
Alluring Job Growth in Center City But Not City-wide
16
Philadelphia has four major, growing centers of 21 st century employment: Center City, University City, the Navy Yard, and Temple University’s two North Philadelphia campuses. Together, they hold 382,000 wage and salaried jobs, 58.4% of all positions in the city (Figure 1). Aligned with the growth at Philadelphia International Airport, these economic centers provide a broad range of opportunity at all skill and educational levels for residents from every city neighborhood and surrounding county. Another 283,000 jobs are spread across neighborhood commercial corridors, industrial parks, big-box retail centers, along the waterfronts, or in emerging pockets of the creative economy. But none of these smaller clusters reaches a critical mass of at least 1% of total citywide jobs. The four largest nodes are diversifying their land-use and improving pedestrian, transit, and vehicular connections. But they are neither large enough, nor expanding fast enough, to off-set the long-term contraction of the old economy that once made Philadelphia the workshop of the world. Citywide, the trajectory is still one of long-term decline. Philadelphia has 25% fewer jobs within its boundaries than it held in 1970. Poverty and unemployment have steadily risen to levels higher than all our major Northeast peer cities. A TIME FOR CHANGE The experience of other, old Northeast cities, particularly Boston, New York, and Washington, D.C., demonstrates that job decline can be reversed and that Philadelphia can exceed the employment levels it enjoyed before suburbanization and de-industrialization gutted inner- city neighborhoods. Decline is no longer the inevitable fate of older cities. Local job loss is a compelling crisis that must be confronted by Philadelphia’s business, civic, and political leaders, not with wishful thinking or facile slogans, but with purposeful action, based on a clear assessment of the facts. There is no single magic bullet. Source: OnTheMap - 2011, Local Employment Dynamics Partnership, U.S. Census Bureau & Philadelphia Industrial Development Corporation Percent of Philadelphia Employment Temple University Center City The Navy Yard University City 44% 1% 1.9% 11.5% Center City’s residential neighborhoods may be growing more affluent, but downtown jobs are for everyone. The city’s major employment nodes are built around existing infrastructure investments at the center of the region’s transit and highway networks. Center City Reports: Pathways to Job Growth January 2014 www.CenterCityPhila.org A publication of the Central Philadelphia Development Corporation and the Center City District 660 Chestnut Street Philadelphia, PA 19106 215.440.5500 Peter Tobia Figure 1: Philadelphia Employment Nodes
-
Upload
national-realty-investment-advisors-llc -
Category
Services
-
view
501 -
download
0
Transcript of Alluring Job Growth in Center City But Not City-wide

Philadelphia has four major, growing centers of 21st century employment: Center City, University City, the Navy Yard, and Temple University’s two North Philadelphia campuses. Together, they hold 382,000 wage and salaried jobs, 58.4% of all positions in the city (Figure 1). Aligned with the growth at Philadelphia International Airport, these economic centers provide a broad range of opportunity at all skill and educational levels for residents from every city neighborhood and surrounding county. Another 283,000 jobs are spread across neighborhood commercial corridors, industrial parks, big-box retail centers, along the waterfronts, or in emerging pockets of the creative economy. But none of these smaller clusters reaches a critical mass of at least 1% of total citywide jobs.
The four largest nodes are diversifying their land-use and improving pedestrian, transit, and vehicular connections. But they are neither large enough, nor expanding fast enough, to off-set the long-term contraction of the old economy that once made Philadelphia the workshop of the world. Citywide, the trajectory is still one of long-term decline. Philadelphia has 25% fewer jobs within its boundaries than it held in 1970. Poverty and unemployment have steadily risen to levels higher than all our major Northeast peer cities.
A time for chAnge The experience of other, old Northeast cities, particularly Boston, New York, and Washington, D.C.,
demonstrates that job decline can be reversed and that Philadelphia can exceed the employment levels it enjoyed before suburbanization and de-industrialization gutted inner-city neighborhoods. Decline is no longer the inevitable fate of older cities. Local job loss is a compelling crisis that must be confronted by Philadelphia’s business, civic, and political leaders, not with wishful thinking or facile slogans, but with purposeful action, based on a clear assessment of the facts. There is no single magic bullet.
Source: OnTheMap - 2011, Local Employment Dynamics Partnership, U.S. Census Bureau & Philadelphia Industrial Development Corporation
Percent of Philadelphia Employment
TempleUniversity
CenterCity
The Navy Yard
UniversityCity
44%
1%
1.9%
11.5%
Center City’s residential neighborhoods may be growing more affluent, but downtown jobs are for everyone.
the city’s major employment nodes are built around existing infrastructure investments at the center of the region’s transit and highway networks.
Center City Reports:Pathways to Job growth
January 2014www.CenterCityPhila.org
A publication of the Central Philadelphia
Development Corporationand the Center City District
660 Chestnut Street Philadelphia, PA 19106
215.440.5500
Peter Tobia
figure 1: Philadelphia Employment Nodes

2 Center City District & Central Philadelphia Development Corporation www.centercityPhila.org
Job growth
Transformational change requires some combination of interconnected, long-term strategies. This report was prepared as a candid look at the strengths, limits, and alternatives for Philadelphia’s largest employment node, Center City, and as an assessment of several different strategies that can help drive citywide growth.
A Dense center of oPPortunity Greater Center City, the 7.7 square miles between Girard Avenue and Tasker Street, river to river, is the region’s largest employment center with 19,362 private-sector firms and 288,493 jobs, 44% of all jobs in Philadelphia.1 These jobs generated at least $13 billion in payroll in 2011, accounting for nearly 50% of all wage tax revenues that support citywide municipal services.2 Fifty-two percent of downtown jobs are held by Philadelphia city residents (Figure 2).3
Center City’s high-rise office, hotel, and major institutional buildings house some of the largest employers in the region: 42% of the companies (98 establishments) in Philadelphia with 500 employees or more are located downtown. But Center City is also energized by small businesses and startup firms in older buildings, converted lofts, home offices, and retail shops. Thirty-five percent of all Philadelphia businesses with fewer than 20 employees are clustered between Girard Avenue and Tasker Street (Figure 6).
This dense concentration of employment (203 jobs per acre in the downtown core, compared to densities of 4.7 jobs/acre in the rest of the city and 0.7 jobs/acre in the surrounding suburbs) is made possible by a multi-modal transit
system that brings more than 305,000 passengers downtown each day, by an expanding cohort of bike commuters, and by those who value one of the largest and most walkable live-work environments in the country. The essence of successful cities, notes Edward Glaeser, is the absence of space between people and companies. Proximity, density, and closeness create “a virtuous cycle in which employers are attracted by a large pool of potential employees and workers are drawn by the abundance of potential employers.”4
Center City’s high-skilled jobs provide opportunity for residents from across the region and for the growing number of workers who have chosen to live between Girard Avenue and Tasker Street. But the broad diversity of job types means that more than four times as many downtown jobs (113,801 workers, 42% of all Center City jobs) are held by residents from neighborhoods outside these boundaries; 29.6% of downtown jobs are held by workers over the age of 30 who have no more than a high school diploma; 29.8% are held by workers with just some college or an associate’s degree (Figure 3).
A recent CPDC/CCD survey found that 70.5% of Philadelphia residents from non-Center City neighborhoods get to work downtown each day by public transit. As a result, Center City is the largest setting in the region for employment for skilled, semi-skilled, and unskilled residents from every neighborhood in the city. Center City’s residential neighborhoods may be growing more affluent, but its jobs are for everyone.
In 1990, Center City was primarily a 9 to 5 office district with a prominent concentration of education and healthcare institutions. The economic diversification of the last two decades with arts, entertainment, and leisure, the continuing expansion of education and healthcare institutions, and
1. Source: County Business Patterns, U.S. Census & OnTheMap – 2011, Local Employment Dynamics Partnership, U.S. Census Bureau. While the more traditionally defined commercial core, Vine to Pine Streets, holds 82% of these jobs, a regionally unique live-work environment has evolved in this broader area where more than 40% of all residents who live within these boundaries work within these boundaries. Among American cities, Philadelphia ranks third behind only Midtown and Downtown Manhattan with the total number of residents (175,000) who live within one mile of the commercial downtown.
2. Source: County Business Patterns, U.S. Census Bureau
3. Suburban residents, who make up 48% of the downtown workforce, support citywide services through payment of the wage or net profits tax.
4. Source: Edward Glaeser, The Triumph of the City, pages 6 and 25
Where Downtown Workers Live
Outside the City 130,585 48%
Other Philadelphia Neighborhoods113,801
42%
Greater Center City27,317
10%
Source: OnTheMap - 2011, Local Employment Dynamics Partnership, U.S. Census Bureau
figure 2: Where Downtown Workers Live

3Center City District & Central Philadelphia Development Corporation www.centercityPhila.org
Job growth
the significant growth in residential population not only added significant vitality to downtown streets, it enabled Center City to weather the national recession that began in 2008 better than prior downturns: 31.1% of all downtown jobs are in office buildings, 21.3% are in public-sector employment, 21% in education and healthcare industries, and 14.2% are in entertainment, hospitality, and retail.5
not Big enough But despite the vitality of Center City and the rapid growth of University City, Philadelphia’s citywide economy continues to lose regional market share. Philadelphia’s major nodes of employment, which are vibrant, expanding, and account for 58.4% of all jobs in the city, are neither large enough nor growing fast enough to offset long-term citywide decline. While the city held 43% of the 11-county metro area’s jobs in 1970, today it holds only 23% of regional jobs (Figures 4 & 5). Since 1970, every county in the region added jobs to its 1970 base except for Philadelphia, which has 25% fewer jobs than it had in 1970 (Figure 7). Today, more than 188,000 Philadelphians (36% of working residents) leave the city each day to find work. This number has been increasing by a half percent annually since 2002. More than 5,400 Philadelphians, for example, travel for work to King of Prussia; another 3,400 commute each day to Horsham.
Regional mobility is typical and beneficial for workers in all metro areas. But particularly for lower-income city residents without cars, Philadelphia’s declining regional
Education Level of Downtown Workers Age 30+
High School Diploma or Less 29.6%Bachelor's Degree
or Higher40.6%
Some College or Associate's Degree29.8%
Source: OnTheMap - 2011, Local Employment Dynamics Partnership, U.S. Census Bureau
1970 Regional Job Share
City of Philadelphia43.3%
Other MetropolitanArea Counties
24.6%
Chester County4.7%
Bucks County5.8%
Montgomery County13.5%
Delaware County8.1%
Source: Regional Economic Profiles, U.S. Bureau of Economic Analysis
2011 Regional Job Share
City of Philadelphia22.9%Other Metropolitan
Area Counties30.9%
Chester County9.8% Bucks County
10.5%
Montgomery County17.5%
Delaware County8.5%
Source: Regional Economic Profiles, U.S. Bureau of Economic Analysis 5. Source: OnTheMap – 2011, Local Employment Dynamics Partnership, U.S. Census Bureau
Education Level of Downtown Workers Age 30+
High School Diploma or Less 29.6%Bachelor's Degree
or Higher40.6%
Some College or Associate's Degree29.8%
Source: OnTheMap - 2011, Local Employment Dynamics Partnership, U.S. Census Bureau
1970 Regional Job Share
City of Philadelphia43.3%
Other MetropolitanArea Counties
24.6%
Chester County4.7%
Bucks County5.8%
Montgomery County13.5%
Delaware County8.1%
Source: Regional Economic Profiles, U.S. Bureau of Economic Analysis
2011 Regional Job Share
City of Philadelphia22.9%Other Metropolitan
Area Counties30.9%
Chester County9.8% Bucks County
10.5%
Montgomery County17.5%
Delaware County8.5%
Source: Regional Economic Profiles, U.S. Bureau of Economic Analysis
figure 3: Education Levels of Downtown Workers Age 30+
figure 4: 1970 Regional Job Share
figure 5: 2011 Regional Job Share

4 Center City District & Central Philadelphia Development Corporation www.centercityPhila.org
Job growth
1970 Indexed Employment - Philadelphia Metropolitan Statistical Area
1970
1971
1972
1973
1974
1975
1976
1977
1978
1979
1980
1981
1982
1983
1984
1985
1986
1987
1988
1989
1990
1991
1992
1993
1994
1995
1996
1997
1998
1999
2000
2001
2002
2003
2004
2005
2006
2007
2008
2009
2010
2011
194.0%
157.1%
83.3%
-25.2%
77.6%
48.5%
Chester County
Montgomery County
Bucks County
Other Metropolitan Area Counties
Delaware County
City of Philadelphia
% A
bove
/Bel
ow 1
970
Empl
oym
ent L
evel
s
200%
175%
150%
125%
100%
75%
25%
0%
50%
-25%
-50%Source: Regional Economic Profiles, U.S. Bureau of Economic Analysis
Other Metropolitan Area Counties: Burlington County, NJ; Camden County, NJ; Gloucester County, NJ; Salem County, NJ; New Castle County, DE; Cecil County, MD
Source: County Business Patterns - 2011, U.S. Census Bureau
geography* establishments with 1-19 employees
establishments with 20-99 employees
establishments with 100-499 employees
establishments with 500+ employees grand total
Core Center City 11,370 2,124 530 78 14,102
Extended Center City 4,602 560 78 20 5,260
Bridesburg/Kensington/Richmond 3,658 558 94 18 4,328
Far Northeast 3,754 676 170 16 4,616
Germantown/Chestnut Hill 2,422 296 56 8 2,782
Near Northeast 4,840 538 74 12 5,464
North Philadelphia 2,882 376 58 10 3,326
Olney/Oak Lane 2,660 210 32 14 2,916
Roxborough/Manayunk 1,354 120 28 0 1,502
South Philadelphia 2,662 418 112 24 3,216
Southwest Philadelphia 1,824 282 80 8 2,194
West Philadelphia 3,318 518 100 26 3,962
grand total 45,346 6,676 1,412 234 53,668
figure 6: Size and Location of Philadelphia Businesses
figure 7: Changing Regional Employment Distribution, Indexed to 1970
* Boundaries largely correspond to the Philadelphia City Planning Commission’s Planning Analysis Districts. In this analysis, Center City is defined as Vine Street to Pine Street; Extended Center City stretches north to Girard Avenue and south to Tasker Street. Greater Center City = Core Center City + Extended Center City.
5Center City District & Central Philadelphia Development Corporation www.centercityPhila.org
Job growth
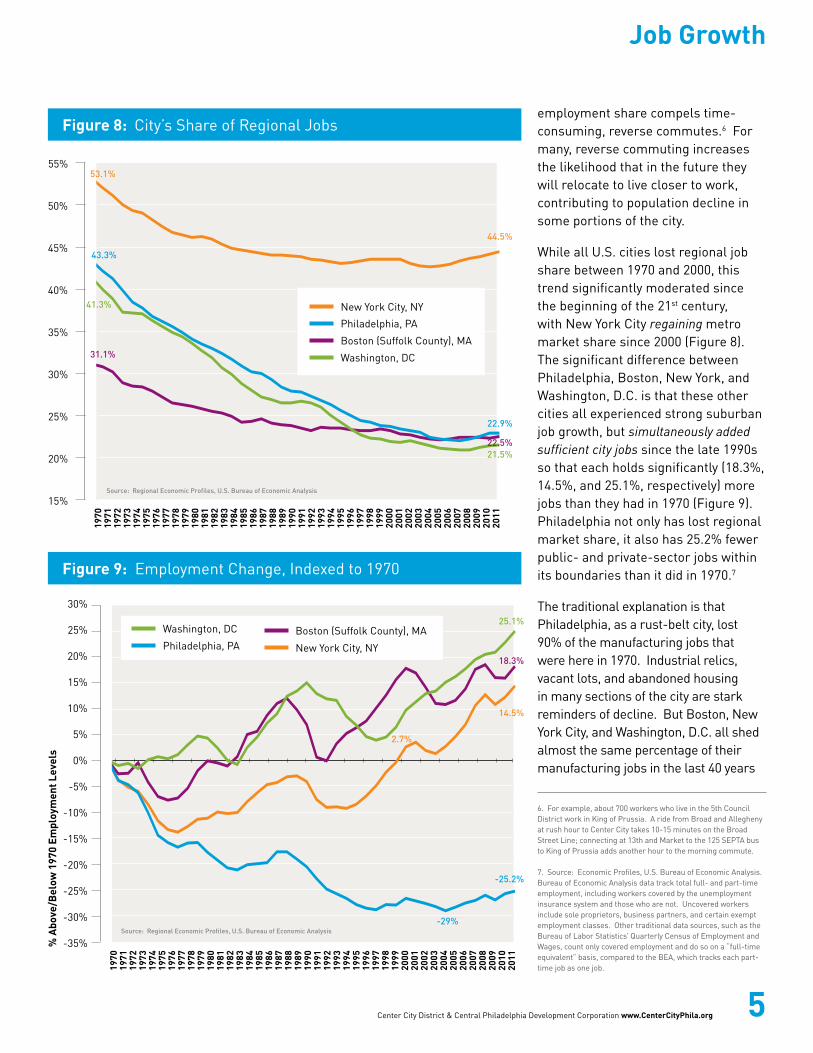
employment share compels time-consuming, reverse commutes.6 For many, reverse commuting increases the likelihood that in the future they will relocate to live closer to work, contributing to population decline in some portions of the city.
While all U.S. cities lost regional job share between 1970 and 2000, this trend significantly moderated since the beginning of the 21st century, with New York City regaining metro market share since 2000 (Figure 8). The significant difference between Philadelphia, Boston, New York, and Washington, D.C. is that these other cities all experienced strong suburban job growth, but simultaneously added sufficient city jobs since the late 1990s so that each holds significantly (18.3%, 14.5%, and 25.1%, respectively) more jobs than they had in 1970 (Figure 9). Philadelphia not only has lost regional market share, it also has 25.2% fewer public- and private-sector jobs within its boundaries than it did in 1970.7
The traditional explanation is that Philadelphia, as a rust-belt city, lost 90% of the manufacturing jobs that were here in 1970. Industrial relics, vacant lots, and abandoned housing in many sections of the city are stark reminders of decline. But Boston, New York City, and Washington, D.C. all shed almost the same percentage of their manufacturing jobs in the last 40 years
figure 8: City’s Share of Regional Jobs
figure 9: Employment Change, Indexed to 1970
6. For example, about 700 workers who live in the 5th Council District work in King of Prussia. A ride from Broad and Allegheny at rush hour to Center City takes 10-15 minutes on the Broad Street Line; connecting at 13th and Market to the 125 SEPTA bus to King of Prussia adds another hour to the morning commute.
7. Source: Economic Profiles, U.S. Bureau of Economic Analysis. Bureau of Economic Analysis data track total full- and part-time employment, including workers covered by the unemployment insurance system and those who are not. Uncovered workers include sole proprietors, business partners, and certain exempt employment classes. Other traditional data sources, such as the Bureau of Labor Statistics’ Quarterly Census of Employment and Wages, count only covered employment and do so on a “full-time equivalent” basis, compared to the BEA, which tracks each part-time job as one job.
Source: Regional Economic Profiles, U.S. Bureau of Economic Analysis
New York City, NY
Boston (Suffolk County), MA
Washington, DC
Philadelphia, PA
City Regional Job Share
55%
50%
45%
40%
30%
25%
35%
20%
15%
53.1%
44.5%
43.3%
22.9%
22.5%
31.1%
21.5%
41.3%
1970
1972
1971
1974
1973
1976
1975
1978
1977
1980
1979
1982
1981
1984
1983
1986
1987
1985
1988
1989
1990
1991
1992
1993
1994
1995
1996
1997
1998
1999
2000
2001
2002
2003
2004
2005
2006
2007
2008
2009
2010
2011
1970 Indexed Employment
30%
25%
20%
15%
10%
5%
0%
-15%
-20%
-10%
-5%
-25%
-35%
-30%Source: Regional Economic Profiles, U.S. Bureau of Economic Analysis
14.5%
2.7%
-25.2%
-29%
18.3%
25.1%
1970
1972
1971
1974
1973
1976
1975
1978
1977
1980
1979
1982
1981
1984
1983
1986
1987
1985
1988
1989
1990
1991
1992
1993
1994
1995
1996
1997
1998
1999
2000
2001
2002
2003
2004
2005
2006
2007
2008
2009
2010
2011
Washington, DC Boston (Suffolk County), MA
New York City, NYPhiladelphia, PA
% A
bove
/Bel
ow 1
970
Empl
oym
ent L
evel
s

6 Center City District & Central Philadelphia Development Corporation www.centercityPhila.org
Job growth
(Figure 10). These peer cities have simply done a better job creating post-industrial replacement jobs, offering significantly more urban employment opportunities than they did in 1970. By contrast, Philadelphia has 232,551 fewer (-28.6%) private wage and salary jobs than it had in 1970 and 34.4% fewer (-57,283) government positions than 40 years ago, for a cumulative decline of 25.2% (Figure 9).
The recurring pattern for Philadelphia since 1970 has been that in each national cycle of economic expansion the city failed to add back more jobs than it shed in the prior downturn, creating a pattern like a downward, though uneven, flight of stairs. In the
last decade, this trend has moderated, though barely enough to reverse the path of job descent. Federal agencies count employment statistics in different ways, but they come to the same conclusion (Figure 11). The Bureau of Labor Statistics’ (BLS) Quarterly Census of Employment and Wages (QCEW) data (which count jobs on a full-time-equivalent basis, aggregating the hours part-time employees work into 40-hour FTE whole jobs) show that by 2012 the city rebounded from 2009, adding 2.5% to the job base for a total of 531,245 full-time-equivalent, private wage and salary jobs. But this was still 2% below the total number of jobs in 2001. Bureau of Economic Analysis (BEA)
data (which count each part-time position as one job, producing a larger total) show that the city has rebounded from 2009, adding 1.9% to the private jobs base for a total of 580,402 jobs in 2011. But this source, too, puts the city 2% below 2001 levels. Are we poised for growth, or just bouncing along the bottom?
Job growth outside the city, often beyond the reach of public transit, compounded by declining opportunity within the city, has adverse impacts on local residents. Throughout much of the 1990s, Philadelphia’s unemployment rate was lower than that of New York City, Washington, D.C., and Baltimore. It followed the
1970 Indexed Manufacturing Jobs19
70
1971
1972
1973
1974
1975
1976
1977
1978
1979
1980
1981
1982
1983
1984
1985
1986
1987
1988
1989
1990
1991
1992
1993
1994
1995
1996
1997
1998
1999
2000
2001
2002
2003
2004
2005
2006
2007
2008
2009
2010
2011
-89.1%-89.8%
-84.1%
-92.1%
% A
bove
/Bel
ow 1
970
Tota
l Ful
l- &
Par
t-tim
e M
anuf
actu
ring
Job
Lev
els
10%
0%
-10%
-20%
-40%
-30%
-50%
-70%
-80%
-60%
-90%
-100%
Source: Total Full- & Part-time Employment by Industry, U.S. Bureau of Economic Analysis
Note: Due to the change in how jobs are classified that occurred between 2000 and 2001, switching from SIC codes to NAICS codes, data before and after 2001 are not fully comparable. But the overall trends are consistent and clear.
New York City, NY
Boston (Suffolk County), MA
Washington, DC
Philadelphia, PA
figure 10: Manufacturing Jobs, Indexed to 1970

7Center City District & Central Philadelphia Development Corporation www.centercityPhila.org
Job growth
same path as these cities, as well as Boston, during the recession. But Philadelphia has lagged in recovery from the Great Recession. In October 2013, Philadelphia posted the highest unemployment rate (10.1%) among major East Coast cities (Figure 13).
The contraction of local opportunity shows up grimly in Philadelphia’s poverty rate and per capita income. The most recent American Community Survey estimates that Philadelphia has the largest percentage of its population living below the poverty line among major east coast cities, with per capita income that most closely tracks Detroit (Figure 14 & 15).
Since 80% of the resources that support local government are generated locally, the City cannot sustain needed services on a shrinking job base. Unless this trend is reversed, the City will have no choice but to follow the path of the School District and curtail services in the coming decade, or to continue to raise taxes and push more people and jobs out of the city.8
These urban challenges might seem to be of limited concern to suburban residents who do not work in the city. But there is evidence suggesting that a weak urban economic core causes regional productivity to lag as well. On a per person basis, the Philadelphia metropolitan area’s gross domestic product (the measure of the value of all goods and services produced in
the region, controlled for population size) has grown the slowest among near peer regions. A recent study prepared by IHS Global Insight for the United States Conference of Mayors that compared the rate of actual and projected annual growth for 363 national metropolitan areas ranked the Philadelphia region 121st, with rates of annual growth well below national
averages (Figure 12). Job growth in the city can translate into greater affluence and opportunity in the suburbs.
how to chAnge the trAJectory? Past patterns are usually a reliable guide to future trends; except when things change. Change can come from external sources, such as the repositioning of cities made possible by auto fuel costs spiking from 30 cents per gallon in the 1960s to the current range of $3 to $4 per gallon. Change is driven by demography as
figure 11: Philadelphia Private-Sector Employment Trends - Poised For Growth or Bouncing Along the Bottom?
8. If Philadelphia succeeds at reducing its underfunded pension liability, it can free up more tax revenues to be used to fund current programs and services. Similarly, to the extent that the City gets the Commonwealth to share more of education and criminal justice costs, the City’s appetite for local taxes can be reduced. For an overview of these issues, see Center on Regional Politics, Temple University Bulletin, Volume 2, #3, Fall 2013.
531,245
518,304
530,575
517,828
542,328
565,856
592,409
582,081
569,680
580,402
Philadelphia Private Employment
20082001 2002 2003 2004 2005 2006 2007 2009 2010 2011 2012
600,000
570,000
580,000
590,000
560,000
550,000
540,000
510,000
520,000
530,000
* See the text on page 6 for an explanation of the difference between these two data sources.
Source: Quarterly Census of Employment & Wages, U.S. Bureau of Labor Statistics and Total Full & Part-time Employment by Industry, U.S. Bureau of Economic Analysis
Pri
vate
Em
ploy
men
t
BEA — Total Full- & Part-Time Private EmploymentQCEW — Total Covered Private Employment
2011 2012 2013 2014
Real Gross Metropolitan Product (GMP) for 363 Metros 1.6% 2.5% 1.6% 2.5%
Philadelphia-Camden-Wilmington, PA-NJ-DE-MD MSA 1.1% 1.5% 1.4% 2.0%
Source: IHS Global Insight, prepared for U.S. Conference of Mayors, 2013
figure 12: Annual and Projected Rate of Regional Growth

8 Center City District & Central Philadelphia Development Corporation www.centercityPhila.org
Job growth
“traditional” families, who supported suburban growth in the 1960s and 1970s, give way to single-person, childless, and non-traditional households. Change radiates from growing new industries. Change can be produced when a city invests in major new infrastructure like transit,
airports, technology, or public space improvements; or, when a place fails to act, slipping behind competitors who reposition themselves through transformational investments. Change comes from improvements to education and job training. A city can become more or less business-friendly by altering its standard practices, permitting processes, or tax policies. So change is both about external factors and about how effectively a place mobilizes to capitalize on these trends.9
Chronic job loss and rising poverty make doing nothing, or waiting for external factors, unacceptable options. These compelling crises must be confronted by Philadelphia’s business, civic, and political leaders, not with wishful
thinking, but with well-considered, purposeful action. Rarely is there a single magic bullet. Transformational change usually requires a combination of interconnected strategies. But since resources and political and civic will are limited, it is worth assessing the benefits and limitations of several different paths that recently have been suggested for Philadelphia.10
figure 13: Unemployment Rate (Not Seasonally Adjusted)
9. The passage of Philadelphia’s 10-year tax abatement in 1997 is a powerful example of how public action can capitalize on external trends and catalyze change. Philadelphia had a 50-year tradition of encouraging urban living, but the passage of a new citywide incentive for housing development enabled the city to catch a demographic wave almost a decade before most other cities. Kevin Gillen has documented, in “Philadelphia’s Ten-Year Property Tax Abatement,” how the regional distribution of building permits issued for residential development dramatically shifted in the city’s favor following the passage of the 1997 and 2000 tax abatement ordinances. In the decade that followed, Philadelphia turned around 60 years of population decline.
10. The Economy League of Greater Philadelphia has developed recommendations for major regional investments in infrastructure in World Class Philadelphia: Global Positioning Strategy, June 2013.
Unemployment Rate (Not Seasonally Adjusted)19
90
1991
1992
1993
1994
1995
1996
1997
1998
1999
2000
2001
2002
2003
2004
2005
2006
2007
2008
2009
2010
2011
2012
Jan-
13
Feb-
13
Mar
-13
Apr
-13
May
-13
Jun-
13
Jul-
13
Aug
-13
Sep-
13
Oct
-13
8.9%
9.9%10.1%
6.9%
9.7%
Une
mpl
oym
ent R
ate
13%
12%
11%
10%
8%
9%
7%
5%
4%
6%
2%
3%
0%
1%Source: Local Area Unemployment Statistics, U.S. Bureau of Labor Statistics
New York City, NYBaltimore, MD Boston, MAWashington, DCPhiladelphia, PA
figure 14: Poverty Rate
Source: 2012 American Community Survey 1-year Estimates, U.S. Census Bureau
city % Below Poverty Line
Philadelphia, PA 26.9%
Baltimore, MD 24.8%
Boston, MA 21.6%
New York City, NY 21.2%
Washington, DC 18.2%
9Center City District & Central Philadelphia Development Corporation www.centercityPhila.org
Job growth
follow the millennials: For the first time in 60 years, the 2010 Census recorded that Philadelphia’s population had grown, netting 8,456 new residents between 2000 and 2010. While many portions of the city continued their long-term loss of population, Asian and Latino immigration in neighborhoods east of Broad Street and 18.1% growth in the core of Center City was enough to turn around more than a half-century of decline. Since that time, downtown population growth has accelerated, with significant gains in both empty-nesters and young professionals.
The December 5, 2013 Wall Street Journal reported on several technology companies and corporate giants who are moving to downtown Chicago and downtown San Francisco to be near young, educated, and tech-savvy workers who prefer to live in the city. Philadelphia, too, has celebrated the opening of several new downtown branch offices of technology firms that have sought to be near younger employees.11 Will population growth alone, especially among well-educated Millennials, be sufficient to drive employment trends?
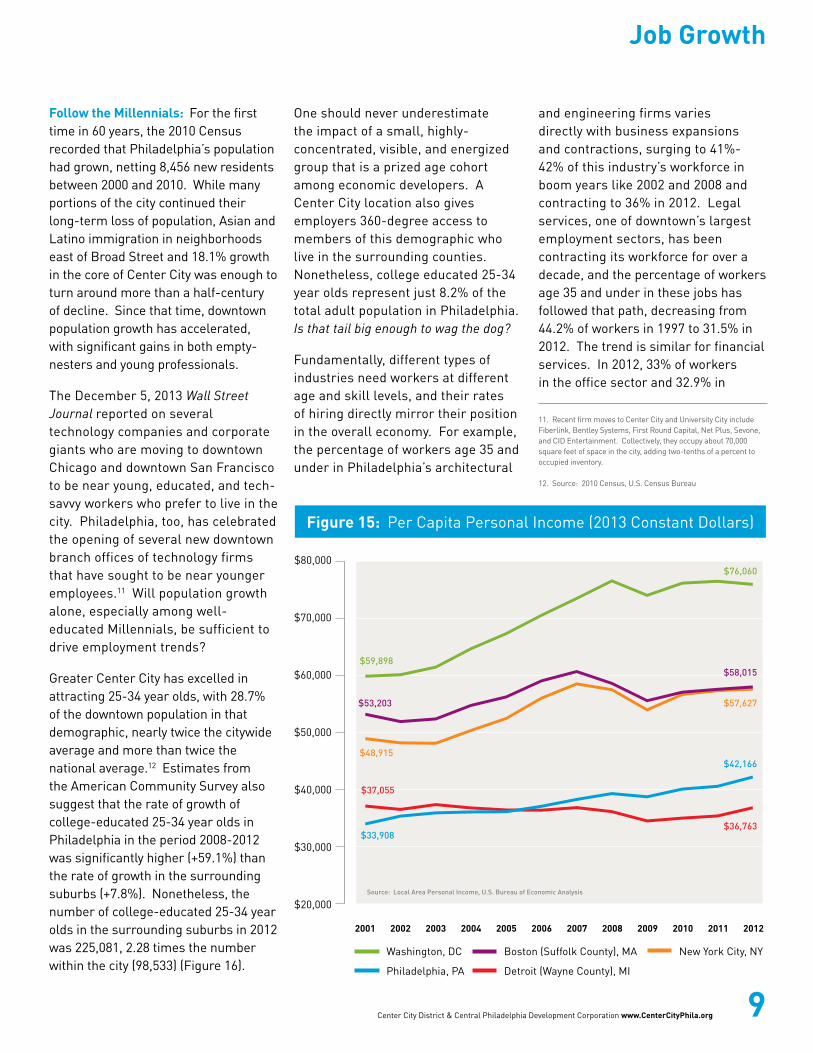
Greater Center City has excelled in attracting 25-34 year olds, with 28.7% of the downtown population in that demographic, nearly twice the citywide average and more than twice the national average.12 Estimates from the American Community Survey also suggest that the rate of growth of college-educated 25-34 year olds in Philadelphia in the period 2008-2012 was significantly higher (+59.1%) than the rate of growth in the surrounding suburbs (+7.8%). Nonetheless, the number of college-educated 25-34 year olds in the surrounding suburbs in 2012 was 225,081, 2.28 times the number within the city (98,533) (Figure 16).
One should never underestimate the impact of a small, highly-concentrated, visible, and energized group that is a prized age cohort among economic developers. A Center City location also gives employers 360-degree access to members of this demographic who live in the surrounding counties. Nonetheless, college educated 25-34 year olds represent just 8.2% of the total adult population in Philadelphia. Is that tail big enough to wag the dog?
Fundamentally, different types of industries need workers at different age and skill levels, and their rates of hiring directly mirror their position in the overall economy. For example, the percentage of workers age 35 and under in Philadelphia’s architectural
and engineering firms varies directly with business expansions and contractions, surging to 41%-42% of this industry’s workforce in boom years like 2002 and 2008 and contracting to 36% in 2012. Legal services, one of downtown’s largest employment sectors, has been contracting its workforce for over a decade, and the percentage of workers age 35 and under in these jobs has followed that path, decreasing from 44.2% of workers in 1997 to 31.5% in 2012. The trend is similar for financial services. In 2012, 33% of workers in the office sector and 32.9% in
figure 15: Per Capita Personal Income (2013 Constant Dollars)Per Capita Personal Income (2013 Constant Dollars)
2001 2002 2003 2004 2005 2006 2007 2008 2009 2010 2011 2012
New York City, NY
Detroit (Wayne County), MI
Boston (Suffolk County), MAWashington, DC
Philadelphia, PA
$80,000
$70,000
$60,000
$50,000
$40,000
$30,000
$20,000Source: Local Area Personal Income, U.S. Bureau of Economic Analysis
$48,915
$57,627
$36,763
$37,055
$33,908
$42,166
$58,015
$53,203
$76,060
$59,898
11. Recent firm moves to Center City and University City include Fiberlink, Bentley Systems, First Round Capital, Net Plus, Sevone, and CID Entertainment. Collectively, they occupy about 70,000 square feet of space in the city, adding two-tenths of a percent to occupied inventory.
12. Source: 2010 Census, U.S. Census Bureau

10 Center City District & Central Philadelphia Development Corporation www.centercityPhila.org
Job growth
healthcare jobs were age 35 and under. Philadelphia technology jobs do skew younger, but not appreciably by much, with 38.7% workers age 35 and under. The one sector with a much younger workforce is hospitality with 57% of workers age 35 and under. But this is an industry that hires many workers with less educational training.13
improving educational and skill Levels for All: The critical mass of educated professionals who have chosen to live in Greater Center City has been transformational for housing and retail markets. But if one pulls back the camera, focusing more broadly on the educational attainment of 25-34 year olds citywide and comparing it to other east coast cities, the narrative quickly changes. Philadelphia as a whole has the highest percentage of 25-34 year olds who possess no more than a high-school diploma. The city has the same unfortunate first-place ranking in educational attainment levels for all adults over 35 (Figures 17 & 18).
Well-managed and funded, quality public education and job training programs are necessary to prepare the city’s population for the jobs of the 21st century. Across the country, low levels of educational attainment correlate closely with high unemployment. No doubt, improved educational attainment is essential for social equity, mobility, and inclusion. This is a moral imperative. But is it sufficient to drive urban job growth?
Most Philadelphia employers still have ready access to skilled suburban workers and can easily open or
figure 16: 25-34 Year Olds with a Bachelor’s Degree or More, City & Suburbs
13. See www.centercityphila.org/workerage for industry trend charts. Source: Quarterly Workforce Indicators, accessed via the LED Extraction Tool, U.S. Census Bureau
25-34 Year-olds with a Bachelor's Degree or More
2008 2009 2010 2011 2012
110,000
100,000
90,000
80,000
70,000
60,000
50,000
Source: American Community Survey 1-year Estimates, U.S. Census Bureau
95,619
86,620
93,663
61,922
98,533
Philadelphia
Philadelphia % change 2008-2012: +59.1%
210,537
216,089
214,141
208,756
Metro area outside Philadelphia % change 2008-2012: +7.8%
25-34 Year-olds with a Bachelor's Degree or More
2008 2009 2010 2011 2012
230,000
225,000
220,000
215,000
210,000
205,000
200,000
Source: American Community Survey 1-year Estimates, U.S. Census Bureau
225,081
Metro Area Outside Philadelphia

11Center City District & Central Philadelphia Development Corporation www.centercityPhila.org
Job growth
expand suburban branch offices. There are some city industries that are experiencing skilled labor shortages around technical skills, like welding or machinery operation. But when local economic developers respond to questions from firms outside the region about available local labor, they are able to demonstrate that the metro area possesses all required skill sets, pointing confidently to the higher education institutions that graduate in excess of 85,000 students each year with an associate’s degree or higher. Usually, if the Philadelphia region is judged non-competitive in a site search, it is due to cost factors or because of a perceived reputation of not being business friendly, rather than because of the absence of talent.
Enhancing education and skill levels in the city does increase earning and purchasing power among residents, contributing to overall city and regional prosperity. Broadening the circle of workforce participation will also expand the tax base and reduce dependency costs that push up tax rates.14 Increasing overall levels of educational attainment can also translate into increased per capita income across the region.15 But without expanding local job opportunities, a significant number of educated workers may have to leave the city to find work.
support the new Proprietors: A recent, potentially positive trend has been the surge in “proprietor employment,” which grew by 36.8% in the city since 1970 and most dramatically since 1999 with the addition of 50,697 new proprietors
% of Adults 35+ with a High School Diploma or Less
Philadelphia, PA Baltimore, MD New York City, NY Boston, MA Washington, DC
53.3%49.3%
46.9%
35.0%
57.4%60%
55%
50%
45%
40%
35%
30%
25%
20%
15%
10%
5%
0%
Source: 2012 American Community Survey 1-year Estimates, U.S. Census Bureau
Percentage of 25-34 Year-Olds with a High School Diploma or Less
Philadelphia, PA Baltimore, MD New York City, NY Boston, MA Washington, DC
36.0%
30.2%
20.0% 18.7%
38.8%40%
35%
30%
25%
20%
15%
10%
5%
0%
Source: 2012 American Community Survey 1-year Estimates, U.S. Census Bureau
figure 17: Percentage of 25-34 Year Olds with a High School Diploma or Less
14. Quality public education is also essential to the retention of Millennials as they have children.
15. Source: “The Talent Dividend,” CEOs for Cities, 2013, www.ceosforcities.org/city-dividends/talent/
figure 18: Percentage of Adults 35+ with a High School Diploma or Less

12 Center City District & Central Philadelphia Development Corporation www.centercityPhila.org
Job growth
citywide (Figure 20).16 Proprietors are the self-employed. They might be construction workers, day-care providers, or hairstylists who use their home living rooms. They might be free-lance writers, graphic designers, or software engineers in co-working spaces and coffee shops, freed from traditional workplaces by wireless technology. They could be lawyers or accountants using a home office.
While the increase in proprietor employment underscores the entrepreneurial energies of Philadelphians, it is consistent with national trends that show substantial growth in self-employment. Since the 2000 recession, as many permanent positions that disappeared did not return, a new free-lance workforce emerged. Still, the national rate of growth among proprietors from 1999 to 2011 was 52%; Philadelphia’s increase was more than twice that rate, 114% (Figure 20).
Many factors might prompt someone to become a proprietor, just as there are diverse paths they subsequently could follow. There are textbook entrepreneurs with brilliant ideas, who take risks and launch thriving new companies. Some might fail several times before getting it right. Others turn to self-employment as a response to unemployment, only to return to full-time work when the economy rebounds. Some may be young workers who never
16. The Bureau of Economic Analysis defines nonfarm proprietors as “sole proprietorships and individual business partners not assumed to be limited partners.” Due to the way in which data are collected, these proprietors are counted based on their place of residence, rather than their place of work, which is the more traditional way employees are counted. To be sure, many proprietors work out of their homes. Additionally, the total count of proprietors is based on the cumulative number who may be active at any time during the year, as opposed to creating an annual average of the number of proprietors. So this might result in the over-estimation of gross numbers, because someone might be a wage employee for nine months of the year, leave that job, and be a proprietor for the remaining three months of the year. But since this method of counting is consistent across all geographic areas, comparisons are still possible between cities.
figure 19: Philadelphia Private Wage & Salary Employment
Tota
l Ful
l- &
Par
t-Ti
me
Empl
oym
ent (
thou
sand
s)To
tal F
ull-
& P
art-
Tim
e Em
ploy
men
t (th
ousa
nds)
Tota
l Ful
l- &
Par
t-Ti
me
Empl
oym
ent (
thou
sand
s)
Source: Total Full & Part-time Employment by Industry, U.S. Bureau of Economic Analysis
Philadelphia Private Wage & Salary Employment
Philadelphia Proprietor Employment
Philadelphia Government & Government Enterprises Employment
812,959850
800
750
700
550
600
650
500
69,500
100
80
90
70
50
60
30
40
95,100
166,586180
160
170
140
150
110
120
130
100
109,303
Change in Private Wage & Salary Employment Between 1970 and 2011: -28.6%
Change in Proprietor Employment Between 1970 and 2011: +36.8%Between 1999 and 2011: +114%
Change in Government Employment Between 1970 and 2011: -34.4%
580,402
1970
1972
1971
1974
1973
1976
1975
1978
1977
1980
1979
1982
1981
1984
1983
1986
1987
1985
1988
1989
1990
1991
1992
1993
1994
1995
1996
1997
1998
1999
2000
2001
2002
2003
2004
2005
2006
2007
2008
2009
2010
2011
1970
1972
1971
1974
1973
1976
1975
1978
1977
1980
1979
1982
1981
1984
1983
1986
1987
1985
1988
1989
1990
1991
1992
1993
1994
1995
1996
1997
1998
1999
2000
2001
2002
2003
2004
2005
2006
2007
2008
2009
2010
2011
1970
1972
1971
1974
1973
1976
1975
1978
1977
1980
1979
1982
1981
1984
1983
1986
1987
1985
1988
1989
1990
1991
1992
1993
1994
1995
1996
1997
1998
1999
2000
2001
2002
2003
2004
2005
2006
2007
2008
2009
2010
2011
figure 20: Philadelphia Proprietor Employment
figure 21: Federal, State, and Local Government Employment
Tota
l Ful
l- &
Par
t-Ti
me
Empl
oym
ent (
thou
sand
s)To
tal F
ull-
& P
art-
Tim
e Em
ploy
men
t (th
ousa
nds)
Tota
l Ful
l- &
Par
t-Ti
me
Empl
oym
ent (
thou
sand
s)
Source: Total Full & Part-time Employment by Industry, U.S. Bureau of Economic Analysis
Philadelphia Private Wage & Salary Employment
Philadelphia Proprietor Employment
Philadelphia Government & Government Enterprises Employment
812,959850
800
750
700
550
600
650
500
69,500
100
80
90
70
50
60
30
40
95,100
166,586180
160
170
140
150
110
120
130
100
109,303
Change in Private Wage & Salary Employment Between 1970 and 2011: -28.6%
Change in Proprietor Employment Between 1970 and 2011: +36.8%Between 1999 and 2011: +114%
Change in Government Employment Between 1970 and 2011: -34.4%
580,402
1970
1972
1971
1974
1973
1976
1975
1978
1977
1980
1979
1982
1981
1984
1983
1986
1987
1985
1988
1989
1990
1991
1992
1993
1994
1995
1996
1997
1998
1999
2000
2001
2002
2003
2004
2005
2006
2007
2008
2009
2010
2011
1970
1972
1971
1974
1973
1976
1975
1978
1977
1980
1979
1982
1981
1984
1983
1986
1987
1985
1988
1989
1990
1991
1992
1993
1994
1995
1996
1997
1998
1999
2000
2001
2002
2003
2004
2005
2006
2007
2008
2009
2010
2011
1970
1972
1971
1974
1973
1976
1975
1978
1977
1980
1979
1982
1981
1984
1983
1986
1987
1985
1988
1989
1990
1991
1992
1993
1994
1995
1996
1997
1998
1999
2000
2001
2002
2003
2004
2005
2006
2007
2008
2009
2010
2011

13Center City District & Central Philadelphia Development Corporation www.centercityPhila.org
Job growth
landed or sought full-time employment and prefer independence. At the other end of the spectrum are older workers, who are laid off from a job, working free-lance by default, yet never piecing together enough to support themselves or others. So the presence of proprietors can be a sign of success or a symptom of failure.
Regardless of motivation or path, few proprietor-owned establishments are large-scale job creators and often serve only local demand for goods and services or the personal aspirations of their founders. While high-growth companies make headlines and can certainly be counted among proprietors, many are classic mom-and-pop retail establishments, people piecing together an income while searching for permanent work, or “lifestyle” companies developed around a founder with a social or personal cause in mind. In the last decade, the percentage of proprietors in Philadelphia who have taken on any employees to work for them has not climbed above the high teens.17 In 2011, at 18.9% of proprietors with employees, Philadelphia was almost identical to Detroit. By contrast, 40% of proprietors in Washington, D.C. have taken on enough business to support employees.
The growth rate of proprietors in Baltimore, Detroit, and Philadelphia, cities that have not added traditional wage or salaried jobs covered by unemployment insurance, has been much faster than in settings like Boston, New York, and Washington, D.C., which have enjoyed substantial job growth (Figure 22). This suggests that whatever the creative energies of proprietors, they are partly symptomatic of a slow growth economy with minimal traditional
opportunities. Proprietors may be a notable part of Philadelphia’s new economic landscape, but their proliferation has not yet offset losses in more established firms. Still, they represent an emerging trend in the 21st century American economy and a path to be nurtured to support local job growth in all neighborhoods, former manufacturing centers, and in older buildings in and around the downtown.18
ed and meds and the next economy: While the downtown economy is built around the office sector, education and healthcare institutions form the backbone of Philadelphia’s overall economy, accounting for 36% of all jobs citywide, twice the regional and national average. Philadelphia has only a 21% share of the region’s office jobs, but it holds 57.5% of the metro
area’s educational and healthcare employment. This sector’s steady growth in the last decade, highly visible in University City and North Philadelphia, buffered the city from the worst of the recession.
Healthcare and education are mature industries and stable employers, anchored by the fixed assets of tax-exempt real estate, classrooms, dormitories, medical and research equipment, and technology. Most are exempt as well from business taxes. They have been described as the factories of the post-industrial age and many have adopted a proactive, beneficial role in their surrounding
figure 22: Rate of Growth of Proprietors Without Employees, Indexed to 2002
33.8%
58.5%
63.5%
24.1%
44.3%
50.3%
New York City, NY
Detroit (Wayne County), MIBaltimore, MD
Boston (Suffolk County), MA
Washington, DC
Philadelphia, PA
2002 2003 2004 2005 2006 2007 2008 2009 2010 2011
2002 Indexed Nonemployer Firms
65%
60%
55%
50%
45%
35%
40%
15%
20%
10%
25%
30%
5%
0%
Source: Nonemployer Statistics, U.S. Census Bureau
% A
bove
/Bel
ow 2
002
Non
empl
oyer
Fir
m L
evel
17. Source: Economic Profiles, U.S. Bureau of Economic Analysis & Nonemployer Statistics, U.S. Census Bureau
18. Source: Stephen Goetz, David Fleming, Anil Rupasingha, “The Economic Impacts of Self-Employment,” Journal of Agricultural and Applied Economics, August 2012

14 Center City District & Central Philadelphia Development Corporation www.centercityPhila.org
Job growth
communities, analogous to some of their manufacturing predecessors.
Both sectors are vulnerable to the impact of cutbacks in federal entitlement and tuition programs, as well as broader demographic trends, though all major schools are augmenting their share of international students. Yet rather than rely on past success, oblivious to the forces of global change that caused the extinction of giants
of the industrial age, most major institutions are focused creatively on the start-ups, patents, and new industries that can be spawned by their research and technological innovations. Drexel University is working on high-profile plans for an innovation neighborhood to the east and north of its campus, adjacent to AMTRAK’s 30th Street Station. Similar new investments are occurring at the University City Science Center and at Temple University.
Philadelphia Industrial Development Corporation has unveiled ambitious plans to transform the Lower Schuylkill into a modern, 21st century, green, mixed-use district, complete with waterfront and bicycle trails, to provide flexible and affordable space for entrepreneurial businesses spawned from research in life and material sciences, new technologies, and creative services emerging at the University of Pennsylvania and Children’s Hospital of Philadelphia.

15Center City District & Central Philadelphia Development Corporation www.centercityPhila.org
Job growth
To the south there are plans to reuse refinery facilities to capitalize on natural gas extraction from the northern tier of Pennsylvania. All represent potential sources for new job creation in the city. Most require substantial capital investment in new infrastructure. Nearly all are founded upon special zones exempt from major city and state taxes.
tax competitiveness: Philadelphia’s long-term job decline is in part structural. The city used to be an industrial powerhouse but shed those jobs as a result of national and global forces. At the beginning of the 20th century, half the city’s employment was in manufacturing; by 1950 it had contracted to a third; today it is less than 5%. But as noted earlier, other major east coast cities that lost comparable percentages of old economy jobs have more than replaced them with new economy jobs.
Two successive tax commissions, one in 2003 and one in 2009, noted that many of Philadelphia’s ailments are self-inflicted. Industrial jobs are gone, but the downward cycle endures. As the 2009 Task Force on Jobs and Economic Competitiveness suggested, “The fundamental problem is that Philadelphia has a tax structure that was appropriate to an industrial economy when people and firms were tied to the fixed assets of railroads, factories, and ports. By continuing to derive the lion’s share of locally generated revenues by taxing people and jobs that are now highly mobile, we continue to undermine our future.”
Sixty-six percent of local tax revenue comes from taxing highly mobile wages and profits. By contrast, comparable taxes in New York
City comprise only 34% of the mix, while in Washington, D.C. it is 35%. Correspondingly, while Philadelphia derives only 17% of municipal tax revenues from real estate, New York City gets 41% and Washington, D.C. 36%. So it’s not that Philadelphia taxes too much, rather it taxes the wrong things: our dependency on wage and business taxes disproportionately pushes mobile office tenants, start-ups, and entrepreneurs to lower-cost suburbs or other cities. In 2009, Robert Inman of the University of Pennsylvania’s Wharton School calculated that business taxes alone made Philadelphia 19% more expensive than surrounding suburbs.19
In one sense, the exemption of education and health institutions from two of the City’s three major taxes underscores the point, as does the success of Keystone Opportunity Zones. When the City significantly lowers the barriers to growth its own taxes impose, Philadelphia’s competitive strengths and entrepreneurial energies break through: businesses, industries, and start-ups flourish, while construction and permanent jobs are created.
It is also an axiom of successful economic development that the rules of the game be simple, transparent, uniform, and easily understood by those considering starting, expanding, or relocating business. The City’s Business Income and Receipts Tax makes an interesting case study. A review of the City’s Code, Chapter 19-2600, reveals an eclectic mix of exceptions. In addition to charities, not-for-profits, and businesses regulated by the Public Utility Commission, there are recent exemptions for investment and information technology companies,
as well as older carve-outs for bookbinders, yarn and fabric dyers, and the loading or discharging of cargo at the port. Similar exemptions typify the Use and Occupancy Tax. By contrast, both recent tax commissions suggested that local government should not try to pick winners and losers but rather level the playing field for all with a 10-year strategy to shift the burden from wage and business taxes to the broad-based real estate tax on assets that can’t readily move: land and improvements.
Do taxes matter? A recent Campus Philly/Philadelphia Magazine survey asked 1,235 Millennials, ages 18-35, what would cause them to leave the city. All ranked taxes very low (5.9%) as a factor. Schools for current or planned children mattered to 25.6%. But all put a job opportunity or absence thereof at the top of the list (47.4%). When one appreciates the substantial debt that many college grads now carry, it’s no surprise that the opportunity for income trumps lifestyle advantages.
While data are only available through 2007 specifically for African American-owned firms, the number of sole proprietors without paid employees in Philadelphia almost tripled from 6,431 in 1992 to 18,699 in 2007. But the number of local African American-owned firms with paid employees barely moved during the same period.20 By contrast, the rate at which comparable firms took on employees was much greater in New York and Washington, D.C., where the overall economy expanded and a rising tide lifted all boats.
19. Source: Robert Inman, “Local Taxes and the Economic Future of Philadelphia,” The Wharton School, August 2009
20. Source: Survey of Business Owners, U.S. Census Bureau
16 Center City District & Central Philadelphia Development Corporation www.centercityPhila.org
Job growth
A 19th century writer once suggested that science is uncommon sense. Common sense says that the sun rises in the east and revolves around the earth. Astronomy enables us to look behind appearances. Most Philadelphians accept the current mix of taxes as if they were divinely ordained. A few simple maps and pie charts in a recent study by The Pew Charitable Trusts showed how different, how out-of-the-ordinary, are the number and mix of taxes upon which Philadelphia relies to fund municipal government. In our extreme dependency on the wage tax, we are in a league with Detroit and Bridgeport, Connecticut, company we don’t want to keep.21
Polls show that Philadelphians overwhelmingly want job growth. They know that quality education is the primary path to opportunity. But the structure of opportunity - the avenues for growth in the city that lay before Millennials, entrepreneurs, disadvantaged businesses and all other firms - are constrained by an obsolete tax regime that quietly works behind the scenes, influencing daily business and employee location decisions, narrowing opportunity, and pushing growth outside the city’s boundaries.
No doubt, Philadelphia has unique challenges that impose extraordinary burdens on the city’s operating budget and constrain the ability to
reduce taxes: a high rate of poverty, low levels of educational attainment, the burden of an unfunded pension system, and the fact that we are both a city and county, carrying criminal justice and social welfare costs that in other municipalities are picked up by higher levels of government. All are challenges local leaders must confront.
But 80% of the resources that support local government are generated locally and are likely to remain so for the foreseeable future. Regardless of whether we choose to invest in education or entrepreneurs, Millennials or displaced workers, we must simultaneously realign the way local government is supported to create the most favorable climate for economic expansion. We can only fund more services if the tax base grows.
By taxing what can readily move to suburban locations (jobs and businesses) rather than immobile assets (land and buildings), Philadelphia increases the cost of working and locating a firm in the city. This drives down office rents, weakens demand for all commercial space, discourages business growth and reduces the share of real estate taxes local government derives from business properties across the city.
As the burden of wage and business taxes goes down, the demand for real estate citywide will go up, increasing the share of real estate taxes that can be
derived from business, not residential properties, while expanding the tax base for the school district.
For example, increasing average Class A rents downtown $1 per square foot — from $27 to $28 per square foot— would yield $8.2 million more each year in real estate taxes just from the central business district.
If rents rose to Cira Centre or Chicago levels — $37 per square foot — that would provide $87.5 million more each year in real estate taxes, more than half of which would go to the School District. As small businesses make use of vacant or underperforming space across the city, more centers of employment will emerge throughout Philadelphia.
The lesson from Boston, New York, and Washington, D.C. is that job decline is no longer the fate of older cities. Market, demographic, and cultural trends have shifted in favor of diverse, walkable, and transit-oriented places. Philadelphia found a way to turn around population decline; finding and widening the paths to job growth across all neighborhoods will be profoundly more consequential for our children and grandchildren.
21. Source: “Philadelphia Taxes: Past, Present, Future,” The Pew Charitable Trusts Philadelphia Research Initiative, 2013
About this report: This report was researched by Lauren Gilchrist, Manager of Research & Analysis, and designed by Abigail Saggi, with editing by Linda Harris, Director of Communications & Publications. The data in this report are drawn from the U.S. Bureau of Economic Analysis, U.S. Bureau of Labor Statistics, U.S. Census Bureau, and U.S. Conference of Mayors.