Allocation of Attention With Head-Up Displays OF ATTENTION WITH HEAD-UP DISPLAYS INTRODUCTION...
22
DOT/FAA/AM-98/28 Office of Aviation Medicine Washington, D.C. 20591 Allocation of Attention With Head-Up Displays C. D. Wickens P. M.Ververs Aviation Research Laboratory University of Illinois Savoy, Illinois 61874 November 1998 Final Report This document is available to the public through the National Technical Information Service, Springfield, Virginia 22161. 0 U.S. Department of Transportation Federal Aviation Administration
Transcript of Allocation of Attention With Head-Up Displays OF ATTENTION WITH HEAD-UP DISPLAYS INTRODUCTION...
DOT/FAA/AM-98/28
Office of Aviation Medicine Washington, D.C. 20591
Allocation of Attention With Head-Up Displays
C. D. Wickens P. M.Ververs
Aviation Research Laboratory University of Illinois Savoy, Illinois 61874
November 1998
Final Report
This document is available to the public
through the National Technical Information
Service, Springfield, Virginia 22161.
0 U.S. Department of Transportation
Federal Aviation Administration
NOTICE
This document is disseminated under the sponsorship of the U.S. Department ofTransportation in the interest of information exchange. The United States Government
assumes no liability for the contents thereof.
Technical Report Documentation Page
1. Report No. 12. Government Accession No. 3. Recipient's Catalog No.
DOT/FAA/AM-98/28
4. Title and Subtitle 5. Report Date
Allocation of Attention With Head-Up Displays November 1998
6. Performing Organization Code
7. Author(s) 8. Performing Organization Report No.
Wickens, C.D. and Ververs, P.M.
9. Performing Organization Name and Address 10. Work Unit No. (TRAIS)
Aviation Research Laboratory, Institute of Aviation University of Illinois 1 Airport Road 11. Contract or Grant No.
Savoy, Illinois 61874 DTFA 95-G-049 12. Sponsoring Agency name and Address 13. Type of Report and Period Covered
Office of Aviation Medicine Federal Aviation Administration
Phase 1 Report
800 Independence Ave., S.W. Washington, D.C. 20591 14. Sponsoring Agency Code
15. Supplemental Notes
This grant was monitored by Dr. Dennis B. Beringer of the Civil Aeromedical Institute.
16. Abstract
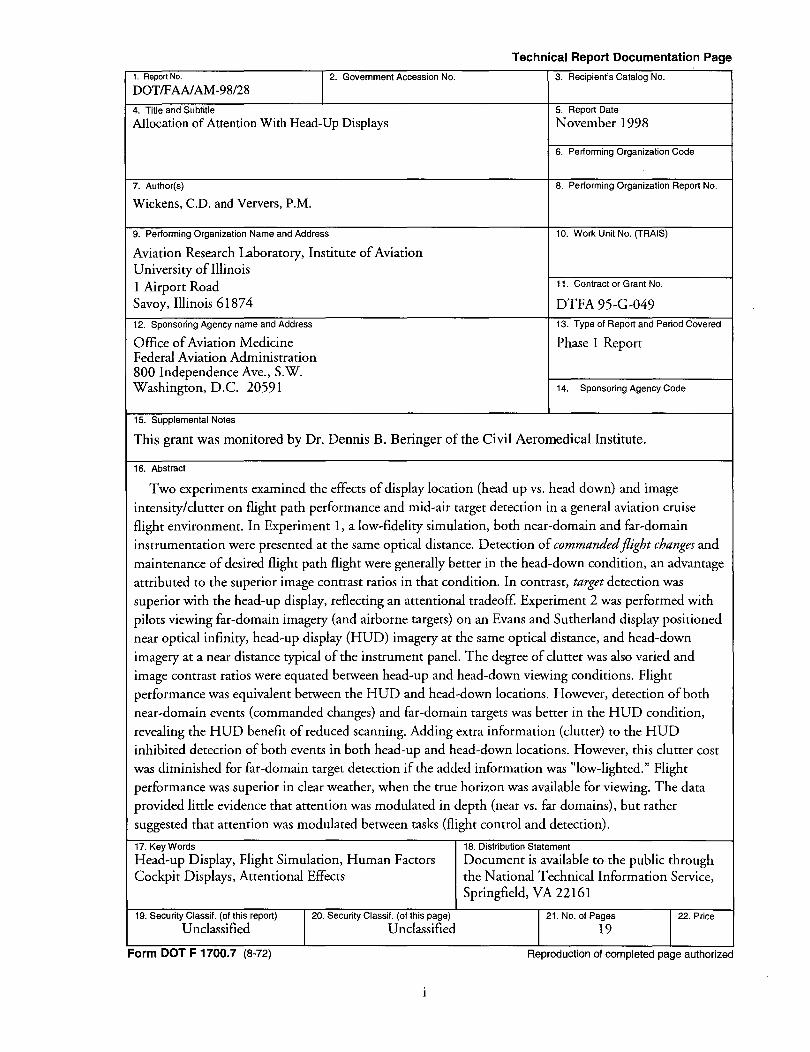
Two experiments examined the effects of display location (head up vs. head down) and image
intensity/clutter on flight path performance and mid-air target detection in a general aviation cruise flight environment. In Experiment 1, a low-fidelity simulation, both near-domain and far-domain instrumentation were presented at the same optical distance. Detection of commanded flight changes and
maintenance of desired flight path flight were generally better in the head-down condition, an advantage attributed to the superior image contrast ratios in that condition. In contrast, target detection was
superior with the head-up display, reflecting an attentional tradeoff. Experiment 2 was performed with
pilots viewing far-domain imagery (and airborne targets) on an Evans and Sutherland display positioned near optical infinity, head-up display (HUD) imagery at the same optical distance, and head-down
imagery at a near distance typical of the instrument panel. The degree of clutter was also varied and image contrast ratios were equated between head-up and head-down viewing conditions. Flight performance was equivalent between the HUD and head-down locations. However, detection of both
near-domain events (commanded changes) and far-domain targets was better in the HUD condition,
revealing the HUD benefit of reduced scanning. Adding extra information (clutter) to the HUD inhibited detection of both events in both head-up and head-down locations. However, this clutter cost was diminished for far-domain target detection if the added information was "low-lighted." Flight
performance was superior in clear weather, when the true horizon was available for viewing. The data provided little evidence that attention was modulated in depth (near vs. far domains), but rather
suggested that attention was modulated between tasks (flight control and detection).
17. KeyWords 18. Distribution Statement
Head-up Display, Flight Simulation, Human Factors Document is available to the public through Cockpit Displays, Attentional Effects the National Technical Information Service,
Springfield, VA 22161
19. Security Classif. (of this report) 120. Security Classif. (of this page) 121. No. of Paf9s 122. Price Unclassified Unclassified
Form DOT F 1700.7 (8-72) Reproduction of completed page authorized

1 1 1 1 1 1 1 1 1 1 1 1 1 1 1 1 1 1 1 1 1 1 1 1 1 1 1 1 1 1 1 1 1 1 1 1 1 1 1 1 1 1 1 1 1 1 1 1 1 1 1 1 1 1 1 1 1 1 1 1 1 1 1 1 1 1 1 1
ACKNOWLEDGMENTS
The authors acknowledge the critical role played by Sharon Yeakel and Jonathan Sivier in developing the software for these simulations, Chun-Keet Song for assisting with data collection in Experiment 1, and Steve Owen for assisting with data collection in Experiment 2 and for consulting on the flight dynamics of the simulation.
This research was sponsored by the Federal Aviation Administration Civil Aeromedical Institute (CAMI) and conducted under grant DTFA 95-G-049. Grant oversight, simulation dynamics consulting, and final editing of the OAM Technical Report version were performed by Dr. Dennis B. Beringer (AAM-510), CAMI. The work presented in this report was the first in a series of studies on head-up displays conducted as a part of CAM I' s general aviation human factors research program.
111

1 1 1 1 1 1 1 1 1 1 1 1 1 1 1 1 1 1 1 1 1 1 1 1 1 1 1 1 1 1 1 1 1 1 1 1 1 1 1 1 1 1 1 1 1 1 1 1 1 1 1 1 1 1 1 1 1 1
ALLOCATION OF ATTENTION WITH HEAD-UP DISPLAYS
INTRODUCTION
Head-up displays (HUDs) are being introduced into general aviation partly because of advantages shown in both military and commercial aviation. There are general findings favoring HUDs when compared with either typical instrumentation or the same HUD symbology presented in the head-down position. HUDs have continually shown performance benefits for flight path maintenance (Fischer, Haines, & Price, 1980; Wickens & Long, 1995) and detection of expected incidents or warnings (e.g., detecting the runway on approach) occurring either in the scene or on the symbology itself (Fischer, 1979; Larish & Wickens, 1991; Wickens & Long, 1995). However, some problems have arisen from the use of HUDs. Prefaced by Fischer, Haines, and Price (1980), a phenomenon known as attentional tunneling or cognitive capture has continued to be cited by a number of studies as adversely affecting performance in the detection of unexpected events (Larish & Wickens, 1991; Wickens & Long, 1995). Larish and Wickens ( 1991) found that, under particularly high workload conditions, the HUD induces a narrowing of attention, restricting processing to the data presented via the symbology. They speculated that pilots in that study may have become fixated on the symbology, thereby interrupting their scanning patterns for low-probability events, in this case, the appearance of a wind shear alert.
Some concerns have also been raised regarding the symbology cluttering the pilot's view of the world outside. Superimposing the instrumentation in the pilots' forward field of view may make it difficult to search the environment for information (Weintraub & Ensing, 1992). For instance, studies have shown that pilots flying with HUDs failed to notice or reacted slower to obstacles on the active runway during an approach (Wickens & Long, 199 5; Fischer, Haines, & Price, 1980). An incident was noted in a military report that excessive brightness, combined with an overload of symbology, probably resulted in the fixation on the display and distraction of the pilot. The conditions led the military pilot to fail to
detect a barrier on a runway, and the result was a mishap. In the final report, the presence of the HUD was named as a contributing factor to the incident.
To resolve some of the inherent problems with the use ofHUDs, one must understand how attention is modulated between the symbology and the environment beyond, and how this modulation is, in turn, influenced by task and display characteristics. The fundamental reason for incorporating head-up displays onto aircraft is to allow the pilot to monitor flight data without requiring attention to be reallocated back inside the cockpit. HUDs allow scanning the environment and scanning the superimposed instrumentation to be a matter of dividing attention between these far and near domains, respectively. The locus of focused attention is determined by the location of the information required, at that moment, by the pilot. Four potential locations for information sources exist when utilizing the HUD symbology (1) in the far-domain environment on objects such as a runway or another aircraft in the area, (2) on the instrumentation presented in the far domain which is intended to draw the pilot's attention outward, (3) on the instrumentation in near domain which, regardless of the designers' original intent, is processed closer to the pilots' resting dark focus point than to optical infinity (see Roscoe, 1987) and ( 4) inside the cockpit on the traditional head down instrumentation panel. The distinction between (2) and (3) is at present somewhat fuzzy because of difficulties both in measuring attention in depth and because of uncertainty regarding the extent to which image properties, such as collimation and symbology conformality, modulate attention along the depth axis. For these reasons, it is important to try to establish where attention is located at any given phase of flight in order to appropriately display data to the pilot. For example, scanning the instrumentation and the far domain environment are of equal importance during the cruise phase of flight, and collocating the sources of data at optical infinity should allow the pilot to more easily divide attention between the two sources. In
contrast, the pilot's attention should be primarily located on the runway in the far domain on final approach with the runway in sight, and not the instrumentation. Here, the pilot will need to filter the excess data in order to attain the necessary cues to land.
It might be gathered from the two scenarios above that the presence of a HUD may not always be beneficial to the pilot. The second scenario requires the pilot to filter or ignore the symbology to satisfactorily complete the goal of landing. The additional clutter suggests the data might be more appropriately presented on a head-down display (HDD). Thus, a principal tradeoff is revealed between the two types of displays. HUDs support scanning the environment but produce clutter, while HDDs relieve the forward field of view of clutter but increase the required visual scan. However, the drawbacks of the HUD may be lessened by modifying the data to make them less salient and less distracting to the pilot. A closer look at the effects of clutter reveals how the locus of attention can be modulated by HUD design characteristics.
There have been a number of studies that have manipulated the presentation of information on displays to investigate the effects of clutter on performance. The general finding from both basic attention literature (Eriksen & Eriksen, 197 4; T eichner & Mocharnuk, 1979; Treisman & Gelade, 1980) as well as the applied aviation domain (Martin-Emerson & Wickens, 1993; McCann, Foyle, & Johnston, 1993; Schons & Wickens, 1993; Ward, Parkes, & Lindsay, 1995; Wickens & Long, 1995), is that the presence of visual data is disruptive if it is not a required element to the task at hand. Ward, Parkes, and Lindsay (1995) found significantly slower response times to a leading car stopping abruptly when using an automobile HUD, as compared with driving without a HUD. Similarly, Wickens and Long (1995) found that the use of a HUD slowed responses to a wide-body jet unexpectedly taxiing onto the active runway when compared with using similar symbology presented in head-down position. However, the picture being painted for HUDs need not be so bleak. Studies by both Wickens and Long (1995) and Martin-Emerson and Wickens (1993) indicated that the potential clutter effects of HUD imagery could be reduced by using conformal imagery; i.e., symbology that was overlaid and fused with counterparts in the far domain. Methods need to be determined for reducing the negative effect that clutter has on pilot displayeddata processing. Additionally, the appropriateness of
2
the data on HUDs needs to be examined within the context of the current task of the pilot. For instance, given a particular phase of flight, what data should be presented and how?
While HUDs have been studied extensively, past investigations have failed to examine the critical issues in all phases of flight, particularly the cruise phase. It is in this phase of flight that it important to scan the environment for traffic, as well as to monitor the instrumentation. This is especially true for general aviation flying where visual flight rules (VFR) conditions are characteristic of flight, and ATC does not have the firm responsibility of maintaining traffic separation. We were unable to locate any studies in the literature that evaluated the impact ofHUDs on the detection of airborne traffic in simulated VFR flight, a critical issue for GA flight. The fundamental goal of the two experiments presented here is to understand how clutter costs (vs. scan costs) influence event detection in both the near (symbology) and far (environment) domains during the cruise phase of flight. Given that our interest is in the effects of clutter as a potentially inhibitory phenomenon, we vary the amount of data presented to the pilot. A second issue concerns how the effects of intensity and contrast may modulate the effects of clutter. We examine this issue by manipulating the weather (background environment) against which the instrumentation was displayed, and the intensity of the symbology itself. While the two experiments are fundamentally similar in investigating flight path tracking and the detection of near and far domain events as display location, symbology intensity, and weather conditions are varied in a cruise flight scenario, they also differed in three key respects. First, Experiment 1 is a low-fidelity simulation and Experiment 2 is a high-fidelity simulation. Second, Experiment 1 manipulates image conformality, and third, Experiment 2 varies the amount of data presented via the symbology.
EXPERIMENT 1
The first experiment used a low-fidelity simulation to investigate how pilots would respond to events occurring on the symbology, as well as in the environment. Three conditions were used to investigate the modulation of attention: location, intensity, and conformality. The principal hypotheses were based on assumptions of where attention was expected to be
directed by the tasks required of the pilots. The appearance of an aircraft in the far domain constituted a far domain (environment) event. Inasmuch as this event was expected, the pilots were required to continually switch their eyes and attention between the two domains to access information. The head-up location of the instrumentation could be expected to benefit detection due to the reduction in required visual scan. However, the added clutter could also obscure the presence of the aircraft and increase response time. The near domain events were comprised of discrete changes in the commanded heading, airspeed, and altitude indicators that needed to be detected and tracked. It was assumed that the location of the preponderance of data would direct attention there. Whereas three-fourths of the events involved symbology events, the pilot was expected to follow the "action" of the display, moving attention primarily downward when this information was presented in the head-down location, thereby benefiting response time to near domain (symbology) events in the HDD condition.
Intensity of the symbology was manipulated to determine if the level of brightness affected how well the pilot performed his/her task. The degree of contrast was not expected to influence performance in the head-down conditions because all three intensities produced large contrast differences. Therefore, the predictions were centered on the head-up conditions where the contrast between the symbology and the higher-intensity background was lower and would be expected to influence performance. It was expected that the symbology with the largest contrast ratios would support the best tracking and the fastest symbology event detection due to the salience of the indicators against the background. However, a highly salient display may distract the pilot and disrupt the scanning of the far domain, increasing the response time to the aircraft events. The opposite results were anticipated for low contrast, where the symbology would be the least distracting to the pilot and would enhance the detection of far domain events. However, if this low level of contrast made it difficult to perceive the values, the pilot would have difficulty processing the symbology-related data due to contrast alone independent of formatting. A mid-level contrast was included in an attempt to strike a compromise between the two contrast levels.
3
Many of our expectations about how pilots would track the segmented path in the simulation were based on the weather conditions. Consider that efficient control of an aircraft is obtained primarily through information derived from two different sources: the instruments and the environment. When the pilot is provided with favorable weather conditions, the opportunity is available to stabilize flight from environmental cues (e.g., the true horizon line). In cloudy conditions, when the far domain is obscured, flight attitude can only be reliably obtained from the instruments. One would expect to observe better attitude tracking performance in good weather, given that two sources of attitude information are available, than one would expect to observe in cloudy conditions. In addition, if clear weather induces more reliance on the true horizon in the far domain, this should also make it easier to scan for traffic, another essential requirement for piloting.
Conformality of the symbology set was also manipulated. The conformal set was characterized by a pitch ladder and a heading tape that were virtually conformal with the far domain counterpart. That is, angular displacements of the HUD symbology indicating pitch and roll were identical to displacements of the external visual scene. In the partially-conformal set, the displayed ranges of the pitch ladder and the heading tape were increased by condensing the distance between the markings. As a result, displacements of the HUD attitude symbology were minified as compared with displacements of the external visual scene. Thus, more information could be displayed in the same amount of space when using the partiallyconformal display.
METHOD
Design and Subjects. A mixed 2 x 2 x 3 x 3 factorial design was employed to the investigate the effects of location (head-up, head-down), symbology set type (conformal, partially conformal), intensity (dim, midlevel, bright), and weather conditions (clear, partly cloudy, cloudy). Half of the pilots were assigned the conformal symbology set and the other half the partially conformal set. The pilots received all other conditions in a pseudo-randomly presented order. Twenty volunteers, 18 males and 2 females, were paid to participate in the study. All were licensed pilots with an average of 1288 flight time hours, ranging between 100 and 9200 hours.
Apparatus/Symbology. The environment and the display symbology were generated by a Silicon Graphics IRIS workstation and presented on a 1 024 x 1024 resolution color monitor located approximately 72 centimeters from the pilots. The symbology overlaid the far domain visual scene, thereby equating the optical distance of the two sources. This allowed any differences in response times to be related to shifts in attention and gaze when extracting information from the different locations.
A two-axis joystick was used to control the pitch and roll of the simulated aircraft, and a throttle button was used to control airspeed. The joystick was mounted on the right arm of the pilots' chair. The monitor subtended 19 degrees of visual angle at nominal pilot eye position. The horizon line of the symbology set overlaid the horizon in the environment in the head-up location and sub tended 10 degrees of visual angle.
The symbology in the head-down location was presented against a black background and yielded contrast ratios of 80:1, 86:1, and 103:1 for the dim, mid-level, and bright intensities, respectively. In the head-up location, the contrast between the symbology and the background varied depending on whether the HUD was presented against the sky or the ground. Contrast ratios of each of the intensities also varied with the background and the weather conditions; therefore, overall "weighted" averages were calculated. The clear and partly cloudy conditions had contrast ratios of 1.06:1, 1.14:1, and 1.35:1; the
34 35
479.0
20
1.0
86
!!II
1'
cloudy conditions produced negative contrast ratios of 1:1.60, 1:1.50, and 1:1.24 for the dim, mid-level, and bright intensities.
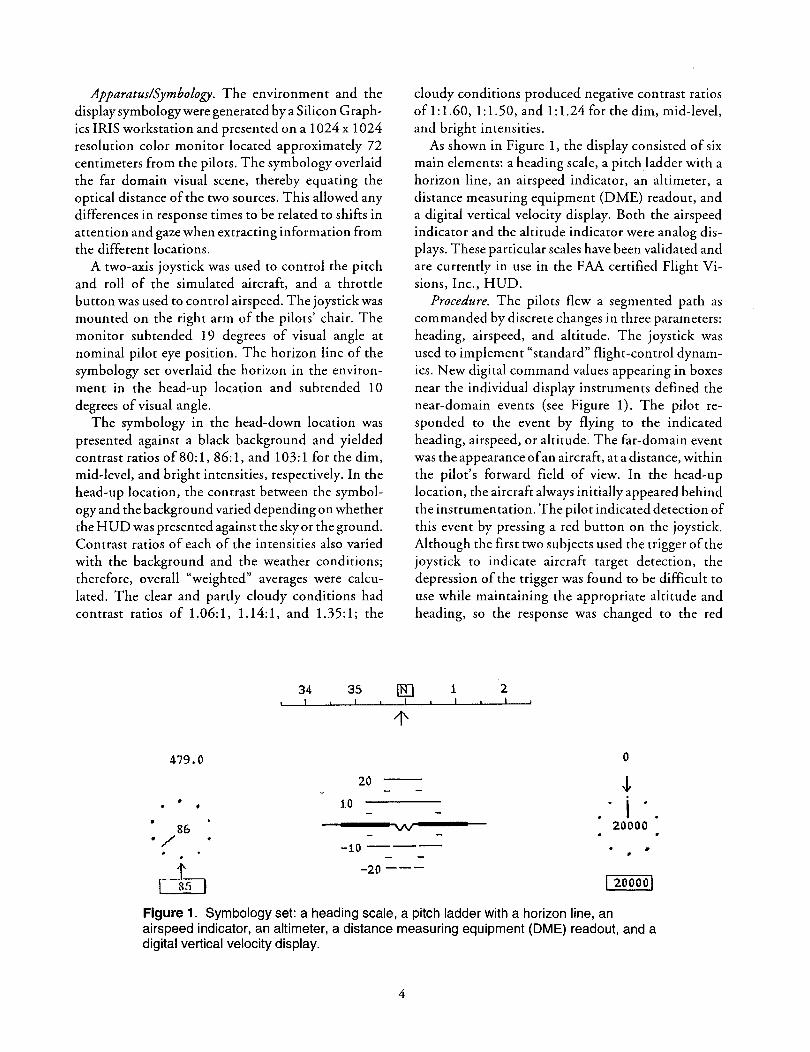
As shown in Figure 1, the display consisted of six main elements: a heading scale, a pitch ladder with a horizon line, an airspeed indicator, an altimeter, a distance measuring equipment (DME) readout, and a digital vertical velocity display. Both the airspeed indicator and the altitude indicator were analog displays. These particular scales have been validated and are currently in use in the FAA certified Flight Visions, Inc., HUD.
Procedure. The pilots flew a segmented path as commanded by discrete changes in three parameters: heading, airspeed, and altitude. The joystick was used to implement "standard" flight-control dynamics. New digital command values appearing in boxes near the individual display instruments defined the near-domain events (see Figure 1). The pilot responded to the event by flying to the indicated heading, airspeed, or altitude. The far-domain event was the appearance of an aircraft, at a distance, within the pilot's forward field of view. In the head-up location, the aircraft always initially appeared behind the instrumentation. The pilot indicated detection of this event by pressing a red button on the joystick. Although the first two subjects used the trigger of the joystick to indicate aircraft target detection, the depression of the trigger was found to be difficult to use while maintaining the appropriate altitude and heading, so the response was changed to the red
1 2
0
-1-
I 20000
•/ -1o--- •
du -20---I 2ooool
Figure 1. Symbology set: a heading scale, a pitch ladder with a horizon line, an airspeed indicator, an altimeter, a distance measuring equipment (DME) readout, and a digital vertical velocity display.
4
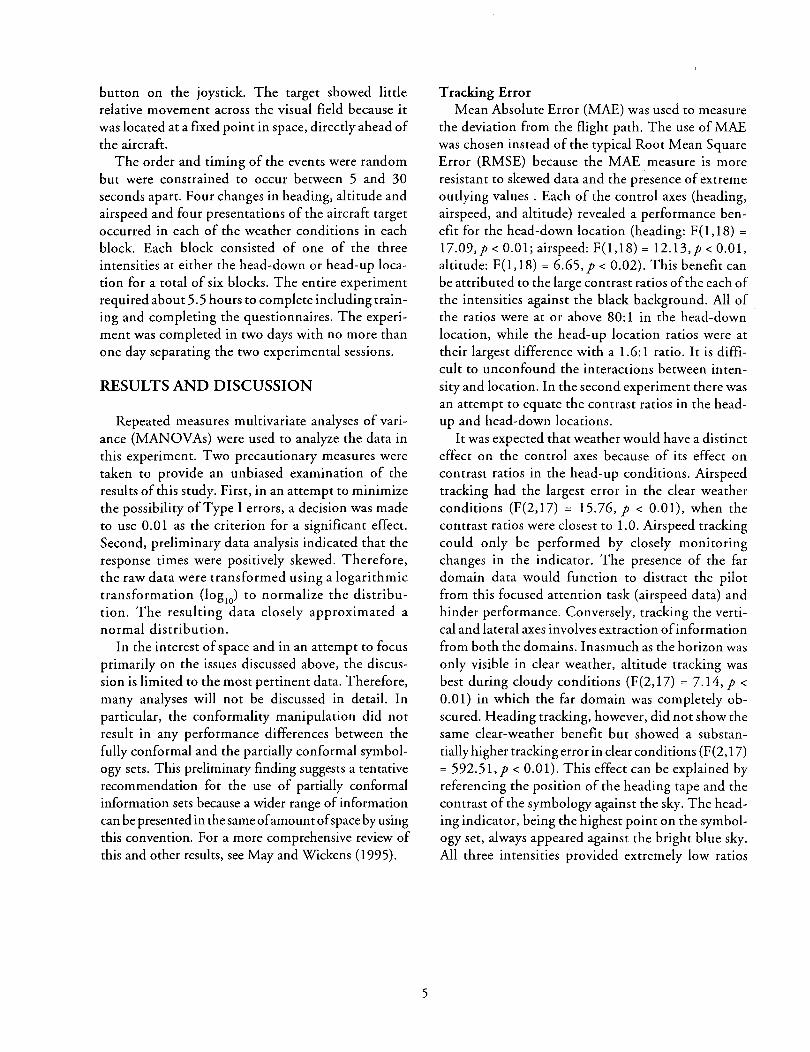
button on the joystick. The target showed little relative movement across the visual field because it was located at a fixed point in space, directly ahead of the aircraft.
The order and timing of the events were random but were constrained to occur between 5 and 30 seconds apart. Four changes in heading, altitude and airspeed and four presentations of the aircraft target occurred in each of the weather conditions in each block. Each block consisted of one of the three intensities at either the head-down or head-up location for a total of six blocks. The entire experiment required about 5. 5 hours to complete including training and completing the questionnaires. The experiment was completed in two days with no more than one day separating the two experimental sessions.
RESULTS AND DISCUSSION
Repeated measures multivariate analyses of variance (MANOVAs) were used to analyze the data in this experiment. Two precautionary measures were taken to provide an unbiased examination of the results of this study. First, in an attempt to minimize the possibility of Type I errors, a decision was made to use 0.01 as the criterion for a significant effect. Second, preliminary data analysis indicated that the response times were positively skewed. Therefore, the raw data were transformed using a logarithmic transformation (log
10) to normalize the distribu
tion. The resulting data closely approximated a normal distribution.
In the interest of space and in an attempt to focus primarily on the issues discussed above, the discussion is limited to the most pertinent data. Therefore, many analyses will not be discussed in detail. In particular, the conformality manipulation did not result in any performance differences between the fully conformal and the partially conformal symbology sets. This preliminary finding suggests a tentative recommendation for the use of partially conformal information sets because a wider range of information can be presented in thesameofamountofspace by using this convention. For a more comprehensive review of this and other results, see May and Wickens (1995).
5
Tracking Error Mean Absolute Error (MAE) was used to measure
the deviation from the flight path. The use of MAE was chosen instead of the typical Root Mean Square Error (RMSE) because the MAE measure is more resistant to skewed data and the presence of extreme outlying values . Each of the control axes (heading, airspeed, and altitude) revealed a performance benefit for the head-down location (heading: F(1,18) =
17.09,p < 0.01; airspeed: F(l,18) = 12.13,p < 0.01, altitude: F(l, 18) = 6.65, p < 0.02). This benefit can be attributed to the large contrast ratios of the each of the intensities against the black background. All of the ratios were at or above 80:1 in the head-down location, while the head-up location ratios were at their largest difference with a 1.6:1 ratio. It is difficult to unconfound the interactions between intensity and location. In the second experiment there was an attempt to equate the contrast ratios in the headup and head-down locations.
It was expected that weather would have a distinct effect on the control axes because of its effect on contrast ratios in the head-up conditions. Airspeed tracking had the largest error in the clear weather conditions (F(2,17) = 15.76, p < 0.01), when the contrast ratios were closest to 1.0. Airspeed tracking could only be performed by closely monitoring changes in the indicator. The presence of the far domain data would function to distract the pilot from this focused attention task (airspeed data) and hinder performance. Conversely, tracking the vertical and lateral axes involves extraction of information from both the domains. Inasmuch as the horizon was only visible in clear weather, altitude tracking was best during cloudy conditions (F(2,17) = 7.14,p <
0.01) in which the far domain was completely obscured. Heading tracking, however, did not show the same dear-weather benefit but showed a substantially higher tracking error in clear conditions (F (2, 17) = 592.5l,p < 0.01). This effect can be explained by referencing the position of the heading tape and the contrast of the symbology against the sky. The heading indicator, being the highest point on the symbology set, always appeared against the bright blue sky. All three intensities provided extremely low ratios
with the bright intensity nearly a 1:1 ratio. Therefore, the pilots found it difficult to track the information in the dear-weather conditions, resulting in greater tracking errors.
Response Time to Near-domain Symbologyrelated Events
The response time to the events on the symbology was calculated as the difference between the time the command was presented and the time when the pilot initiated a significant control movement in the correct direction. Each change required that attention be focused on the particular value of the parameters indicating the change.
A main effect oflocation revealed an advantage for the head-down presentation of all three symbologyrelated events (F(1,14) = 43.37,p < 0.01). This effect mirrors the tracking results, revealing that the low contrast of the symbology against the environment negatively affects performance. There was no main effect of intensity (F(2,13) = 0.27, p > 0.75). There was a main effect of weather, with the fastest responses
4
3.5
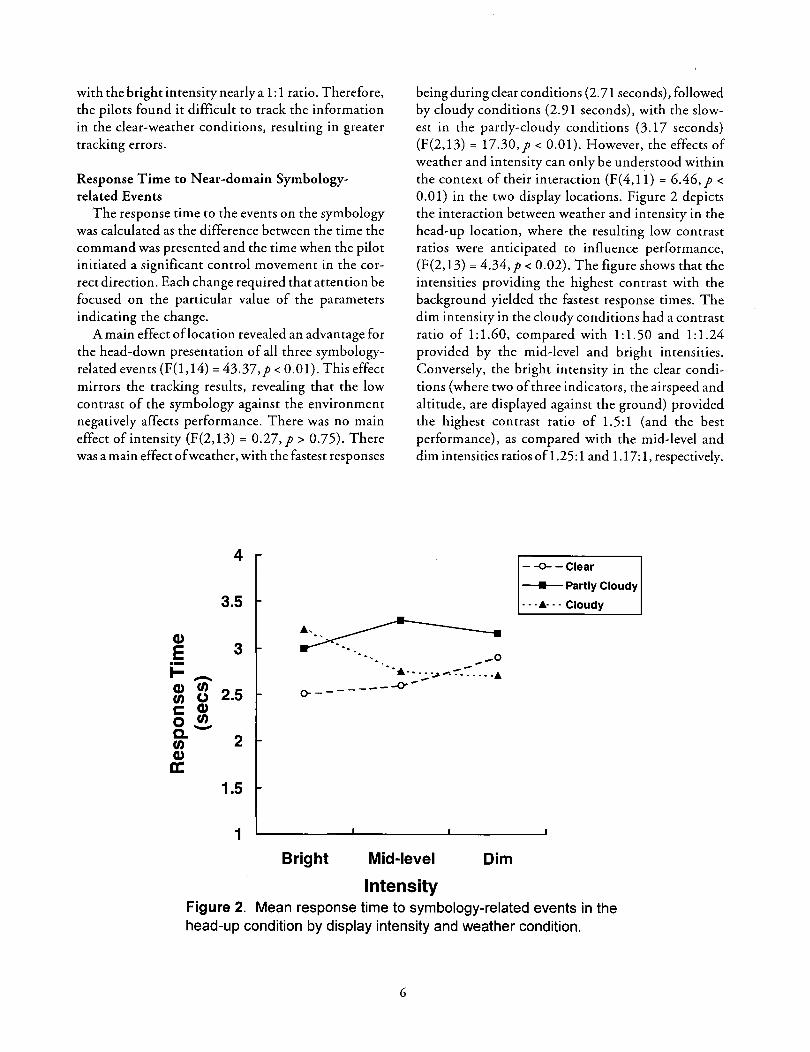
being during dear conditions (2. 71 seconds), followed by cloudy conditions (2.91 seconds), with the slowest in the partly-cloudy conditions (3.17 seconds) (F(2,13) = 17.30,p < 0.01). However, the effects of weather and intensity can only be understood within the context of their interaction (F( 4, 11) = 6.46, p <
0.01) in the two display locations. Figure 2 depicts the interaction between weather and intensity in the head-up location, where the resulting low contrast ratios were anticipated to influence performance, (F(2,13) = 4.34,p < 0.02). The figure shows that the intensities providing the highest contrast with the background yielded the fastest response times. The dim intensity in the cloudy conditions had a contrast ratio of 1:1.60, compared with 1:1.50 and 1:1.24 provided by the mid-level and bright intensities. Conversely, the bright intensity in the clear conditions (where two of three indicators, the airspeed and altitude, are displayed against the ground) provided the highest contrast ratio of 1.5:1 (and the best performance), as compared with the mid-level and dim intensities ratios of 1.25:1 and 1.17:1, respectively.
- -o- -Clear
• Partly Cloudy
···&···Cloudy
Cl)
E i= -Cl) en en ~
3
2.5
.. __ o
•••·• ...... --~.~- .• ·& o---------0---
r:::: en o_ c. en Cl) a:
2
1.5
1
Bright Mid-level
Intensity
Dim
Figure 2. Mean response time to symbology-related events in the head-up condition by display intensity and weather condition.
6
Response Time to Far-domain Aircraft Events ANOVAs were used to analyze the pilot response
time to the appearance of the mid-air target in the far domain. A significant main effect for location (F( 1, 17) = 24.19,p < 0.01) revealed a benefit for the head-up position (2.90 seconds) relative to the head-down position (3.50 seconds). Therefore, the benefit of a reduced scanning area more than offset the cost accruing from clutter of the added information in the forward field environment. Thus, and not unexpectedly, a benefit accrued to the out-the-window surveillance through use of the HUD. There was also a main effect of weather (F(2, 16) = 102.29, p < 0.01), with being more difficult to detect in cloudy conditions, due to the reduced contrast of the target against the background clouds (although clouds never obscured the targets). There was no effect of intensity (F(2, 16) = 0.99, p = 0.39), revealing that none of the three intensities provided sufficient contrast to disrupt the pilot's scan of the environment in the headup location.
The results of Experiment 1 highlighted issues of visibility and contrast in processing BUD-presented data. Performance on nearly all aspects of flight was sacrificed in the HUD location by the greatly reduced contrast ratios that resulted. At the same time, the reduced scanning provided by the HUD location benefited the pilot in detecting far-domain targets. This benefit did not appear to be offset or neutralized by the presence of clutter. In a sense, this is not surprising because the contrast ratios were so close to 1.0, and thereby added little clutter to the scene in any case.
Although the results of Experiment 1 do not provide strong support for the benefit of HUDs, it should be noted that the level of flight performance with the HUD was statistically equivalent to that obtained in the head-down condition when the combination of weather and symbology intensity provided the most favorable contrast ratio. One objective of Experiment 2 was to eliminate the confound between location and contrast observed in Experiment 1. A second objective was to examine, in greater detail, the role of clutter, while a third objective was to examine all of these issues in a higher-fidelity simulation.
7
EXPERIMENT 2
The primary goal of Experiment 2 was to examine the combined effects of location, clutter, and image contrast (defined by image intensity and background) on flight control and on detection of both neardomain display events and far-domain targets. Thus, we used the same general approach as in Experiment 1, but in a more realistic visual simulation. A secondary goal of Experiment 2 was to understand how these effects may be mediated by attention.
As we have noted, performance with HUDs, as opposed to head down displays, involves a tradeoff between the benefits of reduced scanning and the costs of clutter. The latter have been attributed as a causal factor in the few cases when HUDs have led to poorer performance in the detection of rare events (e.g., Wickens & Long, 1995; Larish & Wickens, 1991) or performance with digital indicators (McCann & Foyle, 1996; Wickens & Long, 1995), but the direct effects of HUD clutter have not been documented by systematically modulating the amount of data on the display. We did this in Experiment 2 by imposing two levels of clutter. In the low-clutter condition, only the minimum information deemed necessary to complete the tasks was provided. In the high-clutter condition, plausible but task-irrelevant information was imposed. In addition, a third intermediate display format presented the same information as the high-clutter display but low-lighted (de-intensified) the task-irrelevant symbology (Martens & Wickens, 1995; Synder & Dye, 1991).
Experimental manipulation of intensity was accomplished by presenting imagery in the high- and low-clutter displays at two levels of intensity. This, in turn, created four levels of contrast in the head-up condition, depending on whether the pilot was flying in clear or cloudy weather. In contrast to Experiment 1, we adjusted the background intensity in the headdown conditions to produce equivalent contrasts to those measured in the HUD conditions.
Also in contrast to Experiment 1, our experimental manipulation oflocation in Experiment 2 intentionally confounded location with accommodative distance. That is, both HUD and far domain information were presented "optically far" (around 3 meters),
whereas the head-down instrumentation was viewed on a near instrument panel, approximately 65 em, a viewing distance that would be typical of a real cockpit.
While our primary interest was in the main effects and interactions between these variables, secondary interests were in modeling the results in terms of the allocation of visual attention to one of three loci: the far domain, at which the true horizon and aircraft targets were located; the head-up near domain (HUD instrumentation); and the head-down near domain symbology on the instrument panel. Attention switching costs between the up and down locations are well characterized by visual scanning. Our interest was in the existence of added switching costs between near and far.
METHOD
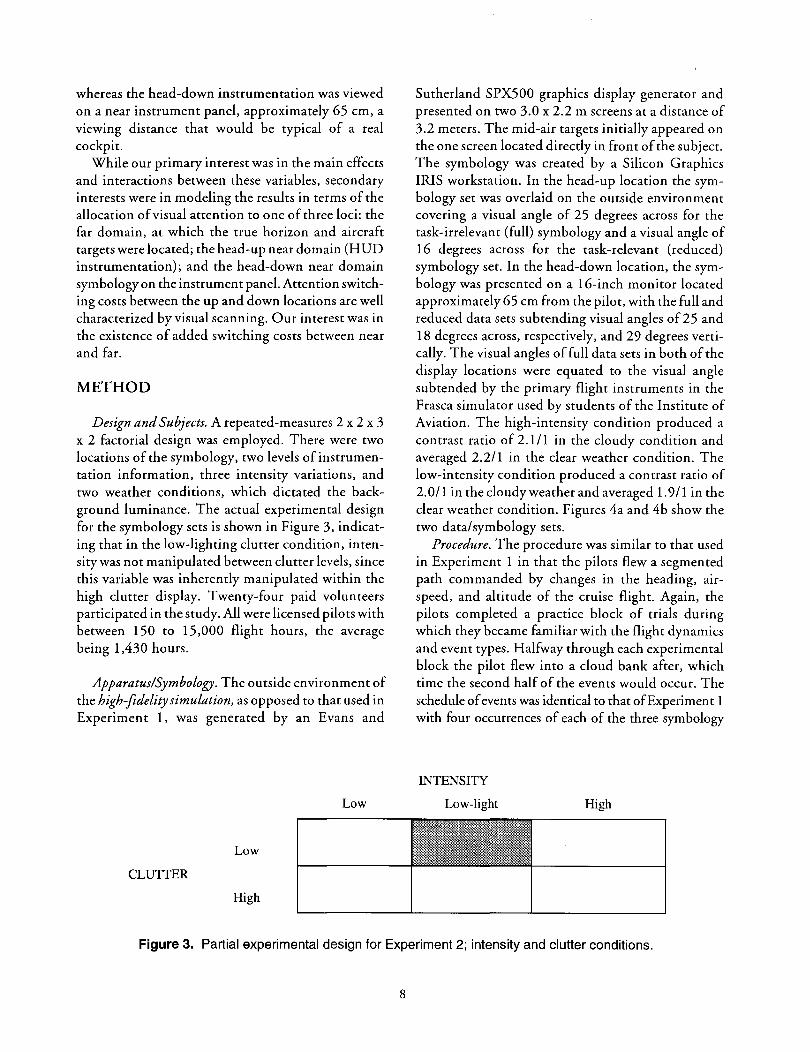
Design and Subjects. A repeated-measures 2 x 2 x 3 x 2 factorial design was employed. There were two locations of the symbology, two levels of instrumentation information, three intensity variations, and two weather conditions, which dictated the background luminance. The actual experimental design for the symbology sets is shown in Figure 3, indicating that in the low-lighting clutter condition, intensity was not manipulated between clutter levels, since this variable was inherently manipulated within the high clutter display. Twenty-four paid volunteers participated in the study. All were licensed pilots with between 150 to 15,000 flight hours, the average being 1,430 hours.
Apparatus/Symbology. The outside environment of the high-fidelity simulation, as opposed to that used in Experiment 1, was generated by an Evans and
Low
Low
CLUTTER
High
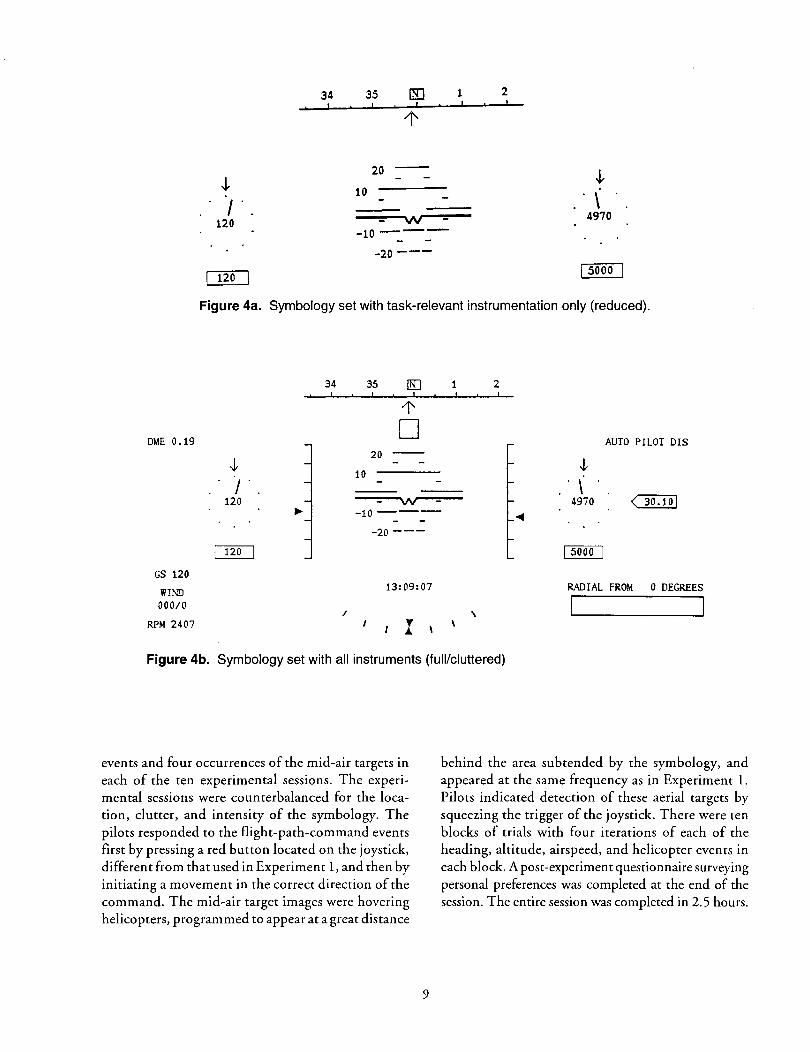
Sutherland SPX500 graphics display generator and presented on two 3.0 x 2.2 m screens at a distance of 3.2 meters. The mid-air targets initially appeared on the one screen located directly in front of the subject. The symbology was created by a Silicon Graphics IRIS workstation. In the head-up location the symbology set was overlaid on the outside environment covering a visual angle of 25 degrees across for the task-irrelevant (full) symbology and a visual angle of 16 degrees across for the task-relevant (reduced) symbology set. In the head-down location, the symbology was presented on a 16-inch monitor located approximately 65 em from the pilot, with the full and reduced data sets subtending visual angles of 25 and 18 degrees across, respectively, and 29 degrees vertically. The visual angles of full data sets in both of the display locations were equated to the visual angle subtended by the primary flight instruments in the Frasca simulator used by students of the Institute of Aviation. The high-intensity condition produced a contrast ratio of 2.1/1 in the cloudy condition and averaged 2.2/1 in the clear weather condition. The low-intensity condition produced a contrast ratio of 2.0/1 in thedoudyweatherandaveraged 1.9/1 in the dear weather condition. Figures 4a and 4b show the two data/symbology sets.
Procedure. The procedure was similar to that used in Experiment 1 in that the pilots flew a segmented path commanded by changes in the heading, airspeed, and altitude of the cruise flight. Again, the pilots completed a practice block of trials during which they became familiar with the flight dynamics and event types. Halfway through each experimental block the pilot flew into a cloud bank after, which time the second half of the events would occur. The schedule of events was identical to that ofExperiment 1 with four occurrences of each of the three symbology
INTENSITY
Low-light High
Figure 3. Partial experimental design for Experiment 2; intensity and clutter conditions.
8
34 35 1 2
20
10 ,J,
I 120
==;;;:=..w,.=:;;=:
J,
\ 4970
-1o-_-_--2o ---
I 120 I I sooo I
Figure 4a. Symbology set with task-relevant instrumentation only (reduced).
34 35
DME 0.19
.J, 10
20
I 120
[ill 1
1' D
w
2
-1-
\ 4970
AUTO PILOT DIS
-1o---- --20---
mD GS 120
WIND 13:09:07 RADIAL FROM 0 DEGREES
000/0 I \
RPM 2407 I Figure 4b. Symbology set with all instruments (full/cluttered)
events and four occurrences of the mid-air targets in each of the ten experimental sessions. The experimental sessions were counterbalanced for the location, clutter, and intensity of the symbology. The pilots responded to the flight-path-command events first by pressing a red button located on the joystick, different from that used in Experiment 1, and then by initiating a movement in the correct direction of the command. The mid-air target images were hovering helicopters, programmed to appear at a great distance
9
behind the area subtended by the symbology, and appeared at the same frequency as in Experiment 1. Pilots indicated detection of these aerial targets by squeezing the trigger of the joystick. There were ten blocks of trials with four iterations of each of the heading, altitude, airspeed, and helicopter events in each block. A post-experiment questionnaire surveying personal preferences was completed at the end of the session. The entire session was completed in 2.5 hours.
RESULTS
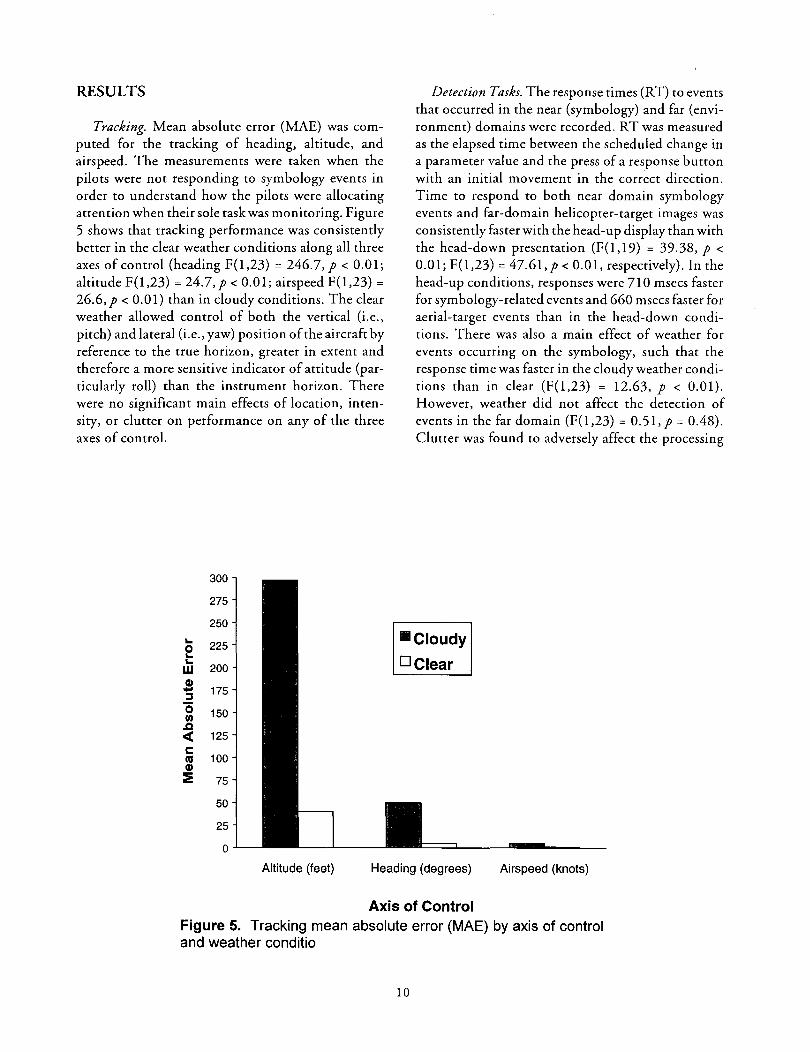
Tracking. Mean absolute error (MAE) was computed for the tracking of heading, altitude, and airspeed. The measurements were taken when the pilots were not responding to symbology events in order to understand how the pilots were allocating attention when their sole task was monitoring. Figure 5 shows that tracking performance was consistently better in the clear weather conditions along all three axes of control (heading F(1,23) = 246.7, p < 0.01; altitude F(1,23) = 24.7,p < 0.01; airspeed F(l,23) = 26.6, p < 0.01) than in cloudy conditions. The clear weather allowed control of both the vertical (i.e., pitch) and lateral (i.e., yaw) position of the aircraft by reference to the true horizon, greater in extent and therefore a more sensitive indicator of attitude (particularly roll) than the instrument horizon. There were no significant main effects of location, intensity, or clutter on performance on any of the three axes of control.
300
275
250 ...
225 e ... w 200 Q) ..... 175 :I 0 150 1/) ..c <( 125 c:: nl 100 Q)
:iE 75
50
25
0
Detection Tasks. The response times (RT) to events that occurred in the near (symbology) and far (environment) domains were recorded. RT was measured as the elapsed time between the scheduled change in a parameter value and the press of a response button with an initial movement in the correct direction. Time to respond to both near domain symbology events and far-domain helicopter-target images was consistently faster with the head-up display than with the head-down presentation (F(l,19) = 39.38,p < 0.01; F(l,23) = 47.61,p < 0.01, respectively). In the head-up conditions, responses were 710 msecs faster for symbology-related events and 660 msecs faster for aerial-target events than in the head-down conditions. There was also a main effect of weather for events occurring on the symbology, such that the response time was faster in the cloudy weather conditions than in clear (F(l,23) = 12.63, p < 0.01). However, weather did not affect the detection of events in the far domain (F(l,23) = 0.51,p = 0.48). Clutter was found to adversely affect the processing
•cloudy
DCiear
Altitude (feet) Heading (degrees) Airspeed (knots)
Axis of Control Figure 5. Tracking mean absolute error (MAE) by axis of control and weather conditio
10
of both the symbology (F(l, 19) = 13.29, p < 0.0 I) and far domain events (F(l,23)=14.20, p < 0.01). The remaining analyses further describe the effects of the individual factors (i.e., intensity, weather, and clutter) and their interactions in both the near and far domains.
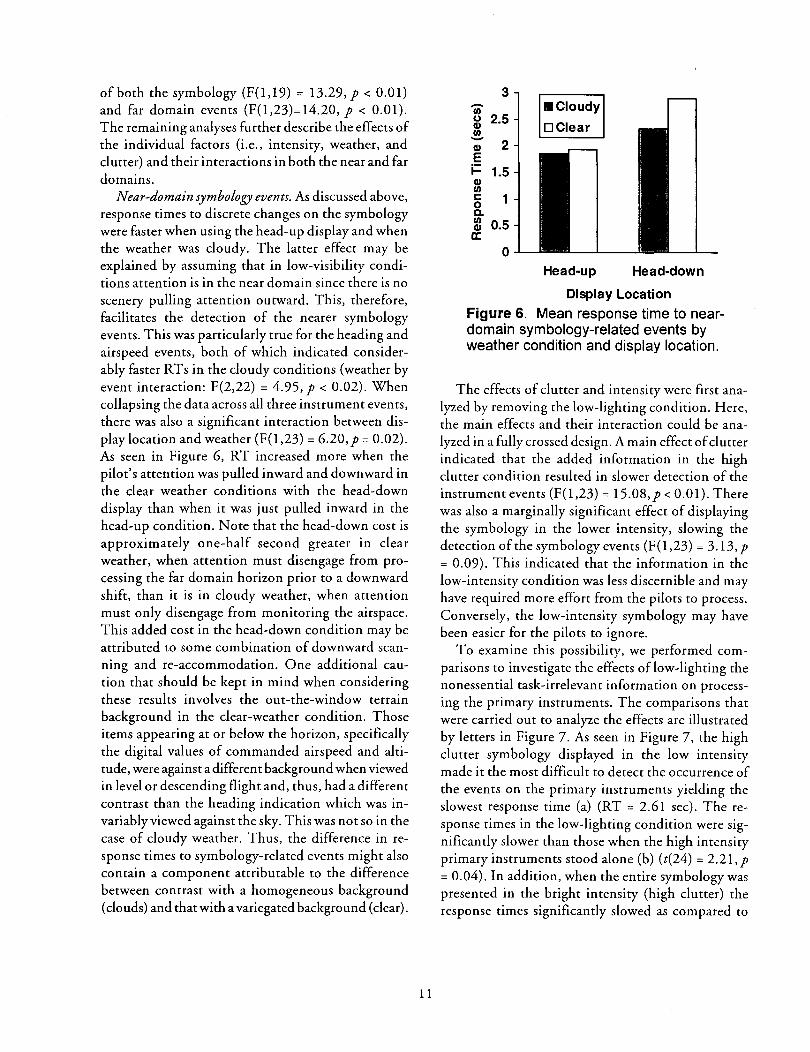
Near-domain symbology events. As discussed above, response times to discrete changes on the symbology were faster when using the head-up display and when the weather was cloudy. The latter effect may be explained by assuming that in low-visibility conditions attention is in the near domain since there is no scenery pulling attention outward. This, therefore, facilitates the detection of the nearer symbology events. This was particularly true for the heading and airspeed events, both of which indicated considerably faster RTs in the cloudy conditions (weather by event interaction: F(2,22) = 4.95, p < 0.02). When collapsing the data across all three instrument events, there was also a significant interaction between display location and weather (F(1,23) = 6.20,p = 0.02). As seen in Figure 6, RT increased more when the pilot's attention was pulled inward and downward in the clear weather conditions with the head-down display than when it was just pulled inward in the head-up condition. Note that the head-down cost is approximately one-half second greater in clear weather, when attention must disengage from processing the far domain horizon prior to a downward shift, than it is in cloudy weather, when attention must only disengage from monitoring the airspace. This added cost in the head-down condition may be attributed to some combination of downward scanning and re-accommodation. One additional caution that should be kept in mind when considering these results involves the out-the-window terrain background in the dear-weather condition. Those items appearing at or below the horizon, specifically the digital values of commanded airspeed and altitude, were against a different background when viewed in level or descending flight and, thus, had a different contrast than the heading indication which was invariably viewed against the sky. This was not so in the case of cloudy weather. Thus, the difference in response times to symbology-related events might also contain a component attributable to the difference between contrast with a homogeneous background (clouds) and that with a variegated background (clear).
11
3 - •cloudy U) u 2.5
DCiear G) U) - 2 G)
E j:: 1.5 G) U) s::: 1 0 a. U) 0.5 G) a:
0 Head-up Head-down
Display Location
Figure 6. Mean response time to neardomain symbology-related events by weather condition and display location.
The effects of clutter and intensity were first analyzed by removing the low-lighting condition. Here, the main effects and their interaction could be analyzed in a fully crossed design. A main effect of clutter indicated that the added information in the high clutter condition resulted in slower detection of the instrument events (F(l ,23) = 15.08, p < 0.0 1). There was also a marginally significant effect of displaying the symbology in the lower intensity, slowing the detection of the symbology events (F(l ,23) = 3.13, p = 0.09). This indicated that the information in the low-intensity condition was less discernible and may have required more effort from the pilots to process. Conversely, the low-intensity symbology may have been easier for the pilots to ignore.
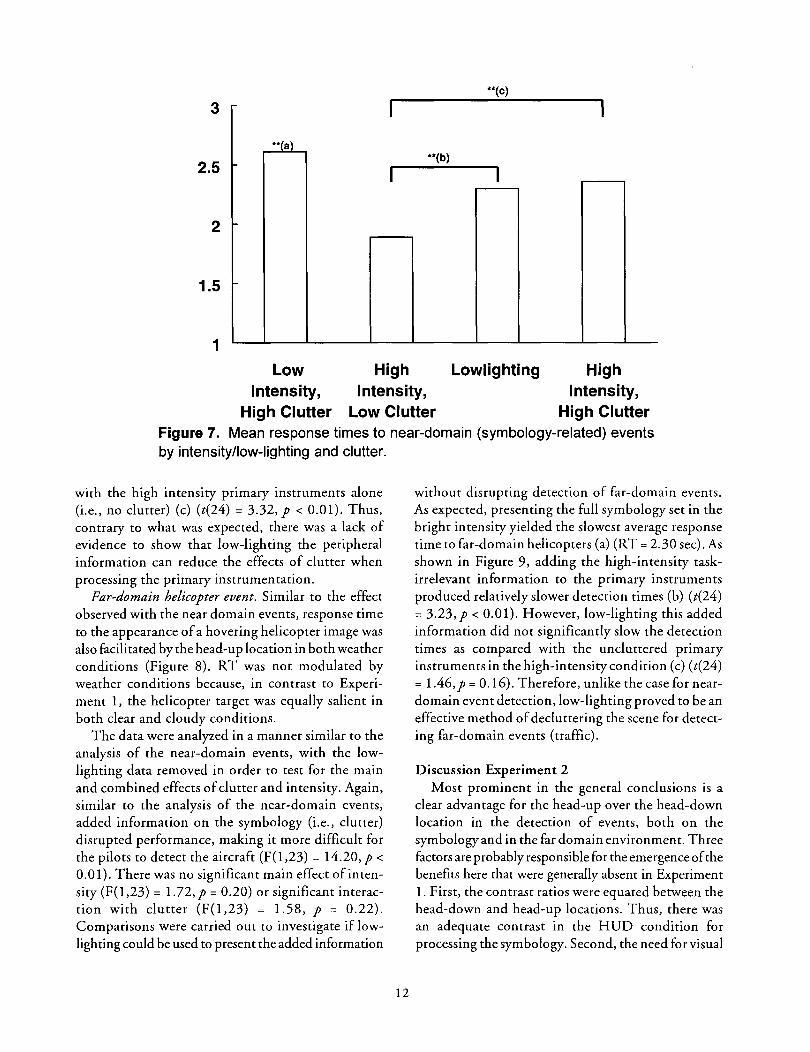
To examine this possibility, we performed comparisons to investigate the effects of low-lighting the nonessential task-irrelevant information on processing the primary instruments. The comparisons that were carried out to analyze the effects are illustrated by letters in Figure 7. As seen in Figure 7, the high clutter symbology displayed in the low intensity made it the most difficult to detect the occurrence of the events on the primary instruments yielding the slowest response time (a) (RT = 2.61 sec). The response times in the low-lighting condition were significantly slower than those when the high intensity primary instruments stood alone (b) (t(24) = 2.21, p = 0.04). In addition, when the entire symbology was presented in the bright intensity (high clutter) the response times significantly slowed as compared to
**(c)
3 I I
**(a) **(b)
I I 2.5
2
1.5
1
Low Intensity,
High Clutter
High Lowlighting High Intensity,
High Clutter Intensity,
Low Clutter Figure 7. Mean response times to near-domain (symbology-related) events by intensity/low-lighting and clutter.
with the high intensity primary instruments alone (i.e., no clutter) (c) (t(24) = 3.32, p < 0.01). Thus, contrary to what was expected, there was a lack of evidence to show that low-lighting the peripheral information can reduce the effects of clutter when processing the primary instrumentation.
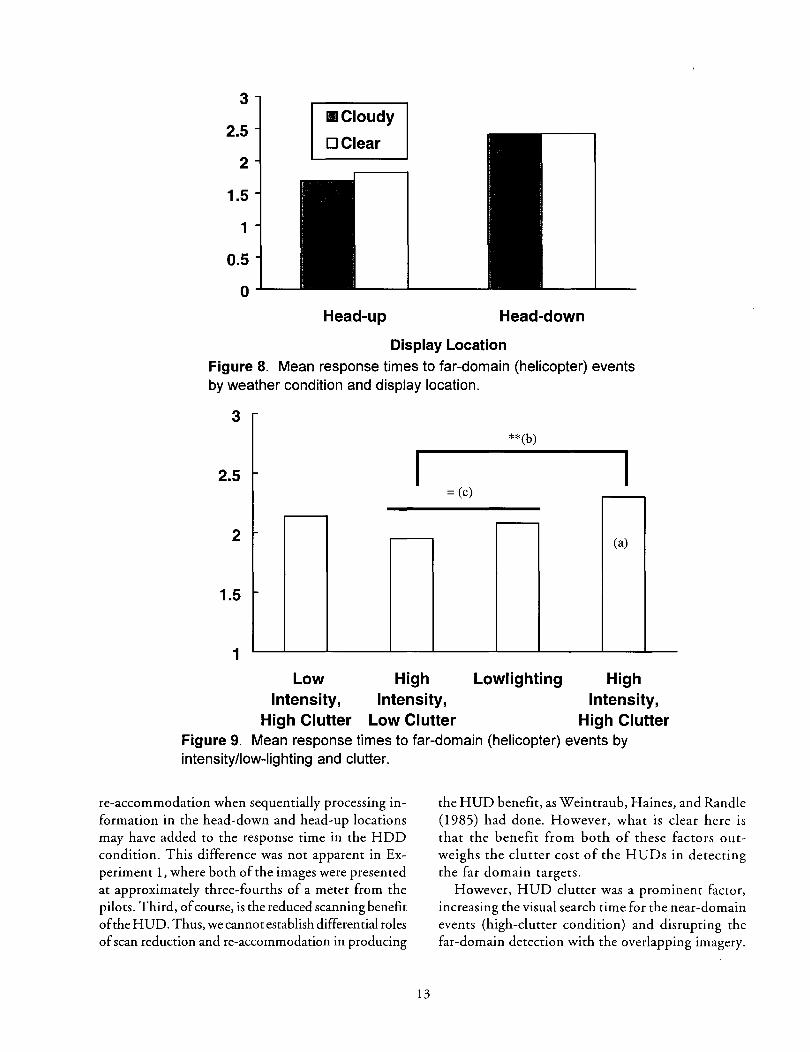
Far-domain helicopter event. Similar to the effect observed with the near domain events, response time to the appearance of a hovering helicopter image was also facilitated by the head-up location in both weather conditions (Figure 8). RT was not modulated by weather conditions because, in contrast to Experiment 1, the helicopter target was equally salient in both clear and cloudy conditions.
The data were analyzed in a manner similar to the analysis of the near-domain events, with the lowlighting data removed in order to test for the main and combined effects of clutter and intensity. Again, similar to the analysis of the near-domain events, added information on the symbology (i.e., clutter) disrupted performance, making it more difficult for the pilots to detect the aircraft (F(1,23) = 14.20,p < 0.01). There was no significant main effect of intensity (F(1,23) = 1.72,p = 0.20) or significant interaction with clutter (F(1,23) = 1.58, p = 0.22). Comparisons were carried out to investigate if lowlighting could be used to present the added information
12
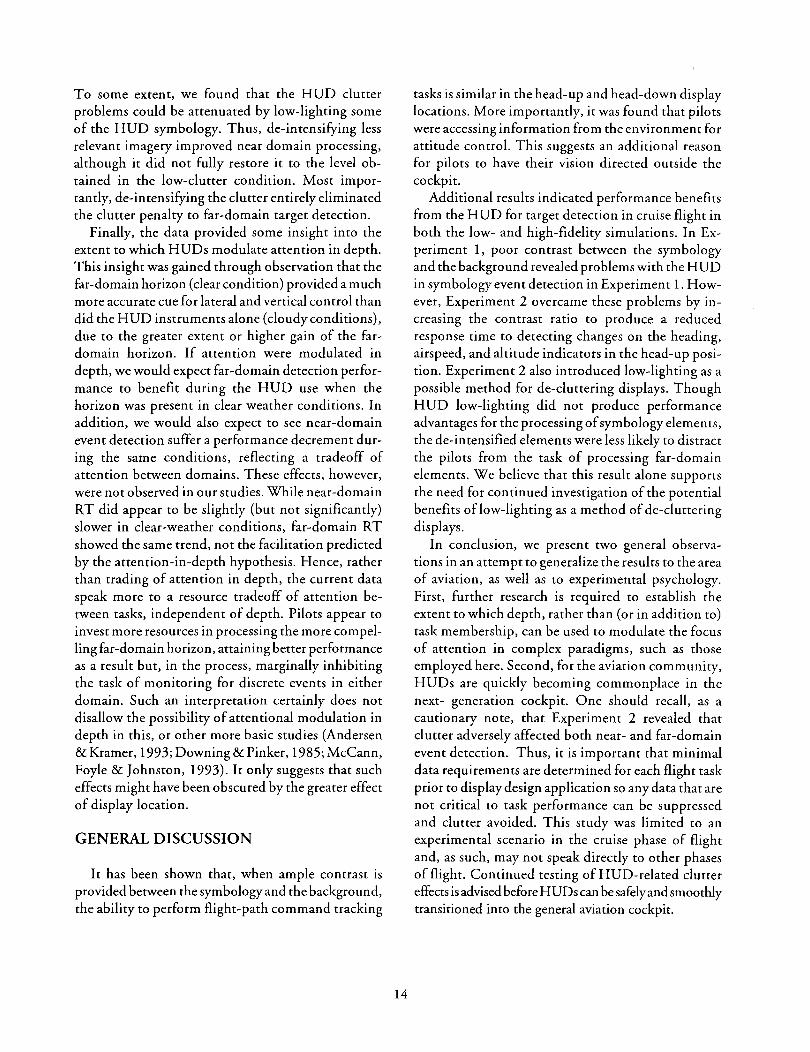
without disrupting detection of far-domain events. As expected, presenting the full symbology set in the bright intensity yielded the slowest average response time to far-domain helicopters (a) (RT = 2.30 sec). As shown in Figure 9, adding the high-intensity taskirrelevant information to the primary instruments produced relatively slower detection times (b) (t(24) = 3.23, p < 0.01). However, low-lighting this added information did not significantly slow the detection times as compared with the uncluttered primary instruments in the high-intensity condition (c) (t(24) = 1.46, p = 0.16). Therefore, unlike the case for neardomain event detection, low-lighting proved to be an effective method of decluttering the scene for detecting far-domain events (traffic).
Discussion Experiment 2 Most prominent in the general conclusions is a
clear advantage for the head-up over the head-down location in the detection of events, both on the symbology and in the far domain environment. Three factors are probably responsible for the emergence of the benefits here that were generally absent in Experiment 1. First, the contrast ratios were equated between the head-down and head-up locations. Thus, there was an adequate contrast in the HUD condition for processing the symbology. Second, the need for visual
3
2.5 •cloudy
DCiear 2
1.5
1
0.5
0
Head-up Head-down
Display Location
Figure 8. Mean response times to far-domain (helicopter) events by weather condition and display location.
3 **(b)
2.5 I I =(c)
2 (a)
1.5
1
Low High Lowlighting High Intensity, Intensity, Intensity,
High Clutter Low Clutter High Clutter Figure 9. Mean response times to far-domain (helicopter) events by intensity/low-lighting and clutter.
re-accommodation when sequentially processing information in the head-down and head-up locations may have added to the response time in the HDD condition. This difference was not apparent in Experiment 1, where both of the images were presented at approximately three-fourths of a meter from the pilots. Third, of course, is the reduced scanning benefit of the HUD. Thus, we cannot establish differential roles of scan reduction and re-accommodation in producing
13
the HUD benefit, as Weintraub, Haines, and Randle (1985) had done. However, what is clear here is that the benefit from both of these factors outweighs the clutter cost of the HUDs in detecting the far domain targets.
However, HUD clutter was a prominent factor, increasing the visual search time for the near-domain events (high-clutter condition) and disrupting the far-domain detection with the overlapping imagery.
To some extent, we found that the HUD clutter problems could be attenuated by low-lighting some of the HUD symbology. Thus, de-intensifying less relevant imagery improved near domain processing, although it did not fully restore it to the level obtained in the low-clutter condition. Most importantly, de-intensifying the clutter entirely eliminated the clutter penalty to far-domain target detection.
Finally, the data provided some insight into the extent to which HUDs modulate attention in depth. This insight was gained through observation that the far-domain horizon (clear condition) provided a much more accurate cue for lateral and vertical control than did the HUD instruments alone (cloudy conditions), due to the greater extent or higher gain of the fardomain horizon. If attention were modulated in depth, we would expect far-domain detection performance to benefit during the HUD use when the horizon was present in clear weather conditions. In addition, we would also expect to see near-domain event detection suffer a performance decrement during the same conditions, reflecting a tradeoff of attention between domains. These effects, however, were not observed in our studies. While near-domain RT did appear to be slightly (but not significantly) slower in dear-weather conditions, far-domain RT showed the same trend, not the facilitation predicted by the attention-in-depth hypothesis. Hence, rather than trading of attention in depth, the current data speak more to a resource tradeoff of attention between tasks, independent of depth. Pilots appear to invest more resources in processing the more compelling far-domain horizon, attaining better performance as a result but, in the process, marginally inhibiting the task of monitoring for discrete events in either domain. Such an interpretation certainly does not disallow the possibility of attentional modulation in depth in this, or other more basic studies (Andersen & Kramer, 1993; Downing & Pinker, 1985; McCann, Foyle & Johnston, 1993). It only suggests that such effects might have been obscured by the greater effect of display location.
GENERAL DISCUSSION
It has been shown that, when ample contrast is provided between the symbology and the background, the ability to perform flight-path command tracking
14
tasks is similar in the head-up and head-down display locations. More importantly, it was found that pilots were accessing information from the environment for attitude control. This suggests an additional reason for pilots to have their vision directed outside the cockpit.
Additional results indicated performance benefits from the HUD for target detection in cruise flight in both the low- and high-fidelity simulations. In Experiment 1, poor contrast between the symbology and the background revealed problems with the HUD in symbology event detection in Experiment 1. However, Experiment 2 overcame these problems by increasing the contrast ratio to produce a reduced response time to detecting changes on the heading, airspeed, and altitude indicators in the head-up position. Experiment 2 also introduced low-lighting as a possible method for de-cluttering displays. Though HUD low-lighting did not produce performance advantages for the processing of symbology elements, the de-intensified elements were less likely to distract the pilots from the task of processing far-domain elements. We believe that this result alone supports the need for continued investigation of the potential benefits of low-lighting as a method of de-cluttering displays.
In conclusion, we present two general observations in an attempt to generalize the results to the area of aviation, as well as to experimental psychology. First, further research is required to establish the extent to which depth, rather than (or in addition to) task membership, can be used to modulate the focus of attention in complex paradigms, such as those employed here. Second, for the aviation community, HUDs are quickly becoming commonplace in the next- generation cockpit. One should recall, as a cautionary note, that Experiment 2 revealed that clutter adversely affected both near- and far-domain event detection. Thus, it is important that minimal data requirements are determined for each flight task prior to display design application so any data that are not critical to task performance can be suppressed and clutter avoided. This study was limited to an experimental scenario in the cruise phase of flight and, as such, may not speak directly to other phases of flight. Continued testing of HUD-related clutter effects is advised before HUDs can be safely and smoothly transitioned into the general aviation cockpit.
REFERENCES
Andersen, G.J. & Kramer, A.F. (1993). Limits of focused attention in three-dimensional space. Perception & Psychophysics, 53(6), 658-67.
Downing, C.J. & Pinker, S. (1985). The spatial structure of visual attention. In M.I. Posner & 0. Marin (Eds.). Attention and Performance XI, 171-87.
Eriksen, B.A. & Eriksen, C.W. (1974). Effects of noise letters upon the identification of a target letter in a nonsearch task. Perception & Psychophysics, 16, 143-49.
Fischer, E. (1979). The role of cognitive switching in head-up displays (NASA Contractor Report 3137). Moffett Field, CA: NASA Ames Research Center.
Fischer, E., Haines, R.F., & Price, T.A. (1980). Cognitive issues in head-up display (NASA Technical Paper 1711). Moffett Field, CA: NASA Ames Research Center.
Larish, I. & Wickens, C.D. (1991). Divided attention with superimposed and separated imagery: Implications for head-up displays (Technical Report 91-4/ NASA HUD 91-1). Savoy, IL: University of Illinois, Aviation Research Laboratory.
Martens, M. & Wickens, C.D. (1995). Low-lighting solutions to display clutter (ARL-95-1 0/NASA-95-4). Savoy, IL: University of Illinois, Aviation Research Laboratory.
Martin-Emerson, R. & Wickens, C.D. (1993). Conformal symbology and the head-up display (ARL-9 3-6/ NASA-HUD-93-1). Savoy, IL: Universityoflllinois, Aviation Research Laboratory.
May, P., & Wickens, C.D. (1995). The role of visual attention in head-up displays: Design implications for varying symbology intensity (ARL-95-3/NASAHUD-95-1). Savoy, IL: University of Illinois, Aviation Research Laboratory.
McCann, R.S., & Foyle, D.C. (1996). Scene-linked symbology to improve situation awareness. AGARD Conference Proceedings 575: Situation awareness: Limitations and enhancement in the aviation environment (pp. 16.1-16.11). Brussels, Belgium.
15
McCann, R.S., Foyle, D.C. & Johnston, ].C. (1993). Attentional limitations with head-up displays. Proceedings of the 7th International Symposium on Aviation Psychology, pp. 70-5. Columbus, OH: The Ohio State University.
Roscoe, S.N. (1987). The trouble with HUDs and HMDs. Human Factors Bulletin, 30(7), 1-2.
Schons, V.W., &Wickens, C.D. (1993). Visualseparation and information access in aircraft display layout (Technical Report ARL-93-7/NASA-AI-93-1). Savoy, IL: University of Illinois, Aviation Research Laboratory.
Synder, H.L. & Dye, C.J. (1991). Effects of display failures, polarity, and clutter on visual search with cartographic images. Society for Information Display International Symposium Digest of Technical Papers, XXII, pp. 91-4.
Teichner, W.H. & Mocharnuk, J.B. (1979). Visual search for complex targets. Human Factors, 21, 259-76.
Treisman, A. & Gelade, G. (1980). A feature integration theory of attention. Cognitive Psychology, 12, 97-136.
Ward, N.J., Parkes, A. &Lindsay, P. (1995). The effect of automotive head-up displays on attention to critical events in traffic. International Conference on Experimental Analysis and Measurement of Situation Awareness. Daytona, FL.
Weintraub, D.J. & Ensing, M. (1992). Humanfoctors issues in head-up display design: The book ofHUD (State-of-the-Art Report). Wright-PattersonAFB, Dayton, OH: Crew System Ergonomics Information Analysis Center.
Weintraub, D.J., Haines, R.F., & Randle, R.J. (1985). Head-up display (HUD) utility, II: Runway to HUD transitions monitoring eye focus and decision times. Proceedings of the 29th Annual Meeting of the Human Factors Society. Santa Monica, CA: Human Factors Society, 615-19.
Wickens, C.D. & Long, J. (1995). Object vs. spacebased models of visual attention: Implication for the design of head-up displays. Journal of Experimental Psychology: Applied, 1 (3), 179-94.
*U.S. GOVERNMENT PRINTING OFFICE: 1998 • 760-082180019