Allianz Group Fiscal Year 2015 - Zonebourse.com SE...SII capitalization1 2(EUR bn) Estimation of...
33
Allianz Group Fiscal Year 2015 Annual results media conference February 19, 2016 Dieter Wemmer Chief Financial Officer Based on preliminary figures
Transcript of Allianz Group Fiscal Year 2015 - Zonebourse.com SE...SII capitalization1 2(EUR bn) Estimation of...

Allianz Group
Fiscal Year 2015
Annual results media conference
February 19, 2016
Dieter Wemmer
Chief Financial Officer
Based on
preliminary figures
©
Alli
anz S
E 2
016
1 Allianz Group
Fiscal Year
2015
2
1 Highlights
2 Glossary

©
Alli
anz S
E 2
016
3
Allianz Group – Fiscal Year 2015 – Group
Business highlights
Executive pay and
promotion linked to
people factors like
customer satisfaction,
collaboration and other
leadership behaviors
starting in 2016
Inclusive Meritocracy
Allianz to establish a
nationwide digital insurance
company in China with
internet company Baidu
Allianz Global Investors to
acquire global fixed
income manager Rogge
Global Partners
Growth Engines
Allianz UK claims adjusters arrive
on site before storm Desmond hit in
December, allowing the team to assist
95 percent of customers within two hours
of making a claim
Allianz ranks as only insurance brand
in Top 50 of Brand Finance Global 500
Ranking 2016
True
Customer Centricity
Digital by Default
New role of Chief Digital Officer
established to foster digital trans-
formation within Allianz Group
Allianz1 Business, the extension of
Allianz Italy’s digital modular offer to
small companies, has sold over 9,000
policies since launch in November 2015
All 8,300 Allianz Germany agents are
able to offer their customers advice via
online-video chat since mid-2015
Technical Excellence
Allianz Germany’s motor retail
insurance business is first to be
certified according to a new global
standard for technical price calculation,
allowing for more transparent and
risk-adequate pricing
Alternative investment portfolio expands
to include two onshore wind parks in
New Mexico, USA

©
Alli
anz S
E 2
016
2014 2015
2014 2015
Total revenues (EUR bn)
Net income2 (EUR mn)
Operating profit drivers (EUR mn)
122.3 125.2
+2.4%1
6,221 6,616
+6.3%
Revenues and profits continue to grow …
4
2015 5,603 3,796 2,297 -945 -16
2014 5,382 3,327 2,603 -820 -91
P/C
10,402
10,735
+3.2%
Operating
profit
2014
Operating
profit
2015
L/H AM CO Conso.
+221
+468
-306 -124
+74
1) Internal growth of -2.1%, adjusted for F/X and consolidation effects
2) Net income attributable to shareholders
Δ 2015/14
Allianz Group – Fiscal Year 2015 – Group

©
Alli
anz S
E 2
016
… driven by strong 4Q 2015
5
Group
Shareholders’
net income
(EUR mn)
Group
Operating profit
(EUR mn)
Group
Total revenues
(EUR bn)
2014
4Q
2015
4Q
P/C1
(EUR mn)
L/H1
(EUR mn)
AM
(EUR mn)
2014
4Q
2015
4Q
1,101
673
+63.7%
637 588
+8.2%
2.5% 2.8% NBM
-141.3 -8.0 3rd party net flows3
(EUR bn)
1,221 1,125
+8.6%
CR 1.5%
4.2%
2.1%
5.6%
NatCat impact2
Run-off ratio 96.5% 96.2%
30.1 29.7
-1.1%
1,220 1,418
+16.2%
2,258 2,586
+14.5%
1) In 4Q 14 the French International Health business was reclassified from L/H France to Allianz Worldwide Partners (P/C) effective 1 January 2014
2) NatCat costs (without reinstatement premiums and run-off)
3) Effective 2015, 3rd party net flows contain re-invested dividends (incl. capital gains) from existing clients (EUR +9.9bn for 4Q 15).
Those have been recognized as market return until 31.12.2014
Allianz Group – Fiscal Year 2015 – Group

©
Alli
anz S
E 2
016
Shareholders’ equity1 (EUR bn) Return on equity3 (in %)
Dividend up 6.6%
2014 2015
-0.4%-p
12.5 13.0
2014 2015
Dividend per share (EUR)
+6.6%
7.304 6.85
Payout
ratio 50% 50%
Estimation of stress impact (EUR bn)
Equity markets -30%
Interest rate -50bps
Credit spread +100bps
on government bonds
Credit spread +100bps
on other bonds
Interest rate +50bps
Unrealized
gains/losses
Retained
earnings2
Paid in
capital
31.12.14 30.09.15 31.12.15
+3.9%
61.3 60.7 63.1
1) Excluding non-controlling interests
2) Including F/X 3) RoE excluding unrealized gains/losses on bonds net of shadow DAC
4) Proposal
6
28.9 28.9 28.9
23.3 21.1 17.9
10.9 11.2 13.9
-3.0
-3.3
+3.1
-3.9
-4.3
Allianz Group – Fiscal Year 2015 – Group

©
Alli
anz S
E 2
016
7
Strong SII capitalization
SII capitalization1 (EUR bn) Estimation of stress impact2
2014 2015
Eligible Own Funds
Solvency capital requirement (confidence level 99.5%)
Solvency II capitalization ratio (confidence level 99.5%)
66.0
34.6
72.7
36.4
+9%-p
191% 200%
1) AZ Life included in the SII capital requirement based on third country
equivalence with 100% of RBC CAL in 2014 and with 150% of
RBC CAL in 2015
2) Second order effects to other risk types and to own funds transferability
restrictions are not considered
2014 2015
Equity markets +30% +9%-p +9%-p
Equity markets -30% -12%-p -9%-p
Interest rate +50bps
SII non-parallel +15%-p +9%-p
Interest rate -50bps
SII non-parallel -21%-p -14%-p
Credit spread +100bps
on government bonds -17%p -11%-p
Credit spread +100bps
on other bonds -13%-p -8%-p
Allianz Group – Fiscal Year 2015 – Group

©
Alli
anz S
E 2
016
8
2015 Revenues Total
growth
Δ p.y.
Internal
growth
Δ p.y.
Price
effect
Volume
effect
Total P/C segment 51,597 +6.8% +2.9% +0.8% +2.1%
Large OEs Germany 9,629 +1.0% +1.0%
Italy 4,755 +13.3% -1.6%
France 4,330 +1.9% +1.8%
Global lines
AGCS1 8,107 +50.4% +1.0%
Allianz Worldwide Partners 3,975 +19.0% +10.8%
Credit Insurance 2,241 +3.8% -0.1%
Selected OEs
United Kingdom 3,055 +13.8% +2.6%
Australia 2,991 +8.3% +4.9%
Spain 2,138 +6.1% +6.1%
Latin America 2,086 -0.7% +8.0%
1) Effective 1 January 2015, FFIC was integrated into AGCS Group. Previous period figures were not adjusted. The results from the run-off portfolio included
in San Francisco Reinsurance Company Corp., a former subsidiary of FFIC, have been reported within Reinsurance PC since 1 January 2015
Internal growth strong at 2.9% (EUR mn)
Allianz Group – Fiscal Year 2015 – Property-Casualty

©
Alli
anz S
E 2
016
2014 2015
2014 2015
Underwriting and investment results up
9
1) Including policyholder participation
2) NatCat costs (without reinstatement premiums and run-off): EUR 400mn (2014) and EUR 738mn (2015)
3) Positive run-off, run-off ratio calculated as run-off result in percent of net premiums earned
Combined ratio (in %)
94.6 94.3
Run-off ratio3 (in %)
66.0
28.3
4.1 3.2
5,382
66.2
28.4
0.9 1.6
Operating profit drivers (EUR mn)
+30 +54 5,603 +137
2015 2,281 3,120 202
2014 2,251 3,066 66
Operating
profit
2015
Other Operating
profit
2014
Investment1 Underwriting
Δ 2015/14
+4.1%
+0.3%-p
+1.0%-p
Loss ratio
Expense ratio
NatCat impact2 (in %-p)
Allianz Group – Fiscal Year 2015 – Property-Casualty

©
Alli
anz S
E 2
016
10
2015 Operating
profit Δ p.y.
Combined
ratio
Δ p.y.
NatCat
impact
in CR1
Δ p.y.1
Total P/C segment 5,603 +4.1% 94.6% +0.3%-p 1.6%-p +0.7%-p
Large OEs Germany 1,216 -6.7% 91.9% +0.3%-p 2.5%-p +1.5%-p
Italy 1,075 +15.4% 83.1% +0.6%-p 0.0%-p 0.0%-p
France 465 +8.6% 95.9% -0.4%-p 1.0%-p -1.1%-p
Global lines
AGCS2 423 -24.5% 102.9% +9.8%-p 3.1%-p +2.8%-p
Allianz Worldwide Partners 128 +21.7% 97.4% +0.8%-p 0.0%-p 0.0%-p
Credit Insurance 400 -0.4% 83.2% +4.6%-p – –
Selected OEs
United Kingdom 56 -68.4% 102.6% +5.0%-p 4.6%-p +3.6%-p
Australia 307 -13.1% 96.2% +1.6%-p 3.0%-p +1.8%-p
Spain 208 -18.6% 92.7% +2.8%-p 0.0%-p 0.0%-p
Latin America -154 n.m.3 116.6% +0.5%-p 0.0%-p 0.0%-p
Italy and France drive OP growth (EUR mn)
1) Excluding reinstatement premiums and run-off
2) Effective 1 January 2015, FFIC was integrated into AGCS Group. Previous period figures were not adjusted. The results from the run-off portfolio included
in San Francisco Reinsurance Company Corp., a former subsidiary of FFIC, have been reported within Reinsurance PC since 1 January 2015
3) Operating profit for Latin America decreased by EUR 6mn from EUR -147mn in 2014
Allianz Group – Fiscal Year 2015 – Property-Casualty

©
Alli
anz S
E 2
016
2015
2014
2014 2015
11
Operating investment result1 (EUR mn)
Interest &
similar income3 3,525 3,529
Net harvesting
and other4 -136 -73
Investment
expenses -323 -337
3,120 3,066
+1.8%
Current yield (debt securities; in %)
3.2
2.9
Reinvestment yield5 (debt securities; in %)
Liabilities
Assets
2015
2014 2.4
2.2
5) On an annual basis
6) For the duration calculation a non-parallel shift in line with Solvency II yield
curves is used. Data excludes internal pensions residing in the P/C segment
1) Including policyholder participation
2) Asset base includes health business France, fair value option and trading
3) Net of interest expenses
4) Comprises real. gains/losses, impairments (net), fair value option, trading
and F/X gains and losses and policyholder participation
Total average
asset base2
(EUR bn) 109.7 105.2
Investment result slightly up
2015
2014
3.8
4.8
3.9
5.0
Duration6
Allianz Group – Fiscal Year 2015 – Property-Casualty

©
Alli
anz S
E 2
016
Shifting away from capital intensive products (EUR mn)
12
2015 Revenues Total
growth
Δ p.y.
Internal
growth
Δ p.y.
PVNBP Δ p.y.1
Total L/H segment 66,903 -0.6% -4.9% 56,323 -1.5%
Large OEs Germany Life 17,742 -6.7% -6.7% 14,376 -3.2%
Italy 11,936 +5.3% +5.3% 9,538 -10.3%
USA 10,475 -11.5% -26.1% 10,417 -13.1%
France 8,053 -2.3% -2.3% 7,269 -2.5%
Selected OEs Asia Pacific 6,769 +18.1% +5.8% 6,059 +17.8%
Germany Health 3,257 +0.4% +0.4% 1,287 +32.8%
Benelux2 2,239 -11.1% -11.1% 1,575 +25.2%
Switzerland 1,842 +11.3% -2.3% 1,537 +31.0%
Spain 1,375 +9.2% +9.2% 1,709 +44.5%
Central and Eastern Europe 818 -4.6% -4.7% 630 -13.4%
1) New business figures were restated by the impact of contract boundaries, removal of holding expenses and the replacement of CNHR and CReC
by RM after tax to be aligned with SII balance sheet
2) Revenues from investment-oriented products in Luxembourg of EUR 389mn in 2015 (EUR 842mn in 2014) are reinsured by France.
The PVNBP of Luxembourg business reinsured with France is included in France (EUR 339mn) and not included in Benelux
Allianz Group – Fiscal Year 2015 – Life/Health

©
Alli
anz S
E 2
016
2014 2015
Operating profit by source1,2 Operating profit by line2
Operating profit up 14% (EUR mn)
13 1) For a description of the L/H operating profit sources please refer to the glossary
2) Prior year figures changed in order to reflect the roll out of profit source reporting to Malaysia
2015 5,667 3,915 -6,610 1,156 -332
2014 5,285 2,973 -6,522 1,203 388
Δ 2015/14
Operating
profit
2014
Operating
profit
2015
Loadings
& fees
Investment
margin
Expenses Technical
margin
Impact of
change
in DAC
3,796
3,327
+381
+942
-87 -47
-721
Protection & health
Guaranteed savings & annuities
Unit-linked w/o guarantees
+14.1% +14.1%
3,796
3,327
2,369
661
298
373
577
2,846
Allianz Group – Fiscal Year 2015 – Life/Health

©
Alli
anz S
E 2
016
NBM with significant improvement in 2H 2015 (EUR mn)
14
2015 VNB Δ p.y.1 NBM Δ p.y.1 Operating
profit Δ p.y.
Total L/H segment 1,196 -18.5% 2.1% -0.4%-p 3,796 +14.1%
Large OEs Germany Life 304 -16.8% 2.1% -0.3%-p 1,257 +16.4%
Italy 111 -32.2% 1.2% -0.4%-p 268 +55.3%
USA 318 -30.6% 3.1% -0.8%-p 841 +28.3%
France 35 -36.8% 0.5% -0.3%-p 550 +20.9%
Selected OEs Asia Pacific 194 +18.7% 3.2% 0.0%-p -83 n.m.2
Germany Health 28 -9.7% 2.2% -1.0%-p 214 +2.4%
Benelux 7 -79.6% 0.5% -2.4%-p 121 -8.5%
Switzerland 26 -19.2% 1.7% -1.0%-p 75 -9.7%
Spain 41 -10.6% 2.4% -1.5%-p 196 +2.9%
Central and Eastern Europe 32 +0.5% 5.1% +0.7%-p 129 +8.8%
1) New business figures were restated by the impact of contract boundaries, removal of holding expenses and the replacement of CNHR and CReC
by RM after tax to be aligned with SII balance sheet
2) Operating profit for Asia Pacific decreased by EUR 187mn from EUR 104mn in 2014
Allianz Group – Fiscal Year 2015 – Life/Health
©
Alli
anz S
E 2
016
2014 2015
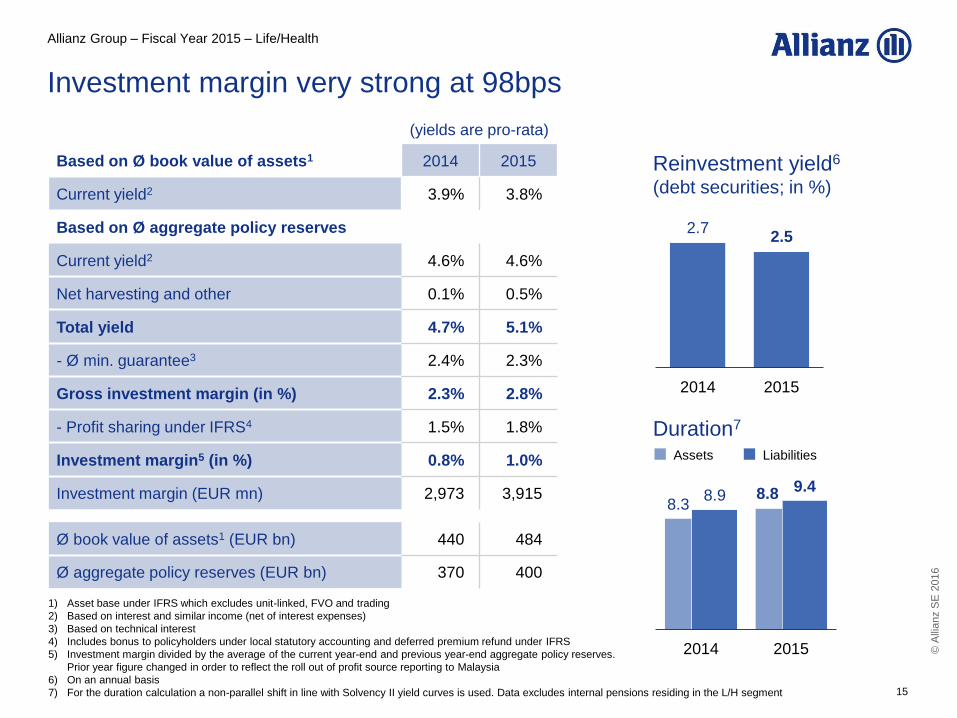
Investment margin very strong at 98bps
15
Based on Ø book value of assets1 2014 2015
Current yield2 3.9% 3.8%
Based on Ø aggregate policy reserves
Current yield2 4.6% 4.6%
Net harvesting and other 0.1% 0.5%
Total yield 4.7% 5.1%
- Ø min. guarantee3 2.4% 2.3%
Gross investment margin (in %) 2.3% 2.8%
- Profit sharing under IFRS4 1.5% 1.8%
Investment margin5 (in %) 0.8% 1.0%
Investment margin (EUR mn) 2,973 3,915
Ø book value of assets1 (EUR bn) 440 484
Ø aggregate policy reserves (EUR bn) 370 400
Reinvestment yield6 (debt securities; in %)
2.5 2.7
1) Asset base under IFRS which excludes unit-linked, FVO and trading
2) Based on interest and similar income (net of interest expenses)
3) Based on technical interest
4) Includes bonus to policyholders under local statutory accounting and deferred premium refund under IFRS
5) Investment margin divided by the average of the current year-end and previous year-end aggregate policy reserves.
Prior year figure changed in order to reflect the roll out of profit source reporting to Malaysia
6) On an annual basis
7) For the duration calculation a non-parallel shift in line with Solvency II yield curves is used. Data excludes internal pensions residing in the L/H segment
(yields are pro-rata)
Duration7
Liabilities Assets
2014 2015
9.4 8.9 8.8
8.3
Allianz Group – Fiscal Year 2015 – Life/Health

©
Alli
anz S
E 2
016
31.12.14 30.09.15 31.12.15
1,276
487
1,763
1,313
488
1,801
EUR bn +17.5 -125.0 -36.9 +116.2 -8.9
∆ total AuM
31.12.14 31.12.15 F/X
impact
Market &
dividends PIMCO AllianzGI
Other
-2.8%
-9.5%
+1.3%
-2.8%
+8.9%
-0.7%
Net flows1
1,259
488
-2.1%
1) Effective 2015, 3rd party net flows contain re-invested dividends (incl. capital gains) from existing clients (EUR +16.6bn for PIMCO and EUR +1.8bn for AllianzGI in 2015).
Those have been recognized as market return until 31.12.2014
1,313 1,276
1,746
+0.9%
∆ 3rd party AuM -2.8%
+1.4%
Allianz Group
assets
3rd party AuM
USD largely compensates for net outflows (EUR bn)
16
Allianz Group – Fiscal Year 2015 – Asset Management

©
Alli
anz S
E 2
016
2014 2015
2014 2015
17
3rd party AuM
margin2 (in bps)
+1.4%
56.5 53.8
PIMCO3
4,921 4,714
-4.2%
205 464
70
1,388 1,624
Other net fee and
commission income
(AuM driven fees)
Performance fees
Revenues development1 Internal growth
-11.4%
Internal growth
+12.5%
2014 2015
43.9 42.6
5,881 AllianzGI4
1,482 1,782
142
+20.2%
6,105
41.2 39.5
4,717 4,256
607 275
6,479 6,388
1) “Other” AM revenues of EUR 8mn (2014) and EUR -8mn (2015) are not shown in the chart
2) Excluding performance fees and other income, 12 months
3) “Other” PIMCO revenues of EUR -1mn (2014) and EUR -6mn (2015) are not shown in the chart
4) “Other” AllianzGI revenues of EUR 24mn (2014) and EUR 16mn (2015) are not shown in the chart
Internal growth
-19.2%
Strong performance drives fees (EUR mn)
Allianz Group – Fiscal Year 2015 – Asset Management

©
Alli
anz S
E 2
016
18
Internal growth
-23.5%
F/X impact +774 +79 +9 -344 -211 0 CIR
2015 5,8812 607 -8 -2,556 -1,585 -41 64.5%
2014 6,1052 275 8 -2,372 -1,415 3 59.2%
Operating
profit
2015 Performance
fees
Operating
profit
2014 Margin2 Volume2
Operating profit drivers (EUR mn)
2,2971
Other
PIMCO
AllianzGI
2,241
1,824
535
-11.8%
70.0%
61.3%
54.5%
72.5%
Revenues Expenses
Personnel
Non-
personnel
CIR
F/X
effect
-860 -138
+160 +253
-25
+307
2,6031
364
2,740
1) Including operating loss from other entities of EUR -46mn in 2014 and EUR -62mn in 2015
2) Calculation based on currency adjusted average Allianz AuM / Allianz AuM driven margins and
based on currency adjusted average third party AuM / third party AuM driven margins
PIMCO
AllianzGI 408
+41
Re-
structuring
-44
Operating profit in line with expectations
Allianz Group – Fiscal Year 2015 – Asset Management

©
Alli
anz S
E 2
016
Operating result at target (EUR mn)
19
Operating loss development and components
-820
-159
+28 +7
Operating
result
2015
Alternative
Investments
Consoli-
dation
Operating
result
2014
Banking Holding &
Treasury
-945
Δ 2015/14
2015 -1,076 94 37 0
2014 -917 66 30 0
-15.1%
0
Allianz Group – Fiscal Year 2015 – Corporate and Other

©
Alli
anz S
E 2
016
Shareholders’ net income up 6.3 percent (EUR mn)
20
2014 2015 Change
Operating profit 10,402 10,735 +333
Non-operating items -1,554 -539 +1,015
Realized gains/losses (net) 812 1,211 +399
Impairments (net) -197 -268 -72
Income from fin. assets and liabilities carried at fair value (net) -303 -219 +84
Interest expenses from external debt -846 -849 -3
Fully consolidated private equity inv. (net) -23 -60 -37
Acquisition-related expenses 7 12 +4
Amortization of intangible assets -104 -304 -199
Reclassification of tax benefits -901 -62 +839
Income before taxes 8,848 10,196 +1,348
Income taxes -2,245 -3,209 -964
Net income 6,603 6,987 +384
Non-controlling interests 381 371 -10
Shareholders’ net income 6,221 6,616 +394
Effective tax rate 32%1 31% -1%-p
1) Calculated shareholders’ effective tax rate based on income taxes w/o tax benefits for prior years allocated to
policyholders resulting from favorable Federal Fiscal Court decision
Allianz Group – Fiscal Year 2015 – Group

©
Alli
anz S
E 2
016
21
Status quo 2015 and ambitions for 2018
RoE Allianz Group
3-year EPS CAGR
P/C CR
L/H NBM
L/H OEs with
RoE ≥10%
PIMCO CIR
SII interest rate
sensitivity
Businesses with
NPS above market
IMIX
Share of new digital
retail products (P/C)
2018
5%
13%
94%
100%
3.0%
2015
8.0%
12.5%
94.6%
65%
2.1%
2018
75%
< 11%-p
60%
72%
~100%
2015
50%
14%-p
61.3%
68%
< 10%
Allianz Group – Fiscal Year 2015 – Group

©
Alli
anz S
E 2
016
Financial reporting from 1Q 2016 onwards
22
1Q 2Q 3Q 4Q
Earnings release
incl. financial supplement
Analyst Presentation
Interim / Annual Report
Following the change in the EU Transparency Directive,
Allianz adjusts its reporting
Allianz Group – Fiscal Year 2015 – Group

©
Alli
anz S
E 2
016
2 Allianz Group
Fiscal Year
2015
23
1 Highlights
2 Glossary

©
Alli
anz S
E 2
016
Glossary (1)
24
AAM Allianz Asset Management, mainly the holding company of PIMCO and AllianzGI
ABS Asset-backed securities: Structured bonds or notes collateralized by a pool of assets such as loans,
bonds or mortgages. As characteristics of the collaterals vary considerably (with regard to asset class,
quality, maturity, etc.), so do asset-backed securities.
AFS Available-for-sale: Securities which have been acquired neither for sale in the near term nor to be
held to maturity. Available-for-sale investments are shown at fair value on the balance sheet.
AGCS Allianz Global Corporate & Specialty
AllianzGI Allianz Global Investors
AM Asset Management – AM segment
APR (accident insurance with
premium refund)
Special form of accident insurance (in German: “Unfallversicherung mit garantierter Beitrags-
rückzahlung” (UBR)) where the policyholder, in addition to insurance coverage for accidents
(accident insurance), has a guaranteed claim to refund from premiums on the agreed
maturity date or in the event of death (endowment insurance).
AuM Assets under management are assets or securities portfolios, valued at current market value,
for which Allianz Asset Management companies provide discretionary investment management
decisions and have the portfolio management responsibility. They are managed on behalf of
third parties as well as on behalf of the Allianz Group.
Net flows: Net flows represent the sum of new client assets, additional contributions from
existing clients, including dividend reinvestment, withdrawals of assets from, and termination of,
client accounts and distributions to investors.
Market and dividends: Market and dividends represents current income earned on, and changes in
fair value of, securities held in client accounts. It also includes dividends from net investment income
and from net realized capital gains to investors of open ended mutual funds and of closed end funds.

©
Alli
anz S
E 2
016
Glossary (2)
25
AuM splits by
asset classes
Multi-assets: A combination of several asset classes (e.g. bonds, stocks, cash and real property)
used as an investment. Multi-assets class investments increase the diversification of an
overall portfolio by distributing investments throughout several asset classes.
Other: Composed of other asset classes than equity, fixed income and multi-assets,
e.g. money markets, commodities, real estate investment trusts, infrastructure investments,
private equity investments, hedge funds.
AuM splits by
investment vehicle
Mutual funds: Investment vehicles (in the US, investment companies, subject to the US code; in
Germany, vehicles subject to the “Standard-Anlagerichtlinien des Fonds” Investmentgesetz) where
the money of several individual investors is pooled into one account to be managed by the asset
manager, e.g. open-end funds, closed-end funds.
Separate accounts: Investment vehicles where the money of a single investor is directly managed
by the asset manager in a separate dedicated account (e.g. public or private institutions,
high net worth individuals, corporates)
Bps Basis point = 0.01%
Businesses for NPS Operating entities at segment level (Life, Health, P/C), unweighted, excluding Global Lines, Russia and
USA P/C for monoliners second level segment considered (e.g. UK personal, commercial)
CEE Central and Eastern Europe. From 3Q 15 onwards CEE is reported excluding Russia and Ukraine.
CNHR Cost of residual non-hedgeable risk: The allowance made in the MCEV for non-hedgeable risks.
This allowance should include the impact of non-hedgeable non-financial risks and non-hedgeable
financial risks.
CO Corporate and Other
Combined ratio (CR) Represents the total of acquisition and administrative expenses (net), excluding one-off effect from
pension revaluation, and claims and insurance benefits incurred (net) divided by premiums earned (net).
Cost-income ratio (CIR) Operating expenses divided by operating revenues
Covered bonds
Debt securities covered by a pool of mortgage loans or by public-sector loans with investors having a
preferential claim in case of a default
CReC Frictional cost of required capital: The allowance made in the MCEV for the frictional costs of required
capital. Frictional costs should reflect the taxation and investment costs on the assets backing required
capital. Further, frictional costs may be due to any sharing of investment income on required capital
with policyholders.

©
Alli
anz S
E 2
016
Glossary (3)
26
Current yield Represents interest and similar income divided by average asset base at book value (excluding
income from financial assets and liabilities carried at fair value); current yield on debt securities
adjusted for interest expenses; yield on debt securities including cash components.
DAC Deferred acquisition costs: Expenses of an insurance company which are incurred in connection with
the acquisition of new insurance policies or the renewal of existing policies. These typically include
commissions paid and the costs of processing proposals.
Earnings per share (EPS) Ratio calculated by dividing the net income for the year attributable to shareholders by the weighted
average number of shares outstanding (basic EPS). In order to calculate diluted earnings per share, the
number of common shares outstanding and the net income for the year attributable to shareholders are
adjusted by the effects of potentially dilutive common shares which could still be exercised. Potentially
dilutive common shares arise in connection with share-based compensation plans (diluted EPS).
EIOPA European Insurance and Occupational Pensions Authority
Expense ratio (ER) Acquisition and administrative expenses (net) divided by premiums earned (net)
F/X Foreign exchange
Fair value (FV) The price that would be received to sell an asset or paid to transfer a liability in an orderly transaction
between market participants at the measurement date.
FCD Financial conglomerates directive: European regulation for the supervision of financial conglomerates
and financial groups involved in cross-sectoral business operations.
Financial assets carried at
fair value through income
Financial assets carried at fair value through income include financial assets held for trading and
financial assets designated at fair value through income.
Financial liabilities carried at
fair value through income
Financial liabilities carried at fair value through income include financial liabilities held for trading and
financial liabilities designated at fair value through income.
Fixed index annuity (FIA) Annuity contract whereby the policyholder is credited based on movements in stated equity or bond
market indices with protection of principal

©
Alli
anz S
E 2
016
FVO Fair value option: Financial assets and liabilities designated at fair value through income are measured
at fair value with changes in fair value recorded in the consolidated income statement. The recognized
net gains and losses include dividends and interest of the financial instruments. A financial instrument
may only be designated at inception as held at fair value through income and cannot be subsequently
changed.
Goodwill Difference between the cost of acquisition and the fair value of the net assets acquired
Government bonds Government bonds include government and government agency bonds.
Gross/Net In insurance terminology the terms “gross” and “net” mean before and after consideration of
reinsurance ceded, respectively. In investment terminology the term “net” is used where the relevant
expenses (e.g. depreciations and losses on the disposal of assets) have already been deducted.
Harvesting rate (Realized gains and losses (net) + impairments on investments (net))/ average investments and loans
at book value (excluding income from financial assets/ liabilities carried at fair value)
IFRS International Financial Reporting Standards: Since 2002, the designation of IFRS applies to the overall
framework of all standards approved by the International Accounting Standards Board. Standards
already approved before will continue to be cited as International Accounting Standards (IAS).
Inclusive Meritocracy Index (IMIX) The Inclusive Meritocracy Index (IMIX) measures the progress of the organization on its way towards
Inclusive Meritocracy. The internal index is subsuming 10 Allianz Engagement Survey (AES) items
around leadership, performance and corporate culture
Internal growth Enhances the understanding of our total revenue performance by excluding the effects of foreign
currency translation as well as of acquisitions and disposals
IRR Internal rate of return: The discount rate which gives a zero value of new business under real-world
projections after allowing for any acquisition expense overrun or underrun
L/H Life and health insurance
Glossary (4)
27

©
Alli
anz S
E 2
016
Glossary (5)
28
L/H lines of business Guaranteed savings & annuities: Guaranteed savings and annuities are life insurance obligations
that always relate to the length of human life. Life obligations may be related to guarantees offering life
and/or death coverage of the insured in the form of single or multiple payments to a beneficiary.
Protection & health: Protection and health insurance covers different risks which are linked to events
affecting the physical or mental integrity of a person.
Unit-linked without guarantees: Conventional unit-linked products are those where all of the benefits
provided by a contract are directly linked to the value of assets contained in an internal or external fund
held by the insurance undertakings. Performance is linked to a separate account and the investment risk
is borne by the policyholder rather than the insurer.
L/H operating profit sources The objective of the Life/Health operating profit sources analysis is to explain movements in IFRS results
by analyzing underlying drivers of performance on a L/H segment consolidated basis.
Loadings & fees: Includes premium and reserve based fees, unit-linked management fees and
policyholder participation on expenses
Investment margin: Is defined as IFRS investment income net of expenses less interest credited
to IFRS reserves less policyholder participation
Expenses: Includes commissions, acquisition expenses and administration expenses
Technical margin: Comprises risk result (risk premiums less benefits in excess of reserves less
policyholder participation), lapse result (surrender charges and commission claw-backs)
and reinsurance result
Impact of change in DAC: Includes effects of change in DAC, URR and VOBA and is the net impact
of deferral and amortization of acquisition costs and front-end loadings on operating profit
Latin America South America and Mexico
Loss frequency Number of accident year claims reported divided by number of risks in-force
Loss ratio (LR) Claims and insurance benefits incurred (net) divided by premiums earned (net). Loss ratio calendar year
(c.y.) includes the results of the prior year reserve development in contrast to the loss ratio accident year
(a.y.).
Loss severity Average claim size (accident year gross claims reported divided by number of claims reported)
MBS Mortgage-backed securities: Securities backed by mortgage loans

©
Alli
anz S
E 2
016
Glossary (6)
29
MCEV Market consistent embedded value is a measure of the consolidated value of
shareholders’ interests in the covered business. It is defined as:
Net asset value (NAV)
‒ Present value of future profits (PVFP)
‒ Time value of options and guarantees (O&G)
‒ Cost of residual non-hedgeable risk (CNHR)
‒ Frictional cost of required capital (CReC)
MCEV on SII balance sheet Represents market consistent embedded value based on SII balance sheet
MoR Margin on reserves: Represents annualized operating profit (loss) divided by the average of (a) current
quarter-end and prior quarter-end net reserves and (b) current quarter-end and prior year-end net
reserves, where net reserves equal reserves for loss and loss adjustment expenses, reserves for
insurance and investment contracts and financial liabilities for unit-linked contracts less reinsurance
assets
NatCat Accumulation of claims that are all related to the same natural or weather/atmospheric event during
a certain period of time and where AZ Group's estimated gross loss exceeds EUR 20mn if one country
is affected (respectively EUR 50mn if more than one country is affected); or if event is of international
media interest
NAV Net asset value: Capital not backing local statutory liabilities, valued at market value
NBM New business margin: Value of new business divided by present value of new business premiums
Non-controlling interests Those parts of the equity of affiliates which are not owned by companies of the Allianz Group
NPE Net premiums earned
Net promoter score (NPS) A measurement of customers’ willingness to recommend Allianz. Top-down NPS is measured
regularly according to global cross industry standards and allows benchmarking against competitors
in the respective markets.
OAB Operating asset base: Represents all operating investment assets within the L/H segment.
This includes investments & loans, financial assets and liabilities carried at fair value as well
as unit-linked investments. Market value liability option is excluded.

©
Alli
anz S
E 2
016
Glossary (7)
30
OE Operating entity
Operating profit (OP) Earnings from ordinary activities before income taxes and non-controlling interests in earnings,
excluding, as applicable for each respective segment, all or some of the following items: Income
from financial assets and liabilities carried at fair value (net), realized gains/losses (net), impair-
ments on investments (net), interest expenses from external debt, amortization of intangible assets,
acquisition-related expenses and income from fully consolidated private equity investments (net)
as this represents income from industrial holdings outside the scope of operating business
P/C Property and casualty insurance
PHP Policyholder participation
PIMCO Pacific Investment Management Company Group
Premiums written/earned
(IFRS)
Premiums written represent all premium revenues in the year under review. Premiums earned
represent that part of the premiums written used to provide insurance coverage in that year.
In the case of life insurance products where the policyholder carries the investment risk (e.g
variable annuities), only that part of the premiums used to cover the risk insured and costs
involved is treated as premium income.
PVFP Present value of future profits: Future (statutory) shareholder profits after tax projected to
emerge from operations and assets backing liabilities, including value of unrealized gains
on assets backing policy reserves
PVNBP Present value of new business premiums: Present value of projected new regular premiums,
discounted with risk-free rates, plus the total amount of single premiums received
Reinsurance An insurance company transfers part of its insurance risk assumed to another insurance company.
Required capital The market value of assets attributed to the covered business over and above that required to
back liabilities for covered business whose distribution to shareholders is restricted
Retained earnings In addition to the reserve required by law in the financial statements of the Group parent company,
this item consists mainly of the undistributed profits of Group entities and amounts transferred from
consolidated net income.

©
Alli
anz S
E 2
016
Glossary (8)
31
Return on equity (RoE) RoE Group: Represents net income attributable to shareholders divided by the average shareholders’
equity excluding unrealized gains/losses on bonds (net of shadow DAC) at begin of the period and at
end of the period.
RoE L/H OE: Represents net income divided by the average total equity excluding unrealized
gains/losses on bonds (net of Shadow DAC) and excluding goodwill at begin of the period and
at end of the period.
RfB Reserves for premium refunds (in German: “Rückstellung für Beitragsrückerstattung”): That part of
the surplus which will be distributed to policyholders in the future. This refund of premiums is made
on the basis of statutory, contractual, or company by-law obligations, or voluntary undertaking.
Risk capital Minimum capital required to ensure solvency over the course of one year with a certain probability
which is also linked to our rating ambition
RM Risk margin: A component of the technical provisions (TP) under Solvency II and represents the
additional amount on top of the fair value of liabilities (best estimate liabilities) that insurance and
reinsurance obligations are expected to require in order to take over and meet the insurance and
reinsurance obligations related to non-hedgeable risks.
Run-off ratio Run-off ratio is calculated as run-off result (result from reserve releases in P/C business)
in percent of net premiums earned.
RWA Risk-weighted assets: All assets of a bank multiplied by the respective risk-weight according
to the degree of risk of each type of asset
SE Societas Europaea: European stock company
Solvency ratio Ratio indicating the capital adequacy of a company comparing eligible funds to required capital
Sovereign bonds Sovereign bonds include government and government agency bonds.
Statutory premiums Represent gross premiums written from sales of life insurance policies, as well as gross receipts
from sales of unit-linked and other investment-oriented products, in accordance with the statutory
accounting practices applicable in the insurer’s home jurisdiction
TIO Territory Insurance Office

©
Alli
anz S
E 2
016
Glossary (9)
32
Total equity Represents the sum of shareholders’ equity and non-controlling interests
Total revenues Represent the sum of P/C segment’s gross premiums written, L/H segment’s statutory premiums,
operating revenues in Asset Management and total revenues in Corporate and Other (Banking)
Unrealized gains and losses (net)
(as part of shareholders’ equity)
Include primarily unrealized gains and losses from available-for-sale investments net of tax and
policyholder participation
URR The unearned revenue reserve contains premium components that refer to future periods,
which are reserved and released over the lifetime of the corresponding contracts.
Variable annuity (VA) Annuity contract whose value fluctuates based on performance of an underlying investment
portfolio of funds; benefit payouts will vary based on account value of the contract.
VIF Value of in-force: Present value of future profits from in-force business (PVFP) minus the time value
of financial options and guarantees (O&G) granted to policyholders, minus the cost of residual
non-hedgeable risk (CNHR), minus the frictional cost of holding required capital (CReC)
VNB Value of new business: The additional value to shareholder created through the activity of writing
new business. It is defined as present value of future profits (PVFP) after acquisition expense overrun
or underrun, minus the time value of financial option and guarantees (O&G), minus the cost of residual
non-hedgeable risk (CNHR), minus the frictional cost of holding required capital (CReC), all determined
at issue date.
VOBA Value of the business acquired: It refers to the present value of future profits (PVFP) associated
with a block of business purchased.
3-year-outperformance AM Three-year rolling investment performance reflects the mandate-based and volume-weighted three-
year investment success of all third-party assets that are managed by AAM's portfolio-management
units. For separate accounts and mutual funds the investment success (valued on the basis of the
closing prices) is compared with the investment success prior to cost deduction of the respective
benchmark, based on various metrics. For some mutual funds, the investment success, reduced by
fees, is compared with the investment success of the median of the respective Morningstar peer group
(a position in the first and second quartile is equivalent to outperformance).

©
Alli
anz S
E 2
016
Disclaimer
33
These assessments are, as always, subject to the disclaimer provided below.
Forward-looking statements
The statements contained herein may include prospects, statements of
future expectations and other forward-looking statements that are based
on management's current views and assumptions and involve known and
unknown risks and uncertainties. Actual results, performance or events
may differ materially from those expressed or implied in such forward-
looking statements.
Such deviations may arise due to, without limitation, (i) changes of the
general economic conditions and competitive situation, particularly in the
Allianz Group's core business and core markets, (ii) performance of financial
markets (particularly market volatility, liquidity and credit events) (iii) frequen-
cy and severity of insured loss events, including from natural catastrophes,
and the development of loss expenses, (iv) mortality and morbidity levels and
trends, (v) persistency levels, (vi) particularly in the banking business, the
extent of credit defaults, (vii) interest rate levels, (viii) currency exchange
rates including the Euro/U.S. Dollar exchange rate, (ix) changes in laws and
regulations, including tax regulations, (x) the impact of acquisitions, including
related integration issues, and reorganization measures, and (xi) general
competitive factors, in each case on a local, regional, national and/or global
basis. Many of these factors may be more likely to occur, or more
pronounced, as a result of terrorist activities and their consequences.
No duty to update
The company assumes no obligation to update any information or forward-
looking statement contained herein, save for any information required
to be disclosed by law.