Monodisperse droplet heating and evaporation: Experimental ...

Spark Ignition of Monodisperse Fuel Sprays
Al len M. Danis
Submitted in part ia l fulfillment of the requirements f o r
the degree of
Doctor o f Philosophy
Approved by
Research Sponsored by the NASA Lewis Research Center Grant No. NAG 3-382 and by Drexel University
Department of Mechanical Engineering and Mechanics Drexel University, Philadelphia, PA 19104
September 1987
https://ntrs.nasa.gov/search.jsp?R=19870020202 2020-03-09T03:32:00+00:00Z

ABSTRACT
I
A study of spark IgnitlOn energy requirements was conducted with a
rnonodlsperse spray system allowing independent contro l of droplet size,
equlvalence ra t lo and fuel type. Minimum ignltion energies were measured
f o r n-heptane and methanol sprays characterlzed at the spark gap in te rms of
droplet diameter, equivalence ra t io (number density) and extent of
prevaporitat ion. The droplet diameter was var ied between 30 and 57 Mm,
and the equivalence rat ios ranged f r o m 0.45 to 1.8. The extent of
prevaporization of the sprays was held approximately constant f o r each fuel,
0.45 fo r n-heptane and 0.34 fo r methanol. Droplet Reynolds numbers of the
sprays ranged f rom 0.1 to 1 .O, and interdroplet spacings var ied between 15
and 30 droplet diameters. In addition to sprays, mlnimum ignition energies
were measured f o r completely prevaporized mixtures of the same fuels over
a range of equivalence rat ios t o provide data at the lower l im i t of droplet
size.
Results showed that spray Ignition was enhanced with decreasing droplet
size and increasing equivalence rat io over the ranges of these parameters
studled. No optimum equivalence r a t i o f o r Ignition was observed fo r sprays,
but an optimum dld occur a t 0 = 1.8 for prevaporized n-heptane ignltlon. A
corresponding optimum fo r prevaporized methanol could not be obtained due
t o excessive fuel condensation.
By comparing spray and prevaporlzed ignitlon resul ts, the existence of an
optimum droplet slze fo r ignition (below 30 u m ) was Indicated f o r both fuels.
This optimum was attr ibuted to the maximum f lame propagation rates

observed by previous researchers fo r sprays in this droplet size range (IO - 40 Mm), where both premixed and diffusive types of combustion occur
simultaneously. Extension of the lean ignition l im i ts was also observed f o r
sprays compared t o prevaporized mixtures. This extension occured f o r both
fuels over the range of droplet sizes studied, and was at t r ibuted to fuel
distribution effects (1. e. fuel r i c h regions surrounding evaporating
droplets). Both the optimum droplet size
ignitlon l im i t tndicate the importance of the
interdroplet spacing to spray ignition.
Fuel vo la t i l i t y was seen t o be a c r i t i c a
and the extension of the lean
gas-phase stoichiometry in the
factor in spray ignition. The
more vo lat i le n-heptane sprays required roughly one-fifth the ignition energy
required by methanol sprays of corresponding size and equivalence ratio.
For prevaporized ignition, however, activation energy was the important fuel
property. Prevaporlzed methanol, with i t s lower activation energy, required
roughly 50% less ignition energy than prevaporized n-heptane.
The spray ignition resul ts were analyzed using two di f ferent empir ical
ignition models fo r quiescent mixtures. Both models employed a
characterist ic t ime approach, relat ing the t ime required fo r fuel evaporation
in the spark kernel t o the quenching t ime of the kernel by thermal conduction
t o i t s surroundings. The major dif ference between the models was that while
the general ignition model developed by Bal la l and Lefebvre equated the two
times, the Characteristic Time Model of Peters and Mel lor stated that they
were only proport ional and determined the corre la t ion between them. Both
models accurately predicted the experimental Ignition energies f o r the
majority of the spray conditions. Their performance deteriorated f o r lean
equivalence rat ios (< 0.7) and smal ler droplet sizes (< 40 urn) however.
This was probably because the models did not account fo r the t ime required
(
I I
I 1
I
I
~
I
I
I
, I I
I I
,
I I
I I
I

fo r chemical reaction in the spark kernel, which becomes important fo r
leaner and smal ler droplet size sprays.
Spray ignition was observed to be probabilistic in nature, and ignition was
quantified in terms of an ignition frequency fo r a given spark energy. The
c r i te r ion f o r the minimum ignition energy was the spark energy which
produced an Ignition frequency of 50%. A model was developed to predict
Ignition frequencies based on the variat ion in spark energy and equivalence
ra t io (number density) in the spark gap. Random normal distributions of
these two parameters were generated with a Monte-Carlo routine and used in
conjunction with the Characteristic Time Model f o r ignition. The resul t ing
ignitlon frequency simulations were near ly identical t o the experimental ly
observed values, Indlcating that the probabll lst ic nature of spray ignition i s
the resu l t of variat ions in the energy levels of individual sparks and the
random distr ibution of droplets in a fuel spray.

SPARK IGNITION OF tlONODISPERSE FUEL SPRAYS
A Thesis
Submitted to the Facul ty
of
D r 8x8 1 University
bY
Al len M. Danis
in par t ia l fu l f i l lment of the
requirements fo r the degree
of
Doctor of Philosophy
September 1987
i

I ACKNOWLEDGEMENTS
I wish to thank my co-advisors, Professors Nicholas P. Cernansky and
Izak Namer, for the i r guidance, support and friendship throughout th is
project. Their posit ive att i tude and continued in terest influenced me
tremendously. Special thanks are also extended t o the members of my thesis
advisory committee, Professors David L. Mi l ler , Aur thur M. Mellor,
Bakhtier Farouk and Charles B. Weinberger, whose suggestions and
recomendatlons were v e r y much appreciated.
Financial support f o r the initial port ion of th is research by NASA Lewis
Research Center (Grant No. NAG 3-382) is g ra te fu l l y acknowledged. Sincere
thanks are also extended t o Mrs. Frederic 0. Hess f o r financial support
through the Hess Fellowship Program in 1984.
My colleagues and fr iends in the Combustion and Fuels Group at the
Freder ic 0. Hess Engineering Research Laboratory, Dr. Hamid Sarv, Dr.
Richard Wllk, Robert Tidona (Lab Supervisor) and Kevin Tallio, have been
extremely helpful and important to me. Special acknowledgement goes t o
Daniel Dietrich, whose discussions and assistance during the modeling
aspects of the program were invaluable.
I also wish t o thank my family, especial ly my father and my future
in-laws, f o r the i r continued support and encouragement throughout this
work.
Finally, and probably most importantly, i thank my future wife Paula fo r
giving me the motivation t o see this project through to I t s f ru i t ion.
ii

I F OF CONTENTS
LIST OF FIGURES .......................................... vi
LIST OF TABLES .......................................... x
NOMENCLATURE ........................................... x i
ABSTRACT ............................................... xiv
CHAPTER 1 INTRODUCTION . . . . . . . . . . . . . . . . . . . . . . . . . . . . . . . . . . l
CHAPTER 2 BACKGROUND AND LITERATURE REVIEW ............. . 4
2.1 Thermal Ignition Studies .................... 4
2.2 Flame Propagation and Transition Region Effects ................................... 6
2.3 Experimental Spark Ignition Studies .......... 8
Homogeneous Spark Ignition .......... 8 Heterogeneous Spark Ignition ......... 10
2.3.1 Spark Characterist ics and
2.3.2
2.3 Theoretical Spark Ignition Studies ........... 12
CHAPTER 3 EXPERIMENTAL FACILITIES AND METHODS ........... 15
3.1 Spray Generation .......................... 15 3.1.1 Monodisperse Spray Generation
System ............................ 15 3.1.2 Fuel and A i r Flow Systems ........... 17 3.1.3 Fuel Prevaporitat ion System ......... .21
3.2 Number Density Measurement ............... 23 3.2.1 LDVSystem . . . . . . . . . . . . . . . . . . . . . . . . . . 2 3 3.2.2 Spray Number Density
3.2.3 LDVProbeArea ..................... 31 3.2.4 Air and Droplet Velocity ............. .34
and Stoichiometry ................... 25

iv
I
3.3 Droplet Size Measurement .................. 39 3.3.1 Droplet Sizing System ................ 39 3.3.2 Extent of Qrevaporitation ............ 45
3.4 Spray Ignition ............................. 46 3.4.1 Spark Generation System ............. 46 3.4.2 Minimum Ignition Energy
Measurement ....................... 52 3.4.3 Spark Parameter Optimization ........ 54
CHAPTER 4 EXPERIMENTAL RESULTS AND DISCUSSION ............ 58
4.1 Spray Ignition ............................. 56 4.1.1 Operating Conditions ................. 56 4.1.2 Spark Duration and Gap Width ......... 61 4.1.3 Effect of Droplet Size
and Equivalence Ratio ................ 63 4.1.4 Effect of Fuel Propert ies ............. 66
4.2 Prevapor i ted Ignition ...................... 67 4.2.1 Operating Conditions ................. 67 4.2.2 Spark Duration and Gap Wldth ......... 69 4.2.3 Effect of Equivalence Ratio ........... 69 4.2.4 Effect of Fuel Propert ies ............. 73
4.3 Spray and Prevaporized Comparison .......... 75 4.3.1 Extension of Lean Ignition Limits ...... 75 4.3.2 Optimum Groplet Size f o r Igniti6n ..... 77
4.4 Summary of Experimental Results ........... 79
CHAPTER 5 ANALYTICAL SPARK IGNITION STUDIES .............. 81
5.1 Spark Ignition Model (Bal la l and Lefebvre) .... 81 5 . 1 . 1 Model Formulatlon .................. 82 5.1.2 Minimum Ignition Energy Predictions ... 85 5.1.3 Effect of Extent of Prevaporization .... 87
5.2 Characteristic Time Model f o r Ignition (Peters and Mel lor ) ....................... 88 5.2.1 Model Formulation .................. 88 5.2.2 Minimum Ignition Energy Predictions ... 94 5.2.3 Effect of Initial Versus Spark Gap .
Droplet Diameter .................... 94 5.2.4 Effect of Extent of Prevaporization .... 99
5.3 Ignition Frequency Model ................... 103

CHAPTER 6 CONCLUSIONS AND RECOMMENDAT IONS . . . . . . . . . . . . . . . 109
6.1 Conclusions ............................... 109
6.2 Recommendations for Future Work . . . . . . . . . . . 1 1 1
LIST OF REFERENCES ........................................ 113
APPENDIX A Comprehensive Spray Characterization and Ignitlon Results . . . . . . . . . . . . . . . . . . . . . . . . . . . t 19
APPENDIX B Computer Program for LDV Data Collection and Analysis ................................. 125
APPENDIX C APL Ignition Frequency Model Program . . . . . . . . . . . 128
VITA .................................................... 129

J IST OF FlGlJRFS
vi
3.1
3.2
3.3
3.4
3.5
3.6
3.7
3.8
3.9
3. to
3.11
Photograph of a Monodisperse N-Heptane Spray Enlarged 2OX (Do = 50 Mm; 0, = 0.55; z = 10 cm) .............. 16 Cross Section Vlew of the Monodisperse Spray Generator........ ........................................ 18
Schematlc Vlew of the lnter lor of the Spray Generator ......... 20
Schematic Drawing of the Fuel Prevaporizing and Mlxlng Apparatus ..................................... 22
Schernatlc Drawing of the LDV Spray Characterizatfon System .................................................. 24
Radfal Prof l les of Droplet Number Density and Equivalence Ratio fo r Methanol and N-Heptane Sprays (0, = 50 um; 0, = 0.51; z = IO cm) ......................... 27
Varlatlon of Spark Gap Equivalence Ratlo wlth Overall Equivalence Ratio for N-Heptane Sprays (Do = 50 um; z = IO cm; Spark Gap = 2 mm) .................. 28
Radlal Prof i les of Instantaneous Droplet Number Density and Droplet Number Denslty f o r a Methanol Spray (Do = 50 um; 0, = 0.42; z = IO cm) ......................... 30
Schematlc Dlagram of the Grid Measurement Pattern fo r Spray Characterizatlon and Probe Area Calibration Procedures .............................................. 32
Effect of Droplet Dlameter on the Effect lve Probe Area f o r N-Heptane and Methanol Sprays ............................. 33
Effect of Initial Droplet Diameter on Mean Droplet Velocity f o r Methanol Sprays of Varying Total A i r Flow Rates ( z = 10 cm) .............................................. 36

3.12
3.13
3.14
3.15
3.16
3.17
3.18
3.19
3.20
3.21
4 . 1
4.2
4.3
4 . 4
4.5
Paae Axial Prof i les of Mean Droplet Velocity f o r 17 and 70 u m Ini t ia l Droplet Diameter Methanol Sprays (00 = 1.27; r = 0 mm) .................................... .37
Radial Prof i les of Mean Droplet and A i r Velocity f o r Methanol Sprays of Varying In i t ia l Droplet Diameter (00 = 0.7; t = 10 cm) ..................................... 38
Schematic Drawing of the Droplet Sizing Apparatus ............ 40
Photograph of a Fraunhofer Diffract ion Pattern p roducedbya 5 0 p m Methanol Spray ........................ 41
Axial Variation in Droplet Diameter f o r 50 u m Initial Diameter N-heptane and Methanol Sprays (r = 0 mm) .......... 44
Ignition Electrode Tip Configuration ......................... 47
Schematic Diagram of the Spark Generation Circuit ............ 48
Typical Voltage, Current and Energy Traces of Ignition Sparks . .50 Effect of Spark Gap Width on Spark Energy f o r Varying Capacitor Values (Spark Duration = 60 us) ................... 51
Effect of Spark Energy on Ignition Frequency f o r an N-Heptane Spray (D = 53 pm; 0 = 0.78; t = 12.5 cm) .......... .53
Effect of Spark Gap Width and Spark Duration on the Minimum Ignitlon Energy of an N-Heptane Spray ( 0 = 41 um; 0 = 0.69; z = 10 em) .............. .:. .......... 62
Effect of Spark Energy and Equivalence Ratio on the Ignition Frequency of N-Heptane Sprays (D = 53 um; z = 12.5 cm) .................................. 64
Effect of Equivalence Ratio and Droplet Diameter on the Mlnlmum Ignltlon Energy of N-Heptane and Methanol Sprays ..... 65
Effect of Spark Energy and Equivalence Ratio on the Ignltlon Frequency of Prevaporized, Premlxed N-Heptane Under Fuel Lean Condltions .................................70
Effect of Spark Energy and Equlvalence Ratio on the Ignition Frequency of Prevaporized, Premixed N-Heptane Under Fuel Rich Conditions ................................. 71

viii
I
4.6
4.7
4.8
4.9
5.1
5.2
5.3
5.4
5 . 5
5.6
5.7
5.8
5.9
5.10
Effect of Spark Energy and Equivalence Ratio on the Ignition Frequency of Prevaporized, Premixed Methanol Under Fuel Lean Conditions ................................. 72
Effect of Equivalence Rat io on the Minimum Ignition Energy of Prevaporized, Premixed N-Heptane and Methanol ........... 74
Effect of Equivalence Ra t io and Droplet Diameter on the Minimum Ignition Energy of N-Heptane and Methanol Sprays and Prevaporized Mixtures.. ............................... 76
Effect of Droplet Diameter and Equivalence Ratio on the Minimum Ignition Energy of N-Heptane and Methanol Sprays .... 78
Minimum Ignition Energy Predictions of B a l l a l and Lefebvre's Ignition Model for N-Heptane and Methanol Sprays ... 86
Effect of Extent of Prevaporization on the Predicted Minimum Ignition Energies of B a l l a l and Lefebvre's Ignition Model f o r N-Heptane and Methanol Sprays (D = 41 and 44 um, respectively) .......................... .89
Characteristic Time Correlation fo r N-heptane and Methanol Sprays (using Ini t ia l Droplet Diameters) ......... 93
CTM Minimum Ignition Energy Predictions fo r N-Heptane and Methanol Sprays (using Ini t ia l Droplet Diameters) ........ .95
Characteristic Time Correlation fo r N-Heptane and Methanol Sprays (using Spark Gap Droplet Diameters). ........ 97
CTM MInimum Ignition Energy Predictions f o r N-Heptane and Methanol Sprays (using Spark Gap Droplet Diameters) ..... 98
Characteristic Time Correlation fo r N-Heptane and Methanol Sprays (using Spark Gap Droplet Diameters and Extent of Prevaporlzation) ............................. 100
CTM Minimum Ignition Energy Predictions fo r N-Heptane and Methanol Sprays (using Spark Gap Droplet Diameters and Extent of Prevaporization). ............................. 102
IFM Ignition Frequency Predictions f o r N-Heptane and Methanol Sprays (D = 4 1 ~ m , 0 = 0.88; D = 44um, 0 = 0.79) ............ 105
IFM Ignition Frequency Predictions fo r N-Heptane Sprays (D = 41pm; 0 = 1.42, 0.44) ......................... 106
PmgiL ~
5.11 Effect of Varying the Standard Deviation of Equivalence Ratio on IFM Ignition Frequency Predictions f o r an N-Heptane Spray(D = 41 um; 0 = 1.42) ................................ 108
~
~
A. 1 Radlal Prof i les of Local Equivalence Ratio f o r N-Heptane Sprays of Varylng Overal l Equlvalence Ratlo (Do = 65, 50 and 40 urn) ................................... 120
Radial Prof i les of Local Equivalence Ratio f o r Methanol Sprays of Varylng Overal l Equivalence Ratio (Do = 65, 50 and 35 urn) ................................... 121
Fraunhofer Di f f ract ion Patterns Produced by N-Heptane (D = 53, 41 and 33 p m ) and Methanol ( D = 57, 44 and 30 urn) Sprays (00 = 0.7) ........................................ 122
A.2
A.3
I
A.4 Effect of Spark Energy and Equivalence Ratio on the Ignition Frequency of N-Heptane Sprays (D = 53, 41 and 33 urn) .................................... 123
A.5 Effect of Spark Energy and Equivalence Ratio on the Ignition Frequency of Methanol Sprays ( 0 = 57, 44 and 30 urn) .................................... 124

Table w 3. t Monodisperse Operating Ranges f o r Various
Orlflces and Fuel Flow Rates ......................... 19
4.1 Spray Generation Parameters and Operating Conditions . . 57
4.2 N-Heptane Spray Characterization and Ignition Results ... 59
4 .3 Methanol Spray Characterization and Ignition Results .... 60
4.4 Prevaporized Mixture Generation Parameters and Operatfng Conditions ................................ 68
5.1 Fuel and Air Properties used for lgnitlon Modelllng ...... 83
I
I.

NOMENCLATURE
A = Surface Area
Ap = LDVProbeArea
B = Combustion Mass Transfer Number
cp = Specific Heat a t Constant Pressure
C = Capacitance
d = Distance
0 = Droplet Diameter
€act = Activation Energy
Emin = Minimum Ignition Energy
ESP = SparkEnergy
f = Focal Length
fd = Disturbance Frequency (Droplet Generation Rate)
f/a, = Fuel t o A i r Ratio (by mass)
I = Current, Intensity of Di f f racted Light
J = Bessel Function
k = Thermal Conductivity
L = Latent Heat of Vaporization
n = Droplet Number Density
qnst = Instantaneous Droplet Number Density
N = Droplet Rate
Q = Volumetric F low Rate
r = Radial Distance

x i i
R =
Red
SL =
SMD =
t
t = T =
v =
Subscriots
Universal Gas Constant
Droplet Reynold s Number
Laminar Flame Speed
Sauter Mean Diameter
Time
Spark Duration
Adia batic F 1 a me Tern pe r a t ur e
Velocity, Voltage
Axial Distance
- - a
c, h c =
d =
e, eb=
f - 9 = 1 f
- - 0
q =
sl =
sp =
s t =
A i r
Chemical Reaction
Droplet
Evaporation
Fuel
Spark Gap
Counting Index
Init ial , Overal l
Quenching
Mixing
Spark
Stoichiometric

Greek Symbols
a =
8 = A = Q =
0 =
P = e =
Particle Slze Number, Thermal Diffusivity
Evaporation Coefficient
Wave! engt h
Extent of Prevaporization, Ohms
Equiva 1 ence Ratio
Density
Scattering Ang 1 e

xiv
ABSTRACT
SPARK IGNITION OF MONODISPERSE FUEL SPRAYS
Allen M. Danis
Nicholas P. Cernansky
lzak Namer
A study of spark ignition energy requirements was conducted with a
monodfsperse spray system allowing Independent contro l of droplet slze,
equivalence ra t io and fuel type. Minimum ignition energies were measured
f o r n-heptane and methanol sprays characterized a t the spark gap in te rms of
droplet diameter, equivalence rat io (number density) and extent of
prevaporization. The droplet diameter was var ied between 30 and 57 um,
and the equivalence rat ios ranged f r o m 0.45 t o 1.8. The extent of
prevaporization of the sprays was held approximately constant f o r each fuel,
0.45 fo r n-heptane and 0.34 f o r methanol. Droplet Reynolds numbers of the
sprays ranged f rom 0.1 t o 1 .O, and interdroplet spacings var ied between 15
and 30 droplet diameters. In addition t o sprays, minimum ignition energies
were measured fo completely prevaporized mixtures of the same fuels over
a range of equiva ence rat ios to provide data a t the lower l im i t of droplet
size.
Results showed that spray ignition was enhanced with decreasing droplet
slze and increasing equivalence r a t i o over the ranges of these parameters
studied. No optimum equivalence rat io f o r ignit ion was observed f o r sprays,

but an optimum did occur a t 0 = 1.8 f o r prevaporized n-heptane ignltlon. A
corresponding optimum f o r prevaporized methanol could not be obtained due
to excessive fuel condensation.
By comparing spray and prevaporized ignition resul ts, the existence of an
optimum droplet size f o r ignition (below 30 u m ) was indicated f o r both fuels.
This optimum was attr ibuted t o the maximum f lame propagation rates
observed by previous researchers f o r sprays in this droplet size range ( 10 - 40 Um), where both premixed and diffusive types of combustion occur
simultaneously. Extension of the lean ignition l im i ts was also observed f o r
sprays compared t o prevaporized mixtures. This extension occured f o r both
fuels over the range of droplet sizes studied, and was attr ibuted t o fuel
distribution effects (i. e. fuel r i c h regions surrounding evaporating
droplets). Both the optimum droplet size and the extension of the lean
Ignition l imi t indicate the importance of the gas-phase stoichiometry in the
interdroplet spacing to spray ignition.
Fuel vo la t i l i ty was seen to be a c r i t i ca l factor in spray ignition. The
more vo lat i le n-heptane sprays required roughly one-fifth the ignition energy
required by methanol sprays of corresponding size and equivalence rat io.
For prevaporized ignition, however, activation energy was the important fuel
property. Prevaporized methanol, with i t s lower activation energy, required
roughly 50% less ignition energy than prevaporized n-heptane.
The spray ignition resul ts were analyzed using two dif ferent empir ical
ignition models fo r quiescent mixtures. Both models employed a
characterist ic t ime approach, relat ing the t ime required f o r fuel evaporation
in the spark kernel t o the quenching t ime of the kernel by thermal conduction
to i t s surroundings. The major dif ference between the models was that while
the general ignition model developed by Bal la l and Lefebvre equated the two

xvi
times, the Characteristic Time Model of Peters and Mel lor stated that they
were only proport ional and determined the correlat ion between them. Both
models accurately predicted the experimental ignition energies fo r the
major i ty of the spray conditions. Their performance deteriorated fo r lean
equivalence rat ios (< 0.7) and smaller droplet sizes (< 40 p m ) however.
This was probably because the models did not account f o r the t ime required
f o r chemical reaction in the spark kernel, which becomes important f o r
leaner and smal le r droplet size sprays.
Spray ignition was observed to be probabil istic in nature, and ignition was
quantified in te rms of an ignition frequency f o r a given spark energy. The
cr i ter ion for the minimum ignition energy was the spark energy which
produced an ignition frequency o f 50%. A model was developed t o predict
ignition frequencies based on the variat ion in spark energy and equivalence
ra t io (number density) in the spark gap. Random normal distr ibutions of
these two parameters were generated with a Monte-Carlo routine and used in
conjunction with the Characteristic Time Model for ignition. The resul t ing
ignition frequency simulations were near ly identical t o the experimental ly
. observed values, indicating that the probabil istic nature of spray ignition i s
the resu l t of variat ions in the energy levels of individual sparks and the
random distr ibution of droplets in a fuel spray.

I
CHAPTER 1
INTROOUCT IO N
The combustion o f l iquid hydrocarbon fuels i s the pr incipal source of
energy production in today’s society. Although the i r percentage of t o ta l
worldwide energy consumption dropped f rom 48% in 1975 t o 40% in 1985, l iquid
petroleum products s t i l l account fo r the major port ion of energy consumed in
the U.S. and worldwide (DOE/EIA, 1985). Roughly 50% of these l iquid
hydrocarbon fuels a re burned in spray form, by combustion devices such as
furnaces and gas turbine and diesel engines.
Studying the ignit ion character ist ics of l iquid hydrocarbon sprays i s
important f o r several reasons. Since many of the combustion devices
mentioned above use spark ignit ion systems, the amount of spark energy
required fo r successful ignit ion over a range of operating conditions must be
known. Information about the ignit ion character ist ics of fuel sprays and
vapor i s also useful f o r the development of fundamental models of ignition,
combustion and f lame propagation. Final ly, knowledge of ignit ion
mechanisms i s necessary fo r the prevention of unwanted explosions and
f ires.
A local source of ignition, such as an e lect r ic spark, ini t iates chemical
reaction by energizing a smal l volume ( o r kernel ) of combustible mix ture
around the spark. Energy i s lost f rom this spark kernel by heat t rans fer and
transport processes, and the chemical energy of the mixture in the kernel
must be converted into thermal energy at a sufficient ra te t o overcome these

2
I
losses, I f th is occurs, the kernel wi l l g row into a steadi ly propagating f lame
and ignit ion i s successful.
The many interacting factors which influence spark ignit ion of fuel sprays
can be grouped into the three basic categories consisting of spray
parameters, physical parameters and spark parameters. Spray parameters
include the size o r size distr ibution of droplets in the spray, the interdroplet
spacing, the amount of evaporated fuel and oxidizer present in the
interdroplet spacing, and the fuel properties. Physical parameters which
can affect ignlt ion a r e f low characterist ics such as the spray ve loc i ty and
level of turbulence, as wel l as the local temperature, density and pressure
at the point o f ignition. Spark parameters such as the energy and duration of
the spark and the electrode spacing and conflguration re la t lve t o the spray
must also be considered.
Extenslve studies have been undertaken previously t o measure the
minimum spark ignition energy required f o r a var ie ty of homogeneous
fuel-air mixtures. However, measurlng the ignition energy of heterogeneous
fuel-air mixtures i s a much more complex task due t o the experimental
d l f f lcul t ies in control l ing and quantifying the spray parameters mentioned
above. The ignition of polydisperse, o r mul t ip le droplet size sprays has been
studied f o r a number of fuels, but only over l imi ted ranges of equivalence
rat io. Ignition data f o r monodisperse, o r single droplet size sprays is even
more sparse, with studies covering only one fuel and a l imi ted size range.
This study was undertaken t o provlde ignit ion energy data f o r monodisperse
sprays over a range of drop sizes and equivalence rat ios more typical o f
those found in pract ical combustors.
A we l l characterized spray faci l i ty was used t o simulate the spark
ignition process which occurs in pract ical combustors, such as gas turbine

engines. The major experlmental var iables included fuel type, droplet size
and stoichiometry. The main experimental measurements made in this study
were ignit ion frequency and spark energy ( f r o m which ignit ion energy was
determined), droplet number density ( f r o m which the stoichiometry was
determined) and droplet size. Ignition energy measurements were also
performed fo r prevaporized, premixed cases t o provide the lower bound of
zero droplet size. The analyt ical port ion of the study involved predict ing the
minimum ignit ion energy of the fuel sprays as a function of fue l type, droplet
size, equivalence ra t io and amount of prevaporized fuel. These predict ions
were made with two existing spark ignit ion models which used a
characterist ic t ime approach. An ignit ion frequency model was developed
which extended the character ist ic t ime models t o account fo r the
probabalistic nature of the ignit ion process.
Chapter 2 includes background informat ion concerning the ignit ion of
combustible mixtures, as wel l as a review of some previous work in the
area. The spray characterization and ignit ion faci l i t ies and experimental
resul ts a re described in Chapters 3 and 4, respectively. Analyt ical
calculations and predictions are presented in Chapter 5. The conclusions of
the study and recommendations fo r future work comprise Chapter 6.

I
CHAPTER 2
BACKGROUND AND LITERATU RE RFVIFW
A n e lect r ic spark ignites a combustible mix ture by means of heat addition
fo l lowed by f lame propagation. Therefore, insight into the spark ignit ion
process can be gained by studying the re la ted processes of thermal ignit ion
and f lame propagation. Experimental and theoret ical studies done in these
areas w i l l be reviewed in the f i r s t two sections of th is chapter.
Experimental spark ignit ion studies have been performed with both
homogeneous and heterogeneous mixtures. Those studies w i l l be reviewed in
the t h i r d section of th is chapter. The discussion w i l l begin with a b r ie f
overview of the homogeneous studies coupled with a review of spark
character ist ics and the i r effects on ignition. This w i l l be fol lowed by a more
detai led review of the heterogeneous ignition studies.
Theoretical work on the spark Ignition of sprays w i l l be covered in the
f ina l section of th is chapter. Global ignition models w i l l be reviewed, as wel l
as attempts t o model the loca l formation and growth of the spark kernel and
i t s ef fect on spray droplets within and surrounding it.
2.1 Thermal lanit ion Studies
The ignition character ist ics of single isolated fuel droplets in a hot
envlronment was studied experimentally by Saitoh & a. (1982). They
measured the ignit lon delay t ime as a function of droplet size and a i r
temperature f o r n-heptane and n-hexadecane droplets ranging f rom 0.5-2.5

mm. A minimum droplet s i ze fo r lQnitiOn was observed, and below th is
minimum the droplet could completely vaporize without igniting. This
l imit ing drop size, as we l l as the ignit ion character ist ics of fuel droplets in
general, depended st rongly on the fuel type and ambient conditions.
Law and Chung (1978, 1980) theoret ica l ly studied the thermal ignit ion of
single droplets in a hot ambient environment. They found that the ignit ion
delay t ime could be represented in te rms of an ignit ion Oamkohler number.
The thermal ignit ion of monosized droplet streams in a hot environment
was investigated by Sangiovanni and Kesten ( 1977). They studied the effect of
droplet interactions, as contro l led by the droplet size (200-300 p m ) and
interdroplet spacing (2-200 droplet diameters), on the ignit ion delay t ime of
fu r fu ry l alcohol droplets. Theoretical ly, they determined ignit ion delay
times f o r the l imi t ing cases o f an isolated droplet and a cy l indr ica l f i lament
of fuel. Results showed that the ignit ion delay t ime increased substantial ly
as the in terdroplet spacing was decreased. This droplet interact ion effect
increased with decreasing droplet size, decreasing ambient temperature and
inc r easing fuel vo l a ti 1 i ty . Aggarwal and Sirignano (1985) developed a numerical model f o r the
ignitlon of idealized, quiescent monosized droplet a r rays by a heated wall .
They predicted optimum values of droplet size and overa l l equivalence ra t io
for ignition. The optimum droplet s i t e depended on the overa l l equivalence
rat io and was at t r ibuted t o the distr ibution of fuel vapor in the ignit ion zone,
whlch was affected by the to ta l droplet surface area. Simi lar ly, the optimum
equivalence ra t io was a function of the initial droplet size and fuel vo la t i l i ty .
The authors also showed that ignit ion of droplet a r rays (and fuel sprays) was
a probabalistic phenomenon, since it depended on the location of the droplets
relat ive t o the heat source, which was random. They subsequently extended

6
th is work to polydisperse sprays (Aggarwal and Sirignano, 1986) and
concluded that the area mean diameter better character ized polydisperse
sprays than the Sauter mean diameter. Aggarwal and Nguyen (1987)
per formed a numerical simulation of the ignit ion of monosized droplet a r rays
f lowing in a tube. Their ignit ion source was a local ized heat source ( f lame
kernel) , and they determined minimum ignit ion energies and ignit ion delay
t imes fo r n-hexane and n-decane droplets ranging f rom 30-150 um. Results
showed that the minimum ignit ion energy increased with increasing droplet
size, increasing mixture veloci ty and decreasing fuel volat i l i ty . They also
indicated an optimum droplet size (minimum ignit ion delay t ime) fo r
n-hexane, and that th is optimum size increased with increasing mixture
veloci ty.
2.2 Flame Prooaaatlon and Transition Reaion Fffects
Burgoyne and Cohen (1954) studied the effect of droplet size on f lame
They observed that propagation through monodisperse te t ra l in aerosols.
premixed, prevaporized combustion dominated fo r sprays with droplet sizes
below IO um. Above 30 urn the droplets burned individual ly in the i r own
dif fusion f lame envelope, with burning droplets ignit ing adfacent droplets.
Fo r the combustion of sprays with intermediate droplet sizes (10-30 um), individual droplets encased in f lame envelopes were observed superimposed
on the gaseous laminar f lame structure. Sprays which exhibited th is
t ransl t lonal combustion behavior, both heterogeneous and homogeneous,
were said t o be in the ' t ransi t ion region'. They also observed that the
presence of droplets extended the lean prevaporized f lammabi l i ty l im i ts t o
leaner equivalence rat ios. They explained this with the observation that even
a t lean overa l l equivalence rat ios, fuel droplets supported a dif fusion f lame

burning in stolchiometrlc p r OpOrtlOnS. Conversely, a lean prevapor
premixed mixture would never have regions of stoichiometric mix
st r engt h . Polymeropoulos and Das (1975) observed a maximum f lame speed
zed
ure
fo r
kerosine sprays a t about 30 u m SMD . This was fu r ther evidence that f lame
propagation was enhanced by t rans i t ion region effects. Hayashi &A. (1976,
1981 ) studied f lame speeds in a closed combustion bomb, which was subject
to large pressure increases as the reaction progressed. However, they
found that the f lame speed increased as drop size increased f rom 16-40 um,
provided that the mass of l iquid fuel droplets was greater than the mass of
fuel vapor present. They also showed that the presence of fuel droplets
could increase the f lame speed compared t o that f o r the fu l l y vaporized
case.
Mizutanl and Nakajima (1973) observed that the addition of kerosine
droplets to a gaseous propane-air mix ture increased the f lame speed at lean
overal l equivalence rat ios. The optimum drop size f o r enhancement was
found t o be 40 um. They explained this behavior by proposing that the
droplets wr inkled and lacerated the f lame surface, thereby increasing the
flame speed. They also suggested that the drops served as high temperature
ignition sources, extending the f lammabi l i ty l im i ts and accelerat ing the
burning veloci ty of adjacent f lame elements. The burning ve loc i ty was
increased because the f lame propagated through regions of optimum fuel t o
alr ra t io formed around the evaporating drops. In addition, the burning
droplets caused local gas expansions, generating turbulence which fur ther
intensified the t ranspor t processes. By repeating the i r experiments with
vaporized kerosine, they conf i rmed that it was the two-phase nature of the
flow that was responsible fo r the observed behavior.
In addition t o enhanced f lame speeds and broadened f lammabi l i ty l imi ts ,
several other combustion phenomena have been observed fo r sprays in the
t rans i t ion region. Nizami et a l . (1982) and Sarv (1985) measured minima in
NO, emissions fo r sprays in the 40-60 u m size range. Chan (1982) and Singh
(1986) both observed optimum drop sizes fo r spark ignition. These ignit ion
studies w i l l be reviewed in detai l below.
* I 2.3 f x rm imen ta l Soark lanit ion Studiec
2.3.1Soark Cha racter is t lcs and Homoaeneous Soa r k IanitioQ
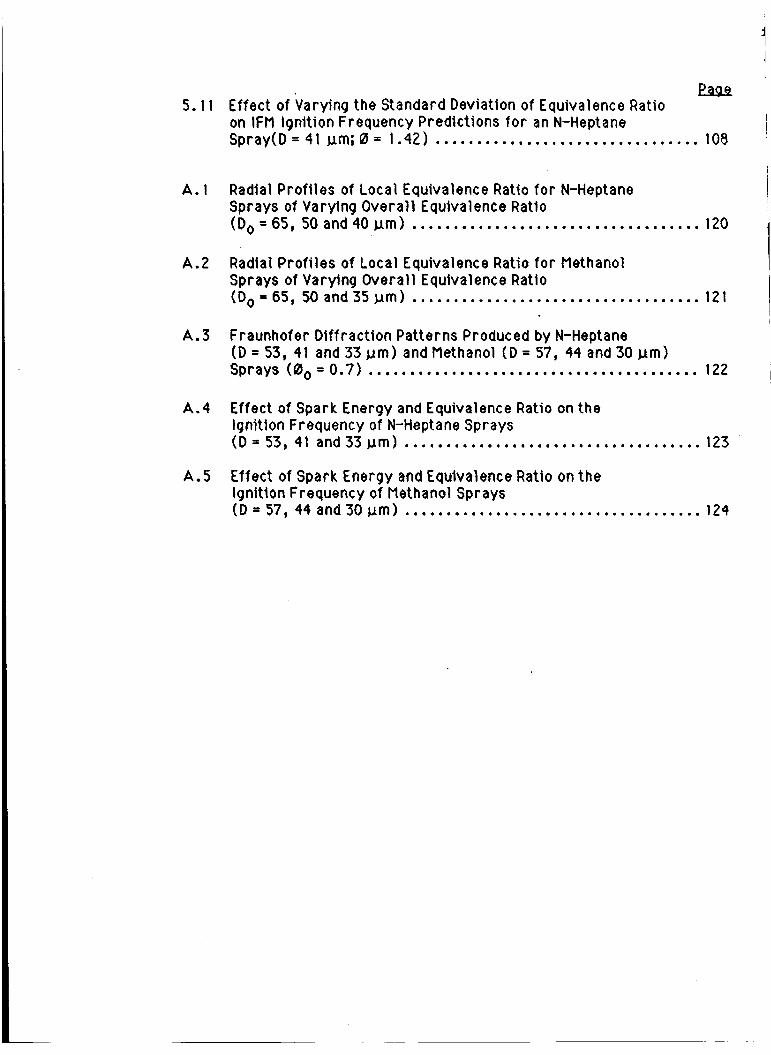
Some of the ear l iest experimental ignit ion work was performed by Lewis
and Von Elbe (1961 and Li tchf ie ld (19601, who independently determined the
minimum spark energy required f o r ignition of mixtures of 8.5% methanej.in
a i r t o be 0.28 mJ. In both studies, purely capacitive sparks with durations
of less than 1 us were used as the ignition source. The spark energy (Esp)
was assumed t o be equal t o the stored e lect r ica l energy of the capacitor,
given by:
ESP = 0.5CV2 (2-1 1
where C i s capacitance and V i s voltage.
Rose and Priede (1958) investigated the minimum ignit ion energy of
hydrogen-air mixtures using a capacitive discharge ignition c i rcu i t with
ser ies resistance (RLC c i rcu i t ) t o produce the i r ignit ion sparks. They found
that by increasing the resistance in the i r c i rcu i t whi le holding the spark
energy constant, the energy required f o r ignit ion decreased. Increasing the
c i rcu i t resistance increased the duration of the spark. This decreased the
strength of the shock wave produced by the spark, thereby increasing the
proport ion of the spark energy available fo r heat addition t o the mixtures.

Since some of the stored CapaCltOr energy was dissipated in the c i rcu i t
resistance, spark energies had t o be calculated by integrating the product of
the voltage ( V I and current ( 1 ) across the spark gap over the duration of the
spark:
ESP = o(t Vldt (2-2)
They also noted that changing the electrode spacing (spark gap width)
affected the i r ignition energy resul ts and that th is parameter should be
optimized f o r each condition tested.
In a detailed investigation of spark discharge character ist ics Maly and
Vogel ( 1978) studied the three modes of capacitive discharge: breakdown,
arc and glow. 6reakdown discharge occurs when there i s v e r y l i t t l e o r no
resistance in series with the capacitor, resul t ing in spark durations that a re
very short, typ ica l ly less than 1 us. A r c and glow discharges have longer
durations (10-300 us and greater than 300 us, respect ively) due t o
increased series resistance. Maly and Vogel concluded that breakdown was
the most efficient discharge mode because v e r y l i t t l e energy loss due t o
conductlon of heat f rom the spark t o the electrodes occurred, while
substantial conduction losses occurred during both a r c and glow discharges.
The energy losses due t o radiat ion were also found t o be negligible fo r a l l
three modes. These findings conf i rmed ear l ie r studies on spark discharges
by Roth (1951).
In a study s imi la r t o that of Maly and Vogel, Kono & d., (1977)
concluded that arc discharge was the most eff icient mode of energy t rans fer
for the spark lgnition of quiescent propane-air mixtures. They observed that
under the condition of optimum spark duration and gap width, a r c discharges
I
i
I
I
I I
I
I
~
I

10
I
I
resul ted in the lowest ignition energy of the three modes.
While investigating the spark ignition of f lowing propane-air mixtures,
Swett (1956) found the optimum spark duration to be about 100 us. B a l l a l and
Lefebvre (1975) also observed optimum spark durations of 60-100 us f o r
f lowing propane-air mixtures, as did Ziegler ( 1984) f o r methane-air
mixtures. In addition, Bal la l and Lefebvre (1975) found that the minimum
ignit ion energy decreased with decreasing electrode diameter due t o
decreasing electrode surface area available f o r conduction losses.
In summary, arc discharge has been found t o be the most efficient f o r m
of energy t ransfer f o r the spark ignition of combustible mixtures, provided
the discharge occurs under optimum conditions of spark duration and spark
gap width t o minimize energy losses. In reality, a l l arc discharges a r e
ini t iated by a breakdown discharge, needed t o ionize the medium in the spark
gap and provide a conducting path f o r the arc. However th is breakdown phase
accounts fo r a negligible amount o f the spark duration and to ta l spark energy
re la t ive t o the a rc discharge.
2.3.2 jieteroaeneous %ark l a n m
Spark ignition of polydisperse fuel sprays has been studied extensively by
Lefebvre and co-workers. Rao and Lefebvre (1976) measured the minimum
ignit ion energy (Emin) of polydisperse kerosine sprays with Sauter mean
diameters (SMD) ranging f r o m 30-100 urn and equivalence rat ios ( 0 ) ranging
f r o m 0.4-1.0. They observed that droplet size had the strongest effect on
ignition, with Emin increasing steadily with increasing SMD. They also found
that, f o r a f ixed droplet diameter, E,i, decreased steadi ly with increasing
0.
Continuing this work, Bal la l and Lefebvre (1978) measured Emin over

similar ranges of SMD and 0 for polydisperse sprays of s ix di f ferent fuels
ranging in vo la t i l i t y f r o m iso-octane t o heavy fuel o i l The observed effects
of SMD and 0 on Emin were s imi la r t o those noted above fo r kerosine.
Moreover, the authors quantified these effects, showing that Emin was
proportional t o SMD3 and 0’’ a 5 . In additlon, Emin was seen to decrease with
increasing fuel vo la t i l i ty . They concluded that the most c r i t i c a l factor in
determlnlng ignit ion was the mass concentration of fuel vapor generated by
the spark In the Ignition zone. In the same study, Bal la l and Lefebvre
Investigated the effect of pressure, mean ve loc l ty and turbulence intensity on
ignition and found that Emin increased with decreasing pressure, increasing
flow veloci ty and increasing turbulence intensity.
The f i r s t spark ignit ion study performed with monosized sprays was by
Chan (19821, who studied the ignit ion of monodisperse te t ra l i n sprays with
drop sizes ranging f rom 8-32 p m and equivalence rat ios of 0.4-1.0. He
observed an optimum droplet size f o r lgnlt lon of about 15 p m and reasoned
that as the drop size decreased f rom 30 to 15 p m the enhanced evaporation
made ignition easier. As the drop size decreased below 15 pm, however,the
spray approached a homogeneous qual i ty and lost the beneflt of individual
droplet combustlon, thus increasing the energy needed fo r ignit ion of lean
mixtures.
Singh ( 1986) per formed ignit ion studies of monodisperse te t ra l i n sprays
and observed an optimum drop size fo r ignit ion of 22-26 pm, depending on
stoichiometric conditions. He concluded that the amount of fuel vapor
generated by the spark depended on the drop size. Sprays with drop sizes
smal ler than the optimum produced fuel vapor concentrations during the
spark discharge that were r l cher than optimum for ignition, while drop sizes
larger than optimum produced fuel vapor concentrations leaner than optimum

12
I
f o r ignition. He also reported ignition resul ts in te rms of ignit ion frequency
ra ther than minimum ignit ion energy, since there was no sharp delineation
between spark energies which produced ignit ion and those which did not.
2.4 Theo re t i ca l %ark lanition Stud i es
The analysis and modeling of spray formation, evaporation and
combustion has been quite extensive. Two review papers which cover th is
area quite thoroughly have been published by Sirignano (1983) and Faeth
(1979).
Modeling of the spark ignition process i t se l f was f i r s t performed by Lewis
and von Elbe (1961) who re la ted ignition energy t o the laminar f lame speed of
the mixture. They assumed that the entire spark energy was instantaneously
converted to thermal energy within a spark kernel. For successful ignition,
th is spark kernel should achieve some c r i t i ca l volume, o r quenching
distance, resul t ing in f lame propagation. This c r i t i ca l volume was achieved
when the heat release ra te within the kernel equalled the ra te of heat loss
f r om it.
More recently, Peters and Mellor (1980) used a character ist ic t ime
approach to the model ignit ion energy of quiescent sprays. They
subsequently extended the model for use in gas turbine engines (Peters,
1981; Peters and Mel lor , 19821, predicting ignition energies as a function of
equivalence rat io, SMD and pressure f o r quiescent and turbulent sprays.
Their c r i te r ion for ignit ion was that the residence t ime of the fuel-air mix ture
a t the spark gap must be longer than the t ime requi red fo r evaporation and
chemical reaction. The residence t ime was the ra t i o of the quenching
diameter t o the mean velocity, and the evaporation and ignit ion delay t imes
were given by the $ law and an Arrhenius expression, respectively. These

models predicted ignttion energies which corre la ted wel l with the
experimental data of B a l l a l and Lefebvre (1977). Bal la l and Lefebvre (1981 )
developed a s imi lar model t o predict ignit ion energies fo r homogeneous and ! heterogeneous mixtures under f low conditions ranging f r o m quiescent t o
turbulent. They re la ted the t ime required fo r evaporation and chemical
reaction t o the t ime required fo r the hot kernel t o be quenched by heat loss t o
the surrounding spray. Their ignit ion delay t ime was re la ted t o the f lame
speed of the mixture, ra ther than the activation energy used by Peters and
Mellor.
1 I
’
While the spray ignit ion models noted above have taken a global approach
t o spark ignition, other investigators have used a more local ized approach
by taking into account the t ime dependent nature of the spark discharge.
Maly ( 1981 ) developed a tempora l ly resolved thermal ignit ion model which
took into account the unsteady nature of the ignit ion process in a detailed
analysis of the di f ferent phases of spark discharge and ignition. He proposed
that the energy available fo r ignit ion was concentrated in a narrow shel l
around the spark plasma. His c r i te r ion fo r ignit ion was that the expansion
velocity of th is outer shel l must be equal t o that of a sel f supporting f lame
front of the same size.
Adelman (1981) developed a theory which re la ted the t ime dependent
energy input f rom a spark t o the kernel expansion. He took into account the
strong shock wave spher ical ly expandlng f rom the spark, fol lowed by the hot
expanding spark kernel. His c r i te r ion fo r ignit ion was that the spark kernel
must grow to a c r i t i c a l size before i t s expansion ve loc i ty f a l l s below a
c r i t i c a l velocity. Using a s im i la r approach, Singh (1986) applied a model of
spark kernel growth, including shock wave effects, t o his experimental
ignition data fo r qual i tat ive correlat ion. For sprays of v e r y smal l droplets

( less than 10 urn), the model predicted that the loca l f low f ie ld generated by
the spark discharge resul ted i n a droplet f ree annular region around the
spark kernel. This fuel f ree zone acted as a ba r r i e r t o f lame propagation,
explaining his experimental observation that sprays with v e r y smal l droplets
(6.7 urn) were v e r y di f f icul t t o ignite.
Bradley and Lung (1987) developed a hydrodynamic model t o predict the
temporal development of the rad ia l prof i les of density, pressure, veloci ty
and temperature f r o m a spark discharge channel. They showed that the slow
spread of thermal energy f r o m the relat ively narrow discharge channel was a
l imi t ing factor in spark ignit ion This spread could be accelerated by higher
energy input in the ea r l y stages o f the spark discharge, resul t ing in stronger
shock waves, thermal waves and outward convection of energy.

CHAPTER 3
I EXPERIMENTAL FACILITIES AND METHODS I
The baslc spray generation and characterlzation facl l i t ies a r e described 1
in th is chapter, along with the spray ignit ion system and experimental
procedures. Representative spray character izat ion resu l ts a re presented l
and discussed in th is chapter, while comprehensive spray characterization I
resul ts appear in Appendix A. Actual spray operating conditions and ignit ion
resul ts w i l l be reported and discussed in Chapter 4.
3.1 Sway Generation
3.1.1 MonodisDerse S w a y Generation System
A Berglund-Liu Vibrating Ori f ice Monodisperse Aerosol Generator, Model
3050 (Berglund and Liu, 1973), was used t o produce sprays of monosized
droplets fo r th is study. Figure 3.1 shows a photograph of a typical spray
enlarged 20 t imes. The picture was taken as the spray exited the tes t section
10 cm downstream of the point of generation. The curved white line i s the
bottom r i m of the tes t section. (For reference, the thickness of the white
line i s about 0.5 mm. As seen, the droplets are monosized, wel l dispersed
and randomly positioned. This generator has been successful ly used
previously fo r a number of monodisperse spray combustion studies (Nizami
dial., 1978-1982; S a w , 1985). The generator was mounted on a t ravers ing
mechanism which allowed manual t ranslat ion of the unit in the x-y-z
coordinates.

I
16
Figure 3.1 Photograph of a Monodisperse N-Heptane Spray Enlarged 2OX (0, = 50 m; 0, = 0.55; z = 10 cm)

A cross-section vlew of the aerosol generator 1s shown In Frgure 3.2.
Monosized droplets were generated by applying periodic disturbances f r o m a
function generator t o a piezoelectric ceramic, which in turn exerted
mechanical vibrations on a l iquid fuel je t emerging f r o m an or i f i ce plate
seated in the ceramic. The perturbed j e t then broke into discrete droplets
with a standard deviation in size of approximately 1% o f the mean diameter.
One droplet was created per cyc le of disturbance, so the in i t ia l droplet
diameter (Do) could be calculated f r o m the vo lumetr ic fuel f low ra te ( Q f )
and the frequency of disturbance ( fd) and i s given by:
(3-1 1
The droplet diameter was contro l led by varying the fue l f low ra te and the
frequency of disturbance. While the droplet diameter was not a d i rect
function of the or i f ice diameter, a given sized or i f i ce was only capable of
producing monosized droplets within a re la t i ve ly nar row 'monodisperse'
range. Therefore, d i f ferent diameter or i f ices were used t o produce a broad
range of monosized droplet diameters. Table 3.1 shows the monodisperse
ranges obtainable fo r the di f ferent or i f ices and fuel f low rates used i n th is
study.
3.1.2 Fuel and A ir Flow Svstems
Figure 3 . 3 shows a s impl i f ied schematic diagram of the in te r io r of the
spray generator. A lso included a r e the radial and axial coordinate axes ( r
and z ) used in this study. A n infusion syringe pump (Harvard Apparatus
Model 901) supplied l iquid fuel t o the spray generator. As the s t ream of
uniform fuel droplets exited the or i f ice, it entered a turbulent je t of

18
I ” I
D I LUT I 0 N AIR D I SPERS I ON AIR
Figure 3.2 Cross Section View of the Monodtsperse Spray Generator

ORIFICE FUEL FUEL MONODISPERSE D IAMETER FLOW RATE RANGE
( u m ) (cc/m) (urn)
7.5 12.5 17 22 27 17 22 27
METHANOL METHANOL N-HEPTANE N-HEPTANE N- HE PTA N E METHANOL METHANOL METHANOL
0.075 0.075 0.18 0.19 0.19 0.35 0.37 0.375
16-20 20-30 30-43 45-57 54-70 30-45 45-56 50-67
Table 3.1 Monodisperse Operating Ranges f o r Various Ori f ices and Fuel Flow Rates

I DILUTION AIR DILUTION AIR I DlSPERSiON AIR
I FUEL I
1.6 cm I.D.
ELECTRODES
I i- i r
Figure 3.3 Schematic View of the Spray Generator In te r io r

dispersion air which kept the droplets f r o m coagulating. Tnis air le t was
formed by the dispersion air f low exiting the dispersion cup through a 1 mm
diameter or i f ice. The dispersion cup was mounted so the dispersion or i f ice
was 1 mm d i rec t l y below the fuel or i f ice.
The dispersion je t with droplets in suspension continued downward
through the reducing section, where a co-flow of d i lut ion a i r was entrained
into the spray. This reducing section had smooth rounded edges t o minimize
flow recirculat ion, The spray then entered the tes t section, which was a 1.6
cm I.D. Pyrex tube 18 cm in length, and exited t o the atmosphere.
Both the dispersion and di lut ion a i r f low rates were set by electronic f low
contro l lers (Tylan Model FC-260), and monitored with mass f low meters
(Hastings Model ALL-5K). The overa l l stoichiometry ( Q o ) of the sprays was
set by the re la t ive f low rates of fuel, dispersion a i r and di lut ion a i r . For a
given drop size spray, the fuel and dispersion air f low rates were fixed, and
the equivalence ra t io was var ied b y changing the di lut ion a i r f low rate.
3.1.3 Fuel PrevaDorization Svst em
In order t o pe r fo rm ignition energy measurements on prevaporized,
premixed fuel /a i r mixtures, a fuel prevaporizing apparatus was added t o the
experimental faci l i ty . A schematic of th is system i s given i n Figure 3.4.
Liquid fuel and a i r entered a spherical 500 cc pyrex vessel, heated t o
approximately 150 T, where the l iquid fuel evaporated and mixed with the
a i r . The mixture then flowed through a heated secondary mixing section
constructed of 1.2 cm 1.0. stainless steel tubing 40 c m in length. This
section had 4 stainless steel screens spaced evenly along i t s length t o induce
turbulence, thus ensuring uni form mixing of the vaporized fuel and air. The
mixture then flowed into the dispersion a i r in le t of the aerosol generator.

,
#
LIQUID FUEL
HEATED SECONDARY MIXING S ECTlO N
AIR
HEATED EVAPORATION AND MIXING CHAMBER
Figure 3.4 Schematic Diagram of the Fuel Prevaporizing and Premixing Apparatus

Stnce no dilution air f l ow was t o the outlet of the dispersion
The test section used was
I
needed, the tes t section was attached directly cup f o r the prevaporized ignit ion experiments.
identical t o the one used f o r the spray
experiments, as described in the previous section.
3.2 Number Density Me a sur e ment
A major port ion of the spray characterization procedure involved
specifying the local droplet number density a t the spark gap, which was
direct ly related t o the stoichiometry. Spray number densities were
determined f rom measurements made with a laser Doppler ve loc imetry (LDV)
system. These measurements included droplet ve loc i ty and rate, a i r
velocity and LDV probe a r e a , and a re detailed i n the fol lowing sections.
Representative resul ts f rom these measurements a re also included below,
. while comprehensive resul ts appear i n Appendix A.
3.2.1 J DV Svstem
Mean droplet and a i r velocit ies, turbulence intensities and droplet ra tes
were measured using a dual beam LDV system in the backscatter mode. A
schematic of the system i s shown in Figure 3.5. The basic system
components were the laser (Spectra-Physics Model 1246 Laser, Model 255
Power Supply), optics (TSI Model 900 Series), photomult ipl ier (TSI Model
962) and signal processor (TSI Model 1984 input conditioner and TSI Model
1985 t imer ) . The signal f rom the processor was sent through an analog t o
digital converter and analyzed with a DEC LSI-11 microcomputor. The
FORTRAN and MACRO data analysis programs a.re l is ted in Appendix 8. A
complete descript ion of the physical principles involved in LDV measurements
can be found i n a Daoer bv Stevenson 1976).

24
f
HE-NE LASER .
I
OPTICS
I
SIGNAL CONDITIONER
LSI-11 MICRO-
COMPUTOR
Figure 3.5 Schematic Diagram of the LDV Spray Characterization System

3.2.2 SDr av Number Density and Stoichiometry
A spray characterization procedure was per formed t o specify the 1 relat ive amounts of fuel and air in the spark gap region during ignit ion 1
I
testing. The procedure involved making LDV measurements a t points on a I
horizontal rectangular g r i d a t the axial location of the ignit ion electrodes.
Due t o the di f f icul ty in attempting LDV measurements through a cy l indr ica l
test section, a shorter test section cut off 3 mm above the laser beams was
used fo r th is procedure-. This allowed LDV measurements t o be made through
air, with no obstruction f r o m the tes t section. The basic procedure was as I
f o l l ows . I
Droplet ra te ( N ) and veloci ty (vd) measurements were made i n a 2 mm
gr id pattern over the ent i re cross section of the spray. The droplet number
density (n) was determined local ly i n the sprays as follows:
I
!
n = N/VaAp (3-2 )
where Va i s the a l r veloci ty and Ap i s the probe area. Va was measured as
described in section 3.2.4. Ap was measured as described i n Section 3.2.3.
The number density was then converted t o the local equivalence ra t io by:
where pf and Pa are the densities of the l iquid fuel and a i r respectively, Do i s
the initial droplet diameter and (f/a),,,t i s the stoichiometric fuel t o a i r
mass f low rat io.
The in i t ia l droplet diameter and not the local diameter was used in order
to account fo r a l l of the fuel ( l iqu id + vapor) present local ly. It was

I
assumed that the evaporated fuel stayed in the radial v ic in i ty of the droplets
f r o m which it evaporated, so that the rad ia l prof i les of fuel vapor matched
the droplet number density prof i les in the sprays. This was based on a
character ist ic mixing length analysis f o r a turbulent f ree je t (Hinze, 1981 )
f r o m which radial mixing lengths of 1-2 mm were calculated fo r the sprays.
Since these mixing lengths were very close t o the average in terdroplet
spacings of the sprays (0.6-1.5 mm), th is assumption was reasonable.
Typical radial prof i les of number density and loca l equivalence ra t io a re
given in Figure 3.6 f o r 50 u m methanol and n-heptane sprays with overa l l
equivalence rat ios of 0.51. Notice that while the equivalence ra t io prof i les of
these sprays were v e r y s imi lar , the methanol number densities were roughly
twice those of the n-heptane spray. This was because methanol, with fewer
carbon atoms and a fuel-bound oxygen atom, requi red about twice the fuel t o
a i r ra t io of n-heptane t o achieve the same equivalence rat io. Equivalence
ra t io prof i les f o r a l l sprays tested are shown in Appendix A.
The spark gap equivalence ra t io (0,) was defined as the average value of
the loca l equivalence ra t i o over the width of the electrode spacing. Values of
Og a r e given in the next chapter in Tables 4.2 and 4.3 fo r a l l sprays tested,
along with specific values of the spark gap widths used. Spark gap widths
ranged f r o m 2-7 mm, increasing with decreasing equivalence rat io. Due t o
the increasing amount of dilution air entrained in to the dispersion jet, the
equivalence ra t io prof i les became f la t ter in shape with decreasing overa l l
equivalence rat io. This meant that larger gap widths corresponded t o f la t te r
equivalence ra t io prof i les . Therefore, the loca l equivalence ra t io was
re la t i ve ly constant over the width of the spark gap f o r most cases.
Figure 3 . 7 shows spark gap equivalence ra t i o (based on a 2 mm gap
width) plot ted as a function o f the overal l equivalence ra t io f o r n-heptane

A
I )3
E E Y
- u) L W 0
3 B0=0.5 1
I
H METHANOL 0 N-HEPTANE i
0 2 4 6 8 I
RADIAL DISTANCE (mm)
0 ~ 0 . 5 1 I 1 0.75 k
0.00 0 2 4 6 8
RADIAL DISTANCE (mm)
a METHANOL a N-HEPTANE
F i g u r e 3.6 Rad ia l P r o f i l e s of D r o p l e t N u m b e r D e n s i t y and Equ iva lence Ra t io f o r Me thano l and N-Heptane Sprays (Do = 50 Mm; 0, = 0.51; z = 10 cm)

2.0
0 I G 1.5
a
w w u L w 1 .o
0.0 0.0 0.5 1 .o
OVERALL EQUIVALENCE RATIO
1
t Figure 3.7 Variation of Spark Gap Equivalence Ratio with Overall Equivalence Ratlo for N-Heptane Sprays (Do = 50 urn; z = 10 cm; Spark Gap = 2 mm)
28
1.5

sprays with 50 urn init ial droplet diameters. As seen, Og was la rger than
and increased l inear ly with 0,. These trends were observed f o r a l l sprays
tested. The uncertainty in 0g was determined f r o m t r ip l i ca te measurements
of the same spray and found t o be f 5%. The symbol 0 w i l l be used
interchangeably with 0g subsequently, while the overa l l equivalence ra t io
w i l l be denoted exclusively by 0,.
At this point, a s l ight digression i s in order t o repor t an interest ing
phenomenon observed during the spray characterization procedures. As w i l l
be discussed more fully in Section 3.2.4, the droplet veloci t ies were greater
than the a i r velocities fo r most of the spray cases studied. For these cases,
there existed an instantaneous droplet number density ( "inst) which d i f fered
f rom the previously defined droplet number density. The instantaneous
number density was a measure of the number of droplets per volume of space
(not air). It can be thought of as a snapshot ( f rozen in t ime) of the droplets
in space. It was determined using an equation s imi la r t o that used fo r the
previous number density, but based on the droplet ve loc i ty instead of the a i r
velocity:
where N i s the LDV droplet rate, vd i s the mean droplet ve loc i ty and Ap i s the
LDV probe area.
A radial p ro f i le of the instantaneous droplet number density compared t o
the droplet number density i s shown in Figure 3.8 f o r a 50 u m init ial droplet
diameter methanol spray with an overa l l equivalence ra t io of 0.42. As seen
in Figure 3.8, the instantaneous number densities a re less than the spray
number densities. In the t ime f rame of an ignition spark (=IO0 us), the

30
n M I
3 tlETHANOL; Do=SOwm; 00=0.42
O + I I 1
0 2 4 6 a RADIAL DISTANCE (mm)
Figure 3.8 Radial Profi les of Instantaneous Droplet Number Density and Droplet Number Density f o r a Methanol Spray (Do = 50 urn; 0, = 0.42; z = 10 cm)

instantaneous number density i s the more relevant quantrty of the two t o
consider when characterizing the spray. However, f o r ignition t o occur, the
spark kernel must propagate into the surrounding mixture. The t ime f rame
of th is propagation, based on the f lame speed and width of the test section, i s
on the order of several mil l iseconds. During th is t ime, the flux of both fuel
and air across the kernel boundary must be considered. Therefore, the
droplet number density based on the a i r ve loc i ty (n) i s more relevant t o
ignition and w i l l be used exclusively t o characterize the spray equivalence
ratios in the subsequent report ing and analysis of ignition data.
3.2.3 LDV Probe Area
The LDV probe volume i s the ell ipsoidal region where the two laser beams
cross, creating the f r inge pat tern which produces Doppler bursts when
traversed by a droplet. These Doppler bursts a re analyzed t o determine the
droplet velocity, and a re counted t o determine the droplet ra te o r frequency.
The LDV probe area (Ap) i s the project ion of the probe volume normal t o the
spray direction. The size of the probe area i s a function of: the diameter of
the laser beams; the diameter of the droplets t ravers ing it; the index of
re f ract ion of the droplets; the laser wavelength and power; the LDV optics;
and the LDV processor electronics. Ap was determined in the following
manner and subsequently used in the spray characterization procedure
described in section 3.2.2.
Measurements of droplet ra te (N) were made in a g r i d pat tern over the
entire cross section of the spray, as seen in Figure 3.9. The droplet r a t e
measured in the center of each 4 rnm2 g r i d sector was assumed t o represent
the average droplet ra te through the ent i re sector. The ra t io of Ap t o the
Sector area (A!) was equal t o the ra t io of measured drop r a t e (Np,i) t o the

I
I
I
SPRAY CROSS SECTION
PROBE AREA (Ap)
A i (2x2mm)
Figure 3.9 Schematic Diagram of Grid Measurement Pattern for Spray Characterlzatlon and Probe A r e a Calibration Procedures

0.3
n N E E C w cy U w 0 cy L
Y
m
0 20 40 ' 60
DROPLET DIAMETER (Vm)
80
Figure 3.10 Effect of Droplet Diameter on the Effect ive Probe Area f o r N-Heptane and Methanol Sprays

34
to ta l droplet ra te ( N i ) t raversing Ai. From conservation of droplets, the
sum of Ni over the entire spray was equal t o the droplet generation r a t e ( fd ) .
Therefore, the probe area was calculated by:
These values were then used in Equations 3-2 and 3-4 t o calculate the
spray number densities. Measured values of the probe area a r e shown as a
function of droplet diameter and fuel type in Figure 3.10. As seen, the probe
area var ied f rom about 0.03 t o 0.23 mm2, increasing with increasing droplet
diameter. This was expected, since the intensity of scattered l ight increases
with the diameter of the scattering part ic le squared.
3.2.4 A i r and Droolet Velocity
For di lute sprays, such as those used in this study, it can be assumed
that the fuel droplets have a negligible effect on the a i r f low (Faeth, 1979).
Therefore, axial and radial a i r velocity prof i les were measured in i t ia l l y ove?
the ent i re range of a i r f low conditions and applied t o a l l spray conditions
tested in this study.
Mean a i r velocit ies were measured with the LDV using the smal lest
droplets attainable (17 u m initial droplet diameter) as the f low seed. Some
lustiffcation for thts i s required, as a 17 um part ic le may seem too large t o
fo l low the a i r flow. Figure 3.11 shows the effect of droplet size on droplet
ve loc i ty over the range of a i r f low rates used in the study. These data were
taken fo r n-heptane sprays a t the centerline of the test section a t an axial
distance IO cm downstream of the dispersion ori f ice. As seen, the droplet
velocit ies asymptotical ly approached a constant value as the in i t ia l droplet

diameter decreased below 24 um. Thts indicates that the smal ler droplet-$
have relaxed t o the a i r ve loc i ty and can be used with the LUV t o measure air
velocities. It also indicates that the l a rge r droplets (above 24 urn ) a r e
t ravel l ing faster than the a i r a t th is location in the tes t section. To fu r ther
i l l us t ra te the difference in ve loc i ty between the droplets and the a i r in the
sprays, Figure 3.12 compares axial velocity prof i les of 17 and 70 u m init ial
diameter droplets as they proceed downstream f r o m the dispersion or i f i ce
along the test section center l ine ( reca l l that the 17 u m droplets a r e
following the air veloci ty) . Because the 70 Um droplets a re exiting f r o m a
larger diameter fuel or i f ice, they s ta r t out more s lowly than the smal le r
droplets. Fur ther downstream however, the l a rge r droplets maintain a
higher veloci ty due t o the i r inert ia, while the ve loc i ty of the smal le r droplets
and air relaxes more quickly. Therefore, by the t ime the spray has reached
the ignition electrodes, the l a rge r droplets a re t ravel ing faster than the air.
Droplet Reynolds numbers in the sprays, based on the droplet diameter and
sl ip velocity, ranged f r o m 0.1-1 .O, increasing with increasing droplet
dia met e r . Typical prof i les of the radial var iat ion of mean a i r and droplet veloci t ies
across the test sect ion a r e shown in Figure 3.13. The droplet prof i les were
measured 10 cm ax ia l ly downstream fo r methanol sprays with an overa l l
equivalence ra t io of 0.7 and init ial droplet diameters of 35, 50 and 65 p m .
Notice that both the air and droplet prof i les a re re la t i ve ly constant across
the center of the test section and t a i l o f f towards the edge. Again, the
increase in droplet veloci ty with increasing size i s c lea r l y seen. It should be
noted that the methanol sprays genera l ly had higher droplet velocities than
the n-heptane sprays. This is because methanol requi red roughly double the
fuel f low ra te of n-heptane t o achieve the same equivalence ratio, as

36
0.8 - P
N-HEPTANE-CENTER11 NE
0.6 -
0.4 -
0.2 I I I - .-
0 20 40 60 80
INITIAL DROP DIAMETER (pm)
0 5300 3300 2300
4 1300
Figure 3.11 Effect of in i t ia l Droplet Diameter on Mean Droplet Velocity f o r N-Heptane Sprays of Varying T o t a l A i r Flow Rates ( z = 10 cm)

n QD
t 4
0 U a
a
\ E Y
0 0
100
10
1
I I
0 5 10 15
AXIAL DISTANCE (cm)
Figure 3. 12 Axial Prof i les of Mean Droplet Velocity f o r 17 and 70 )Im Ini t ia l Droplet Diameter Methanol Sprays (0, = 1.27; r = 0 m m )
Do0 0 t7 m 70

38
I
1.00 METHANOL; 00=0.7; z= 1 Ocm
1
0.00 ! I I 1
0 2 4 6 8
RADIAL DISTANCE (mm)
Figure 3.13 Radial P r o f i l e s of Mean Droplet and Air Velocity for Methanol Sprays of Varying Initial Droplet Diameter (00 = 0.7; z = 10 cm)
A 65 50 35
X AIR

discussed previously. These higher fuel f low rates meant higher o r r f i c e exi t
velocities for the methanol droplets, which resul ted in higher veloci t ies
downstream. It should also be noted that conservation of mass was obtained
upon integrating the a i r ve loc i ty prof i les across the section f o r a l l cases
tested.
RMS velocities were measured using the LDV system and converted t o
turbulent lntenstty by dlvidlng by the mean veloci ty. Values of turbulent
intensity fo r the droplet velocities ranged f rom 20-25 X at the center of the
sprays ( r = 0-5 mm) and increased s l ight ly towards the edges. In general,
the turbulent intensity of the droplet velocities increased with decreasing
velocity and decreasing droplet size.
3.3 DroD l e t S i z e Measu rement
3.3.1 ProDlet Si7ina Svstem
A Fraunhofer di f f ract ion technique, based on a method developed by
Dobbins et a l . (1963) fo r polydisperse sprays, was used t o measure the
diameter of the droplets at the spark gap. A schematic of the droplet sizing
system is given in Figure 3.14, and the method i s described as follows. A
coll imated He-Ne laser beam was passed through the sprays, and the l ight
d i f f racted by the droplets was focused by a 200 mm focal length col lect ing
lens onto a photographic plate. I f the di f f ract ing droplets were monosized,
the di f f racted l ight appeared as a ser ies of alternating l ight and dark
concentric r ings known as an A i r y o r Fraunhofer d i f f ract ion pat tern (Dobbins
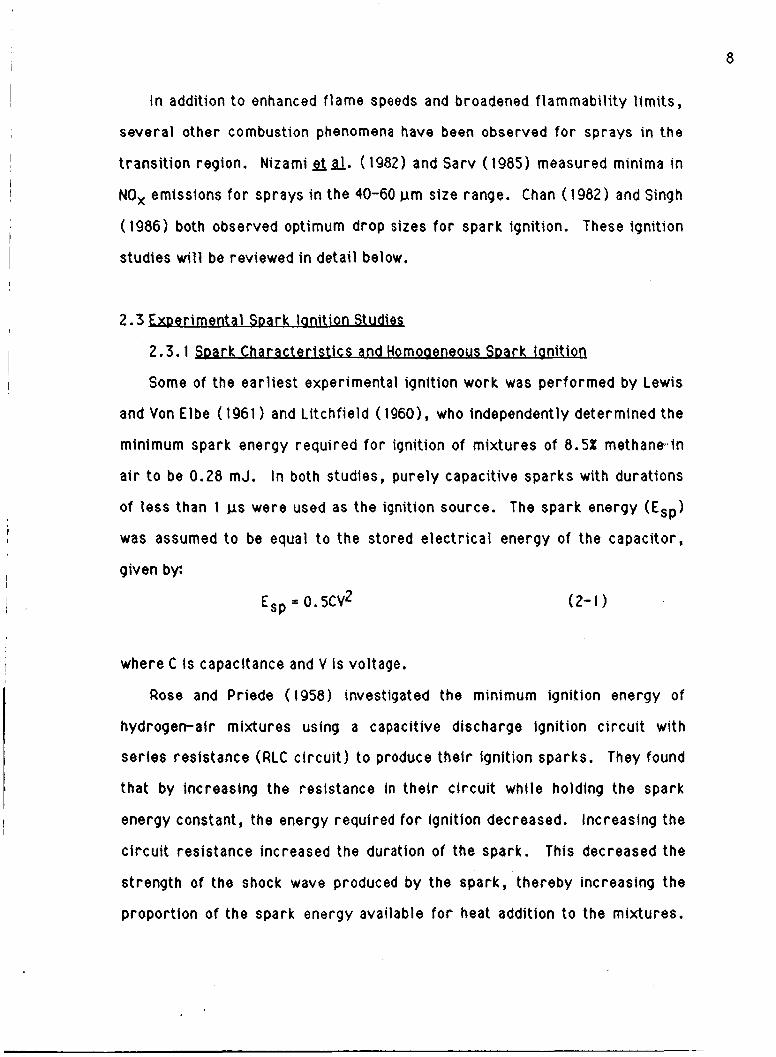
& A., 1963). A photograph of the di f f ract ion pat tern produced by a 50 u m
methanol spray is shown in Figure 3.15. The br ight center of the pat tern i s
due to the incident laser beam. Four sets of dark and l ight d i f f ract ion r ings
are c lear ly v is ib le around the center. The intensity of the br ight r ings

SPATIAL FILTER
PLANO-CONVEX LENS
COLLl MATE D BEAM
PLANO-CONVEX LENS
PHOTOGRAPHIC +-r PLANE
Figure 3.14 Schematic Diagram of the Droplet Sizing Apparatus
I
Figure 3.15 Photograph of a Fraunhofer Dlffractlon Pattern produced by a 50 urn Methanol Spray

42
decreased rad ia l ly outward, so there were actually several sets of la rger
r ings not observed due to the resolution of the f i lm. The s i z e o f the s p r a y
droplets was obtained by measuring the rad i i of these l ight and dark rings,
based on t h e fol lowing analysis.
The radial intensity distr ibution of a Fraunhofer di f f ract ion pattern in the
focal plane of the col lect ing lens i s given by (Dobbins et al . , 1963):
where I(e)/l(O) i s the rat io of the intensity of d i f f racted l ight at angle 8 t o
the incident l ight intensity. Jl i s a Bessel function of the f i r s t kind. a i s the
par t i c le size number given by: 0 = nD/A, where D i s the diameter of the
di f f ract ing droplets and A i s the light wavelength (0.6328 u m ) . The
col lect ing lens t ransforms the angular di f f ract ion informat ion to a radial
coordinate system (with the smal l angle approximation) by the fol lowing
relation: s ine= 8 r/f, where r is the radius on the focal plane of the lens o f
the l ight d i f f racted a t an angle 8, and f i s the focal length of the lens. This
al lows dl to be expressed as:
d = nDr/fl (3-7)
The dark r ings in the di f f ract ion patterns occur when the di f f racted l ight
i s zero, o r a t zeros of the Bessel function J1 (a). These zeros occur a t ai3 =
3.83, 7.02, 10.17, 13.32, 16.4, etc. The diameter of the di f f ract ing
droplets was d i rec t l y determined by measuring the radius of the center of the
dark r ings and using the values of the Bessel function zeros above with
Equation 3-7. The resul t ing equation for the droplet diameter is:

I D = Bikf/nri ( 3-8 1 I
~
where B i i s the i ' th zero of the Bessel function and ri i s the radius of the
center of the i ' th dark ring. It can also be shown that the br ight r ings
correspond t o the zeros of a second Bessel function J*(oL8), occuring a t a0 =
5.14, 8.42, 11.62, 14.8, 17.96, etc. Therefore, the diameter of the spray
droplets could also be determined with Equation 3-8 by measuring the radius
1 I
of the l ight r ings and using the zeros of Jz(OL8).
The to ta l number of r ings measured fo r any given d i f f ract ion pat tern
varied f r o m 4 t o 8, increasing with increasing droplet diameter. The
uncertainty in th is droplet sizing technique was f 1 % , based on the var ia t ion
in droplet diameter f r o m mult ip le r ing measurements.
Using th is method, the droplet diameter a t the spark gap (Dg) was
measured f o r each of the sprays tested in th is study. Representative
photographs of the d i f f ract ion patterns obtained fo r the ent i re range o f fuel
and droplet size sprays tested a re given in Appendix A. Comprehensive
droplet sizing resu l ts a re given in the next chapter in Tables 4.2 and 4.3.
For a given fuel and droplet size spray, there was less than 5% var ia t ion in
the measured spark gap droplet diameter over the ent i re range of
equivalence ratios.
Figure 3.16 shows the axial var ia t ion in droplet diameter f o r methanol
and n-heptane sprays of 50 urn in i t ia l droplet diameter and overa l l
equivalence ra t io of 1.0. The n-heptane droplets evaporated faster due t o
their greater vo lat i l i ty . The n-heptane sprays also had lower droplet
velocities than the methanol sprays, as discussed in the previous section.
This meant longer residence t imes between generation and ignition, which
also led to enhanced evaporation.

44 I
48 n E
ey W I=
U
46 E I
44 n t ml Q 0 91: 42 n
Do = 50 urn
I I I I
0 2 4 6 8 10 12
AXIAL DISTANCE (cm)
Figure 3.16 Axial Variation i n Droplet Diameter f o r 50 u m Ini t ia l Droplet Diameter N-Heptane and Methanol Sprays (r = 0 mm)
0 METHANOC m N-HEPTANE

Droplet s i ze measurements were per formed a t the center l ine of the test
section. Since the droplet sizing technique made a line of sight average
through the ent i re spray, no effect of radial position was expected. This was
confirmed by measuring the drop size of a 50 u m n-heptane spray a t th ree
different radial positions ( -4 , 0 and 4 mm). The measured values were a l l
within 1 %.
3.3.2 Extent of PrevaDorization
The amount of evaporated fuel present in a spray i s a c r i t i ca l factor in
ignition (Bal la l and Lefebvre, 1976). Increasing the extent of
prevaporitat ion not only decreases the energy requi red t o evaporate the fuel
droplets in the spark kernel, it a lso increases the ra te of propagation, o r
growth, of the kernel into the unburned mixture. Therefore, an accurate
measure of the extent of prevaporization was necessary f o r the sprays tested
in th is study.
The extent of prevaporization (Q) was defined as the ra t io of the mass of
evaporated fuel t o the mass of to ta l fuel present. For the prevaporized,
premixed cases, Q was equal t o one. For the sprays, Q was determined a t
the spark gap based on the initial droplet diameter and the measured droplet
diameter at the spark gap. Values of Q a re presented in the next chapter in
Tables 4 . 2 and 4.3 f o r the sprays tested. 0 was kept re la t i ve ly constant
(within 5 % ) f o r each fuel. This was done by varying the axial location of the
ignition electrodes. For example, the smal le r droplet size sprays, which
evaporated more quickly, were ignited a t a t smal le r axial distance
downst ream.

t
t
f
3.4 S tway lanition
3.4.1 SDark Generation System
Ignition sparks were del ivered t o the sprays by electrodes which
protruded into the test section a t axial distances 7.5, 10 and 12.5 crn below
the dispersion or i f ice. The electrodes were placed with the i r axes normal t o
the spray direction, and were mounted on a micrometer t ravers ing assembly
which was used t o adjust the spark gap width. The electrodes were 5 mm
diameter stainless steel rods, with the spark producing ends machined t o t ips
of 1 mm diameter and 6 mm length. The high voltage side electrode t i p was
pointed while the ground side t ip was f la t , as seen in Figure 3.17. The t ips
were bent upward approximately 15 ' to prevent accumulation o f fuel droplets
on them.
A capacitive discharge spark generation system produced the ignition
sparks a t the electrodes. The system was designed t o provide independent
contro l of the energy and duration of individual sparks, and consisted of a
modified RC c i rcu i t as shown in Figure 3.18.
Sparks were generated in the fol lowing manner. The capacitor
(0.5-50nF) was charged to 20 kV by closing the* charging switch fo r 2
seconds. The charging switch was then opened. The spark was generated
immediately af terward by closing the discharge switch, which caused the
capacitor t o discharge through the resistor (1-1000 k Q ) and across the
electrode'gap to ground. The two switches were high voltage solenoid
switches, and were control led by timing re lays which allowed repeti t ion of
the charge/discharge cycle. The time interval between sparks could be
var ied f rom 3-15 seconds. The charging res is tor was used to l im i t the
current during charging, while the shunt res is tor provided an al ternat ive
path t o ground in cases where the dlscharging current could not jump the

I
5 mm
1 1 m m
Figure 3.17 Ignition E l e c t r o d e Tip Configuration

48
15 ~n CHARGING RES I STOR
0-30 KV
1 0.05-50 nF CAPACITOR
1-1 000 KO RES I STO R
DC POWER SUPPLY
LVOLTAGE
DISCHARGE \ 3 MI1 SWITCH SHUNT
RE SI STO R
PROBE -
ELECTRODES
CURRENT PROBE t
Figure 3.18 Schematic Diagram of the Spark Generation Circuit

spark gap. I The spark energy and duration were determined by the values of the
capacitor and the res is tor in the c i rcu i t . To measure the spark energy and i duration, a high voltage probe was connected across the electrodes, and an 1 inductive current probe was attached to the ground-side electrode. The
resulting voltage and current t races of the spark were recorded on a two
channel digital storage oscilloscope. Voltage, current and energy t races fo r
a typical spark a r e shown in Figure 3.19. As seen, a f ter the initial spike of
the breakdown voltage, the spark voltage was re la t ive ly constant throughout
the spark duration, while the spark current and energy decayed
exponentially. The energy of a given spark was determined from:
where V is voltage, 1 i s current, t i s t ime. The spark duration, t, was taken
as the t ime required fo r the spark current t o decay to 5% of i t s initial value.
A series of cal ibrat ion measurements was per formed t o determine the
spark energy levels of the system described above. This spark energy
calibration procedure was done over a wide range of spark gap widths (2-8
mm) and capacitance (0.1-50 nF) fo r three discreet values of spark duration
(30, 60 and 100 us). These durations were chosen to cover the range of
optimum spark durations observed by previous researchers for s im i la r spray
conditions, including Rao and Lefebvre ( 19761, Bal la l and Lefebvre ( 1978)
and Chan and Polymeropoulos (1982). Typical resul ts of these cal ibrat ion
measurements a re given in Figure 3.20, which shows spark energy as a
function of spark gap width fo r the range of capacitors and a duration of 60
us. Each data point i s the resu l t of two sets of 15 spark energy

50
i
Lu (3
0
>
a 3
I- z Lu
U 3
0
a
z (3
W z
W
a
TIME
Figure 3.19 Typical Voltage, Current and Energy Traces of Ignition Sparks

W c3 PL W z W
10:
1 -
1 OUR = 60 vs
I I I I _ - 0 2 4 6 a lo
SPARK GAP WIDTH (mm)
co
0 50 4 20
IO 0 5 8 2 0 1
0.5 A 0.2 B 0.1
Figure 3.20 Effect of Spark Gap Width on Spark Energy fo r Varying Capacitor Values (Spark Duration = 60 us)

52
I
t
measurements, taken on separate days. The standard deviation of each set
of 15 measurements was less than 10% of the mean, while the day t o day
var iat ion in the mean spark energy values was less than 5%. As seen in
Figure 3.20, the spark energy var ied logarithmical ly with the spark gap width
f o r a given capacitance, which i s seen as a l inear relationship on the
semi-log plots shown. This calibration procedure was per formed in a i r , but
it was subsequently observed that the composition of the mixture in the spark
gap affected the measured spark energies by al ter ing the resistance of the
spark gap. Therefore, spark energy levels were measured f o r each
individual ignition case studied, as wi l l be described in the following section.
3.4.2 Minimum lanition Enerav Measurement
Spark ignition i s a probabi l is t ic phenomenon, as was discussed in Chapter
2 . No sharp boundary was observed between spark energies which ignited a
given mixture and those which did not. Rather, a range of spark energies was
seen fo r which increasing, the spark energy resul ted in an increasing
probabi l i ty o r frequency of ignition. A n example of th is i s given in Figure
3.21, which shows the effect of spark energy on ignition frequency* for an
n-heptane spray (@,=O.88, D9=41 u m ) . Notice that the ignition
frequencyrose sharp ly in i t ia l ly , then ta i led of f as it assymptotical ly
approached an ignition frequency of 1 .O (100%). Similar behavior was
observed f o r a l l of the spray and prevaporized ignition cases studied.
* The t e r m 'ignition frequency' was employed based on previous usage in
the l i terature. It should be noted, however, that this quantity i s not a t r u e
frequency, but represents the incidence o r probabi l i ty of ignition.

0 2 W
U W Qc LL
a
1 .O
0.5
0.0
/ N-HEPTANE; D=53; 0 ~ 0 . 7 8
/
I I I 1 .
. I 1 ' 10 100
SPARK ENERGY (mJ)
Figure 3.21 Effect of Spark Energy on Ignition Frequency f o r an N-Heptane Spray ( D = 53 pm; 0 = 0.78; z = 12.5 c m )

I
54
Each point in Figure 3.21 was the resu l t of ignition observations and
spark energy measurements f o r one set of 50 single sparks. The interval
between sparks var ied f rom 5 t o 20 seconds, increasing with decreasing
equivalence rat io. This in te rva l was always sufficient t o al low the
temperature and spray conditions in the test section t o return t o normal a f ter
a successful ignition. The cr i ter ion f o r ignition was that a v is ib le f lame
propagate a t least 5 cm into the mixture. The spark energy was measured
simultaneously with the ignition observations and averaged fo r 20 of the 50
sparks, as described in the previous section. A minimum of two sets of 50
sparks was done at each energy level. 'The values of spark energy and
ignition frequency f o r both sets were within 7% of the mean fo r a l l cases
studied.
The minimum ignition energy (Emin) was defined as the spark energy
leve l which produced an ignition frequency of 0.5 (50% ignition), as shown in
Figure 3.21. The 50% level was chosen t o account f o r the probabil istic
ef fects of ignition, as w i l l be described in Chapter 5. The uncertainty in Emin
was calculated f rom the 95% confidence in terva ls of repeated sets of spark
energy and ignition frequency measurements and found t o be f 10%.
3.4.3 $Dark Parameter ODtimization
The ignition frequency curve shown in Figure 3.2 1 was obtained with fixed
values of spark gap width and spark duration. As discussed in Chapter 2 ,
both of these parameters affect ignition. I f the spark gap width i s too smal l ,
excessive heat i s lost t o the electrodes through conduction. I f i t i s too
large, the spark kernel becomes la rge r than necessary f o r ignition,
resul t ing in excessive heat lost to the surrounding mixture through
convection. I f the spark duration i s too short , excessive energy i s lost in the

accompanying shock wave, whose strength increases with decreasing spark
duration. If the duration i s too long, spark energy i s s t i l l being input a f ter
ignition has occurred, resul t ing in convection losses t o the mixture.
Therefore, optimization of these spark parameters involves minimizing
energy losses and must be done t o obtain the lowest possible minimum
ignition energy for each ignition case studied.
The procedure used t o optimize the spark duration and gap width f o r a
given spray case was as follows. The spark energy leve l (capacitor) which
produced ignition frequencies in the 40% t o 60% range was determined. With
this capacitor, one set of 50 sparks was per formed a t each of th ree durations
(30, 60 and 100 us) over a range of gap widths. Start ing a t a smal l value,
the gap width was increased in steps of 1 mm. For a given duration, the
ignition frequency increased with increasing gap width, reached some
maximum, then decreased. This was repeated f o r a la rger ( o r sma l le r )
capacitor in order t o obtain ignition frequencies both above and below 50%.
The optimum values of duration and gap width were then easi ly determined as
those which resul ted in the lowest 50% energy. For cases where the optimum
duration was 30 o r 100 us, durations of 15 and 200 us respectively were
tested t o confirm an optimum value.

I
I
CHAPTER 4
g
The effects of droplet size, equivalence ra t io and fuel propert ies on the
minimum ignit ion energy of n-heptane and methanol sprays are reported i n
th is chapter. Ignition energy resul ts fo r prevaporized n-heptane and
methanol mixtures a r e a lso reported t o represent the lower l imi t of droplet
size. Valuable insight in to the ignition phenomenon i s gained by comparing
the spray and prevaporized resul ts as a function of both equivalence r a t i o and
droplet diameter.
4.1 Sprav lani t ion
4.1 .1 O w r a t ina Conditions
The generation parameters and flow rates used to produce the n-heptane
and methanol sprays ignited in this study are l is ted in Table 4 . 1 . Also
included are initial droplet diameters and overa l l equivalence rat ios. As
seen, air f low rates f o r the methanol and n-heptane sprays were s imi lar , but
methanol sprays required roughly double the fuel f low rates t o achieve the
same range of stoichiometry because of the fuel bound oxygen. For a given
fuel and drop size spray, the dispersion a i r f low ra te was set just high
enough to adequately disperse the droplets. For a given drop s ize spray, the
equivalence rat io was var ied by adjusting the di lut ion a i r f low rate.

00 O f (cc /m) 1.04 0.18 0.78 0.52 0.39
. . . 00 Qf (cc /m) 1.26 0.19 0.94 0.75 0.55 0.35
.
00 Qf (cc /m) 1.27 0.19 0.92 0.72 0.50 0.34
. . . .
00 Q f (cc/rn) 1 .oo 0.35 0.80 0.67 0.50
. . 00 Qf (cc /m) 1.04 0.37 0.84 0.60 0.42 0.30
. . . . 00 Qf (cc/rn) 1.17 0.38 0.92 0.66 0.44 0.31
. s . .
FUEL: N-HEPTANE Do = 40 urn
fd (kHz1 0 (urn) 89.6 17 . . . . . .
Do = 50 urn fd (kHz1 0 ( u m )
48.4 22 .
Do 5 65 urn fd (kHz) 0 ( u m )
22.0 27 . . . . . FUEL: HETHANOL
Do = 35 urn fd (kHz1 0 (urn)
260.0 17 . . . . . Do = 50 u m
fd (kHz1 0 (urn) 22 . . . 94.3
. . . Do = 65 urn
fd (kHz1 0 (Urn) 43.6 27 . . . . .
Qadis(cc/m) Qadi l (cc /m) 1000 500
1000 2000 3000
. . . Qadls(cc/m) Qadi l (cc /m)
1300 0 . 4 50 900 1700 3400
.
Qadis(cc/m) Qadi1 (cc /m) 1300 0 . 500
1000 2000 3500
. . .
Qadis(cc/m) Qadi l (cc /m) 1500 0 . 500
1000 2000
. . Qadis( cc/m) Qadi l ( cc /m)
1500 0 500 1500 3000 5000
. . Qadis(cc/m) Qadi l ( cc/m)
I300 0 500 1500 3000 5000
.
T a b l e 4.1 S p r a y G e n e r a t i o n P a r a m e t e r s a n d O p e r a t i n g Condi t ions

58
I
Tables 4.2 and 4.3 contain values of the relevant spray parameters
t
measured a t the spark gap, a s described in Chapter 3, for n-heptane and
methanol sprays, respectively. Also included are the optimized ignit ion
parameters and measured minimum ignition energies, which w i l l be discussed
in the next section.
While the tables a re straightforward, several points should be noted.
The axial location ( z ) of the ignition electrodes was var ied as a function of
droplet size, with the smal lest sprays being ignited a t the smal lest axial
distance. This was done fo r several reasons. The smal lest droplets (30 and
33 g m ) spread t o a greater degree than the la rger droplets as they
progressed downstream. This resulted in droplet impaction, beginning about
10 c m downstream, on the test section walls. To solve tMs problem, the
ignit ion electrodes were moved upward t o an axial location of 7.5 cm where
the sprays just f i l l ed the test section with no impaction. Conversely, the
largest sprays (53 and 57 um) did not spread suff ic ient ly by the t ime they
had reached 10 cm downstream. For these la rger droplets the electrodes
were moved to 12.5 cm where the sprays were more uni form across the test
section. This var iat ion In electrode positioning also had the effect of
minimizing the dif ference in the extent of prevaporization between the
di f ferent sized sprays. This resulted in values of 0 within 5% f o r a given
fuel.
All sprays were generated with l iquid fuel and a i r a t 20 'C. The
temperatures l is ted in Tables 4.2 and 4.3 were measured a t the spark gap
with a type K thermocouple and represent a bulk spray temperature.
N-heptane sprays temperatures ranged f rom 8 t o 10 'C whi le methanol spray
temperatures ranged f rom - 1 t o 2 'C. The methanol sprays had lower
temperatures because of methanol's higher latent heat of vaporization.

W
2
c
a
W c
W r U a z 0
U a
a a
cn a c3
E w
n
E E Y
NM
co
b
n
cn a
0
uoooo
www,
a 3
P
n
u ' o
oc
na
u--
n
3
n
3
n
cn a a
a
~00000
cow
ww
co
P
c
E-
W
n
E E U
NN
M*
b
n
0 a wooooo
cowlD
wE
l a
n
3
0
C
0
C
0
P
N
L
a3 u
0 L
0<
c
u
x
0
L a
v)
.C
U
.C
- cv d
a3
0
I- c
n

n
7
I E
~O
cu
IO
cu
....
ti a W
C-
--
-M
W
- E E W
n
n
E E u
wo
m(
D
E
4 (3
n
cn n
n
ta
a uoooo
(D
aw
2
a
a
P
c
0 c
P
4
0 z
S
c
w
x a ID
W 1
L
n
V . c
u-
00
t
Y
n
u ' O
OO
';-T
Y
c
x
W
L
m
n
W c
wo
am
o-
&
)mm
fi*o
=
oo
oo
-
..... .e
rb
bO
O(v
&
)ro
aa
-- aooo--
.....
c- .....
Yo
oo
oo
li
(D
N>
II >" n
N
*; ?~M0(000
0~
0m
wC
n-
ll"0
00
0-
.....
E E
E

Greater heat transfer f rom the surrounding air to the droplet was required
for evaporation, lowering the spray temperature. Both the lower spray
temperatures and the higher latent heat decreased the vo la t i l i t y of t he
methanol sprays, resul t ing i n the i r lower extent of prevaporization compared
t o n-heptane sprays.
Mean values of the spray number density a t the spark gap var ied f rom
0.5-4.1 mm-3 fo r n-heptane sprays and 1 .O-13 mm-3 f o r methanol sprays,
increasing with increasing equivalence ra t io and decreasing droplet size.
Mean values of the interdroplet spacing a t the spark gap var ied f rom 20-32
droplet diameters fo r n-heptane sprays and 15-25 droplet diameters fo r
methanol sprays, increasing with decreasing equivalence ra t io and
decreasing droplet size.
4.1.2 Soa r k Duration and Gao Width
Minimum ignition energies were measured at optimum values of the spark
duration and spark gap width fo r each spray tested, as described in Section
3.5.3. These optimum values a re l is ted in Tables 4.2 and 4.3. Optimum
values of both the spark duration and gap width decreased with Increasing
equivalence rat io. Optimum durations ranged f rom 60 to 100 11s f o r both
n-heptane and methanol sprays. Optimum gap widths ranged f rom 2-7 mm
for n-heptane sprays and 4-8 mm fo r methanol sprays. These values are in
the same range found by previous researchers in s imi la r studies (Rao and
Lefebvre, 1976; B a l l a l and Lefebvre, 1978; Chan, 1982; and Singh, 1986).
Varying the spark gap width was found to have a large effect on €,In,
while varying the spark duratlon had l i t t l e effect. Figure 4.1 shows the
effect of spark gap width and duration on the minimum ignit ion energy of a 41
flm n-heptane spray with an equivalence ra t io of 0.69. As seen, varying the

62
W cp PL W 2 W
~
z 0
~
I c z tD m I - c
3 r ... I I I z I - I r
i a
1 1
N-HEPTANE; D = 4 1 ~ m ; 0=0.69
I I I I I
2 3 4 5 6
SPARK GAP WIDTH (mm)
DUR' (US) 0 30
60 loo
7
Figure 4.1 Effect of Spark Gap Width and Spark Duration on the Minimum ignition Energy of an N-Heptane Spray (D = 41 urn; 0 = 0.69; z = 10 cm)

gap width f rom 2 t o 6 mm had a pronounced effect on Emin, with an optimum
value o f 4 mm c lear ly evident f o r each duration. Varying the spark duration
f rom 30 t o 100 11s had a lesser effect on Emin, but an optimum duration of 60
11s was evident. Simi lar behavior was observed fo r a l l of the sprays tested.
~
I
I
I
I 4.1.3 E f f e c t o f DroDlet Size and Eauivalence Ratio I The var iat ion in ignit ion frequency with spark energy was determined as
described previously f o r the sprays l is ted in Tables 4.2 and 4.3 . Figure 4.2
shows typical ignit ion frequency curves fo r 56 u m n-heptane sprays ranging
in equivalence ra t io f r o m 0.59 t o 1.80. Notice that as 0 decreased f r o m r i ch
t o lean, the curves became less ver t i ca l and began to t a i l off towards higher
spark energies as they approached 100% ignition. Simi lar behavior was
observed fo r a l l cases tested. Ignition frequency curves fo r a l l cases are
shown in Appendix A.
The minimum ignit ion energy (Emin = SO% ignition) was determined f rom
these ignit ion frequency curves as described in Section 3.5.2. The effect of
equivalence ra t io and droplet diameter on Eminsis shown in Figure 4.3 fo r
n-heptane and methanol sprays. As can be seen, both. sets of curves a re
very s imi lar qual i tat ively. For a given droplet size and fuel spray, Emin
decreased sharply with increasing lean equivalence rat io, but began to level
off as the sprays became r lcher. Emin continual ly decreased with increasing
equivalence ra t io and no optimum value of equivalence ra t io fo r ignit ion was
observed fo r any of the sprays tested. The lean ignit ion l im i t was determined
to be about 0 = 0.4 f o r both n-heptane and methanol sprays. For any given
equivalence ra t io and fuel spray, Emin decreased with decreasing droplet
size.
Slmi lar behavior of Emin wlth respect t o droplet size and equivalence
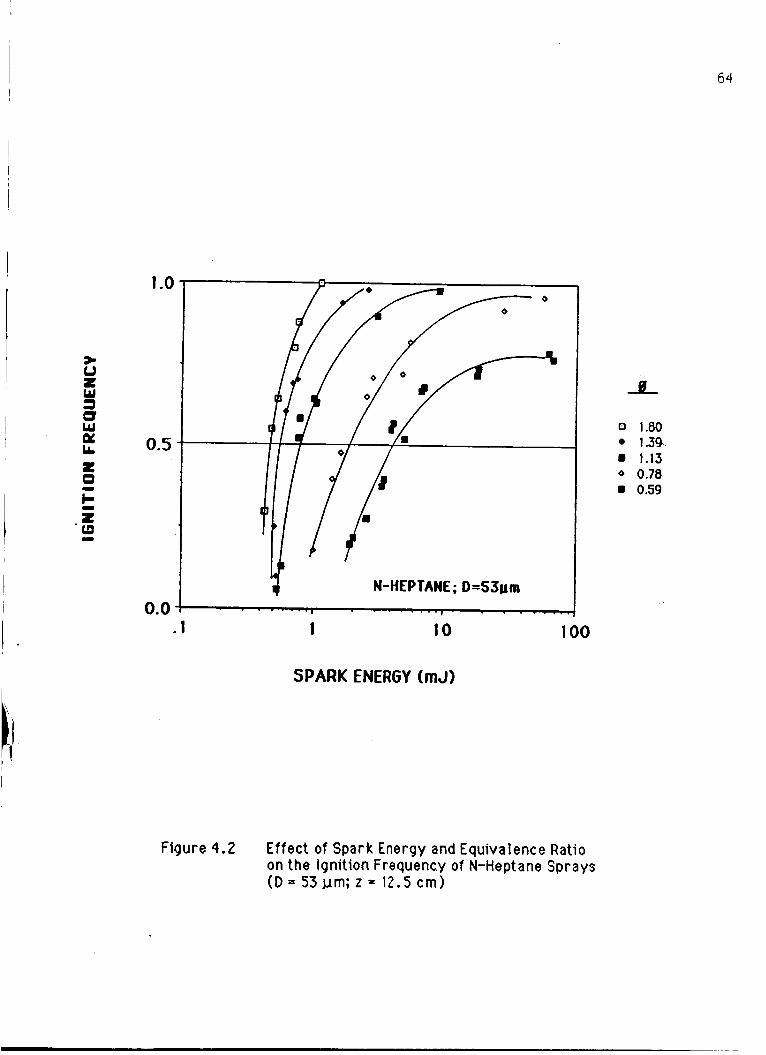
64
0.0 .
1.0 i
I 1
u z
I .
11 ,
- w 3 U w u L 0.5
. I 1 IO 100
SPARK ENERGY (mJ)
L
0 1.80 1.39. 1.13
0 0.78 8 0.59
Figure 4.2 Effect of Spark Energy and Equivalence Ratio on the Ignition Frequency of N-Heptane Sprays (D = 53 um; z = 12.5 cm)

.
+
N-HEPTANE
. I 1
10:
1 -
0.0 0.5 1 .o 1.5 2.0 €QUI VALENCE RATIO
7- l oo tlETHANOL
10:
1
0.0 0.5 1 .o 1.5 EQUl VALENCE RATIO
2.0
8 a 0
53 41 33
W 57
a 44 0 30
Figure 4 .3 Effect of Equivalence Ratio and Droplet Diameter on the Minimum Ignition Energy of N-Heptane and Methanol Sprays

66
ra t i o has been observed in previous ignition studies with sprays in the same
size range (Rao and Lefebvre, 1976; B a l l a l and Lefebvre, 1978 and 1981 1. The
decrease in Emin with decreasing droplet size and increasing equivalence
ra t i o can be explained as follows. For a given equivalence rat io, the smal le r
sprays had more to ta l surface area of fuel which decreased the t ime requi red
f o r the droplets t o vaporize and burn in the spark kernel. The la rge r
droplets took longer t o vaporize and burn in the spark gap, resul t ing in
energy losses t o the unburned mixture. Therefore, more ignition energy was
requi red fo r la rger droplet size sprays. For a given droplet size, increasing
the equivalence ra t io improved ignition by increasing the amount of fuel i n and
around the spark kernel. This effect became less pronounced as the sprays
became r icher .
4.1.4 Effec t of Fuel ProDertieS
As seen in Figures 4.3, the methanol sprays requi red roughly 3 t imes
more spark energy f o r ignition than the n-heptane sprays. This can be
explained by examining the re la t ive volat i l i t ies of the two fuels. Previous
researchers (Bal la l and Lefebvre, 1978; Peters and Mellor, 1980) have
shown that fuel vo la t i l i t y i s a cr i t ica l factor in spray ignition, with Emin
decreasing with increasing vo lat i l i ty . The vo la t i l i t y of the fuel in the spark
kerne l during ignition can be quantified in t e r m s of a combustion mass
t rans fer number (B) which may be defined as the ra t io o f the energy available
f o r evaporation t o the energy required f o r evaporation. Values of B (Kanury,
1975) were 5.82 and 2.70 f o r n-heptane and methanol, respectively.
N-heptane's higher vo lat i l i ty , more than twice methanol's, accounted in a
la rge par t f o r the better igni tabi l i ty of n-heptane sprays.
Increasing the extent of fuel prevaporization p r i o r t o ignition ( a ) has

also been shown to reduce ignition energy requirements (Bal la l and Lefebvre,
1981 ). Values of 0 f o r the methanol sprays were about 25% lower than f o r
the n-heptane sprays, as seen in Tables 4 .2 and 4 .3 . This difference in Q
also accounted in some par t for methanol's higher igni t ion energies. The
I
1
i I re lat ive importance of fuel prevaporization and vo la t i l i t y on ignition w i l l be
fur ther examined analyt ical ly in Chapter 5 .
Several differences between n-heptane and methanol combustion were
observed in the types of f lames produced by ignition. For v e r y lean cases (0
< 0.5) the n-heptane f lames were faint blue in co lor . As 0 increased beyond
0.5, they became a br ighter orange co lor . This indicated increasing soot
formation and oxidation. In fact, the soot had t o be cleaned f r o m the
electrodes often while testing n-heptane sprays. The methanol f lames were
a v e r y faint blue co lor at lean equivalence rat ios and became faint orange
with increasing 0, indicating v e r y l i t t l e sooting. This was confirmed by the
fact that the electrodes showed no soot accumulation during methanol
ignition.
4 .2 PrevaDorized lanition
4 .2 .1 . OPeratina Conditions
Ignition energy experiments were per formed on prevaporized, premixed
flowing n-heptane and methanol mix tures over the f u l l range of equivalence
ratios attainable. The fuel and a i r f low rates used t o produce these mixtures
are l is ted in Table 4 . 4 , along with the measured minimum ignition energies
and optimized spark parameters. The ignition electrodes were located 10 cm
downstream ax ia l ly f o r a l l prevaporized experiments. The mixture
temperatures at the spark gap were 25 'C f 1 f o r a l l cases. Equivalence
ratios higher than 3.0 could not be tested fo r n-heptane mixtures because of

68
tl IXTURE PARAMETERS: IGNITION PARAtlETERS:
N- HEPTANE
0 Q f (cc/m) Qa (cc/m) DUR (us) GAP ( m m ) Emin ( m J ) 0.6 0.19 2750 100 9 = 1000 .
2 538 60 8 20 2357 30 7 2.9
0.65 0.7 0.8 . 2062 30 6 0.70 0.9 . 1833 30 5 0.40 1 .o . 1650 30 4 0.34
< 0.2 1.5 1100 - - < 0.2 2.0 825 - -
2.5 . 660 30 4 0.43 3.0 550 30 7 2.0
.
. .
METHANOL
0 Of (cc/m) Qa (cc/m) DUR (us) GAP (mm) Emin (mJ) 0.6 0.38 3075 60 9 = 1000 . 0.65 2798 60 8 5.0 0.7 2559 30 * 5 0.93
0.75 2352 30 4 0.50 0.8 2171 30 3 0.34
0.85 2012 30 2 0.23
0.2
. . .
. 0.9 1870 30 2 0.20 1 .o 1628 - . -
Table 4.4 Prevaporlzed Mixture Generation Parameters and Operating Conditions

I
I I fuel condensation in the dispersion cup. For the same reason, equivalence
ratios above 1.0 could not be tested fo r methanol mixtures. However, the
range of prevaporized mixtures tested was sufficient t o provide a lower l im i t I I
(D = 0) fo r the study of droplet size effects on ignition.
4.2.2. $Dark DU ratlon and Gat3 Width
The optimum values of spark duration and gap width a re l is ted in Table
4.4 for prevaporized n-heptane and methanol mixtures. With the exception
of the v e r y lean cases (0 = 0.6 and 0.65) the optimum duration was 30 us f o r
a l l mixtures. These durations were shorter than the comparable spray
cases, which was expected since no t ime was required fo r fuel evaporation
during ignition. The optimum spark gap widths var ied f r o m 4-9 mm and 2-9
mm for n-heptane and methanol mixtures, respectively. These values were
comparable t o those observed fo r spray ignition. The effect of varying spark
duration and gap width on the minimum ignit ion energy of prevaporized
mixtures was also s imi lar t o the behavior observed and reported fo r sprays.
4.2.3. r f f e c t of Eauivalence Ratio
The procedure fo r measuring the minimum ignit ion energy of the
prevaporized mixtures was identical t o the one used fo r sprays. The ignit ion
frequency was determined as a function of spark energy and Emin was the
spark energy which produced 50% ignition. Ignition frequency curves fo r a l l
cases tested a r e presented in Figures 4.4, 4.5 and 4.6 fo r lean n-heptane,
r ich n-heptane and lean methanol mixtures, respectively. The prevaporized
ignition frequency curves were v e r y s imi lar in shape to those observed fo r
sprays.
For two of the lean cases (n-heptane and methanol, 0 = 0.6) Emin could

70
1 .o
0.5
0.0 . 1 1 10 100 1000
SPARK ENERGY (mJ)
Figure 4 .4 Effect of Spark Energy and Equivalence Ratio on the Ignition Frequency of Prevaporited, Premixed N-Heptane Under Fuel Lean and Stoichiometric Conditions
0 -
0 m . 5 5 + 0.6
0.65 0 0.7
0.8 0 0.9 4 1.0

1 .o
0.5
0.0 . I 1 10 100
SPARK ENERGY (mJ) 1000
f igure 4 . 5 Effect of Spark Energy and Equivalence Ratio on the Ignition Frequency of Prevaporized, Premixed N-Heptane Under Fuel Rich Conditions
0 0 0-2.5
3.0
-

72
0.0 '
t
I I I ._
1 .o
0.5' Qc LL
. 1 1 10 100 1000
SPARK ENERGY (mJ)
Figure 4.6 Effect of Spark Energy and Equivalence Ratio on the Ignition Frequency of Prevaporited, Premixed Methanol Under Fuel Lean Conditions
a 0=0.55 0.6
w 0.65 6 0.7
0.75 0 0.8 A 0.85 A 0.9

only be estimated because the highest spark energies attainable with the
ignition circui t , about 100 mJ, resul ted in ignit ion frequencies less than 50%.
Therefore only par t ia l ignit ion frequency curves were obtained. Emin was
estimated by extrapolating these par t ia l curves t o the 50% l ine based on the
shapes of the other curves. Emin was estimated t o be 1000 f 300 m J fo r both
cases. For three of the r icher cases (n-heptane, 0 = 1.5, 2.0 and
methanol, 0 = 1 .O) only an upper l imi t could be determined fo r Emin because
the lowest spark energies attainable, about 0.2 mJ, produced 100% ignition.
Emin i s reported as < 0.2 m J fo r these mixtures .
I
1 ,
The var iat ion in minimum ignit ion energy with equivalence ra t io i s shown
in Figure 4 .7 fo r prevaporized, premixed n-heptane and methanol. An
optimum equivalence ra t io fo r n-heptane ignition, between 0 = 1.5 and 0 =
2.0, i s evident f rom th is figure. This i s in v e r y good quali tat ive and
quantitative agreement with data presented by Lewis and Von Elbe (1961 1, who reported an optimum equivalence ra t io of about 1.8 corresponding t o a
minimum ignit ion energy of about 0.23 m J fo r prevaporized n-heptane. Rich
mixtures of methanol could not be tested due t o the condensation problem
mentioned previously, so no optimum equivalence ra t io fo r methanol was
observed. Prevaporized lean ignit ion l im i ts were observed a t equivalence
rat ios of 0.55 f o r n-heptane and 0.5 f o r methanol. -
4.2.4. Effect of Fuel Prooert ies
As seen in Figure 4 .7 , prevaporized methanol was easier t o ignite than
prevaporized n-heptane. This may seem t o contradict the spray resul ts,
which showed that n-heptane sprays were more ignitable. However, the
reason the methanol sprays were more di f f icul t t o ignite was because they
needed more spark energy fo r fuel vaporization due t o the i r lower vo lat i l i ty .
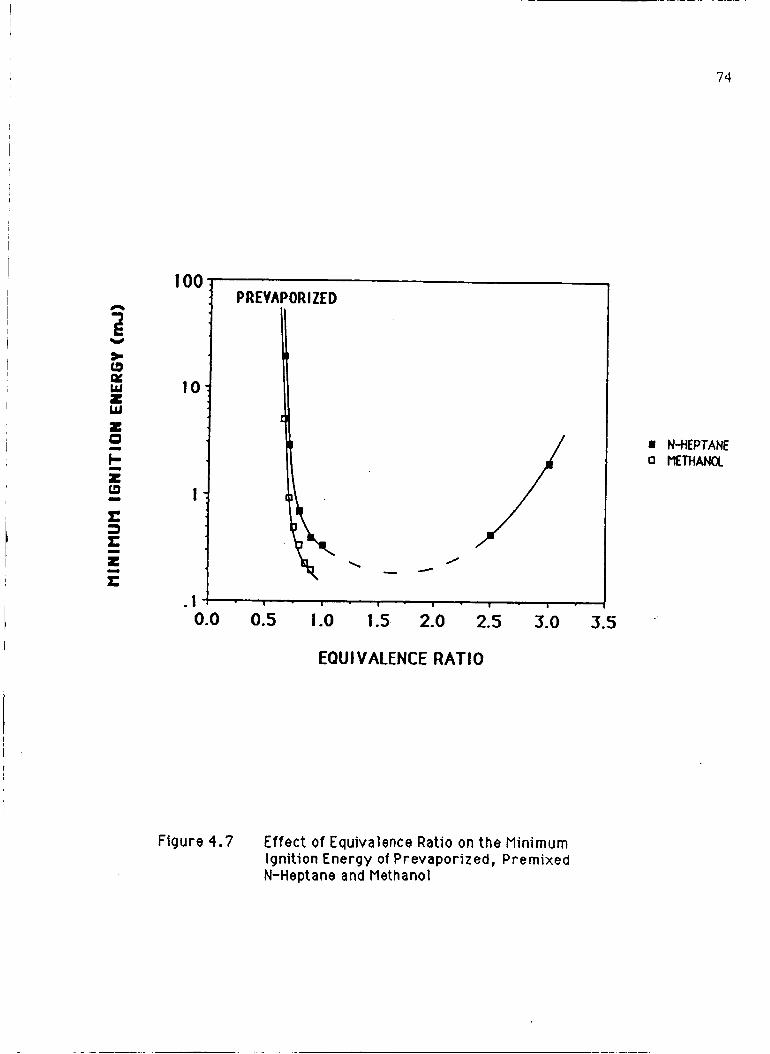
74
I
w 2 0 I- - - c
IO0 PREVAPORIZED
i . I -I 1 I I 1 1 I
0.0 0.5 1.0 1.5 2.0 2.5 3.0 3.5
EQU t VALENCE RATIO
NSIEPTANE 0 METHANOL
Figure 4.7 Effect of Equivalence Ratio on the Minimum Ignition Energy of Prevaporized, Premixed N-Heptane and Methanol

Volatllity i s not a factor in the prevaporized case, and activation energy IS
the c r i t i ca l fuel proper ty . Methanol has a lower activation energy than
n-heptane, 41.3 cal/gmol as opposed t o 60.5 cal/gmol (Kanury, 1975),
which accounted f o r i t s better igni tabi l i ty in the vapor state.
4.3 SDrav and PrevaRorized ComRarison
4.3.1. Extension of Lean lanition L im i t s
Figure 4.8 shows the spray and prevaporized ignition data plot ted
together fo r n-heptane and methanol. Extension of the prevaporized lean
ignition l imi t t o lower equivalence rat ios was evident f o r both n-heptane and
methanol sprays. This extension can be explained as fol lows. When the
ignition spark occurs, temperatures in the spark path reach several thousand
degrees Kelvin (Maly, 1978). Fuel droplets present in the immediate v ic in i ty
o f the spark vaporize and burn, along with the prevaporized fuel, t o f o r m the
spark kernel . Successful ignition occurs i f the spark kernel i s able t o
propagate into the unburned mixture surrounding it. In spray ignition, the
kernel i s surrounded by fuel droplets and a vaporized fue l la i r mix ture with a
range of equivalence ratios. Even a t lean overa l l gap equivalence rat ios,
localized regions that a r e r i cher and easier t o ignite exist around the
droplets. These regions of favorable stoichiometry accelerate the growth of
the spark kernel into the surrounding mixture. Thus, the presence of fuel
droplets enhances lean spray ignition. In contrast, prevaporized premixed
mixtures have a uni form distr ibut ion of fuel vapor, so kernel growth i s
l imi ted by the igni tabi l i ty of the stoichiometry being tested.
Simi lar extension of lean f lammabi l i ty l im i t s has been observed in
previous spray studies. For example, Burgoyne and Cohen (1954) found that
the f lammabil i ty l im i t s were extended leanward f o r t e t ra l i n sprays with

76
Y a * CD w I W z 0
0.0 0.5 1 .o 1.5 2.0 €QUI VALENCE RATIO
100
10
1
. 1
4 tlETHANOL I
0.0 0.5 1 .o 1.5 2.0 EQUl VALENCE RATIO
u l m l 8 53 B 41 0 33
PRE-VAP
w 57 44
0 30 9 PRE-VAP
Figure 4.8 Effect of Equivalence Ratio and Droplet Diameter on the Mlnlmum lgnltlon Energy of N-Heptane and Methanol S p r a y s and P r e v a p o r i t e d Mixtures

droplets In the 10-40 urn range. Also, MlZUtanI and Nakajima (1973) obtained
extension of the f lammabi l i ty l im i ts by the addition o f kerosine droplets t o a
propane air mixture.
4.3.2. ODt imum DroDlet Size f o r lanition
The spray and prevaporized ignit ion energy data a re given as a function of
droplet size fo r various equivalence rat ios in Figure 4.9 fo r n-heptane and
methanol. Prevaporized data were plot ted a t zero diameter, the lower l i m i t
of drop size. The dashed l ines are an extrapolat ion f r o m the lowest drop size
studied t o the prevaporized case. The minima in the extrapolated region of
the ignition curves suggest the existence of an optimum droplet size f o r
ignition of lean sprays, occuring below 30 u m for both fuels. The existence
of th is optimum droplet size was indicated over a la rger range of lean
equivalence rat ios f o r n-heptane (0.4-0.8) than f o r methanol (0.4-0.65).
The optimum diameter could not be quantified f r o m this study, obviously.
The existence of an optimum droplet diameter f o r ignit ion can be
explained as follows. A successful spark ignit ion event can be considered as
two separate processes. Initially, the spark has t o vaporize and burn the
fuel in i t s path t o create a spark kernel . Secondly, th is kernel has t o
propagate into the unburned mixture. The amount of energy needed t o
vaporize and burn a given amount of fuel in the spark gap decreases
monotonically as the droplet size decreases t o zero, due t o the enhanced
evaporative qual i ty of the fuel. Therefore, the existence of an optimum drop
Size fo r ignit ion must be explained in te rms of the second process, f lame
propagation.
Flame propagation studies (Burgoyne and Cohen, 1954; Polymeropoulos
and Das, 1976; Hayashi &&, 1976; Mizutani and Nakajima, 1973) have shown
G 3 -

CI
78
0 0.6
0.8
= 1.0
0.7
~ 0 0.9
1 N-HEPTANE 100 I
I04 \
. 1 -I I I I I I I 0 10 20. 30 40 50 60
DROPLET DIAMETER (bm)
I 10
/ 0 IF;;. 0 I
. 1 Y + I I I I I I 0 IO 20 30 40 50 60
DROPLET DIAMETER (pm)
B 0 0.65
0.75 -0.85
Figure 4.9 Effect of Droplet Diameter and Equivalence Ratio on the Minimum Ignition Energy of N-Heptane and Methanol Sprays

that as drop sizes are decreased f r o m arge values to zero, sprays in the
transit ion region (10-40 p m ) achieve the maximum f lame speed. This
enhanced f lame speed would also enhance spark kernel propagation r a t e s ,
and ignition. Therefore, the optimum in drop size fo r ignit ion i s probably
caused by the increased f lame propagation rates in the t rans i t ion region, and
should occur a t the drop size where the f lame speed i s maximized.
Previous researchers also have observed optimum droplet sizes fo r
ignition. Chan (1982) and Singh (1986) found optimum sizes of 15 p m and
22-26 p m respectively fo r ignit ion of t e t ra l i n aerosols a t lean equivalence
ratios, which agrees with the current findings. A numerical thermal ignit ion
study by Aggarwal and Sirignano (1984) predicted an optimum droplet size
for ignition, which increased with increasing equivalence rat io. This optimum
was attr ibuted t o the distr ibution of fuel vapor in the ignit ion zone, which i s
affected by the to ta l droplet surface area.
4.4 Summary of ExDerimental Results
To b r i e f l y summarize the major experimental results:
1 ) Ignition was improved ( requi red ignit ion energies were lowered) by
decreasing the droplet size, increasing the equivalence ra t io and in'creasing
the fuel vo la t i l i t y of the sprays.
2 ) An optimum equivalence ra t io fo r ignit ion of prevaporized n-heptane
was observed between 1.5 and 2.0; no optimum equivalence ra t io was seen
for spray ignition.
3) An optimum droplet size fo r spray ignition, less than 30 um, was
suggested for lean sprays of both fuels. This optimum was re la ted to the
maximum f lame speeds observed by previous researchers for sprays i n th is

80
transition region size.range.
4 ) Extension of the lean prevaporized ignition limit was observed for a l l
sprays tested. This was attributed to interdroplet regions of gas-phase
stoichiometry more favorable to ignition created by the evaporating droplets.

CHAPTER 5
ANALYTICAL SPARK IGNITION STUDIES
It has been shown that many factors affect the minimum ignition energy of
fuel sprays. Droplet size, equivalence rat io, extent of prevaporization and
fuel propert ies a re parameters that w i l l be examined by two analytical
models which a re described in th is Chapter. The models w i l l be used t o
predict minimum ignition energies based on these and other parameters using
a character ist ic t ime approach. The resu l ts w i l l give insight into the re la t ive
importance of these parameters on the spark ignition process, as we l l as the
abil ity of character ist ic t ime models t o accurately predic t ignition energies.
One of the models w i l l
spray ignition process
experimental resul ts.
also be extended t o simulate the randomness of the
in order t o explain the probabi l is t ic nature of the
5.1 S w a y lanition Model (Bal la l and Lefebvre)
The ignition model developed .by Bal la i and Lefebvre (1981) takes a
characteristic t ime approach, with the c r i te r ion f o r ignition being that the
t ime required f o r the fuel t o evaporate and chemical ly react in the spark
kernel must be less than o r equal t o the t ime it takes the kernel t o be
quenched by thermal conduction and turbulent diffusion. A c r i t i ca l quenching
diameter was calculated f r o m this. The minimum ignition energy was the
amount of energy requi red t o ra ise th is c r i t i ca l l y sized kernel t o the
stoichiometric adiabatic f lame temperature. The fuel and a i r propert ies used

in the model a re l is ted i n Table 5.1.
5.1 .1 !'lode 1 Formulat ioq
The ignition model was developed t o be used over a wide range of f low
conditions. To cor re la te the present ignit ion data, the heterogeneous,
quiescent and monodisperse case was used. (The model c r i te r ion fo r
quiescent conditions was Red << 16. The droplet Reynolds numbers f o r the
present sprays var ied f rom 0.3-1.2.)
The basic assumptlons of the model were as follows. A spherical spark
kernel was formed by the Ignition spark. The temperature in th is kernel was
the stoichiometric, adiabatic f lame temperature of the fuel. The a i r
propert les in the kernel were evaluated a t a mean temperature of 1300 K.
The basic premise of the model was given by:
tq t e + t c (5-1)
which equated the t ime required f o r droplet evaporation ( t e ) and chemical
react ion (t,) t o the quenching t ime (t,) of the spherical spark kernel .
The quenching t ime was defined as the ra t io of the heat capacity of the
spark kernel divided by the average ra te of heat loss f rom the kernel by
conduction. This was given by:
where d i s the diameter of the spark kernel, ATst i s the temperature
difference between the stoichiometric, adiabatic f lame temperature of the
kernel and the ambient spray and Pa, Cpa and k a are the density, specific

PROPERTY
FUEL PROPERTIES: I I
SYMBOL UNITS N-HEPTANE tlETHANOL 1 Density P (kg/m3) 6.88E+02 7.96€+02
Flame Temperature Ts t ( 'K) 2266 2152
Boiling Temperature Tb ( O K ) 37 1 337
Latent Heat of Vaporization L J/kg 3.65€+05 1 .lo006
Activatlon Energy Eact (kca l /mole) 60.5 41.3
Corn bust lon Transfer Number 8 - 5.82 2.70
AIR PROPERTIES:
PROPERTY SYMBOL UNITS VALUE TEMP.
Density P (kg/m3) 2.71E-01 (1300'K)
Speciflc Heat cpa (J/kg*K) 1.20€+03 ( 1300'K
Thermal Conductfvlty ka (J/sm*K) 8.37E-02 (1300.K)
Thermal Dlffuslvlty d ( m2/s) 2.58E-04 ( 1300.K)
Table 5.1 Fuel and A i r Properties Used f o r Ignition Modeling

~
h . 4
84
t
heat and thermal conductivity of air evaluated a t 1300 K. This reduced to:
tq = d 2 / M ( 5-3 1
where a i s the thermal dif fusivi ty of air.
The evaporation t ime was defined as the ra t io of the mass of fuel
contained within the spark kernel t o the ra te of fuel evaporation and was
given by:
where Q i s the f ract ion of fuel In vapor form, 0 1s the droplet dlameter, 0 i s
the equivalence ra t io and Bst i s the stoichiometric combustion mass t rans fer
number. The (1-0) t e r m was included to account fo r fuel vapor in the
ignit ion zone p r i o r t o the spark. This fuel vapor was assumed to have
rei;Uced %e uv8pOriiiion time by ine i ime ii wouia nave taken t o produce that
vapor had it been present initially in the fo rm of fuel droplets the same size
as those present. Values of Bst were taken f rom Kanury (1970).
The chemical reaction t ime was defined in te rms of the laminar f lame
speed (SL) and was given by:
Using relat ions 5-3 to 5-5 in equatlon 5-1, the c r i t i ca l quenching distance
was determined, and was gtven by:
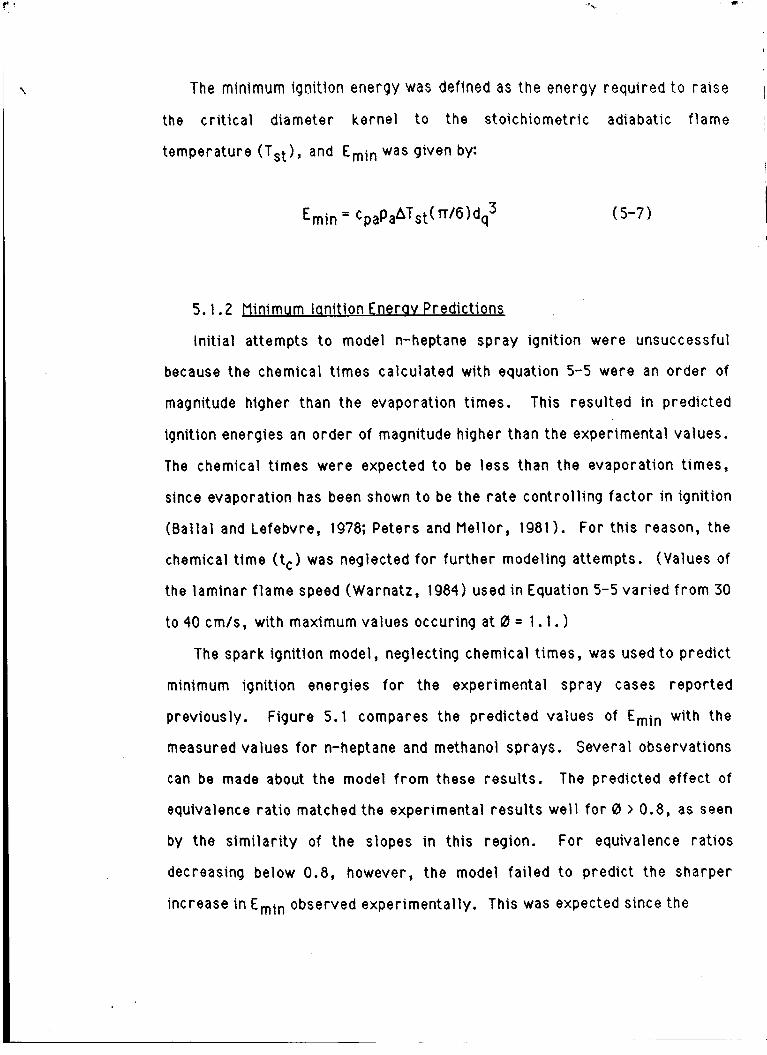
c
The minimum ignit ion energy was defined as the energy required t o raise I the c r i t i c a l diameter kernel t o the stoichiometric adiabatic f lame ~
temperature ( T s t ) , and Emin was given by: I !
I Emin = CpaPaATst(n/6)dq 3 ( 5-7 1
5.1.2 Minimum lanit ion Enerav Predictions
In i t ia l attempts t o model n-heptane spray ignit ion were unsuccessful
because the chemical t imes calculated with equation 5-5 were an order of
magnitude higher than the evaporation times. This resul ted in predicted
ignition energies an order of magnitude higher than the experimental values.
The chemical t imes were expected t o be less than the evaporation t imes,
since evaporation has been shown t o be the ra te control l ing factor in ignit ion
( B a l l a l and Lefebvre, 1978; Peters and Mel lor , 1981). For th is reason, the
chemical t ime (t,) was neglected fo r fur ther modeling attempts. (Values of
the laminar f lame speed (Warnatz, 1984) used in Equation 5-5 var ied f r o m 30
to 40 cm/s, with maximum values occuring a t 0 = 1.1.
The spark ignit ion model, neglecting chemical t imes, was used t o predict
minimum ignit ion energies fo r the experimental spray cases reported
previously. Figure 5.1 compares the predicted values of Emin with the
measured values fo r n-heptane and methanol sprays. Several observations
can be made about the model f r o m these resul ts. The predicted effect o f
equivalence rat io matched the exper mental resu l ts wel l f o r 0 > 0.8, as seen
by the s imi la r i t y of the slopes in this region. For equivalence rat ios
decreasing below 0.8, however, the model fa i led t o predict the sharper
increase in Emin observed experimental ly. This was expected since the

L
loo
10:
I :
. I -
N-HEPTANE
a
:; I I I
1:
. I I I I I t
0.0 0.5 1 .o 1.5 2.0 EQUl VALENCE RATIO
lulml 53fXP
B 414XP 0 3 3 - w - 53-BhL - 41-6hL - 33-BhL
U U J d m 57-EXP B 4 4 - w 0 3bEXP - 576hL - 44-BbL - 30-8hL
Figure 5.1 Predictions o f Minimum Ignition Energy using Bal la l and Lefebvre's Ignition Model f o r N-Heptane and Methanol Sprays

model dldn’t include chemical t imes, which would become la rger a s the lean
ignition l im i t was approached. For equivalence rat ios above 0.8, the
quantitative agreement between the predicted and experimental ignition
energies was v e r y good fo r the largest drop sizes. As droplet size
decreased, however, the model increasingly underpredicted Emin. This was
par t ia l ly explained by the exclusion of chemical t imes. As the droplet size
decreased, the evaporation t imes decreased also and the chemical t imes
became re la t ive ly more important. Furthermore, equation 5-6, without the
chemical t ime, predicts a monotonic decrease in quenching distance and
ignition energy, approaching zero f o r zero drop size (vapor). Therefore,
the model also breaks down as droplet size decreases because it cannot
account f o r the t rans i t ion region fuel d istr ibut ion effects which resu l t in t h e
optimum droplet size f o r ignition observed experimentally.
In summary, the spark ignition model developed by+Bal la l and Lefebvre
was not able t o account f o r spray ignition behavior as the equivalence ra t io
approached the lean l im i t o r as the droplet diameter dropped below 40 p m .
However, the general agreement between the model predictions and the
experimental data i s quite good considering the.globa1 nature of the model
compared t o the complex nature of the spark ignition process.
5.1.3 Effect of E xtent of Prevaporization
The effect of fuel prevaporization on ignition was also studied using the
ignition model of Bal la l and Lefebvre. This was done t o address a question
raised in Chapter 4 concerning the fact that ignition energies were measured
for n-heptane and methanol sprays with di f ferent values of Q. It was not
clear how much of the difference in ignitton energy between the n-heptane and
methanol sprays could be at t r ibuted t o the i r difference in Q, and how much

-;, .
88
was due to the dif ference i n their volat i l i t ies. To examine this, Emin was
predicted fo r sprays of the two fuels with the same value of (3 = 0.39. This
was done fo r n-heptane sprays with D = 41 u m and methanol sprays with D =
44 urn. Figure 5.2 shows the effect of varying Q on the predicted ignition
energies for these sprays. The experimental values of Q (n-heptane = 0.45;
methanol = 0.32) a re included as a reference. As seen, using a mean value
of Q (0.39) decreased the difference in Emjn between the n-heptane and
methanol sprays by about 25%. This indicates that the major i ty of the
dif ference in ignition energies was due to the dif ference in vo la t i l i t y of the
fuels.
5.2 Characte r i s t i c Time Mode\ fo r lanition (Pete r s and Mel io r )
The second ignit ion model used t o evaluate the experimental data was the
character ist lc t ime model (CTM) fo r ignition of quiescent fuel sprays, which
was developed by Peters and Mel lor (1980) based on an ear l ie r model f o r
f lame stabilization. This model associated specific t imes with the physical
processes occuring during spark ignition and stated that the ignit ion l imi t was
reached when the mixing ra te o f the spark kernel with i t s environment
equalled the fuel evaporation r a t e .
5.2. I Model Formulation
The basic assumptions of the model were s imi la r t o those presented f o r
the previous model of Bal la l and Lefebvre. A spherical spark kernel was
formed by the ignit ion spark and the temperature in this kernel was the
stoichiometric, adiabatic f lame temperature of the fuel. The a i r propert ies
in the kernel were evaluated a t a mean temperature of 1300 K. In addition,

N-HEPT: D = 4 1 ~ m ; M T H : D = 4 4 ~ m
1
1 .1 ! I I 1
0.0 0.5 1 .o 1.5 2.0
EQUIVALENCE RATIO
Figure 5 . 2 Effect of Extent of Prevaporization on the Predicted Minimum Ignition Energies of Bal l a l and Lefebvre's Ignition Model f o r N-Heptane and Methanol Sprays (0 = 41 and 44 urn, respectively)
FUEL-Q
METH-0.: 0 METH-0.T A HEPT-O.2 A HEPT-O.4

ignit ion was assumed. t o be control led by evaporation. That i s , the t ime
required f o r evaporation of the fuel i n the spark kernel was very much la rger
than the t ime required f o r chemical reaction. Therefore, chemical t imes
were neglected. The basic premise of the model was given by:
t s l - teb/O ( 5-8 1
where tsl i s the t ime required for the heat t o be removed f rom the kernel by
conduction, teb i s the t ime required for evaporation of a fuel droplet in the
kernel and 0 i s the equivalence ra t io a t the spark gap. Since the t o t a l amount
of fuel being vaporized contributed to the ignit ion process, teb was divided by
the equivalence rat io, which was proport ional t o the to ta l number of droplets
present.
Note that the CTM di f fered f rom the previously described model of Bal la l
and Lefebvre in that it only assumed proport ional i ty between the relevant
character ist ic t imes, not absolute equality. The model was applied by
evaluating ts l and teb f rom the measured ignition energies and experimental
conditions t o determine the proport ional i ty in equation 5-8. Emin was then
predicted based on this proportionality. The fuel and a i r propert ies used in
these calculations were identical t o those used in the previous model, and
a r e l is ted in Table 5.1.
For a quiescent mixture, the relevant mode of heat t rans fer f rom the
spark kernel was conduction. Therefore, the t ime required f o r heat loss
f rom the kernel was given by:

where A i s the surface area of the kernel and OLa i s the thermal dif fusivi ty.
Fo r a spherical spark kernel, th is became: I
I . i
where d i s the diameter of the spark kernel and pa, Cpa and k a a re the
density, speciflc heat and themal conductivity of a i r evaluated at 1300 K. To
evaluate d, the minimum ignit ion energy was defined as the energy required
to heat a spherical volume of a i r with diameter d to the stoichiometric,
adiabatic f 1 a me temper a t ure:
where d has been replaced by dq, the quenching distance, and AT,t i s the
temperature dif ference between the stoichiometric, adiabatic f lame
temperature of the kernel and the ambient spray.
The t ime required for evaporation of a fuel droplet in the spark kernel
was derived f rom the 'd2 law" of Godsave, given by:
(5-12)
where Do i s the droplet diameter and 8 i s the evaporation coefficient. This
expanded to:
teb = DO2pfcpa/8kaln( I+Bst) (5-13)
where Bst is the stoichiometric mass t ransfer number, taken f rom Kanury

92
(1970).
Using the experimental conditions and measured ignition energies, tSl and
teb were calculated with equations 5-10, 5-11 and 5-13. A simple l inear
regression analysis was then performed with these values to determine the
proport ional i ty in equation 5-8. Results o f th is a re given in f i g u r e 5.3, which
shows tsl plot ted as a function of t,b/0 fo r the experimental data of th is
study. The least-squares f i t was:
(5-14)
The coefficient of corre la t ion ( r ) for th is fit was 0.89 and the y-intercept
was we l l within the standard e r r o r o f estimate (13.6) of zero. The scat ter in
the corre la t ion was not excessive considering only 26 data points were
modeled.
This corre la t ion was v e r y close t o the one obtained by Peters and Mel lo r
( 1980) using the CTM with experimental data of Bal la l and Lefebvre ( 1978):
Equation 5-15 was the resu l t of Ignition energy measurements made f o r
iso-octane, diesel o i l and heavy fuel o i l sprays wi th SMD ranging f rom 20 t o
170 urn and equivalence rat ios ranging f rom 0.43 t o 1.0. The agreement
between the two corre la t ions i s v e r y good considering t,l and teb Only ranged
f rom 0-120 ms and 0-7 ms respectively f o r the present study, while the
corresponding ranges f o r the data in Peters and Mel lor 's corre la t ion were
0-1000 ms and 0-70 ms.

d 1
150
100
50
teb = 15.8teb/H -0.7 (Do)
I I I
0 2 4 6 8
teb/0 (ms)
F i g u r e 5.3 C h a r a c t e r i s t i c T i m e C o r r e l a t i o n f o r N-Heptane and Methano l Sp rays (us ing I n i t i a l D r o p l e t D i a m e t e r s )
FUEL-D (urn)
0 HEPT-33 B HEPT-41 IS HEPT-53
MEW-30 MEM-44
Lo METH-57

. : . :r $.vi. .
94
5 .2 .2 Minimum lanition Enerav Predictions
Using the corre la t ion obtained for the present data (5-14) and neglecting
the smal l y-intercept, Emin was calculated with equations 5-10, 5-11 and
5- 13 as:
Comparlsons of the minimum ignttion energies predtcted by 5-16 and the
experimental ly measured values a re shown in Figure 5.4 fo r n-heptane and
methanol sprays. As seen, the CTM quali tat ively predicted the effects of
droplet size and equivalence rat io on ignition quite accurately. Quantitatively
however, the predicted ignition energies were about 50% higher than the
measured values fo r n-heptane sprays of a l l sizes. For methanol sprays,
the model overpredicted Emin fo r the 57 p m sprays and underpredicted Emin
f o r the 30 p m sprays by about 30%, while the 44 urn predictions were v e r y
close t o the experimental values. As in Bal la l and Lefebvre’s model, the
agreement between the measured and predicted values of E min deteriorated
with decreasing equivalence ratio, suggesting the need f o r chemical kinetic
t imes in modelfng lean sprays.
5.2.3 Effect of Initial Versus SDark Gao Droolet Diameter
The CTM was developed to model ignition energies based on in i t ia l spray
conditions, since detailed information about spray parameters at the ignition
locatton i s not always available. (It was not c lear whether CTM the
corre la t ion obtained by Peters and Mellor f o r Bal la l and Lefebvre’s quiescent
data (Eq. 5-15) was obtained using init ial o r spark gap diameters. ) In this
study, however, measurements of droplet diameter were made d i rec t l y a t

O0 1 N-HEPTANE
10 l a I \-
0 E
0.0 0.5 1 .o 1.5 2.0 EQUIVALENCE RATIO
flETHANOt 100
E
. 1 I 0.0 0.5 1 .o 1.5 2.0
EQUIVALENCE RATIO
Figure 5.4 CTM Minimum Ignition Energy Predictions f o r N-Heptane and Methanol Sprays (using Ini t ia l Droplet Diameters )

96
the spark gap. Therefore, the droplet evaporation t e r m in the CTM was
modified t o use these measured values, instead of the initial droplet
diameters used previously. This gave a more real ist ic estimate of the t ime
required f o r evaporation in the spark kernel. With th is modification the
droplet evaporation t ime became:
where 0 i s the droplet diameter measured a t the spark gap. The corre la t ion
between ts l and teb was determined as before and found t o be:
Figure 5.5 shows a plot of tsl as a function of teb/0 f o r this case. The
corre la t ion coefffcient ( r ) of th is least squares fit was 0.9 and the
y-intercept was within the standard e r r o r of estimate (12.9) of zero. As
seen in Figure 5.5, the evaporation times were decreased by about a factor of
one-third compared t o the initial diameter case (Figure 5.31, which
increased the slope of the correlat ion by about 30%.
Using this correlat ion, the minimum ignition energy was given by:
Values of E min predicted by th is equation are compared t o the experimental ly
measured values in Figure 5.6 fo r n-heptane and methanol sprays. As seen,
th is modification had no quali tat ive effect on the predicted ignition energies.
Using the spark gap droplet diameter improved the n-heptane predict ions but

tsl = 20.6bb/B + 1.7 ( 0 ) 150-
0 HEPT-33 B HEPT-41 0 HEPT-53
METH-30 IIETH-44
B PlETH-57
0 2 4 6
F igu re 5 . 5 Charac te r i s t i c T ime C o r r e l a t i o n f o r N-Heptane and Methanol Sprays (us ing Spark Gap Drop le t D iamete rs )

I
loo
10:
1 : ; . 1 1
! N-HEPTANE
I u l U n l E 53-EXP
a 41-EXP 0 33-EXP - S3-CWD) - rll-CT?l(D)
O;. E - 33-CTM(D)
I I I
* 10:
Figure 5 . 6 CTM Minimum Ignition Energy Predictions fo r N-Heptane and Methanol Sprays (using Spark Gap Droplet Diameters)
E
\
98
1:
. 1 1 I 1

1 1
had very l i t t l e effect on the methanol predictlons. This was expected since
n-heptane's greater vo la t i l i t y resul ted in la rger differences between the
in i t ia l and spark gap droplet diameters than fo r methanol sprays. I
1 5.2.4 Ef fec t of Extent of Prevaoorization I
The CTM was fur ther modified t o include the effects of prevaporized fuel I , , in the ignit ion zone p r i o r t o sparking. This fuel vapor was assumed t o have
reduced the evaporation t ime by the t ime it would have taken t o produce that
vapor .had it been present in i t ia l l y in the f o r m of fuel droplets ( B a l l a l and
Lefebvre, 1981 1. The droplet evaporation t ime became: I
where Q i s the f ract ion of fuel in vapor phase and Dais the droplet diameter
measured a t the spark gap. The corre la t ion between ts l and teb was
determined as before and found t o be:
(5 -2 I )
Figure 5.7 shows a plot of tsl as a function of teb/0 f o r th is case. The
correlat ion coefficient (r) of th is feast squares fit was 0.9 and the
y-intercept was within the standard e r r o r of estimate (12.6) of zero. The
evaporation t imes were decreased by about a factor of two compared t o the
in i t ia l diameter case, which near ly doubled the slope of the correlat ion.
Using this correlat ion, the minimum ignit ion energy was given by:

. .
Figure 5.7 Characteristic Time Correlation for N-Heptane and Methanol Sprays (using Spark Gap Droplet Diameters and Extent of Prevaporization)
FUEL - 0 (urn1
0 HEPT-33 D HEPT-41 E HEPT-53
METH-30 MEM-44
IJ METH-57
I I
0 1 2 3 4

Values of Emin predicted by this equation are compared t o the
experimentally measured values in Figure 5.8 fo r n-heptane and methanol
sprays. As seen, the quali tat ive agreement was again quite good with the
exception of equivalence rat ios approaching the lean l im i t . In addition, the
quantitative agreement between the predicted and measured ignit ion energies
improved signif icantly f o r the n-heptane sprays, while l i t t l e change was seen
f o r methanol. Again, th is was expected due t o n-heptane's greater
volat i l i ty , which resul ted i n smal ler drop sizes and more prevapor i ted fuel
than methanol.
1 1
I
I
I ,
In general, the CTM was shown to be quite re l iab le in predict ing the
ignition energies of the sprays examtned in this study. It appears that use of
local (spark gap) spray parameters, such as droplet size and extent of
prevaporization, resul ts in more accurate predictions compared to use of
init ial parameters. Inclusion of chemical times, while not attempted in this
study, might also improve model performance fo r lean and smal le r droplet
size sprays.

!
1
I t
' O0 j HETHANOC
8
10:
1 :
. 1 I I I 1
10
1
. 1 0.0 0.5 1 .o 1.5 2.0
€QUI VALENCE RATIO
5 3 f X P 8 4 1 - W 0 33-ExP - 53-CMD.O) - 41-ClMD.Q) - 33-CTWD,O)
Figure 5 . 8 CTM Minimum Ignition Energy Predictions f o r N-Heptane and Methanol Sprays (using Spark Gap Droplet Diameters and Extent of Prevaporizat.ion)
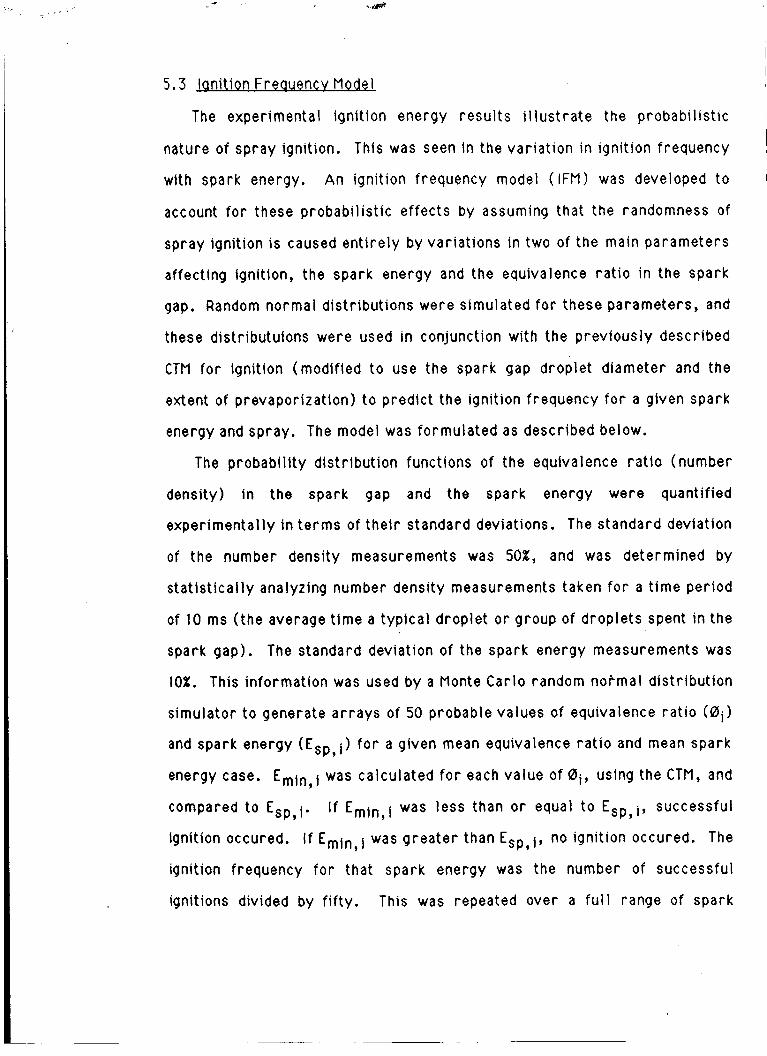
5.3 lanition Freauencv Model
The experimental ignit ion energy resu I s i l l us t ra te the probabil ist ic
nature of spray ignition. This was seen in the var iat ion in ignit ion frequency
with spark energy. An ignit ion frequency model ( IFM) was developed t o
account for these probabil ist ic effects by assuming that the randomness of
spray ignition i s caused ent i re ly by variat ions i n two of the main parameters
affecting ignition, the spark energy and the equivalence ra t io i n the spark
gap. Random normal distr ibutions were simulated fo r these parameters, and
these distributuions were used in conjunction with the previously described
CTM for ignition (modif ied t o use the spark gap droplet diameter and the
extent of prevaporization) t o predict the ignition frequency fo r a given spark
energy and spray. The model was formulated as described below.
The probabil i ty distr ibution functions of the equivalence ra t i o (number
density) in the spark gap and the spark energy were quantified
experimental ly in te rms of the i r standard deviations. The standard deviation
of the number density measurements was 508, and was determined by
stat ist ical ly analyzing number density measurements taken fo r a t ime period
of 10 ms ( the average t ime a typical droplet o r group of droplets spent i n the
spark gap). The standard deviation of the spark energy measurements was
10%. This information was used by a Monte Carlo random normal distr ibut ion
simulator t o generate a r rays of 50 probable values of equivalence ra t io (0i)
and spark energy (ESp,i) f o r a given mean equivalence ra t io and mean spark
energy case. E,in,i was calculated fo r each value of ( 2 1 1 9 using the CTM, and
compared t o ESP,!. I f Emin,l was less than o r equal t o Esp,i, successful
ignition occured. I f was greater than Esp,l, no ignit ion occured. The
ignition frequency fo r that spark energy was the number of successful
ignitions divided by f i f ty . This was repeated over a f u l l range of spark

I
I
104
energies t o generate an ignition ,frequency curve fo r a given mean equivalence
ra t io spray. A complete l is t ing of the APL program used to run this progra'm
i s given in Appendix C.
Typical resul ts of the model a re given in Figure 5.9, which shows ignit ion
frequency curves generated by the IFM compared to the ignition frequencies
obtained experimental ly f o r representative n-heptane and methanol sprays.
As seen, the IFM predlcted quite accurately the observed var iat ion i n ignit ion
frequency with spark energy fo r these cases.
Figure 5.10 shows IFM predictions fo r both r i ch (0 = I . 42 ) and lean (0 =
0.44) 41 um n-heptane sprays. Several things can be observed f rom these
resul ts. For the v e r y lean case, the IFM substantial ly underpredicted the
50% ignit ion energy, or Emin. This was because the ignit ion -frequency
predict ions were based on minimum ignition energies calculated with the CTM.
Where the CTM underpredicted Emin, such as lean cases approaching the
ignit ion l imi t , the IFM overpredicted the ignition frequency fo r a given spark
energy. The ignit ion frequency model, then, i s l imi ted by the accuracy of the
ignit ion energy model (CTM) used. For the r i ch case in Figure 5. I s ' , the 50%
ignit ion energy predicted by the IFM was within 5% of the exper imental ly
observed value. The slope of the predicted curve was less steep than the
slope of the experimental curve, however. This issue w i l l be addressed in
the fol lowing paragraph. The ignition frequency modeling resu l ts shown i n
Figures 5.9 and 5.10 were representitive of resul ts obtained fo r both fuels
over the ent i re range of droplet sizes and equivalence rat los tested.
The slope of the ignit ion frequency curves predicted by the IFM were a
function of the standard deviations of the spark energy and equivalence rat io
used in the model. Smal ler standard deviations would have resul ted in
steeper slopes, and vice-versa. This is i l l us t ra ted in Figure 5.11, which

'LL
%
2 0
+ +.+ ++i ++ a?. + +. +. 8
1 .o
0.5
0.0
1 .o
+*++ + + + ' + c, m + +
a+
P +
+
N-HEPTANE; 0x4 1 wm.; 810.88 & +
I I I . . 1 1 10 100
SPARK ENERGY (mJ)
0.5 i + 8
+
METHANOL; D=44 urn; 8=0.79 0.0 I d
1 10 100 SPARK ENERGY (mJ)
8 + IFH I
8 EXP + IFM
Figure 5.9 IFM Ignition Frequency Predictions f o r N-Heptane and Methanol Sprays ( D = 41 ,44 urn; 0 = 0.88,0.79)

1 .o
0.5
0.0 7
" U + X
r.
x x x xn ++* X + + +
+ 0 0 c
8 X
xx N-HEPTANE; 0=4 1 pm x x - I I d
Y " Y
++ O++
X xx X
8' X +
fi . o r #
I X 8
8 0
+
. 1 1 10 * 100
SPARK ENERGY (mJ)
0
0 1.42-EXP 0.44-EXP
+ 1.42-IFfl X 0.44-IFM
Figure 5.10 IFM Ignition Frequency Predictions for N-Heptane Sprays (0 = 41 urn; 0 = 1.42 and 0 .44)

shows the predicted ignition frequency curves for a 41 urn n-heptane spray
with equivalence rat io of 1.42 using standard deviations of SO%, 30% and 1OX
for the equivalence rat io. The standard deviation of the spark energy was
held constant a t 10%. From Figure 5-11 it appears that by using a standard
deviation o f about 30% fo r the equivalence ra t io in the IFM, the slope of the
corresponding experimental ignition frequency curve in Figure 5.10 would
have been predicted quite accurately. However, no decrease i n the standard
deviation of the number density with increasing equivalence ra t io was
observed experimental ly t o warrant this.
Finally, note in Figure 5. i 1 that a l l th ree curves cross the 50% ignition
line a t approximately the same spark energy. This i s because the probabi l i ty
distribution functions used in the IFM f o r both the equivalence ra t io and the
spark energy a re symmetric about the mean value. If the standard
deviations of the distributions were zero ( 1 . e. i f ignition was determinist ic),
the ignition frequency curve would collapse t o a straight ver t i ca l l ine which
would also cross the 50% ignition l ine a t the same energy. This i l l us t ra tes
that while spark ignition of sprays i s probabil istic, choosing SO% ignition as
the c r i te r ion fo r the minimum ignition energy accounts fo r these probabi l is t ic
effects.

* 0 L W 3 U W ' U LL z 0 c II
1 .o
0.5
0.0 .1 1 10
SPARK ENERGY (mJ)
Figure 5.11 Effect of Varying the Standard Deviation of Equivalence R a t i o on IFM Ignition Frequency Predictions f o r an N-Heptane Spray ( D = 4 1 urn; 0 = 1 .42 )

CHAPTER 6
CONCLUSIONS AND RECOMMENDAT IONS
6.1 Conclusions
A monodisperse spray ignit ion system was developed and used to study
the spark ignition behavior of fuel sprays over a wide range of operating
conditions. A cr i te r ion based on the probabil ist ic nature of ignit ion was
determined fo r the minimum ignit ion energy, which was measured over a
30-57 p m droplet range and a wide range of equivalence rat ios fo r n-heptane
and methanol fuels. The sprays were characterized in te rms of the i r number
density, drop size, extent of prevaporization and ve loc i ty a t the ignit ion
spark gap. The spray droplet size was an important factor in spray ignition.
Ignition was enhanced in a l l cases by decreasing the droplet diameter, which
increased the to ta l surface area of fuel in the ignit ion zone. Increasing the
spray equivalence ra t io also enhanced ignition i n a l l cases, so the optimum
amount of fuel In the ignit ion zone was never reached. Fuel vo la t l l i t y was the
c r i t i c a l fuel proper ty in corre la t ing spray ignit ion behavior fo r a given fuel
droplet size.
Minimum ignit ion energy measurements were made f o r prevaporized,
Premixed n-heptane and methanol t o provide ignition data fo r the lower l im i t
of droplet size. The optimum vapor phase equivalence ra t io for ignition was
also determined f rom these measurements fo r n-heptane. Activation energy
was the c r i t i c a l fuel proper ty fo r corre la t ing prevaporized ignit ion behavior,
The importance of Flame propagation was closely related t o ignition.

t rans i t ion region effects on f lame propagation rates i n sprays of th is size
range and smal ler was exhibited by the existence of an optimum droplet size
fo r ignit ion a t lean equivalence r a t i o s f o r both fuels. This optimum size
could not be quantified due to limitations of the spray generator, but it was
at t r ibuted t o the maximum flame speeds achieved by sprays in the transi t ion
region. Extension of the lean ignition l im i ts was observed fo r sprays of both
fuels, and attr ibuted t o the enhancing effect of the fuel vapor supplied by
eva po rat ing drop 1 et s . Two models using a characterist ic t ime approach were applied to
cor re la te the spray ignit ion results. Both models predicted quite
accurately, qual i tat ively and quantitatively, the observed ignit ion behavior.
The models underpredicted ignit ion energies as the spray equivalence rat ios
approached the lean l imi t and as the droplet sizes decreased below 40 um. This was because they did not account f o r the importance of kinetic t imes fo r
lean mfxtures and smal le r droplets, nor did they account fo r t ransi t ion
region effects in smal ler sprays.
The random nature of the spray ignit ion process was explained with a
probabil ist ic model which took into account the distr ibutions of spray number
densities and spark energies during ignition. This model predicted ignition
frequency curves which were in very good agreement with the observed
var iat ion in ignition frequency with spark energy. The success of the model
indicated that the probabil ist ic nature of spray ignition i s due in a large par t
t o the random positioning of droplets in a spray.

~
6.2 Recommendations fo r Future Work
While th is study points out important factors fo r optimizing ignit ion and
minimizing ignition energies fo r spray combustors, fur ther experimental and
theoretical advancements a re needed before the knowledge acquired he re can
be applied t o such systems. Suggested experimental studies and the i r I
objectives are l is ted below:
1 ) Modification of the spray system should be done t o generate droplets i n
the 10-30 b m range t o quantify the optimum drop size f o r ignit ion and t o
determine the effects of equivalence rat io, prevaporization and fuel
propert ies on this optimum.
2 ) Ignition studies should be performed with the prevaporizing system t o
add vapor t o the interdroplet spacing of the sprays. 0 should be var ied fo r
fixed values of 0 and 0 t o quantify the importance of prevaporization t o
ignition and to evaluate ignit ion models which use Q.
3) Ignition studies should be performed with sprays formed using the
dispersion je t only (no di lut ion a i r ) to reduce the levels of turbulence in the
sprays. A l a rger dlameter test sectlon should also be used t o el iminate the
problem of droplet impingement on the wal ls.
4 ) The prevaporizing apparatus should be modified to generate r i ch
methanol mixtures i n order t o quantify the optimum equivalence ra t io fo r
prevaporized methanol mixtures. This could possibly be done by heating the
entire f low system f rom the vaporizing chamber t o the test section, o r by

112
increasing the fuel and air f low rates fo r the existing set-up.
5 ) Modifications should be made with the spray system t o generate bi-modal
distributions of droplets t o quantify their ignition behavior relative t o
monodisperse sprays. Such a study would begin t o provide a l ink between
monodisperse and polydisperse ignition studies. This information could also
be used t o assess the relative importance of size corre la t ion parameters,
such as SMD and 020 f o r ignition modelling.
Improvements in modeling of the spark ignit ion process can be achieved
in several ways:
1 A more detailed chemical kinetic t e rm i s needed t o account f o r the sharp
increase in ignition energies observed experimental ly as the lean ignition
l iml t fs approached. The use of a non-unity exponent f o r 0 in the thc t e r m
developed by Peters and Mel lor (1982) could improve the CTM performance in
this respect.
2 ) Attention should be given t o modelling the observed transi t ion region
effects, i. e. the flame propagation and fuel distr ibution effects result ing in
an optimum droplet size f o r ignition. Both ignition models present ly predict a
monotonic decrease in ignition energy with decreasing droplet size, thus
underpredicting Emin f o r smal le r droplets (0 < 35 u m ) .
3 ) Statist ical methods fo r determining the actual distr ibutions of number
density and equivalence r a t i o f o r sprays over a range of conditions should be
developed in order t o ve r i f y the IFM assumptions In this respect.

LIST OF REFERENCES
Adelman, H. G., 1981, "A Time Dependent Theory of Spark Ignition', Eiahteenth SvmDosium
International 1 on Combustion, p. 1333, The Combustion Inst i tute, Pittsburgh, PA.
Aggarwal, S. K. andsirignano, W. A . , 1985, 'Ignition of Fuel Sprays: Deterministic Calculations f o r Idealized
Droplet Arrays" , Twentieth Svmoosium ( International 1 on Combustion, p. 1773, The Combustion institute, Pittsburgh, PA.
Aggarwal, S. K. andsirignano, W. A . , 1986, 'Ignition of Polydisperse Sprays: Importance of D ~ o - , Combust ion
Science and Tecnoloav s, p.289.
Aggarwal, S. K. and Nguyen, K., 1987, 'Numerical Simulation of the Ignition of Combustible Fuel-Air Mixtures
Flowing in a Tube', Presented a t the Spring Technical Meeting,Central States Section/ The Combustion Inst i tute.
Ballal, 0. R. andiefebvre, A. H., 1975, "The Influence of Flow Parameters on Minimum Ignition Energy and
Quenching Distance', Fifteenth Svmr>osium ( International on Combustion, p. 1473, The Combustion Institute, Pittsburgh, PA.
8alla1, 0. R. andLefebvre, A. H., 1975, 'The Influence of Spark Discharge Characterist ics on Minimum ignition
Energy in Flowing Gases', Combustion and Flame, 2, p.99.
Ballal, D. R. andLefebvre, A. H., 1977, 'Ignition and Flame Quenching in Flowing Gaseous Mixtures,'
Proceedinas of the Roval Societv of London, A357, p. 163.
Ballal, 0. R. andLefebvre, A. H., 1978, 'Ignition and Flame Quenching of Quiescent Fuel Mists', Proceedinas of
the Roval Societv of London, A364, p.277.
Ballal, D. R. andLefebvre, A. H., 1978, 'Ignition of Liquid Sprays a t Subatmospheric Pressure", Combustion and
Flame, 31, p.115.

Bal l a l , D. R. and Lefebvre, A. H., 1978, "Ignition and Flame Quenching of Flowing Heterogeneous Fuel-Air
Mixtures', Combustion and Flame, s, p . 155.
B a l l a l , 0. R. and Lefebvre, A. H., 1981, 'A General Model of Spark Ignition fo r Gaseous and Liquid Fuel-Air
Mixtures", Eiahteenth Svmoosium ( International 1 on Combustion, p. 1737, The Combustion Institute, Pittsburgh, PA.
Bellan, J. and Cuffel, R., 1983, 'A Theory of Nondilute Spray Evaporation Based upon Mult iple Drop
Interactions', Combustion and Flame, 2, p. 55.
Bellan, J. andcuffel , R., 1986, 'Ignition of Nondilute Clusters of Drops in Convective Flows", Paper No.
WSS-86-24, West e r n S t at es Section/ The Co m bus t i on I ns t i t ut e, Pittsburgh, PA.
Berglund, R. N., and Liu, 8. Y. H., 1973, 'Generation of Monodisperse Aerosol Standards", Environmental
Sclence and Technoloav. 2, 2, 147.
Bradley, D. and Lung, F. K-K., 1987, 'Spark Ignition and the Early Stages of Turbulent Flame Propagation',
Combustion and FlamQ, f&, p.71.
Blanc, M. V., Guest, P. G., Von Elbe, G., and Lewis, B., 1948, 'Minimum Ignition Energies and Quenching Distances of Mixtures of
Hydrocarbons and Ether with Oxygen and Iner t Gases', Th i rd Svmoosium on Combustion, Flame and ExDlosion Phenomena, The Combustion Institute, Pittsburgh, PA.
Burgoyne, J. H. and Cohen, L., 1954, 'The Effect of Drop Size on Flame Propagation i n Liquid Aerosols',
Proceedinas of the Royal Society of London, Series A: Mathematical and Physical Sciences, a, No. 1162, p.375.
Chan, K. K. andPolymeropoulos, C. E., 1981, 'An Experimental Investigation of the Minimum Ignition Energy of
Monodlsperse Sprays', Paper No. 81-21, Fal l Technical Meeting, Eastern States Section, The Combustion Inst i tute, Pittsburgh, PA.
Chan, K. K. 1982, "An Experimental Investigation of the Minimum Ignition Energy of
Monodisperse Fuel Sprays', D o c t o r a l Thesis, Rutgers University, New Brunswick, NJ.

r
I
Dixon-Lewis, G. and Shepherd, 1 . G., 1975, 'Some Aspects of Ignition by Localized Sources, and of Cyl indrical and
Spherical Flames', Fifteenth SvmDosium ( International 1 on Combustion, p. 1483, The Combustion Inst i tute, Pittsburgh, PA.
I I I
Dobbins, R. A , , Crocco, L. andGlassman, I . , I 1963, 'Measurement of Mean Par t ic le Size of Sprays f r o m Dif f ract ively Scattered Light', AIAA Journal, 1, p. 1882.
DOE/EIA - 0219(85), 1985, 'International Energy Annual', U. S. Department of Energy.
Faeth, G. M., 1979, "Spray Combustion Models - a Review', Proceedinas of the Seventeenth
Aerosoace Sciences Meetinq, Paper No. 79-0293; AIAA.
Hayashi, S. and Kumagai, S., 1974, 'Flame Propagation in Fuel Droplet-Vapor-Air Mixtures', Fifteenth
SvmDosium ( International 1 on Combustion, 445-452, The Combustion Institute, Pittsburgh , PA.
Hayashi, S., Kumagai, S. andSakai, T., 1976, 'Propagation Velocity and Structure of Flames in Droplet-Vapor-Air
Mixtures', Combus tion Science and Technoloav, 15, 169.
Hayashi, S., Ohtani, T. and linuma, K., 1981, 'Limiting Factor of Flame Propagation in Low Velocity Fuel Clouds',
Fiahteenth Sv mDosium (Internat ional) on Combustion, p.361, The Combustion Institute, Pittsburgh, PA.
Kanury, A. M., 1975, 'Introduction to Combustion Phenomena', Gordon and Breach Science
Publications Inc., N.Y . , N .Y .
Kono, M., Kumagal, S. andSakai, T., 1977, 'The Optimum Condition fo r Ignition of Gases by Composite Sparks",
Slxtemth Svlllppsiyrn ( International) on Combustion, p.757, The Combustlon Institute, Pittsburgh, PA.
Law, C. K. andChung, S. H., 1978, 'Theory of Thermal Ignition in Fuel Droplet Burning', Combustion and
Flame, U, 0.285.
Law, C. K. and Chung, S. H., 1980, "An Ignition Cr i ter ion fo r Droplets in Sprays', Combust ion Science and
Technoloay, a, p. 17.

i
1 I6
Lewis, 8. and von Elbe, G., 1987, "Combustion, Flames and Explosions of Gases", Third Edition,
Acedemic Press, Orlando, FL.
Litchfield, E. L., 1960, U. S. Bureau of Mines, Rep. Inv. 5671.
Maly, R. R. and Vogel, M., 1978, 'Init iation and Propagation of Flame Fronts in Lean CH4-Air Mixtures by
the Three Modes of the Ignition Spark', Seventee nth SvmDosium I International 1 on Combustion, p.82 1, The Combustion Institute, Pittsburgh, PA.
Maly, R. R., 1981, ' ignition Model f o r Spark Discharges and the Early Phase of Flame
front Growth', E iahteenth . Svmo osium ( International) on Combustion, p . 1747, The Combustion Institute, Pittsburgh, PA.
Mizutani, Y. and Nakajima, A., 1973, 'Combustion of Fuel Vapor-Drop-Alr Systems: P a r t 1 - Open Burner
Flames', Combustion and F lame, a, p.343.
NACA Report No. 1300, 1959, "Basic Considerations in the Combustion of Hydrocarbon Fuels with
Air., Table X X X l l , Appendix, by the Propulsion Chemistry Dlvision, Lewis Flight Propulsion Laboratories.
Nltami, A. A., Singh, S. andcernansky, N. P., 1982, "Formation of Oxides of Nitrogen in Monodisperse Spray Combustion of
Peters, J. E. andMellor, A. M., 1980, 'An ignition Model f o r Quiescent Fuel Sprays', Combust ion and Flame,
Hydrocarbon fuels', Combustion Science a nd Technoloav, 28, p.97.
38, P.65.
Peters, J. E., 1981 ,'An Ignition Model f o r Gas Turbine Engines', Doctoral Thesis, Purdue
University, West Lafayette, IN.
Peters, J. E. andMel lor , A. M., 1982, 'A Spark ignition Model f o r Liquid Fuel Sprays Applied t o Gas Turbine
Engines', AlAA Jour nal of Fnerav , 6.4, p.272.
Polymeropoulos, C. E. and Das, S., 1975, 'The Effect of Droplet Size on the Burning Velocity of Kerosine-Air
Sprays', Combustion and Flame , 25, P.247.

Polymeropoulos, C. E., 1984, 'Flame Propagation i n Aerosols of Fuel Droplets, Fuel Vapor and A i r - ,
Combustion Science and Technoloav, 9, p. 217.
Rao, H. N. S. and Lefebvre, A. H., 1973, 'Ignition of Kerosine Fuel Sprays i n a Flowing A i r Stream', Combustion
Science and Technoloav 9 4, P.95.
Rao, K . V. L. and Lefebvre, A. H. , 1976, 'Minimum Ignition Energy in Flowing Kerosine-Air Mixtures",
Combustion and Flame, 22, p. 1.
Rose, H. E. and Priede, T. , 1958, 'Ignition Phenomena in Hydrogen-Air Mixtures', Seventh Svmoosium
( international ) on Combustion, p.436, The Combustion institute, Pittsburgh, PA.
Rose, H. E. and Priede, T., 1958, 'Investigation of Characterist ics of Spark Discharges as Employed in
ignition Experiments,, Seventh SvmDosium ( international on combustion, 0.454, The Combustion Inst i tute, Pittsburgh, PA.
Roth, W. R., Guest, P. G., von Elbe, G. and Lewis, B., 1951, 'Heat Generation by Elect r ic Spark and Rate of Heat Loss t o the Spark
Electrodes', Journal of Chemical Phvsics, 19.12, p. 1530.
Saitoh, T., ishiguro, S. andNiioka, T., 1982, 'An Experimental Study of Droplet Ignition Characterist ics Near the
lgnit ible Limit', Combustion and Flame, 48, p.27.
Sangiovanni, J. J. andKesten, A. S., 1978, 'Effect of Droplet Interactions on Ignition in Monodispersed Droplet
Streams', Sixteenth Svmoosium ( International) on Combustion, p. 577, The Combustion Institute, Pittsburgh, PA.
Sarv, H., 1985, "Oxides of Nitrogen E missions f rom the Combustion of Monodisperse
Liquid Fuel Sprays', Doctoral Thesis, Drexel University, Philadelphia, PA.
Slrignano, W . A. , 1984, 'Fuel Droplet Vaporization and Spray Combustion Theory', Proaress in
Enerav and Combustion Science, 9, p.291.
Slngh, A. K., andPolymeropoulos, C. E., 1985, 'Spark Ignition of Monodisperse Aerosols', presented a t the Fal l
Technical Meeting, Eastern Section of the Combustion Institute.

Singh, A. K., 1986, "Spark Ignition of Monodisperse Aerosols', Doctora
University, New Brunswick, NJ.
(II,
118
Thesis, Rutgers
Stevenson, W. H., 1976, "Principles of Laser Velocimetry', Proceedinas of the Fourteenth
AerosDace Sc iences Meet ing, p.307, AIAA.
Swett, Jr., C. C., 1956, "Spark Ignition of Flowing Gases using Long Duration Discharges", Sixth
SvmDosium ( International) on Combustion, p. 523, The Combustion Institute, Pittsburgh, PA.
Warnatz, J. 1984, 'Chemistry of High Temperature Combustion of Alkanes up to Octane',
Twentleth SvmDosium ( International) on Combustion, p.845, The Com bus t ion Institute, Pittsburgh , PA.
Ziegler, G. F. W., Wagner, E . P. andMaly, R. R., 1984, 'Ignition of Lean Methane-Air Mixtures by High Pressu,re Glow and A r c
Discharges', Twentieth SY mDosium ( International) on Combustion, p. 1817, The Combustlon Instltute, Plttsburgh, PA.

APPENDIX A
COMPREHENSIVE SPRAY CHARACTERIZATION AND IGNITION RESULTS
For brevi ty, only represent i t ive resul ts of the spray characterization
and ignition measurements were repor ted in the main body of text .
Comprehensive resul ts a re given in th is appendix. Figures A. 1 and A.2 show
radial prof i les of the loca l equivalence ra t io f o r a l l of the sprays tested in
this study. Figure A . 3 shows Fraunhofer d i f f ract ion patterns f r o m each of
the fuel and droplet size sprays tested a t an overa l l equivalence ra t io of 0.7.
Finally, Figures A . 4 and A.5 repor t the experimental ignition energy
measurements, showing the var iat ion in ignition frequency with spark energy
for each of the sprays tested.

'i
2-s 1 N-HEPTANE; D0=65um; z= 12.5cm
2.0
1 .s 1 .o 0.5
0.0 0 2 4 6 8
RADIAL DISTANCE (mml
Ba 0 126
0.94 0.75
0 0.55 8 0.35
0 2 4 6 a RADIAL DISTANCE (mm)
1 N-HEPTANE; D o = 4 0 ~ ~ ; Z=7.-
Bo 0 1.04
0.78 8 052 0 0.39
0.0 -+ I 1 I I 0 2 4 6 8
RADIAL DISTANCE (mm)
Bo EI 1.27
0.92 0.72
4 0.50 0.34
Figure A. 1 Radial Profi les of Local Equivalence Ratio f o r N-Heptane Sprays of Varying Overa l l Equivalence Ratio (Do = 6 5 , 50 and 40 urn)

0 t U
0 I- 4 a W u z W II 4 > 3 0 w
m
-
0 + 4 U
- W u z W
*-O 1 flETHAMOL; Oo=65fla; z= I 2 S c m
1.5
1.0
0.5
0.0 0 2 4 6 8
RADIAL DISTANCE (mm)
' 5 I HETHANOL; Do=SOpm; z=lOcm I
0.0 f I I I J 0 2 4 6 8
RADIAL DISTANCE (mm)
1.5
1 .o
0.5
0.0 t I I I I 0 2 4 6 0
RADIAL DISTANCE (mm)
Bo 0 1.17
0.92 = 0.66 0 0.44 8 0.31
Bo a 1.04
0.84 W 0.60 0 0.42 W 0.30
80 a 1.00
0.67 0. 0.50
0.80
F i g u r e A.2 Radia l P r o f i l e s o f L o c a l Equ iva lence Rat io f o r Methano l S p r a y s o f V a r y i n g O v e r a l l Equ iva lence Rat io (Do = 65, 50 and 35 urn>

a
H-53
H-441
122
M-57
M-44
H-33 M-30
Figure A.3 Fraunhofer Diffraction Patterns produced by N-Heptane (0 = 53, 41 and 33 urn) and Methanol (D = 57, 44 and 30 urn) Sprays (0, = 0.7)

* u L w U W ry
a
LL '3L 0 I- L c3
- - I
1 .o
0.5
N-HEPTANE; D=53~1m
n n ! .I w.w ' . l 1 10 100
SPARK ENERGY (mJ)
B 0 1.80
1.39 W 1.13 0 0.78
0.59
1 .o
0.5
0.0
1 .o
0.5
N-HEPTANE; D=41~1r
B 0 1.42
1.10 0.88
0 0.69 0.44
I I - ... I
. 1 1 10 100 SPARK ENERGY (mJ)
N-HEPTANE: D=33~a
B a 1.15
0.83 8 0.60 0 0.45
0.0 I I
. 1 1 10 100 SPARK ENERGY (mJ)
Figure A . 4 Effect o f Spark Energy and Equivalence Ratio on the Ignition Frequency of N-Heptane Sprays (0 = 53, 41 and 33 urn)

I
* u L w
w Qt Lb
a a
1 .o
0.5
HETHANOL; 0=57um
0.0 ! I I 1 10 100
SPARK ENERGY (mJ)
HETHANOL; 0=44~11n 1 .o
0.5
0.0 1 10 100
SPARK ENERGY (mJ)
1.0 z W 3 0 W PL Lb 0.5
B Q 1.51
1.25 0.93
4 0.n m 0 . a
1 0 1.17
0.99 0.79
* 0.59 0.6
1 a 1.15 + 0.94
0.62 0 0.63
. l 1 10 too SPARK ENERGY (mJ)
F i g u r e A . 5 E f f e c t of S p a r k E n e r g y a n d E q u i v a l e n c e Rat io o n t h e I g n i t i o n F r e q u e n c y of Me thano l S p r a y s (D = 57, 44 and 30 urn)
.
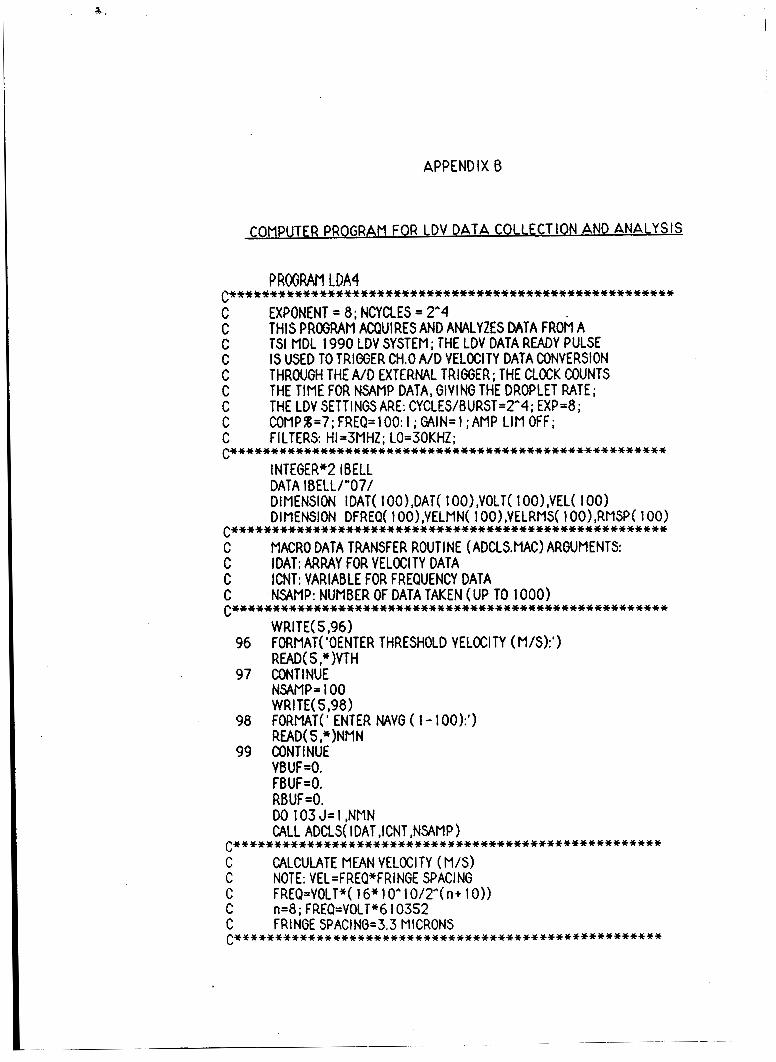
x
APPENDIX 8
COMPUTER PROGRAM FOR LDV DATA COLLECTION AND ANALYSIS
PROGRAM IDA4
EXPONENT = 8 ; NCYCLES = 2^4
TSI MDL 1990 LDV SYSTEM ; THE LDV DATA READY PULSE IS USED TO TRIGGER CH.0 A/D VELOCITY DATA CONVERSION THROUGH THE A/D EXTERNAL TRIGGER; THE CLOCK COUNTS THE TIME FOR NSAMP DATA, GIVING THE DROPLET RATE; THE LDV SETTINGS ARE: CYCLES/BURST=2^4; EXP=8;
. . . . . . . . . . . . . . . . . . . . . . . . . . . . . . . . . . . . . . . . . . . . . . . . . . . . . . .
C
C C C C C C COMPX=7;fREQ=lOO:l; GAIN=l;AMP LIMOFF; C FILTERS HI=3MHZ; LO=30KHZ; C*****************************************************
C THIS PROGRAM ACQUIRES AND ANALYZES DATA FROM A
INTEGER*2 IBELL DATA IBELL/"07/ DIMENSION IDAT( 1 OO),DAT( 1 OO),VOLT( 1 OO),VEL( 100) DIMENSION DFREQ( 1 OO),VELMN( 1 OO),VELRMS( lOO),RMSP( 100) . . . . . . . . . . . . . . . . . . . . . . . . . . . . . . . . . . . . . . . . . . . . . . . . . . . . . .
C MACRO DATA TRANSFER ROUTINE (ADCLS.MAC) ARGUMENTS: C I DAT: ARRAY FOR VELOCl TY DATA C ICNT: VARIABLE FOR FREQUENCY DATA C NSAMP: NUMBER OF DATA TAKEN (UP TO 1000) . . . . . . . . . . . . . . . . . . . . . . . . . . . . . . . . . . . . . . . . . . . . . . . . . . . . . .
WRITE(5,96) FORMAT('0ENTER THRESHOLD VELOCITY ( M/S):') READ( 5 ,*)VTH
NSAMP= 100 WRITE( 598) FORMAT(' ENTER NAVG ( 1 - 100):') READ( 5 ,*)NMN
VBUF=O. FBUF=O. RBUF=O. DO 103 J= 1 ,NMN CALL ADCLS( IDAT,ICNT,NSAMP) . . . . . . . . . . . . . . . . . . . . . . . . . . . . . . . . . . . . . . . . . . . . . . . . . . . . .
C CALCULATE MEAN VELOCITY (MIS) C NOTE: VEL =FREQ*FRI NGE SPACl NG C FREQ=VOLT*( 16* 1 OA 10123 n+ IO)) C n=8;FREQ=VOLT*610352 C FRINGE SPAClNG=3.3 MICRONS . . . . . . . . . . . . . . . . . . . . . . . . . . . . . . . . . . . . . . . . . . . . . . . . . . . . .
96
97 CONTINUE
98
99 CONTINUE

I
SUM=O. DO 100 I= 1 ,NSAMP VOLT( I )=S.*FLOAT( IDAT( I ))/4095. VEL( I )=VOLT( I )*2.0 142 IF (VEL( I).GT.VTH) GO TO 100 SUM=SUM+VEL( I)
VELMN( J)=SUM/NSAMP
CALCULATE RMS VELOCl TY ( M/S)
SUMM=O. DO 101 I=l,NSAMP SUMM=SUMM+( (VEL( 1 )-VELMN( J))**2)
SUMMM=SUMM/FLOAT(NSAMP) VELRMS( J)=SQRT(SUMMM)
.................................................... C CALCULATE DROPLET RATE (KHZ): (CLOCK RATE=O. 1 KHZ) . ...................................................
RATE=O. 1 DFREQ( J)=FLOAT( NSAMP)/( FLOAT( ICNT)/RATE)
100 CONTINUE
. . . . . . . . . . . . . . . . . . . . . . . . . . . . . . . . . . . . . . . . . . . . . . . . . . . . C ....................................................
101 CONTINUE
RMSP( J)=VELRMS( J)/VELMN( J)
. . . . . . . . . . . . . . . . . . . . . . . . . . . . . . . . . . . . . . . . . . . . . . . . . . . . C STORE VALUES FOR MEAN . . . . . . . . . . . . . . . . . . . . . . . . . . . . . . . . . . . . . . . . . . . . . . . . . . . .
VBUF=VBUF +VELMN( J FBUF=FBUF+DFREQ(J) RBUF=RBUF +DFREQ( J)
103 CONTINUE . . . . . . . . . . . . . . . . . . . . . . . . . . . . . . . . . . . . . . . . . . . . . . . . . . . C CALCULATE MEAN VALUES C***************************************************
VELMNM=VBUF/FLOAT( NMN) OFREQM=FBUF/FLOAT( NMN) TINTM=RBUF/FLOAT( NMN) WRITE(S,l04)DFREQM ,VELMNM,TINTM
104 FORMAT(' MEAN VALUES (N,V,T): ',3F7.3) WRITE(S,lOOO)IBELL
1 000 FORMAT( ' +' A 1 ) GO TO 97 STOP END

SUBROUTINE ADCLSMAC:
.TITLE ADCLS
.GtOBL ADCLS ADCSR= 170400 ADBUF=170402 CCSR= 1 70420 CBUF = 1 70422
ADCLS: CLR ADCSR CLR ADBUF CLR CCSR CLR CBUF MOV 2(RS),Rl MOV 4(RS),R2 MOV @6( R5) ,R3 B IS *55 ,CCSR BIS*20ADCSR
BGE LOOP MOV ADBUF ,( R 1 )+ SOB R3,LOOP B IS * 1 000 ,CCSR MOV CBUF ,(R2) CLR ADCSR CLR ADBUF CLR CCSR CLR CBUF RTS PC
.END
LOP: TSTB ADCSR
;ADCLS.MAC MAKES IO00 A/D ;CONVERSIONS ON CH.0 ;OF VELOCl TY DATA FROM ;THE ANALOG OUTPUT OF ;THE LDV TIMER. I T ALSO ;RECORDS THE t* OF COUNTER ;TICS DURING ACQUISITION ;TO GIVE DROPLET FREQUENCY
;IVOLT ARRAY LOCATION ;ICNT VARIABLE LOCATION ;SET NSAMP ;SET RATE=O. I KHZ, MODE=2, GO ;SET A/D CH=O, EXT. TRIG. ENABLE ;CHECK IF CONV. DONE ;LOOP TILL DONE (NEGATIVE) ;PUT IVOLT( I ) INTO ARRAY ;COUNT* OF CONVERSIONS :SIMULATE ST2 INPUT ;READ COUNTER * INTO ICNT

I
[ 11 r 2 I 13 I [4 I 15 1 [6 1 17 I [ 8 1 19 I t 101 1 1 1 1 [ 121 [ 131 141
[ 151 161
[ 171 r 151
191 r201 [21 I [22 I I23 I [24 1 [25 I 126 1 r271 I28 1 [291 [30 1 131 I 132 I [33 I [34 1
[ 11 r21 [3 I t41 15 I 16 I
t l l t2 I t3 I 14 I 15 1
APPENDIX C
APL IGNITION FREQUENCY MODEL PROGRAM
V ~ G N I T I O N ; N ~ F H I B A R ~ P H I S T D ~ F H I ~ E ~ ~ N ~ D R O P ~ O M E G A ~ C P A ; R H O A ~ L N B ~ D T S T ~ ~ R O B ~ C ~ ~ B ~ ~ 'INPUT THE SPARK GAP DROPLET DIAIlETER:' mop + 0 ' INPUT OMEGA * ' OMEGA - 0 ' INPUT THE MEAN SPARK GAP EQU I VALEtJCE RAT IO : ' PHIBAR + 0
1 NPUT THE STANDARD DEU I AT I ON OF THE SPARK EQU I UALEHCE RAT I 0 (PERCENT) : ' PHISTD + 0 N + SO M + NX28 ' I tiPUT THE STANDARD DEU I AT I ON OF THE SPARK ENERGY (PERCENT) : ' ESTD + 0 PHI + SIMNORM ti PHI - PHIBAR + <<(PHISTDx.Ol)xPHIBAR)xPHI) PHIT - PHtx<PHi>a) PHI + PHlT + <(PHIT=O)x.Ol> PHI + (28 5 0 ) ~ F H l ESPARK+SPARKV ESTD CPA + 1200 RHOA + .271 DTST - 1983 RHOF + 685 LHB + 1.92 Ell IN - .676xCFAxDTSTx<RH@A+'O. 5 ) EMllJ + EMINx<(RHOF+LNB>*1.5)x(DROP*3)x<(< l-OMEGA>+FHI >*1.5> El l IN - Ell I Nx 1E' 15 PROB + <+/(EM I NSESPARK) )+N FROB - (28 1)PPROB I I
I 8
' THE SPARK EHERG I ES AHD I GH I T I ON PROBAB I L I T I ES ARE : ' ESPIIN ~ FROB ,- COtlB - ESFMt4, FROB NUMPUT COMB
V Z + SFFiWJ EST0 ;ESPEXP jGiiE jI.1 ;ESFARK OltE - < 1 50)~OtiE-1 ESPEXP + ESFMN + . x ONE
ESFRRK - SlllMoRW W ESPRRK + (28 5O)PESFARK Z + ESPEXP + <<<ESTDx.Ol)xESFEXF)xESPARK)
ri + 50x28
vZ+S I MtiORtl ti ;A jB ;THETA j R tJ+N+2 R+UNIFORfl N 6-UN I F O W I N THETA+<o2)xA

VITA
A l len M. Dank was born in . He
attended Denison University, f r o m which he graduated i n 1977 with a Bachelor
o f Science degree in Physics. A f te r working at Owens Corning Fiberglas
Research Center f o r several years, he enro l led a t Drexel University in the
F a l l of 1980 t o pursue graduate studies. He recieved a Master of Science
degree in Mechanical Engineering in June of 1982 and a Doctor of Philosophy
degree in Mechanical Engineering in September of 1987. During th is period,
he served as a Hess Fellow, a graduate research assistant and a teaching
assistant in the Mechanical Engjneering and Mechanics Department.
Mr. Danis has co-authored s ix technical papers i n t-he areas of spray
ignition and diesel emissions while studying at Drexel. He was also awarded
the Frederic 0. Hess Fellowship in Combustion in 1982 and 1984.
Mr. Danis was elected t o associate member of Sigma X i in 1986 and
promoted t o f u l l member in 1987. He i s also a member of the American
Society of Mechanical Engineers, the Society of Automotive Engineers and the
Combustion Institute.