
© 2008 Tzu-Ying Chen ALL RIGHTS RESERVED - Rutgers University

Walking and Cycling forALL New Jerseyans
Prof. John Pucher, Rutgers Universityhttp://policy.rutgers.edu/faculty/pucher
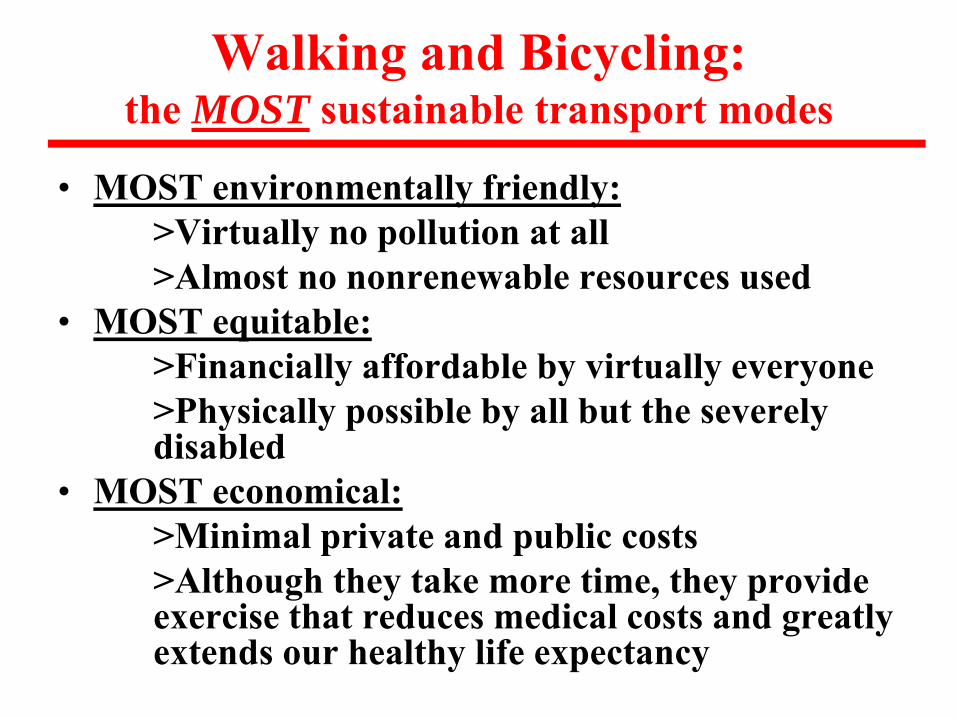
Walking and Bicycling: the MOST sustainable transport modes
• MOST environmentally friendly:>Virtually no pollution at all>Almost no nonrenewable resources used
• MOST equitable:>Financially affordable by virtually everyone>Physically possible by all but the severely disabled
• MOST economical:>Minimal private and public costs>Although they take more time, they provide exercise that reduces medical costs and greatly extends our healthy life expectancy
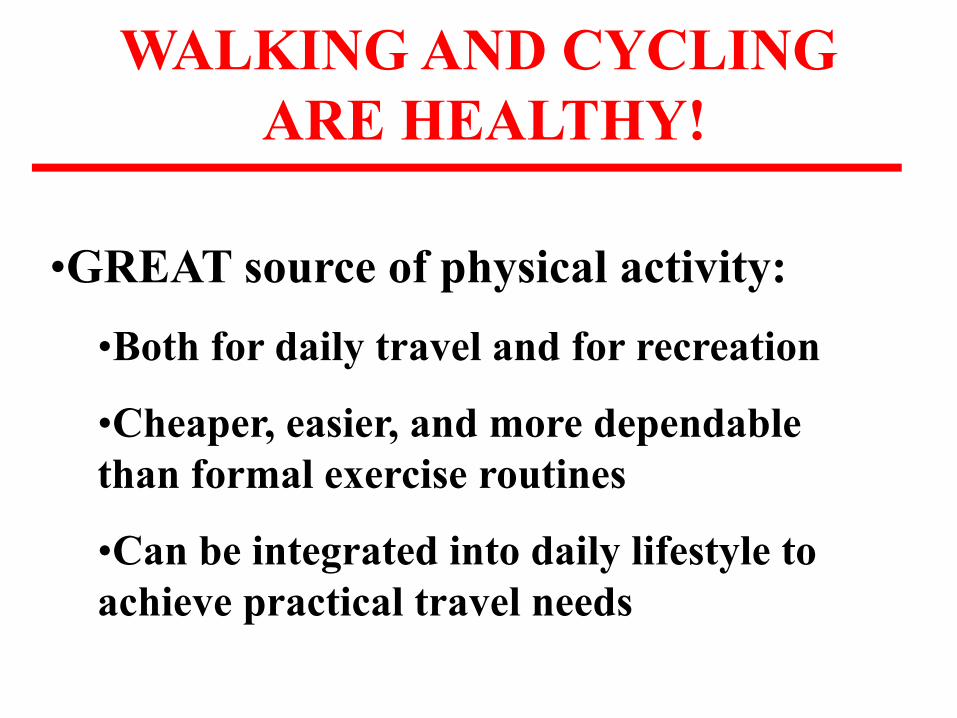
•GREAT source of physical activity:•Both for daily travel and for recreation
•Cheaper, easier, and more dependable than formal exercise routines
•Can be integrated into daily lifestyle to achieve practical travel needs
WALKING AND CYCLINGARE HEALTHY!

Crucial importance of regular physical exercise:
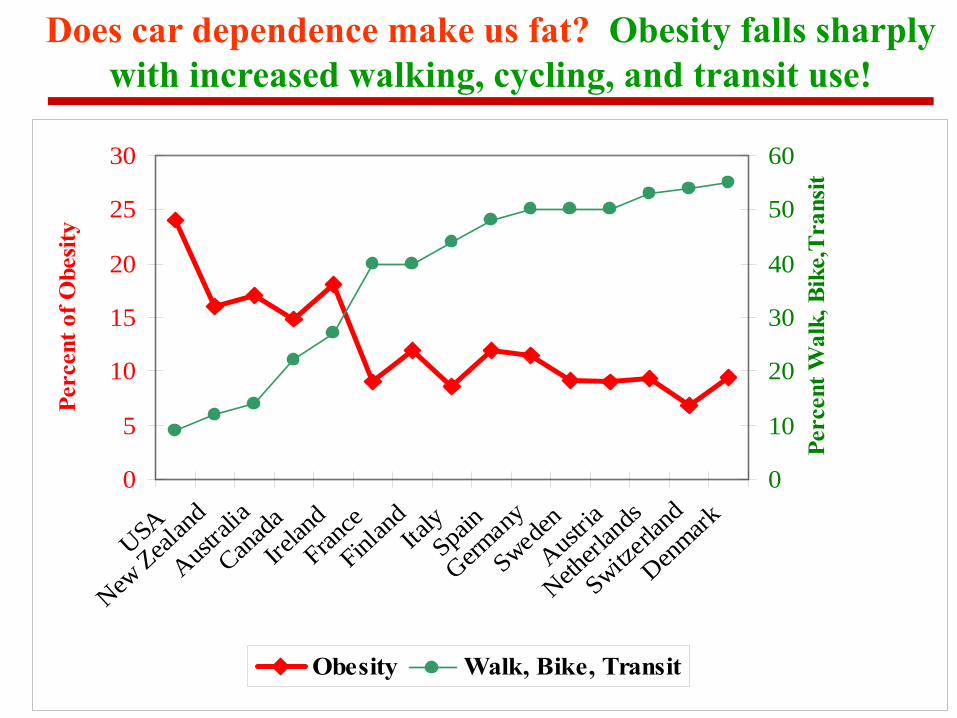
• Obviously, the daily physical exercise of walking and cycling for practical travel helps burn up calories and helps avoid the problems of overweight and obesity
• Moreover:
“Whether normal-weight, overweight, or obese, physically inactive persons are 2 to 3 times more likely to die prematurely."
Journal of Am. Med. Assoc. (1999)
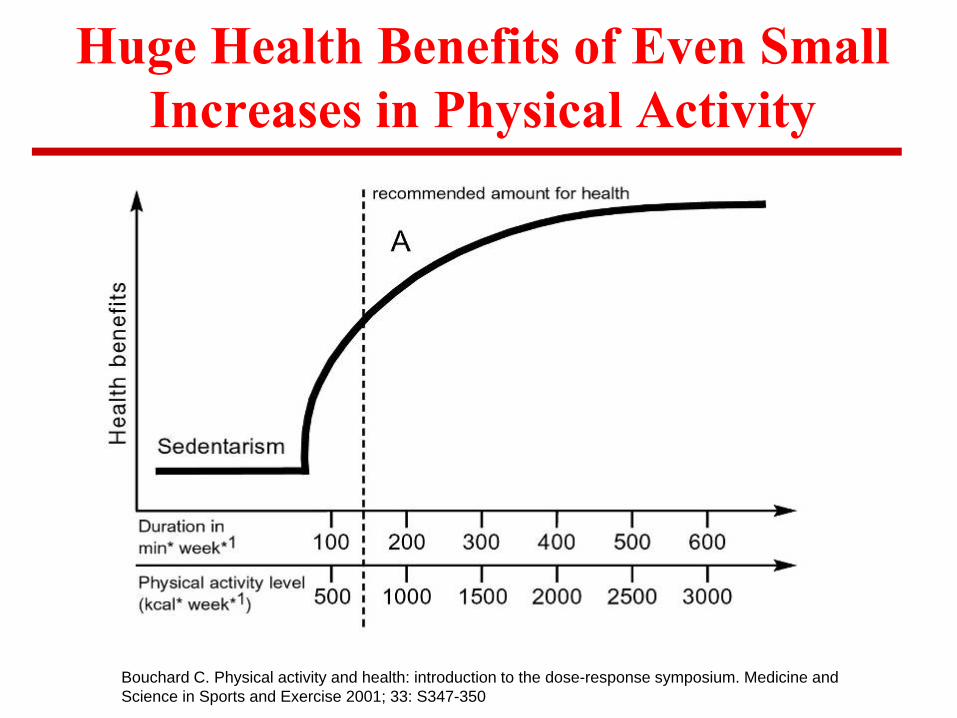
Huge Health Benefits of Even Small Increases in Physical Activity
Bouchard C. Physical activity and health: introduction to the dose-response symposium. Medicine and Science in Sports and Exercise 2001; 33: S347-350

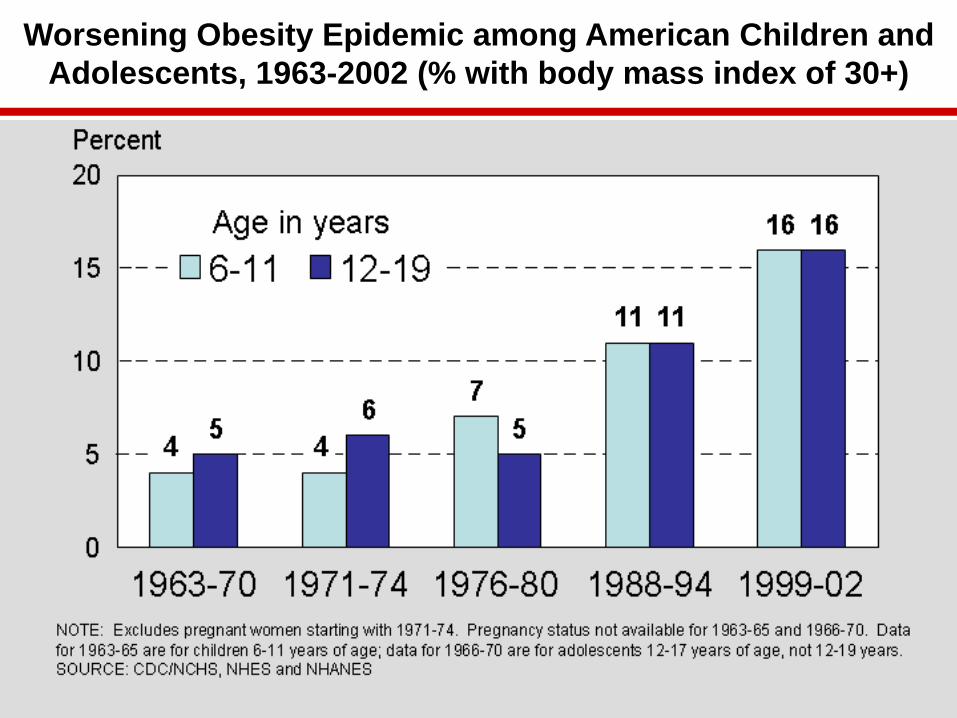
Worsening Obesity Epidemic among American Children and Adolescents, 1963-2002 (% with body mass index of 30+)

Obesity Rate by Country (Body Mass Index ≥
30)
0.0 5.0 10.0 15.0 20.0 25.0 30.0 35.0
USAUK
AustraliaNew Zealand
CanadaIreland
GermanyFinland
DenmarkNetherlands
SwedenAustriaFrance
ItalySw itzerland
JapanKorea
Obesity Rate by Country (Body
Mass Index ≥ 30)(percentage of adults)
0
5
10
15
20
25
30
USA
New Zeal
and
Austral
ia
CanadaIre
landFran
ce
Finland Ita
lySpa
in
German
y
SwedenAust
ria
Netherl
ands
Switzerl
and
Denmark
Perc
ent o
f Obe
sity
0
10
20
30
40
50
60
Perc
ent W
alk,
Bik
e,T
rans
it
Obesity Walk, Bike, Transit
Does car dependence make us fat? Obesity falls sharply with increased walking, cycling, and transit use!

3%5%
9%11%
22%
16%
22% 21% 22% 22% 23% 25%
1%1% 2%
2%
8%
3% 4%4%
9% 9% 10%
18%
16%
23%
11%
26%
1%0.5%
0
0.1
0.2
0.3
0.4
0.5
0.6
USA* ('08)
Australia*
('06)
USA ('08)
Canada* (
'06)Ire
land* (
'06)UK ('0
8)Belg
ium ('99)
France
('08)Austri
a ('05)
Norway ('0
1)Finl
and ('0
5)Sweden
( '06)
Germany (
'08)Denmark
('08)
Netherl
ands ('
08)Pe
rcen
t of t
rips
by
bicy
cle
and
foo
Walking Cycling
*data for commute only
Share of Trips by Cycling and Walking

0.4
0.80.9 1.0 1.1 1.1 1.0 1.1 1.2 1.1 1.1 1.1 1.0
1.31.1
0.80.1
0.20.1 0.1 0.1
0.2 0.5 0.4 0.4 0.50.7 0.7
0.9
1.0 1.52.4
0.0
0.5
1.0
1.5
2.0
2.5
3.0
3.5
USA UKPort
ugal
Spain
Greece
France
Irelan
d
Italy
Austria
EU-15 Aver
ageSwed
enFinn
land
Belgium
German
yDenm
arkNeth
erland
sK
ilom
eter
s of w
alki
ng a
nd c
yclin
g pe
r da
Walking Cycling
Daily Distance Walked and Cycled Per Person

• 25% of all trips ≤ 1 mile• 40% of all trips are ≤ 2 miles
Lots of Potential for Increased Walking and Cycling in the USA:
Many daily trips in American urban areas are short enough to make by bike!

Lots of Potential for Increased Walking and Cycling in the USA:
•Possible at any age, except for very young and very old
•Women as well as men
•Possible for wide range of skills and physical abilities
•Affordable by everyone

25%27%
30%
55%
49%
56%
52% 53%56%
60%
49%
56%
10%
20%
30%
40%
50%
60%
70%
USA UK Canada Denmark Germany Netherlands
Perc
ent o
f trip
s by
wom
en
Cycling Walking
Women’s Share of Bike and Walk Trips in Europe and
North America

3224 20 20 21
31
17 19 2230 31
19 1813 13
18 21 24 23 19 21283
2
22
15
7 79
10 10 32
20
14 14 1515
15
40
25
2122
23
1511 12 10 9 13
0.8 0.8 0.7 0.5
1 1
0
10
20
30
40
50
60
70
5-15
16-2
425
-39
40-6
565
+
0-16
17-2
930
-59
60-6
565
+
0-17
18-2
526
-45
46-6
060
-65
65 +
10-1
9'20
-29
30-3
940
-49
50-5
960
-69
70-8
4
0-17
18-2
526
-44
45-6
465
+
Age Group
Perc
ent o
f trip
s by
foot
and
bik
eWalking Cycling
USA Germany Denmark NetherlandsUK
Bike and Walk Share of Trips by Age Group
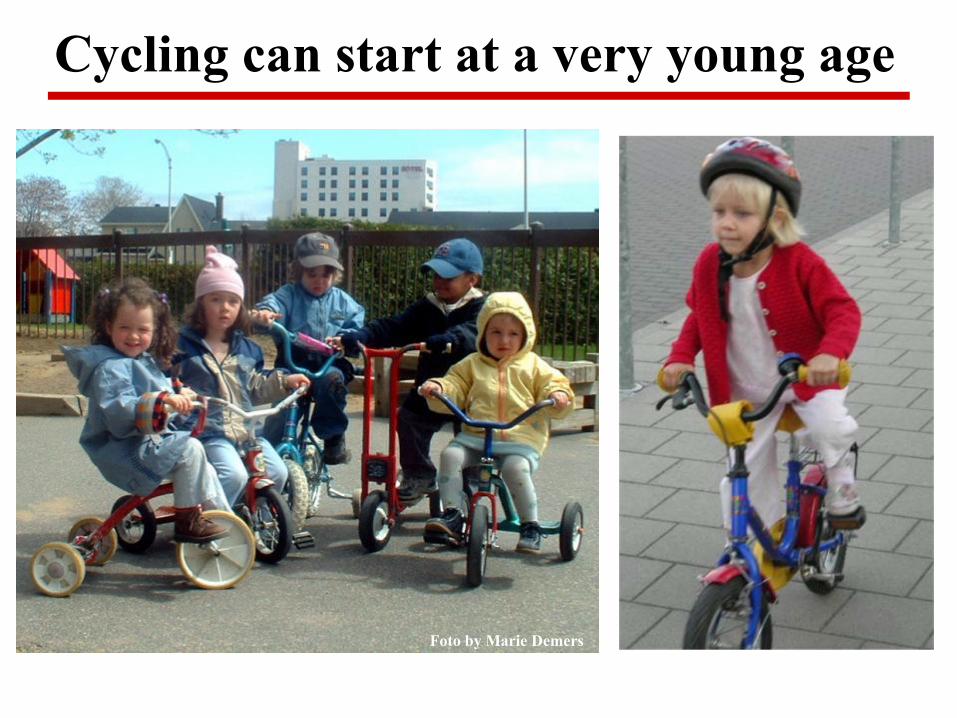
Cycling can start at a very young age
Foto by Marie Demers
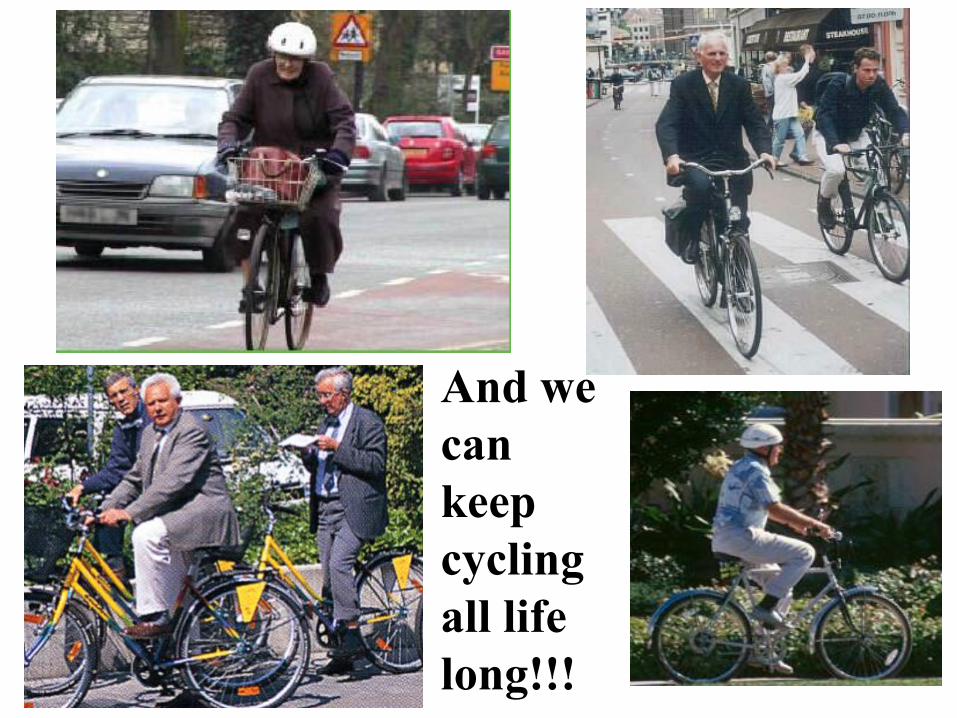
And we can keep cycling all life long!!!

Pucher: Biking for all Texans
Mother and kids cycling together in Amsterdam

Parents and kids cycling together in Portland
Pucher: Walking and Cycling for Health
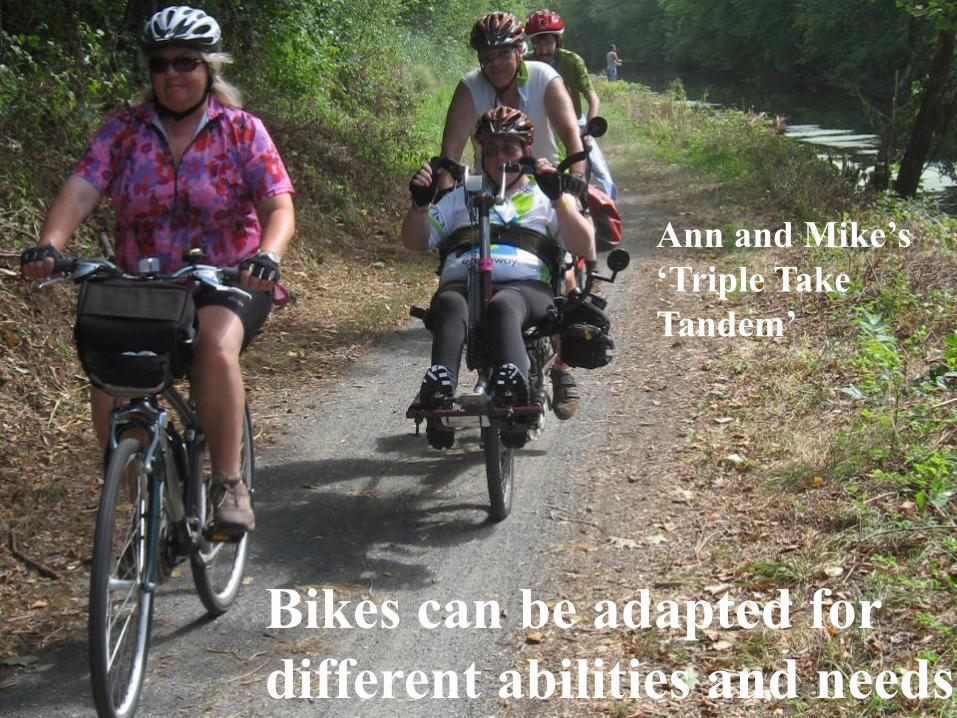
Bikes can be adapted for different abilities and needs
Ann and Mike’s ‘Triple Take Tandem’

•Especially important for the young, the old, for anyone with disabilities, for the timid or risk-averse
•Women more sensitive to safety than men
•Safety of walking and cycling in the Netherlands, Denmark, and Germany helps explain high levels of walking and cycling there
Make Walking and Cycling Safe forEveryone !

5.5
1.62.3
1.9
3.6
9.7
1.3 1.3
2.4
3.3
13.7
1.11.6 1.6
3.3
1.6 1.5
4.75.7
33.5
0
2
4
6
8
10
12
14
16
18
20
NL DK GER UK USA
Cyc
list a
nd P
edes
tria
n Fa
talit
y an
d In
jury
Rat
e
Cylists killed per 100 million km cycled 2008
Cylists injured per 10 million cycled 2008
Pedestrians killed per 100 million km walked
Pedestrians injured per 10 million km walked
≠
Cyclist and Pedestrian Fatality and Injury Rates

0
20
40
60
80
100
120
140
160
1970
1972
1974
1976
1978
1980
1982
1984
1986
1988
1990
1992
1994
1996
1998
2000
2002
2004
2006
2008
Tota
l cyc
list f
atal
ities
rela
tive
to 1
970
(=10
0
USAUKDenmarkGermanyNetherlands
Trends in Cyclist Fatalities
0
20
40
60
80
100
120
1970
1972
1974
1976
1978
1980
1982
1984
1986
1988
1990
1992
1994
1996
1998
2000
2002
2004
2006
2008
Tota
l ped
estri
an fa
talit
ies r
elat
ive
to 1
970
(=10
0
USAUKDenmarkGermanyNetherlands
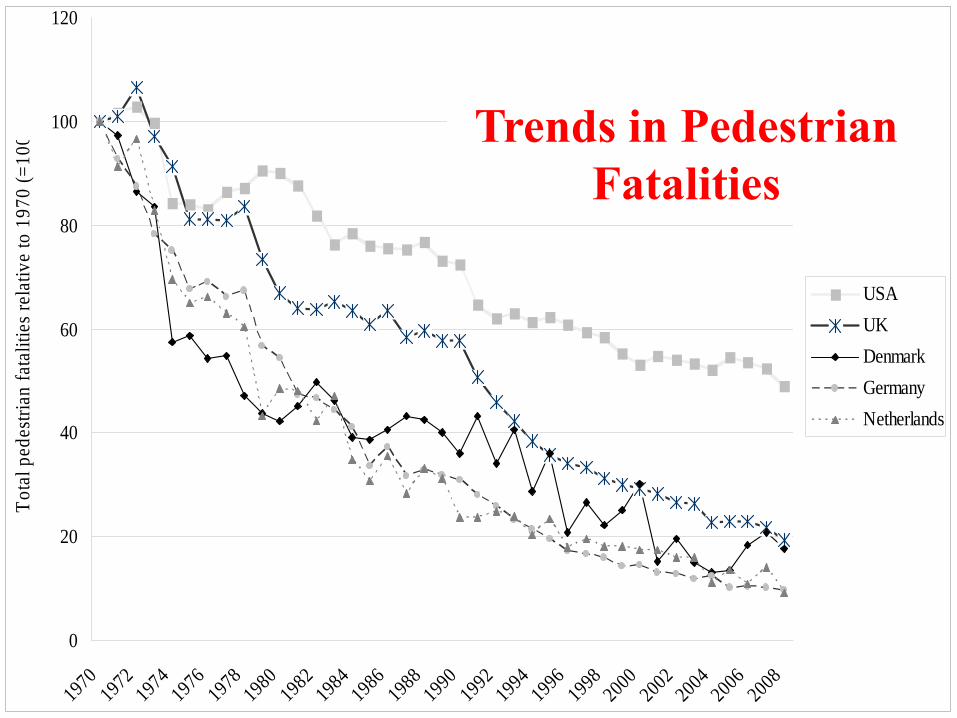
Trends in Pedestrian Fatalities

SAFETY IN NUMBERS
•As levels of cycling increase, injury and fatality rates per trip and per km traveled fall dramatically
•Thus, if we can increase cycling, it will almost inevitably be safer

• Pro-car policies in European cities in 1950s and 1960s caused huge decline in cycling
• Dramatic policy turn-around since 1970s to limit car use and promote cycling, walking, and public transport in Dutch, Danish, and German cities
Public Policies Crucialto Increase Cycling

Bridge in Freiburg BEFORE and AFTER reforms
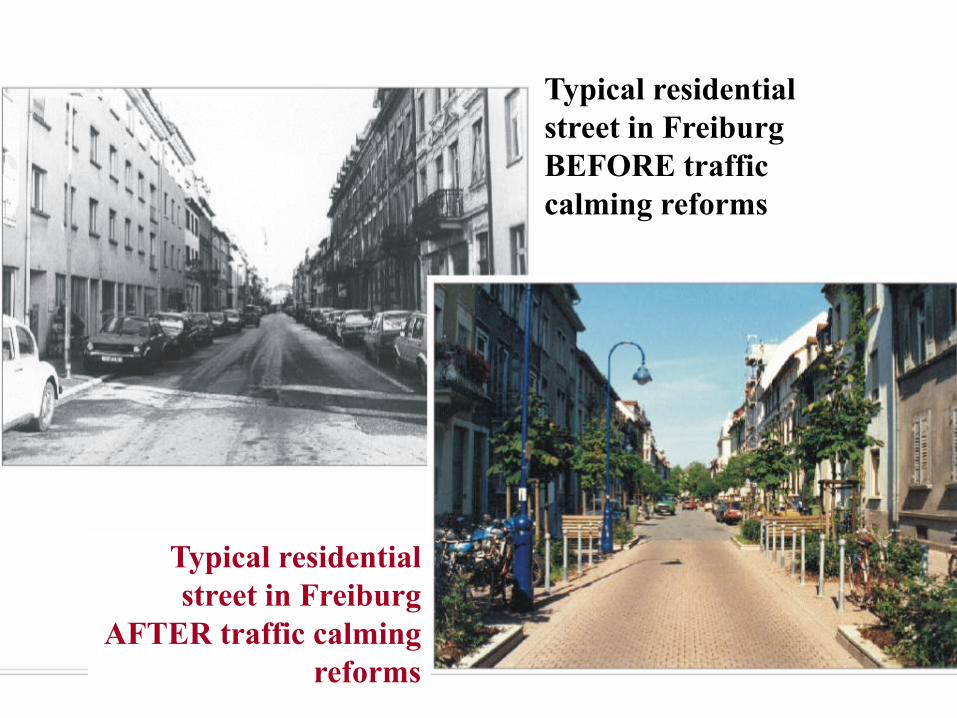
Typical residential street in Freiburg BEFORE traffic calming reforms
Typical residential street in Freiburg
AFTER traffic calming reforms
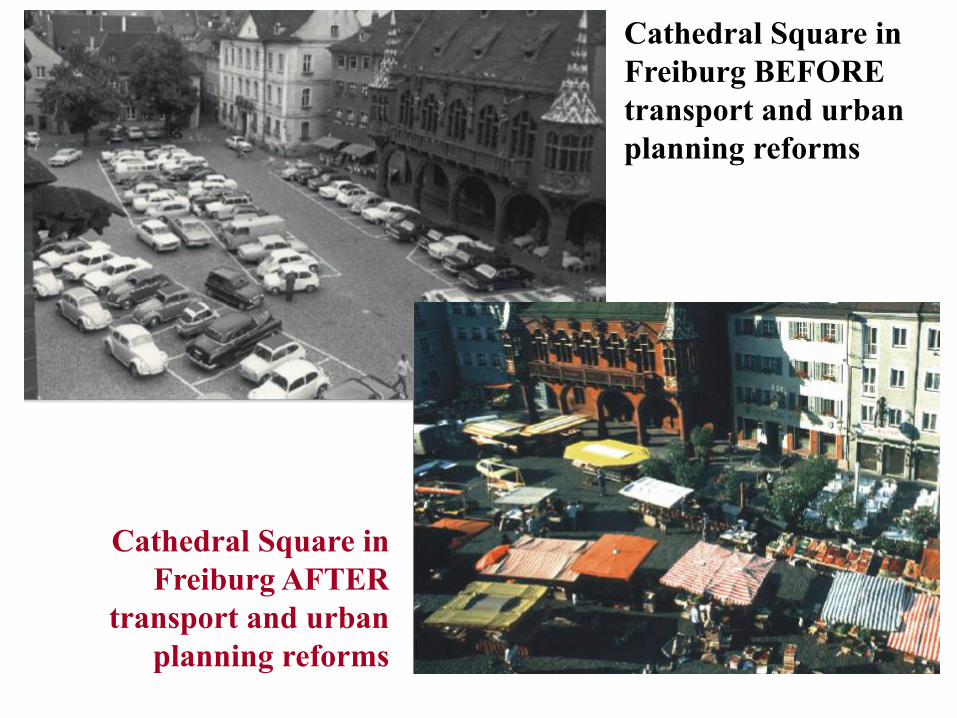
Cathedral Square in Freiburg BEFORE transport and urban planning reforms
Cathedral Square in Freiburg AFTER
transport and urban planning reforms
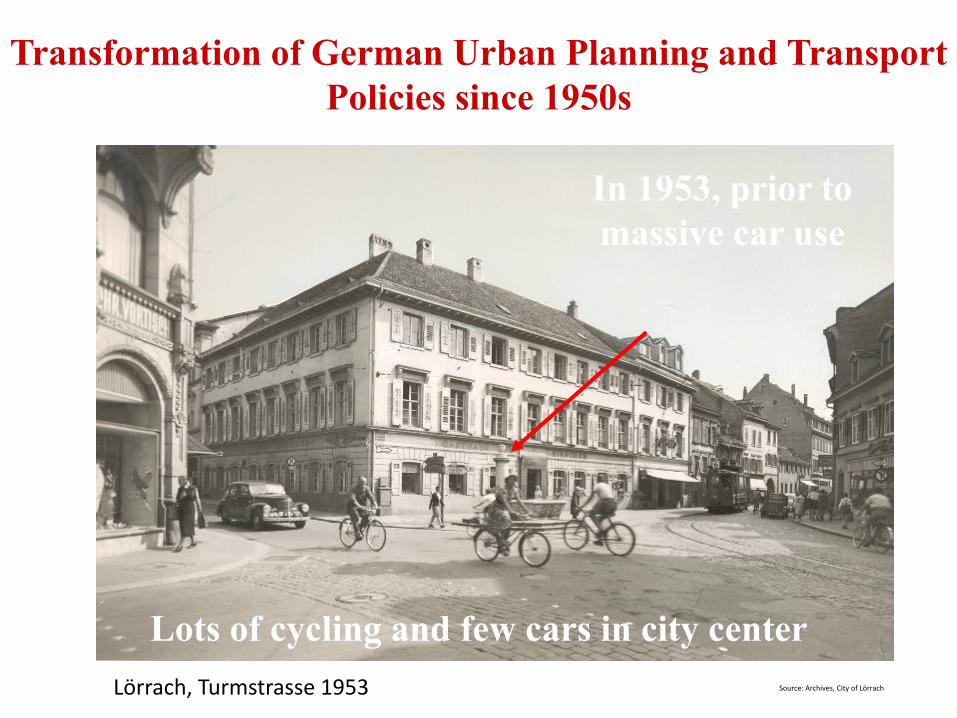
Lörrach, Turmstrasse 1953 Source: Archives, City of Lörrach
Transformation of German Urban Planning and Transport Policies since 1950s
In 1953, prior to massive car use
Lots of cycling and few cars in city center
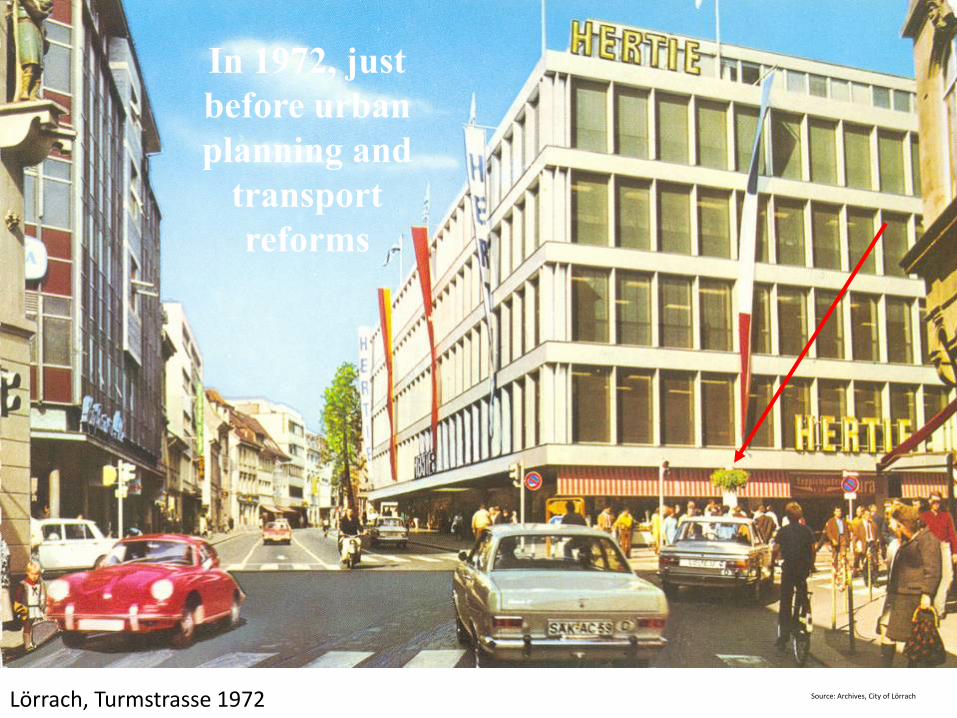
Lörrach, Turmstrasse 1972 Source: Archives, City of Lörrach
In 1972, just before urban planning and
transport reforms
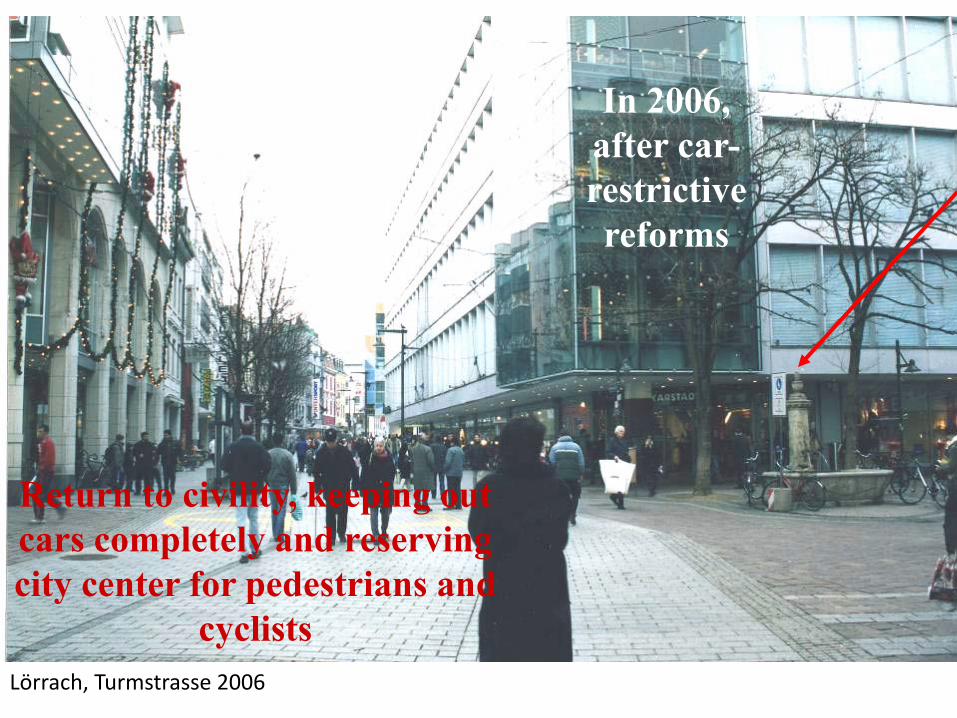
Lörrach, Turmstrasse 2006
In 2006, after car-restrictive reforms
Return to civility, keeping out cars completely and reserving city center for pedestrians and
cyclists

German Cycling Boom Engineered by Explicit Shifts in Transport Policy in 1970s
City Time PeriodChange in Bicycle Modal Split Share
Percentage Increase in Bicycle Share
Munich 1976 to 1996 6% to 13% +117%
Nuremberg 1976 to 2001 4% to 9% +125%
Cologne 1976 to 1998 6% to 12% +100%
Freiburg 1976 to 1998 12% to 19% +58%
Stuttgart 1976 to 2000 2% to 6% +200%
Bremen 1976 to 1997 16% to 21% +31%
Muenster 1976 to 2001 29% to 35% +21%
Average for all urban areas in Western Germany
1972 to 2002 8% to 10% +25%
Sources: Broeg and Erl, Mobilitaet und Verkehrsmittelwahl. Muenchen: Socialdata, 2003; Deutsches Institut fuerWirtschaftswissenschaften, Mobilitaet in Deutschland, 2002. Berlin: Bundesministerium fuer Verkehr, 2004.

Source: Pucher, Dill, and Handy, “Infrastructure, Programs, and Policies to Increase Bicycling,” Preventive Medicine, Jan 2010, Vol. 50, S.1, pp. S106-S125.
Increase in Bike Share of Trips in Cities Around the World

Source: Pucher, Dill, and Handy, “Infrastructure, Programs, and Policies to Increase Bicycling,” Preventive Medicine, Jan 2010, Vol. 50, S.1, pp. S106-S125.
Increase in Bike Share of Trips in Cities Around the World
Year:0 0
50
100
150
200
250
300
350
Bridge Bicycle Traffic
Bikeway Miles
Bridge Bicycle Traffic
Bikeway Miles
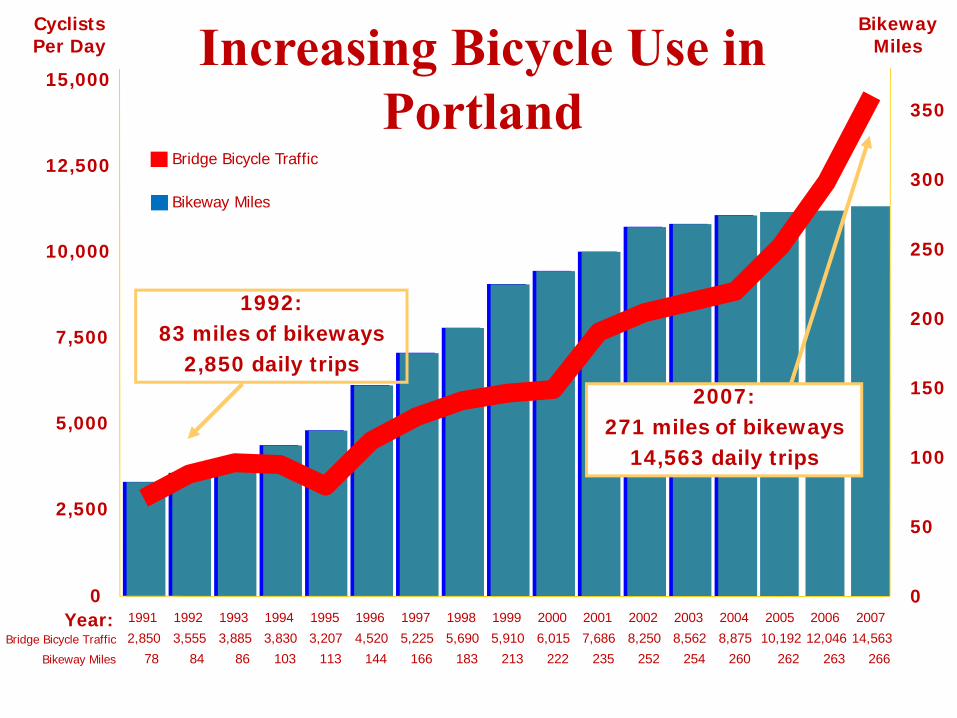
Increasing Bicycle Use in Portland
BikewayMiles
1992:83 miles of bikeways
2,850 daily trips2007:
271 miles of bikeways14,563 daily trips
1991 1992 1993 1994 1995 1996 1997 1998 1999 2000 2001 2002 2003 2004 2005 2006 2007
2,500
5,000
7,500
10,000
12,500
15,000
2,850 3,555 3,885 3,830 3,207 4,520 5,225 5,690 5,910 6,015 7,686 8,250 8,562 8,875 10,192 12,046 14,56378 84 86 103 113 144 166 183 213 222 235 252 254 260 262 263 266
CyclistsPer Day

Decreasing Crash Rate in Portland
Year
Crashes/Crash RateDaily Bicycle Trips
Annual CrashesCrash RateBridge Bicycle Traffic
1991 1992 1993 1994 1995 1996 1997 1998 1999 2000 2001 2002 2003 2004 20050
2,500
5,000
7,500
10,000
100
150
200
250
300
350
400
450
500
550
600

Portland vs. Dallas• Bike share of trips in Dallas FELL:
0.15% in 19900.05% in 2008
• Bike share of trips in Portland ROSE 5-fold:1.15% in 19906.20% in 2008
Differences in cycling policies:• Almost no bikeway facilities in Dallas• Quadrupling in bikeway facilities in Portland
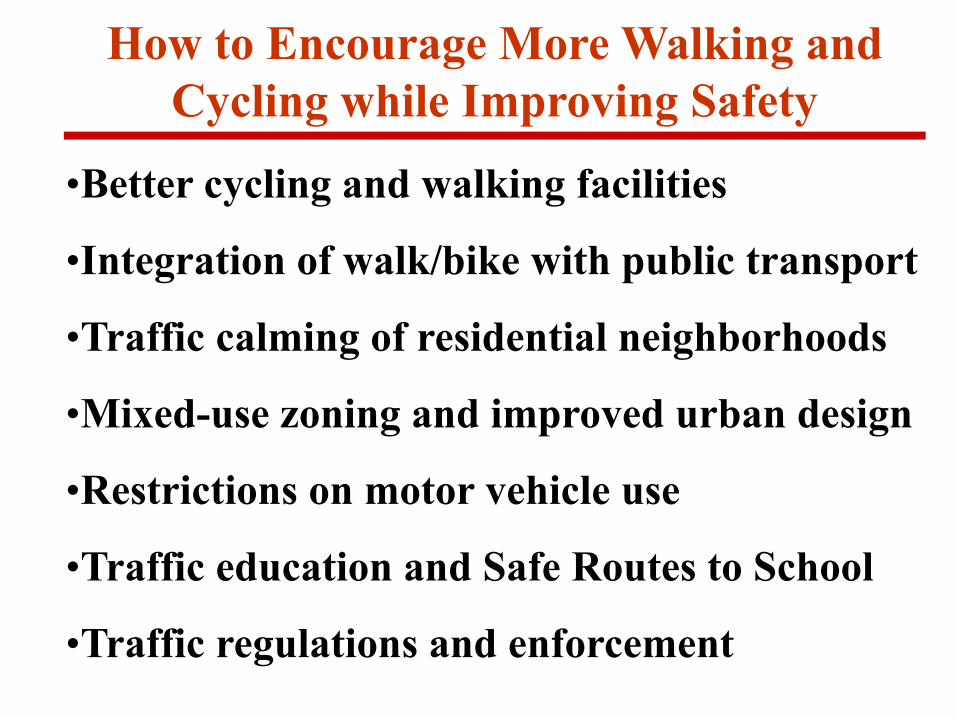
How to Encourage More Walking and Cycling while Improving Safety
•Better cycling and walking facilities
•Integration of walk/bike with public transport
•Traffic calming of residential neighborhoods
•Mixed-use zoning and improved urban design
•Restrictions on motor vehicle use
•Traffic education and Safe Routes to School
•Traffic regulations and enforcement

Most European cities have extensive car-free districts ideal for walking and cycling
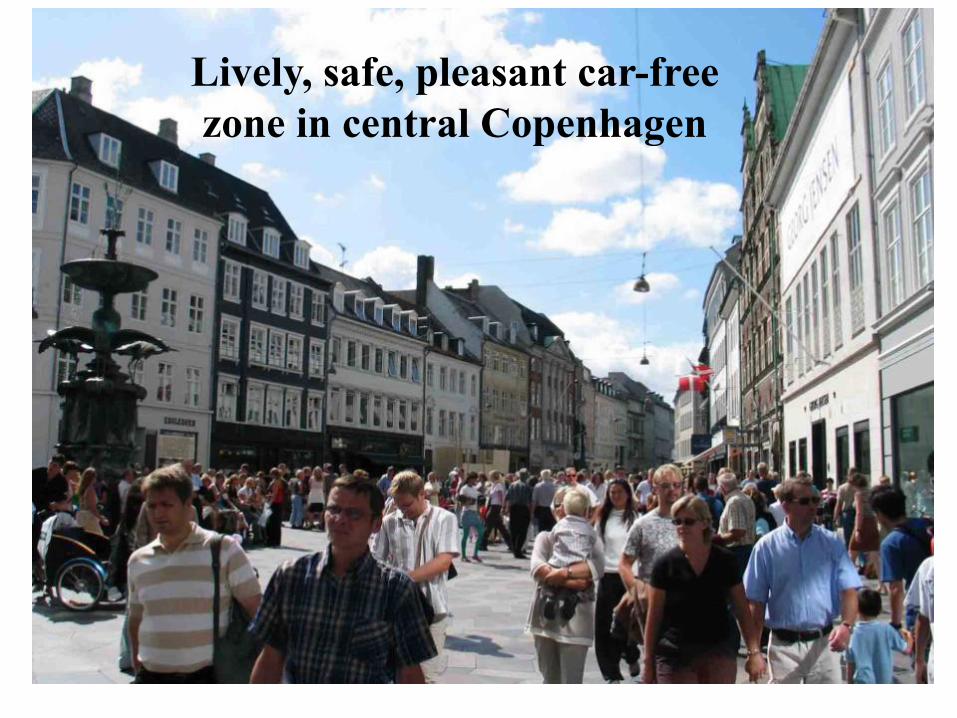
Lively, safe, pleasant car-free zone in central Copenhagen
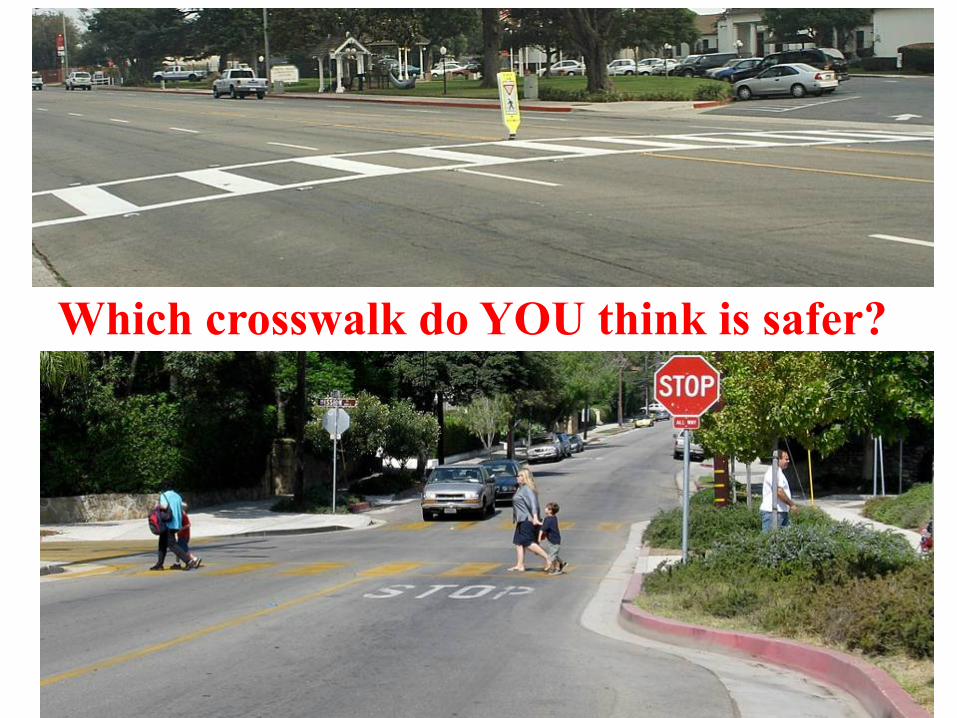
Which crosswalk do YOU think is safer?
Pucher: Walking and Cycling for Health
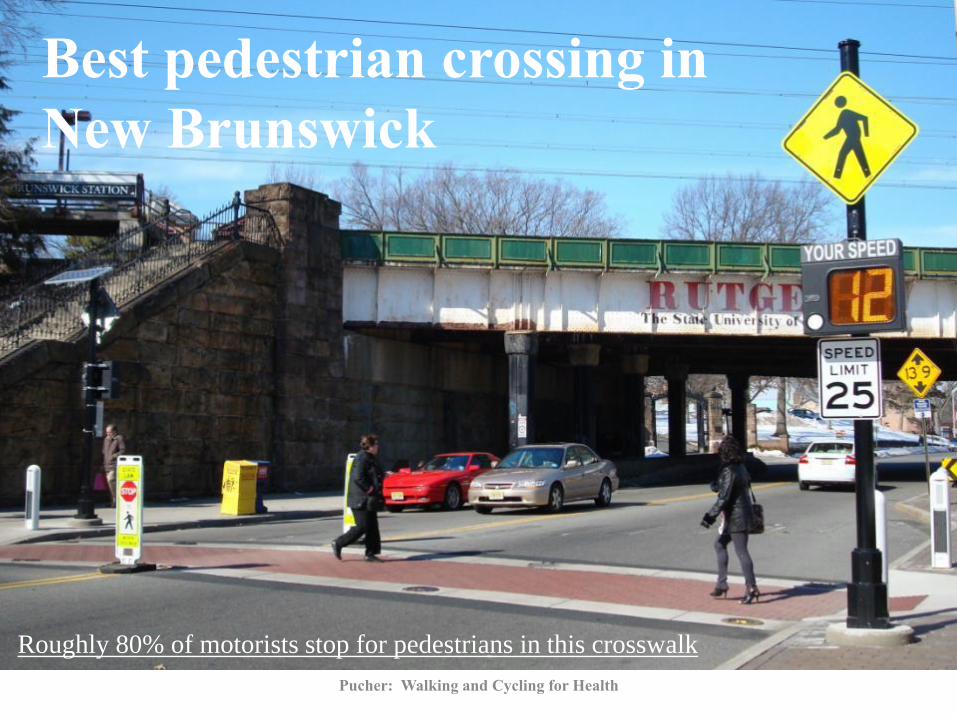
Best pedestrian crossing in New Brunswick
Roughly 80% of motorists stop for pedestrians in this crosswalk

Lousy pedestrian crossing at core of Rutgers University
Only about 20% of motor vehicles yield for pedestrians at this crosswalk on Hamilton Street
Pucher: Biking for all Texans
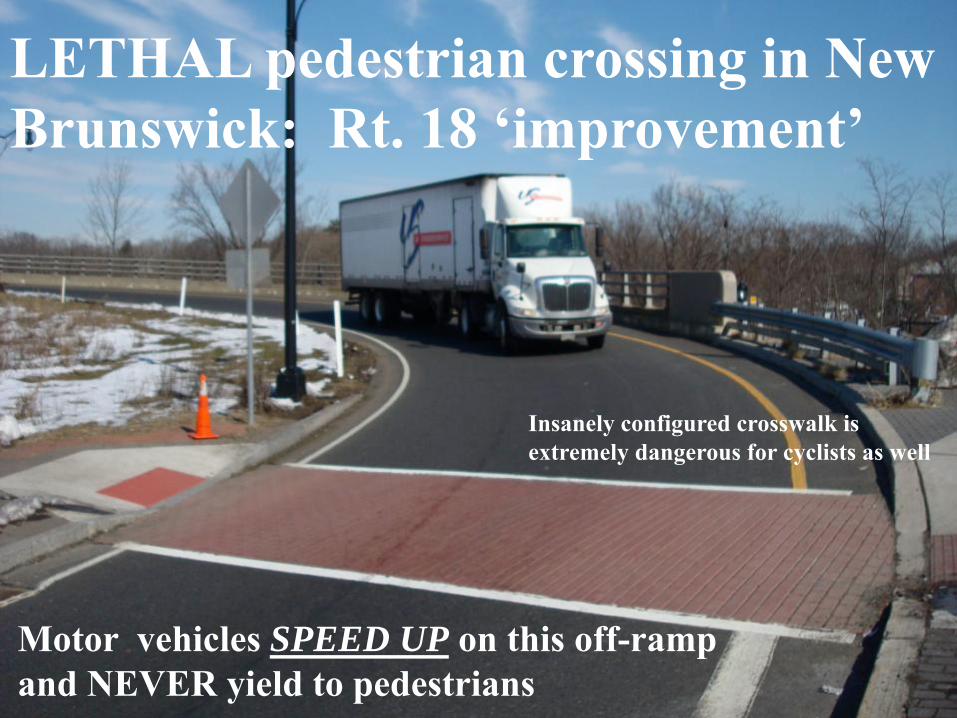
LETHAL pedestrian crossing in New Brunswick: Rt. 18 ‘improvement’
Motor vehicles SPEED UP on this off-ramp and NEVER yield to pedestrians
Insanely configured crosswalk is extremely dangerous for cyclists as well

What idiot designed this crosswalk?
Accelerating motor vehicles coming from the left who NEVER yield to pedestrians
Extremely sharp angles at both ends of crosswalks that force most cyclists to dismount
Good luck making this sharp turn: Non-existent sidewalk at other end

Why 99% of cyclists ride on the walkway and not on the roadway
No provisions of any kind AT ALL for cyclists on this crucial arterial connection between Highland Park and New Brunswick

Every time it rains, water ponds up on Rt. 27, and pedestrians get DRENCHED with bucketsful of water!
Outrageous conditions for pedestrians on most important crossing in Middlesex County!
Photo: Ralph Buehler

Running the gauntlet across the bridge, dodging masses of filthy water splashed by cars and trucks onto the walkway!
Big decision: Which way to hold the umbrella??
Photo: Ralph Buehler
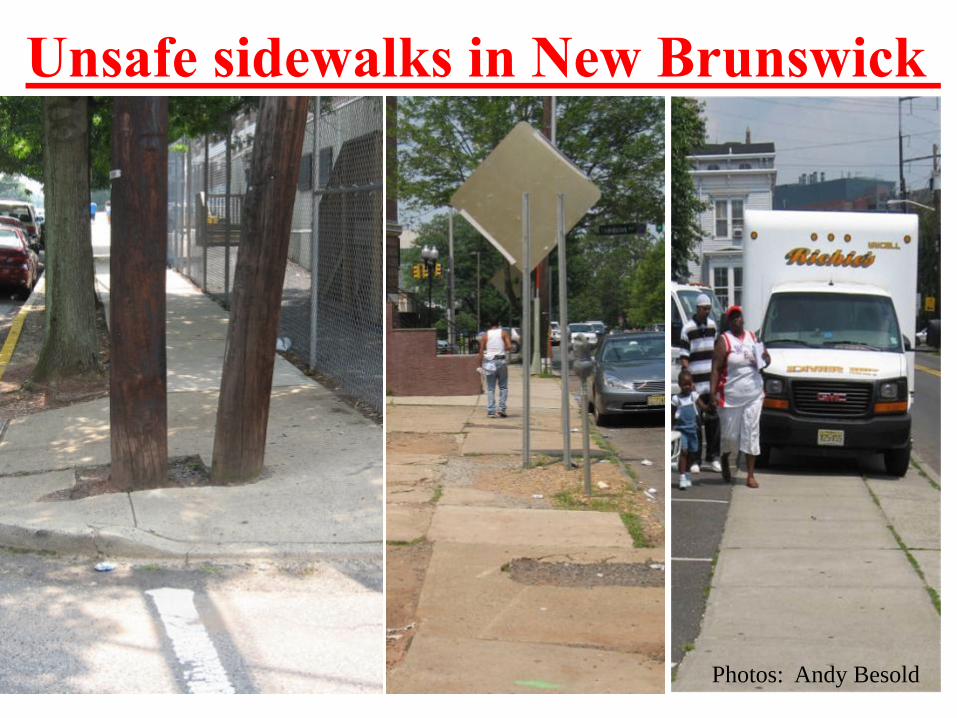
Unsafe sidewalks in New Brunswick
Photos: Andy Besold

My favorite pedestrian walkway in New Brunswick
Plenty of room for cyclists as well! Perfect mixed-use path!

Bike paths such as these make it safe and comfortable for all to bike: including women, children, and seniors

55% of all bike trips in Denmark are by women
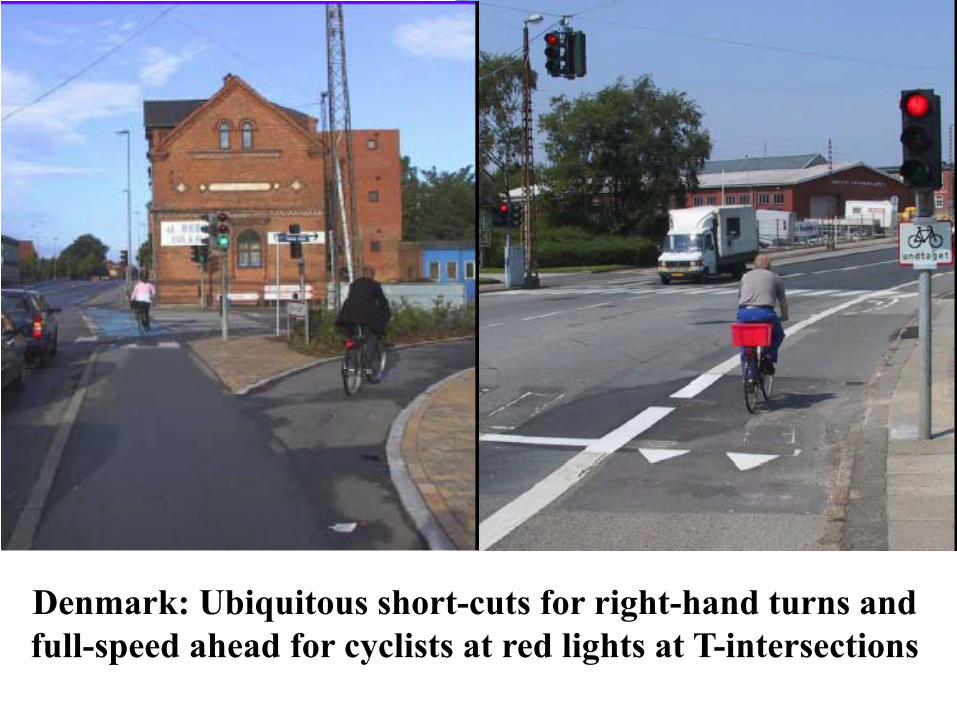
Denmark: Ubiquitous short-cuts for right-hand turns and full-speed ahead for cyclists at red lights at T-intersections

Note exclusive cycle path in middle and completely separate pedestrian walkways on both sides
Bicycle expressway-beltway in Muenster, Germany
•38% of all trips in Muenster are by bike•58% of bike trips are by women•One injury per 608,000 bike trips
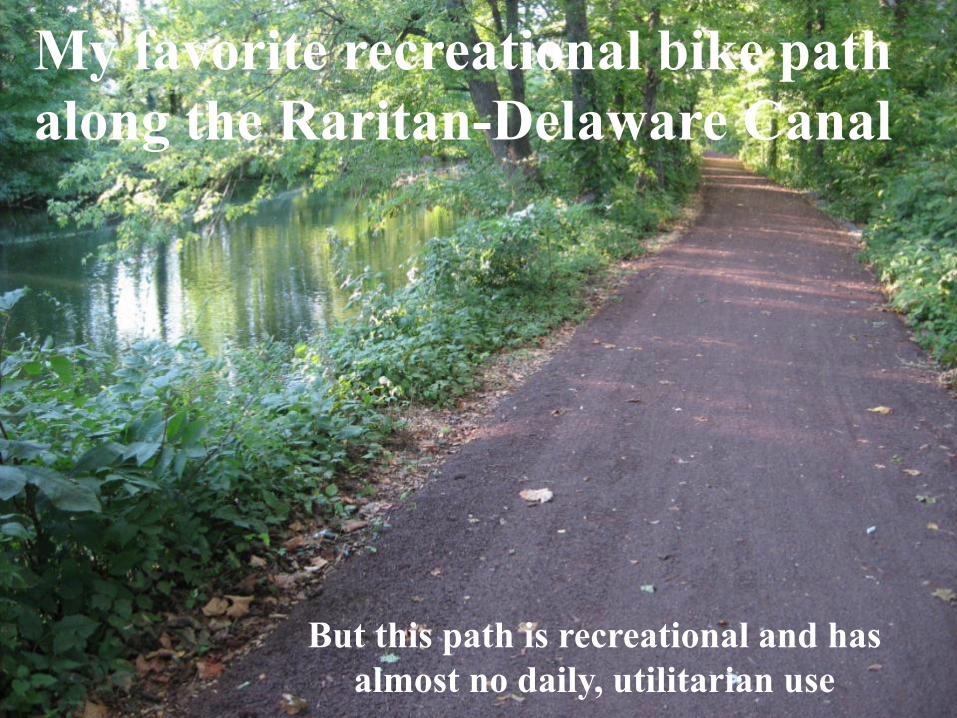
My favorite recreational bike path along the Raritan-Delaware Canal
But this path is recreational and has almost no daily, utilitarian use
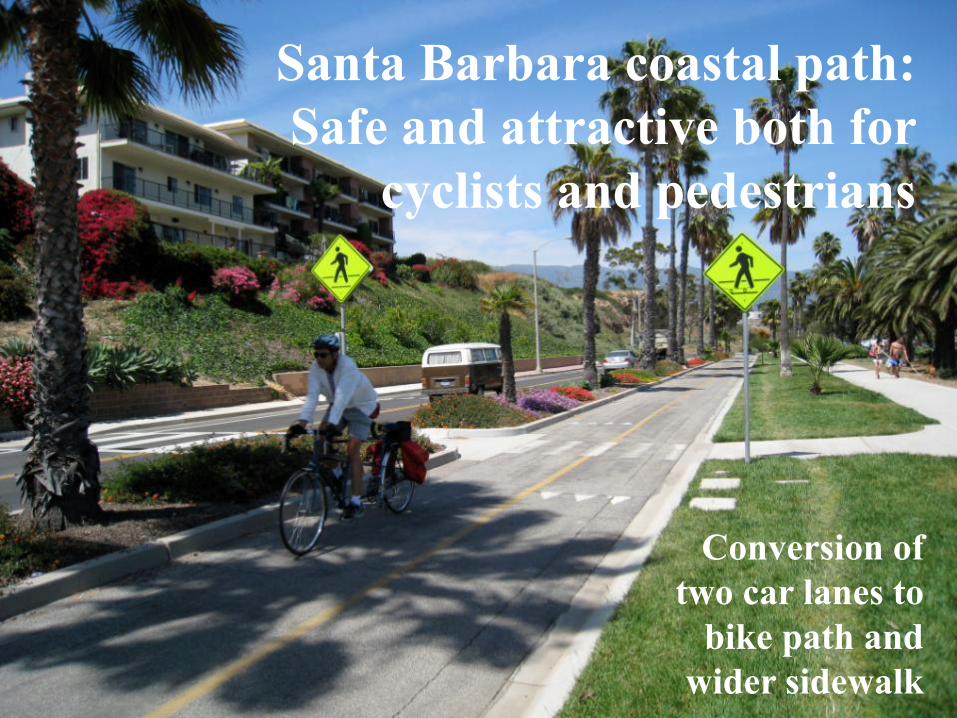
Santa Barbara coastal path: Safe and attractive both for
cyclists and pedestrians
Conversion of two car lanes to
bike path and wider sidewalk
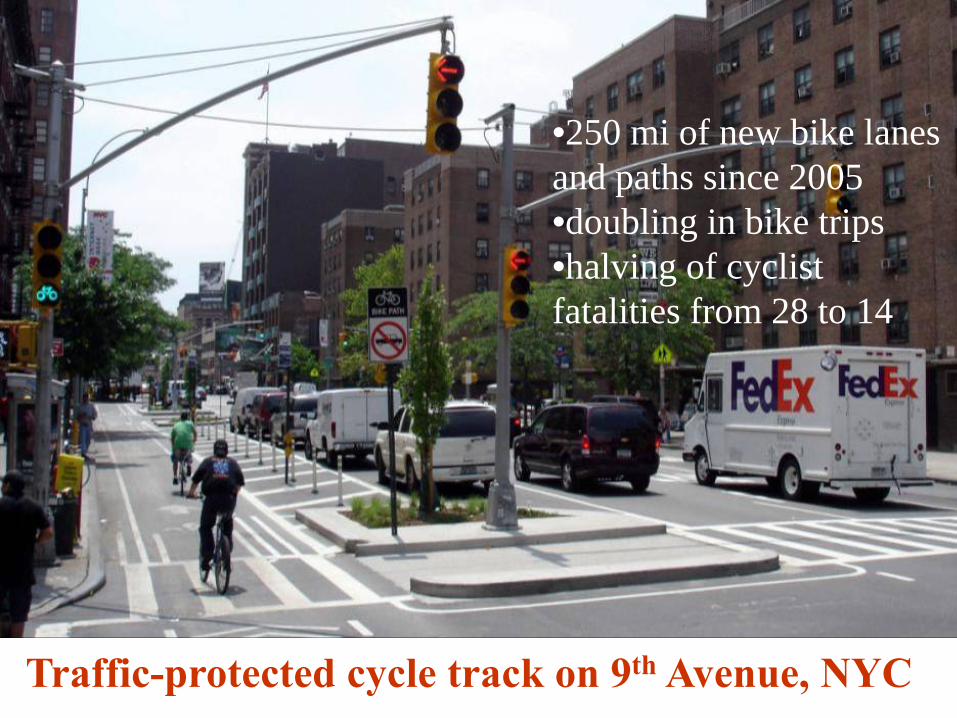
Traffic-protected cycle track on 9th Avenue, NYC
•250 mi of new bike lanes and paths since 2005•doubling in bike trips•halving of cyclist fatalities from 28 to 14

Typical intersection in Copenhagen, with separate crossings for pedestrians and cyclists
From 1996 to 2006, bike share of trips rose from 25% to 38%; fatalities fell 60%

Bike access lane approaching intersection in Dutch city
Netherlands has a cyclist fatality rate only a fifth as high as in the USA
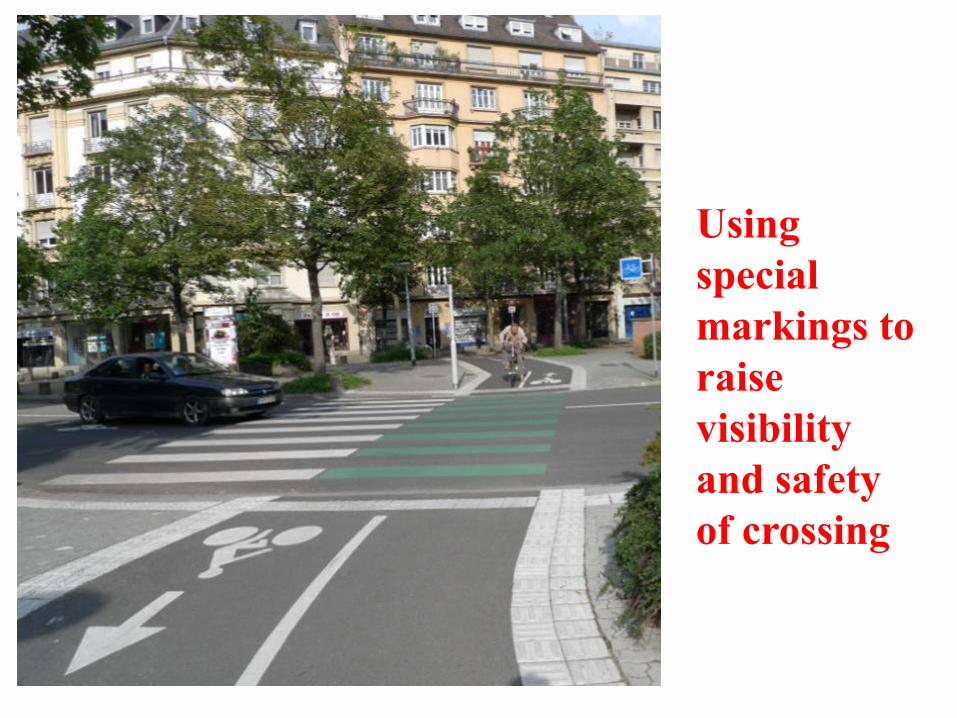
Using special markings to raise visibility and safety of crossing
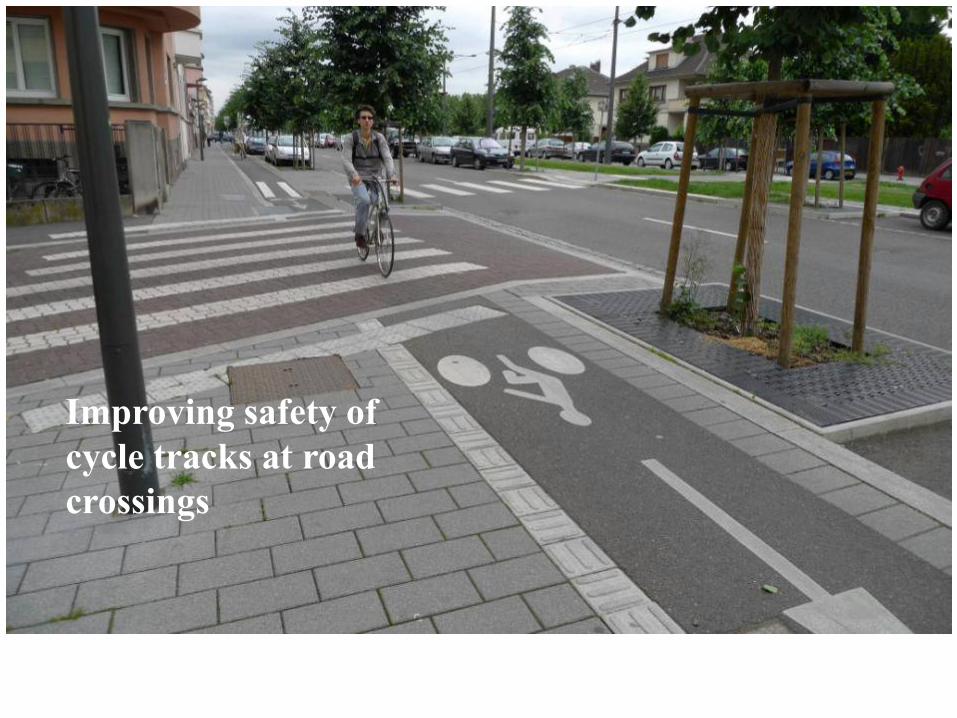
Improving safety of cycle tracks at road crossings
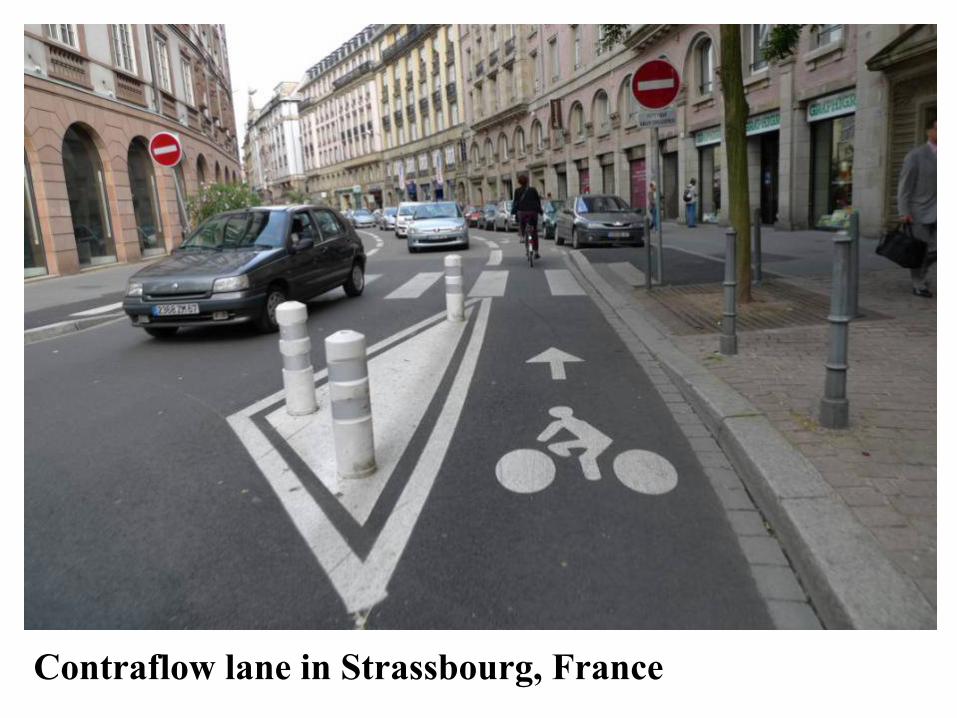
Contraflow lane in Strassbourg, France
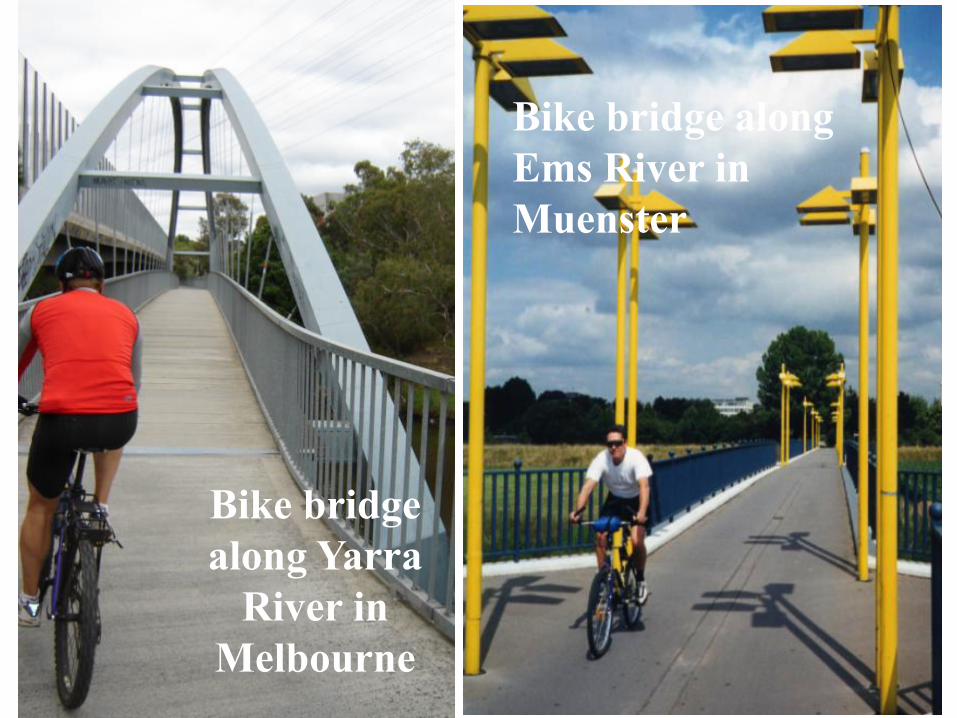
Bike bridge along Yarra
River in Melbourne
Bike bridge along Ems River in Muenster

Delaware & Raritan Canal Path:Ped-bike bridge over Rt. 1 near Trenton
Photo: Andy Besold

Extensive, fully-integrated bikeway network in Freiburg, Germany
CRUCIAL to have full
connectivity of cycling facilities! Usually lacking
in North America
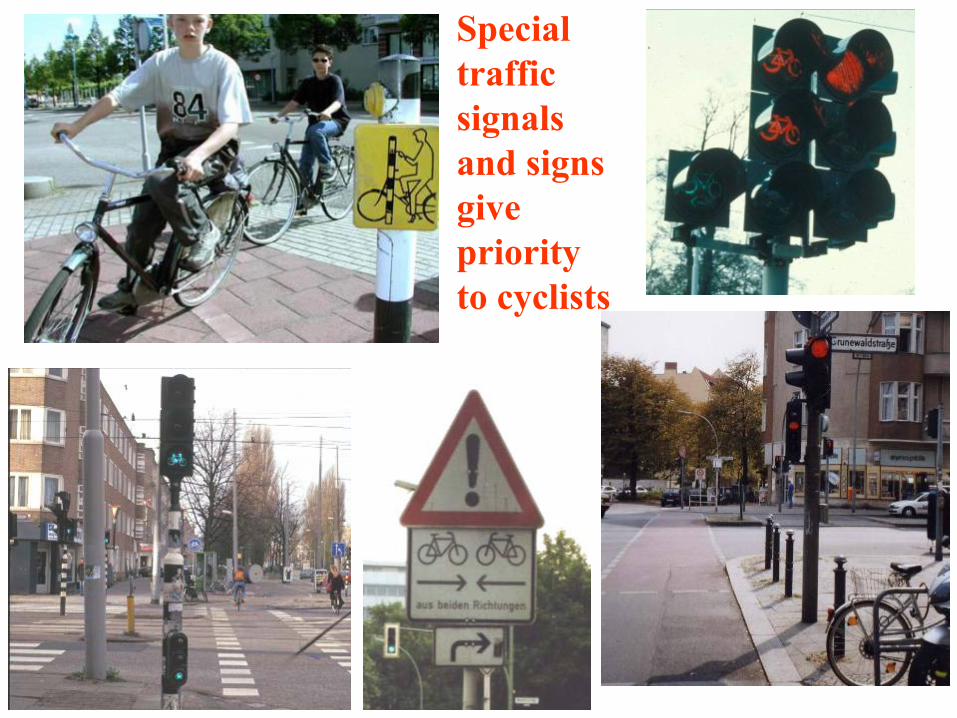
Special traffic signals and signs give priority to cyclists
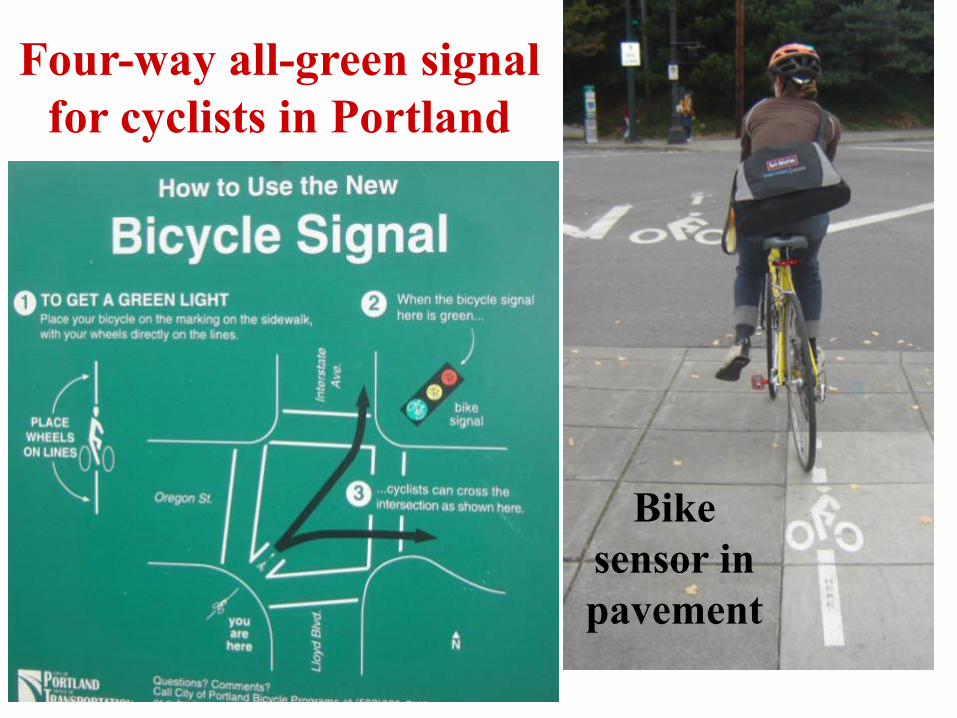
Four-way all-green signal for cyclists in Portland
Bike sensor in pavement
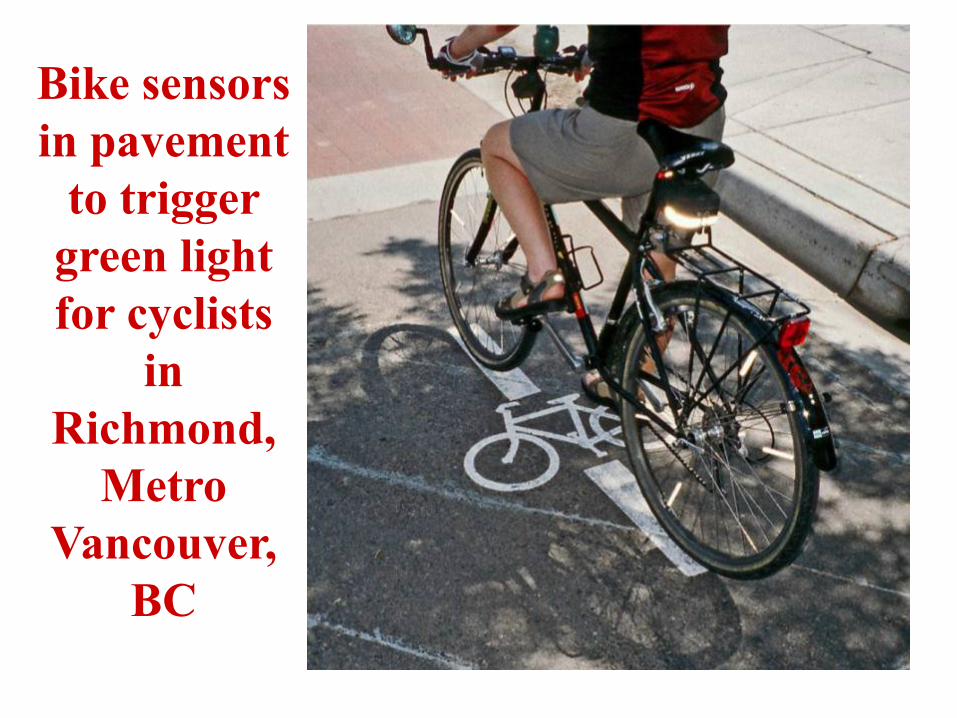
Bike sensors in pavement
to trigger green light for cyclists
in Richmond,
Metro Vancouver,
BC
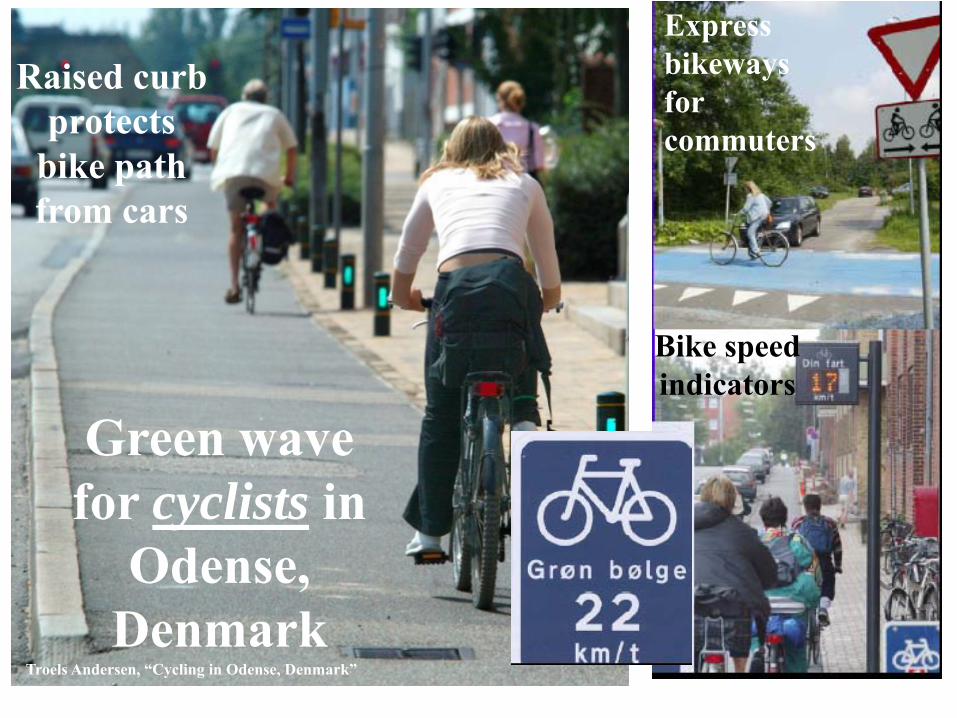
Green wave for cyclists in
Odense, Denmark
Troels Andersen, “Cycling in Odense, Denmark”
Express bikeways for commuters
Bike speed indicators
Raised curb protects
bike path from cars
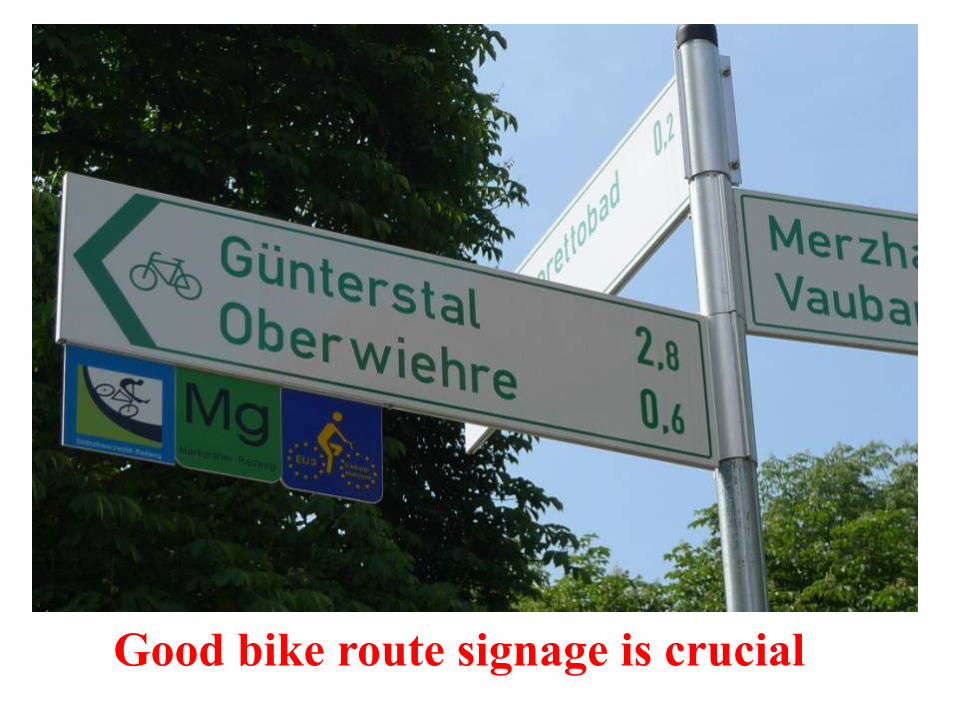
Good bike route signage is crucial

Convenient air pumps for bikes throughout Odense

Traffic Calming of Residential Neighborhoods•Speed limited by law to 30km per hour (19mph) or less
•Physical measures that force cars to slow down:
•Road narrowing, zigzag routing, chicanes
•Raised intersections and crosswalks
•Traffic circles
•Speed humps and bumps
•Mid-block closures and artificial dead-ends
•Bulb-outs at intersections and crosswalks, with sidewalk widening
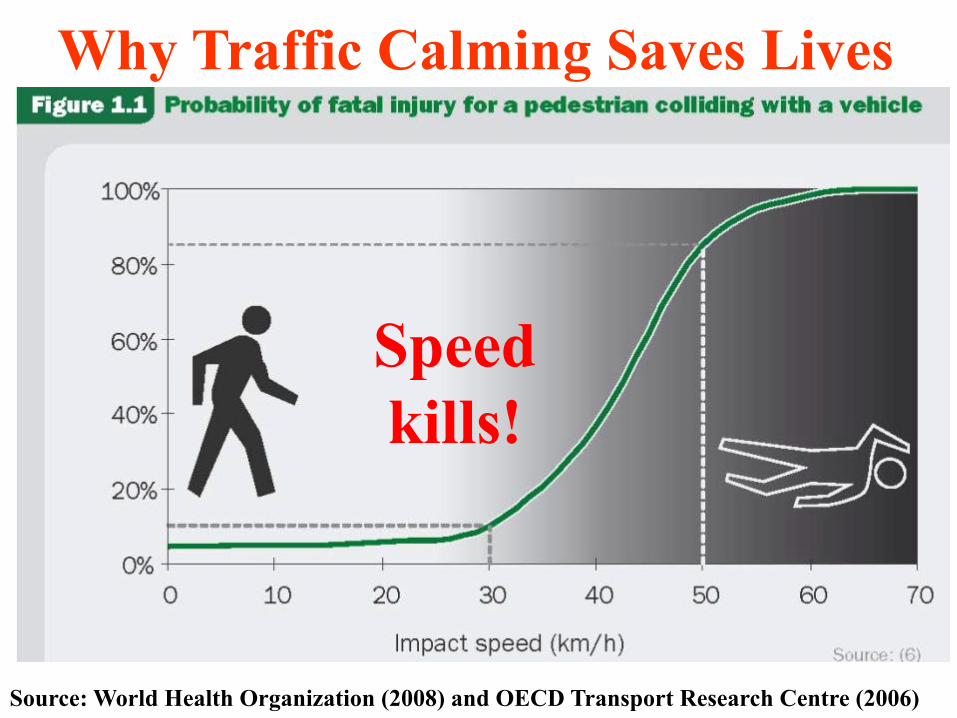
Source: World Health Organization (2008) and OECD Transport Research Centre (2006)
Why Traffic Calming Saves Lives
Speed kills!
Speed kills!
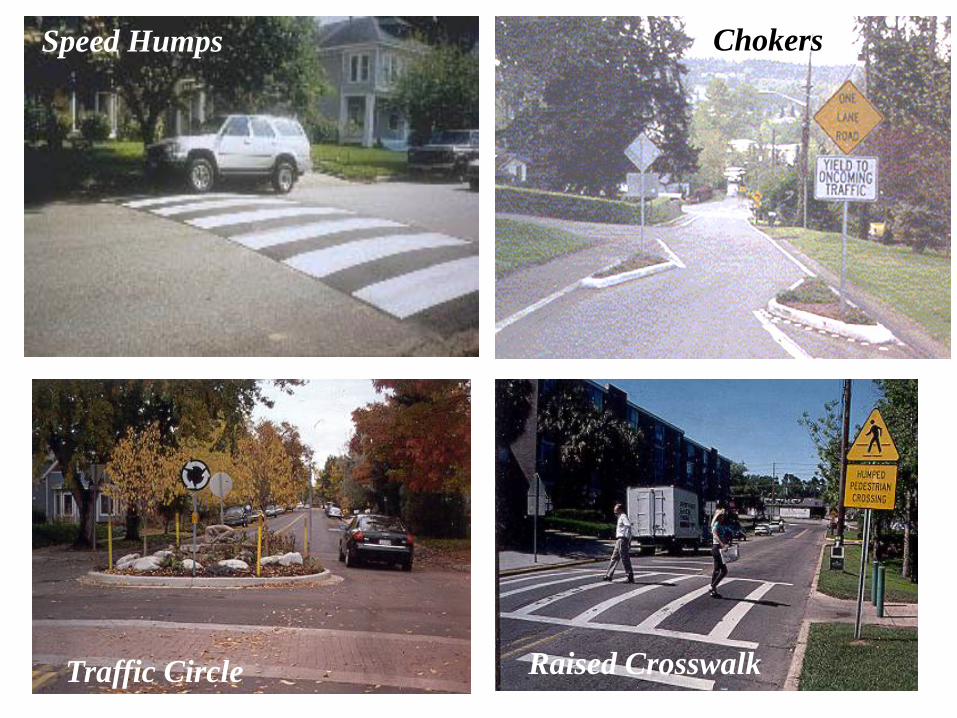
Speed Humps Chokers
Traffic Circles
Traffic Circle Raised Crosswalk
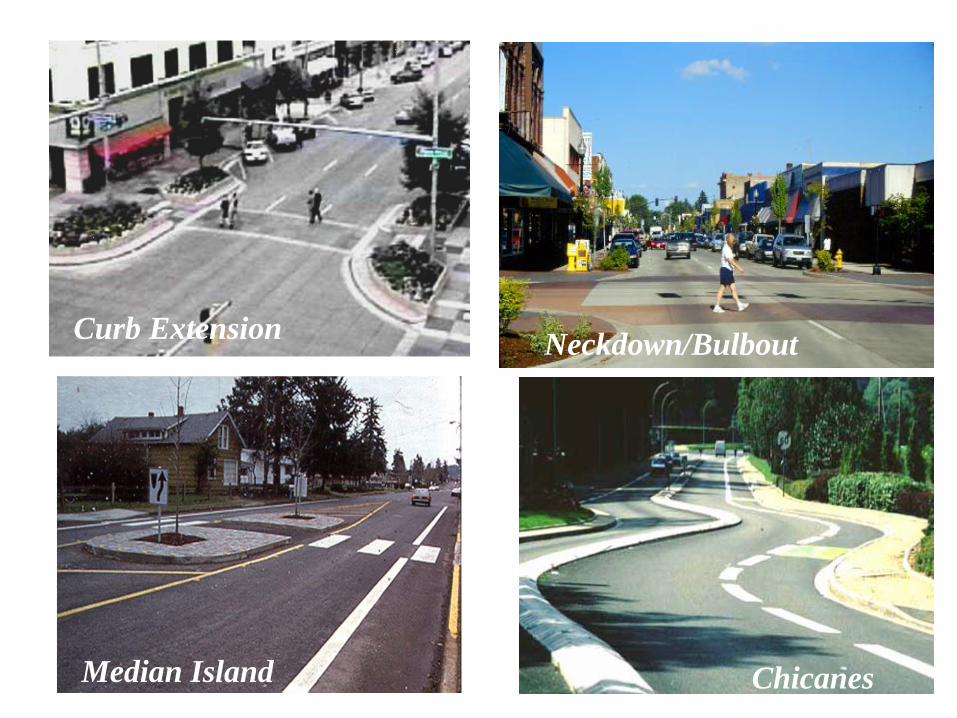
Curb Extension
Chicanes
Neckdown/Bulbout
Median Island
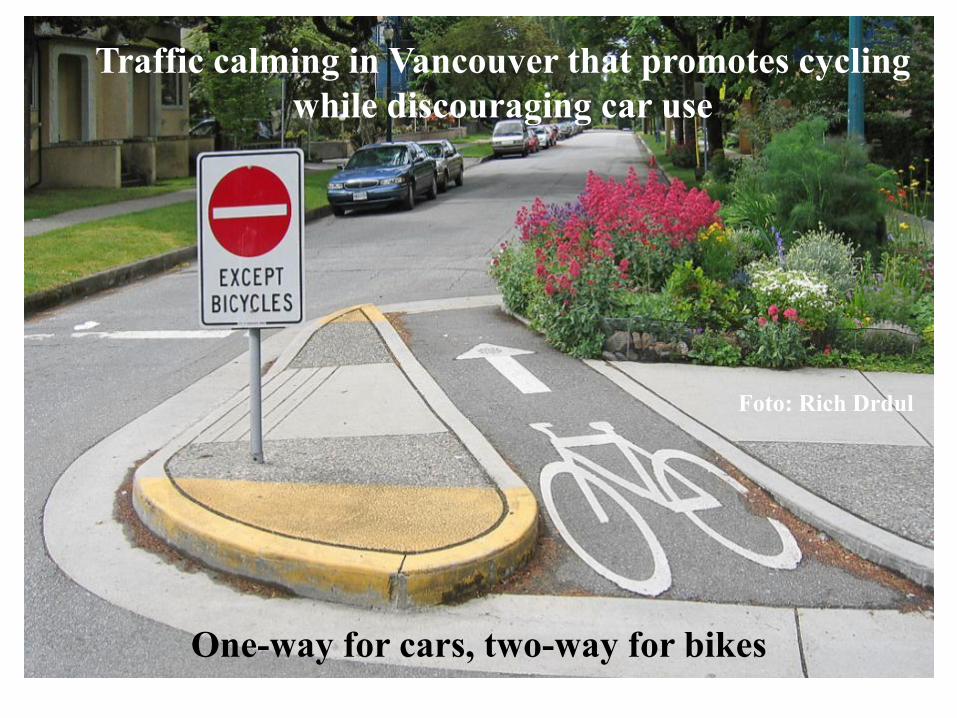
Traffic calming in Vancouver that promotes cycling while discouraging car use
One-way for cars, two-way for bikes
Foto: Rich Drdul

Convenient bike cut-thru for cyclists in MelbourneFoto by Peter Berkeley
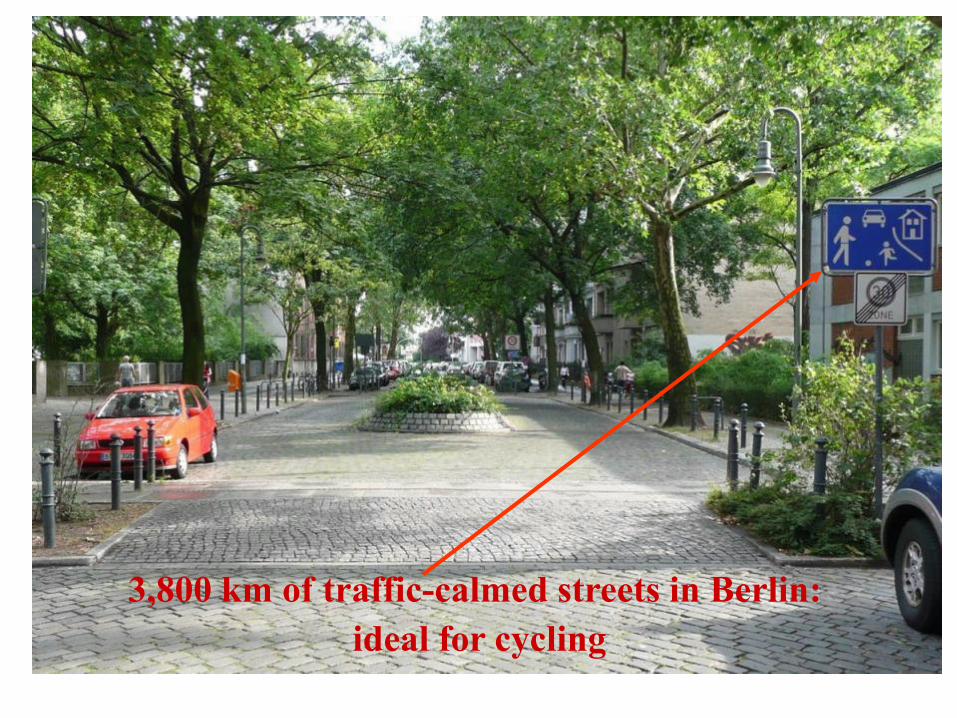
3,800 km of traffic-calmed streets in Berlin:ideal for cycling
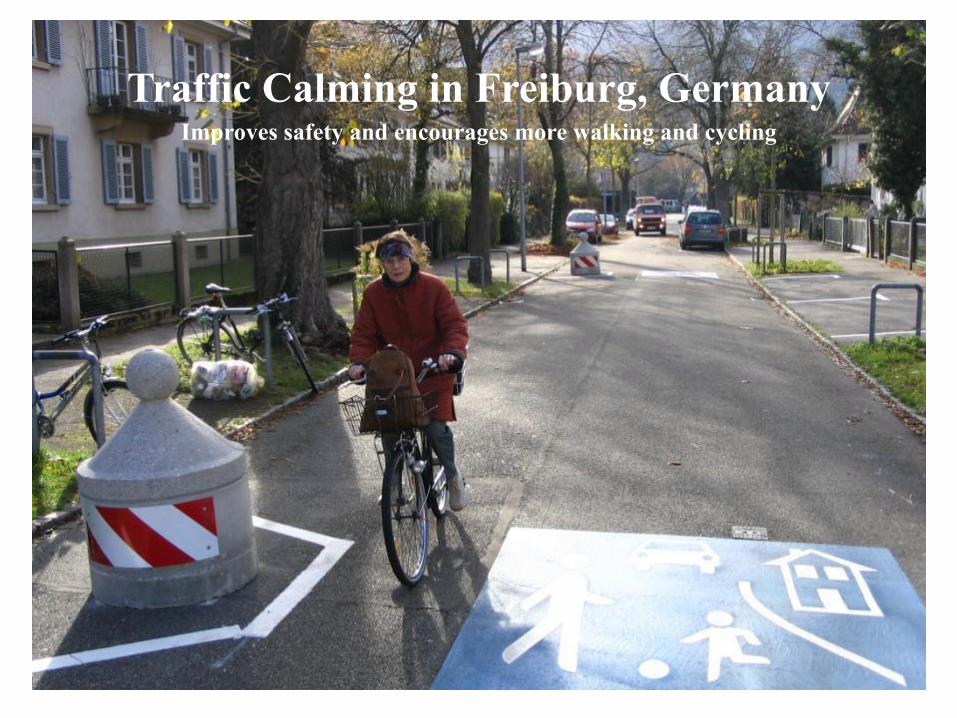
Traffic Calming in Freiburg, GermanyImproves safety and encourages more walking and cycling

Bike Boulevards in Portland
Traffic calming turns these streets into bikeways
Fotos: Jonathan Maus

Many neighborhood streets in NJ are perfectly good for cycling even
without any special facilities
I cycle on this street in Highland Park every day and never have any problems.
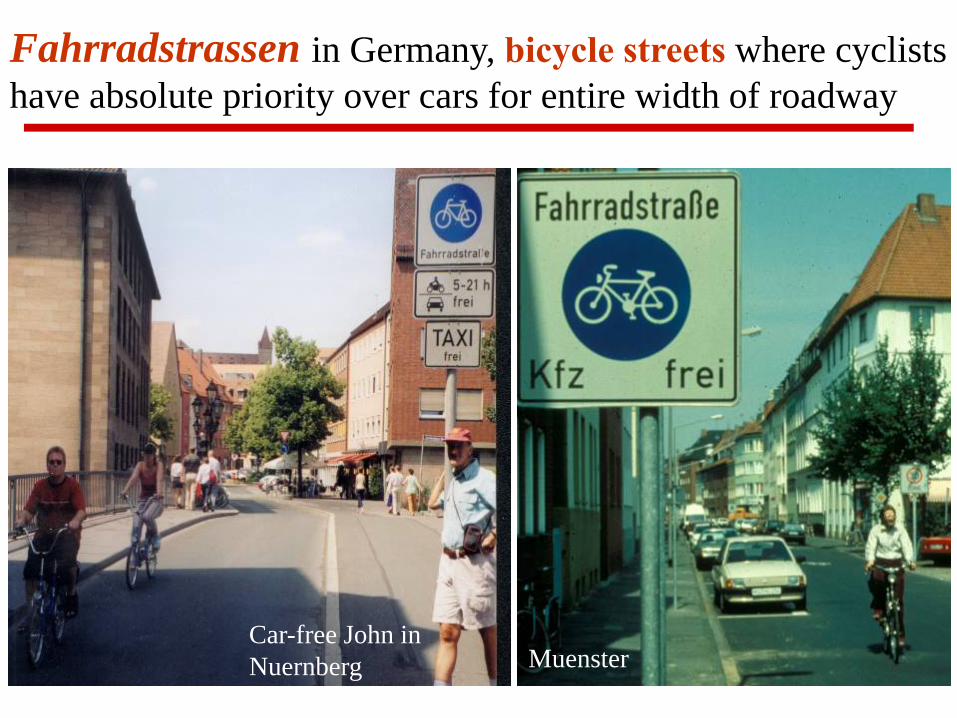
Fahrradstrassen in Germany, bicycle streets where cyclists have absolute priority over cars for entire width of roadway
Car-free John in Nuernberg Muenster

Over half of NJ Transit buses now have bike racks, 95% by 2015
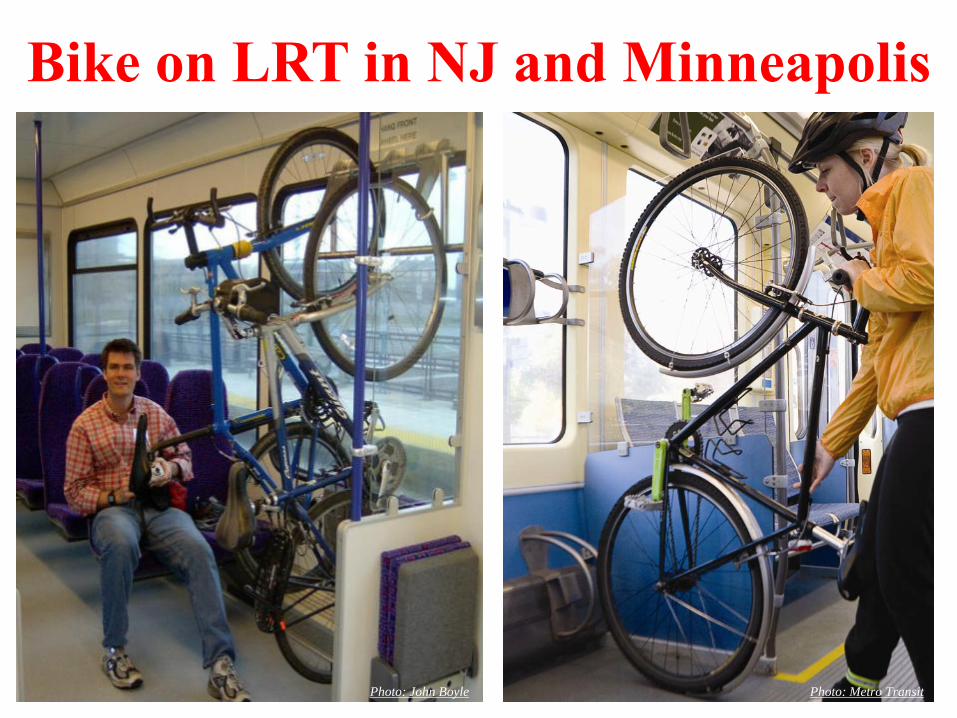
Bike on LRT in NJ and Minneapolis
Photo: Metro TransitPhoto: John Boyle

Bike on Suburban Rail in NJ
Photo: Leigh Ann Von Hagen

Photo: John PucherPhoto: Ralph Buehler
Bikes on Caltrain in San Francisco
Photo: San Francisco Bicycling Coalition


Convenient and secure parking for 3,500 bikes at main train station in
Muenster
Bike and Ride
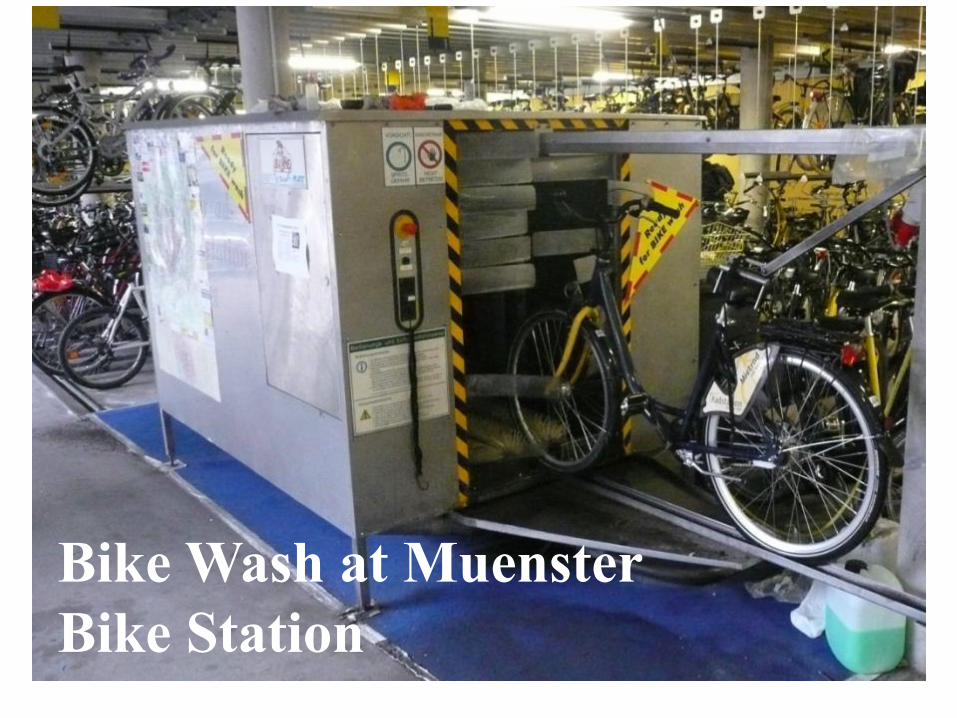
Bike Wash at Muenster Bike Station
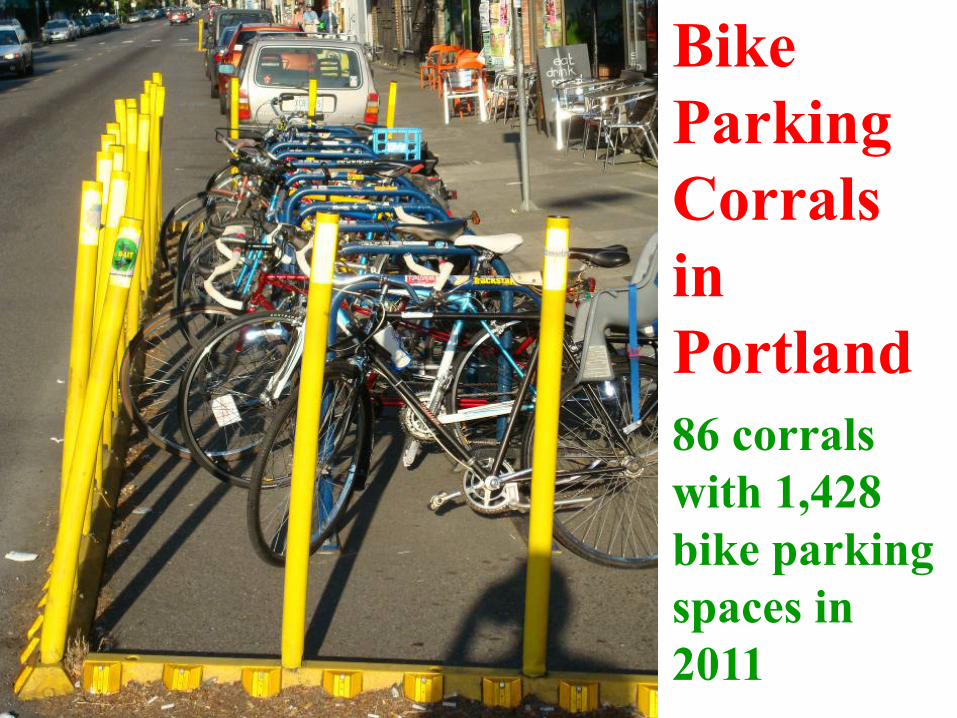
BikeParking Corrals in Portland 86 corrals with 1,428 bike parking spaces in 2011
Traffic Education
•Improved motorist training, with much more emphasis on how to avoid endangering pedestrians and cyclists
•Compulsory traffic safety lessons for all school children by the age of 10, with testing by traffic police on actual traffic test courses, to ensure safe and defensive walking and cycling by an early age (as in the Netherlands and Germany)

German traffic laws generally favor cyclists and pedestrians over motorists

Cycling training and testing course in Berlin
Most German and Dutch children take cycling lessons by the 3rd or 4th grade and must pass a police-administered cycling safety test!

Bike Training for Children in NJ

MARKETING CYCLING TO ALL SOCIAL GROUPS
•Very diverse needs of different groups
•Need to tailor cycling facilities, policies, and programs to serve this broad range
•Be as inclusive as possible
•Need good facilities as well as active marketing of cycling, with different approaches to each potential group of cyclists
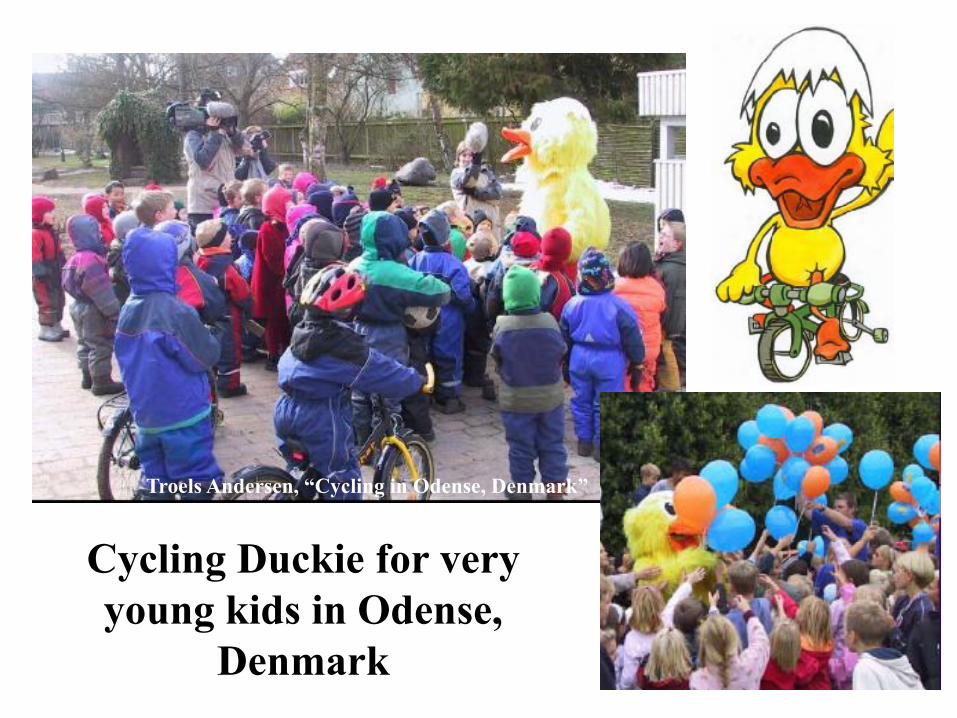
Cycling Duckie for very young kids in Odense,
Denmark
Troels Andersen, “Cycling in Odense, Denmark”

Cycling competitions for somewhat older kids
in Odense, Denmark
Troels Andersen, “Cycling in Odense, Denmark”

Bike Training for Adults

Troels Andersen, “Cycling in Odense, Denmark”
GIVE EMPLOYEES FREE BIKES INSTEAD OF FREE PARKING!
The perfect zero emissions vehicles!

“Get rid of the sack” Campaign aimed at overweight middle-aged
men with pot bellies
Troels Andersen, “Cycling in Odense, Denmark”
Get on a bike and lose weight!
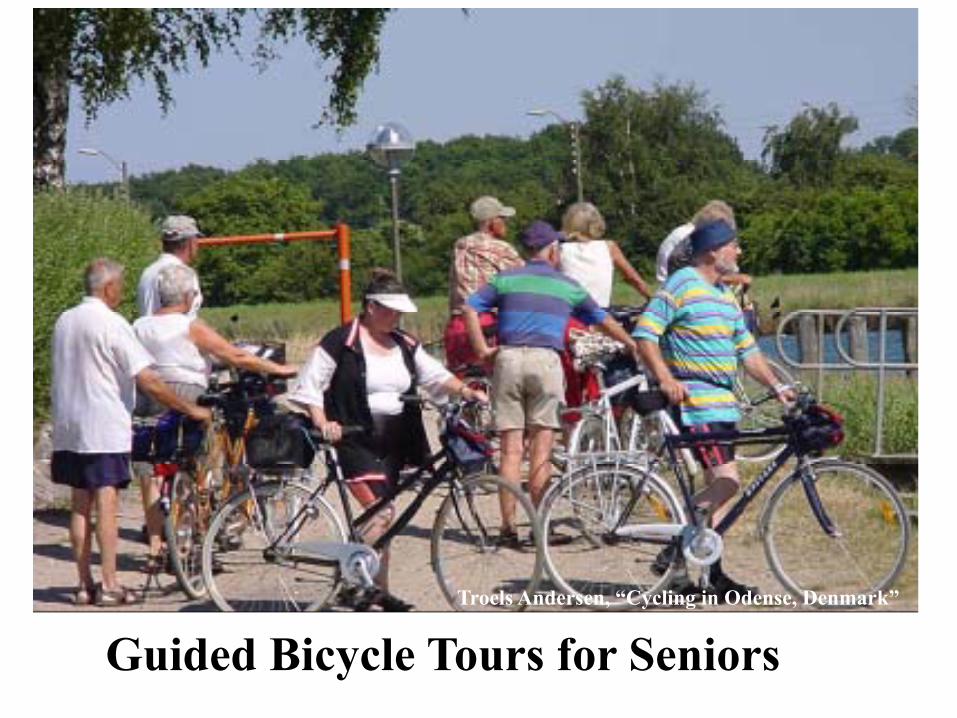
Guided Bicycle Tours for SeniorsTroels Andersen, “Cycling in Odense, Denmark”
Safe Routes to School: Enable Children to Walk or Bike to Schools!
•Two thirds of American children who live within a mile of their school travel there by car
•Only 13 percent of children in the USA walked or biked to school in 2001, compared to 60 percent in 1974
•Most European children walk or bike to school, some ride transit, virtually none get chauffered by their parents or drive themselves
•Need improved walking and cycling facilities to prevent dangerous conflicts with motor vehicles, especially at crossings and intersections

Good crosswalks crucial near schools!


Walking School Bus in Newark, NJ
These kids are actually having fun and getting good exercise, too!

Walking School Bus in Wharton, NJ
These kids are actually having fun and getting good exercise, too!
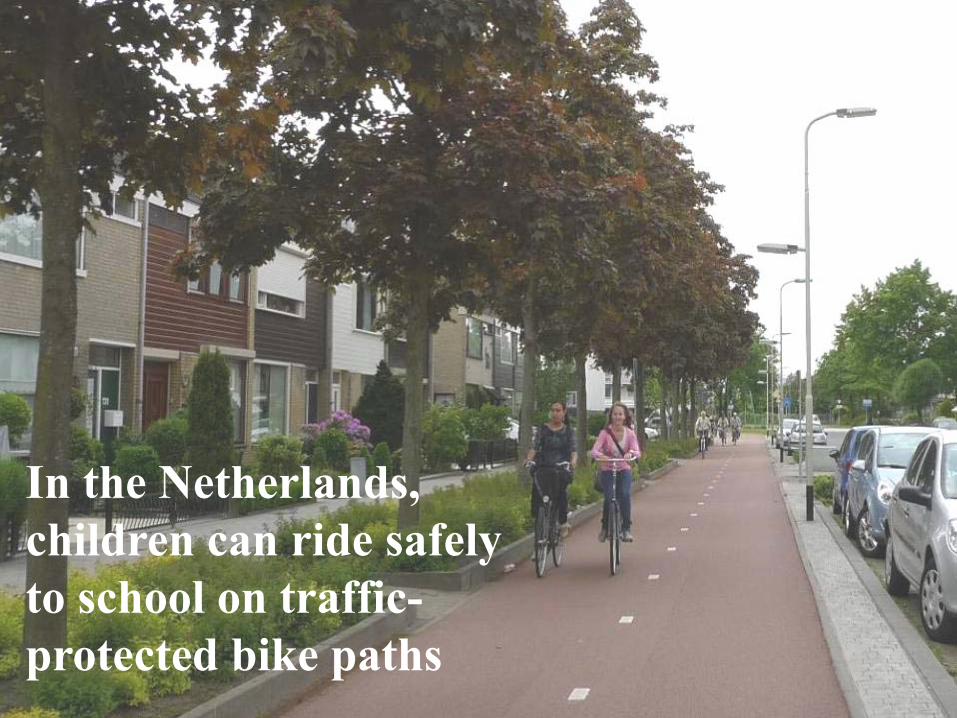
In the Netherlands, children can ride safely to school on traffic-protected bike paths
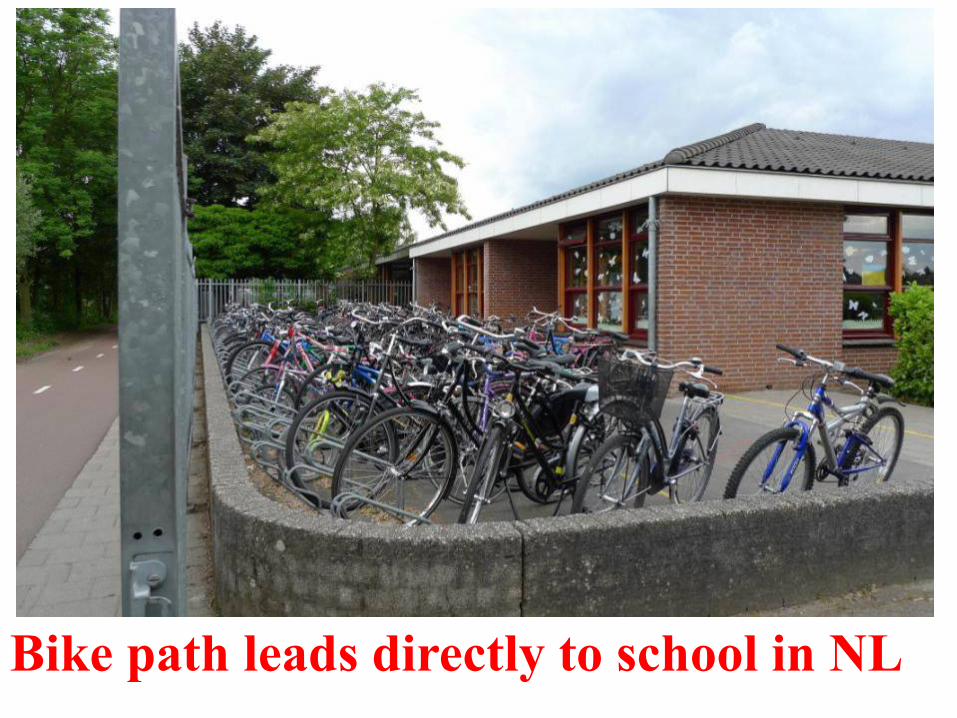
Bike path leads directly to school in NL
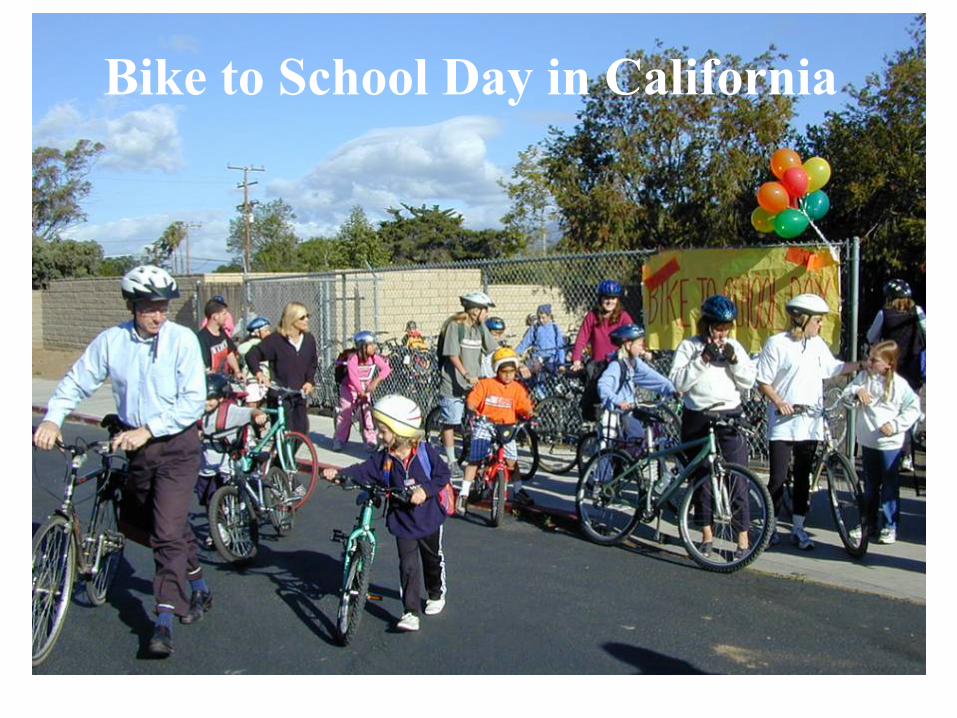
Bike to School Day in California
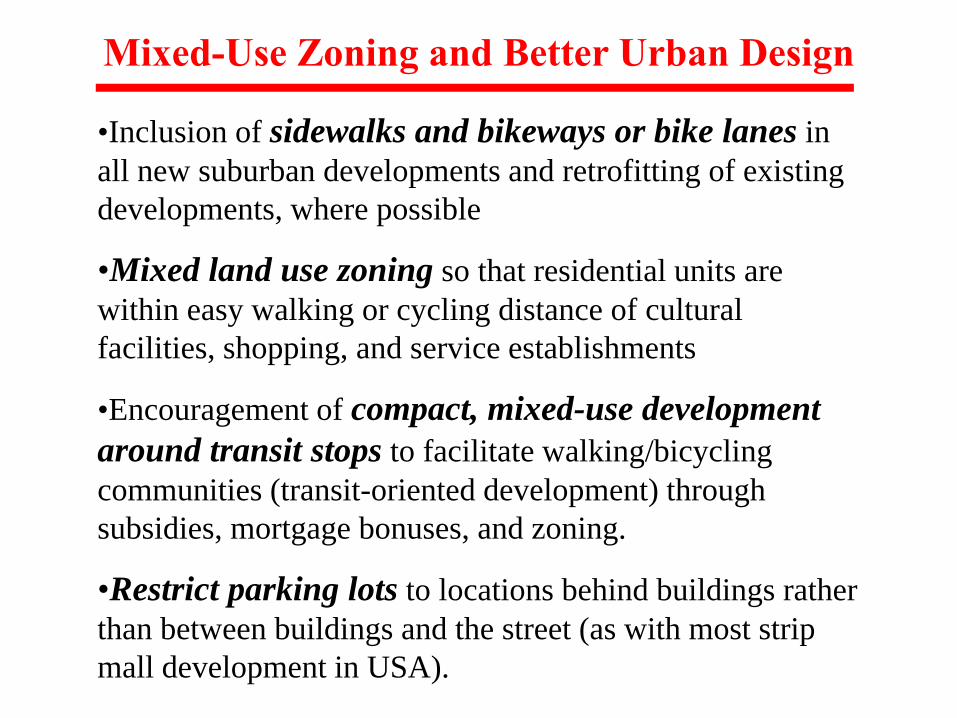
Mixed-Use Zoning and Better Urban Design
•Inclusion of sidewalks and bikeways or bike lanes in all new suburban developments and retrofitting of existing developments, where possible
•Mixed land use zoning so that residential units are within easy walking or cycling distance of cultural facilities, shopping, and service establishments
•Encouragement of compact, mixed-use developmentaround transit stops to facilitate walking/bicycling communities (transit-oriented development) through subsidies, mortgage bonuses, and zoning.
•Restrict parking lots to locations behind buildings rather than between buildings and the street (as with most strip mall development in USA).
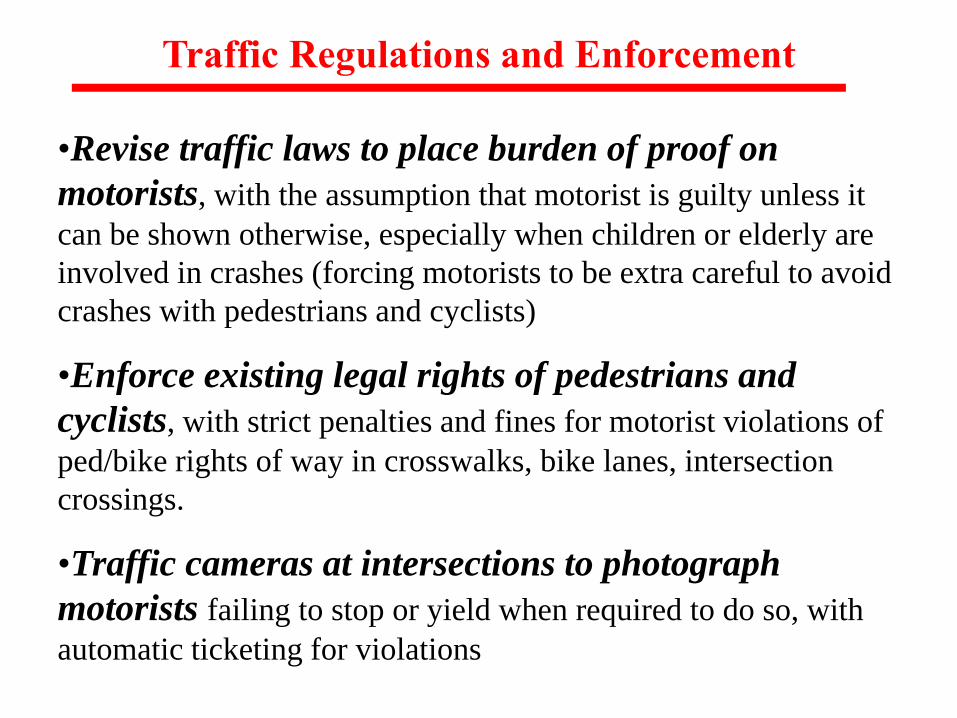
Traffic Regulations and Enforcement
•Revise traffic laws to place burden of proof on motorists, with the assumption that motorist is guilty unless it can be shown otherwise, especially when children or elderly are involved in crashes (forcing motorists to be extra careful to avoid crashes with pedestrians and cyclists)
•Enforce existing legal rights of pedestrians and cyclists, with strict penalties and fines for motorist violations of ped/bike rights of way in crosswalks, bike lanes, intersection crossings.
•Traffic cameras at intersections to photograph motorists failing to stop or yield when required to do so, with automatic ticketing for violations

CONCLUSIONS:
• Broad range of public health benefits of walking and cycling have potential to provide widespread political support for more sustainable transport policies
• Almost everyone could walk and cycle more on a daily basis, and thus reap these health benefits
• Many local trips in American cities are short enough to cover by walking or cycling
• Crucial to design ped-bike facilities and programs for everyone! Be as inclusive as possible!
• Public information campaign needed to emphasize both direct and indirect public health benefits of walking and cycling
For any questions or further information, please contact:
Prof. John Pucher Bloustein School of Planning and Public PolicyRutgers University33 Livingston Avenue, Room 363Email: [email protected]: http://policy.rutgers.edu/faculty/pucher.html


![2010] Nisha Korattyswaroopam ALL ... - Rutgers University](https://static.fdocuments.in/doc/165x107/623b95fd41cc86774451622c/2010-nisha-korattyswaroopam-all-rutgers-university.jpg)


