Alirocumab Treatment Effect Did Not Differ Between ... · Tarrytown, NY, USA; 6Columbia University,...
21
G. Kees Hovingh, 1 Richard Ceska, 2 Michael Louie, 3 Pascal Minini, 4 Kathryn Miller, 5 Henry N. Ginsberg 6 1 Department of Vascular Medicine, Academic Medical Center, University of Amsterdam, Amsterdam, The Netherlands; 2 Center of Preventive Cardiology, First School of Medicine and University Hospital, Charles University, Prague, Czech Republic; 3 Cardiovascular & Metabolism, Regeneron Pharmaceuticals, Tarrytown, NY, USA; 4 Biostatistics and Programming, Sanofi, Chilly-Mazarin, France; 5 Biostatistics and Data Management, Regeneron Pharmaceuticals, Tarrytown, NY, USA; 6 Columbia University, New York, NY, USA Alirocumab Treatment Effect Did Not Differ Between Patients With and Without Low HDL-C or High Triglyceride Levels in Phase 3 trials This study was funded by Sanofi and Regeneron Pharmaceuticals
-
Upload
doankhuong -
Category
Documents
-
view
214 -
download
0
Transcript of Alirocumab Treatment Effect Did Not Differ Between ... · Tarrytown, NY, USA; 6Columbia University,...

G. Kees Hovingh,1 Richard Ceska,2 Michael Louie,3 Pascal
Minini,4 Kathryn Miller,5 Henry N. Ginsberg6
1Department of Vascular Medicine, Academic Medical Center, University of
Amsterdam, Amsterdam, The Netherlands; 2Center of Preventive Cardiology,
First School of Medicine and University Hospital, Charles University, Prague,
Czech Republic; 3Cardiovascular & Metabolism, Regeneron Pharmaceuticals,
Tarrytown, NY, USA; 4Biostatistics and Programming, Sanofi, Chilly-Mazarin,
France; 5Biostatistics and Data Management, Regeneron Pharmaceuticals,
Tarrytown, NY, USA; 6Columbia University, New York, NY, USA
Alirocumab Treatment Effect Did Not
Differ Between Patients With and Without
Low HDL-C or High Triglyceride Levels in
Phase 3 trials
This study was funded by Sanofi and Regeneron Pharmaceuticals

Author Disclosure
G. Kees Hovingh G.K. Hovingh’s institution has received payment for conducting clinical trials from
Sanofi, Regeneron, Amgen, Pfizer, Kowa, Genzyme, Isis Pharmaceuticals, Roche,
Eli Lilly, Aegerion, Synageva, and AstraZeneca; and for lectures and/or advisory
panel participation of GKH from Amgen, Sanofi, Pfizer, and Roche
Richard Ceska Consultancy fees/honoraria from Regeneron, Sanofi, Amgen, Genzyme, Aegerion,
and Kowa
Michael Louie Employee of and stockholder in Regeneron
Pascal Minini Employee of and stockholder in Sanofi
Kathryn Miller Employee of and stockholder in Regeneron
Henry N. Ginsberg Research support from Genzyme (Sanofi), Merck, and Sanofi-Regeneron.
Consultant on Advisory Boards for Merck, Sanofi, and Regeneron. Consultant for
Amarin, Amgen, AstraZeneca, Bristol Myers Squibb, GlaxoSmithKline, ISIS, Kowa,
Merck, Novartis, and Pfizer
Industry Relationships and
Institutional Affiliations
2

High TG and low HDL-C levels are associated with increased
risk of CVD1,2
Patients with high TG/low HDL-C may have elevations in LDL
particle number and non-LDL atherogenic lipoproteins for a
given LDL-C level3
– Apo B or non-HDL-C may be a better estimate of risk in such cases
Alirocumab is a fully human monoclonal antibody to
PCSK9 which has shown significant LDL-C reductions in Phase
2 and 3 trials4-8
Background and Aims
3
TG, triglycerides; HDL-C, high-density lipoprotein cholesterol; CVD, cardiovascular disease; LDL-C, low-density lipoprotein
cholesterol; PCSK9, proprotein convertase subtilisin/kexin type 9;.
1. Assmann G. et al. Eur Heart J. 1998;19(suppl M):M8–M14. 2. Gordon DJ et al. Circulation. 1989;79:8–15. 3. Bays HE et al.
J Clin Lipidol. 2014;8, S1-S36; 4. Koren MJ et al. Postgrad Med. 2015;127:125–132; 5. Roth EM et al. Int J Cardiol. 2014;176:55–
61; 6. Cannon CP et al. Eur Heart J. 2015; 36:1186-1194; 7. Robinson JG et al. N Eng J Med. 6;372:1489–1499;
8. Kereiakes DJ et al. Am Heart J. 2015 [Epub ahead of print].
The aim of this analysis of 10 Phase 3 trials was to determine potential
treatment differences in alirocumab lipid- and lipoprotein-lowering efficacy
and safety between patients with baseline TG levels < or ≥150 mg/dL
(1.69 mmol/L) or baseline HDL-C levels < or ≥40 mg/dL (1.03 mmol/L)

Pooled Analysis of Ten Phase 3
Alirocumab Trials
4
*Includes all lipid data throughout the duration of the study irrespective of adherence to the study treatment.
ALI, alirocumab; CV, cardiovascular; EZE, ezetimibe; FH, familial hypercholesterolemia; heFH, heterozygous familial
hypercholesterolemia; ITT, intent-to-treat; LLT, lipid-lowering therapy; PBO, placebo.
OPTIONS I + II,
24 weeks each
ALI n=202
EZE n=196
COMBO II,
102 weeks
ALI n=467
EZE n=240
ALTERNATIVE,
24 weeks
ALI n=126
EZE n=122
MONO, 24 weeks
ALI n=52
EZE n=51
HIGH FH, 78 weeks
ALI n=71
PBO n=35
LONG TERM,
78 weeks
ALI n=1530
PBO n=780
COMBO I, 52 weeks
ALI n=205
PBO n=106
FH I + FH II,
78 weeks each
ALI n=488
PBO n=244
Phase 3
ODYSSEY
studies
PBO-controlled
Receiving stable background statin ±other LLT Not receiving statin
(monotherapy/statin
intolerant population)
4915 patients with FH (heFH), and/or at high CV risk
3141 ALI, 1774 control
EZE-controlled
Primary endpoint in each study: % change from baseline to Week 24 in LDL-C based on an ITT approach.
In LONG TERM and HIGH FH, ALI was dosed at 150 mg Q2W, whereas in COMBO I and II, FH I and II, OPTIONS I and II,
MONO and ALTERNATIVE, the initial 75 mg Q2W dose regimen was increased to 150 mg Q2W at week 12 if Week 8 LDL-C
was ≥70 mg/dL..

Baseline TGs <150 mg/dL
(1.69 mmol/L)
Baseline TGs ≥150 mg/dL
(1.69 mmol/L)
Alirocumab
n=1989
Control
n=1103
Alirocumab
n=1199
Control
n=690
Age, years, mean (SD) 59.4 (11.8) 60.2 (11.3) 59.8 (10.1) 59.6 (10.1)
Males, % (n) 62.2 (1237) 60.5 (667) 63.3 (759) 62.6 (432)
Race, white, % (n) 90.1 (1792) 90.3 (996) 91.1 (1092) 90.1 (622)
BMI, kg/m2, mean (SD) 29.4 (5.7) 29.5 (5.6) 31.4 (5.6) 31.4 (5.5)
Calculated LDL-C, mmol/L
[mg/dL], mean (SD)
3.20 (1.2)
[123.5 (46.3)]
3.21 (1.2)
[123.8 (47.0)]
3.36 (1.3)
[129.8 (49.9)]
3.37 (1.4)
[130.3 (52.5)]
Non HDL-C, mmol/L
[mg/dL], mean (SD)
3.72 (1.2)
[143.7 (47.0)]
3.73 (1.2)
[144.0 (47.4)]
4.52 (1.4)
[174.5 (53.6)]
4.54 (1.5)
[175.1 (59.1)]
Apo B, mg/dL, mean (SD) 96.7 (26.3) 96.6 (25.9) 115.0 (31.0) 114.4 (32.3)
HDL-C, mmol/L
[mg/dL], mean (SD)
1.36 (0.4)
[52.7 (14.1)]
1.37 (0.4)
[53.0 (13.7)]
1.15 (0.3)
[44.5 (10.4)]
1.15 (0.3)
[44.6 (11.3)]
Fasting TGs, mmol/L
[mg/dL], median (Q1:Q3)
1.14 (0.9:1.4)
[101.0 (79.6:123.9)]
1.14 (0.9:1.4)
[101.0 (79.6:123.0)]
2.3 (1.9:2.8)
[203.5 (171.7:251.3)]
2.27 (2.0:2.9)
[201.0 (171.0:249.0)]
Lp(a), mg/dL, median (Q1:Q3) 25.3 (9.0:70.2) 26.1 (9.0:70.0) 21.9 (7.0:65.1) 18.2 (6.0:55.0)
Baseline Characteristics by Baseline TG Levels
(Pooled Randomized Population)
5
Apo, apolipoprotein; BMI, body mass index; Lp(a), lipoprotein (a); SD, standard deviation.

Study Baseline
TG
% change from baseline* Mean % difference vs. control
(95% CI)
Interaction
p-valueN Control Alirocumab
ALI 150 vs
PBO
(+ statin)
Long Term <150 mg/dL 1378 2.2 (1.3) -58.8 (0.9) 0.3431
≥150 mg/dL 931 -1.1 (1.6) -64.5 (1.2)
High FH <150 mg/dL 76 -3.3 (6.0) -43.1 (4.1) 0.9685
≥150 mg/dL 30 -13.1 (8.4) -53.4 (6.9)
ALI 75/150
vs PBO
(+ statin)
COMBO I <150 mg/dL 190 0.2 (3.3) -46.9 (2.5) 0.5073
≥150 mg/dL 120 -7.6 (4.7) -50.1 (3.1)
FH I <150 mg/dL 356 8.6 (2.6) -48.1 (1.8) 0.4220
≥150 mg/dL 129 10.7 (4.5) -50.9 (3.1)
FH II <150 mg/dL 194 2.9 (3.1) -47.4 (2.2) 0.5504
≥150 mg/dL 53 2.4 (6.4) -53.1 (4.2)
ALI 75/150
vs EZE
(+ statin)
COMBO II <150 mg/dL 409 -22.8 (2.5) -50.2 (1.8) 0.2200
≥150 mg/dL 298 -17.9 (2.9) -51.0 (2.1)
OPTIONS I <150 mg/dL 130 -24.1 (4.) -49.8 (4.0) 0.6763
≥150 mg/dL 70 -16.2 (5.7) -45.9 (5.4)
OPTIONS II <150 mg/dL 128 -7.4 (5.7) -46.2 (5.1) 0.0908
≥150 mg/dL 70 -17.5 (6.8) -34.2 (8.0)
ALI 75/150
vs EZE
(no statin)
ALTERNATIVE <150 mg/dL 119 -18.3 (3.0) -46.0 (3.4) 0.3073
≥150 mg/dL 129 -10.0 (3.3) -44.2 (2.9)
MONO <150 mg/dL 73 -16.4 (3.5) -41.9 (3.5) 0.0226
≥150 mg/dL 30 -13.3 (5.6) -60.1 (5.4)
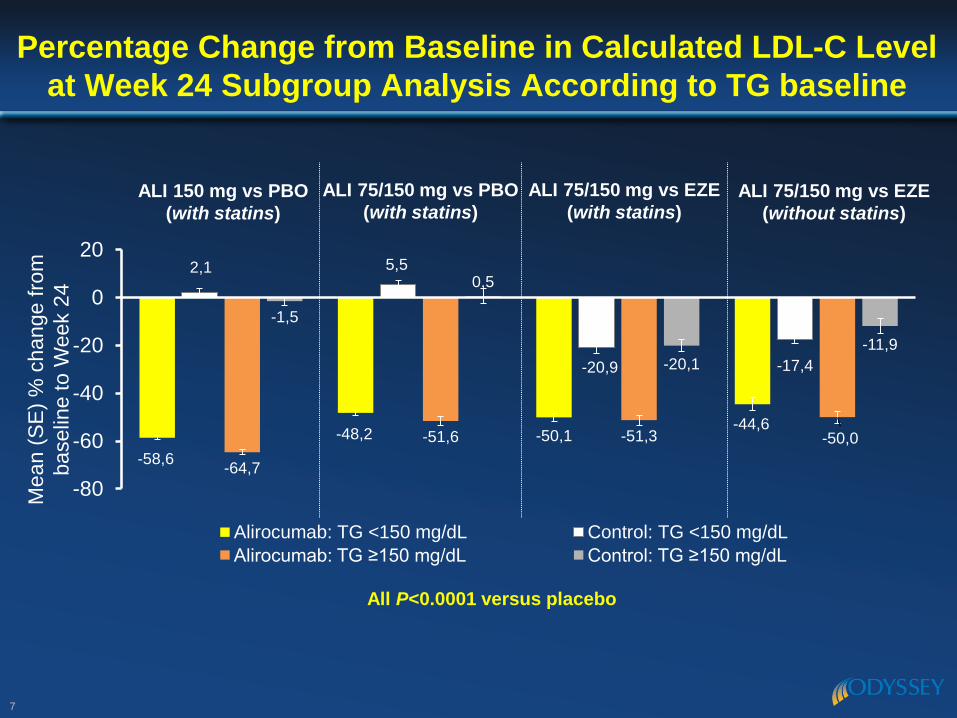
LDL-C Reduction with Alirocumab vs Control was Generally
Consistent Across Phase 3 Trials Regardless of Baseline TG
6Favours ALI -80 -60 -40 -20 0 20 Favours
control
*Least square mean (SE). ITT analysis.
ALI, alirocumab, EZE, ezetimibe, PBO, placebo.
7
-58,6
-48,2 -50,1-44,6
2,1 5,5
-20,9 -17,4
-64,7
-51,6 -51,3 -50,0
-1,5
0,5
-20,1
-11,9
-80
-60
-40
-20
0
20
Alirocumab: TG <150 mg/dL Control: TG <150 mg/dL
Alirocumab: TG ≥150 mg/dL Control: TG ≥150 mg/dL
ALI 150 mg vs PBO
(with statins)
All P<0.0001 versus placebo
Mea
n (
SE
) %
change f
rom
baselin
e to W
eek 2
4Percentage Change from Baseline in Calculated LDL-C Level
at Week 24 Subgroup Analysis According to TG baseline
ALI 75/150 mg vs PBO
(with statins)
ALI 75/150 mg vs EZE
(with statins)ALI 75/150 mg vs EZE
(without statins)

8
-60,9
-45,4-49,7 -47,0
3,2 4,6
-24,4 -19,3
-66,6
-43,6
-51,8 -48,7
-2,4
3,1
-19,6-13,2
-80
-60
-40
-20
0
20
Alirocumab: TG <150 mg/dL Control: TG <150 mg/dL
Alirocumab: TG ≥150 mg/dL Control: TG ≥150 mg/dL
ALI 75 mg vs PBO
(with statins)
ALI 75 mg vs EZE
(with statins)ALI 150 mg vs PBO
(with statins)
All P<0.0001 versus placebo
ALI 75 mg vs EZE
(without statins)
Mea
n (
SE
) %
change f
rom
baselin
e to W
eek 1
2Percentage Change from Baseline in Calculated LDL-C Level
at Week 12 Subgroup Analysis According to TG baseline

9
-51,4
-39,9 -39,3 -35,2
3,31,5
-15,1 -11,5
-54,3
-41,9 -39,9 -39,3
-2,5
0
-16,5-10,2
-80
-60
-40
-20
0
20
Alirocumab: TG <150 mg/dL Control: TG <150 mg/dL
Alirocumab: TG ≥150 mg/dL Control: TG ≥150 mg/dL
ALI 75/150 mg vs PBO
(with statins)
ALI 75/150 mg vs EZE
(with statins)ALI 150 mg vs PBO
(with statins)
All P<0.0001 versus placebo
ALI 75/150 mg vs EZE
(without statins)
Mea
n (
SE
) %
change f
rom
baselin
e to W
eek 2
4Percentage Change from Baseline in ApoB Level at Week
24 Subgroup Analysis According to TG baseline

10
-50,4
-41,7 -42,0 -39,1
3,4 6,1
-18,3 -15,2
-54,0
-44,1 -43,2 -43,4
-3,5
1,2
-19,9-14,2
-80
-60
-40
-20
0
20
Alirocumab: TG <150 mg/dL Control: TG <150 mg/dL
Alirocumab: TG ≥150 mg/dL Control: TG ≥150 mg/dL
ALI 75/150 mg vs PBO
(with statins)
ALI 75/150 mg vs EZE
(with statins)ALI 150 mg vs PBO
(with statins)
All P<0.0001 versus placebo
ALI 75/150 mg vs EZE
(without statins)
Mea
n (
SE
) %
change f
rom
baselin
e to W
eek 2
4Percentage Change from Baseline in Non-HDL-C Level at
Week 24 Subgroup Analysis According to TG baseline

Baseline HDL-C <40 mg/dL
(1.03 mmol/L)
Baseline HDL-C ≥40 mg/dL
(1.03 mmol/L)
Alirocumab
n=753
Control
n=393
Alirocumab
n=2435
Control
n=1402
Age, years, mean (SD) 57.5 (12.0) 57.6 (11.9) 60.2 (10.8) 60.6 (10.5)
Males, % (n) 82.2 (619) 77.9 (306) 56.6 (1377) 56.6 (794)
Race, white, % (n) 88.8 (669) 88.5 (348) 91.0 (2215) 90.7 (1272)
BMI, kg/m2, mean (SD) 31.4 (5.4) 31.5 (5.3) 29.7 (5.8) 29.9 (5.7)
Calculated LDL-C, mmol/L
[mg/dL], mean (SD)
3.17 (1.2)
[122.5 (47.9)]
3.20 (1.2)
[123.6 (46.4)]
3.28 (1.3)
[126.9 (47.7)]
3.29 (1.3)
[127.1 (50.0)]
Apo B, mg/dL, mean (SD) 107.2 (31.2) 107.8 (30.1) 102.5 (28.9) 102.3 (29.7)
Non HDL-C,
[mg/dL], mean (SD)
4.13 (1.4)
159.7 (54.3)
4.15 (1.3)
160.6 (52.1)
3.99 (1.3)
153.9 (50.9)
4.00 (1.4)
154.6 (54.9)
HDL-C, mmol/L
[mg/dL], mean (SD)
0.90 (0.1)
[34.8 (3.9)]
0.89 (0.1)
[34.3 (4.1)]
1.40 (0.3)
[54.2 (11.9)]
1.40 (0.3)
[54.1 (11.9)]
Fasting TGs, mmol/L [mg/dL],
median (Q1:Q3)
1.82 (0.4:2.7)
161.1 (120:235)
1.9 (1.3:2.6)
169.0 (119:230)
1.35 (1.0:1.9)
119.5 (87.6:167.0)
1.37 (1.0:1.9)
121.2 (89.0:166)
Lp(a), mg/dL, median (Q1:Q3) 23.0 (8.0:62.7) 19.3 (7.0:52.0) 25.0 (8.0:71.0) 24.0 (7.4:68.1)
Baseline Characteristics, by Baseline HDL-C
(Pooled Randomized Population)
11

Study Baseline
HDL-C
% change from baseline* Mean % difference vs. control
(95% CI)
Interaction
p-valueN Control Alirocumab
ALI 150 vs
PBO
(+ statin)
Long Term <40 mg/dL 457 0.5 (2.3) -65.5 (1.6) 0.0989
≥40 mg/dL 1853 0.9 (1.1) -59.9 (0.8)
High FH <40 mg/dL 26 4.6 (9.8) -46.3 (7.2) 0.2690
≥40 mg/dL 80 -10.4 (5.7) -45.5 (4.0)
ALI 75/150
vs PBO
(+ statin)
COMBO I <40 mg/dL 85 -1.7 (5.6) -47.2 (3.7) 0.9269
≥40 mg/dL 226 -2.4 (3.1) -48.6 (2.3)
FH I <40 mg/dL 138 10.7 (4.0) -49.4 (3.1) 0.6052
≥40 mg/dL 347 8.5 (2.7) -48.6 (1.9)
FH II <40 mg/dL 44 8.6 (7.0) -47.2 (4.6) 0.5693
≥40 mg/dL 203 1.7 (3.0) -49.0 (2.2)
ALI 75/150
vs EZE
(+ statin)
COMBO II <40 mg/dL 218 -16.1 (3.4) -52.1 (2.4) 0.0762
≥40 mg/dL 489 -22.8 (2.3) -49.9 (1.6)
OPTIONS I <40 mg/dL 57 -22.3 (6.8) -52.9 (5.6) 0.6000
≥40 mg/dL 143 -21.1 (3.7) -46.2 (3.9)
OPTIONS II <40 mg/dL 37 -18.6 (11.0) -38.8 (9.4) 0.4217
≥40 mg/dL 161 -10.5 (4.8) -43.6 (4.9)
ALI 75/150
vs EZE
(no statin)
ALTERNATIVE <40 mg/dL 59 -10.5 (5.2) -46.3 (4.2) 0.3596
≥40 mg/dL 189 -15.5 (2.5) -44.4 (2.6)
MONO <40 mg/dL 13 -11.6 (10.7)- 55.4 (7.2) 0.2970
≥40 mg/dL 90 -16.0 (3.2) -45.4 (3.3)
LDL-C Reduction with Alirocumab vs Control was Generally Consistent
Across Phase 3 Trials Regardless of Baseline HDL-C
12Favours ALI -80 -60 -40 -20 0 20 Favours
control
*Least square mean (SE). ITT analysis.
ALI, alirocumab, EZE, ezetimibe, PBO, placebo.

13
-64,5
-48,8 -51,4-52,1
2,5 7,3
-18,8-12,0
-59,9
-49,3 -50,2-45,5
0,2 3,3
-21,3-15,8
-80
-60
-40
-20
0
20
Alirocumab: HDL-C <40 mg/dL Control: HDL-C <40 mg/dL
Alirocumab: HDL-C ≥40 mg/dL Control: HDL-C ≥40 mg/dL
ALI 150 mg vs PBO
(with statins)
All P<0.0001 versus placebo
Mea
n (
SE
) %
change f
rom
baselin
e to W
eek 2
4Percentage Change from Baseline in Calculated LDL-C Level
at Week 24 Subgroup Analysis According to HDL-C baseline
ALI 75/150 mg vs PBO
(with statins)
ALI 75/150 mg vs EZE
(with statins)ALI 75/150 mg vs EZE
(without statins)

14
-67,6
-41,6
-52,0 -48,3
-1,4
1,7
-18,0 -13,7
-61,9
-46,0-49,8 -47,7
1,55
-24,1-17,4
-80
-60
-40
-20
0
20
Alirocumab: HDL-C <40 mg/dL Control: HDL-C <40 mg/dL
Alirocumab: HDL-C ≥40 mg/dL Control: HDL-C ≥40 mg/dL
ALI 75 mg vs PBO
(with statins)
ALI 75 mg vs EZE
(with statins)ALI 150 mg vs PBO
(with statins)
All P<0.0001 versus placebo
ALI 75 mg vs EZE
(without statins)
Mea
n (
SE
) %
change f
rom
baselin
e to W
eek 1
2Percentage Change from Baseline in Calculated LDL-C Level
at Week 12 Subgroup Analysis According to HDL-C baseline

15
-53,3
-39,7 -39,3-40,8
4,73,3
-14,6-8,4
-52,3
-40,8 -39,6-35,8
-0,1
0,4
-16,1-11,4
-80
-60
-40
-20
0
20
Alirocumab: HDL-C <40 mg/dL Control: HDL-C <40 mg/dL
Alirocumab: HDL-C ≥40 mg/dL Control: HDL-C ≥40 mg/dL
ALI 75/150 mg vs PBO
(with statins)
ALI 75/150 mg vs EZE
(with statins)ALI 150 mg vs PBO
(with statins)
All P<0.0001 versus placebo
ALI 75/150 mg vs EZE
(without statins)
Mea
n (
SE
) %
change f
rom
baselin
e to W
eek 2
4Percentage Change from Baseline in ApoB Level at
Week 24 Subgroup Analysis According to HDL-C baseline

16
-53,5
-42,0 -42,2-44,7
2,1 6,7
-17,4-9,1
-51,4
-42,6 -42,5 -39,9
0,14,1
-19,5-15,8
-80
-60
-40
-20
0
20
Alirocumab: HDL-C <40 mg/dL Control: HDL-C <40 mg/dL
Alirocumab: HDL-C ≥40 mg/dL Control: HDL-C ≥40 mg/dL
ALI 75/150 mg vs PBO
(with statins)
ALI 75/150 mg vs EZE
(with statins)ALI 150 mg vs PBO
(with statins)
All P<0.0001 versus placebo
ALI 75/150 mg vs EZE
(without statins)
Mea
n (
SE
) %
change f
rom
baselin
e to W
eek 2
4Percentage Change from Baseline in Non-HDL-C Level at
Week 24 Subgroup Analysis According to HDL-C baseline

Safety Analysis (Pool of 4x Phase 2 + 10x Phase 3
trials*; safety population)
17
*Placebo-controlled studies: phase 3 (LTS11717, FH I, FH II, HIGH FH, COMBO I), phase 2 (DFI11565, DFI11566, CL-1003, DFI12361)
Ezetimibe-controlled studies: phase 3 (COMBO II, MONO, OPTIONS I, OPTIONS II, ALTERNATIVE). Includes all data collected to last patient visit at
52 wks for COMBO, FH, HIGH FH and LONG TERM studies.†Safety data pool includes alirocumab 75 mg Q2W and alirocumab 150 mg Q2W doses only‡Includes CHD death, Non-fatal MI, Fatal and non-fatal ischemic stroke, Unstable angina requiring hospitalization, Congestive heart failure requiring
hospitalization, Ischemia driven coronary revascularization procedure. ‖ Calculated using N values of 2318 for alirocumab and 1174 for placebo (excludes phase 2).
CMQ, Custom MedDRA Query; HLT, High-Level Term, PCSA, Potentially Clinically Significant Abnormalities; PT, preferred term.
n (%) of patients Ezetimibe-controlled pool
(N=1482; 28%)
Placebo-controlled pool
(N=3752; 72%)
ALI (n=864)† EZE (n=618) ALI (n=2476)† PBO (n=1276)
TEAEs 607 (70.3) 421 (68.1) 1876 (75.8) 975 (76.4)
Treatment-emergent SAEs 113 (13.1) 69 (11.2) 340 (13.7) 182 (14.3)
TEAEs leading to death 2 (0.2) 7 (1.1) 13 (0.5) 11 (0.9)
TEAEs leading to discontinuation 76 (8.8) 60 (9.7) 131 (5.3) 65 (5.1)
Safety terms of interest
Adjudicated CV events‡ 27 (3.1) 12 (1.9) 83 (3.6)‖ 41 (3.5)‖
Injection site reactions (HLT) 26 (3.0) 13 (2.1) 179 (7.2) 65 (5.1)
General allergic TEAE (CMQ) 59 (6.8) 33 (5.3) 213 (8.6) 99 (7.8)
Pruritus (PT) 7 (0.8) 3 (0.5) 28 (1.1) 5 (0.4)
General allergic serious TEAE
(CMQ)1 (0.1) 2 (0.3) 9 (0.4) 5 (0.4)
Neurocognitive disorders (CMQ) 8 (0.9) 6 (1.0) 21 (0.8) 9 (0.7)
ALT >3 x ULN (PCSA) 9/850 (1.1) 1/612 (0.2) 41/2455 (1.7) 18/1266 (1.4)

N (%) of patients
TG <150 mg/dL TG ≥150 mg/dL
ALI n=1984 ALI n=1198
TEAEs 1501 (75.7) 891 (74.4)
Treatment-emergent SAEs 285 (14.4) 166 (13.9)
TEAEs leading to death 12 (0.6) 3 (0.3)
TEAEs leading to discontinuation 112 (5.6) 91 (7.6)
Safety terms of interest
Adjudicated CV events* 64 (3.2) 46 (3.8)
Injection site reactions (HLT) 132 (6.7) 57 (4.8)
General allergic TEAE (CMQ) 162 (8.2) 99 (8.3)
Pruritus (PT) 26 (1.3) 9 (0.8)
General allergic serious TEAE (CMQ) 7 (0.4) 3 (0.3)
Neurocognitive disorders (CMQ) 21 (1.1) 7 (0.6)
ALT >3 x ULN (PCSA) 23/1962 (1.2) 27/1186 (2.3)
Pooled Safety Data by Baseline TG from Safety
Population Included in the Current Analysis
18
*Includes CHD death, non-fatal MI, fatal and non-fatal ischemic stroke, unstable angina requiring hospitalization, congestive heart
failure requiring hospitalization, ischemia-driven coronary revascularization procedure.
Safety population: All randomized patients who received ≥1 full or partial dose of study drug.
ALT, alanine aminotransferase; CHD, coronary heart disease; CMQ, custom MedDRA query; HLT, high-level term; PCSA, potentially
clinically significant abnormalities; PT, preferred term; SAE, serious adverse event; TEAE, treatment-emergent adverse event; ULN,
upper limit of normal.

N (%) of patients
HDL-C <40 mg/dL HDL-C ≥ mg/dL
ALI n=505 ALI n=2429
TEAEs 580 (77.0) 1812 (74.6)
Treatment-emergent SAEs 110 (14.6) 341 (14.0)
TEAEs leading to death 4 (0.5) 11 (0.5)
TEAEs leading to discontinuation 45 (6.0) 158 (6.5)
Safety terms of interest
Adjudicated CV events* 30 (4.0) 80 (3.3)
Injection site reactions (HLT) 42 (5.6) 147 (6.1)
General allergic TEAE (CMQ) 52 (6.9) 209 (8.6)
Pruritus (PT) 6 (0.8) 29 (1.2)
General allergic serious TEAE (CMQ) 2 (0.3) 8 (0.3)
Neurocognitive disorders (CMQ) 3 (0.4) 25 (1.0)
ALT >3 x ULN (PCSA) 13/747 (1.7) 37/2401 (1.5)
Pooled Safety Data by Baseline HDL-C from
Safety Population Included in the Current Analysis
19
*Includes CHD death, non-fatal MI, fatal and non-fatal ischemic stroke, unstable angina requiring hospitalization, congestive heart
failure requiring hospitalization, ischemia-driven coronary revascularization procedure.
Safety population: All randomized patients who received ≥1 full or partial dose of study drug.
ALT, alanine aminotransferase; CHD, coronary heart disease; CMQ, custom MedDRA query; HLT, high-level term; PCSA, potentially
clinically significant abnormalities; PT, preferred term; SAE, serious adverse event; TEAE, treatment-emergent adverse event; ULN,
upper limit of normal.

In this large, pooled analysis of 4915 patients
– Alirocumab consistently produced substantially lower LDL-
C levels regardless of baseline TG or HDL-C
– The rate of treatment-emergent adverse events was similar
in alirocumab and control groups irrespective of baseline
TG and HDL-C
These findings hold potential for patients who are at
high CVD risk due to high TG and/or low HDL-C
levels
Summary
20