Aligning Sales Promotion Strategies With Buying Attitudes ...
145
Walden University ScholarWorks Walden Dissertations and Doctoral Studies Walden Dissertations and Doctoral Studies Collection 2015 Aligning Sales Promotion Strategies With Buying Aitudes in a Recession Paulin Adjagbodjou Walden University Follow this and additional works at: hps://scholarworks.waldenu.edu/dissertations Part of the Advertising and Promotion Management Commons , and the Marketing Commons is Dissertation is brought to you for free and open access by the Walden Dissertations and Doctoral Studies Collection at ScholarWorks. It has been accepted for inclusion in Walden Dissertations and Doctoral Studies by an authorized administrator of ScholarWorks. For more information, please contact [email protected].
Transcript of Aligning Sales Promotion Strategies With Buying Attitudes ...
Walden UniversityScholarWorks
Walden Dissertations and Doctoral Studies Walden Dissertations and Doctoral StudiesCollection
2015
Aligning Sales Promotion Strategies With BuyingAttitudes in a RecessionPaulin AdjagbodjouWalden University
Follow this and additional works at: https://scholarworks.waldenu.edu/dissertations
Part of the Advertising and Promotion Management Commons, and the Marketing Commons
This Dissertation is brought to you for free and open access by the Walden Dissertations and Doctoral Studies Collection at ScholarWorks. It has beenaccepted for inclusion in Walden Dissertations and Doctoral Studies by an authorized administrator of ScholarWorks. For more information, pleasecontact [email protected].

Walden University
College of Management and Technology
This is to certify that the doctoral study by
Paulin Adjagbodjou
has been found to be complete and satisfactory in all respects,
and that any and all revisions required by
the review committee have been made.
Review Committee
Dr. Janet Booker, Committee Chairperson, Doctor of Business Administration Faculty
Dr. Peter Anthony, Committee Member, Doctor of Business Administration Faculty
Dr. Maurice Dawson, University Reviewer, Doctor of Business Administration Faculty
Chief Academic Officer
Eric Riedel, Ph.D.
Walden University
2015
Abstract
Aligning Sales Promotion Strategies With Buying Attitudes in a Recession
by
Paulin Adjagbodjou
MS, Abomey-Calavi University, 2004
MBA, Abomey-Calavi University, 2002
BS, Abomey-Calavi University, 1995
Doctoral Study Submitted in Partial Fulfillment
of the Requirements for the Degree of
Doctor of Business Administration
Walden University
April 2015
Abstract
Some managers lack an effective strategy for aligning sales promotion strategies with
consumers’ buying attitudes in a recession. The intent of this comparative design was to
determine the most effective sales promotion strategy for sales improvement and business
sustainability during a recession. The theories of (a) sales promotions, (b) consumer
behavioral metrics, (c) price reductions, and (d) strategy in a competitive environment
represented the theoretical framework that grounded and complemented this research.
Using a confidential paper-based survey and random sampling method, preference data
were obtained from 287 consumers in retail stores located in a city in the southern United
States. This analysis comprised examining the effects of types of sales promotions and
gender of customers. Statistical tests for the data analysis encompassed a 4X2 ANOVA
and Bonferroni post hoc tests for mean pairs. The principal findings from the analysis
were that there is a significant difference in buying attitudes means among the 4 types of
sales promotion in a recession [F(3, 279) = 101.360; p = .000 < .001; Partial η² = .522].
However, there is no significant difference in buying attitudes means in a recession [F(1,
279) = .000; p = .999 > .05; Partial η² = .000] between genders. Price discount strategy
had a higher buying attitudes mean than did any other type of sales promotion under
study for both genders. The most effective strategy for aligning sales promotions with
buying attitudes in a recession is price discount. Implications for business practice and
positive social change include the sales increase in a recession, improvement of lifestyle
of individuals, and reduction of negative tendencies such as crime and poverty associated
with unemployment.
Aligning Sales Promotion Strategies With Buying Attitudes in a Recession
by
Paulin Adjagbodjou
MS, Abomey-Calavi University, 2004
MBA, Abomey-Calavi University, 2002
BS, Abomey-Calavi University, 1995
Doctoral Study Submitted in Partial Fulfillment
of the Requirements for the Degree of
Doctor of Business Administration
Walden University
April 2015
Dedication
I dedicate this doctoral study to my mother, Dessoi Houindode (God rest her
soul), who taught me the self-discipline and value of a strong work ethic in attaining
personal goals in any circumstance. To my father, Augustin Adjagbodjou (God rest his
soul), who always valued higher education and taught me the perseverance even in the
midst of adversity. To my wife, Colette, for her encouragement and support throughout
the process. To my children, Adinawa, Ededi, Finagnon, Tchegnon, and Tchessimin, who
will succeed more than me. To my sisters, brothers, and other family members who
encouraged me.
Acknowledgments
First and foremost, I thank God for all. I am forever deeply grateful to my
children, Adinawa, Ededi, Finagnon, Tchegnon, and Tchessimin, and my wife, Colette,
for understanding that this journey required time, patience, and sacrifice that took me
away from them. I thank my first mentor and committee chair, Dr. Ann Nelson for her
contribution and support. I am grateful to my second chair, Dr. Janet Booker for her
support and availability. Dr. Janet Booker, this research would not have materialized
without your availability. I am grateful to my committee member, Dr. Peter Anthony,
methodologists Dr. James E. Fletcher and Dr. Al Endres, and University Research
Reviewer, Dr. Maurice Dawson for their valuable feedback and suggestions that made
this study possible. I acknowledge Raimi Gnonlonfoun for his support. I thank the
director of this program, Dr. Freda Turner, and all the instructors and fellow learners I
met during this journey.
i
Table of Contents
List of Tables ..................................................................................................................... iv
List of Figures ......................................................................................................................v
Section 1: Foundation of the Study ......................................................................................1
Background of the Problem ...........................................................................................1
Problem Statement .........................................................................................................3
Purpose Statement ..........................................................................................................4
Nature of the Study ........................................................................................................5
Research Question .........................................................................................................6
Hypotheses .....................................................................................................................6
Survey Questions .................................................................................................... 7
Theoretical Framework ................................................................................................11
Definition of Terms......................................................................................................14
Assumptions, Limitations, and Delimitations ..............................................................15
Assumptions .......................................................................................................... 15
Limitations ............................................................................................................ 15
Delimitations ......................................................................................................... 16
Significance of the Study .............................................................................................16
Contribution to Business Practice ......................................................................... 16
Implications for Social Change ............................................................................. 17
A Review of the Professional and Academic Literature ..............................................18
Literature Review of Sales Promotion .................................................................. 19
ii
Literature Review of Factors Influencing Buying Attitudes ................................. 30
Literature Review of Factors Affecting Sales ....................................................... 37
Literature Review of the Financial Crisis Impact on Sales ................................... 46
Summary of Literature Review ............................................................................. 50
Transition and Summary ..............................................................................................51
Section 2: The Project ........................................................................................................52
Purpose Statement ........................................................................................................52
Role of the Researcher .................................................................................................53
Participants ...................................................................................................................54
Research Method and Design ......................................................................................56
Method .................................................................................................................. 56
Research Design.................................................................................................... 57
Population and Sampling .............................................................................................58
Ethical Research...........................................................................................................60
Data Collection ............................................................................................................62
Instruments ............................................................................................................ 62
Data Collection Technique ................................................................................... 65
Data Organization Techniques .............................................................................. 66
Data Analysis Technique .............................................................................................67
Reliability and Validity ................................................................................................70
Reliability .............................................................................................................. 70
Validity ................................................................................................................. 71
iii
Transition and Summary ..............................................................................................72
Section 3: Application to Professional Practice and Implications for Change ..................74
Overview of Study .......................................................................................................74
Presentation of the Findings.........................................................................................76
Presentation of the Results .................................................................................... 77
Discussion of the Results ...................................................................................... 84
Applications to Professional Practice ..........................................................................90
Implications for Social Change ....................................................................................90
Recommendations for Action ......................................................................................91
Recommendations for Further Study ...........................................................................92
Reflections ...................................................................................................................92
Summary and Study Conclusions ................................................................................93
References ..........................................................................................................................96
Appendix A: List of Demographic and Survey Questions ..............................................118
Appendix B: Permissions to Use Existing Survey ...........................................................122
Appendix C: Consent Form .............................................................................................129
Appendix D: Confidentiality Agreement .........................................................................131
iv
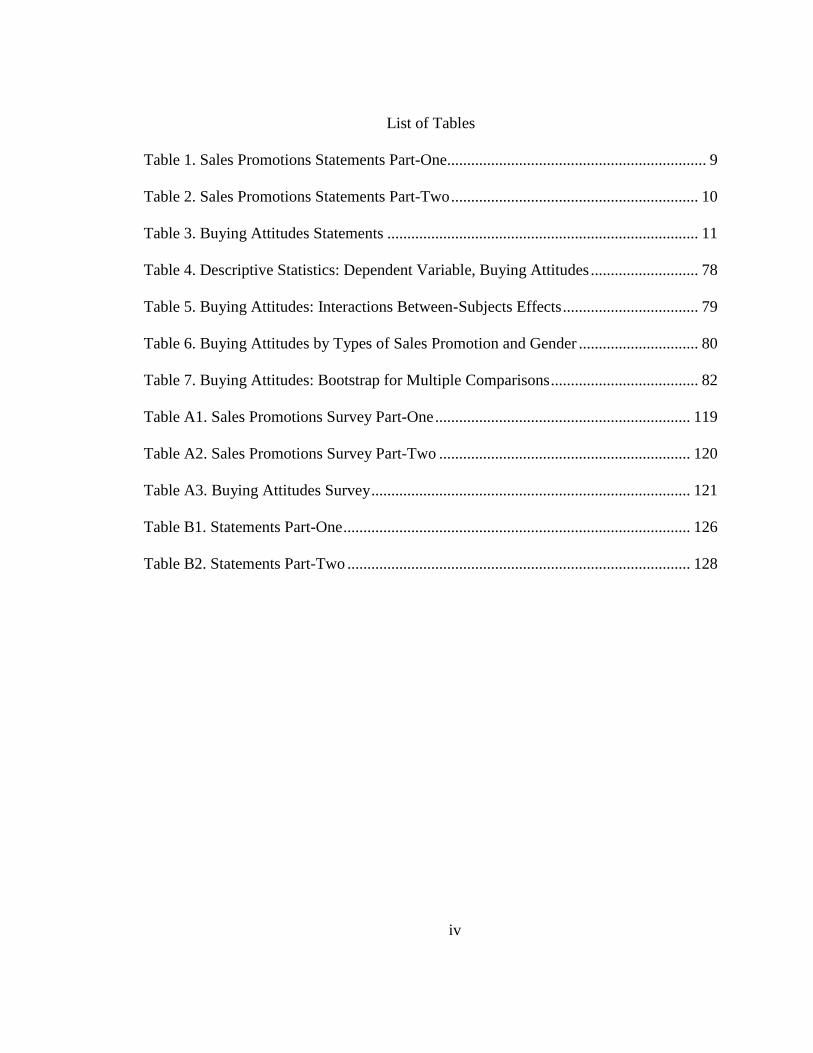
List of Tables
Table 1. Sales Promotions Statements Part-One................................................................. 9
Table 2. Sales Promotions Statements Part-Two .............................................................. 10
Table 3. Buying Attitudes Statements .............................................................................. 11
Table 4. Descriptive Statistics: Dependent Variable, Buying Attitudes ........................... 78
Table 5. Buying Attitudes: Interactions Between-Subjects Effects .................................. 79
Table 6. Buying Attitudes by Types of Sales Promotion and Gender .............................. 80
Table 7. Buying Attitudes: Bootstrap for Multiple Comparisons ..................................... 82
Table A1. Sales Promotions Survey Part-One ................................................................ 119
Table A2. Sales Promotions Survey Part-Two ............................................................... 120
Table A3. Buying Attitudes Survey ................................................................................ 121
Table B1. Statements Part-One ....................................................................................... 126
Table B2. Statements Part-Two ...................................................................................... 128

v
List of Figures
Figure 1. Plot of estimated marginal means of buying attitudes....................................... 84
1
Section 1: Foundation of the Study
The intent of this doctoral study was to determine the most effective strategy of
sales promotions towards buying attitudes of customers in a recession, in a city, in the
southern United States (U.S.). The evaluation of customers’ buying attitudes underlay a
potent model for aligning sales strategies with buying attitudes. The literature included
sales, sales promotions, buying attitudes, and financial crisis. Understanding the
background might assist business leaders in developing appropriate strategies for
recessions.
Background of the Problem
The 2008 global financial crisis commenced the crash of stocks in the U.S, spread
into the world, and engendered a recession (Hsu, 2012). Levchenko, Lewis, and Tesar
(2010) confirmed that the financial crisis caused a collapse of trade in the U.S. and was
intense in magnitude and worldwide in nature. Furthermore, Hsu (2012) supported that
the economic crisis covered much of both the developing and developed worlds and was
equally devastating for many companies. For example, the U.S. nonpetroleum exports
and imports declined by 27% from August 2008 to April 2009 (Alessandria, Kaboski, &
Midrigan, 2010), and exports and imports decreased respectively by18.9 and 21.4% over
the same time (Levchenko et al., 2010). The U.S. has struggled unsuccessfully to recover
from the consequences of the crisis, although the country has had the highest ratio of
businesspersons per capita compared to any nation in the world (Monahan, Shah, &
Mattare, 2011).
2
Information related to sales and other key economic indicators have been poor,
confirming the crisis tendency even though company leaders have implemented different
models, trying to develop business (Milić, 2011). However, theoretical and practical
methods have been obsolete in this crisis (Mitran & Bebeselea, 2012). Mishra and Mishra
(2011) supported this view, providing examples from previous findings. When all else is
equal, consumers prefer bonus packs to price discounts (Mishra & Mishra, 2011). Mishra
and Mishra examined the way price and quantity based sales promotions impact the
consumption of foods and found that this preference does not hold for unhealthy foods in
this recession. Consistency of the price in a perfectly competitive market when an
auctioned good is homogeneous was the insight of previous research (Dulaney & Wiese,
2011). Conversely, Dulaney and Wiese (2011) found a significant variation of prices in
this crisis. Moreover, Mitran and Bebeselea (2012) confirmed the trend and suggested the
need for companies to anticipate the domino effect the financial crisis has engendered.
Milić (2011) reinforced this prospect, establishing that the financial crisis effects may
continue even beyond 2014.
The change in the nature of value creation might present a need to increase sales.
Apetroaie, Florescu, and Ducu (2012) supported this opinion and showed that company
leaders should integrate the financial requirement of consumers in the development plan
of firms. Price is a critical factor in every consumer purchase as customers use price
information to determine the value of the product and make a decision whether to
consume this good or service (Samper & Schwartz, 2013). Samper and Schwartz (2013)
3
explained that the transparency of higher prices causes a decrease in consumption.
Additionally, Zhang and Zaric (2011) posited that the manager capitalizes when selecting
marketing efforts to promote diverse usages.
An overview of the recession allowed the perception of a lack of research in sales
strategy. There was a need to examine strategies such as sales promotions and align
approaches with buying attitudes. Mitran and Bebeselea (2012) supported that receiving
fresh information about marketing development from sales potency in time and
channeling the resources of the organization to achieve marketing objectives are essential
requirements for sales performance. Understanding the types of sales promotions that
might influence buying attitudes significantly in a crisis was of crucial importance to
company leaders. The goal of this doctoral study was to assess customers’ buying
attitudes towards sales promotions in a recession. Findings from the research might serve
as a basis for the development of appropriate sales strategies involving promotions.
Inferences for positive social change included the potential to enable the profitability of
firms and employment opportunity for individuals.
Problem Statement
One of the challenges for corporation leaders consists of increasing sales of
products (Apetroaie et al., 2012). The collapse of sales in the U.S. was a remarkable
consequence of the financial crisis that occurred in 2008 (Alessandria et al., 2010). Sales
of (a) agricultural products, (b) consumer goods, (c) manufacturing supplies, and (d)
automotive products decreased respectively by 9, 15, 47, and 49% during the 2008-2009

4
sales collapse (Levchenko et al., 2010). In 2011, Milić found that the financial crisis
effects might continue until 2014 and even later. Kotler (2011) explained the persistence
of sales issues by the magnitude of the crisis, which has constrained consumers to modify
lifestyles to a lower level of revenue and spending. The general business problem was a
loss of profits for the business because of the collapse of sales and nonexistence of a sales
promotion strategy that significantly influences buying attitudes. The specific business
problem was that some managers lack an effective strategy for aligning sales promotions
with buying attitudes in a recession.
Purpose Statement
The purpose of this quantitative study using a comparative design was to
determine the most effective strategy for aligning sales promotions with buying attitudes
in a recession. A southern U.S. city represented the geographic location of the study
because the 2008 recession has affected the profitability and sustainability of retail stores
in the city (Apetroaie et al., 2012; Levchenko et al., 2010). The specific population group
of the study consisted of consumers involved in the buying process in retail stores
because the increase of sales should generate from customers, not from internal
requirements or perspectives of corporations (Apetroaie et al., 2012). Every customer had
scores on three variables, which were two factors and one dependent variable. The
independent variables or factors were sales promotion and gender of customers. The
factor sales promotion included cases divided into four levels: (a) coupons, (b) buy-one-
get-one-free, (c) price discounts, and (d) control case for which there was no sales
5
promotion strategy. The factor gender encompassed cases divided into two levels, male
and female. The dependent variable was buying attitudes of customers. An examination
of the mean difference between the sales promotions and customers’ buying attitudes was
necessary to understand the sales promotion strategy that could contribute to a significant
growth of sales. The implications for positive social change comprised the potential to
enable the sustainability of businesses, employment opportunity, and reduction of poverty
associated with unemployment.
Nature of the Study
The quantitative research method was the approach for the study. This process
allowed the investigation of the relationship between dependent and independent or
outcome variables in a population (Williams, 2011). The research design for the inquiry
was survey research, which facilitated the evaluation of objective theories by examining
differences between groups or relationships among variables (Anyiwe, 2012). The intent
of the research question was to determine the most effective strategy for aligning sales
promotions with buying attitudes in a recession. Shuval et al. (2011) and Słysz and
Soroko (2012) found that the qualitative method is useful when the researcher does not
identify the key variables in the analysis. Consequently, a qualitative approach was not
suitable for the study since there was identification of the independent variables, which
were sales promotion and gender of customers. The dependent variable was buying
attitudes of customers. In addition, a quantitative approach was relevant because the
research required a systematic scientific process, defining a problem, and building and
6
testing hypotheses. The mixed methods approach integrates both quantitative and
qualitative approaches in research (Anyiwe, 2012). This approach was not necessary
since there was no need for qualitative data collection and analysis. Thus, a quantitative
method using a survey instrument was appropriate for the purpose of this study.
Research Question
The purpose of this quantitative comparative design was to identify which sales
promotion strategy influences buying attitudes significantly in a recession. The research
question was a follows: What is the most effective strategy for aligning sales promotions
with buying attitudes in a recession? The sales promotions under investigation were
coupons, buy-one-get-one-free, price discounts, and control case for which there was no
sales promotion strategy. The analysis included effects of both types of sales promotions
and gender of customers. The subquestions generated from this question were as follows:
1. How do buying attitudes means differ among the types of sales promotion in a
recession?
2. How do buying attitudes means differ among customers male and female in a
recession?
Hypotheses
The null and alternative hypotheses built from the research question were as
follows:
H1o: There is no significant difference in buying attitudes means among the types
of sales promotion in a recession.
7
H1a: There is a significant difference in buying attitudes means among the types
of sales promotion in a recession.
H2o: There is no significant difference in buying attitudes means among
customers male and female in a recession.
H2a: There is a significant difference in buying attitudes means among customers
male and female in a recession.
Survey Questions
The survey included demographic, sales promotion, and buying attitudes
statements (Appendix A). The buying attitudes and sales promotion questions were
instruments Bakewell and Mitchell made in 2003 and those that Osman and Fah created
in 2011. The demographic statements encompassed both close-ended and open-ended
questions. The sales promotion and buying attitudes questions represented the 5-point
Likert-type rating scales.
For the demographic questions, participants chose answers among statements
generated from standard classifications used in 2012 by the U.S. Census Bureau:
1- Gender:
Female Male
2- Age:
18 - 24 years old 25 – 44 years old 45 – 59 years old 60 years and older
3- Race:
8
White Black or African American American Indian or Alaska Native
Asian Native Hawaiian and Other Pacific Islander
Some Other Race
4- Marital Status
Single (never married) Married Cohabiting Separated
Divorced Widowed Not Stated
5- Employment Situation:
Employed Unemployed Student
5- Family Monthly income:
Under or $19,999 $20,000 – $29,999 $30,000 – $39,999 $40,000 – $59,999
$60,000 – $79,999 $80,000 – $99,999 $100,000 – $249,999 $250,000 or
over
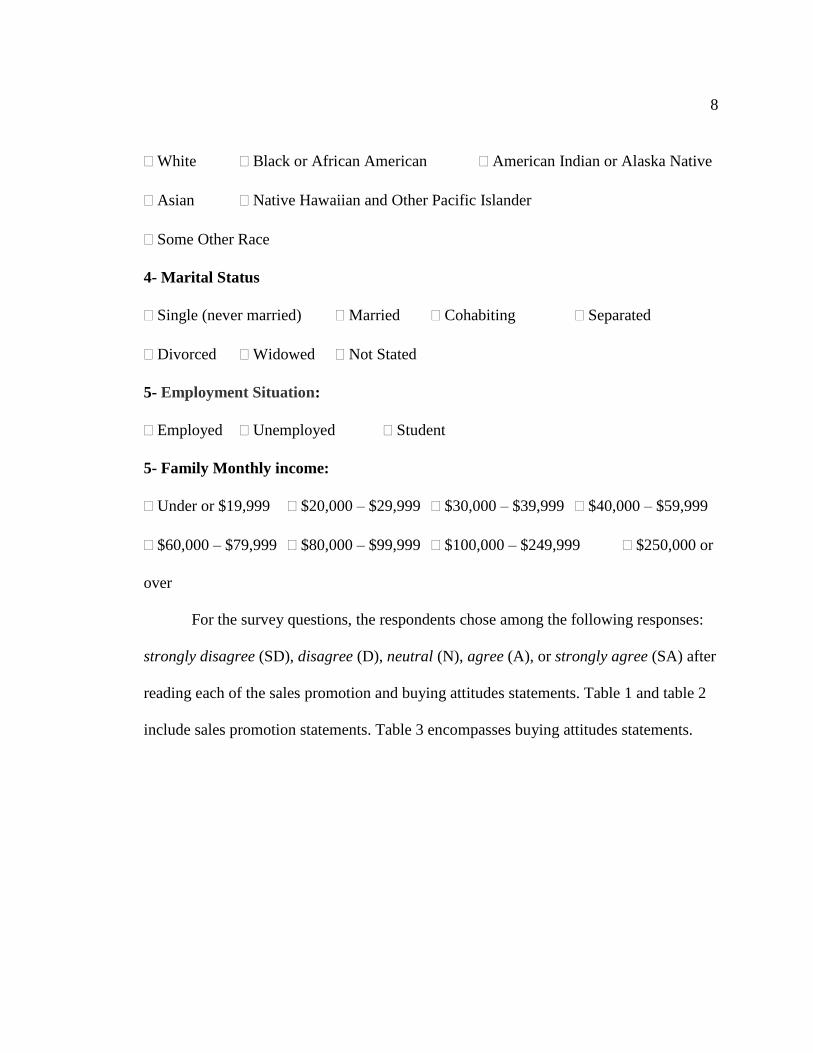
For the survey questions, the respondents chose among the following responses:
strongly disagree (SD), disagree (D), neutral (N), agree (A), or strongly agree (SA) after
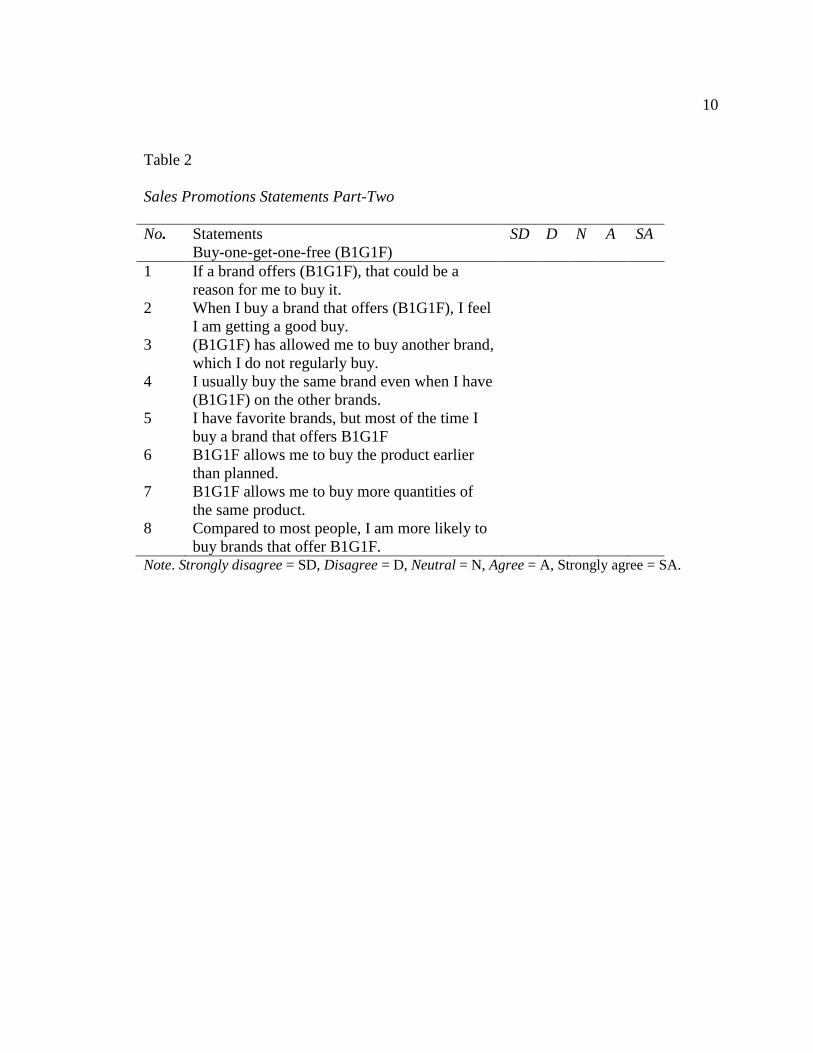
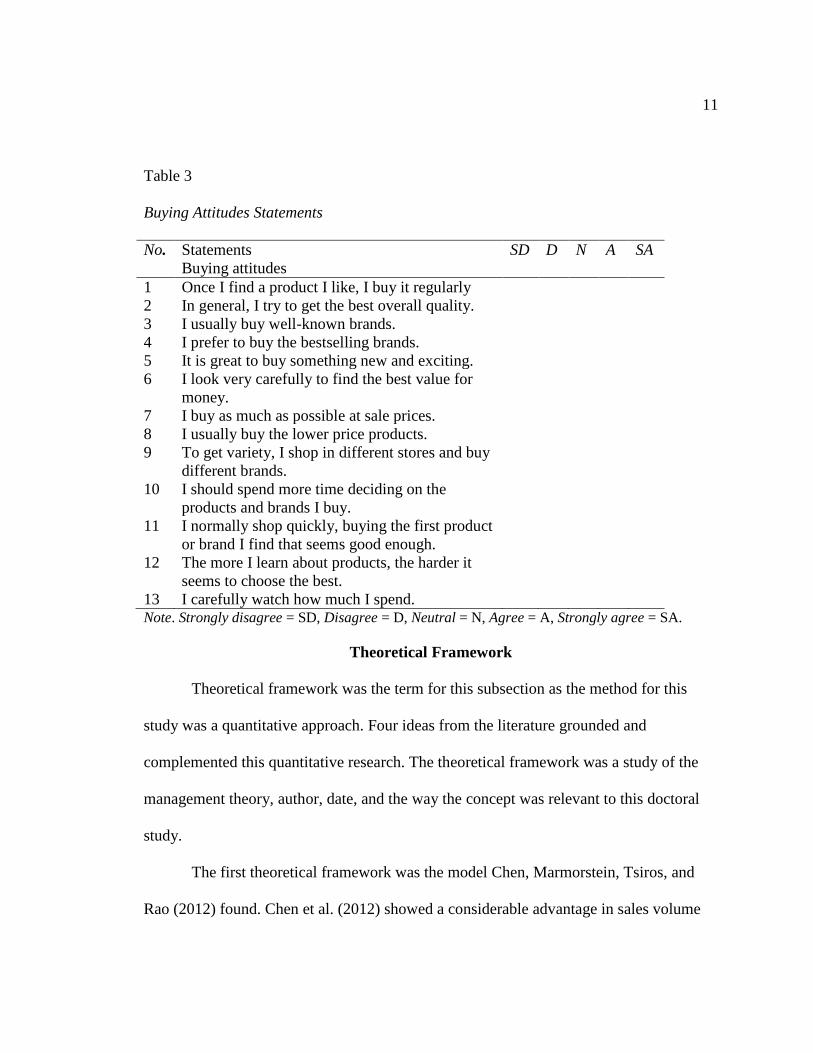
reading each of the sales promotion and buying attitudes statements. Table 1 and table 2
include sales promotion statements. Table 3 encompasses buying attitudes statements.
9
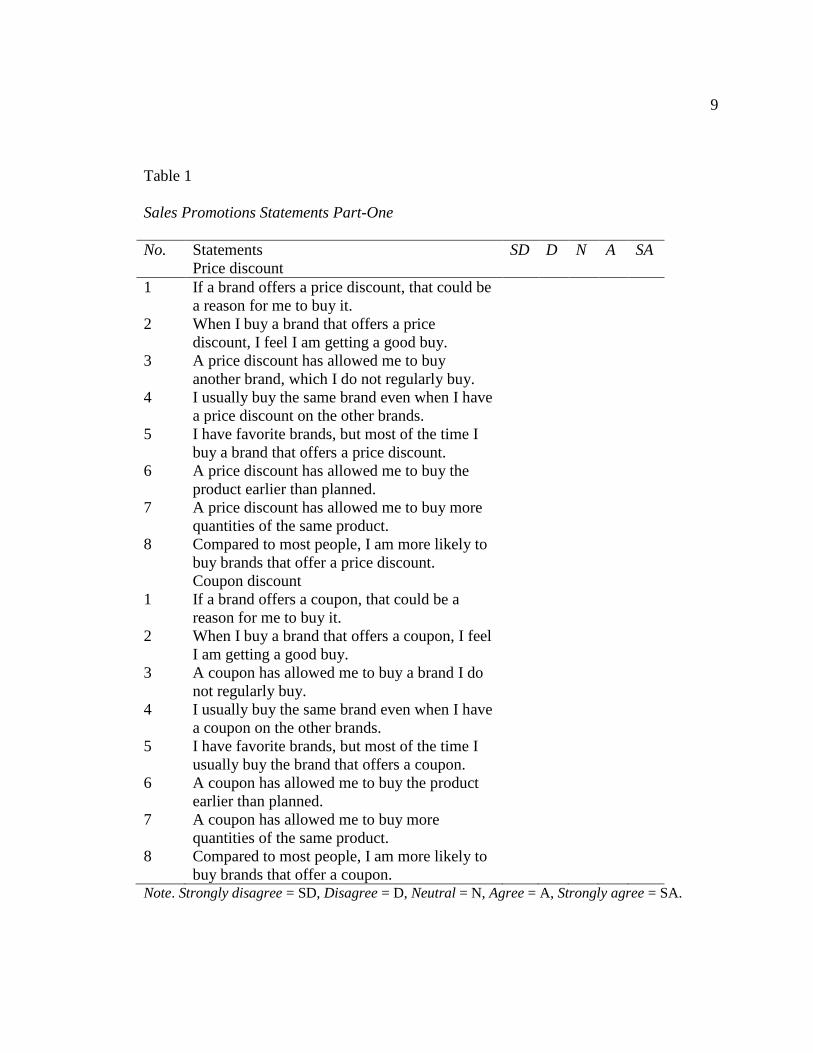
Table 1
Sales Promotions Statements Part-One
No. Statements SD D N A SA
Price discount
1 If a brand offers a price discount, that could be
a reason for me to buy it.
2 When I buy a brand that offers a price
discount, I feel I am getting a good buy.
3 A price discount has allowed me to buy
another brand, which I do not regularly buy.
4 I usually buy the same brand even when I have
a price discount on the other brands.
5 I have favorite brands, but most of the time I
buy a brand that offers a price discount.
6 A price discount has allowed me to buy the
product earlier than planned.
7 A price discount has allowed me to buy more
quantities of the same product.
8 Compared to most people, I am more likely to
buy brands that offer a price discount.
Coupon discount
1 If a brand offers a coupon, that could be a
reason for me to buy it.
2 When I buy a brand that offers a coupon, I feel
I am getting a good buy.
3 A coupon has allowed me to buy a brand I do
not regularly buy.
4 I usually buy the same brand even when I have
a coupon on the other brands.
5 I have favorite brands, but most of the time I
usually buy the brand that offers a coupon.
6 A coupon has allowed me to buy the product
earlier than planned.
7 A coupon has allowed me to buy more
quantities of the same product.
8 Compared to most people, I am more likely to
buy brands that offer a coupon.
Note. Strongly disagree = SD, Disagree = D, Neutral = N, Agree = A, Strongly agree = SA.
10
Table 2
Sales Promotions Statements Part-Two
No. Statements SD D N A SA
Buy-one-get-one-free (B1G1F)
1 If a brand offers (B1G1F), that could be a
reason for me to buy it.
2 When I buy a brand that offers (B1G1F), I feel
I am getting a good buy.
3 (B1G1F) has allowed me to buy another brand,
which I do not regularly buy.
4 I usually buy the same brand even when I have
(B1G1F) on the other brands.
5 I have favorite brands, but most of the time I
buy a brand that offers B1G1F
6 B1G1F allows me to buy the product earlier
than planned.
7 B1G1F allows me to buy more quantities of
the same product.
8 Compared to most people, I am more likely to
buy brands that offer B1G1F.
Note. Strongly disagree = SD, Disagree = D, Neutral = N, Agree = A, Strongly agree = SA.
11
Table 3
Buying Attitudes Statements
No. Statements SD D N A SA
Buying attitudes
1 Once I find a product I like, I buy it regularly
2 In general, I try to get the best overall quality.
3 I usually buy well-known brands.
4 I prefer to buy the bestselling brands.
5 It is great to buy something new and exciting.
6 I look very carefully to find the best value for
money.
7 I buy as much as possible at sale prices.
8 I usually buy the lower price products.
9 To get variety, I shop in different stores and buy
different brands.
10 I should spend more time deciding on the
products and brands I buy.
11 I normally shop quickly, buying the first product
or brand I find that seems good enough.
12 The more I learn about products, the harder it
seems to choose the best.
13 I carefully watch how much I spend. Note. Strongly disagree = SD, Disagree = D, Neutral = N, Agree = A, Strongly agree = SA.
Theoretical Framework
Theoretical framework was the term for this subsection as the method for this
study was a quantitative approach. Four ideas from the literature grounded and
complemented this quantitative research. The theoretical framework was a study of the
management theory, author, date, and the way the concept was relevant to this doctoral
study.
The first theoretical framework was the model Chen, Marmorstein, Tsiros, and
Rao (2012) found. Chen et al. (2012) showed a considerable advantage in sales volume
12
for sales promotions, provided evidence in support of the result, and indicated useful
boundary circumstances for when the influence is likely to be manifest. In addition, Chen
et al. also identified a tendency among customers to neglect base values when processing
proportion change information and stated that understanding the implications of how
customers evaluate offers such as sales promotions is necessary for business leaders to
increase sales and profitability of companies. The idea of learning how consumers
appraise the types of sales promotions was pertinent in that the principles of the theory
were inherent for the inquiry.
The idea Frischmann and Gensler (2011) developed was the second model.
According to Frischmann and Gensler, the intent when developing several customer
metrics in the past was to value and measure marketing investments and to link returns to
business performance and results in accordance with the growing importance of the
subject. Frischmann and Gensler supported that, in general, managers acknowledged the
need for quantitative procedures of marketing performance when facing the challenge of
determining which metrics managers should measure and a way to interpret the results.
Furthermore, Frischmann and Gensler established the relevance of mediating effects of
consumer behavioral metrics on the correlation between buyer perceptual metrics and
profitability. This theory was useful for this research because Frischmann and Gensler
addressed the issues and impact on consumer profitability, considering direct and indirect
mediator effects and associations.
13
The management model Ferrer and Mallari (2011) found was the third theoretical
framework serving as a guide. Ferrer and Mallari posited in the theory that reductions in
price allow creating value for investors. The authors found that reductions of product
prices have a positive impact on sales and investors’ revenue and that firms earn per
share when cutting prices. This management theory was relevant as the theory enables the
establishment of a relationship between product price reduction and the profitability of
companies.
The final theoretical framework was a theory developed in Harvard Business
Essentials (2005). Harvard Business Essentials included the concept that the best strategy
starts with goals. Using the analysis that consists of strengths, weaknesses, opportunities,
and threats (SWOT), the authors showed the way a strategic choice should emerge from
the process consisting of looking outside and inside of an organization. The authors
defined different types of strategies, strategic moves, and ways a firm may stay on course
in a competitive environment. This theory was relevant since the researchers indicated
how an organization might survive and acquire or maintain a leadership position in a
competitive environment by aligning strategy to goals, implementation, and action plans.
The literature review section included a discussion of the theoretical frameworks. The
definition of a number of terms was essential for the insight of the analysis.
14
Definition of Terms
The study contained a number of relevant terms and concepts that common
definitions helped understand. Below, authors from peer-reviewed sources informed the
definition of the term. The ideas referred to jargon or technical expressions.
Ambidextrous organizations: Organizations with leaders who manage conflicting
demands of using existing competencies and exploring innovative opportunities and
enjoy higher performance (Jasmand, Blazevic, & de Ruyter, 2012).
Bonus pack: The additional product shoppers receive for the same price (Mishra
& Mishra, 2011).
Delayed promotion: The future reward clients receive after buying a promoted
product, which is contingent on completing requirements (Kim, 2013).
Immediate promotion: The instant saving to shoppers at the time of buying and
managers require almost no effort from clients (Kim, 2013).
Loyal customer: A client who buys a brand repeatedly (Liu-Thompkins & Tam,
2013).
Prevention focus: The orientation that is toward negative results (Ramanathan &
Dhar, 2010).
Price discount: The sales promotion that consists of offering the same product at a
reduced price (Mishra & Mishra, 2011).
Promotion focus: The orientation that is toward positive results (Ramanathan &
Dhar, 2010).
15
Assumptions, Limitations, and Delimitations
The doctoral study included assumptions. The study included various limitations
and delimitations as the credibility and reliability of the inquiry depended on the
respondents’ statements. In this subsection, assumptions, limitations, and delimitations
issues were the focus.
Assumptions
The assumptions in the study consisted of clear understanding of questions by
respondents. Participants answered honestly, exhibiting integrity and truthfulness.
Furthermore, information about the three sales promotion strategies in the research was
invariant. In addition, a literature review was sufficient to portray the objectives of the
study accurately.
Limitations
The interpretation of results from the study included unavoidable limitations.
Respondents answered all questions and might show a spontaneous approach in
completing the survey. I relied on the credibility and reliability of participants’
statements. The sample was likely to represent a viable sample of the population.
However, this sample might not be typical of the entire population of the city. The
number and quality of consumers willing and available to participate were indispensable
to determine the limits of the study and ability to extrapolate findings to the general
population.
16
Delimitations
The research was an analysis of only three sales promotional tools instead of a
large number of sales promotion implements such as rebates, free samples, sweepstakes,
and in-pack premiums. The focus was not a category of goods or service. The
generalization of the results required increasing the size of the sample and extending the
study to other geographical locations. Although the investigation included limitations and
delimitations, the significance of the study was evident.
Significance of the Study
The purpose of this doctoral study was to evaluate customers’ buying attitudes
towards sales promotions in a recession. The analysis contributed to the sales
development in a recession. The implications for positive social change and effective
business practice were substantial. This subsection includes the contribution to business
practice and implications for social change.
Contribution to Business Practice
The implications of this research for business practice included the prospective to
address sales issues, identify the sales promotion strategies that contribute to a substantial
increase of sales, and facilitate sustainability of organizations. Kotler (2011) established
that meeting the new sales challenges requires balancing growth goals and social
marketing thinking in combination with the necessity to pursue sustainability. The intent
was to suggest a business strategy consisting of using sales promotions to improve profits
through the increase of sales volume. The implications of the inquiry included a possible
17
increase of sales and profitability for companies. There is an extraordinary level of
uncertainty among corporations regarding the economic context because sales have been
in recession (Dzikowska & Jankowska, 2012). Executives might use findings from this
research to develop business in a recession and ensure profitability for firms. The rise of
the sales volume should have a direct and positive impact on social change.
Implications for Social Change
The employment opportunity was one of the positive social changes anticipated
through the study. Increasing sales might require growing the production volume and
hiring more employees. The inferences of this inquiry for positive social change
encompassed the potential to promote the improvement of lifestyle of individuals and the
reduction of negative tendencies such as crime and poverty in association with
unemployment. For individuals, positive emotion usually accompanies a positive
outcome (Erevelles & Fukawa, 2013).
As companies sell more products and obtain more profits, governments might
collect more taxes and invest more in social programs. The gross domestic product
(GDP) might increase because of the growth of companies and transactions. The
implementation of appropriate sales promotion strategies might allow profits, success,
and prosperity opportunities for businesses, individuals, and governments. Overall, the
implications for business practice and positive social change were substantial. A literature
review was an evaluation of the body of research in sales promotions, factors influencing
buying attitudes, and the impact of the recent financial crisis on sales.
18
A Review of the Professional and Academic Literature
A review of the professional and academic literature consisted of searches, a
historical overview of dates from 2005 through 2013. Out of the 117 sources on the broad
category of sales, 116 sources, equivalent of 99% were from peer-reviewed sources and
published between 2010 and 2013. A search of the research literature through the Walden
University Internet search engines, including ProQuest, ABI/INFORM, and Business
Source Complete served in the literature review. Key terms and phrases used in primary
and secondary searches included sales promotions, factors influencing buying attitudes
and sales, price impact on sales, price reductions impact on sales, price impact on
consumer good sales, and recession. The outcomes of searches generated references to
scholarly peer-reviewed studies and articles.
The intent of this study was to assess the impact of sales promotions on buying
attitudes in a recession. The research question consisted of identifying the most effective
strategy for aligning sales promotions with buying attitudes in a recession. The answer to
the question needed to test the null hypothesis, which assumed that there is no significant
difference in buying attitudes among groups of customers based on the gender and sales
promotion in a recession. Hence, the assessment of buying attitudes towards sales
promotions was a key issue in this quantitative comparative design. The literature review
comprised sales promotions, factors influencing buying attitudes, factors affecting sales,
and the recent financial crisis impact on sales.

19
Literature Review of Sales Promotion
Sales promotion is one of key factors in the marketing mix for different
consumers' products worldwide used to stimulate customer purchases (Esfahani &
Jafarzadeh, 2012). Mir and Rehman (2012) confirmed that sales promotion is a key
implement managers use frequently to influence customers’ buying attitudes directly.
Kanagal (2013) explained that promotions as part of the information of value, comprise
trade promotions, consumer sales promotions, and promotions to the sales dynamism.
The author considered the conceptualization and definition of promotions as business
transactions, defining transactions and promotions and placing transactions as a
component of the business sequencing of contracts, transactions, and exchanges. Kanagal
found market transactions dissimilar to transactions, which are a part of studies in the
industrial organization. Kanagal uncovered that promotions have a significant function in
transactional marketing in four aspects, which are market share dynamics, demand
management, market equilibrium, and market potential realization resulting in need.
Promotions should allow acting as basing on effective competitive market transactions
upon which managers create markets (Kanagal, 2013). Kanagal also acknowledged that
marketing strategists should consider promotions as an efficient method and strategy for
managing customers and rivals in the end.
The goal managers pursue through advertising consists of informing potential
purchasers about the business and supply (Gherasim, 2012). Gherasim (2012) argued that
the central goal managers try to reach through a sales promotion is to activate stimuli and
20
turn customers into actual buyers. The author established that sales promotions are not for
a broad audience as in the case of advertising, nor for a slight group of individuals as in
direct sales. Instead, sales promotions are between advertising and direct sales (Gherasim,
2012). Gherasim found sales promotion to be an activity through which the sales agents
or distributors offer a product to purchasers or set added value or particular reward to
generate short-term sales growth. Sales promotions are a part of promotion actions and
different from promotions in general (Gherasim, 2012). Gherasim documented that
frequently, marketers offer 50% more time to sales promotions than to advertising, and
managers allocate even up to 25% of the total budget of the corporation to promotion.
Esfahani and Jafarzadeh (2013) strengthened the tendency, revealing that
resources allocated to sales promotions have increased rapidly with marketers shifting
attention to implementing sales promotions more than other strategies such as
advertising. Higher media costs might have been the principal factor in this change.
Esfahani and Jafarzadeh evidenced that sales promotions have attracted more customers
this decade than other past decades. Esfahani and Jafarzadeh also revealed that sales
promotions have stimulated marketers to rely more on sales rather than promotions to
respond to customer behavior trends. The authors gathered data from 171 chain store
customers in Kerman, Iran to confirm that sales promotions affect significantly
psychological variables involving price consciousness, quality consciousness, store
loyalty, variety seeking, and planning. However, sales promotions do not affect variables
21
such as shopping enjoyment, brand loyalty, financial constraints, time pressure, and
impulsive behavior (Esfahani & Jafarzadeh, 2012).
The behavior of customers might vary from one sales promotion to another. Mir
and Rehman (2012) showed the comparative impact of different formats and advantage
ranks of instant price discounts and buying promotions on the consumer perceptions and
buying intentions of promoted products. Moreover, Mishra and Mishra (2011)
demonstrated that consumers desire bonus packs to price discounts for healthy food items
and desire price discounts to bonus packs for unhealthy food items. Mishra and Mishra
explained the result of a price discount on unhealthy food by that related to a guilt-
mitigating mechanism. The authors concluded that for healthy food, the nonexistence of
anticipated post consumption guilt leads consumers to choose a bonus pack over a price
discount.
Osman and Fah (2011) brought a substantial contribution to the debate by
simulating coupons, buy-one-get-one-free, price discounts, and free samples towards
buying attitudes among students. The authors assessed the impact of sales promotion on
buying attitudes in this community using data collected from a sample of 150 University
Putra Malaysia students. Osman and Fah exploited self-administrated surveys and
statistical tests such as multiple regression and the t test for the analysis. The authors
found significant consistency between gender and buying attitude. Osman and Fah
established an important difference between buying behavior and family monthly revenue
and revealed the presence of a significant association between buying attitudes and

22
coupons, buy-one-get-one-free, price discounts, and free samples. Osman and Fah
concluded that findings might assist marketers in understanding the categories of sales
promotion that significantly affect buying attitudes among Malaysian students. The study
by Osman and Fah was inspiring as the purpose of this doctoral study was to achieve a
similar goal.
Shrestha (2012) examined other aspects of sales promotions. The study was
exploratory research of marketers’ observations of the sales promotion programs’
effectiveness and customers’ opinions regarding products. Shrestha evaluated customers’
perceptions of goods, and services purchased under sales promotion offers, results on
rebuying intentions of the same goods, and services after the end of the offers. The author
uncovered that customers recognize quality and price benefits. However, Shrestha found
that consumers do not distinguish benefits from the goods and services acquired under
product and price built on sales promotion offers. Shrestha documented that sales
promotion offers encourage neither rebuying intentions nor significant short-term brand
switching.
Nevertheless, Volpe and Li (2012) showed that the estimate of sale frequency is
higher while previous estimates are higher than the estimate of price rigidity. Volpe and
Li highlighted the problem of sale duration and revealed that sales often run considerably
longer than 1 or 2 weeks and could no longer appear as temporary price diminutions.
Volpe and Li proposed the reconsideration of the empirical definition of sales.
Furthermore, Yi and Yoo (2011) compared the impact of sales promotions on brand
23
attitudes through promotions types over time. Yi and Yoo used 154 subjects in an
experiment consisting of testing materials for 12 weeks. The authors found that the long-
term effects of sales promotions on brand attitudes differ across deal types. Over time,
nonmonetary promotions appear to work better in eliciting customers’ promising brand
attitudes than monetary promotions (Yi & Yoo, 2010). Nonetheless, customers’ deal
proneness moderates such effects (Yi & Yoo, 2010). Yi and Yoo documented that
although monetary promotions allow inducing more negative impacts than nonmonetary
promotions; these influences are weaker for high deal-prone customers than for low deal-
prone clients. Promotions facilitate a partial power of the distributor performance, and the
connection between performance and sales promotions relies on a set of moderating
factors (Turki & Kammoun, 2013).
Onditi (2012) assessed the impact of the promotional mix elements on sales and
indicated that the use of sales promotion could produce cost problems connected to a
shortage of finances for carrying out the promotion. Communication mix marketers
exploit modes consisting of sales promotion, communication, personal selling,
advertising, direct marketing, and public and publicity (Onditi, 2012). In addition,
Winterich and Barone (2011) found that consumers in possession of interdependent self-
construal desire promotions to a higher degree than consumers holding independent self-
construal. Moreover, Winterich and Barone evidenced that the impact decreases when
donation-based promotions do not include charity, identity consistency, or more salient
(cause-congruent identity) than self-construal at the time of decision-making.
24
Furthermore, Zebra Rizvi, Malik, and Batul Zaidi (2012) showed the presence of many
extraneous factors influencing the effectiveness of sales promotions. For instance,
Dulaney and Wiese (2011) analyzed a category of gift cards that employ the standard
auction format and confirmed that different factors influenced the proportion of the total
value got for the cards. Similarly, Felgate, Fearne, Di Falco, and Garcia Martinez (2012)
revealed that using loyalty card data produces more statistically significant results and
offers a more detailed picture of the way promotion influences sales.
Chen et al. (2012) conducted several statistical tests to identify a tendency among
consumers to neglect base values when processing proportion change information. The
emphasis was the implications of base value neglect for how customers evaluate offers
such as bonus packs and price discounts. Chen et al. unveiled significant advantages in
the sales volume for bonus packets over a corresponding price discount in field
experiment directed in a retail store. In a mall-intercept survey and many laboratory
inquiries, Chen et al. provided further evidence in support of the result and identified
useful boundary circumstances for when the impact tends to be evident. Likewise,
Melnik, Richardson, and Tompkins (2011) tested whether product features and sellers
influence the use of informational-type promotion versus display-type on eBay. Melnik et
al. (2011) assumed that less-experienced sellers exploit display-type promotion and
demonstrated that experienced sellers prefer the informational promotion because high
scores make seller-provided messages more credible.
25
Melnik et al. (2011) theorized that product features, such as product condition and
price have an impact on the promotion and established that higher prices allow driving
more funds in display-type promotions, even when a promotion is less effective. Melnik
et al. documented that the better the situation of the good, the higher utilization of the
informational promotion since this category of disclosure is particularly influential.
Melnik (2011) supported that the increasing insertion fee scheme of eBay is an incentive
for sellers to lower opening prices, which enables the growth of the bidding activity in
turn. Melnik posited that there would be no transactions without bidders and explained
that the success of online auction website relies on appeal to bidders. Melnik mentioned
that the auctioneer could make lower opening prices through an increase with respect to
the opening prices insertion fee structure. Melnik evidenced that, in turn, the increase
bidder participation raises an auction probability that results in a sale.
Liu, Cheng, and Ni (2011) supported a contradictory view, mentioning that when
customers miss an initial chance to obtain a good as a gift during the time of the
promotion those consumers are likely to reduce buying the good at a discounted price,
especially if the gift has a great regular price (Liu et al., 2011). Liu et al. (2011) explained
this behavior of shoppers by the inaction inertia. In addition, those customers are more
unlikely to purchase a good or service managers offered earlier as a gift when providing a
larger total amount of the gift during a promotional period (Liu et al., 2011). Liu et al.
concluded that anticipated valuation and regret affect the mediating function of inaction
inertia substantially.
26
In the case of motorcycle or scooter products, only the extrinsic attribute of
product quality on the basis of the apparent quality has a significant impact on the brand
loyalty in place of intrinsic attributes, which are objective quality (Shaharudin et al.,
2011). Changes in these perceptions are possible if the good or service has a high level of
consumer alertness and a good appearance from marketing events such as advertising and
the promotion of sales (Shaharudin et al., 2011). Kim (2013) revealed that a variety-
seeking environment stimulates a risk-taking mindset while an inertial environment
motivates a risk-averse mindset. According to Kim, such a difference in risk propensity
creates a delayed promotion more appealing for shoppers with a variety-seeking
tendency. Kim evidenced that preferences for a brand that presents a delayed promotion
are stronger when consumers have a variety-seeking propensity. The author explained
that these preferences of clients low in need for cognitive closure are more swayed by the
difference in variety-seeking versus inertial propensity. Kim underlined the impact of
variety-seeking versus inertial propensity on a real-world selection.
Nonetheless, Serviere-Munoz and Mallin (2013) proposed and tested a model that
illustrates the direct impacts of five neutralization methods: denials of victim, injury, and
responsibility, appeal to greater loyalties, and accusing the condemner on the
salespeople’s moral intentions. Serviere-Munoz and Mallin theorized that two
neutralizations were prevalent in swaying ethical intentions, appeal to higher loyalties
and denial of injury, and tested these associations in three sales behavioral situations,
sales organization, sales promoting, and customer relationship constructing and
27
maintenance. In addition, Laran and Tsiros (2013) argued that whereas uncertainty
consisting of not knowing which gift will be available reduces buying probability when
the decision is cognitive, uncertainty raises the buying likelihood when the decision is
affective. Laran and Tsiros provided a framework to predict buying attitudes when
uncertainty has a detrimental or beneficial effect on marketing that implicates gifts. Field
and laboratory studies served to establish that individuals like surprise and value
uncertainty in the buying process when the decision is affective (Laran & Tsiros, 2013).
The authors documented that when the decision is cognitive, customers appreciate having
information about goods and services offer.
Hui, Inman, Yanliu, and Suher (2013) investigated the impact of in-store travel
distance problems on unplanned path and directed a field experiment to assess the
efficiency of mobile promotions. Hui et al. (2013) documented that only purchasers'
paths cover less than half of the zones in a grocery store. In addition, Hui et al.
acknowledged that buyers frequently exploit physical products in the store as exterior
memory cues, and encouraging consumers to travel more can stimulate shoppers to
increase unplanned spending. Nevertheless, Hui et al. identified the endogeneity of in-
store travel distance and the difficulty of gathering in-store path data as the principal
problems managers face when estimating the direct impact of in-store travel distance on
unintended spending. Hui et al. showed that the elasticity of unplanned spending on a
travel distance is 57% higher than the uncorrected regular least squares estimate. The use
of coupons that necessitates travelling farther from the planned path results in a
28
significant increase in unplanned spending over a coupon for an unplanned type near the
planned path (Hui et al., 2013). The authors found that targeted mobile promotions aimed
at raising the in-store path length increase unplanned spending.
The framing of savings messages on sales promotions, expiration of date
restriction cues, and familiarity of brands are independent primes of regulatory focus
(Ramanathan & Dhar, 2010). Such cues, when compatible with prior regulatory focus or
one another, lead to more unrelated buying in the store (Ramanathan & Dhar, 2013).
Ramanathan and Dhar (2010) showed that sales promotions affect the sales of brands
under promotion and promoted brands and theorized managerial implications for the
sales promotions design and store positioning. Buyers add unpromoted items on shopping
baskets because of the incentive of saving or exploring money (Ramanathan & Dhar,
2013). The right marketing indications positively affect the shopping basket and sales
(Ramanathan & Dhar, 2013). For example, Bui, Krishen, and Latour (2012) revealed a
difference of gender indicating that focused promotions for kiosks are critical to
decreasing probable risk and regret perceptions, especially for females.
Leeflang and Parreño-Selva (2012) developed a framework to determine the
effect of price promotions on category revenues that comprise interdependencies among a
considerable number of types at the category demand level. Variables such as category
features (own-category effects), promotion intensity, and spatial distances among shelf
locations (cross-category effects) weaken the own-and cross-category demand impacts
(Leeflang & Parreño-Selva, 2012). The authors confirmed that approximately half of all
29
price promotions increase own-category revenues, particularly for categories with deeper
reinforced discounts and that a price promotion influences sales of at least one other
category. Leeflang and Parreño-Selva revealed the presence of cross-promotional
influence among categories more closely situated in the store.
Liu-Thompkins and Tam (2013) analyzed how to differentiate the two drivers of
repeat purchase and how these drivers affect customer response to cross-selling
promotions. The authors yielded substantial managerial insights into higher effective
cross-selling to repeat customers. Liu-Thompkins and Tam found that the attitudinal
loyalty enables cross-selling while habit has the opposite effect. In addition, Liu-
Thompkins and Tam showed that a particular promotional design works better for
habitual customers than for those with attitudinal loyalty. Liu-Thompkins and Tam
pointed out that ignoring these two principal drivers may lead to inadvertent negative
consequences on customer behavior.
Nevertheless, Nwielaghi Michael and Ogwo (2013) argued that not all firms are at
optimal points in both marketing performance and trade promotion tools. Trade
promotion strategies influence the marketing performance through trade contests and
allowances (Michael & Ogwo, 2013). Cuellar, Noland, and Kirkwood (2012) mentioned
that differences in price between nonpromoted and promoted sales as well as
heterogeneity amongst customers who purchase nonpromoted and promoted products
often confound the establishment of the promotion effect. For given optimal levels, firm
leaders should implement trade promotion strategies that underscore trade allowances and
30
trade contests (Nwielaghi Michael & Ogwo, 2013). Adaptation associates with
performance positively when intensity and duration are low and short respectively
(Hultman, Katsikeas, & Robson, 2011). Mir and Rehman (2012) found that the scope,
together with the promotion adaptation and sociocultural distance, apply a complex three-
way impact on export performance. Mir and Rehman revealed the need for more research
attention in the field and underlined that customers’ buying attitudes vary from one sales
promotion to another. These findings were stimuli to pursue the doctoral study and
determine the most effective strategy of sales promotions towards the buying attitudes of
customers in a recession.
Literature Review of Factors Influencing Buying Attitudes
Different factors affect buying behaviors, and marketers might need to apply the
appropriate sales increase strategies for the crisis. Harvard Business Essentials (2005)
explained that the best strategy starts with goals. Harvard Business Essentials showed
how a strategic choice should emerge from the process consisting of looking outside and
inside. The authors defined different types of strategies and how a firm may stay on
course in a competitive environment. The assessment of customers’ buying attitudes
towards sales promotion requires understanding these factors.
Various reasons might explain the decision to buy a product rather than another.
Rahutami and Kekalih (2011) supported this approach, providing the example of
consumers who might prefer one product rather than another because of availability,
quality, attractive design, or price. Hiraide and Chakraborty (2012) confirmed that the
31
demand for automobiles in the U.S. relates negatively to the vehicle price and gas price.
Hiraide and Chakraborty also showed that such a demand associates with nonfarm
employment and single-family housing start. Zhang and Breugelmans (2012) reinforced
the theory, showing that customers become less reactive to price discounts than to reward
point promotions when the comparison is in the matching monetary value. Customers are
no longer reactive to rival’s reward point promotions, and present cumulative reward
point impacts (Zhang & Breugelmans, 2012). Zhang and Breugelmans concluded the
need to make marketing decisions based on a price-volume agreement.
The advertising and marketing communities have traditionally understood
television advertising success (Harvey, Herbig, Keylock, Aggarwal, & Lerner, 2012).
Nevertheless, changes of packaging may impact the market share, sales, and consumer
decision to buy. For instance, Harvey et al. (2012) applied actual single-source,
household-level data to show a methodology for optimizing the mix of in-store and
television advertising. Moreover, Mishra and Jain (2012) examined the effect of
packaging in a purchase decision for a category of consumer goods and determined that
the packaging is an essential part of modern lifestyle and how managers organize
business. Packaging is a product for sales and is a significant part of the branding
process, serving in communicating the identity and image of a company (Mishra & Jain,
2012). Mishra and Jain asserted that the interest in a package as a sales promotional tool
and stimulator of impulsive purchase behavior is increasing inducing changes in business
contexts. Furthermore, Shahhosseini and Ardahaey (2011) mentioned that such changes
32
could affect a seller’s performance. In the globalization process, the development of the
cultural and art activities is important, and marketers in cultural fields should examine the
purpose cultural customers’ understanding, perception, and preferences (Shahhosseini &
Ardahaey, 2011).
Anglin and Wiebe (2013) confirmed that changes allow modifying the trade-off
between the effects of list price on buying attitudes and the influences of list price on
bargaining attitude. Shahhosseini and Ardahaey (2011) posited that considering the
significance of elements of business in interesting cultural consumers and pursuing
satisfying buyers should be the fundamental disquiet for all marketers in the cultural
business. Shahhosseini and Ardahaey studied marketing mix and factors such as price,
product, place, and promotion in the cultural industry and explained that marketing
models may indeed define suitable strategies in cultural fields to provide the products in
the most recipient way for companies.
Nonetheless, Kwanho, Jiheon, and Lichtenstein (2012) established that customers
commonly believe that quality and price are in positive correlation and that price-quality
perceptions affect price willingness and evaluations. Kwanho et al. (2012) showed that
customers tend to decide on higher-price options when differing brand options are in
downward price order, and when differing brand options are in arising price order, buyers
tend to choose lower-priced options. The authors documented that consumers' price-
quality perceptions are an indispensable condition for such a result. Additionally,
Mcshane, Bradlow, and Berger (2012) revealed that for cars of the same price levels,
33
visual effects exist and vary from one zone to another. These effects are subject to
saturation and depend on the consumer gender (Mcshane et al., 2012).
The product information theory and market power model could generate divergent
results, and advertising is likely to affect resale price maintenance over the market power
effect and the product information impact (Wu & Chen, 2012). Advertising discourages
manufacturers from forcing resale price maintenance when the market power is
dominant, and the opposing is true in case the product information effect is prevailing
(Wu & Chen, 2012). Wu and Chen (2012) showed that the way advertising influences the
relation between demand quantities and prices is necessary to evaluate how advertising
engenders the approval of resale price. In addition, Wu and Chen evidenced the need for
managers to coordinate resale price maintenance and advertising strategies based on real
options theories.
Although Rajput, Kalhoro, and Wasif (2012) did not reject the concept, the
authors focused on the impact of the product price and quality of the consumer buying
behavior. Rajput et al. (2012) found the presence of significant positive relationship
between product price and buying behavior. A negative relationship exists between
buying attitudes and product quality (Rajput et al., 2012). Exploiting the cultural theory
of buying behavior, Rajput et al. gathered data from a convenience sampling of 100
participants involved in the buying process in Pakistan to show these associations.
Likewise, Ray, Wood, and Messinger (2012) highlighted the relative extent of price
reductions for the product systems and components assuming that these price reductions
34
fluctuate across different types of systems systematically. Ray et al. (2012) argued that
the result depends on the price rigidity as firms would not see any effect of demand for
small reductions. Ray et al. clarified the theory of rational inattention and asserted the
patterns of plunging rigidity in online price of cameras and computers that are consistent
with this theory. Ignoring small price changes under definite conditions is rational for
consumers, and this inattention differs systematically across different categories of
multicomponent classifications, leading to particular postulates about vendors' pricing
behavior (Ray et al., 2012).
Bruno, Hai, and Dutta (2012) confirmed the association between price and
transaction, arguing that consumer experience with the salesperson could intensify the
loss aversion affect. The authors revealed the presence of the reference price effects on
the transaction pricing outcome and buying level in the business-to-business market
transactions. Business consumers react asymmetrically to price decreases and price
increases, and salespeople hold reference prices that affect the transaction price (Bruno et
al., 2012). Bruno et al. (2012) addressed the role of the reference price in a situation when
managers set both the quantity and price through personal interaction during the process
of transaction. Che Ahmat et al. (2011) reinforced this theory, providing the example of a
hotel. According to Che Ahmat et al., the experience clients gain when staying in a hotel
affects response behaviors positively while the experience clients acquire pertaining to
room rates impacts the response behaviors negatively. Che Ahmat et al. tested four
factors, price information, treatment experience, price expectation, and price experience

35
and found that client judgments and perceptions of price unfairness lead to a negative
emotional response such as self-protection, revenge, and no action.
Broadcasts direct-to- consumer advertising (DTCA) influence sales and price
positively while nonbroadcasts DTCA have a relatively smaller power (Dave & Saffer,
2012). Frischmann and Gensler (2011) highlighted the relevance of mediating effects of
consumer behavioral metrics on the relationship between purchaser perceptual metrics
and purchaser profitability. Lack of direct experiential information is in part why only a
small percentage of apparel sales occur online (Merle, Senecal, & St-Onge, 2012).
Nevertheless, Anderson, Fong, Simester, and Tucker (2010) found that the current U.S.
sales taxes laws have a significant effect on both consumer and firm performance.
Anderson et al. (2010) analyzed buying attitudes among buyers who live far from the
store but need now to pay sales taxes on the internet and catalog purchases and clarified
that catalog sales are genuine while internet sales decrease significantly. The study was
an exploration of how opening a store affects catalog and internet market. Based on the
results from the investigation, Anderson et al. explained that when a multichannel retailer
opens the first retail store in the state, managers must gather sales taxes on all catalog and
internet orders shipped to that state. In addition, Anderson et al. showed that the
difference in the results is partly attributable to the ease with which consumers could
search for lower prices at rival retailers. Retailers who earn a high proportion of income
from direct channels avoid opening a first retail store in high-tax states (Anderson et al.,
2010).
36
Ghani and Kamal (2010) demonstrated that the impulse buying is gaining
significant rank in the minds of marketers. According to Ghani and Kamal, implications
for placed display material, robust shelf lay-out, and further off-shelf presentation include
operational merchandising and result in the impulse buying of goods in the store. Ghani
and Kamal found that females did more impulse purchase on the shelves while males are
on the counter. However, exhibition of the goods on the counter and shelves is a major
factor that affects the impulse behavior. Khan and Dost (2011) reinforced that dynamics
of impulsive buying behavior and sales promotion have an insignificant positive
correlation. Nevertheless, there is no significant relationship between customers’ buying
decisions and advertisements kids endorse; such commercials affect the married and
unmarried more or less equally (Malik & Guptha, 2013).
Činjarević, Tatić, and Petrić (2011) examined the fashion consciousness on
customers' impulse buying behavior. In addition, Činjarević et al. (2011) analyzed the
effect of six broad types of hedonic shopping motivations, adventure, role, gratification,
value, social, and idea shopping. The authors used an online survey to gather data from
224 participants. Činjarević et al. exploited a nonprobability convenience sampling
method and e-mailed a survey to a sample of individuals in Bosnia and Herzegovina. The
researchers designed a survey instrument using scales already validated in prior research
to establish that social shopping, role shopping, and fashion awareness do not have an
association with impulse buying attitudes. However, Činjarević et al. found that
impulsive buying attitudes relate to gratification, adventure, value, and idea shopping
37
motivations. Činjarević et al. argued that a focus on adventure, excitement, entertainment,
and sales might be an effective retailing strategy to motivate impulse buying attitudes. As
the objective of the research was to determine the most effective design that aligns sales
promotion strategies with buying approach of customers, this suggestion was a stimulus
to conduct the doctoral study.
Literature Review of Factors Affecting Sales
Several factors might affect sales. Evans, McFarland, Dietz, and Jaramillo (2012)
identified underresearched topic areas that offer promising opportunities for future
investigators in search of an advanced understanding of marketers of the sales
performance field. This literature review encompassed a part of these topic areas:
information technology, price, loyalty, and other factors affecting sales.
Effect of information technology on sales. The internet might have an impact on
sales of a product. Pathak, Garfinkel, Gopal, Venkatesan, and Yin (2010) supported that
information technologies (IT) and the strength of recommendations have a positive
impact on sales. Pathak et al. (2010) established that online retailers are increasingly
exploiting IT to provide value-added services to consumers. The authors mentioned that
noticeable examples of these services are customer feedback mechanisms and online
recommender systems, both of which serve to reduce customer search costs and the
uncertainty associated with the buying of unfamiliar products. Pathak et al. found that
recommender systems help strengthen the long-tail electronic commerce phenomenon,
and obscure suggestions affect cross-selling positively. Pathak et al. showed the presence
38
of a positive effect of suggestions on prices and indicated that there is the opportunity for
traders to adjust prices and have a greater impact on sales than does customer feedback.
Implications for companies include the possibility to allow sales development and offer
added flexibility to retailers (Pathak et al., 2010).
Engelen (2011) confirmed that IT is vital in sales development. Furthermore,
Mithas, Tafti, Bardhan, and Goh (2011) theorized that IT investment contributes to the
improvement of sales and profitability of corporations. The impact of IT investments on
profitability and sales is higher than that of other optional investments, such as research
and development and advertising (Mithas et al., 2011). The technology in sales
environment that leads to the documentation of social media is a prevailing new selling
tool (Marshall, Moncrief, Rudd, & Lee, 2012). When managers auction a homogeneous
good, the price obtained is not consistent in a perfectly competitive market (Dulaney &
Wiese, 2011). Moreover, Lin, Cheng, Wang, and Chang (2012) emphasized that a higher
fee of perceived transaction engenders a higher switching intention.
Cui, Lui, and Guo (2012) averred that the volume of reviews has a significant
impact on sales of a new product in the early time and that such influence drops over
time. The authors used data encompassing 332 new products over 9 months from
Amazon.com to confirm the tendency. As result, Cui et al. (2012) indicated that
marketers should consider the distinctive effect of various online reviews aspects when
devising e-marketing strategies and launching new products. Social discussion via
electronic word of mouth (e-WOM) becomes a significant market driver and a shared
39
signal of reputation with the minimal role of price in the buying decision (Amblee & Bui,
2011). Amblee and Bui (2011) measured the effect of reputation signals e-WOM
engenders and investigated the whole business of Amazon Shorts e-books, digital micro
products sold at a low and uniform price. The authors acknowledged the need for both e-
tailers and shoppers to consider e-WOM technology as the first and possibly primary
source of social buying experience.
Impact of price on sales. A literature review of the price impact on sales was a
need in the analysis of buying attitudes of customers towards sales promotions. Price
influences risk intentions, and the perception to consume the good or service is a key
factor in purchasers’ decision-making (Samper & Schwartz, 2013). Reduced prices signal
higher accessibility to anyone in need of a product and increase consumption of this good
or service, and the opposite is true for higher prices (Samper & Schwartz, 2013). Alrjoub
et al. (2012) reinforced the theory and demonstrated that the price reduction increases
sales and profitability. In addition, Alexy, Criscuolo, and Salter (2012) confirmed that a
tool of low-prices increases sales. Ferrer and Mallari (2011) posited that reductions in
price create value for investors, establishing a positive impact of the product price
reductions on sales and investors revenue. In the 21st century, cost will not be the only
key factor, but also value and revenue in successful companies (Kumar & Kumar, 2011).
Nevertheless, Milić (2011) examined the strategies companies frequently implemented
between 2008 and 2010 all over the world and revealed that results were poorer than

40
firms’ expectations. Eggert and Serdaroglu (2011) argued that managers should build the
sales technology to develop customer relationship rather than cut costs.
Lin, Cheng, et al. (2012) remarked that a higher perceived transaction fee
engenders a higher switching intention. An association exists between higher cross-price
effects among personal computer brands and a higher casual of follower price rivalry
(Roy & Raju, 2011). Nevertheless, beyond the price reduction, the entry of new generic
rivals is useful for dropping the real transaction price of purchases (Puig-Junoy, 2010).
Lin, Ke, and Whinston (2012) underlined that a higher advertising return rate leads to
lower service prices. The optimal policy for a monopolist is both advertising-supported
and advertising-free services as advertising returns compensate for the cannibalistic effect
of vertical differentiation (Lin, Ke, et al., 2012). Lin, Ke, et al. (2012) clarified that the
price reductions are more simple in the cost-per-thousand-impressions model than in the
cost-per-click model consistently across both duopoly and monopoly settings.
Jazayeri and Jazayeri (2011) examined the dynamic behavior and impact of price
elasticity on the overall profit and uncovered that the dynamic behavior of price elasticity
can affect the overall profit of the corporation. Enduring actions such as regular price
changes and assortment have a higher elasticity for products such as organics than for
conventional goods (Bezawada & Pauwels, 2013). Bezawada and Pauwels (2013)
underlined that higher assortment and lower prices contrasted with more and deeper
promotions are the most effective strategies. The long-term own and cross-price elasticity
increase during contractions and the short-term price elasticity becomes stronger
41
significantly throughout the observation period (Van Heerde, Gusenberg, Dekimpe, &
Steenkamp, 2013). The price transmission elasticity is higher or lower when inventories
are below or above the target level (Abbassi, Tamini, & Gervais, 2012).
Fazlzadeh, Mohammadi, and Sepehrfar (2011) explained that the policies
consisting of inelastic one price fits everything are unsuitable in several conditions of
business to business market. The authors evaluated the effect of price delegation on
organization performance and uncovered that the degree of price delegation impacts
customer heterogeneity positively and influences risk-aversion of salespeople negatively.
Information asymmetry has no association with price delegation (Fazlzadeh et al., 2011).
Fazlzadeh et al. (2011) documented a positive price delegation impact on corporation
performance, which intensifies when salespeople hold better customer-related
information than managers do and when market-related uncertainty is high. Consumer
value of a status product influences the proportion of desirable type among owners
positively and proportion of the preferable type among nonowners negatively (Kuksov &
Ying, 2012). Shapiro and Drayer (2012) also examined the secondary market prices and
dynamic ticket pricing in major league baseball and found that time had a significant
impact on ticket price. A positive association is reliable with managers employing
operational discretion to get benefits that allow better performance or to signal future
company value (Gunny, 2010).
Homburg, Jensen, and Hahn (2012) theorized a framework of how managers
organize pricing authority within the sales function and across the marketing, sales, and
42
finance functions. The authors revealed that a positive interaction exists between
horizontal dispersion and vertical delegation, indicating that corporations need to design
horizontal dispersion and vertical delegation jointly. Homburg et al. (2012) highlighted
margin-based motivations as a mediator of vertical delegation of the pricing authority-
profitability relationship and price-related market dynamism as a mediator of the
horizontal dispersion of the pricing authority-profitability connection. Obadia (2013)
examined the efficacy of price manipulations by exporters in a circumstance of
information asymmetry and found that, in general, such price manipulations have no
impact on sales performance. Export price manipulations weaken performance once
information asymmetry is high (Obadia, 2013). Brown (2011) found the presence of a
significant relationship between rates of change in sales and rates of change in stock
prices.
Chou, Sim, Teo, and Zheng (2012) contributed to the debate by constructing a
model allowing making marketing decisions based on a price-volume agreement. Niu,
Zhao, Castillo, and Joro (2012) examined joint pricing and inventory and production
matters under three scenarios considering decision issues for members in a domination
two-stage dual-channel trader supply chains. The authors assumed that managers of retail
companies have adopted a multi-channel approach that comprises both pre-existing
offline channels and web-based channels. Niu et al. (2012) indicated that pricing in one
channel influences the business in the other channel for a dual-channel retailer. Niu et al.
revealed that subsequently, such pricing impacts the retailer's replacement decisions,
43
which affect the producer’s plan decisions, inventory price, and manufacture wholesale
price. Niu et al. concluded that inventory, production, and pricing decisions interrelate in
each participant of the supply chain and among the participants in the chain.
Kuksov and Ying (2012) confirmed the presence of a positive impact of price
reduction of a product on the market for alternate products. Niu et al. (2012) supported
the existence of a unique equilibrium under definite, realistic conditions. Song (2011)
elucidated that the price reductions in rival retailers tend to reduce prices in the retailer.
The threshold incentives enhance channel profits in the balance when the retailer
practices first-level price discrimination (Caliskan Demirag, 2011). Caliskan Demirag
(2011) theorized that incentives lead to suboptimal channel effectiveness when the
retailer applies uniform pricing. The manufacturer should support the retailer only after
crossing a subsidy threshold and provide more support when the retailer has one
competing retailer (He, Krishnamoorthy, Prasad, & Sethi, 2012). However, support starts
declining with the presence of further retailers (He et al., 2012).
Impact of loyalty on sales. A brief review of the existing body of research on
loyalty was necessary as the loyalty might have an impact on sales. The consumer’s
perspective of the impact of relationship marketing orientation on consumer loyalty is
important in business, and growing consumer loyalty is a significant challenge marketers
face (Alrubaiee & Nahla, 2010). Cultivating loyal consumers is the single key driver of
firms' long-term financial performance, which may lead to improved sales and consumer
share, lower costs, and upper (Alrubaiee & Nahla, 2010). Corporation or brand name,

44
price, guarantee, and after sales service are the key factors in the buying of durables
(Vyas, 2011). Source of information about authorized dealers and shops, technical expert
advice through mass media, and impact of neighbors, relatives, and friends are important
factors persuading in the purchase of durables (Vyas, 2011). Manning and Sydow (2011)
indicated that the project entrepreneurs create collaborative paths by forming core teams
with particular consumers and services suppliers.
Lei, Dawar, and Gürhan-Canli (2012) theorized that users who discount a first
crisis are prone to discount a second one for the same brand, and users who subtype a
first crisis are improbable to subtype again. For brands with positive earlier beliefs, a high
base level of product-harm crises leads to less responsibility if the crisis is analogous to
others in the industry (Lei et al., 2012). In the absence of similar information, low base
rate of crises creates less responsibility toward the brand (Lei et al., 2012). Draganska
and Klapper (2011) found that consumers are not mindful of all available brands at
buying time and arguing that advertising influences market shares by two processes, the
direct effect on brand mindfulness and impact on the buyer’s preferences. In the case of
ignorance of purchaser heterogeneity, in select sets, both the estimated brand and price
coefficient are unfair plunging (Draganska & Klapper, 2011). Draganska and Klapper
posited that such biased estimates could lead companies to make costly price-setting
errors.
Other factors affecting sales. Many other factors might affect sales, and
salespeople need to consider these aspects to be successful when implementing a sales
45
promotion strategy. Erevelles and Fukawa (2013) strengthened this insight, mentioning
that salespeople and sales managers should be up-to-date on the rapid progresses in the
understanding of emotional manners in psychology and consumer behavior and apply
these progresses in sales contexts. According to Erevelles and Fukawa, sales technology
impacts the performance of salespersons when serving as a customer relationship tool in
the pharmaceutical industry. Factors that trigger voluntary usage drive the customer
relationship dimension and factors imposed from outside explain the internal
coordination dimension (Eggert & Serdaroglu, 2011). A stigmatized type association
does not create disapproval for companies automatically (Vergne, 2011). Erevelles and
Fukawa posited that the future of the personal selling and sales management depends
gradually on understanding the affective manners to reach a competitive advantage,
highlighting the increasingly competitive aspects of markets.
Jasmand et al. (2012) identified cross-and up-selling in inbound call centers as an
emergent business practice, with the promise of customer retention and improved revenue
creation. A customer service representatives’ (CSR's) locomotion orientation assists the
ambidextrous behavior and interrelates positively with a valuation orientation (Jasmand
et al., 2012). Jasmand et al. found that managers struggle to create conducive conditions
to CSRs' concurrent engagement in sales and service although team identification and
bounded discretion weaken the valuable interplay. Jasmand et al. theorized that the
ambidextrous behavior improves sales performance and customer satisfaction while
decreasing efficiency. Baumgarten, Bonenkamp, and Homburg (2010) found a strong and
46
positive correlation between sales and selling, general, and administrative (SG&A) cost.
The value of best sellers and that of low ones might be respectively overestimate and
underestimate (Oestreicher-Singer, Libai, Sivan, Carmi, & Yassin, 2013). However, the
value of goods grows with an increasing number of people using these goods and services
(Lickus, 2012). Cognitive dissonance after buying affects purchasers’ goods return
intentions positively (Nadeem, 2012). Marketers should manage the development time
that reduces progress costs and adept market-entry timing, which capitalizes on new
goods and services sales (Langerak, Griffin, & Hultink, 2010).
Evans et al. (2012) identified strategies such as sales promotions as significant
factors of sales performance in the marketplace. Nevertheless, Hui, Wong, and Wong
(2012) evidenced that the effectiveness in optimizing retailers’ returns and time-on-
market depends on the availability of other options such as economic contexts. Hence, a
literature review of the financial crisis impact on sales was necessary to inform this
inquiry.
Literature Review of the Financial Crisis Impact on Sales
The financial crisis that occurred in 2008 might have influenced sales over the
world. Understanding the impact of the crisis on sales was a need for this research. A
literature review of the financial crisis impact on sales included the magnitude of the
financial crisis and effect the crisis has had on sales.
Magnitude of the recent financial crisis. Sales issues that were the focus in this
research might be the consequences of the 2008 financial crisis. The behavior of
47
customers towards sales promotions in this recession might depend on the magnitude of
the recent financial crisis. Hsu (2012) demonstrated that the 2008 crisis generated from
the housing market in the U.S. and spread rapidly into the financial market. The 2008
global financial crisis had a ripple effect throughout the world, affected outcomes of
almost every industry, and was the worst category since the Great Depression in 1929
(Hsu, 2012). Apetroaie et al. (2012) confirmed this insight, showing that the crisis
covered much of both the developing and developed worlds and was equally devastating.
The magnitude of the financial crisis was at a point that strong financial
institution tools have failed to measure factors of sales (Stanton & Wallace, 2011).
Mitran and Bebeselea (2012) argued that the crisis was a global economic, financial crisis
that had reached unimaginable points, and theoretical and practical approaches had
become obsolete to take on the role of a universal remedy. Ben-David, Franzoni, and
Moussawi (2012) reinforced the magnitude evidence of the financial crisis by presenting
the hedge funds’ trading performance in 2007-2009. Ben-David et al. (2012) established
that capital withdrawals on the part of pressure by lenders and investors hedge fund
selloffs in the crisis drove overpoweringly, a situation associated with the principles of
limits-of-arbitrage. Ben-David et al. mentioned that hedge funds vended about 29% of the
aggregate portfolio, reducing the equity holding significantly during the crisis. In
response to poor returns, stakeholders withdrew capital three times as intensely as mutual
stakeholders did (Ben-David et al., 2012).
48
Dzikowska and Jankowska (2012) supported the trend and magnitude of the
crisis. The authors evidenced that corporations operating in financial, motor vehicles,
airlines, and shares industries dominated the organizations whose business performance
worsened the most in the crisis. This economic crisis has engendered a domino effect by
the magnitude, and crisis marketing models should anticipate this effect and provide
efficient solutions to overwhelm the crisis (Mitran & Bebeselea, 2012). This brief
evaluation of the magnitude of the financial crisis was a support for the doctoral study as
the review enabled the assessment of the crisis impact on sales.
Impact of the financial crisis on sales. The literature review of this impact was
essential in understanding customers’ buying attitudes towards sales promotions. Hiraide
and Chakraborty (2012) examined the impact of the economic crisis on the U.S. auto
industry in general and demand of Ford vehicles in particular. The authors documented
that the auto industry in the U.S. faced the most severe troubles, which threatened the
survival of the industry. Shapiro, DeSchriver, and Rascher (2012) supported that, despite
the presence of a variety of factors impacting the luxury suites pricing, the recession has
influenced the premium seat sales business. Levchenko et al. (2010) reinforced that
relative to the economic activity, the decline in trade was higher than what occurred in
the previous postwar recessions in order of magnitude. Levchenko et al. emphasized that
the severest percentage declines in trade have been in automobiles, capital goods, and
durable industrial supplies. Three factors have affected retail sales, lack of the available
credit, increasing of the saving rate associated with decreasing of consumption
49
expenditures, and dropping of consumer sentiment and confidence (Levchenko et al.,
2010). Agafonov (2011) and Hiraide and Chakraborty (2012) supported that the financial
crisis engendered a global recession that has affected the economic world severely and
had a significant negative impact on sales.
Suresh (2012) strengthened the tendency of change in buying attitudes by giving
the example of the gold market. Gold is an important component in international
transactions (Suresh, 2012). Most of the central banks in advanced and emerging market
economies either had purchased fresh gold stock or stopped vending existing stock
(Suresh, 2012). Alessandria et al. (2010) confirmed that the international trade dropped
drastically, and a large adjustment of inventory followed. The decline was evident for the
automobile industry, sector in which Alessandria et al. observed the largest drop of sales.
Monahan et al. (2011) analyzed the recent trade collapse, which symbolized a
puzzle and found small corporations as a solution for this enigma. Companies leaders
should balance growth goals and social marketing thinking (Kotler, 2011). Managers
need to pursue sustainability and consequently, revise policies on product development,
pricing, delivery, and branding (Kotler, 2011). Mitran and Bebeselea (2012) showed the
need to impose the respect of strict discipline in the entire marketing activity. In addition,
Mitran and Bebeselea recommended fresh information about marketing development
from sales potency in time as a critical condition for sales performance. This idea
appeared as stimulation for the doctoral study since the aim of the survey was to provide
50
fresh marketing information managers might use for sales increases. The following
summary included the essential aspects of the theory for improved business practice.
Summary of Literature Review
The literature review allowed the perception of a substantial body of research
related to the sales promotion, factors that affect buying behavior and sales, and the 2008
financial crisis impact on the sales issues. This review facilitated the identification of
various sales promotion strategies and insight of the relationship between the recent
financial downturn and the recession. A literature review was a support for the theoretical
framework in that the analysis reinforced the concepts that grounded and complemented
this quantitative comparative design. The review included the idea that coupons, buy-
one-get-one-free, and price discounts were sales promotions, which might affect buying
behavior of customers, enable sales increases even in the time of a sales downturn. Ferrer
and Mallari (2011) supported that reductions of product prices have a positive impact on
sales and investors revenue, and firms earn per share when reducing prices.
However, a gap in research appeared through the literature review as there was no
evidence of sales promotion strategies towards customers’ buying attitudes. The way to
acquire or maintain a leadership position in a competitive environment by aligning
strategy to goals, implementation, and action plans was necessary for an organization to
survive and sustain profitability (Harvard Business Essentials, 2005). Managers admitted
the need for quantitative measures of marketing performance and faced the challenge of
determining and interpreting metrics and standards (Frischmann & Gensler, 2011). Chen
51
et al. (2012) argued that understanding the implications of how customers evaluate offers
such as sales promotions is indispensable for businesses. Hence, there was substantiation
of a potential research opportunity. The insight of the sales promotions that affect
significantly customers’ buying attitudes among coupons, buy-one-get-one-free, and
price discounts was of the critical need for corporations in this recession.
Transition and Summary
The intent of this research was to evaluate customers’ buying attitudes towards
three sales promotional tools in a recession. Section 1 included the contextual problems
of the analysis. The sales promotions under investigation were coupons, buy-one-get-one-
free, and price discounts. The main topics of the literature review were sales promotion,
factors influencing buying attitudes, factors affecting sales, and impact of the recent
financial crisis on sales. A review of the body of sales research allowed perceiving the
need to determine the most effective strategy of sales promotions towards buying
attitudes in a recession. The intent of the inquiry was to address this gap using a
quantitative comparative design. Implications comprised the potential to improve
business practice and enable positive social change. Section 2 included aspects regarding
the purpose, role of the researcher, participants, population and sampling design, ethical
research, data collection and analysis techniques, reliability, and validity of the research.
The outcomes and conclusions of the study were the focus in section 3.
52
Section 2: The Project
Section 2 includes further descriptions and discussions of the research. Aligning
sales promotions with buying attitudes of customers in a recession was the purpose of this
business project. Section 1 of the study allowed the insight that there was no evidence of
sales promotion strategies towards customers’ buying attitudes in a recession. Section 2
contains additional information on how the study led to addressing this gap identified in
the body of sales literature.
Purpose Statement
The purpose of this quantitative study using a comparative design was to
determine the most effective strategy for aligning sales promotions with buying attitudes
in a recession. The independent variables were types of sales promotion and customers’
gender. The dependent variable was buying attitudes of customers. Data from customers
of retail stores in a city in the southern U.S. region allowed extending the body of the
literature of sales promotions in a recession. Retail stores in the city have experienced
sales issues (Levchenko et al., 2010). Consumers involved in the buying process in retail
stores were the specific population group of the study. Apetroaie et al. (2012) revealed
that the increase of sales should generate from customers, not from companies. Assessing
differences in buying attitudes among groups of customers based on the gender and type
of sales promotion had implications for effective business practice and positive social
change. Inferences for effective business strategies encompassed the potential to identify
the sales strategy that enables a substantial increase of sales and sustainability of firms.
53
Implications for positive social change included the prospective to promote the
employment and improvement of lifestyle of individuals. Managers should increase sales
and create value by offering products at reduced prices in this recession (Kotler, 2011).
Role of the Researcher
In this quantitative comparative design, my role as a researcher was identifying
the most effective strategy of sales promotions towards buying attitudes in a recession.
Such a strategy was a need for business leaders in this crisis (Mitran & Bebeselea, 2012).
A function consisted of exploiting data collected from consumers in a southern U.S. city,
using a confidential paper-based survey implement. My role included gathering,
organizing, analyzing, and interpreting data. This process allowed assessing objective
theories by investigating differences between groups or connections among variables
(Anyiwe, 2012). The data set contained demographic, sales promotions, and buying
attitudes data from consumers involved in the buying process in the city. In addition, my
function consisted of organizing the data, computing statistics tests, describing the data
tendency, and summarizing the relevant characteristics of the data sets.
The version 21.0 of statistical package for social science (SPSS) served to
perform complex computations necessary for the analytical testing. Skarzauskiene,
(2010) supported that the SPSS is a validated measurement tool for association testing of
variables when scrutinizing data. The role of explanation comprised providing
information related to the need to use a number of statistical tests as well as how analyses
fit with the study and interpreting results from the statistical scrutiny. The role
54
encompassed analyzing whether results reject predictions based on the null hypotheses or
not. Furthermore, I standardized the data, determined the implications of the data to
generate inferences about the entire population and other regions, summarized the results
of the study, and addressed recommendations for future research.
Participants
The process for data collection was a random sampling method. Fowler (2002)
posited that a random sampling method ensures representative samples where every
member in the group holds an equal probability of being a component of the sample. I
gathered data from consumers involved in the buying process, in a southern U.S. city,
using a confidential paper-based survey. A random starting point within a list of retail
stores in the city helped select every fifth store from this list. Four retail stores
represented the data collection sites for different days of data gathering until I obtained
the required number of respondents. Participants received information on the purpose of
the study and accepted to participate by signing an informed consent (Appendix C). A
respondent could stop answering the survey questions anytime during the survey
completion process as participation in the study was voluntary. I provided volunteer
participants with (a) the Walden informed consent form, (b) demographic questions, and
(c) sales promotions and buying attitudes survey after receiving permission from stores’
management to do so. The strategy for gaining access to participants consisted of
approaching every fifth customer who was about to enter the main entrance of retail

55
stores. Osman and Fah (2011) found the process consisting of approaching every fifth
participant in front of the main entrance of stores appropriate for the investigation.
A random representative sample assisted researchers in drawing conclusions
concerning the population (Spiegel, Schiller, & Srinivasan, 2012). I used a two-way
analysis of variance (ANOVA) test for assessing an overall difference of means. As a
significant difference existed among means, Bonferroni multiple comparison procedures
allowed examining the nature of the differences among the means. The design for the
analysis was a 4 X 2 ANOVA as the factors type of sales promotion and gender of
customers were at four and two levels respectively. An a priori power test analysis
enables researchers to calculate the sample size that is appropriate for a comparative
study (Kadam & Bhalerao, 2010). An a priori power analysis for the ANOVA model
using a power level of .80, alpha level of .05, effect size of .25 (medium), numerator df of
3, and 8 as the number of groups generated a sample size of 179 respondents for the
survey (Faul, Erdfelder, Lang, & Buchner, 2007). However, I used a minimum of 287
respondents to yield a power of .95 (Faul et al., 2007). Streiner (2003) supported that
larger sample sizes allow detecting smaller differences among groups.
Institutional Review Board (IRB) approval is a federal regulation that allows
keeping populations from being at risk (Crocker, 2012). The conduct and protection of
participants observed the guidelines of the IRB. Being in the study did not pose a risk to
participants’ safety or wellbeing. The study included the protection of survey respondents
by confidentiality of identity, location, and privacy rights of individuals. I saved the
56
research data and related documents in an electronic folder, and access will be only via
security enabled email and password. All raw data will be in a locked container for 5
years after completion of the study. A summary of findings will be available, and I will
provide participants and anyone interested in having the results from the research with
this summary upon request during the data collection or later via e-mail. The
managements of cooperating stores will receive a summary of findings from this study. I
will shred physical documents and erase electronic files 5 years after completion of the
doctoral study.
Research Method and Design
The intent of this study was to determine the most effective strategy of sales
promotions towards buying attitudes in a recession. The sales promotions under
investigation were coupons, buy-one-get-one-free, and price discounts. There are several
approaches for research. The present subsection consisted of examining the research
method and design that were appropriate for the study.
Method
The research method for the doctoral study was a quantitative. Questions contain
how much or derivatives are likely to favor survey methods, which are advantageous in
case the objective for the inquiry is to predict definite results (Yin, 2014). The intent of
this research question was to determine the most effective strategy for aligning sales
promotions with buying attitudes in a recession. Therefore, survey research was relevant
for the research question. The research was an inquiry using numeric values to form
57
statistical analysis, and two-way ANOVA and multiple comparison procedures were the
statistical techniques for the data analysis.
The insight of differences in buying attitudes among groups of customers based
on the gender and type of sales promotion was essential to answer to the research
question. The independent variables were the type of sales promotion and gender of
customers. The dependent variable was buying attitudes of customers. A quantitative
research method was necessary for the study because this methodology facilitates the
examination of the differences among key variables in a population (Williams, 2011). As
key variables were definite in the study, a qualitative approach was not convenient
(Shuval et al., 2011; Słysz & Soroko, 2012). Thus, the mixed methods approach, which
combines both qualitative and quantitative methods (Anyiwe, 2012) was not relevant for
the study. Any inquiry other than the quantitative method was not suitable for the
analysis of the issue and question under study.
Research Design
The research design for this quantitative study was comparative. A quantitative
method was necessary to form statistical analysis, a scientifically based research that
employs numeric values (Gelo, Brankman, & Benetka, 2008). Comparative research
design relates to the research questions and problem statement (Crocker, 2012). The
research question consisted of determining the most effective strategy for aligning sales
promotions with buying attitudes in a recession. A quantitative comparative design was
relevant for this research question because examining the extent to which variables affect
58
buying attitudes was the purpose of this doctoral study. A quantitative comparative
design allows analysis to determine how single or combinations of variables influence
patterns of attitudes, trends, and opinions of a population by analyzing a sample of the
population (Gelo et al., 2008).
Sales promotion type and gender of customers were the independent variables,
and the dependent variable in the analysis was buying attitudes of customers. Regarding
the impossibility to randomly assign shoppers to control and treatment groups, a quasi-
experimental design was appropriate (May, Joshi, & Nair, 2012). An experimental design
was not feasible as there was no necessity to assign individuals to treatment groups
randomly and test whether a particular treatment affects an outcome (May et al., 2012).
Instead, a comparative design was appropriate because the research was about analyzing
mean differences (Bertilsson, Högberg, & Hanson, 2012). Davis (2010) supported that
each element of a design interacts with every other piece of the design system. A
quantitative comparative design was the relevant research design for this doctoral study.
Population and Sampling
The target population for this quantitative comparative design consisted of
customers involved in the buying process, in a southern U.S. city. The eligibility criteria
for choosing the population sample were that participants be consumers involved in the
buying process in the city and 18 years of age or older. Four retail stores selected
randomly from a list of retail stores in the city were the data collection sites. I chose
every fifth store from this list until I obtained a total of four stores. I accessed the
59
participants implementing the strategy consisting of approaching every fifth customer
who was about to enter the main entrance of stores. Therefore, the sampling units were 5,
10, 15, 20, and so on until I obtained a total of 287 participants. Osman and Fah (2011)
found this process appropriate for the investigation.
Fowler (2002) found that sampling technique researchers may use include random
sampling and systematic sampling methods. Random sampling was the method for this
doctoral study. Fowler supported that a random sampling method ensures representative
samples where every member in the group holds an equal probability of being a
component of the sample. Randomization is more desirable than nonprobability or
convenience sampling and allows the researcher to generalize findings to the study
population (Spiegel et al., 2012). Spiegel et al. (2012) posited that a representative
sample assists the researcher in drawing conclusions concerning the population of
interest. Spiegel et al. emphasized that a random sampling method can represent the
population. Green and Salkind (2010) supported that a random sample of the population
allows meeting the underlying random sample assumptions necessary for the ANOVA
and multiple comparison data analysis. The sample was a genuine customer sample.
Lowe and Barnes (2012) found genuine customer sample rare while those such as student
samples serve in research frequently. The authors underlined that interpretation of
findings on the basis of student’s data requires caution and replication with actual
customers while genuine customer samples enhance the generalizability of findings.
60
The sample size for this inquiry was 287 volunteer respondents to yield a power
of .95 (Faul et al., 2007). Streiner (2003) confirmed that a researcher might detect smaller
differences among groups when using larger sample sizes. A power analysis using a
power level of .80, alpha level of .05, effect size of .25 (medium), numerator df of 3, and
8 as the number of groups generated a sample size of 179 respondents for the survey
(Faul et al., 2007). Kadam and Bhalerao (2010) concluded that there is a set for the alpha
value of committing a Type I error at 0.05 and 20% the probability of committing a
Category II error or 80% the power of the test value for social science research. The
authors showed that a small effect size necessitates a large sample size, and a large effect
size allows for a small sample size. In addition, Kadam and Bhalerao established that an a
priori power test analysis allows the evaluation of proper sample size for an examination.
I approached random customers in front of retail stores located in the city expecting 287
responses from a cross-section of the customer body’s different socioeconomic
demographic. Data gathering took place following Walden’s IRB approval.
Ethical Research
I complied with all regulations of both the IRB and Walden University relevant to
rights of participants. IRB is a federal regulation institution that allows keeping
populations from being at risk (Crocker, 2012). The IRB approval number for this
research was 10-07-14-0361937. I approached customers who were 18 years of age or
older in front of retail stores after receiving permission from the management of stores to
61
do so. The survey was confidential. Being in the study did not pose a risk to participants’
safety or wellbeing.
Volunteer participants received information on the purpose of the study and
agreed to participate through an informed consent (Appendix C). The
informed consent form included diverse information such as ways to maintain
the privacy, confidentiality, and right of respondents.
Participants (a) agreed to all provisions in the consent form before answering the
survey instrument; (b) received a demographic, sales promotion, and buying
attitudes survey; and (c) stopped answering the survey questions anytime
during the survey completion process if the wish was to do so since the
participation in the survey was voluntary. The buying attitudes and sales
promotion questions were instruments Bakewell and Mitchell (2003) and
Osman and Fah (2011) created.
There were (a) confidentiality agreement documents (Appendix D) for the
protection of respondents; (b) no compensation for respondents of the survey;
(c) no identifying numbers, which linked an individual survey respondent to a
particular survey form; and (d) no information in the reports of the study that
helped identify respondents.
For continuing confidentiality and safety purposes, I will store and lock the
survey instrument, raw and coded data, collective results, and
62
recommendations in a container, security monitored place for 5 years after
completion of the study.
I will shred confidential data that will be physical documents and erase electronic
5 years after completion of the study.
A summary of findings from this research will be available to participants and
anyone after receipt of the request.
Data Collection
Data collection was an important step in this quantitative comparative design. The
quality of the study depended on the instruments that served in the data collection and
relied on the data collection technique. Finally, a successful data gathering might depend
on the method of the data organization.
Instruments
The instrument tools included a form of demographic, sales promotions, and
buying attitudes survey for analysis (Appendix A). The demographic data were a part of
the information that assisted in evaluating the validity of participants. The sales
promotions under study were coupons, buy-one-get-one-free, and price discounts. The
survey questions served to test the customers’ buying attitudes towards the three sales
promotions in the city, using a 5-point Likert-type scale. The Likert-type scale is a
prevalent method to measure psychometric responses from participants completing
surveys and set surveys employing closed-ended questions (Sardar, Rehman, Yousaf, &
Aijaz, 2011).
63
Crocker (2012) stated that identifying the central theme of the survey and
instituting the numeric scale (5, 7, or 9), is important when using a Likert-type scale.
Using a numeric scale of 5 allows rating statements and measuring the attitudes of survey
respondents (Crocker, 2012). Waples, Weyhrauch, Cornell, and Culbertson (2010)
mentioned that the reliability of responses increases by exploiting Likert-type rating
scales. The rationale for surveying was gathering structured data with the intent to
employ the data as a generalized sample of the population. Participants completed
confidential paper-based surveys. Data computation using the SPSS version 21.0
facilitated the analysis. I will keep raw data in a locked container for 5 years after
completion of the study. A summary of findings will be available upon request.
The definition of the variables was proper in the study to avoid threats to the
validity of the analysis (Miles, 2013). Sales promotion type and gender of customers
were the two independent variables for the analysis. Sales promotion type and gender
served as two factors at respectively four and two levels while buying attitudes of
customers served as the dependent variable. The statistical tests consisted of using a two-
factor ANOVA indicating significant overall mean differences, and Bonferroni multiple
comparison procedures served for examining which buying attitudes means differed
significantly among groups of customers based on the gender and type of sales
promotion. The approach to preventing possible internal and external threats consisted of
having appropriate sample size, establishing clear questions, identifying and verifying
64
assumptions, and expressing relevant business strategies. Approaches to addressing
threats to validity included double checking and viewing data.
The survey instrument tools were the instruments by Bakewell and Mitchell
(2003) and Osman and Fah (2011). Appendix B included permissions to use these survey
instrument tools. Osman and Fah assessed the reliability and validity of the survey
instruments and documented that the survey instruments had reached adequate reliability
for social science research and business. The scales of reliability for buying attitudes
towards coupons, buy-one-get-one-free, and price discounts had reached respectively
reliability coefficients of 0.752, 0.827, and 0.862 while buying attitudes scale had
attained the reliability coefficient of 0.680 (Osman & Fah, 2011). The scale of reliability
for coupons, buy-one-get-one-free, and price discounts had achieved the coefficient of
determination of 23 points (Osman & Fah, 2011). The scale of reliability for buying
attitudes had attained the coefficient of determination of 36 points (Osman & Fah, 2011).
Osman and Fah concluded that respondents who score the mean scale of 23 points or
below have unfavorable buying attitudes and those who score above the mean scale of 23
points have favorable buying attitudes. Buying attitudes are at low level for respondents
who score the mean scale of 36 points or below and at high level for those who score
above the mean scale of 36 points (Osman & Fah, 2011). Revisions or adjustments to the
use of the standardized research instruments were unnecessary. The methods for scale
score measurement and point attribution are reliable research tools for closed-ended
questions and quantitative studies (Sardar et al., 2011).
65
The first part of the survey included six close-ended demographic questions.
Close-ended questions allowed participants to choose from a provided set of possible
answers. The second part of the survey included 37 items consisting of assessing
participants’ buying attitudes towards the three sales promotion strategies and buying
attitudes of respondents. In this part, respondents chose an answer from a 5-point ordinal
scale, which were: strongly agree, agree, neutral, disagree, and strongly disagree. Eight
items served to measure each sales promotion type, and 13 items facilitated the
assessment of buying attitudes of participants.
The quantitative comparative design and analysis reflected the patterns of
preferences among the respondents. Points for responses varied from 1 in one end
(strongly disagree) to 5 in the other end (strongly agree). Data analysis using SPSS
version 21.0 generated calculations allowing identifying the most effective strategy of
sales promotions towards buying attitudes in the city. The total scale of buying attitudes
towards coupons, buy-one-get-one-free, and price discounts was on the basis of the mean
score. Two scale categories described the total score of buying attitudes towards coupons,
price discounts, and buy-one-get-one-free based on the measurement of mean scores.
Data Collection Technique
A confidential paper-based survey represented the instrument to collect data from
287 participants using a random sampling method. This process enabled the possibility of
the underlying random sample assumptions necessary for data analysis (Green & Salkind,
2010). The data collection technique consisted of approaching customers on sites of retail
66
stores after receiving permission from stores’ management to do so. Four retail stores
selected randomly represented the sites of the data collection. There was no transcriber or
translator. The random selection process consisted of approaching every fifth customer
who was about to enter the main entrance of stores until I obtained a total of 287
respondents. Randomization is preferable over convenience or nonprobability sampling
and allows generalization to the population (Spiegel et al., 2012). I provided volunteer
respondents with a Walden informed consent form, demographic questions, and sales
promotions and buying attitudes survey. Customers received information on the purpose
of the study and accepted to participate through an informed consent. There was no
compensation for participants. The study did not include a pilot study as the survey was
existing instruments tools. Osman and Fah (2011) established the reliability and validity
of the survey instrument tools and evidenced readability and understanding of questions.
Hence, a pilot study was not necessary.
Data Organization Techniques
The SPSS, version 21.0 software program, served to compute a two-way ANOVA
and, as determined from the overall ANOVA results, multiple comparison testing for the
data analysis. I coded the data into an SPSS data file for analysis and used the same
software program to check for data entry errors. Rating statements and measuring the
attitudes of survey respondents (Crocker, 2012) required an appropriate measurement
tool. Skarzauskiene (2010) identified SPSS as a validated measurement tool for effects
testing of variables when examining data. Sardar et al. (2011) found the Likert-type scale
67
as a prevalent technique to measure psychometric responses from participants completing
surveys using closed-ended questions. The SPSS, version 21.0, allowed keeping track of
data, logging data into a matrix, and analyzing the effects (Skarzauskiene, 2010) of the
types of sales promotion and gender on buying attitudes. I will store and lock the survey
instrument, raw and coded data, and the collective results and recommendations in a
container for 5 years after completion of the study to protect rights of participants.
Data Analysis Technique
The research question for this doctoral study was: What is the most effective
strategy for aligning sales promotions with buying attitudes in a recession? The research
was a quantitative comparative design, not requiring interview questions. The list of the
demographic and survey questions included 43 questions (Appendix A). For the
demographic questions, the participants selected answers among statements. The
demographic and survey questions included six close-ended questions and 37 statements
of sales promotion and buying attitudes respectively. For each survey question, the
respondents chose among answers, which were strongly disagree, disagree, neutral,
agree, or strongly agree after reading each of the sales promotion and buying attitudes
statements.
The data analysis consisted of testing two null hypotheses. One null hypothesis
consisted of nonexistence of a significant difference in buying attitudes means among the
types of sales promotion in a recession. The other null hypothesis consisted of
nonexistence of a significant difference in buying attitudes means between customers’
68
gender in a recession. The participants’ responses to the demographic, sales promotions,
and buying attitudes survey were confidential and helped identify the respondents only as
Participant 1, Participant 2, and so on. The points (ordinal scale) for responses strongly
agree, agree, neutral, disagree, and strongly disagree were respectively 5, 4, 3, 2, and 1
for the statistical tests computation. SPSS is a validated analysis tool for effects testing of
variables when analyzing data (Skarzauskiene, 2010). The SPSS, version 21.0 software
tools enabled the creation of data spreadsheet and charted demographic, survey, and
analysis data in the study. After obtaining frequency counts to review the distribution of
responses to each question on the survey and identify possible outliers, a two-way
ANOVA served as a statistical test for assessing an overall difference of means. As a
significant difference existed among means, multiple comparisons using Bonferroni
multiple comparison procedure (Green & Salkind, 2010) enabled me to examine the
nature of the differences and identify which sales promotion type is the most effective
towards buying attitudes. Assumptions for the ANOVA test included homoscedasticity.
There was a test for homogeneity of variances to ensure that all within-group variances
were the same before the ANOVA test. The Levene’s test revealed the presence of
heteroscedasticity, and I used SPSS’ bootstrapping feature to assure the statistical validity
of the post hoc tests and determine which sales promotion strategy was the most effective
for aligning sales promotions with buying attitudes in a recession.
Four concepts from the literature grounded and complemented this quantitative
comparative design. Harvard Business Essentials (2005) suggested that managers should
69
look not only inside, but also outside of the firm to obtain or maintain a leadership
position by aligning strategy to goals in a competitive environment. When looking
outside, marketers might uncover that reductions in the product price have a positive
impact on sales and create value for investors (Ferrer & Mallari, 2011). Frischmann and
Gensler (2011) supported that, in general, managers admitted the need for quantitative
measures of marketing performance face the challenge of determining which metrics to
measure and in what way to interpret metrics. Chen et al. (2012) stated that understanding
the implications of how customers evaluate offers such as sales promotions is
indispensable for organizations. The doctoral study was congruent with these ideas as the
research question consisted of identifying the most effective strategy for aligning sales
promotions with buying attitudes in a recession. The inquiry allowed data gathering to
determine the most effective strategy of sales promotions. Hence, the research question
was a support in establishing the sales promotion strategy that aligns properly with the
sales increase goal in a recession and addressing the theoretical framework.
The data presentation, explanation, and interpretation helped establish critical
consistency in association with the research question and illustrate implications of the
population under study. Johnson and Christensen (2007) supported that the statistical
process assists in attempting to either disprove or prove if a difference exists between the
independent and dependent variables. Because there were two factors at four and two
levels, a 4X2 two-way ANOVA was a support, and multiple comparison procedures
helped examine differences in buying attitudes among the groups of customers. Johnson
70
and Christensen reinforced that such a design was suitable as data analysis allows using
samples and inferential statistics methodology for mean differences examination in the
population.
Reliability and Validity
The data accuracy allowed understanding whether a gap exists between the results
of the inquiry and practice. Reliability and validity were important to evaluate potential
weaknesses and strengths of the analysis and for this study. This subsection included a
discussion of the reliability and validity of the study.
Reliability
A compilation of appropriate materials, when creating survey questions is
necessary to generate reliable research (Johnson & Christensen, 2007; Yukl, George, &
Jones, 2010). The quality of the survey, data collection method, approach of data
transferring, and proper data analysis procedure were factors that led to internal and
external reliability (Yukl et al., 2010). Wikman (2006) confirmed that managing the
measuring indicators is easier when the researcher chooses proper questions on surveys.
The instruments for this research had reached acceptable reliability for business and
social science research (Osman & Fah, 2011). Osman and Fah (2011) established that the
scale of reliability for buying attitudes towards coupons had attained the reliability
coefficient of 0.827 while the scale of reliability for buying attitudes towards price
discounts had achieved the reliability coefficient of 0.752. The scale of reliability for
buying attitudes towards buy-one-get-one-free had reached the reliability coefficient of
71
0.806. In addition, Osman and Fah indicated that the scale of reliability for buying
attitudes had reached the reliability coefficient of 0.680. The SPSS, version 21.0 software
program, served to compute a two-way ANOVA and, as necessary, multiple comparison
procedures for the data analysis. SPSS provides estimates of the coefficient of
determination and effect sizes for main effects and the two-factor interaction for a two-
way ANOVA (Green & Salkind, 2010).
A confidential paper-based survey represented the instrument to collect data from
287 participants using a random sampling method for this quantitative comparative
design. For each survey question, the respondents chose among answers, which were
strongly agree, agree, neutral, disagree, or strongly disagree. The points (ordinal scale)
for these responses were respectively 5, 4, 3, 2, and 1.
Validity
Validity consists of factual conclusions reflecting (a) real world phenomena, (b)
accuracy of data collection, (c) authenticity, (d) credibility, and (e) trustworthiness
(Miles, 2013). Minimizing external validity problems in the research design and analysis
was a goal. External validity referred to the ability of other researchers to apply the
study’s findings and recommendations for customers of different regions or types of
store. The generalizability and applicability of findings to other circumstances depend on
the study’s external validity (Rodriguez Jaime, 2013). Internal validity related to the
variables and ability to verify the cause and effect, which was not the focus of a
comparative design (Rodriguez Jaime, 2013). The statistical tests consisted of using a
72
two-factor ANOVA for examining the differences in buying attitudes among groups of
customers based on the gender and type of sales promotion. Assumptions of the ANOVA
test included homoscedasticity that all within-group variances are the same. The Levene’s
test enabled me to conclude the presence of heteroscedasticity, and using SPSS’s
bootstrapping procedures enabled me to assure the statistical validity of the post hoc
tests’ results (Green & Salkind, 2010). Appropriate methods for data collection and
analysis were necessary for assuring the statistical conclusion validity of this quantitative
comparative study. In addition, profile plots and viewing data helped in assuring
statistical conclusion validity. Before the ANOVA test, I examined the frequency
distributions of responses to each question on the survey and identified no outliers.
Watrous-Kelley (2012) concluded that external validity issues can result in other
researchers reaching incorrect inferences. The population group of the study consisted of
consumers involved in the buying process in retail stores in a southern U.S. city as the
increase of sales should generate from customers, not from internal requirements or
perspectives of corporations (Apetroaie et al., 2012). The recession had affected the
profitability and sustainability of retail stores in a southern U.S. city, which represented
the geographic location of the study (Apetroaie et al., 2012; Levchenko et al., 2010).
Transition and Summary
Section 2 included (a) the purpose statement, (b) role of the researcher, (c)
participants, (d) population and sampling design, (e) ethical research, (f) data collection
and analysis techniques, and (g) means for assuring the reliability and validity of this
73
study. Section 2 encompassed the explanation and discussion of the substance of this
research. Observing ethical rules in data collection and analysis was necessary for the
reliability and validity of the study and protection of participants.
Section 3 included the discussion of the (a) presentation of findings, (b)
application to professional practice, (c) inferences for social change, (d) suggestions for
actions and further research, and (e) reflections. Findings comprised the (a) presentation
of the purpose, (b) research question, (c) reintroduction of hypotheses, and (d) summary
of findings. The presentation encompassed conclusions on the basis of the statistical
evidence. The application to professional practice comprised how the study related to
business relevance for improving business practices. Implications to social change
comprised establishing the way the findings and recommendations enabled the
development of (a) organizations, (b) individuals, or (c) institutions in the community.
Change recommendations for action were suggestions of how the study’s findings led to
future research. Reflections included suggestions and thoughts about sales promotion
tools, and conclusion was a message regarding effective sales promotion tools towards
buying attitudes.
74
Section 3: Application to Professional Practice and Implications for Change
The purpose of this quantitative comparative study was to determine the most
effective strategy for aligning sales promotions with buying attitudes in a recession.
Section 1 was a discussion of the foundation of the study, and Section 2 was an
explanation and discussion of the research methodology and design. Section 3 includes
an (a) overview of the study, (b) presentation of the findings, and (c) description of ways
findings from the research apply to professional practice and might influence social
change. In addition, this section encompasses (a) recommendations for action and further
research in the field, (b) reflections, and (c) summary and conclusions of the study.
Overview of Study
The intent of this research was to identify which sales promotion strategy
influences buying attitudes significantly in a recession. The sales promotions under
investigation were (a) coupons discount, (b) buy-one-get-one-free, (c) price discounts,
and (d) control case for which there was no sales promotion strategy. The research
question was as follows: What is the most effective strategy for aligning sales promotions
with buying attitudes in a recession? This analysis comprised effects of both types of
sales promotions and gender of customers. The subquestions generated from the research
question were as follows:
1. How do buying attitudes means differ among the types of sales promotion in a
recession?
75
2. How do buying attitudes means differ among customers male and female in a
recession?
Data from customers completing a confidential paper-based survey and random
sampling method served for computing 4X2 two-way ANOVA and Bonferroni post hoc
testing. The main effect for customers’ gender [F(1, 279) = .000; p = .999 > .05; Partial
η² = .000] was not significant. The difference in buying attitudes was not significantly
different (p = .99 > .05) for male and female participants. However, there was a
significant main effect with respect to the types of sales promotion [F(3, 279) = 101.360;
p = .000 < .001; Partial η² = .522]. The price discount mean was higher than coupon
discount, buy-one-get-one-free, and control means. The price discount strategy had a
higher buying attitudes mean (38.51) than did any other type of sales promotion for both
genders. Findings enabled the identification of price discount as the most effective
strategy for aligning sales promotions with buying attitudes in a recession.
Findings from this research enable business practitioners to develop a sales
promotion strategy that contributes to a substantial increase of sales for sustainability of
organizations in a recession. Increasing sales might require growing the production
volume and hiring more employees. Findings could catalyze the improvement of lifestyle
of individuals and reduction of negative tendencies such as crime and poverty associated
with unemployment. The next section includes a presentation of the findings.
76
Presentation of the Findings
The purpose of this study was to determine which sales promotion strategies
differed significantly in customers’ buying attitudes in a recession. The research question
was the following: What is the most effective strategy for aligning sales promotions with
buying attitudes in a recession? This data analysis consisted of testing two null
hypotheses. The null and alternative hypotheses built from the research question were as
follows:
H1o: There is no significant difference in buying attitudes means among the types
of sales promotion in a recession.
H1a: There is a significant difference in buying attitudes means among the types
of sales promotion in a recession.
H2o: There is no significant difference in buying attitudes means among
customers male and female in a recession.
H2a: There is a significant difference in buying attitudes means among customers
male and female in a recession.
Using a confidential paper-based survey and random sampling method, I obtained
and analyzed data from 287 consumers. There was a quick review for completion of each
survey package returned during the data gathering, and participants completed any
missing parts, if necessary without coercion. As a result, there were no missing answers
or variables when completing analyses. Demographic data such as race and occupation
were not necessary for the analysis or research question. I coded the data into an SPSS

77
data file for analysis and used the same software program to check for data entry errors.
There were frequency counts to develop and review the distribution of responses to each
question on the survey. Below is a presentation of results from the analysis.
Presentation of the Results
This data analysis consisted of (a) calculating descriptive statistics, (b) computing
a 4X2 ANOVA, and (c) employing Bonferroni post hoc tests. The descriptive statistics
comprised the responses by question label, group name, number per group, mean, and
standard deviation. Descriptive statistics allowed for the examination of possible mean
differences. Table 4 contains the descriptive statistics of buying attitudes of male and
female customers towards each of the four types of sales promotion. The ANOVA test
enabled the analysis of the significance of mean differences. Buying attitudes mean was
an indication of the average perception of each group in relation to each factor.
The results did not include any outliers. Buying attitudes means for customer males
ranged from 38.51 to 32.00 while means for customer females ranged from 38.51 to
32.22. Buying attitudes means for types of sales promotion ranged from 38.51 for price
discount to 32.00 for coupon discount. The overall buying attitudes means were 38.51 for
price discount, 32.13 for coupon discount, 33.48 for buy-one-get-one-free, and 32.82 for
the control case for which there was no sales promotion strategy.
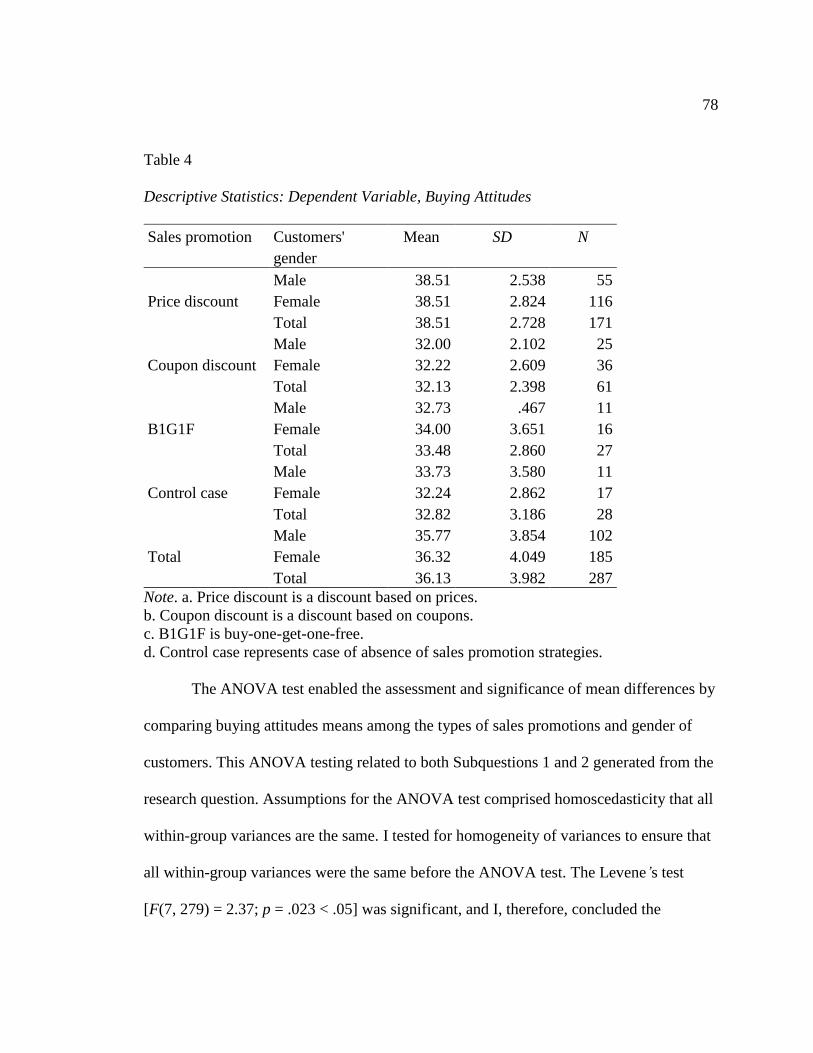
78
Table 4
Descriptive Statistics: Dependent Variable, Buying Attitudes
Sales promotion Customers'
gender
Mean SD N
Price discount
Male 38.51 2.538 55
Female 38.51 2.824 116
Total 38.51 2.728 171
Coupon discount
Male 32.00 2.102 25
Female 32.22 2.609 36
Total 32.13 2.398 61
B1G1F
Male 32.73 .467 11
Female 34.00 3.651 16
Total 33.48 2.860 27
Control case
Male 33.73 3.580 11
Female 32.24 2.862 17
Total 32.82 3.186 28
Total
Male 35.77 3.854 102
Female 36.32 4.049 185
Total 36.13 3.982 287
Note. a. Price discount is a discount based on prices.
b. Coupon discount is a discount based on coupons.
c. B1G1F is buy-one-get-one-free.
d. Control case represents case of absence of sales promotion strategies.
The ANOVA test enabled the assessment and significance of mean differences by
comparing buying attitudes means among the types of sales promotions and gender of
customers. This ANOVA testing related to both Subquestions 1 and 2 generated from the
research question. Assumptions for the ANOVA test comprised homoscedasticity that all
within-group variances are the same. I tested for homogeneity of variances to ensure that
all within-group variances were the same before the ANOVA test. The Levene’s test
[F(7, 279) = 2.37; p = .023 < .05] was significant, and I, therefore, concluded the
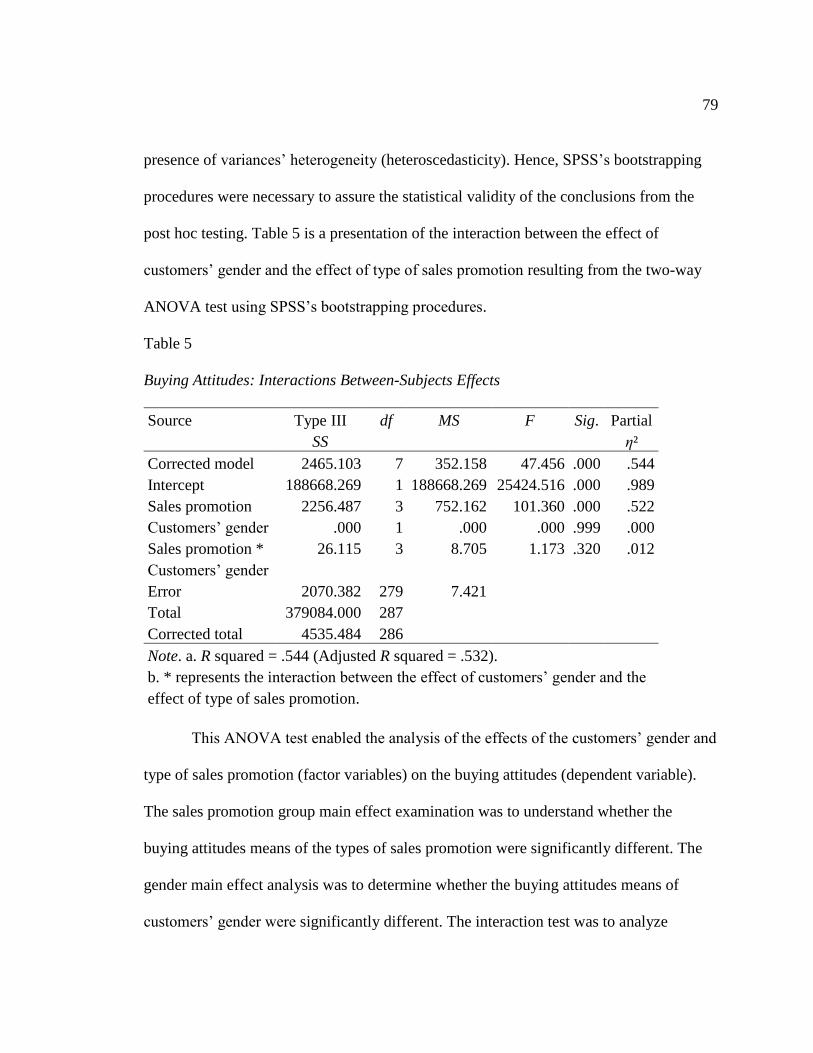
79
presence of variances’ heterogeneity (heteroscedasticity). Hence, SPSS’s bootstrapping
procedures were necessary to assure the statistical validity of the conclusions from the
post hoc testing. Table 5 is a presentation of the interaction between the effect of
customers’ gender and the effect of type of sales promotion resulting from the two-way
ANOVA test using SPSS’s bootstrapping procedures.
Table 5
Buying Attitudes: Interactions Between-Subjects Effects
Source Type III
SS
df MS F Sig. Partial
η²
Corrected model 2465.103 7 352.158 47.456 .000 .544
Intercept 188668.269 1 188668.269 25424.516 .000 .989
Sales promotion 2256.487 3 752.162 101.360 .000 .522
Customers’ gender .000 1 .000 .000 .999 .000
Sales promotion *
Customers’ gender
26.115 3 8.705 1.173 .320 .012
Error 2070.382 279 7.421
Total 379084.000 287
Corrected total 4535.484 286
Note. a. R squared = .544 (Adjusted R squared = .532).
b. * represents the interaction between the effect of customers’ gender and the
effect of type of sales promotion.
This ANOVA test enabled the analysis of the effects of the customers’ gender and
type of sales promotion (factor variables) on the buying attitudes (dependent variable).
The sales promotion group main effect examination was to understand whether the
buying attitudes means of the types of sales promotion were significantly different. The
gender main effect analysis was to determine whether the buying attitudes means of
customers’ gender were significantly different. The interaction test was to analyze
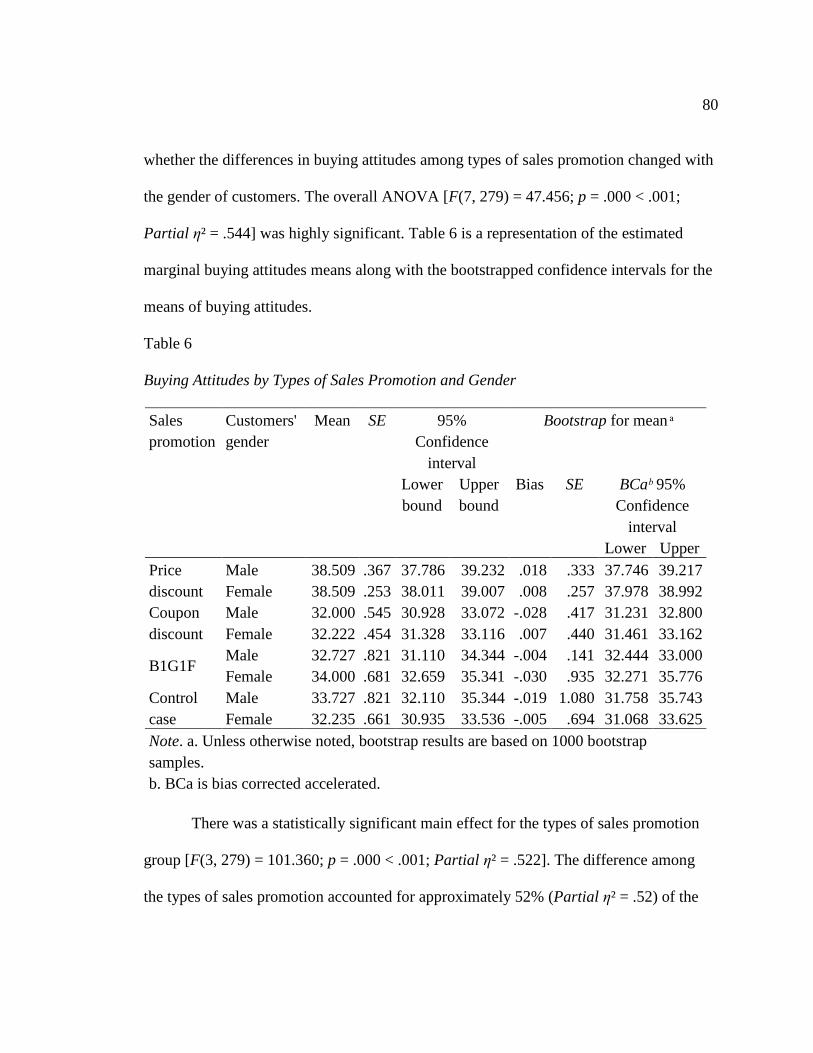
80
whether the differences in buying attitudes among types of sales promotion changed with
the gender of customers. The overall ANOVA [F(7, 279) = 47.456; p = .000 < .001;
Partial η² = .544] was highly significant. Table 6 is a representation of the estimated
marginal buying attitudes means along with the bootstrapped confidence intervals for the
means of buying attitudes.
Table 6
Buying Attitudes by Types of Sales Promotion and Gender
Sales
promotion
Customers'
gender
Mean SE 95%
Confidence
interval
Bootstrap for mean ͣ
Lower
bound
Upper
bound
Bias SE BCaᵇ 95%
Confidence
interval
Lower Upper
Price
discount
Male 38.509 .367 37.786 39.232 .018 .333 37.746 39.217
Female 38.509 .253 38.011 39.007 .008 .257 37.978 38.992
Coupon
discount
Male 32.000 .545 30.928 33.072 -.028 .417 31.231 32.800
Female 32.222 .454 31.328 33.116 .007 .440 31.461 33.162
B1G1F Male 32.727 .821 31.110 34.344 -.004 .141 32.444 33.000
Female 34.000 .681 32.659 35.341 -.030 .935 32.271 35.776
Control
case
Male 33.727 .821 32.110 35.344 -.019 1.080 31.758 35.743
Female 32.235 .661 30.935 33.536 -.005 .694 31.068 33.625
Note. a. Unless otherwise noted, bootstrap results are based on 1000 bootstrap
samples.
b. BCa is bias corrected accelerated.
There was a statistically significant main effect for the types of sales promotion
group [F(3, 279) = 101.360; p = .000 < .001; Partial η² = .522]. The difference among
the types of sales promotion accounted for approximately 52% (Partial η² = .52) of the

81
variability in buying attitudes (Table 5). Further analysis of the specific differences in the
mean effects was necessary because of the presence of a statistically significant main
effect for types of sales promotion (p = .000 < .001; Partial η² = .52). The overall mean
(Table 4) for the price discount (38.51) was significantly higher than that for coupon
discount (32.13), buy-one-get-one-free (33.48), or control case for which there was no
sales promotion strategy (32.82). However, the difference in buying attitudes means for
customers’ gender (Table 5) was not significant [F(1, 279) = .000; p = .999 > .05; Partial
η² = .000]. The sales promotion * customers’ gender interaction (Table 5) was not
statistically significant [F(3, 279) = 1.173; p = .320 > .05; Partial η² = .012]. Post hoc
pairwise comparisons for the customers’ gender (p = .99 > .05) and sales promotion *
customers’ gender (p = .32 > .05) were unnecessary since the effects were not significant.
I then conducted the follow-up of the tests for mean differences with pairwise
comparisons among the four types of sales promotion averaged across gender. The nature
of the post hoc pairwise comparison testing depended on the degree to which variance
across all of the groups was equal, through the use of the Levene’s test. There was
evidence of heteroscedasticity. The Levene’s test [F(7, 279) = 2.37; p = .023 < .05] was
significant, rejecting the assumption of equal variance across all subpopulations.
Bootstrapped non-parametric confidence intervals were, therefore, necessary for
conducting multiple comparison testing. I used Bonferroni adjustment for the post hoc
pairwise comparisons across the groups of types of sales promotion. Field (2013)
concluded that Bonferroni procedures enable researchers to control for the Type I error
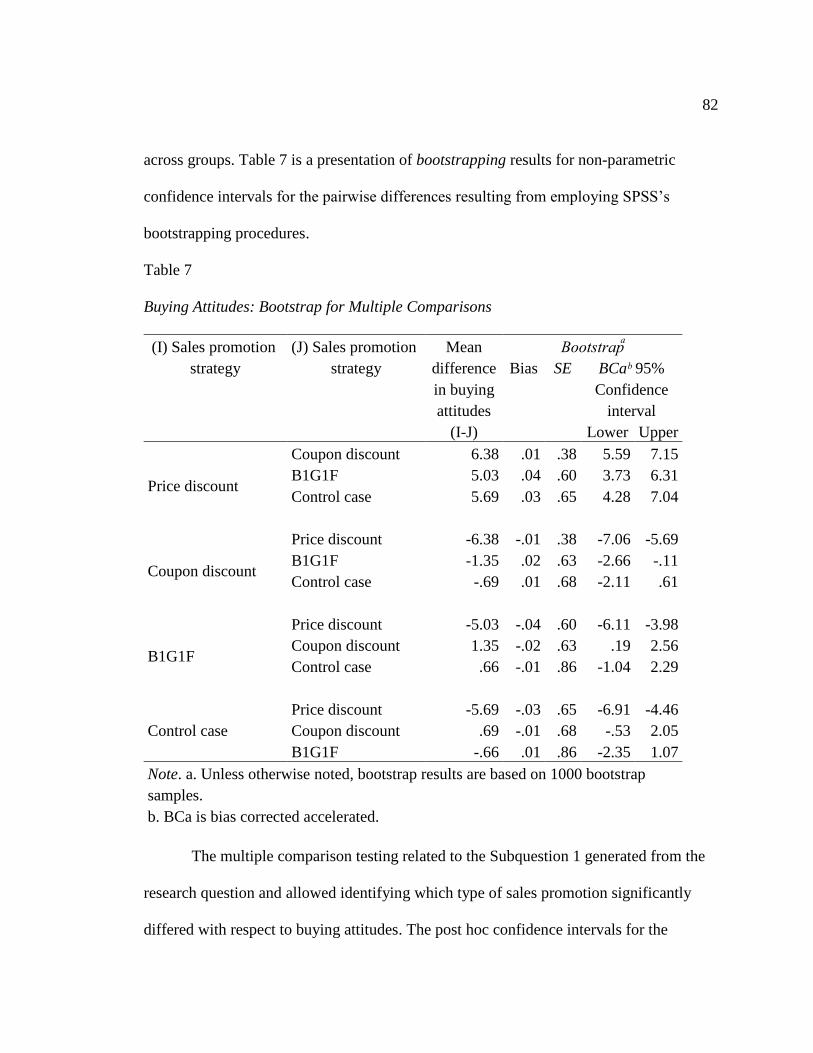
82
across groups. Table 7 is a presentation of bootstrapping results for non-parametric
confidence intervals for the pairwise differences resulting from employing SPSS’s
bootstrapping procedures.
Table 7
Buying Attitudes: Bootstrap for Multiple Comparisons
(I) Sales promotion
strategy
(J) Sales promotion
strategy
Mean
difference
in buying
attitudes
(I-J)
Bootstrapͣ
Bias SE BCaᵇ 95%
Confidence
interval
Lower Upper
Price discount
Coupon discount 6.38 .01 .38 5.59 7.15
B1G1F 5.03 .04 .60 3.73 6.31
Control case
5.69 .03 .65 4.28 7.04
Coupon discount
Price discount -6.38 -.01 .38 -7.06 -5.69
B1G1F -1.35 .02 .63 -2.66 -.11
Control case
-.69 .01 .68 -2.11 .61
B1G1F
Price discount -5.03 -.04 .60 -6.11 -3.98
Coupon discount 1.35 -.02 .63 .19 2.56
Control case
.66 -.01 .86 -1.04 2.29
Control case
Price discount -5.69 -.03 .65 -6.91 -4.46
Coupon discount .69 -.01 .68 -.53 2.05
B1G1F -.66 .01 .86 -2.35 1.07
Note. a. Unless otherwise noted, bootstrap results are based on 1000 bootstrap
samples.
b. BCa is bias corrected accelerated.
The multiple comparison testing related to the Subquestion 1 generated from the
research question and allowed identifying which type of sales promotion significantly
differed with respect to buying attitudes. The post hoc confidence intervals for the
83
differences in means of buying attitudes identified significant mean differences for the
bootstrap confidence intervals, which did not contain zero. Based on Table 7, the
confident intervals that did not overlap zero difference in buying attitudes were for (a)
price discount and coupon discount [5.59, 7.15], (b) price discount and buy-one-get-one-
free [3.73, 6.31], (c) price discount and control case [4.28, 7.04], (d) coupon discount and
price discount [-7.06, -5.69], (e) coupon discount and buy-one-get-one-free [-2.66, -.11],
(f) buy-one-get-one-free and price discount [-6.11, -3.98], (g) buy-one-get-one-free and
coupon discount [.19, 2.56], and (h) control case and price discount [-6.91, -4.46].
Participants had almost identical buying attitudes in the presence of buy-one-get-
one-free, coupon discount, and control case (absence of sales promotions) strategies. The
buying attitudes mean for price discount was significantly higher than those for coupon
discount, buy-one-get-one-free, and that of the control case. The mean differences in
buying attitudes varied from 6.38 for price discount and coupon discount to 5.03 for price
discount and buy-one-get-one-free. The mean difference in buying attitudes was 5.69
between price discount and control case and 1.35 between buy-one-get-one-free and
coupon discount.
There was a significant difference in buying attitudes means among the types of
sales promotion in a recession (Table 5). Buying attitudes towards the price discount
strategy were substantially higher than those towards the coupon discount, buy-one-get-
one-free, and that of the control case strategies (Table 7). Osman and Fah (2011)
concluded that buying attitudes are at a low level for respondents who score below or the
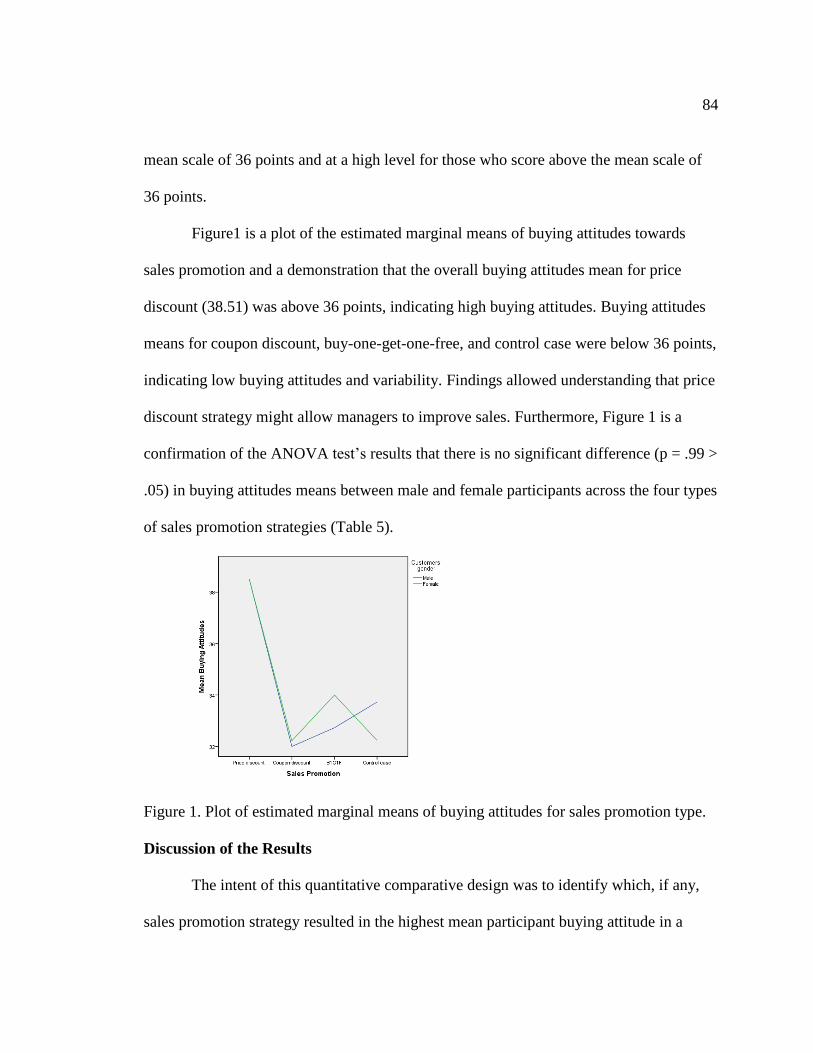
84
mean scale of 36 points and at a high level for those who score above the mean scale of
36 points.
Figure1 is a plot of the estimated marginal means of buying attitudes towards
sales promotion and a demonstration that the overall buying attitudes mean for price
discount (38.51) was above 36 points, indicating high buying attitudes. Buying attitudes
means for coupon discount, buy-one-get-one-free, and control case were below 36 points,
indicating low buying attitudes and variability. Findings allowed understanding that price
discount strategy might allow managers to improve sales. Furthermore, Figure 1 is a
confirmation of the ANOVA test’s results that there is no significant difference (p = .99 >
.05) in buying attitudes means between male and female participants across the four types
of sales promotion strategies (Table 5).
Figure 1. Plot of estimated marginal means of buying attitudes for sales promotion type.
Discussion of the Results
The intent of this quantitative comparative design was to identify which, if any,
sales promotion strategy resulted in the highest mean participant buying attitude in a
85
recession. The research question was as follows: What is the most effective strategy for
aligning sales promotions with buying attitudes in a recession? Two subquestions
generated from the research question led to two null and alternative hypotheses.
Subquestion 1. The first sub-question stemming from the research question
consisted of understanding how buying attitudes means differ among the types of sales
promotion in a recession. Null hypothesis 1: There is no significant difference in buying
attitudes means among the types of sales promotion in a recession. Null hypothesis 1 was
false. Buying attitudes means among the types of sales promotion are significantly
different in a recession. This result is similar to previous researchers’ findings. Mir and
Rehman (2012) found that the behaviors of customers vary from a sales promotion
strategy to another. Mishra and Mishra (2011) provided an example of price discount and
bonus packs and showed that customers desire price discounts to bonus for unhealthy
food items. Osman and Fah (2011) reached a similar conclusion when simulating
coupons, buy-one-get-one-free, price discounts, and free samples towards buying
attitudes among students. Osman and Fah established a significant difference in buying
attitudes among these types of sales promotion. Chen et al. (2012) conducted several
statistical tests and documented that buying behaviors of buyers change when managers
vary sales promotion strategies. Zhang and Breugelmans (2012) reinforced this concept
when comparing price discount with other sales promotion strategies. Khan and Dost
(2011) found that dynamics of impulsive buying behavior and sales promotion have an
insignificant positive correlation. Overall, the conclusion that there is a significant

86
difference in buying attitudes means among the types of sales promotion in a recession is
a confirmation of findings from previous studies.
Price discount is a sales promotion strategy that influences buying attitudes. This
finding is similar to results from the research by Osman and Fah (2011). Osman and Fah
found the presence of a significant association between buying attitudes and sales
promotions. Effective marketing strategies affect the consumers’ shopping basket
decisions and sales (Ramanathan & Dhar, 2013). Findings are a confirmation of the
conclusion Esfahani and Jafarzadeh reached in 2012. Sales promotion is one of the key
factors in the marketing mix for different consumers' products worldwide used to
stimulate customer purchases (Esfahani & Jafarzadeh, 2012). Mir and Rehman (2012)
supported that sales promotion is a key implement managers frequently rely on to
influence customers’ buying attitudes directly. Strategists should consider promotions as
an efficient method and strategy for managing customers and rivals in the end (Kanagal,
2013). Esfahani and Jafarzadeh (2013) confirmed that marketers use more sales
promotions to respond to customer behavior trends. Ramanathan and Dhar (2013)
reinforced that sales promotions affect the sales of brands under promotion and promoted
brands. Nevertheless, managers need to identify the right sales promotion tool for the
improvement of buying attitudes.
Price discount is the most effective strategy for aligning sales promotions with
buying attitudes in a recession. This result from the research is similar to previous
findings. Kotler (2011) explained the persistence of sales issues by the magnitude of this
87
recession, which has constrained consumers to modify lifestyles to a lower level of
revenue and spending. Price influences risk intentions, and the perception to consume the
good or service is a key factor in purchasers’ decision-making (Samper & Schwartz,
2013). Leeflang and Parreño-Selva (2012) found that approximately half of all price
promotions increase own-category revenues, particularly for categories with deeper
reinforced discounts and that a price promotion influences sales of at least one other
category. Reduced prices signal higher accessibility to anyone in need of a product and
increase consumption of this good or service, and the opposite is true for higher prices
(Samper & Schwartz, 2013). Nonetheless, Mishra and Mishra (2011) revealed that
consumers prefer bonus packs to price discounts for healthy food items. Bezawada and
Pauwels (2013) elucidated that higher assortment and lower prices contrasted with more
and deeper promotions are the most effective strategies. Alexy et al. (2012) supported
that a tool of low-price increases sales and Alrjoub et al. (2012) reinforced that price
reductions increase sales and profitability of firms. Rajput et al. (2012) confirmed the
presence of significant positive relationship between product price and buying attitudes.
Kuksov and Ying (2012) showed the presence of a positive impact of price reduction of a
product on the market for alternate products. Overall, the conclusion that price discount is
the most effective strategy for aligning sales promotions with buying attitudes in a
recession aligns with conclusions from previous similar studies.
Subquestion 2. The second sub-question generated from the research question
consisted of understanding the extent to which buying attitudes means differ with
88
customers’ gender. Null hypothesis 2: There is no significant difference in buying
attitudes means among male and female customers in a recession. Null hypothesis 2
could not be rejected. There is no significant difference in buying attitudes means among
male and female customers in a recession. This finding is similar to results from the
research by Osman and Fah (2011). Osman and Fah found no significant difference in
buying attitudes among customers male and female. Nevertheless, Kwanho et al. (2012)
found a significant difference in buying attitudes among male and female customers for
car markets.
In summary, buying attitudes means differ significantly among the types of sales
promotion in a recession. Buying attitudes do not differ significantly between customers’
gender. Findings from the null hypotheses 1 and 2 testing assisted in responding to the
two subquestions generated from the research question. Findings from this analysis
allowed answering the research question and identifying price discount as the most
effective strategy for aligning sales promotions with buying attitudes in a recession.
The concepts of sales promotions, consumer behavioral metrics, price reductions,
and strategy in a competitive environment represented the theoretical framework that
grounded and complemented this quantitative comparative design. Findings were
congruent with these ideas as the analysis led to identifying the most effective strategy
for aligning sales promotions with buying attitudes in a recession. Chen et al. (2012)
showed a considerable advantage in sales volume for sales promotions. Managers face
the challenge of determining, which metrics marketers should utilize and how to interpret

89
results (Frischmann & Gensler, 2011). Chen et al. suggested that understanding the
implications of how customers evaluate offers such as sales promotions is necessary for
business leaders to increase sales and profitability of companies. Frischmann and Gensler
(2011) found the relevance of mediating effects of consumer behavioral metrics on the
correlation between buyer perceptual metrics and profitability. The concepts Frischmann
and Gensler developed were pertinent in that the principles of the theories were inherent
for the inquiry.
Harvard Business Essentials (2005) suggested that managers look not only inside,
but also outside of the firm to obtain or maintain a leadership position by aligning
strategy to goals in a competitive environment. The current study was an opportunity to
look outside of firms by collecting data from customers for examining the most effective
strategy for aligning sales promotions with buying attitudes in a recession. Fresh
information about marketing development was necessary for integrating the financial
requirement of consumers in the development plan of businesses. Reductions in the
product price have a positive impact on sales and enable value creation for investors
(Ferrer & Mallari, 2011). Findings were in association with the theory Ferrer and Mallari
(2011) developed since results enabled the identification of price discount as the most
effective strategy for sales increase and value creation. Hence, the research question was
catalyst for establishing the sales promotion strategy that aligns properly with the sales
increase goal in a recession and addressing the theoretical framework.
90
Applications to Professional Practice
The intent of this research was to provide executives with an effective strategy for
aligning sales promotions with buying attitudes in a recession. The four types of sales
promotion under investigation were coupons, buy-one-get-one-free, price discounts, and
control case for which there was no sales promotion strategy. There is the presence of a
significant difference in buying attitudes means among the types of sales promotion in a
recession. There is no significant difference in buying attitudes means between male and
female customers in a recession for the four sales promotion strategies. Identifying the
sales promotion strategy that is in association with buying attitudes in a recession was
necessary for company leaders for the development of sales forecasts for different
promotion strategies. Findings from this research enabled the identification of price
discount as the most effective strategy for aligning sales promotions with buying attitudes
in a recession. The applicability of these findings might be of importance for not only
managers, but also stakeholders. Kotler (2011) explained the persistence of sales issues
by the magnitude of the recession, which has constrained consumers to modify lifestyles
to a lower level of revenue and spending. Based on findings from the inquiry, managers
could potentially increase sales to ensure profitability and sustainability for companies in
a recession.
Implications for Social Change
Findings from this research enabled a direct and positive impact on social change.
Based on findings from this research, managers could increase sales and ensure
91
sustainability for companies in a recession. Findings may enable company owners,
stakeholders, and employees to remain profitable during a recession. The implementation
of price discount strategy should allow individuals to buy more products for less
spending. Increasing sales requires growing the production volume and hiring more
employees. As for individuals, positive emotion usually accompanies a positive outcome
(Erevelles & Fukawa, 2013), findings enabled the promotion of the lifestyle improvement
of individuals. In addition, results should assist in reducing potential negative
consequences of recession such as crime and poverty associated with unemployment. The
implementation of results should enable sales, transactions, profits, companies, and gross
domestic product (GDP) growth, which could allow governments to collect more taxes
and invest more in social programs. Overall, the application of findings should allow
profits, success, and prosperity opportunities for businesses, individuals, and
governments.
Recommendations for Action
The purpose of this quantitative comparative design was to provide managers
with an effective strategy for aligning sales promotions with buying attitudes in a
recession. Based on findings from this study, price discount is the sales promotion
strategy that influences buying attitudes significantly in a recession. Managers should
implement effective price reduction strategies for sales increase. The implementation of
the price discount strategy elicits interest in training programs to support improved

92
strategy for sales increase. Dissemination opportunities include providing business
journals, institutions, and business owners interested in the study with findings for action.
Recommendations for Further Study
Results from this study can serve as a springboard for future in-depth studies of
sales promotion in a recession. The participants in this study might not be typical of the
entire population of the city. The number and quality of consumers willing and available
to participate were indispensable for determining the limits of the study and other
researchers’ ability to extrapolate findings to the general population. The generalization
of the results might require increasing the size of the sample and extending the research
to other geographical locations. The research was an analysis of only three sales
promotional tools instead of a large number of sales promotion implements such as
rebates, free samples, sweepstakes, and in-pack premiums. Future researchers could
address the assessment of buying attitudes towards a larger number of sales promotion
strategies. The first issue is defining and listing all sales promotion tools. A category of
goods or service was not the focus for this study. Future researchers should delve deeper
into buying attitudes among customers male and female.
Reflections
As a result of conducting this research, I have gained an increased understanding
of the complexity of planning, collecting, and analyzing data from customers, using a
confidential paper-based survey. A personal aim for conducting this quantitative
comparative design was to (a) hone professional skills in quantitative research, (b)
93
enhance understanding of sales issues, and (c) suggest potential solutions to address a
problem of general concern. There was no compensation for participants of the survey.
The ability to convince volunteer customers for participating in such a survey was a
moment of self-discovery. The analysis of data enabled the identification of the price
discount as the most effective sales promotion strategy for sales increase in the city,
which represented the geographic location of the study.
Summary and Study Conclusions
The intent of this quantitative study using a comparative design was to determine
which sales promotion strategy influences buying attitudes significantly in a recession.
The main topics of the literature review were (a) sales promotion, (b) factors influencing
buying attitudes, (c) factors affecting sales, and (d) impact of the recent financial crisis on
sales. A review of the body of sales research enabled the insight of the need to determine
the most effective strategy of sales promotions towards buying attitudes in a recession.
The research question was as follows: What is the most effective strategy for aligning
sales promotions with buying attitudes in a recession? The analysis included examining
effects of customers’ gender and type of sales promotion. The sales promotions under
investigation were coupons, buy-one-get-one-free, and price discounts. Two subquestions
stemming from the principal research question allowed addressing the need to understand
how buying attitudes means differ among the male and female customers and types of
sales promotion in a recession.
94
The data analysis comprised testing two null hypotheses. One null hypothesis
consisted of nonexistence of a significant difference in buying attitudes means among the
types of sales promotion in a recession. The other null hypothesis consisted of
nonexistence of a significant difference in buying attitudes means between customers’
gender in a recession. I collected data from 287 volunteer participants using a
confidential paper-based survey and random sampling method to obtain data for the
analysis.
Utilizing Levene’s test enabled me to conclude the presence of heteroscedasticity.
Statistical tests for the data analysis comprised 4X2 two-way ANOVA and derivative
post hoc using SPSS’s bootstrapping confidence interval procedures. Bootstrapping
procedure allowed for assuring the statistical validity of the conclusions from the post
hoc pairwise comparisons tests. The ANOVA test assisted in assessing an overall mean
difference in buying attitudes among the types of sales promotions and gender of
customers. There was a significant difference in buying attitudes means among the types
of sales promotion. However, there was no significant difference in buying attitudes
means among participants male and female. The post hoc pairwise comparisons were
across the groups of types of sales promotion. Findings enabled the identification of price
discount as the most effective strategy for aligning sales promotions with buying attitudes
in a recession. The implementation of this strategy is of importance for not only
managers, but other stakeholders such as business owners. Implications of this research
for business practice included increasing firms’ sales, market share, and profitability in a
95
recession. Inferences for positive social change comprised improvement of lifestyle of
individuals and reduction of concomitant negative consequences such as crime and
poverty associated with unemployment.
96
References
Abbassi, A., Tamini, L. D., & Gervais, J. (2012). Do inventories have an impact on price
transmission? Evidence from the Canadian chicken industry. Agribusiness, 28,
173-186. doi:10.1002/agr.21292
Agafonov, Y. (2011). Modelling of Baltic supply chain for consumer goods. Journal of
Business Management, 2011, 178-184. Retrieved from
http://www.serialspublications.com/
Alessandria, G., Kaboski, J., & Midrigan, V. (2010). The great trade collapse of 2008-09:
An inventory adjustment? IMF Economic Review, 58, 254-294.
doi:10.1057/imfer.2010.10
Alexy, O., Criscuolo, P., & Salter, A. (2012). Managing unsolicited ideas for R&D.
California Management Review, 54, 116-139. doi:10.1525/cmr.2012.54.3.116
Alrjoub, S., Mohammad, A., Alfawa'reh, S., Hamid, N., Baniatta, A., Mahmoud, H., …
& Akram, M. (2012). The impact of cost and sales trend over the profitability of
Shree Cement Limited, India. European Journal of Economics, Finance &
Administrative Sciences, 48, 104-112. Retrieved from
http://www.europeanjournalofeconomicsfinanceandadministrativesciences.com/
Alrubaiee, L., & Nahla, A. (2010). Investigate the impact of relationship marketing
orientation on customer loyalty: The customer's perspective. International
Journal of Marketing Studies, 2(1), 155-174. Retrieved from http://ccsenet.org
97
Amblee, N., & Bui, T. (2011). Harnessing the influence of social proof in online
shopping: The effect of electronic word of mouth on sales of digital
microproducts. International Journal of Electronic Commerce, 16(2), 91-114.
Retrieved from http://www.mesharpe.com/
Anderson, E., Fong, N., Simester, D., & Tucker, C. (2010). How sales taxes affect
customer and firm behavior: The role of search on the internet. Journal of
Marketing Research, 47, 229-239. doi:10.1509/jmkr.47.2.229
Anglin, P. M., & Wiebe, R. (2013). Pricing in an illiquid real estate market. Journal of
Real Estate Research, 35, 83-102. Retrieved from http://gort.ucsd.edu/
Anyiwe, T. O. (2012). Aligning financial strategy with customer categorization based on
environmental scanning (Doctoral study). Available from ProQuest Dissertations
and Theses database. (UMI No. 1039263877)
Apetroaie, M., Florescu, V., & Ducu, C. (2012). Towards new guidelines within the
management systems-enhancing updates. Global Conference on Business &
Finance Proceedings, 7, 643-648. Retrieved from http://www.theibfr.com
Bakewell, C., & Mitchell, V. W. (2003). Generation Y female consumer decision-making
styles. International Journal of Retail and Distribution Management, 31, 95-106.
doi:10.1108/0959055031046199
Baumgarten, D., Bonenkamp, U., & Homburg, C. (2010). The information content of the
SG&A ratio. Journal of Management Accounting Research, 22, 1-22.
doi:10.2308/jmar.2010.22.1.1
98
Ben-David, I., Franzoni, F., & Moussawi, R. (2012). Hedge fund stock trading in the
financial crisis of 2007–2009. Review of Financial Studies, 25, 1-54. Retrieved
from http://rfs.oxfordjournals.org
Bertilsson, E., Högberg, D., & Hanson, L. (2012). Using experimental design to define
boundary manikins. Work, 41, 4598-4605. Retrieved from http://www.iospress.nl
Bezawada, R., & Pauwels, K. (2013). What is special about marketing organic products?
How organic assortment, price, and promotions drive retailer performance.
Journal of Marketing, 77(1), 31-51. Retrieved from http://www.ama.org
Brown, L. D. (2011). The selected works of George J. Benston: Volume 2, accounting
and finance. Accounting Review, 86, 1843-1846. Retrieved from http://aaahq.org
Bruno, H. A., Hai, C., & Dutta, S. (2012). Role of reference price on price and quantity:
Insights from business-to-business markets. Journal of Marketing Research, 49,
640-654. Retrieved from http://www.ama.org
Bui, M., Krishen, A. S., & Latour, M. S. (2012). When kiosk retailing intimidates
shoppers. Journal of Advertising Research, 52, 346-363. doi:10.2501/JAR-52-3-
346-363
Caliskan Demirag, O. (2011). Optimizing channel profits with threshold incentives and
alternative pricing schemes. International Transactions in Operational Research,
18, 617-646. doi:10.1111/j.1475-3995.2011.00820.x
Che Ahmat, N., Radzi, S., Mohd Zahari, M., Muhammad, R., Aziz, A., & Ahmad, N.
(2011). The effect of factors influencing the perception of price fairness towards
99
customer response behaviors. Journal of Global Management, 2, 22-38. Retrieved
from http://www.globalresearch.com
Chen, H., Marmorstein, H., Tsiros, M., & Rao, A. (2012). When more is less: The impact
of base value neglect on consumer preferences for bonus packs over price
discounts. Journal of Marketing, 76(4), 64-77. doi:10.1509/jm.10.0443
Chou, M. C., Sim, C., Teo, C., & Zheng, H. (2012). Newsvendor pricing problem in a
two-sided market. Production & Operations Management, 21, 204-208.
doi:10.1111/j.1937-5956.2011.01235.x
Činjarević, M., Tatić, K., & Petrić, S. (2011). See it, like it, buy it! Hedonic shopping
motivations and impulse buying. Economic Review: Journal of Economics &
Business/Ekonomska Revija: Casopis Za Ekonomiju I Biznis, 9, 3-15. Retrieved
from http://www.untz.ba
Crocker, P. M. (2012). Relationship between entry-level skills and manager-preferred
skills for business graduates (Doctoral study). Available from ProQuest
Dissertations and Theses database. (UMI No. 1038151336)
Cuellar, S., Noland, M., & Kirkwood, S. (2012). Measuring the effect of promotion in
non-controlled settings: A de-compositional approach. Journal of Strategic
Marketing, 20, 103-111. doi:10.1080/0965254X.2011.581381
Cui, G., Lui, H., & Guo, X. (2012). The effect of online consumer reviews on new
product sales. International Journal of Electronic Commerce, 17(1), 39-58.
doi:10.2753/JEC1086-4415170102
100
Dave, D., & Saffer, H. (2012). Impact of direct-to-consumer advertising on
pharmaceutical prices and demand. Southern Economic Journal, 79, 97-126.
Retrieved from http://journal.southerneconomic.org
Davis, J. (2010). Correlational research methods. Metropolitan State College of Denver.
Retrieved from http://clem.msed.edu/
Draganska, M., & Klapper, D. (2011). Choice set heterogeneity and the role of
advertising: An analysis with micro and macro data. Journal of Marketing
Research, 48, 653-669. doi:10.1509/jmkr.48.4.4653
Dulaney, E. A., & Wiese, M. D. (2011). Factors contributing to the final selling price of
auctioned gift cards. Journal of Internet Commerce, 10, 163-192.
doi:10.1080/15332861.2011.596005
Dzikowska, M., & Jankowska, B. (2012). The global financial crisis of 2008-2009 and
the fortune global 500 corporations. Looking for losers among the biggest -
exploratory study. Poznan University of Economics Review, 12, 99-124. Retrieved
from http://www.puereview.ae.poznan.pl
Eggert, A., & Serdaroglu, M. (2011). Exploring the impact of sales technology on
salesperson performance: A task-based approach. Journal of Marketing Theory
and Practice, 19, 169-185. doi:10.2753/MTP1069-6679190204
Engelen, A. (2011). Which department should have more influence on organization-level
decisions? A strategy-dependent analysis. Journal of Strategic Marketing, 19,
229-254. doi:10.1080/0965254X.2011.557739
101
Erevelles, S., & Fukawa, N. (2013). The role of affect in personal selling and sales
management. Journal of Personal Selling & Sales Management, 33, 7-24.
Retrieved from http://www.tandfonline.com/toc/rpss20/current#.U-4qZ2OrgfQ
Esfahani, A., & Jafarzadeh, M. (2012). Studying impacts of sales promotion on
consumer's psychographic variables (case study: Iranian chain stores at city of
Kerman). Interdisciplinary Journal of Contemporary Research in Business, 3,
1278-1288. Retrieved from http://ijcrb.webs.com
Evans, K. R., McFarland, R. G., Dietz, B., & Jaramillo, F. (2012). Advancing sales
performance research: A focus on five under-researched topic areas. Journal of
Personal Selling & Sales Management, 32, 89-106. Retrieved from
http://mkt.cba.cmich.edu/
Faul, F., Erdfelder, E., Lang, A.-G., & Buchner, A. (2007). G*Power 3: A flexible
statistical power analysis program for the social, behavioral, and biomedical
sciences. Behavior Research Methods, 39, 175-191. Retrieved from
http://www.springer.com/psychology/cognitive+psychology/journal/13428
Fazlzadeh, A., Mohammadi, P., & Sepehrfar, A. (2011). How agency-theoretic factors
affect the delegation of pricing authority to the sales force: An empirical study.
International Journal of Marketing Studies, 3(1), 66-77. Retrieved from
http://ccsenet.org
102
Felgate, M., Fearne, A., Di Falco, S., & Garcia Martinez, M. (2012). Using supermarket
loyalty card data to analyze the impact of promotions. International Journal of
Market Research, 54, 221-240. doi:10.2501/IJMR-54-2-221-240
Ferrer, R., & Mallari, N. C. (2011). Speculative and pure risks: Their impact on firms’
earning per share. Journal of International Business Research, 10(1), 115-136.
Retrieved from
http://www.alliedacademies.org/Public/Journals/JournalDetails.aspx?jid=15
Field, A. (2013). Discovering statistics using IBM SPSS statistics (4th ed.). Thousand
Oaks, CA: Sage Publications, Inc.
Fowler, F. J. (2002). Survey research methods (3rd ed.). Thousand Oaks, CA: Sage
Publications, Inc.
Frischmann, T., & Gensler, S. (2011). Influence of perceptual metrics on customer
profitability: The mediating effect of behavioral metrics. Journal of Financial
Services Marketing, 16, 14-26. doi:10.1057/fsm.2011.4
Gelo, O., Brankman, D., & Benetka, G. (2008). Quantitative and qualitative research:
Beyond the debate. Integrative Psychological & Behavioral Science, 42, 266–
290. doi:10.1007/s12124-008-9078-3
Ghani, U., & Kamal, Y. (2010). The impact of in-store stimuli on the impulse purchase
behavior of consumers in Pakistan. Interdisciplinary Journal of Contemporary
Research in Business, 2, 155-162. Retrieved from http://ijcrb.webs.com
103
Gherasim, T. (2012). Sales promotion. Economy Transdisciplinarity Cognition, 15, 186-
190. Retrieved from http://www.ugb.ro
Green, S. B., & Salkind, N. J. (2010). Using SPSS for Windows and Macintosh:
Analyzing and understanding data. Upper Saddle River, NJ: Prentice Hall Press.
Gunny, K. A. (2010). The relation between earnings management using real activities
manipulation and future performance: Evidence from meeting earnings
benchmarks. Contemporary Accounting Research, 27, 855-888.
doi:10.1111/j.1911-3846.2010.01029.x
Harvard Business Essentials. (2005). Strategy: Create and implement the best strategy
for your business. Boston, MA: Author.
Harvey, B., Herbig, T., Keylock, M., Aggarwal, R., & Lerner, N. (2012). Exploding the
legend of TV advertising and price promotions. Journal of Advertising Research,
52, 339-345. doi:10.2501/JAR-52-3-339-345 S
He, X., Krishnamoorthy, A., Prasad, A., & Sethi, S. P. (2012). Co-Op advertising in
dynamic retail oligopolies. Decision Sciences, 43, 73-106. doi:10.1111/j.1540-
5915.2011.00336.x
Hiraide, N., & Chakraborty, K. (2012). Surviving the global recession and the demand
for auto industry in the U.S. - A case for Ford Motor Company. International
Journal of Economics & Finance, 4(5), 85-93. doi:10.5539/ijef.v4n5p85
104
Homburg, C., Jensen, O., & Hahn, A. (2012). How to organize pricing? Vertical
delegation and horizontal dispersion of pricing authority. Journal of Marketing,
76(5), 49-69. doi:10.1509/jm.11.0251
Hsu, S. (2012). The increasing virulence of man-made crises: Financial crises and global
instability. Journal of Economic Issues, 46, 491-498. doi:10.2753/JEI0021-
3624460224
Hui, E., Wong, J. Y., & Wong, K. T. (2012). Marketing time and pricing strategies.
Journal of Real Estate Research, 34, 375-398. Retrieved from
http://aux.zicklin.baruch.cuny.edu/jrer/
Hui, S. K., Inman, J., Yanliu, H., & Suher, J. (2013). The effect of in-store travel distance
on unplanned spending: Applications to mobile promotion strategies. Journal of
Marketing, 77(2), 1-16. Retrieved from
https://www.ama.org/publications/JournalOfMarketing/Pages/Current-Issue.aspx
Hultman, M., Katsikeas, C., & Robson, M. (2011). Export promotion strategy and
performance: The role of international experience. Journal of International
Marketing, 19(4), 17-39. doi:10.1509/jim.11.0022
Jasmand, C., Blazevic, V., & de Ruyter, K. (2012). Generating sales while providing
service: A study of customer service representatives' ambidextrous behavior.
Journal of Marketing, 76(1), 20-37. doi:10.1509/jm.10.0448
105
Jazayeri, A., & Jazayeri, N. (2011). The effects of price elasticity dynamics on a firm's
profit. Iranian Journal of Management Studies, 4, 101-114. Retrieved from
http://www.ijms.ir
Johnson, R. B., & Christensen, L. B. (2007). Educational research: Quantitative,
qualitative, and mixed approaches (3rd ed.). Thousand Oaks, CA: Sage
Publications, Inc.
Kadam, P., & Bhalerao, S. (2010). Sample size calculation. International Journal of
Ayurveda Research, 1, 55-57 doi:10.4103/0974-7788.59946
Kanagal, N. (2013). Promotions as market transactions. Journal of Management &
Marketing Research, 13, 1-13. Retrieved from http://www.aabri.com
Khan, M., & Dost, Z. (2011). Rationale and proclivity of sales promotion influencing the
impulsive buying behavior of the customers: An experimental study on cellular
service providers in Pakistan. Interdisciplinary Journal of Contemporary
Research in Business, 3, 346-362. Retrieved from http://ijcrb.webs.com
Kim, H. (2013). How variety-seeking versus inertial tendency influences the
effectiveness of immediate versus delayed promotions. Journal of Marketing
Research, 50, 416-426. doi:10.1509/jmr.12.0011
Kotler, P. (2011). Reinventing marketing to manage the environmental imperative.
Journal of Marketing, 75(4), 132-135. doi:10.1509/jmkg.75.4.132
Kuksov, D., & Ying, X. (2012). Competition in a status goods market. Journal of
Marketing Research, 49, 609-623. Retrieved from http://www.ama.org
106
Kumar, A., & Kumar, S. (2011). Strategic cost management-suggested framework for
21st century. Journal of Business & Retail Management Research, 5(2), 118-130.
Retrieved from http://www.abrmr.com
Kwanho, S., Jiheon, L., & Lichtenstein, D. R. (2012). The influence of price presentation
order on consumer choice. Journal of Marketing Research, 49, 708-717.
Retrieved from http://www.ama.org
Langerak, F., Griffin, A., & Hultink, E. J. (2010). Balancing development costs and sales
to optimize the development time of product line additions. Journal of Product
Innovation Management, 27, 336-348. doi:10.1111/j.1540-5885.2010.00720.x
Laran, J., & Tsiros, M. (2013). An investigation of the effectiveness of uncertainty in
marketing promotions involving free gifts. Journal of Marketing, 77(2), 112-123.
Retrieved from http://www.ama.org
Leeflang, P., & Parreño-Selva, J. (2012). Cross-category demand effects of price
promotions. Academy of Marketing Science. Journal, 40, 572-586.
doi:10.1007/s11747-010-0244-z
Lei, J., Dawar, N., & Gürhan-Canli, Z. (2012). Base-rate information in consumer
attributions of product-harm crises. Journal of Marketing Research, 49, 336-348.
doi:10.1509/jmr.10.0197
Levchenko, A., Lewis, L., & Tesar, L. (2010). The collapse of international trade during
the 2008-09 crisis: In search of the smoking gun. IMF Economic Review, 58, 214-
253. doi:10.1057/imfer.2010.11
107
Lickus, P. (2012). Two-sided market effect in Lithuanian mobile communications
market. Engineering Economics, 23, 83-89. Retrieved from
http://www.ktu.lt/en/inzeko
Lin, M., Ke, X., & Whinston, A. B. (2012). Vertical differentiation and a comparison of
online advertising models. Journal of Management Information Systems, 29, 195-
236. Retrieved from http://www.mesharpe.com/
Lin, T., Cheng, H., Wang, F., & Chang, K. (2012). A study of online auction sellers'
intention to switch platform: The case of Yahoo!Kimo versus Ruten_eBay*.
Decision Sciences, 43, 241-272. doi:10.1111/j.1540-5915.2011.00347.x
Liu, T., Cheng, T., & Ni, F. (2011). How consumers respond to the behavior of missing a
free gift promotion: Inaction inertia effect on products offered as free gifts.
Journal of Social Psychology, 151, 361-381. doi:10.1080/00224545.2010.483698
Liu-Thompkins, Y., & Tam, L. (2013). Not all repeat customers are the same: Designing
effective cross-selling promotion on the basis of attitudinal loyalty and habit.
Journal of Marketing, 77(5), 21-36. Retrieved from http://www.ama.org
Lowe, B., & Barnes, B. R. (2012). Consumer perceptions of monetary and non-monetary
introductory promotions for new products. Journal of Marketing Management,
28(5/6), 629-651. doi:10.1080/0267257X.2011.560889
Malik, G., & Guptha, C. (2013). Impact of promotional campaigns featuring kids on the
purchase behavior of customers. IUP Journal of Marketing Management, 12(1),
43-58. Retrieved from http://www.iupindia.in
108
Manning, S., & Sydow, J. (2011). Projects, paths, and practices: Sustaining and
leveraging project-based relationships. Industrial and Corporate Change, 20,
1369-1402. doi:10.1093/icc/dtr009
Marshall, G. W., Moncrief, W. C., Rudd, J. M., & Lee, N. (2012). Revolution in sales:
The impact of social media and related technology on the selling environment.
Journal of Personal Selling and Sales Management, 32, 349-363.
doi:10.2753/PSS0885-3134320305
May, J., Joshi, N. N., & Nair, R. (2012). Application of design simulation and
experimental design methodologies to the study of coronary stent designs.
Computer-Aided Design & Applications, 9, 439-455.
doi:10.3722/cadaps.2012.439-455
Mcshane, B., Bradlow, E., & Berger, J. (2012). Visual influence and social groups.
Journal of Marketing Research, 49, 854-871. doi:10.1509/jmr.11.0223
Melnik, M. I. (2011). Listing fees and their role on eBay: Evidence from a natural
experiment. Journal of Internet Commerce, 10, 270-290.
doi:10.1080/15332861.2011.622695
Melnik, M. I., Richardson, P., & Tompkins, D. (2011). How seller and product
characteristics impact promotion on eBay. Journal of Promotion Management,
17, 426-437. doi:10.1080/10496491.2011.597317
109
Merle, A., Senecal, S., & St-Onge, A. (2012). Whether and how virtual try-on influences
consumer responses to an apparel web site. International Journal of Electronic
Commerce, 16(3), 41-64. Retrieved from http://www.mesharpe.com/
Miles, K. J. (2013). Exploring factors required for small business success in the 21st
century (Doctoral Study). Available from ProQuest Dissertations and Theses
database. (UMI No. 1355759716)
Milić, T. (2011). Cost reduction in the time of crisis. Management, 6(1), 64-71. Retrieved
from http://management.fon.rs
Mir, I., & Rehman, K. (2012). Two wing models of sales promotion: Theorization and
examination. Journal of Economics & Behavioral Studies, 4, 12-25. Retrieved
from http://www.ifrnd.org
Mishra, A., & Mishra, H. (2011). The influence of price discount versus bonus pack on
the preference for virtue and vice foods. Journal of Marketing Research, 48, 196-
206. doi:10.1509/jmkr.48.1.196
Mishra, H., & Jain, D. (2012). Impact of packaging in consumer decision making process
of Namkeen products. Journal of Marketing & Communication, 7, 48-63.
Retrieved from http://www.niilm.com
Mithas, S., Tafti, A., Bardhan, I., & Goh, J. M. (2011). Information technology and firm
profitability: Mechanisms and empirical evidence. MIS Quarterly, 36, 205-224.
Retrieved from gttp://www.misq.org
110
Mitran, P., & Bebeselea, M. (2012). About the crisis marketing and the crisis of
marketing. Economics, Management & Financial Markets, 7, 660-665. Retrieved
from http://www.addletonacademicpublishers.com
Monahan, M., Shah, A., & Mattare, M. (2011). The road ahead: Micro enterprise
perspectives on success and challenge factors. Journal of Management Policy &
Practice, 12, 113-125. Retrieved from http://www.na-businesspress.com
Nadeem, M. (2012). Returning customer: Was that a planned purchase? Skyline Business
Journal, 7, 11-17. Retrieved from http://www.skylineuniversity.com
Niu, R. H., Zhao, X., Castillo, I., & Joro, T. (2012). Pricing and inventory strategies for a
two-stage dual-channel supply chain. Asia-Pacific Journal of Operational
Research, 29, 1240004-1-1240004-38. Retrieved from
http://www.worldscinet.com/
Nwielaghi Michael, B. B., & Ogwo, E. E. (2013). Trade sales promotion strategies and
marketing performance in the soft drink industries in Nigeria. International
Journal of Marketing Studies, 5(4), 96-109. doi:10.5539/ijms.v5n4p96
Obadia, C. (2013). Competitive export pricing: The influence of the information context.
Journal of International Marketing, 21(2), 62-78. Retrieved from
http://www.ama.org
Oestreicher-Singer, G., Libai, B., Sivan, L., Carmi, E., & Yassin, C. (2013). The network
value of products. Journal of Marketing, 77(3), 1-14. Retrieved from
http://www.ama.org

111
Onditi, A. (2012). An evaluation of promotional elements influencing sales of an
organization: A case study of sales of agricultural and non-agricultural products
among women groups, Homa-Bay District, Kenya. International Journal of
Business & Social Sciences, 3(5), 296-313. Retrieved from http://ijbssnet.com
Osman, S., & Fah, B. (2011). Simulation of sales promotions towards buying behavior
among university students. International Journal of Marketing Studies, 3(3), 78-
88. doi:10.5539/ijms.v3n3p78
Pathak, B., Garfinkel, R., Gopal, R. D., Venkatesan, R., & Yin, F. (2010). Empirical
analysis of the impact of recommender systems on sales. Journal of Management
Information Systems, 27, 159-188. doi:10.2753/MIS0742-1222270205
Puig-Junoy, J. (2010). Impact of European pharmaceutical price regulation on generic
price competition. PharmacoEconomics, 28, 649-63. doi:10.2165/11535360-
000000000-00000
Rahutami, A., & Kekalih, W. (2011). Strengthening the domestic market or searching
export opportunities: A dilemma resulted from the impact of ACFTA on small
and medium enterprises. China-USA Business Review, 10, 802-815. Retrieved
from http://www.usa-review.org
Ramanathan, S., & Dhar, S. (2010). The effect of sales promotions on the size and
composition of the shopping basket: Regulatory compatibility from framing and
temporal restrictions. Journal of Marketing Research, 47, 542-552.
doi:10.1509/jmkr.47.3.542
112
Ramanathan, S., & Dhar, S. K. (2013). Buy one, get one free: How framing sales
promotions affects the whole shopping basket. Gfk-Marketing Intelligence
Review, 5, 49-52. Retrieved from http://www.gfkmir.com
Rajput, A., Kalhoro, S., & Wasif, R. (2012). Impact of product price and quality on
consumer buying behavior: Evidence from Pakistan. Interdisciplinary Journal of
Contemporary Research in Business, 4, 485-496. Retrieved from
http://ijcrb.webs.com
Ray, S., Wood, C. A., & Messinger, P. R. (2012). Multicomponent systems pricing:
Rational inattention and downward rigidities. Journal of Marketing, 76(5), 1-17.
Retrieved from http://www.ama.org
Rodriguez Jaime, L. F. (2013). Student acceptance of online enrollment processes in a
higher education institution (Dissertation). Available from ProQuest Dissertations
and Theses database. (UMI No. 1435602533)
Roy, A., & Raju, J. (2011). The influence of demand factors on dynamic competitive
pricing strategy: An empirical study. Marketing Letters, 22, 259-281.
doi:10.1007/s11002-010-9124-z
Samper, A., & Schwartz, J. A. (2013). Price inferences for sacred versus secular goods:
Changing the price of medicine influences perceived health risk. Journal of
Consumer Research, 39, 1343-1358. doi:10.1086/668639
113
Sardar, S., Rehman, A., Yousaf, U., & Aijaz, A. (2011). Impact of HR practices on
employee engagement in banking sector of Pakistan. Interdisciplinary Journal of
Contemporary Research in Business, 2, 378-389. Retrieved from ijcrb.webs.com
Serviere-Munoz, L., & Mallin, M. L. (2013). How do unethical salespeople sleep at
night? The role of neutralizations in the justification of unethical sales intentions.
Journal of Personal Selling & Sales Management, 33, 289-306.
doi:10.2753/PSS0885-3134330304
Shaharudin, M., Hassan, A., Salleh, M., Ali, S., Harun, E., Jalil, M., & Aziz, N. (2011).
The relationship between extrinsic and intrinsic attributes of product quality with
brand loyalty on Malaysia national brand motorcycle/scooter, MODENAS.
Interdisciplinary Journal of Contemporary Research in Business, 2, 135-149.
Retrieved from http://ijcrb.webs.com
Shahhosseini, A., & Ardahaey, F. (2011). Marketing mix practices in the cultural
industry. International Journal of Business & Management, 6(8), 230-234.
doi:10.5539/ijbm.v6n8p230
Shapiro, S. L., DeSchriver, T., & Rascher, D. A. (2012). Factors affecting the price of
luxury suites in major north American sports facilities. Journal of Sport
Management, 26, 249-257. Retrieved from http://www.humankinetics.com
Shapiro, S. L., & Drayer, J. (2012). A new age of demand-based pricing: An examination
of dynamic ticket pricing and secondary market prices in major league baseball.
114
Journal of Sport Management, 26, 532-546. Retrieved from
http://journals.humankinetics.com/jsm
Shrestha, B. (2012). Consumers' responses to sales promotions of fast moving consumer
goods in Nepal. Business Perspectives & Research, 10(2), 13-24. Retrieved from
http://www.somaiya.edu
Shuval, K., Harker, K., Roudsari, B., Groce, N. E., Mills, B., Siddiqi, Z., & Shachak, A.
(2011). Is qualitative research second class science? A quantitative longitudinal
examination of qualitative research in medical journals. PLoS One, 6(2), 1-6.
doi:10.1371/journal.pone.0016937
Skarzauskiene, A. (2010). Managing complexity: System thinking as a catalyst of the
organization performance. Measuring Business Excellence, 14(4), 49-64.
doi:10.1108/13683041011093758
Słysz, A., & Soroko, E. (2012). A scientific journey on experiencing qualitative research.
Baltic Journal of Psychology, 13(1), 36-44. Retrieved from
http://www.lu.lv/apgads/izdevumi/elektroniskie-izdevumi
Song, I. (2011). Empirical investigation on the determinants of retail prices. Seoul
Journal of Business, 17(1), 137-153. Retrieved from http://www.useoul.edu
Spiegel, M. R., Schiller, J. J., & Srinivasan, R. A. (2012). Probability and statistics. New
York, NY: McGraw Hill.
115
Stanton, R., & Wallace, N. (2011). The bear's lair: Index credit default swaps and the
subprime mortgage crisis. Review of Financial Studies, 24, 3250-3280.
doi:10.1093/rfs/hhr073
Streiner, D.L. (2003). Unicorns do exist: A tutorial for proving the null hypothesis.
Canadian Journal of Psychiatry, 48, 756-761. Retrieved from
http://www.ncbi.nlm.nih.gov/
Suresh, A. (2012). An analytical perspective of global melt down vis-a-vis perceptible
escalation in gold price with special reference to India. Journal of Finance,
Accounting & Management, 3(2), 79-95. Retrieved from http://gsmi-usa.com
Turki, M., & Kammoun, M. (2013). The impact of the sales promotion on the
distributors' performance. Case of three companies from the Maghreb. Revue Des
Sciences De Gestion, 48(261/262), 14-15. Retrieved from http://www.larsg-
revue.com
U.S. Census Bureau. (2012). The Statistics Abstracts. Retrieved from
https://www.census.gov/
Van Heerde , H. J., Gusenberg, M. J., Dekimpe, M. G., & Steenkamp, J. M. (2013). Price
and advertising effectiveness over the business cycle. Journal of Marketing
Research, 50, 177-193. Retrieved from http://www.ama.org
Vergne, J. P. (2011). Stigmatized categories and public disapproval of organizations: A
mixed methods study of the global arms industry (1996–2007). Academy of
Management Journal, 55, 1027-1052. doi:10.5465/amj.2010.0599
116
Volpe, R. J., & Li, C. (2012). On the frequency, depth, and duration of sales at high-low
pricing supermarkets. Agribusiness, 28, 222-238. doi:10.1002/agr.21289
Vyas, H. D. (2011). Consumer purchase of consumer durables: A factorial study. Journal
of Marketing & Communication, 7, 38-43. Retrieved from http://www.niilm.com
Waples, C. J., Weyhrauch, W. S., Cornell, A. R., & Culbertson, S. S. (2010).
Questionable defeats and discounted victories for Likert-type rating scales.
Industrial and Organizational Psychology, 3, 477–480. doi:10.1111/j.1754-
9434.2010.01274.x
Watrous-Kelley, T. (2012). Financial performance of logistics divisions in three small
international companies. (Doctoral study). Available from ProQuest Dissertations
and Theses database. (UMI No. 1033213458)
Wikman, A. (2006). Reliability, validity and true values in surveys. Social Indicators
Research, 78, 85–110. doi:10.1007/s11205-005-5372-3
Williams, I. B. (2011). Using differentiated instruction as a strategy to improve
mathematics performance of eighth-grade students (Doctoral study). Available
from ProQuest Dissertations and Theses database. (UMI No. 915708375)
Winterich, K., & Barone, M. (2011). Warm glow or cold, hard cash? Social identify
effects on consumer choice for donation versus discount promotions. Journal of
Marketing Research, 48, 855-868. doi:10.1509/jmkr.48.5.855
Wu, S., & Chen, G. (2012). How does price-sales correlation affect vertical restraints?
Journal of Management Research, 4, 72-80. doi:10.5296/jmr.v4i4.1921
117
Yi, Y., & Yoo, J. (2011). The long-term effects of sales promotions on brand attitude
across monetary and non-monetary promotions. Psychology & Marketing, 28,
879-896. doi:10.1002/mar.20416
Yin, R. K. (2014). Case study research: Design and methods (5th ed.). Thousand Oaks,
CA: Sage Publications, Inc.
Yukl, G. George, J. M., & Jones, G. R. (2010). Leadership: Building sustainable
organizations (Laureate Education, Inc. custom. ed). New York, NY: Custom
Publishing.
Zebra Rizvi, S., Malik, S., & Batul Zaidi, S. (2012). Short term and long term impact of
sales promotion on organizations' profitability: A comparative study between
convenience and shopping goods. International Journal of Business &
Management, 7(5), 247-255. doi:10.5539/ijbm.v7n5p247
Zhang, H., & Zaric, G. S. (2011). Promotion and leakage under a pharmaceutical price-
volume agreement. Infor, 49, 247-253. Retrieved from
http://www.utpjournals.com
Zhang, J., & Breugelmans, E. (2012). The impact of an item-based loyalty program on
consumer purchase behavior. Journal of Marketing Research, 49, 50-65.
doi:10.1509/jmr.09.0211

118
Appendix A: List of Demographic and Survey Questions
List of Statements
A-Demographic Statements
1- Gender:
Female Male
2- Age:
18 - 24 years old 25 – 44 years old 45 – 59 years old 60 years and older
3- Race:
White Black or African American American Indian or Alaska Native
Asian Native Hawaiian and Other Pacific Islander
Some Other Race
4- Marital Status
Single (never married) Married Cohabiting Separated
Divorced Widowed Not Stated
5- Employment Situation:
Employed Unemployed Student
5- Family Monthly income:
Under or $19,999 $20,000 – $29,999 $30,000 – $39,999 $40,000 – $59,999
$60,000 – $79,999 $80,000 – $99,999 $100,000 – $249,999
$250,000 or over
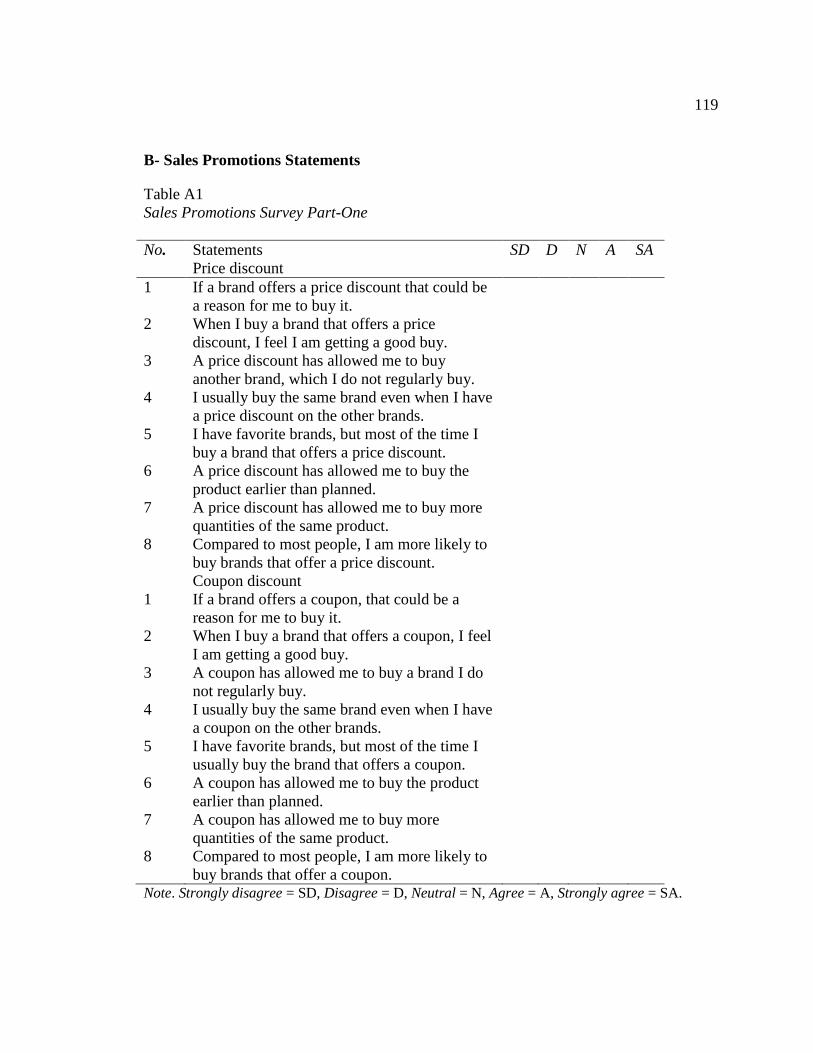
119
B- Sales Promotions Statements
Table A1
Sales Promotions Survey Part-One
No. Statements SD D N A SA
Price discount
1 If a brand offers a price discount that could be
a reason for me to buy it.
2 When I buy a brand that offers a price
discount, I feel I am getting a good buy.
3 A price discount has allowed me to buy
another brand, which I do not regularly buy.
4 I usually buy the same brand even when I have
a price discount on the other brands.
5 I have favorite brands, but most of the time I
buy a brand that offers a price discount.
6 A price discount has allowed me to buy the
product earlier than planned.
7 A price discount has allowed me to buy more
quantities of the same product.
8 Compared to most people, I am more likely to
buy brands that offer a price discount.
Coupon discount
1 If a brand offers a coupon, that could be a
reason for me to buy it.
2 When I buy a brand that offers a coupon, I feel
I am getting a good buy.
3 A coupon has allowed me to buy a brand I do
not regularly buy.
4 I usually buy the same brand even when I have
a coupon on the other brands.
5 I have favorite brands, but most of the time I
usually buy the brand that offers a coupon.
6 A coupon has allowed me to buy the product
earlier than planned.
7 A coupon has allowed me to buy more
quantities of the same product.
8 Compared to most people, I am more likely to
buy brands that offer a coupon.
Note. Strongly disagree = SD, Disagree = D, Neutral = N, Agree = A, Strongly agree = SA.

120
Table A2
Sales Promotions Survey Part-Two
No. Statements SD D N A SA
Buy-one-get-one-free (B1G1F)
1 If a brand offers (B1G1F), that could be a
reason for me to buy it.
2 When I buy a brand that offers (B1G1F), I feel
I am getting a good buy.
3 (B1G1F) has allowed me to buy another brand,
which I do not regularly buy.
4 I usually buy the same brand even when I have
(B1G1F) on the other brands.
5 I have favorite brands, but most of the time I
buy a brand that offers B1G1F
6 B1G1F allows me to buy the product earlier
than planned.
7 B1G1F allows me to buy more quantities of
the same product.
8 Compared to most people, I am more likely to
buy brands that offer B1G1F.
Note. Strongly disagree = SD, Disagree = D, Neutral = N, Agree = A, Strongly agree = SA.
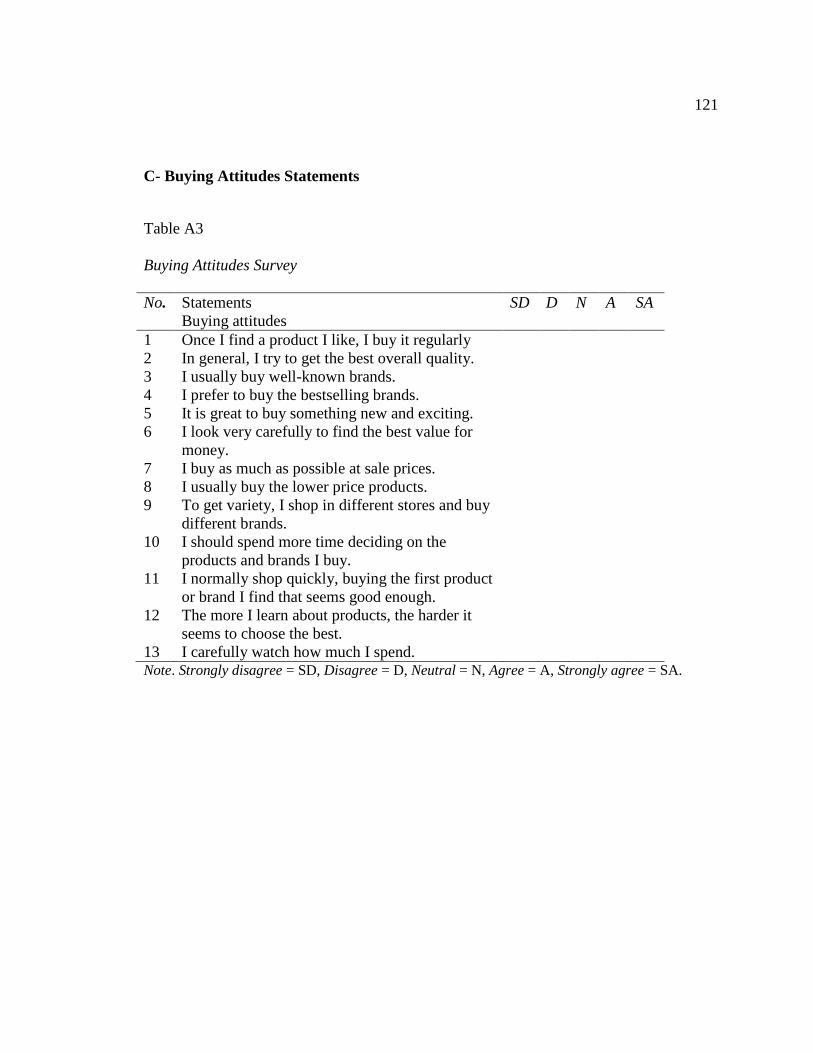
121
C- Buying Attitudes Statements
Table A3
Buying Attitudes Survey
No. Statements SD D N A SA
Buying attitudes
1 Once I find a product I like, I buy it regularly
2 In general, I try to get the best overall quality.
3 I usually buy well-known brands.
4 I prefer to buy the bestselling brands.
5 It is great to buy something new and exciting.
6 I look very carefully to find the best value for
money.
7 I buy as much as possible at sale prices.
8 I usually buy the lower price products.
9 To get variety, I shop in different stores and buy
different brands.
10 I should spend more time deciding on the
products and brands I buy.
11 I normally shop quickly, buying the first product
or brand I find that seems good enough.
12 The more I learn about products, the harder it
seems to choose the best.
13 I carefully watch how much I spend. Note. Strongly disagree = SD, Disagree = D, Neutral = N, Agree = A, Strongly agree = SA.
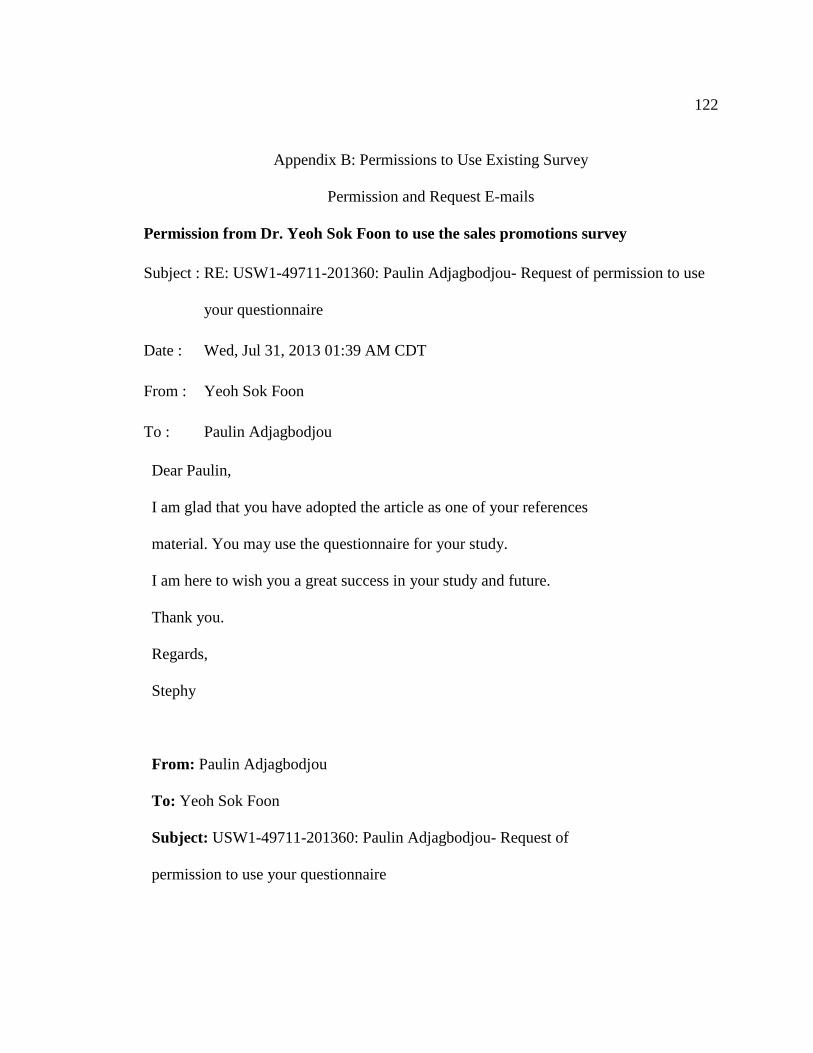
122
Appendix B: Permissions to Use Existing Survey
Permission and Request E-mails
Permission from Dr. Yeoh Sok Foon to use the sales promotions survey
Subject : RE: USW1-49711-201360: Paulin Adjagbodjou- Request of permission to use
your questionnaire
Date : Wed, Jul 31, 2013 01:39 AM CDT
From : Yeoh Sok Foon
To : Paulin Adjagbodjou
Dear Paulin,
I am glad that you have adopted the article as one of your references
material. You may use the questionnaire for your study.
I am here to wish you a great success in your study and future.
Thank you.
Regards,
Stephy
From: Paulin Adjagbodjou
To: Yeoh Sok Foon
Subject: USW1-49711-201360: Paulin Adjagbodjou- Request of
permission to use your questionnaire
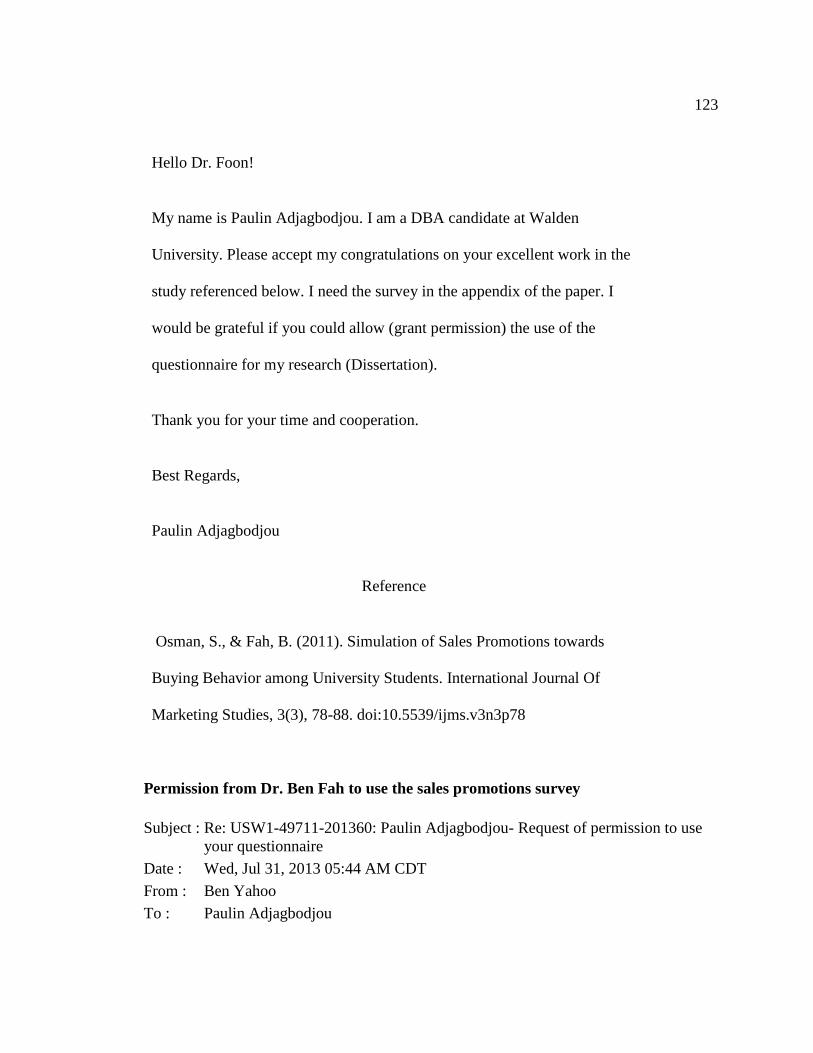
123
Hello Dr. Foon!
My name is Paulin Adjagbodjou. I am a DBA candidate at Walden
University. Please accept my congratulations on your excellent work in the
study referenced below. I need the survey in the appendix of the paper. I
would be grateful if you could allow (grant permission) the use of the
questionnaire for my research (Dissertation).
Thank you for your time and cooperation.
Best Regards,
Paulin Adjagbodjou
Reference
Osman, S., & Fah, B. (2011). Simulation of Sales Promotions towards
Buying Behavior among University Students. International Journal Of
Marketing Studies, 3(3), 78-88. doi:10.5539/ijms.v3n3p78
Permission from Dr. Ben Fah to use the sales promotions survey
Subject : Re: USW1-49711-201360: Paulin Adjagbodjou- Request of permission to use
your questionnaire
Date : Wed, Jul 31, 2013 05:44 AM CDT
From : Ben Yahoo
To : Paulin Adjagbodjou
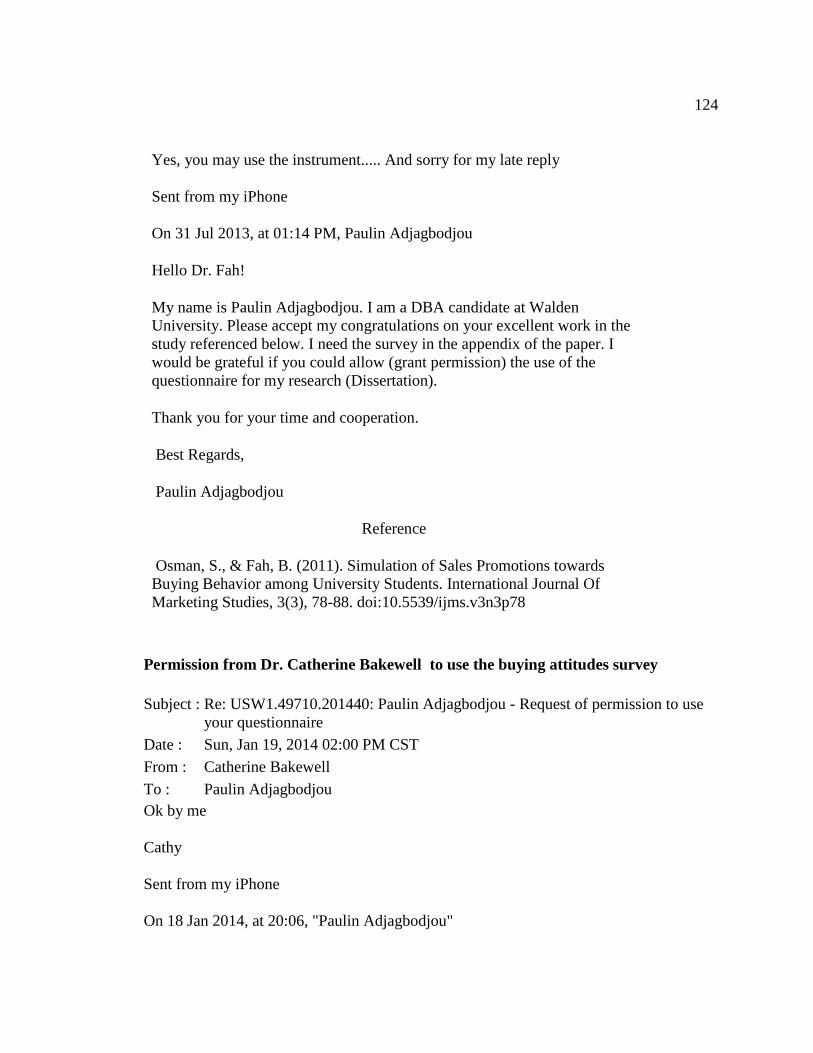
124
Yes, you may use the instrument..... And sorry for my late reply
Sent from my iPhone
On 31 Jul 2013, at 01:14 PM, Paulin Adjagbodjou
Hello Dr. Fah!
My name is Paulin Adjagbodjou. I am a DBA candidate at Walden
University. Please accept my congratulations on your excellent work in the
study referenced below. I need the survey in the appendix of the paper. I
would be grateful if you could allow (grant permission) the use of the
questionnaire for my research (Dissertation).
Thank you for your time and cooperation.
Best Regards,
Paulin Adjagbodjou
Reference
Osman, S., & Fah, B. (2011). Simulation of Sales Promotions towards
Buying Behavior among University Students. International Journal Of
Marketing Studies, 3(3), 78-88. doi:10.5539/ijms.v3n3p78
Permission from Dr. Catherine Bakewell to use the buying attitudes survey
Subject : Re: USW1.49710.201440: Paulin Adjagbodjou - Request of permission to use
your questionnaire
Date : Sun, Jan 19, 2014 02:00 PM CST
From : Catherine Bakewell
To : Paulin Adjagbodjou
Ok by me
Cathy
Sent from my iPhone
On 18 Jan 2014, at 20:06, "Paulin Adjagbodjou"
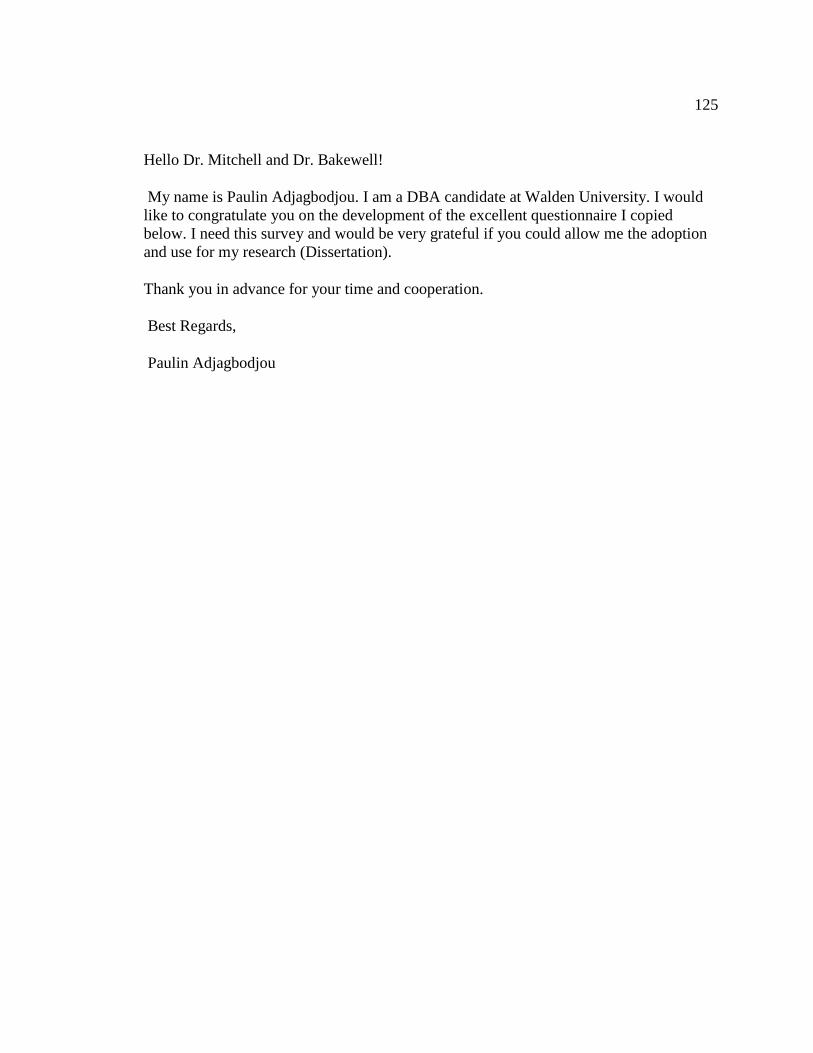
125
Hello Dr. Mitchell and Dr. Bakewell!
My name is Paulin Adjagbodjou. I am a DBA candidate at Walden University. I would
like to congratulate you on the development of the excellent questionnaire I copied
below. I need this survey and would be very grateful if you could allow me the adoption
and use for my research (Dissertation).
Thank you in advance for your time and cooperation.
Best Regards,
Paulin Adjagbodjou

126
Table B1
Statements Part-One
No. Statements SD D A SA
N(%) N(%) N(%) N(%)
1 Once I find a product I like, I buy it
regularly
2 In general, I try to get the best overall
quality.
3 I usually buy well-known brands.
4 I prefer buy the bestselling brands.
5 It is funny to buy something new and
exciting.
6 I look very carefully to find the best
value for money.
7 I buy as much as possible at sale prices.
8 I usually buy the lower price products.
9 To get variety, I shop in different stores
and buy different brands.
10 I should spend more time deciding on
the products and brands I buy.
11 I normally shop quickly, buying the
first product or brand I find that seems
good enough.
12 The more I learn about products, the
harder it seems to choose the best.
13 I carefully watch how much I spend.
Note: Strongly disagree = SD, Disagree = D, Agree = A, Strongly agree = SA
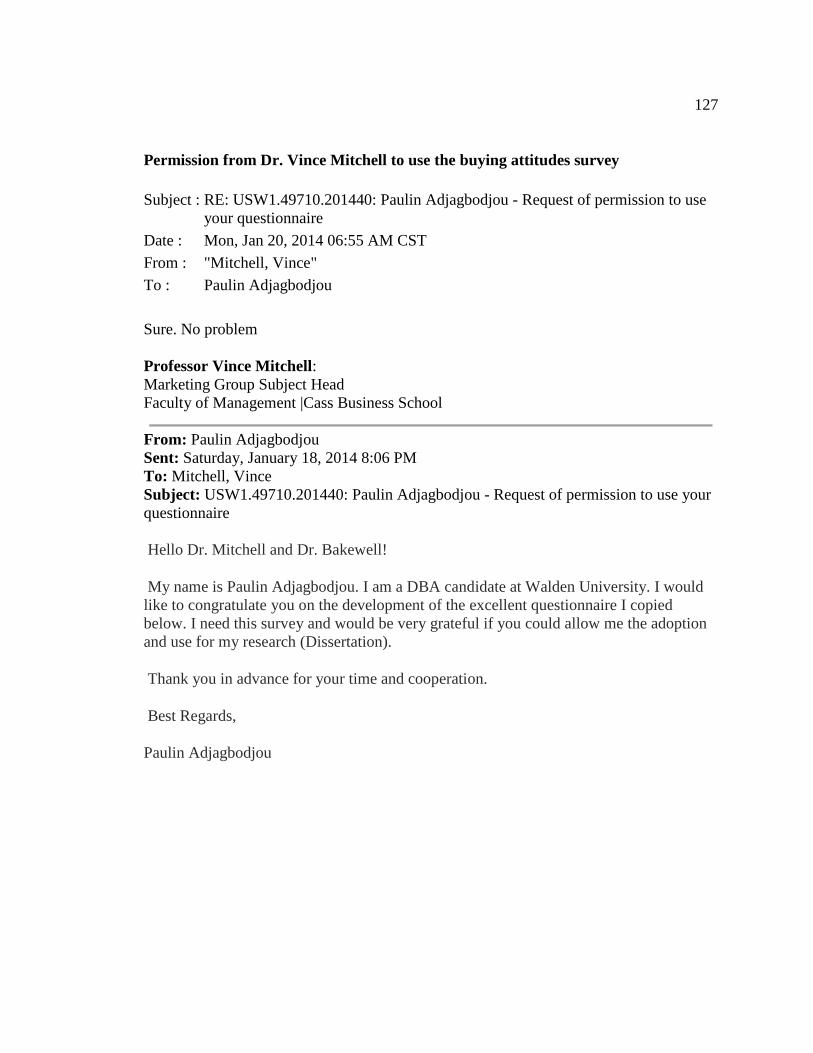
127
Permission from Dr. Vince Mitchell to use the buying attitudes survey
Subject : RE: USW1.49710.201440: Paulin Adjagbodjou - Request of permission to use
your questionnaire
Date : Mon, Jan 20, 2014 06:55 AM CST
From : "Mitchell, Vince"
To : Paulin Adjagbodjou
Sure. No problem
Professor Vince Mitchell:
Marketing Group Subject Head
Faculty of Management |Cass Business School
From: Paulin Adjagbodjou
Sent: Saturday, January 18, 2014 8:06 PM
To: Mitchell, Vince
Subject: USW1.49710.201440: Paulin Adjagbodjou - Request of permission to use your
questionnaire
Hello Dr. Mitchell and Dr. Bakewell!
My name is Paulin Adjagbodjou. I am a DBA candidate at Walden University. I would
like to congratulate you on the development of the excellent questionnaire I copied
below. I need this survey and would be very grateful if you could allow me the adoption
and use for my research (Dissertation).
Thank you in advance for your time and cooperation.
Best Regards,
Paulin Adjagbodjou
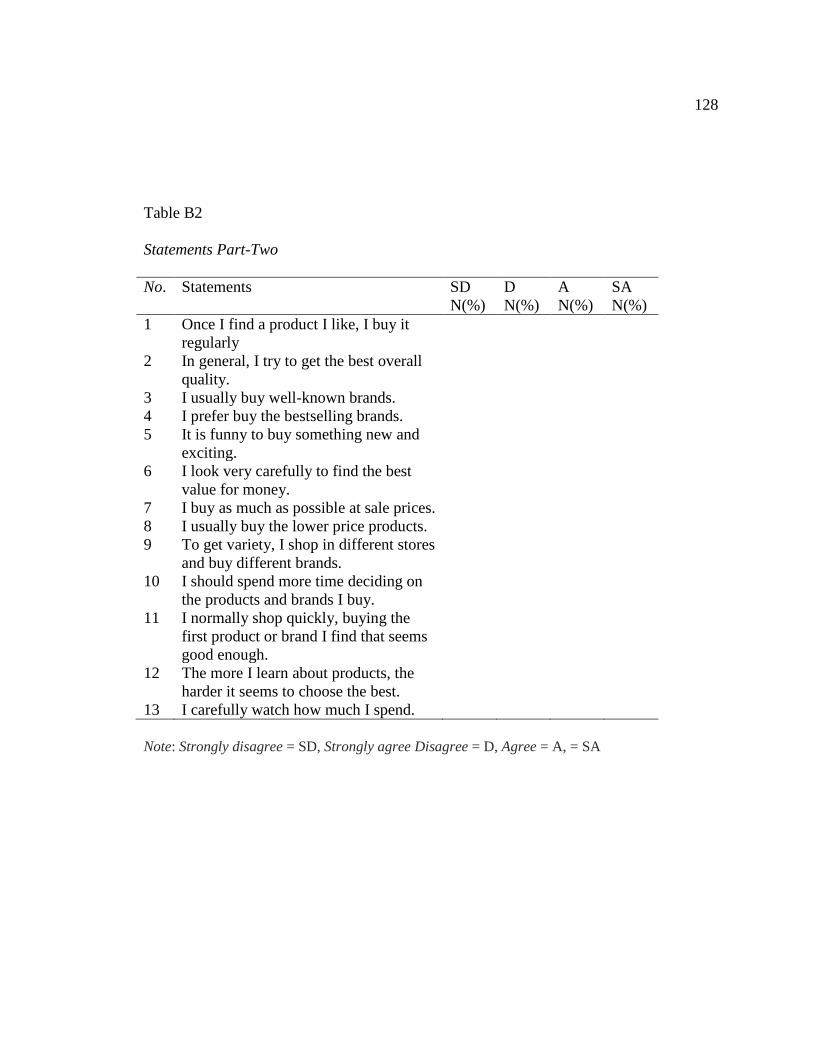
128
Table B2
Statements Part-Two
No. Statements SD D A SA
N(%) N(%) N(%) N(%)
1 Once I find a product I like, I buy it
regularly
2 In general, I try to get the best overall
quality.
3 I usually buy well-known brands.
4 I prefer buy the bestselling brands.
5 It is funny to buy something new and
exciting.
6 I look very carefully to find the best
value for money.
7 I buy as much as possible at sale prices.
8 I usually buy the lower price products.
9 To get variety, I shop in different stores
and buy different brands.
10 I should spend more time deciding on
the products and brands I buy.
11 I normally shop quickly, buying the
first product or brand I find that seems
good enough.
12 The more I learn about products, the
harder it seems to choose the best.
13 I carefully watch how much I spend.
Note: Strongly disagree = SD, Strongly agree Disagree = D, Agree = A, = SA
129
Appendix C: Consent Form
Consent Form
You are invited to take part in a research study of an effective strategy for
aligning sales promotions with buying attitudes in a recession. The researcher is inviting
adults consumers involved in the buying process, in the city to be in the study. This form
is part of a process called “informed consent” to allow you to understand this study
before deciding whether to participate.
This study is being conducted by a researcher named Paulin Adjagbodjou, who is a
doctoral student at Walden University.
Background Information:
The purpose of this study is to determine which of price discounts, coupons, and buy-
one-get-one-free influence buying attitudes significantly in a recession.
Procedures:
If you agree to be in this study:
You will be asked to complete a confidential paper-based survey.
You do not need to disclose any confidential business or financial data to
complete the survey
The survey will take approximately 15-20 minutes
Here are some sample questions:
If a brand offers a price discount, that could be a reason for me to buy it.
If a brand offers a coupon, that could be a reason for me to buy it.
130
I buy as much as possible at sale prices.
Voluntary Nature of the Study:
This study is voluntary. Everyone will respect your decision of whether or not you
choose to be in the study. No one at Walden University will treat you differently if you
decide not to be in the study. If you decide to join the study now, you can still change
your mind later. You may stop participating at any time.
Risks and Benefits of Being in the Study:
Being in this study would not pose risk to your safety or wellbeing.
A summary of findings from this research will be available to participants and anyone
interested in having the results from the study upon request during the data collection or
by contacting later the researcher via e-mail. The researcher will provide the
managements of cooperating stores with a summary of findings from this study.
Implications of the study will include scholarly research, sales increase, and improvement
of lifestyle of individuals.
Payment:
There will be no compensation for participants of this survey.
Privacy:
Any information you provide will be kept confidential, and no identification of you will
be requested within the survey. The researcher will not use your personal information for
any purposes outside of this research project. In addition, the researcher will not include
your name or any other information that could identify you in the reports of the study.
131
Data will be kept secure by the researcher in a locked container. The researcher will keep
data for 5 years after completion of the study, as required by the University.
Contacts and Questions:
You may ask any questions you have now. Or if you have questions later, you may
contact the researcher via e-mail. If you want to talk privately about your rights as a
participant, you can call Dr. Leilani Endicott. She is the Walden University representative
who can discuss this with you. Her phone number is 612-312-1210 or email address
[email protected]. Walden University’s approval number for this study is 10-07-14-
0361937 and it expires on October 6, 2015.
Please keep this consent form for your records.
Statement of Consent:
I have read the above information and I feel I understand the study well enough to make a
decision about my involvement. By returning a completed survey, I understand that I am
agreeing to the terms described above.
Appendix D: Confidentiality Agreement
Printed Name of Participant
Date of consent
Participant’s Signature
Researcher’s Signature

132
Confidentiality Agreement
Name of Signer:
During the course of my activity in collecting data for this research, I, Paulin
Adjagbodjou will have access to information that is confidential and should not be
disclosed. I acknowledge that the information must remain confidential, and that
improper disclosure of confidential information can be damaging to the participant.
By signing this Confidentiality Agreement I acknowledge and agree that:
1. I will not disclose or discuss any confidential information with others, including
friends or family.
2. I will not in any way divulge, copy, release, sell, loan, alter, or destroy any
confidential information except as properly authorized.
3. I will not discuss confidential information where others can overhear the
conversation. I understand that it is not acceptable to discuss confidential information
even if the participant’s name is not used.
4. I will not make any unauthorized transmissions, inquiries, modification, or purging of
confidential information.
5. I agree that my obligations under this agreement will continue after termination of
the job that I will perform.
6. I understand that violation of this agreement will have legal implications.
133
7. I will only access or use systems or devices I’m officially authorized to access and I
will not demonstrate the operation or function of systems or devices to unauthorized
individuals.
By signing this document, I acknowledge that I have read the agreement and I agree to
comply with all the terms and conditions stated above.
Signature: Date: