Ali Curang jobs profile 2014 - Northern Territory · 2018-10-12 · 5 2014 Jobs Profile ALI CURUNG...
37
ALI CURUNG 2014 JOBS PROFILE
Transcript of Ali Curang jobs profile 2014 - Northern Territory · 2018-10-12 · 5 2014 Jobs Profile ALI CURUNG...
1
2014 Jobs Profile ALI CURUNG
ALI CURUNG
2014 JOBS PROFILE
2
© Northern Territory of Australia 2014
Preferred Reference: Department of Business, 2014 Jobs Profiles, Northern Territory Government, November 2014, Darwin.
Disclaimer
The data in this publication were predominantly collected by conducting a face-to-face survey of businesses within town boundaries during mid-2014. The collection methodology was created in accordance with Australian Bureau of Statistics data quality framework principles. Data in this publication are only reflective of those businesses reported on as operating in the town at the time of data collection (see Table 30 for list of businesses reported on).
To comply with privacy legislation or where appropriate, some data in this publication may have been adjusted and will not reflect the actual data reported by businesses. As a result of this, combined with certain data not being reported by some businesses, some components may not add to totals and changes over time may be partially reflective of business’ change in propensity to report on certain data items rather than actual changes over time. Total figures have generally not been adjusted.
Caution is advised when interpreting the comparisons made to the earlier 2011 publication as the businesses identified and reported on and the corresponding jobs may differ between publications.
Notes for each table and chart are alphabetically ordered and listed at the end of the publication.
Any use of this report for commercial purposes is not endorsed by the Department of Business.
3
2014 Jobs Profile ALI CURUNG
Table of Contents
Ali Curung .............................................................................................................................. 4
Publication Summary ............................................................................................................. 5
Jobs Overview ....................................................................................................................... 6
Jobs by Indigenous Status ..................................................................................................... 7
Jobs by Sector ....................................................................................................................... 8
Job Permanency .................................................................................................................. 12
Job Vacancies ...................................................................................................................... 14
Jobs by Industry ................................................................................................................... 15
Jobs by Occupation .............................................................................................................. 19
Jobs by Industry by Occupation ........................................................................................... 21
Jobs by Gender .................................................................................................................... 22
Jobs by Age ......................................................................................................................... 25
Vocational Education and Training ....................................................................................... 28
Remote Jobs and Communities Program (RJCP) ................................................................ 32
Population……………………………………………………………………………………………. 33
Businesses .......................................................................................................................... 34
Notes ................................................................................................................................... 35
Abbreviations and Acronyms ................................................................................................ 36
4
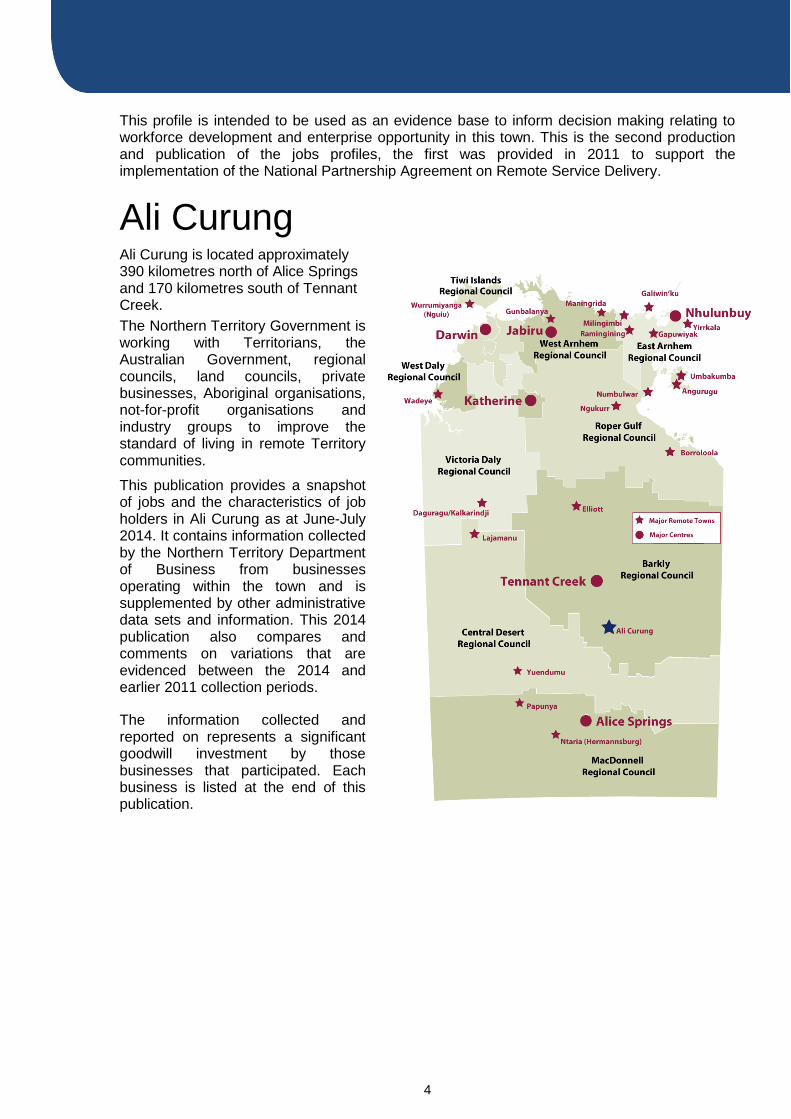
This profile is intended to be used as an evidence base to inform decision making relating to workforce development and enterprise opportunity in this town. This is the second production and publication of the jobs profiles, the first was provided in 2011 to support the implementation of the National Partnership Agreement on Remote Service Delivery.
Ali Curung Ali Curung is located approximately 390 kilometres north of Alice Springs and 170 kilometres south of Tennant Creek.
The Northern Territory Government is working with Territorians, the Australian Government, regional councils, land councils, private businesses, Aboriginal organisations, not-for-profit organisations and industry groups to improve the standard of living in remote Territory communities.
This publication provides a snapshot of jobs and the characteristics of job holders in Ali Curung as at June-July 2014. It contains information collected by the Northern Territory Department of Business from businesses operating within the town and is supplemented by other administrative data sets and information. This 2014 publication also compares and comments on variations that are evidenced between the 2014 and earlier 2011 collection periods.
The information collected and reported on represents a significant goodwill investment by those businesses that participated. Each business is listed at the end of this publication.
5
2014 Jobs Profile ALI CURUNG
Publication Summary
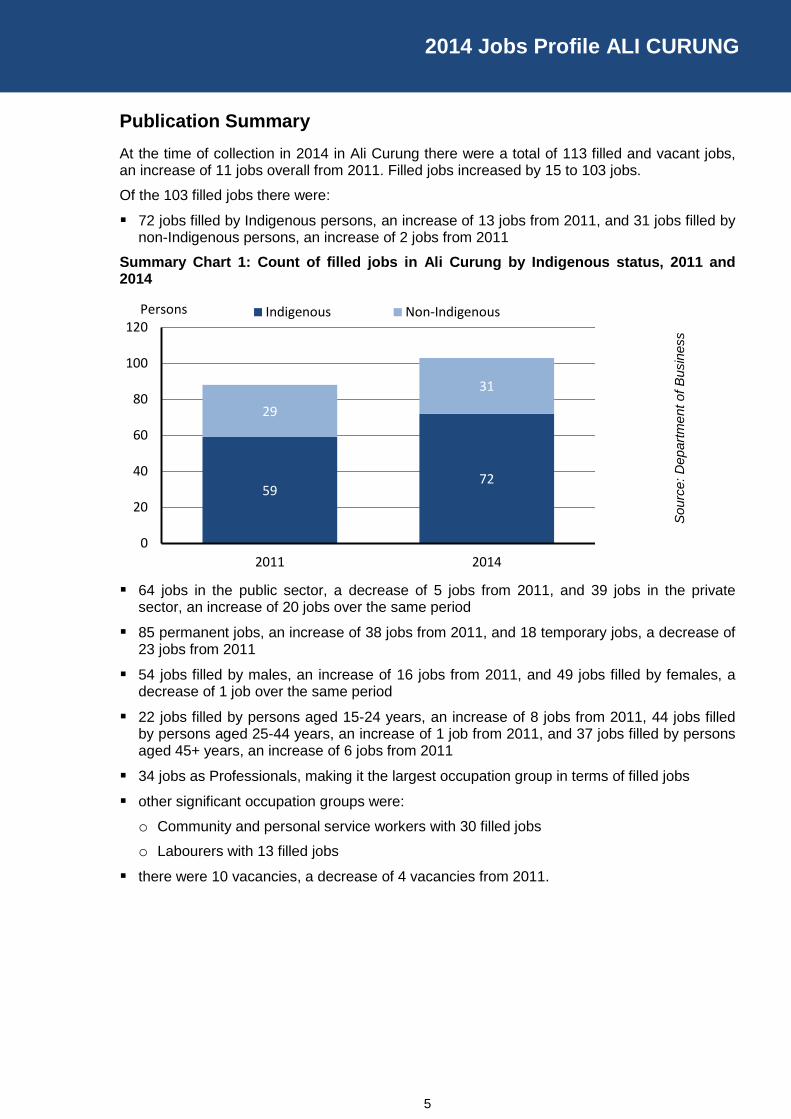
At the time of collection in 2014 in Ali Curung there were a total of 113 filled and vacant jobs, an increase of 11 jobs overall from 2011. Filled jobs increased by 15 to 103 jobs.
Of the 103 filled jobs there were:
72 jobs filled by Indigenous persons, an increase of 13 jobs from 2011, and 31 jobs filled by non-Indigenous persons, an increase of 2 jobs from 2011
Summary Chart 1: Count of filled jobs in Ali Curung by Indigenous status, 2011 and 2014
64 jobs in the public sector, a decrease of 5 jobs from 2011, and 39 jobs in the private sector, an increase of 20 jobs over the same period
85 permanent jobs, an increase of 38 jobs from 2011, and 18 temporary jobs, a decrease of 23 jobs from 2011
54 jobs filled by males, an increase of 16 jobs from 2011, and 49 jobs filled by females, a decrease of 1 job over the same period
22 jobs filled by persons aged 15-24 years, an increase of 8 jobs from 2011, 44 jobs filled by persons aged 25-44 years, an increase of 1 job from 2011, and 37 jobs filled by persons aged 45+ years, an increase of 6 jobs from 2011
34 jobs as Professionals, making it the largest occupation group in terms of filled jobs
other significant occupation groups were:
o Community and personal service workers with 30 filled jobs
o Labourers with 13 filled jobs
there were 10 vacancies, a decrease of 4 vacancies from 2011.
5972
29
31
0
20
40
60
80
100
120
2011 2014
Indigenous Non-IndigenousPersons
Sourc
e:
Dep
art
me
nt of
Busin
ess
6
Jobs Overview
Table 1: Count of filled jobs and vacancies, 2011 and 2014 (a)(b)
Source: Department of Business
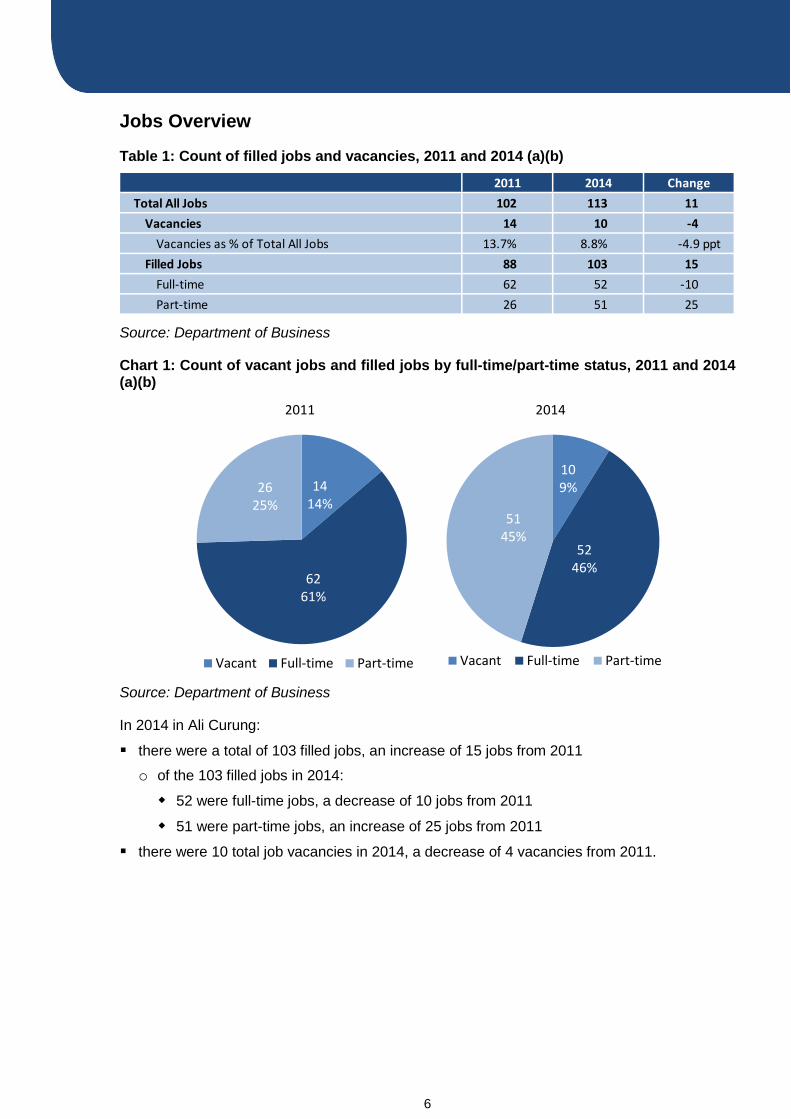
Chart 1: Count of vacant jobs and filled jobs by full-time/part-time status, 2011 and 2014 (a)(b)
Source: Department of Business
In 2014 in Ali Curung:
there were a total of 103 filled jobs, an increase of 15 jobs from 2011
o of the 103 filled jobs in 2014:
52 were full-time jobs, a decrease of 10 jobs from 2011
51 were part-time jobs, an increase of 25 jobs from 2011
there were 10 total job vacancies in 2014, a decrease of 4 vacancies from 2011.
2011 2014 Change
Total All Jobs 102 113 11
Vacancies 14 10 -4
Vacancies as % of Total All Jobs 13.7% 8.8% -4.9 ppt
Filled Jobs 88 103 15
Full-time 62 52 -10
Part-time 26 51 25
1414%
6261%
2625%
2011
Vacant Full-time Part-time
109%
5246%
5145%
2014
Vacant Full-time Part-time
7
2014 Jobs Profile ALI CURUNG
Jobs by Indigenous Status
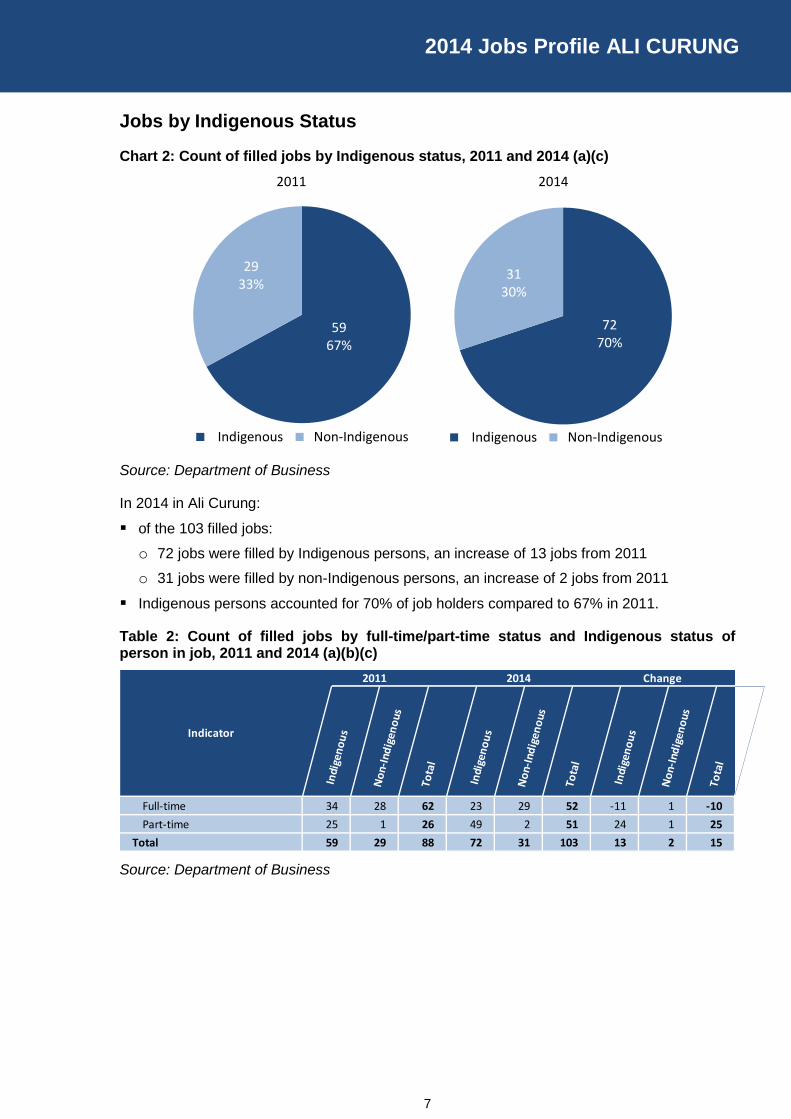
Chart 2: Count of filled jobs by Indigenous status, 2011 and 2014 (a)(c)
Source: Department of Business
In 2014 in Ali Curung:
of the 103 filled jobs:
o 72 jobs were filled by Indigenous persons, an increase of 13 jobs from 2011
o 31 jobs were filled by non-Indigenous persons, an increase of 2 jobs from 2011
Indigenous persons accounted for 70% of job holders compared to 67% in 2011.
Table 2: Count of filled jobs by full-time/part-time status and Indigenous status of person in job, 2011 and 2014 (a)(b)(c)
Source: Department of Business
5967%
2933%
Indigenous Non-Indigenous
20112011
7270%
3130%
Indigenous Non-Indigenous
22014
Indicator
2011 2014 Change
In
dige
no
us
No
n-In
dig
eno
us
To
tal
In
dige
no
us
No
n-In
dig
eno
us
To
tal
In
dige
no
us
No
n-In
dig
eno
us
To
tal
Indicator
Full-time 34 28 62 23 29 52 -11 1 -10
Part-time 25 1 26 49 2 51 24 1 25
Total 59 29 88 72 31 103 13 2 15
8
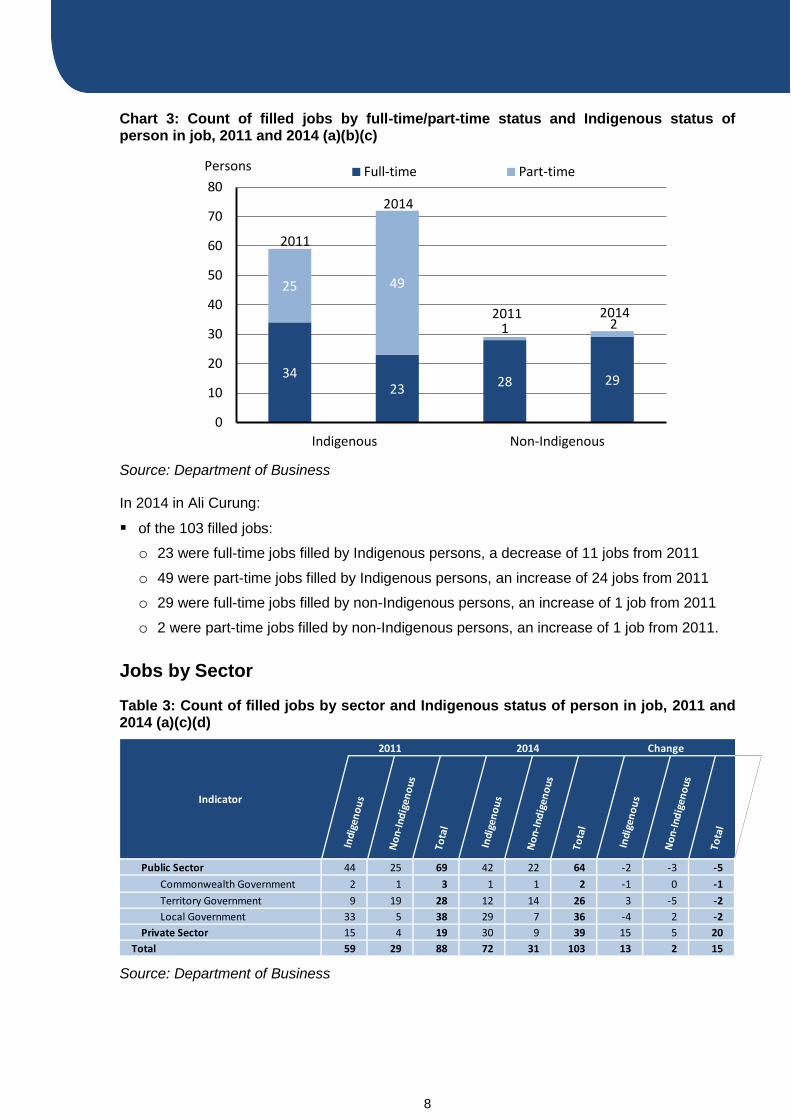
Chart 3: Count of filled jobs by full-time/part-time status and Indigenous status of person in job, 2011 and 2014 (a)(b)(c)
Source: Department of Business
In 2014 in Ali Curung:
of the 103 filled jobs:
o 23 were full-time jobs filled by Indigenous persons, a decrease of 11 jobs from 2011
o 49 were part-time jobs filled by Indigenous persons, an increase of 24 jobs from 2011
o 29 were full-time jobs filled by non-Indigenous persons, an increase of 1 job from 2011
o 2 were part-time jobs filled by non-Indigenous persons, an increase of 1 job from 2011.
Jobs by Sector
Table 3: Count of filled jobs by sector and Indigenous status of person in job, 2011 and 2014 (a)(c)(d)
Source: Department of Business
3423
28 29
25 49
1 2
0
10
20
30
40
50
60
70
80Full-time Part-timePersons
Indigenous Non-Indigenous
2011
2011
2014
2014
2011
Indicator
2014 Change
In
dige
no
us
No
n-In
dig
eno
us
To
tal
In
dige
no
us
No
n-In
dig
eno
us
To
tal
In
dige
no
us
No
n-In
dig
eno
us
To
tal
Indicator
Public Sector 44 25 69 42 22 64 -2 -3 -5
Commonwealth Government 2 1 3 1 1 2 -1 0 -1
Territory Government 9 19 28 12 14 26 3 -5 -2
Local Government 33 5 38 29 7 36 -4 2 -2
Private Sector 15 4 19 30 9 39 15 5 20
Total 59 29 88 72 31 103 13 2 15
9
2014 Jobs Profile ALI CURUNG
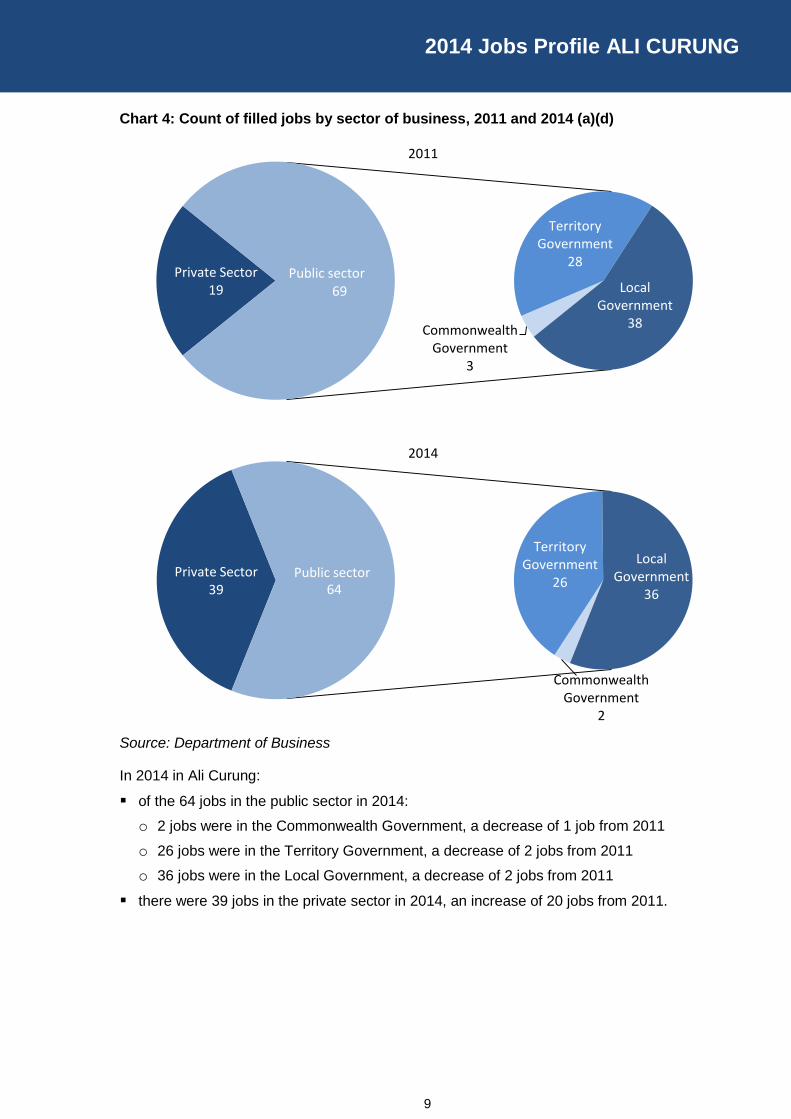
Chart 4: Count of filled jobs by sector of business, 2011 and 2014 (a)(d)
Source: Department of Business
In 2014 in Ali Curung:
of the 64 jobs in the public sector in 2014:
o 2 jobs were in the Commonwealth Government, a decrease of 1 job from 2011
o 26 jobs were in the Territory Government, a decrease of 2 jobs from 2011
o 36 jobs were in the Local Government, a decrease of 2 jobs from 2011
there were 39 jobs in the private sector in 2014, an increase of 20 jobs from 2011.
Private Sector19
Commonwealth Government
3
Territory Government
28
Local Government
38
69
2011
Public sector
Private Sector39
Commonwealth Government
2
Territory Government
26
Local Government
3664
2014
Public sector
10
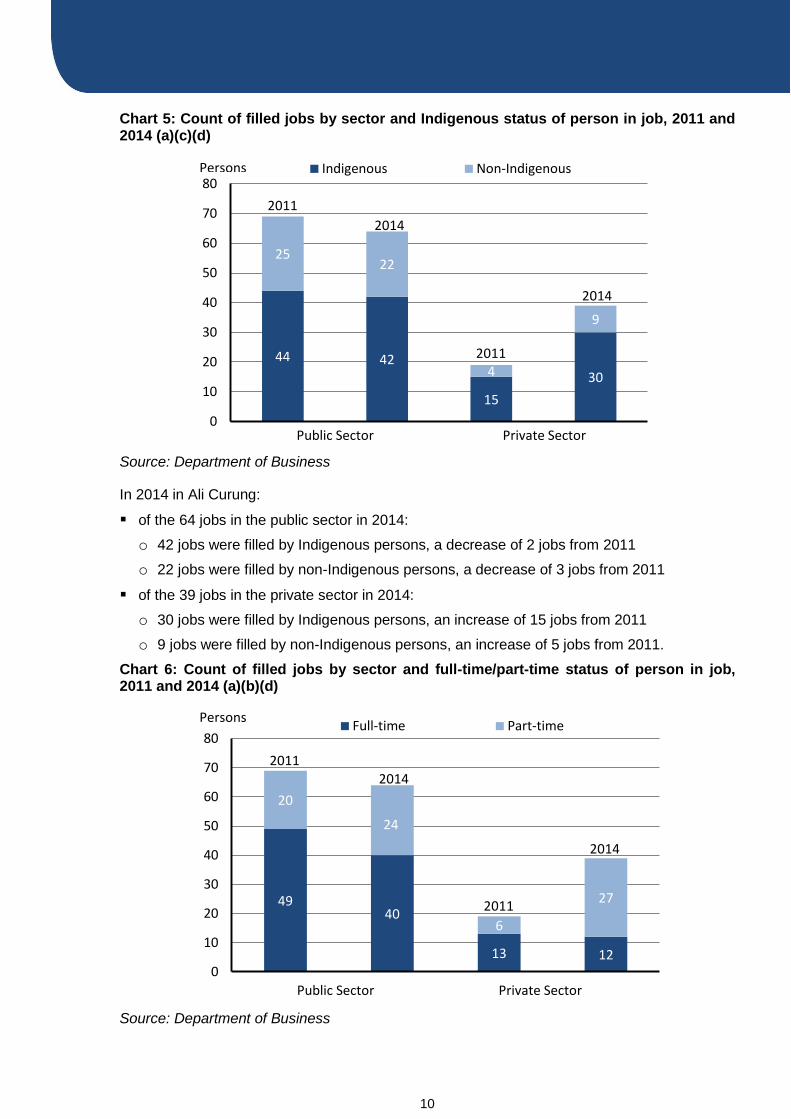
Chart 5: Count of filled jobs by sector and Indigenous status of person in job, 2011 and 2014 (a)(c)(d)
Source: Department of Business
In 2014 in Ali Curung:
of the 64 jobs in the public sector in 2014:
o 42 jobs were filled by Indigenous persons, a decrease of 2 jobs from 2011
o 22 jobs were filled by non-Indigenous persons, a decrease of 3 jobs from 2011
of the 39 jobs in the private sector in 2014:
o 30 jobs were filled by Indigenous persons, an increase of 15 jobs from 2011
o 9 jobs were filled by non-Indigenous persons, an increase of 5 jobs from 2011.
Chart 6: Count of filled jobs by sector and full-time/part-time status of person in job, 2011 and 2014 (a)(b)(d)
Source: Department of Business
44 42
15
30
2522
4
9
0
10
20
30
40
50
60
70
80Indigenous Non-Indigenous
2014
Public Sector
Private Sector
2011
2011
2014
Private Sector
Persons
4940
13 12
20
24
6
27
0
10
20
30
40
50
60
70
80Full-time Part-time
Persons
Public Sector Private Sector
2011
2011
2014
2014
11
2014 Jobs Profile ALI CURUNG
In 2014 in Ali Curung:
of the 64 jobs in the public sector:
o 40 were full-time jobs, a decrease of 9 jobs from 2011
o 24 were part-time jobs, an increase of 4 jobs from 2011
of the 39 jobs in the private sector:
o 12 were full-time jobs, a decrease of 1 job from 2011
o 27 were part-time jobs, an increase of 21 jobs from 2011.
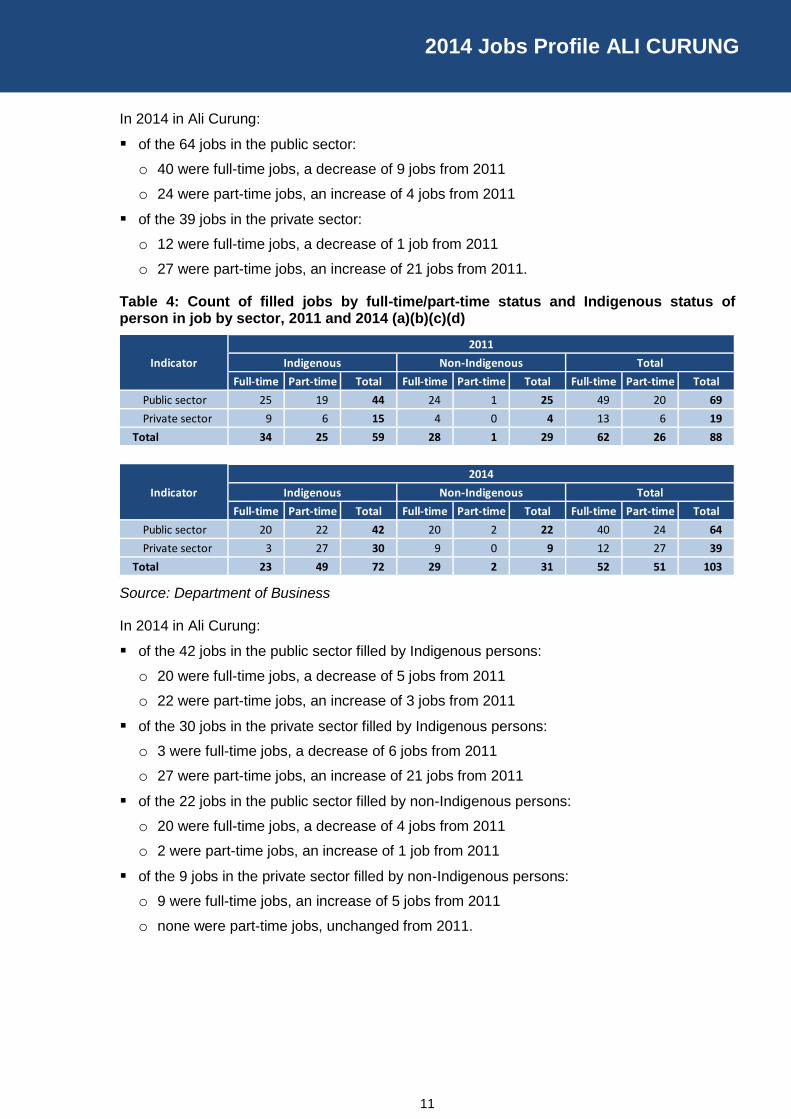
Table 4: Count of filled jobs by full-time/part-time status and Indigenous status of person in job by sector, 2011 and 2014 (a)(b)(c)(d)
Source: Department of Business
In 2014 in Ali Curung:
of the 42 jobs in the public sector filled by Indigenous persons:
o 20 were full-time jobs, a decrease of 5 jobs from 2011
o 22 were part-time jobs, an increase of 3 jobs from 2011
of the 30 jobs in the private sector filled by Indigenous persons:
o 3 were full-time jobs, a decrease of 6 jobs from 2011
o 27 were part-time jobs, an increase of 21 jobs from 2011
of the 22 jobs in the public sector filled by non-Indigenous persons:
o 20 were full-time jobs, a decrease of 4 jobs from 2011
o 2 were part-time jobs, an increase of 1 job from 2011
of the 9 jobs in the private sector filled by non-Indigenous persons:
o 9 were full-time jobs, an increase of 5 jobs from 2011
o none were part-time jobs, unchanged from 2011.
Full-time Part-time Total Full-time Part-time Total Full-time Part-time Total
Public sector 25 19 44 24 1 25 49 20 69
Private sector 9 6 15 4 0 4 13 6 19
Total 34 25 59 28 1 29 62 26 88
Full-time Part-time Total Full-time Part-time Total Full-time Part-time Total
Public sector 20 22 42 20 2 22 40 24 64
Private sector 3 27 30 9 0 9 12 27 39
Total 23 49 72 29 2 31 52 51 103
2011
Total
Indicator
Indicator
2014
Indigenous Non-Indigenous
Indigenous Non-Indigenous Total
12
Job Permanency
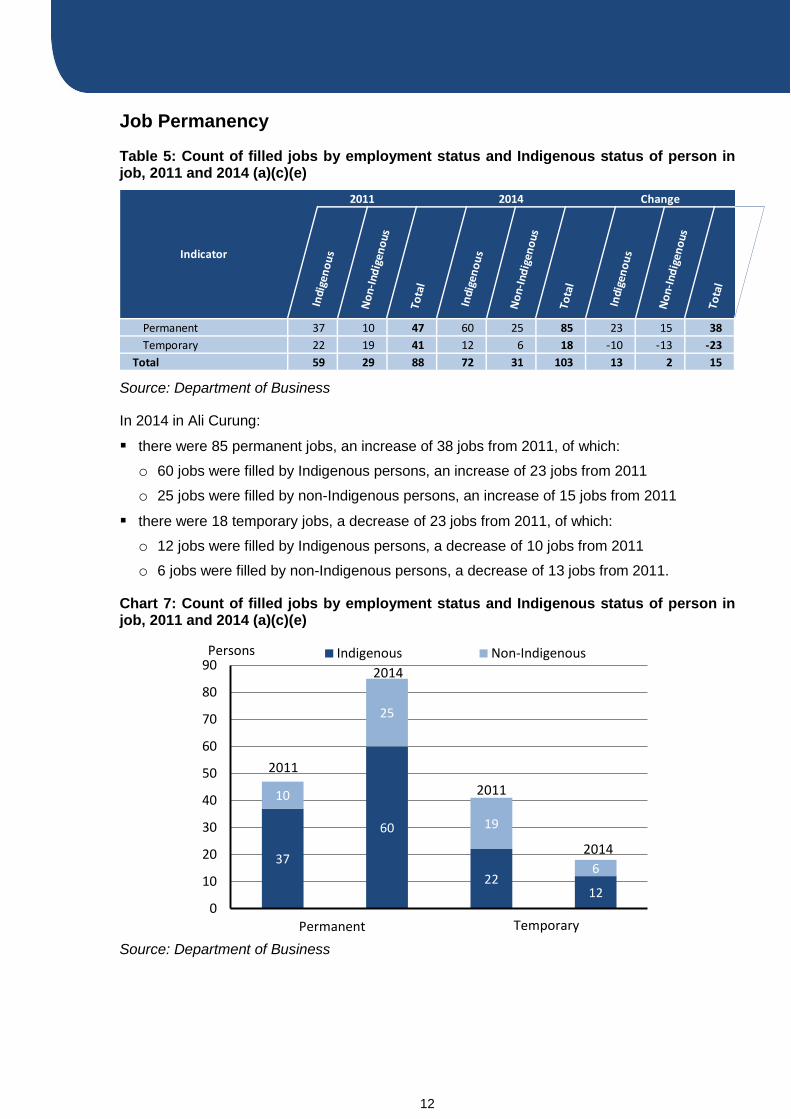
Table 5: Count of filled jobs by employment status and Indigenous status of person in job, 2011 and 2014 (a)(c)(e)
Source: Department of Business
In 2014 in Ali Curung:
there were 85 permanent jobs, an increase of 38 jobs from 2011, of which:
o 60 jobs were filled by Indigenous persons, an increase of 23 jobs from 2011
o 25 jobs were filled by non-Indigenous persons, an increase of 15 jobs from 2011
there were 18 temporary jobs, a decrease of 23 jobs from 2011, of which:
o 12 jobs were filled by Indigenous persons, a decrease of 10 jobs from 2011
o 6 jobs were filled by non-Indigenous persons, a decrease of 13 jobs from 2011.
Chart 7: Count of filled jobs by employment status and Indigenous status of person in job, 2011 and 2014 (a)(c)(e)
Source: Department of Business
Indicator
2014 Change2011
In
dige
no
us
No
n-In
dig
eno
us
To
tal
In
dige
no
us
No
n-In
dig
eno
us
To
tal
In
dige
no
us
No
n-In
dig
eno
us
To
tal
Indicator
Permanent 37 10 47 60 25 85 23 15 38
Temporary 22 19 41 12 6 18 -10 -13 -23
Total 59 29 88 72 31 103 13 2 15
37
60
2212
10
25
19
6
0
10
20
30
40
50
60
70
80
90Indigenous Non-Indigenous
2014
Permanent Temporary
2011
2011
2014
Persons
13
2014 Jobs Profile ALI CURUNG
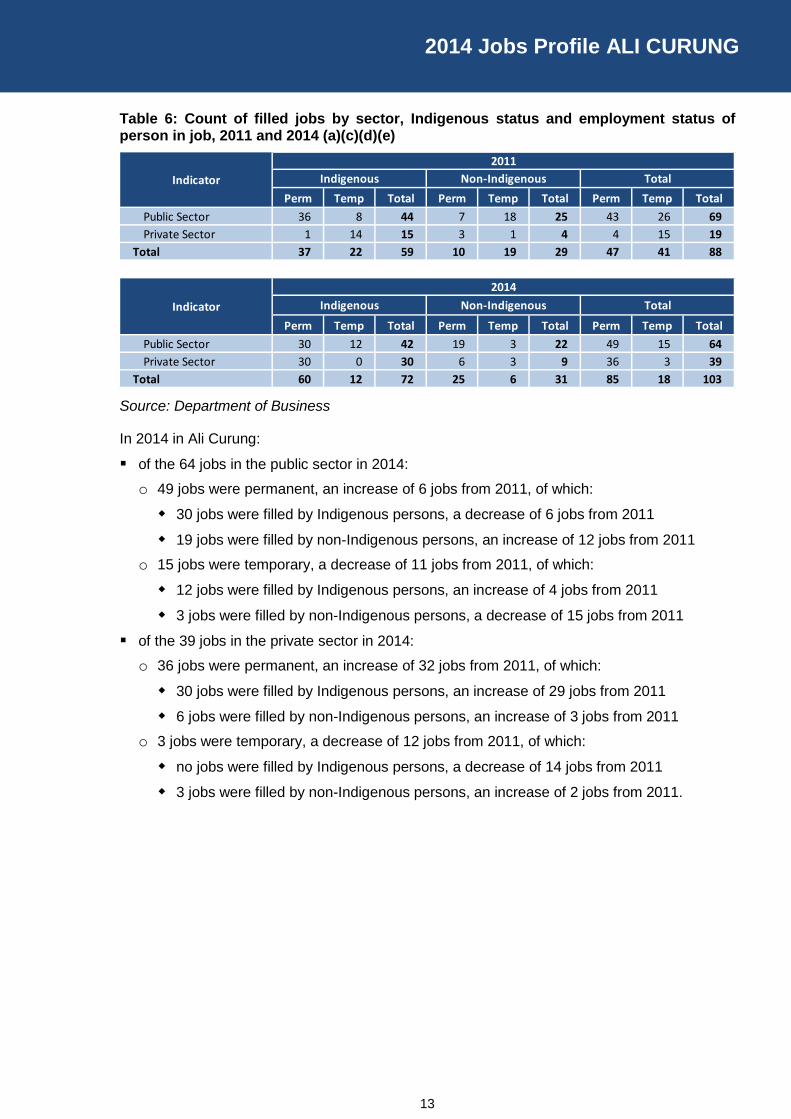
Table 6: Count of filled jobs by sector, Indigenous status and employment status of person in job, 2011 and 2014 (a)(c)(d)(e)
Source: Department of Business
In 2014 in Ali Curung:
of the 64 jobs in the public sector in 2014:
o 49 jobs were permanent, an increase of 6 jobs from 2011, of which:
30 jobs were filled by Indigenous persons, a decrease of 6 jobs from 2011
19 jobs were filled by non-Indigenous persons, an increase of 12 jobs from 2011
o 15 jobs were temporary, a decrease of 11 jobs from 2011, of which:
12 jobs were filled by Indigenous persons, an increase of 4 jobs from 2011
3 jobs were filled by non-Indigenous persons, a decrease of 15 jobs from 2011
of the 39 jobs in the private sector in 2014:
o 36 jobs were permanent, an increase of 32 jobs from 2011, of which:
30 jobs were filled by Indigenous persons, an increase of 29 jobs from 2011
6 jobs were filled by non-Indigenous persons, an increase of 3 jobs from 2011
o 3 jobs were temporary, a decrease of 12 jobs from 2011, of which:
no jobs were filled by Indigenous persons, a decrease of 14 jobs from 2011
3 jobs were filled by non-Indigenous persons, an increase of 2 jobs from 2011.
Perm Temp Total Perm Temp Total Perm Temp Total
Public Sector 36 8 44 7 18 25 43 26 69
Private Sector 1 14 15 3 1 4 4 15 19
Total 37 22 59 10 19 29 47 41 88
Perm Temp Total Perm Temp Total Perm Temp Total
Public Sector 30 12 42 19 3 22 49 15 64
Private Sector 30 0 30 6 3 9 36 3 39
Total 60 12 72 25 6 31 85 18 103
Indicator
2014
Indigenous TotalNon-Indigenous
Indigenous Total
2011
Non-IndigenousIndicator
14
Job Vacancies
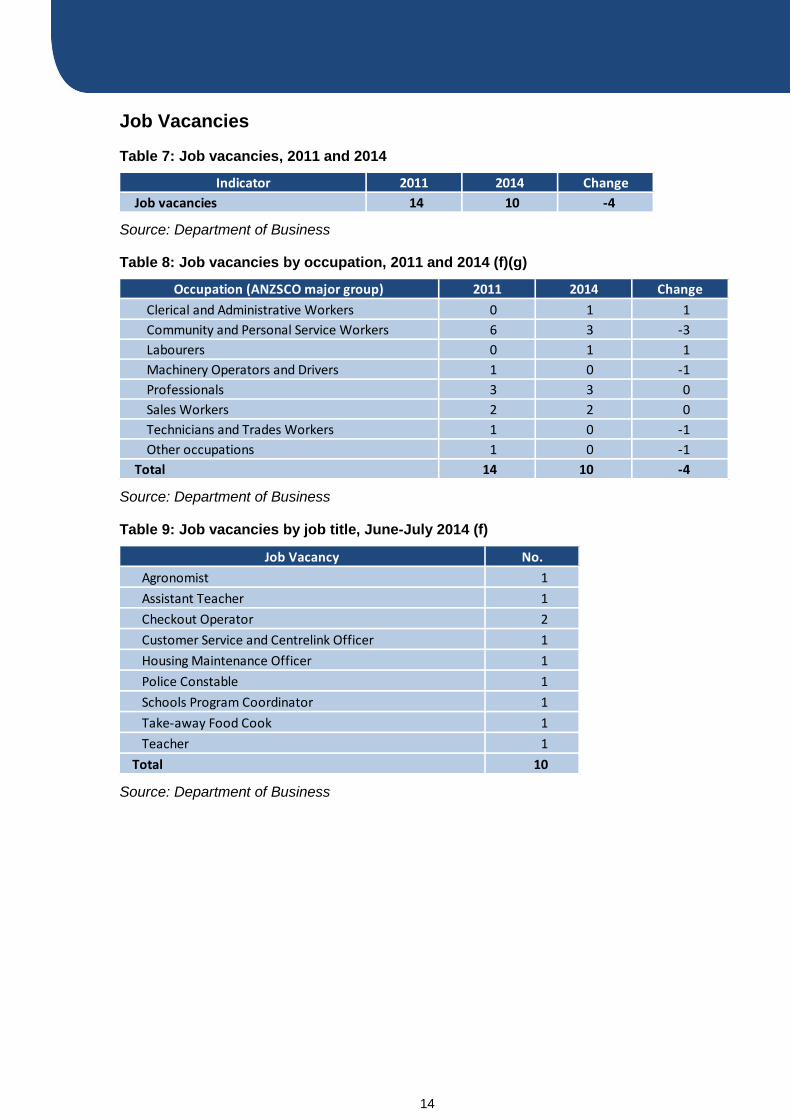
Table 7: Job vacancies, 2011 and 2014
Source: Department of Business
Table 8: Job vacancies by occupation, 2011 and 2014 (f)(g)
Source: Department of Business
Table 9: Job vacancies by job title, June-July 2014 (f)
Source: Department of Business
Indicator 2011 2014 Change
Job vacancies 14 10 -4
Occupation (ANZSCO major group) 2011 2014 Change
Clerical and Administrative Workers 0 1 1
Community and Personal Service Workers 6 3 -3
Labourers 0 1 1
Machinery Operators and Drivers 1 0 -1
Professionals 3 3 0
Sales Workers 2 2 0
Technicians and Trades Workers 1 0 -1
Other occupations 1 0 -1
Total 14 10 -4
Job Vacancy No.
Agronomist 1
Assistant Teacher 1
Checkout Operator 2
Customer Service and Centrelink Officer 1
Housing Maintenance Officer 1
Police Constable 1
Schools Program Coordinator 1
Take-away Food Cook 1
Teacher 1
Total 10
15
2014 Jobs Profile ALI CURUNG
In 2014 in Ali Curung:
there were 10 vacancies reported, a decrease of 4 vacancies from 2011
of the 10 reported vacancies, the largest requirements were for:
o 3 Community and personal service workers, e.g. Assistant teacher, Police constable
o 3 Professionals, e.g. Agronomist, Teacher
o 2 Sales workers, e.g. Checkout operator.
Jobs by Industry
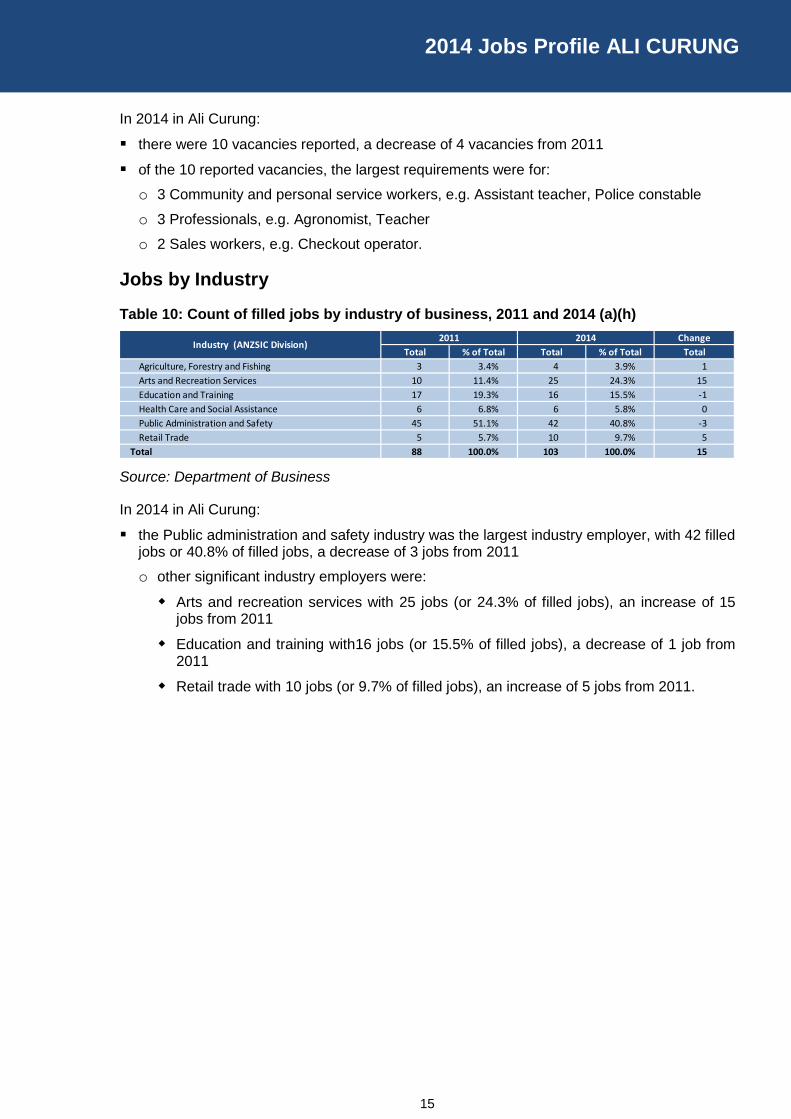
Table 10: Count of filled jobs by industry of business, 2011 and 2014 (a)(h)
Source: Department of Business
In 2014 in Ali Curung:
the Public administration and safety industry was the largest industry employer, with 42 filled jobs or 40.8% of filled jobs, a decrease of 3 jobs from 2011
o other significant industry employers were:
Arts and recreation services with 25 jobs (or 24.3% of filled jobs), an increase of 15 jobs from 2011
Education and training with16 jobs (or 15.5% of filled jobs), a decrease of 1 job from 2011
Retail trade with 10 jobs (or 9.7% of filled jobs), an increase of 5 jobs from 2011.
Change
Total % of Total Total % of Total Total
Agriculture, Forestry and Fishing 3 3.4% 4 3.9% 1
Arts and Recreation Services 10 11.4% 25 24.3% 15
Education and Training 17 19.3% 16 15.5% -1
Health Care and Social Assistance 6 6.8% 6 5.8% 0
Public Administration and Safety 45 51.1% 42 40.8% -3
Retail Trade 5 5.7% 10 9.7% 5
Total 88 100.0% 103 100.0% 15
2011 2014Industry (ANZSIC Division)
16
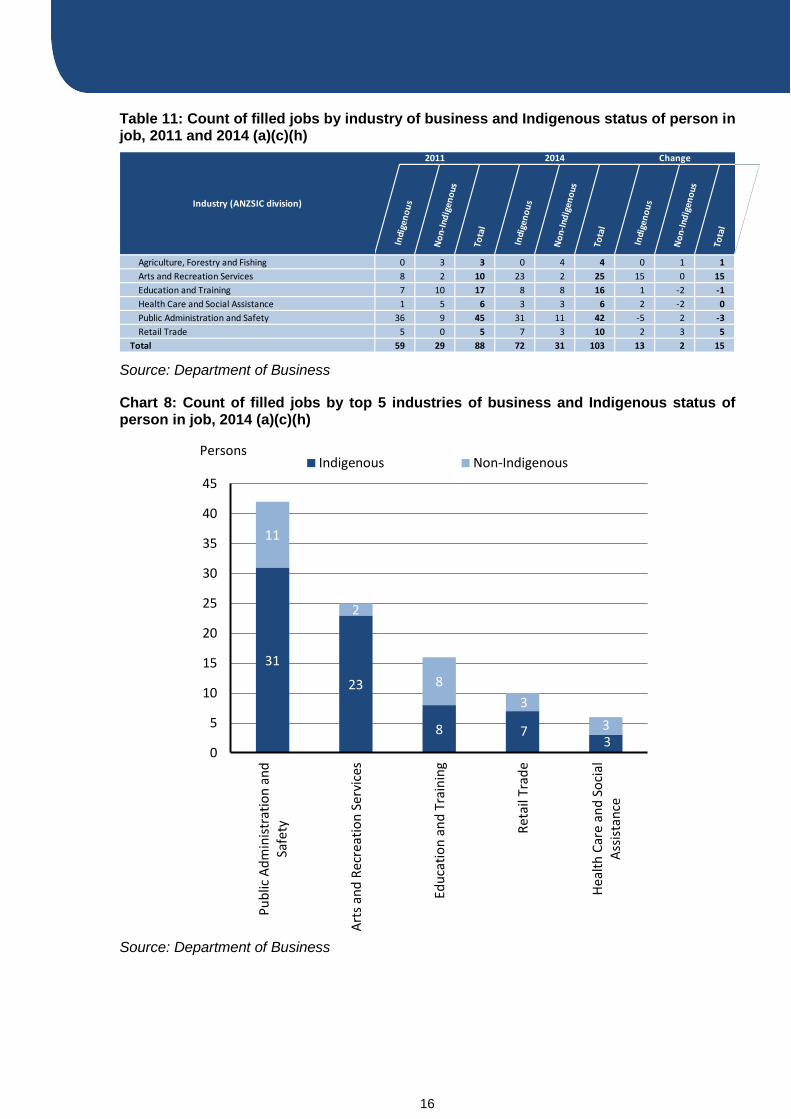
Table 11: Count of filled jobs by industry of business and Indigenous status of person in job, 2011 and 2014 (a)(c)(h)
Source: Department of Business
Chart 8: Count of filled jobs by top 5 industries of business and Indigenous status of person in job, 2014 (a)(c)(h)
Source: Department of Business
2014 Change
Industry (ANZSIC division)
2011
In
dige
no
us
No
n-In
dig
eno
us
To
tal
In
dige
no
us
No
n-In
dig
eno
us
To
tal
In
dige
no
us
No
n-In
dig
eno
us
To
tal
Industry (ANZSIC division)
Agriculture, Forestry and Fishing 0 3 3 0 4 4 0 1 1
Arts and Recreation Services 8 2 10 23 2 25 15 0 15
Education and Training 7 10 17 8 8 16 1 -2 -1
Health Care and Social Assistance 1 5 6 3 3 6 2 -2 0
Public Administration and Safety 36 9 45 31 11 42 -5 2 -3
Retail Trade 5 0 5 7 3 10 2 3 5
Total 59 29 88 72 31 103 13 2 15
31
23
8 73
11
2
8
3
3
0
5
10
15
20
25
30
35
40
45
Pu
blic
Ad
min
istr
atio
n a
nd
Safe
ty
Art
s an
d R
ecre
atio
n S
ervi
ces
Edu
cati
on
an
d T
rain
ing
Ret
ail T
rad
e
Hea
lth
Car
e an
d S
oci
alA
ssis
tan
ce
Indigenous Non-IndigenousPersons
17
2014 Jobs Profile ALI CURUNG
In 2014 in Ali Curung:
there were 72 jobs filled by Indigenous persons, including:
o 31 jobs in Public administration and safety, a decrease of 5 jobs from 2011
o 23 jobs in Arts and recreation services, an increase of 15 jobs from 2011
o 8 jobs in Education and training, an increase of 1 job from 2011
there were 31 jobs filled by non-Indigenous persons, including:
o 11 jobs in Public administration and safety, an increase of 2 jobs from 2011
o 2 jobs in Arts and recreation services, unchanged from 2011
o 8 jobs in Education and training, a decrease of 2 jobs from 2011.
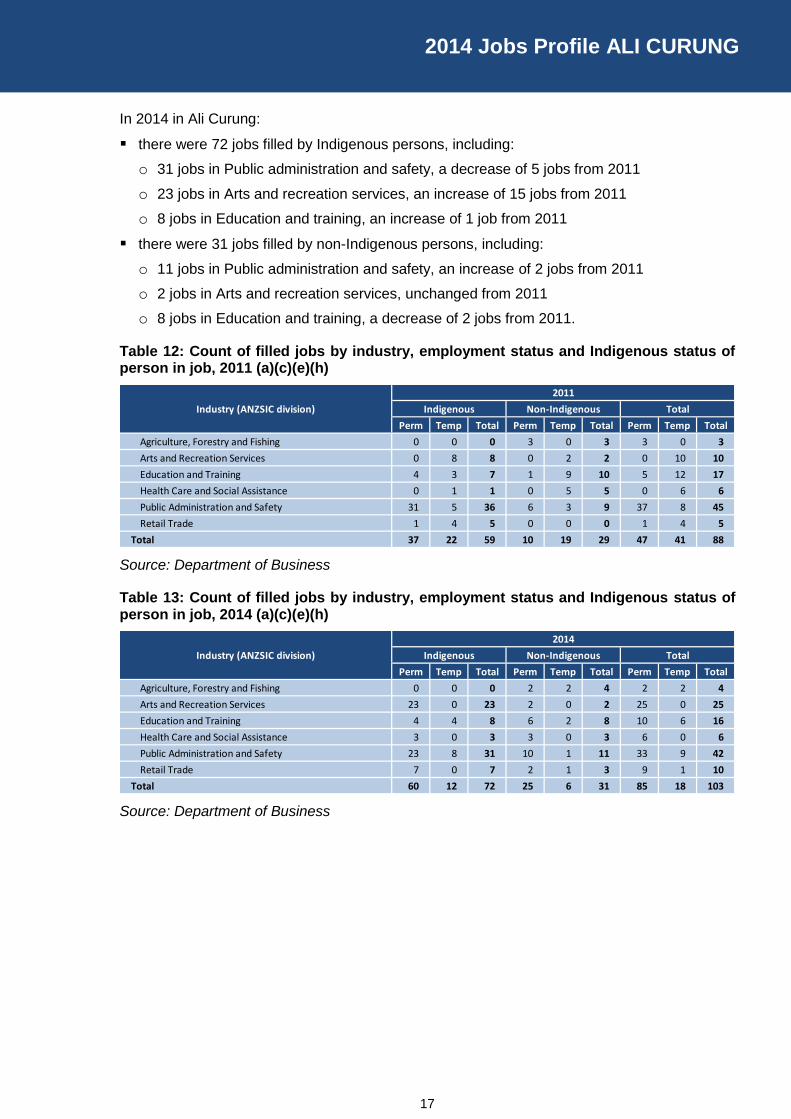
Table 12: Count of filled jobs by industry, employment status and Indigenous status of person in job, 2011 (a)(c)(e)(h)
Source: Department of Business
Table 13: Count of filled jobs by industry, employment status and Indigenous status of person in job, 2014 (a)(c)(e)(h)
Source: Department of Business
Perm Temp Total Perm Temp Total Perm Temp Total
Agriculture, Forestry and Fishing 0 0 0 3 0 3 3 0 3
Arts and Recreation Services 0 8 8 0 2 2 0 10 10
Education and Training 4 3 7 1 9 10 5 12 17
Health Care and Social Assistance 0 1 1 0 5 5 0 6 6
Public Administration and Safety 31 5 36 6 3 9 37 8 45
Retail Trade 1 4 5 0 0 0 1 4 5
Total 37 22 59 10 19 29 47 41 88
2011
Industry (ANZSIC division) Indigenous Non-Indigenous Total
Perm Temp Total Perm Temp Total Perm Temp Total
Agriculture, Forestry and Fishing 0 0 0 2 2 4 2 2 4
Arts and Recreation Services 23 0 23 2 0 2 25 0 25
Education and Training 4 4 8 6 2 8 10 6 16
Health Care and Social Assistance 3 0 3 3 0 3 6 0 6
Public Administration and Safety 23 8 31 10 1 11 33 9 42
Retail Trade 7 0 7 2 1 3 9 1 10
Total 60 12 72 25 6 31 85 18 103
Industry (ANZSIC division)
2014
Indigenous Non-Indigenous Total
18
In 2014 in Ali Curung:
there were 85 permanent jobs an increase of 38 jobs from 2011, including:
o 33 jobs in Public administration and safety, a decrease of 4 jobs from 2011, including:
23 jobs filled by Indigenous persons, a decrease of 8 jobs from 2011
10 jobs filled by non-Indigenous persons, an increase of 4 jobs from 2011
o 25 jobs in Arts and recreation services, an increase of 25 jobs from 2011, including:
23 jobs filled by Indigenous persons, an increase of 23 jobs from 2011
2 jobs filled by non-Indigenous persons, an increase of 2 jobs from 2011
o 10 jobs in Education and training, an increase of 5 jobs from 2011, including:
4 jobs filled by Indigenous persons, unchanged from 2011
6 jobs filled by non-Indigenous persons, an increase of 5 jobs from 2011
there were 18 temporary jobs a decrease of 23 jobs from 2011, including:
o 9 jobs in Public administration and safety, an increase of 1 job from 2011, including:
8 jobs filled by Indigenous persons, an increase of 3 jobs from 2011
1 job filled by a non-Indigenous person, a decrease of 2 jobs from 2011
o 6 jobs in Education and training, a decrease of 6 jobs from 2011, including:
4 jobs filled by Indigenous persons, an increase of 1 job from 2011
2 jobs filled by non-Indigenous persons, a decrease of 7 jobs from 2011
o 2 jobs in Agriculture, forestry and fishing, an increase of 2 jobs from 2011, including:
none of jobs filled by Indigenous persons, unchanged from 2011
2 jobs filled by non-Indigenous persons, an increase of 2 jobs from 2011.
19
2014 Jobs Profile ALI CURUNG
Jobs by Occupation
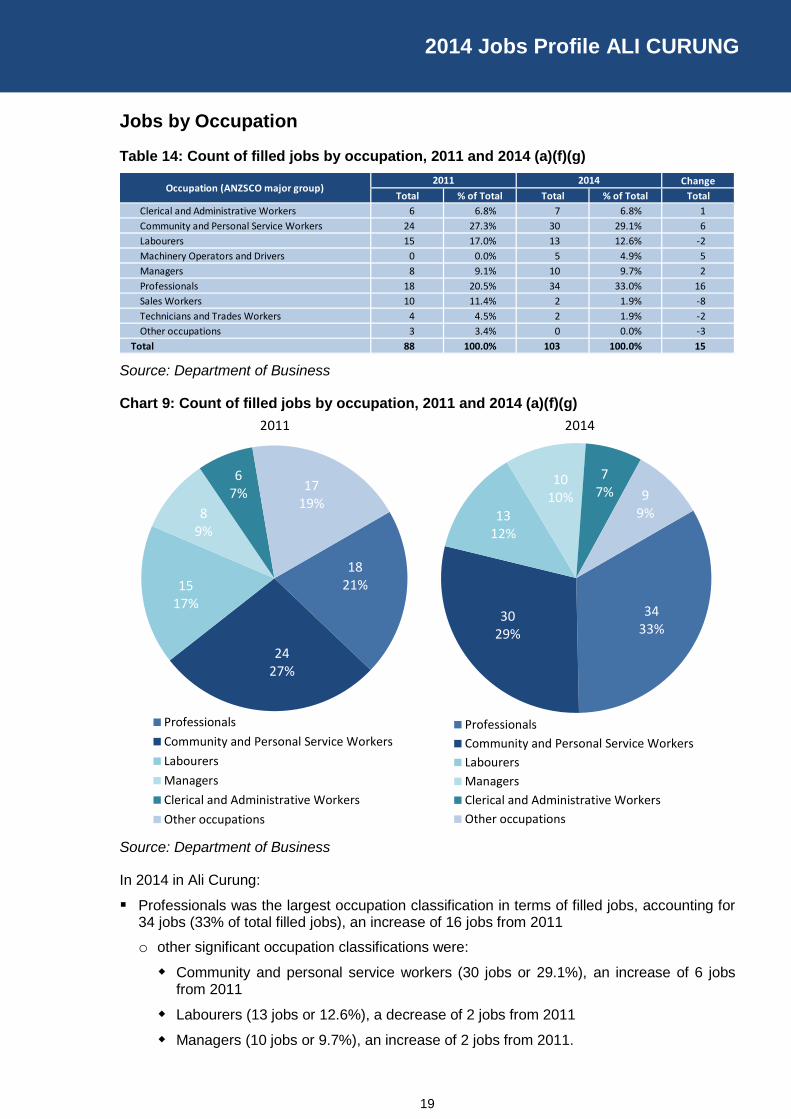
Table 14: Count of filled jobs by occupation, 2011 and 2014 (a)(f)(g)
Source: Department of Business
Chart 9: Count of filled jobs by occupation, 2011 and 2014 (a)(f)(g)
Source: Department of Business
In 2014 in Ali Curung:
Professionals was the largest occupation classification in terms of filled jobs, accounting for 34 jobs (33% of total filled jobs), an increase of 16 jobs from 2011
o other significant occupation classifications were:
Community and personal service workers (30 jobs or 29.1%), an increase of 6 jobs from 2011
Labourers (13 jobs or 12.6%), a decrease of 2 jobs from 2011
Managers (10 jobs or 9.7%), an increase of 2 jobs from 2011.
Change
Total % of Total Total % of Total Total
Clerical and Administrative Workers 6 6.8% 7 6.8% 1
Community and Personal Service Workers 24 27.3% 30 29.1% 6
Labourers 15 17.0% 13 12.6% -2
Machinery Operators and Drivers 0 0.0% 5 4.9% 5
Managers 8 9.1% 10 9.7% 2
Professionals 18 20.5% 34 33.0% 16
Sales Workers 10 11.4% 2 1.9% -8
Technicians and Trades Workers 4 4.5% 2 1.9% -2
Other occupations 3 3.4% 0 0.0% -3
Total 88 100.0% 103 100.0% 15
Occupation (ANZSCO major group)2011 2014
3433%
3029%
1312%
1010%
77% 9
9%
Professionals
Community and Personal Service Workers
Labourers
Managers
Clerical and Administrative Workers
Other occupations
2 2014
1821%
2427%
1517%
89%
67%
1719%
Professionals
Community and Personal Service Workers
Labourers
Managers
Clerical and Administrative Workers
Other occupations
22011
20
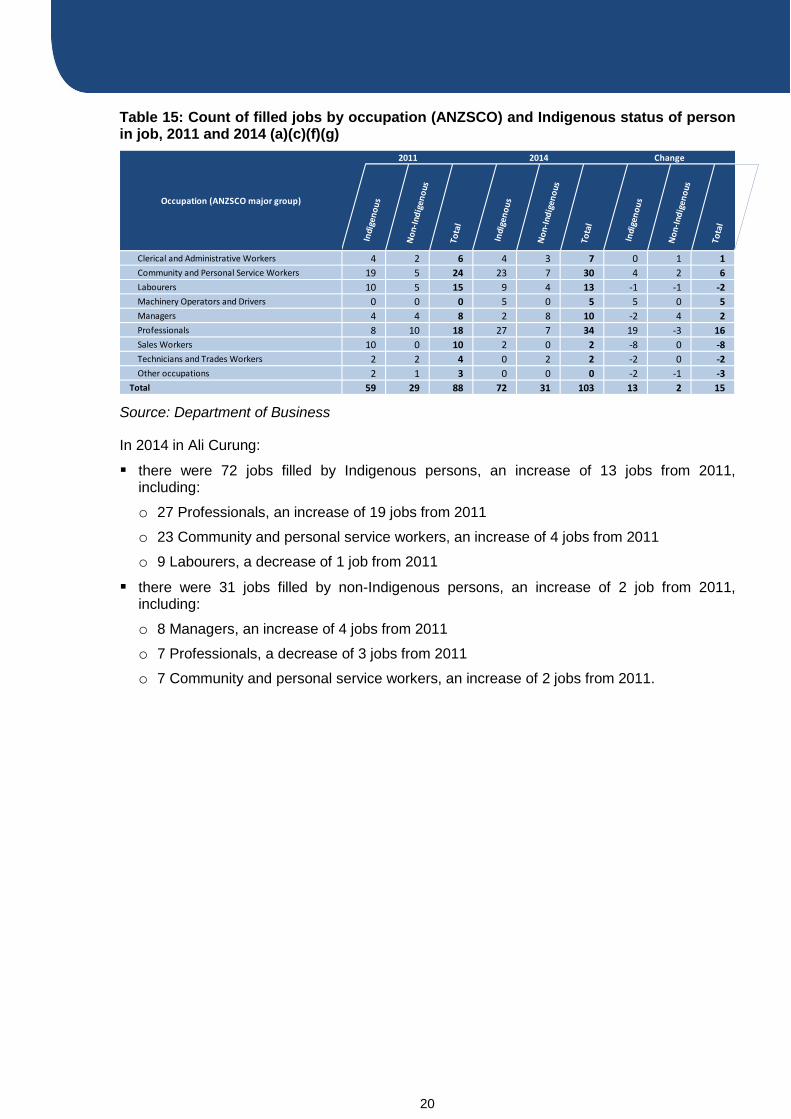
Table 15: Count of filled jobs by occupation (ANZSCO) and Indigenous status of person in job, 2011 and 2014 (a)(c)(f)(g)
Source: Department of Business
In 2014 in Ali Curung:
there were 72 jobs filled by Indigenous persons, an increase of 13 jobs from 2011, including:
o 27 Professionals, an increase of 19 jobs from 2011
o 23 Community and personal service workers, an increase of 4 jobs from 2011
o 9 Labourers, a decrease of 1 job from 2011
there were 31 jobs filled by non-Indigenous persons, an increase of 2 job from 2011, including:
o 8 Managers, an increase of 4 jobs from 2011
o 7 Professionals, a decrease of 3 jobs from 2011
o 7 Community and personal service workers, an increase of 2 jobs from 2011.
2011
Occupation (ANZSCO major group)
Change2014
In
dige
no
us
No
n-In
dig
eno
us
To
tal
In
dige
no
us
No
n-In
dig
eno
us
To
tal
In
dige
no
us
No
n-In
dig
eno
us
To
tal
Occupation (ANZSCO major group)
Clerical and Administrative Workers 4 2 6 4 3 7 0 1 1
Community and Personal Service Workers 19 5 24 23 7 30 4 2 6
Labourers 10 5 15 9 4 13 -1 -1 -2
Machinery Operators and Drivers 0 0 0 5 0 5 5 0 5
Managers 4 4 8 2 8 10 -2 4 2
Professionals 8 10 18 27 7 34 19 -3 16
Sales Workers 10 0 10 2 0 2 -8 0 -8
Technicians and Trades Workers 2 2 4 0 2 2 -2 0 -2
Other occupations 2 1 3 0 0 0 -2 -1 -3
Total 59 29 88 72 31 103 13 2 15
21
2014 Jobs Profile ALI CURUNG
Jobs by Industry by Occupation
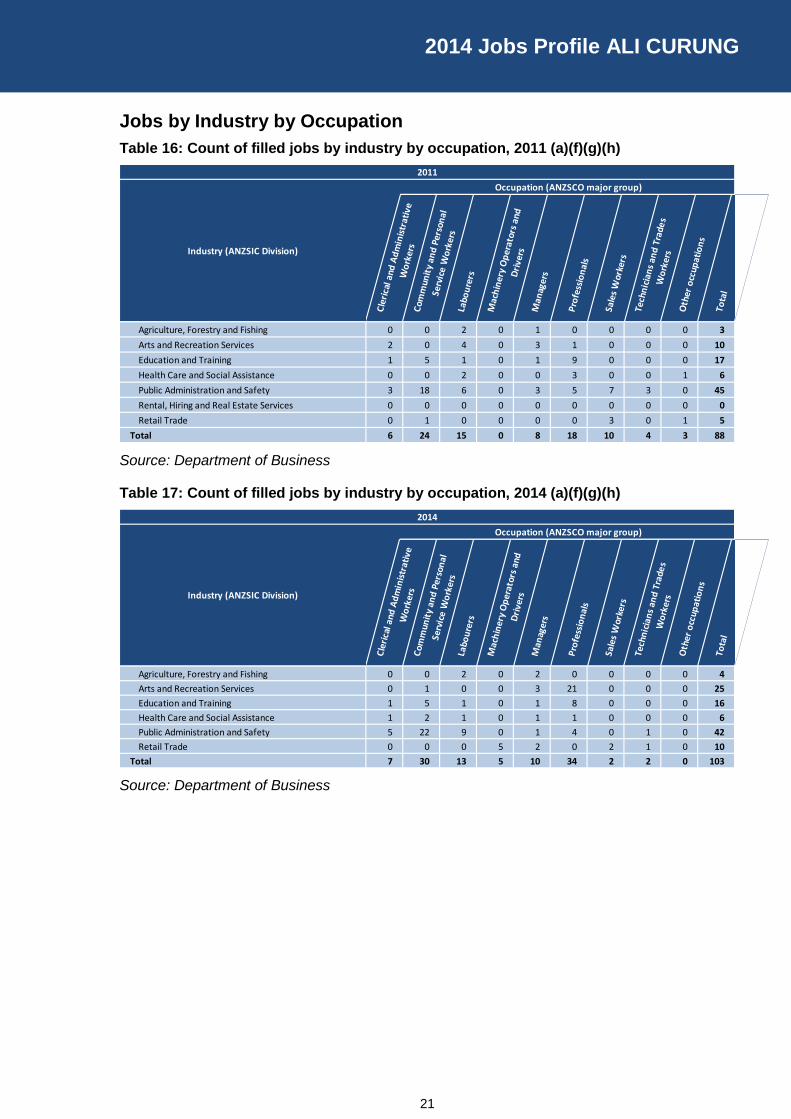
Table 16: Count of filled jobs by industry by occupation, 2011 (a)(f)(g)(h)
Source: Department of Business
Table 17: Count of filled jobs by industry by occupation, 2014 (a)(f)(g)(h)
Source: Department of Business
2011
Industry (ANZSIC Division)
Occupation (ANZSCO major group)
C
leri
cal a
nd A
dm
inis
trat
ive
Wo
rker
s
Com
mun
ity
and
Per
son
al
Serv
ice
Wo
rker
s
Labo
ure
rs
M
ach
iner
y O
per
ator
s an
d
Dri
vers
M
anag
ers
P
rofe
ssio
nal
s
Sa
les
Wor
kers
Te
chn
icia
ns
and
Tra
des
Wo
rker
s
O
ther
occ
upat
ion
s
To
tal
Industry (ANZSIC Division)
Agriculture, Forestry and Fishing 0 0 2 0 1 0 0 0 0 3
Arts and Recreation Services 2 0 4 0 3 1 0 0 0 10
Education and Training 1 5 1 0 1 9 0 0 0 17
Health Care and Social Assistance 0 0 2 0 0 3 0 0 1 6
Public Administration and Safety 3 18 6 0 3 5 7 3 0 45
Rental, Hiring and Real Estate Services 0 0 0 0 0 0 0 0 0 0
Retail Trade 0 1 0 0 0 0 3 0 1 5
Total 6 24 15 0 8 18 10 4 3 88
Occupation (ANZSCO major group)
2014
Industry (ANZSIC Division)
C
leri
cal a
nd A
dm
inis
trat
ive
Wo
rker
s
Com
mun
ity
and
Per
son
al
Serv
ice
Wo
rker
s
Labo
ure
rs
M
ach
iner
y O
per
ator
s an
d
Dri
vers
M
anag
ers
P
rofe
ssio
nal
s
Sa
les
Wor
kers
Te
chn
icia
ns
and
Tra
des
Wo
rker
s
O
ther
occ
upat
ion
s
To
tal
Industry (ANZSIC Division)
Agriculture, Forestry and Fishing 0 0 2 0 2 0 0 0 0 4
Arts and Recreation Services 0 1 0 0 3 21 0 0 0 25
Education and Training 1 5 1 0 1 8 0 0 0 16
Health Care and Social Assistance 1 2 1 0 1 1 0 0 0 6
Public Administration and Safety 5 22 9 0 1 4 0 1 0 42
Retail Trade 0 0 0 5 2 0 2 1 0 10
Total 7 30 13 5 10 34 2 2 0 103
22
In 2014 in Ali Curung:
the majority of Professionals (the largest occupation group) were in the Arts and recreation services industry (the second largest industry)
in the Public administration and safety industry (the largest industry), there were 22 filled jobs for Community and personal service workers, an increase of 4 jobs from 2011
the majority of Community and personal service workers (the second largest occupation group) were in the Public administration and safety industry (the largest industry) and the Education and training industry (the third largest industry), accounting for 22 and 5 jobs respectively.
Jobs by Gender
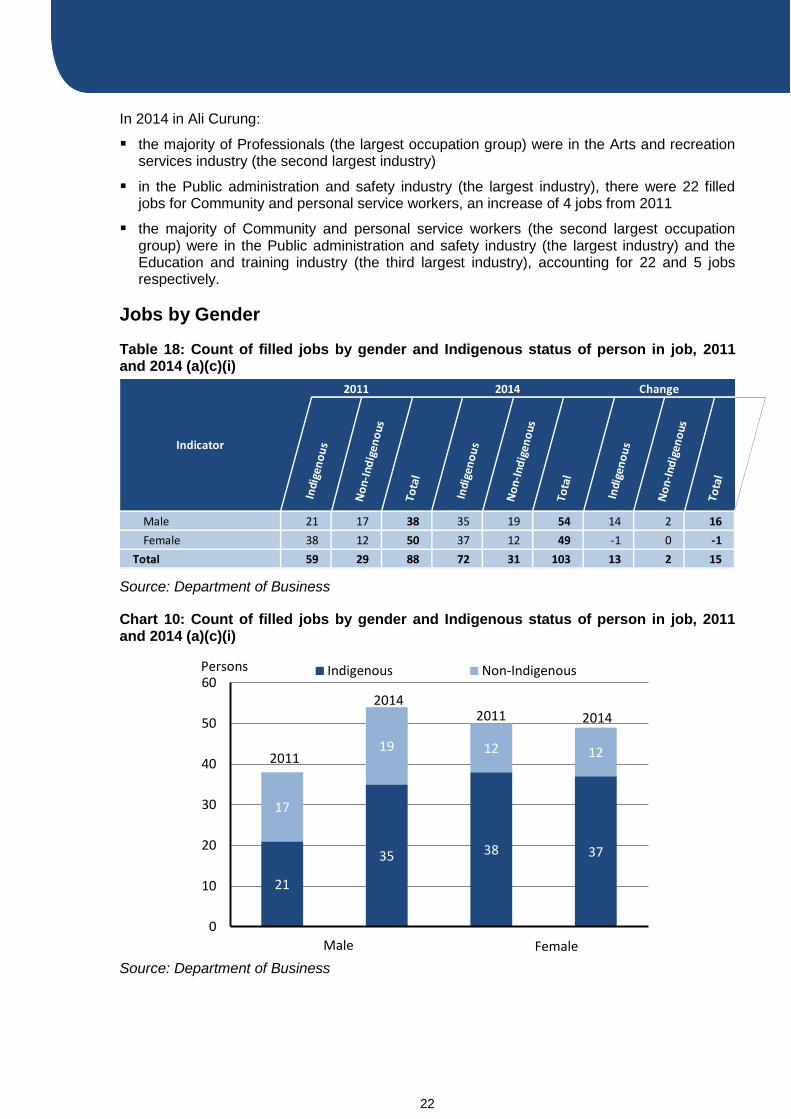
Table 18: Count of filled jobs by gender and Indigenous status of person in job, 2011 and 2014 (a)(c)(i)
Source: Department of Business
Chart 10: Count of filled jobs by gender and Indigenous status of person in job, 2011 and 2014 (a)(c)(i)
Source: Department of Business
Indicator
2011 2014 Change
In
dige
no
us
No
n-In
dig
eno
us
To
tal
In
dige
no
us
No
n-In
dig
eno
us
To
tal
In
dige
no
us
No
n-In
dig
eno
us
To
tal
Indicator
Male 21 17 38 35 19 54 14 2 16
Female 38 12 50 37 12 49 -1 0 -1
Total 59 29 88 72 31 103 13 2 15
21
35 38 37
17
19 12 12
0
10
20
30
40
50
60Indigenous Non-Indigenous
2014
Female
2011
2011
2014
Male
Persons
23
2014 Jobs Profile ALI CURUNG
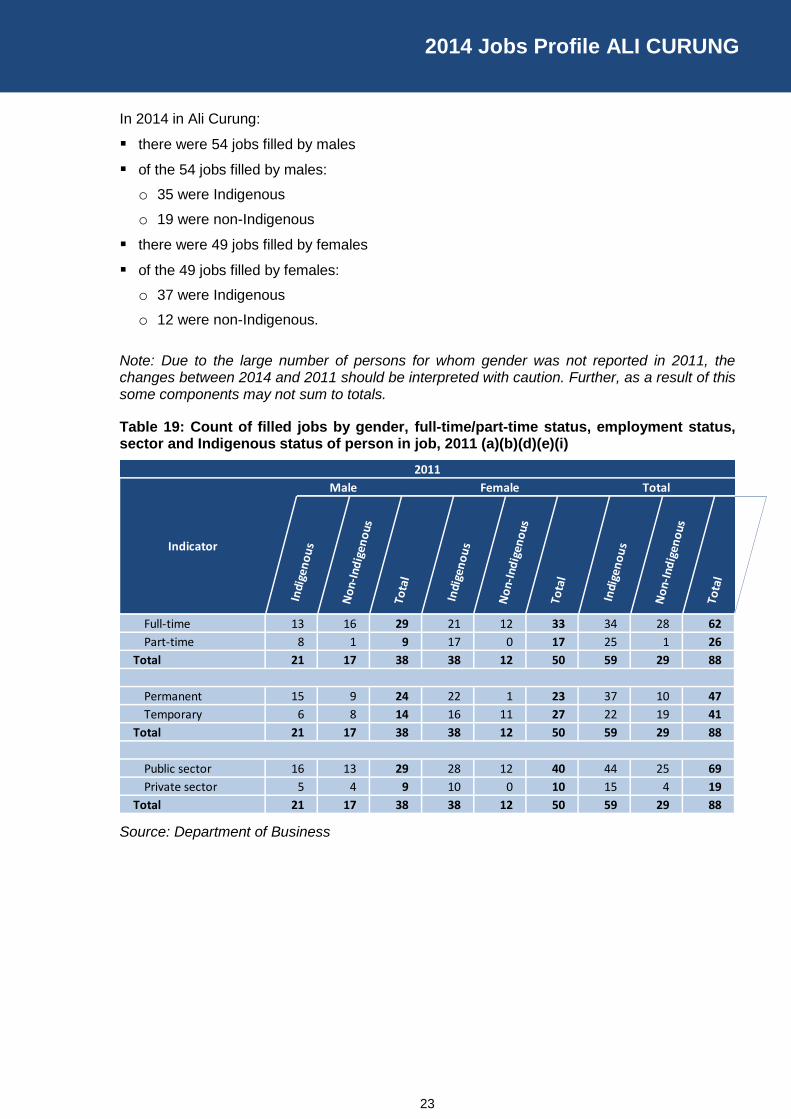
In 2014 in Ali Curung:
there were 54 jobs filled by males
of the 54 jobs filled by males:
o 35 were Indigenous
o 19 were non-Indigenous
there were 49 jobs filled by females
of the 49 jobs filled by females:
o 37 were Indigenous
o 12 were non-Indigenous.
Note: Due to the large number of persons for whom gender was not reported in 2011, the changes between 2014 and 2011 should be interpreted with caution. Further, as a result of this some components may not sum to totals.
Table 19: Count of filled jobs by gender, full-time/part-time status, employment status, sector and Indigenous status of person in job, 2011 (a)(b)(d)(e)(i)
Source: Department of Business
Male Female Total
2011
Indicator
In
dige
no
us
No
n-In
dig
eno
us
To
tal
In
dige
no
us
No
n-In
dig
eno
us
To
tal
In
dige
no
us
No
n-In
dig
eno
us
To
tal
Indicator
Full-time 13 16 29 21 12 33 34 28 62
Part-time 8 1 9 17 0 17 25 1 26
Total 21 17 38 38 12 50 59 29 88
Permanent 15 9 24 22 1 23 37 10 47
Temporary 6 8 14 16 11 27 22 19 41
Total 21 17 38 38 12 50 59 29 88
Public sector 16 13 29 28 12 40 44 25 69
Private sector 5 4 9 10 0 10 15 4 19
Total 21 17 38 38 12 50 59 29 88
24
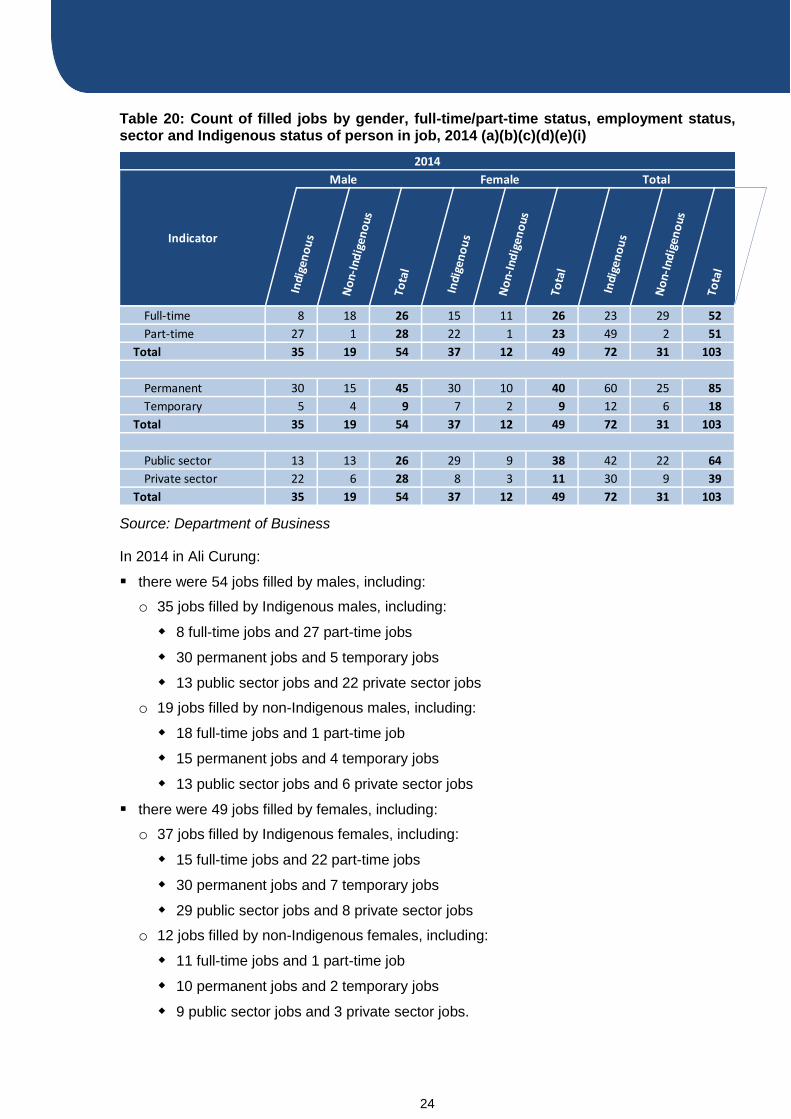
Table 20: Count of filled jobs by gender, full-time/part-time status, employment status, sector and Indigenous status of person in job, 2014 (a)(b)(c)(d)(e)(i)
Source: Department of Business
In 2014 in Ali Curung:
there were 54 jobs filled by males, including:
o 35 jobs filled by Indigenous males, including:
8 full-time jobs and 27 part-time jobs
30 permanent jobs and 5 temporary jobs
13 public sector jobs and 22 private sector jobs
o 19 jobs filled by non-Indigenous males, including:
18 full-time jobs and 1 part-time job
15 permanent jobs and 4 temporary jobs
13 public sector jobs and 6 private sector jobs
there were 49 jobs filled by females, including:
o 37 jobs filled by Indigenous females, including:
15 full-time jobs and 22 part-time jobs
30 permanent jobs and 7 temporary jobs
29 public sector jobs and 8 private sector jobs
o 12 jobs filled by non-Indigenous females, including:
11 full-time jobs and 1 part-time job
10 permanent jobs and 2 temporary jobs
9 public sector jobs and 3 private sector jobs.
2014
Indicator
Male Female Total
In
dige
no
us
No
n-In
dig
eno
us
To
tal
In
dige
no
us
No
n-In
dig
eno
us
To
tal
In
dige
no
us
No
n-In
dig
eno
us
To
tal
Indicator
Full-time 8 18 26 15 11 26 23 29 52
Part-time 27 1 28 22 1 23 49 2 51
Total 35 19 54 37 12 49 72 31 103
Permanent 30 15 45 30 10 40 60 25 85
Temporary 5 4 9 7 2 9 12 6 18
Total 35 19 54 37 12 49 72 31 103
Public sector 13 13 26 29 9 38 42 22 64
Private sector 22 6 28 8 3 11 30 9 39
Total 35 19 54 37 12 49 72 31 103
25
2014 Jobs Profile ALI CURUNG
Jobs by Age
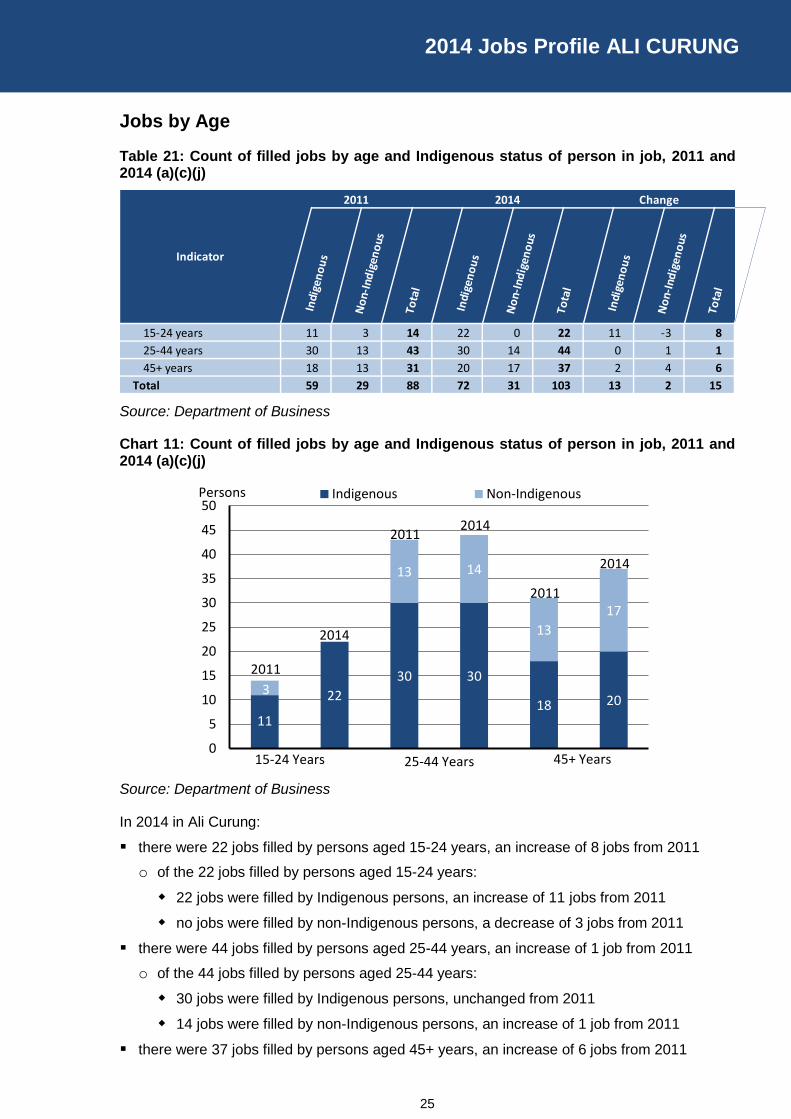
Table 21: Count of filled jobs by age and Indigenous status of person in job, 2011 and 2014 (a)(c)(j)
Source: Department of Business
Chart 11: Count of filled jobs by age and Indigenous status of person in job, 2011 and 2014 (a)(c)(j)
Source: Department of Business
In 2014 in Ali Curung:
there were 22 jobs filled by persons aged 15-24 years, an increase of 8 jobs from 2011
o of the 22 jobs filled by persons aged 15-24 years:
22 jobs were filled by Indigenous persons, an increase of 11 jobs from 2011
no jobs were filled by non-Indigenous persons, a decrease of 3 jobs from 2011
there were 44 jobs filled by persons aged 25-44 years, an increase of 1 job from 2011
o of the 44 jobs filled by persons aged 25-44 years:
30 jobs were filled by Indigenous persons, unchanged from 2011
14 jobs were filled by non-Indigenous persons, an increase of 1 job from 2011
there were 37 jobs filled by persons aged 45+ years, an increase of 6 jobs from 2011
Indicator
2011 2014 Change
In
dige
no
us
No
n-In
dig
eno
us
To
tal
In
dige
no
us
No
n-In
dig
eno
us
To
tal
In
dige
no
us
No
n-In
dig
eno
us
To
tal
Indicator
15-24 years 11 3 14 22 0 22 11 -3 8
25-44 years 30 13 43 30 14 44 0 1 1
45+ years 18 13 31 20 17 37 2 4 6
Total 59 29 88 72 31 103 13 2 15
11
22
30 30
18 203
0
13 14
13
17
0
5
10
15
20
25
30
35
40
45
50Indigenous Non-Indigenous
2014
15-24 Years
2011
Persons
2011
2014
25-44 Years 45+ Years
20142011
15-24 Years
26
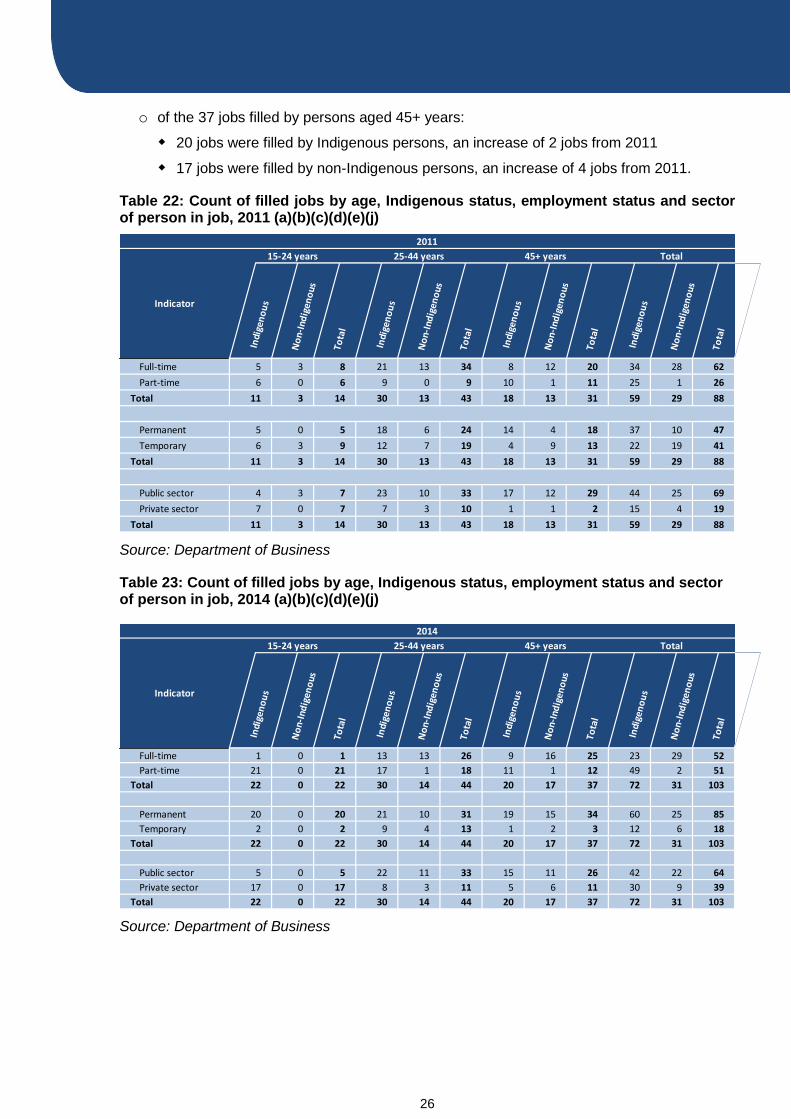
o of the 37 jobs filled by persons aged 45+ years:
20 jobs were filled by Indigenous persons, an increase of 2 jobs from 2011
17 jobs were filled by non-Indigenous persons, an increase of 4 jobs from 2011.
Table 22: Count of filled jobs by age, Indigenous status, employment status and sector of person in job, 2011 (a)(b)(c)(d)(e)(j)
Source: Department of Business
Table 23: Count of filled jobs by age, Indigenous status, employment status and sector of person in job, 2014 (a)(b)(c)(d)(e)(j)
Source: Department of Business
25-44 years 45+ years Total
2011
Indicator
15-24 years
Indi
gen
ou
s
No
n-In
dig
eno
us
To
tal
In
dige
no
us
No
n-In
dig
eno
us
To
tal
In
dige
no
us
No
n-In
dig
eno
us
To
tal
In
dige
no
us
No
n-In
dig
eno
us
To
tal
Indicator
Full-time 5 3 8 21 13 34 8 12 20 34 28 62
Part-time 6 0 6 9 0 9 10 1 11 25 1 26
Total 11 3 14 30 13 43 18 13 31 59 29 88
Permanent 5 0 5 18 6 24 14 4 18 37 10 47
Temporary 6 3 9 12 7 19 4 9 13 22 19 41
Total 11 3 14 30 13 43 18 13 31 59 29 88
Public sector 4 3 7 23 10 33 17 12 29 44 25 69
Private sector 7 0 7 7 3 10 1 1 2 15 4 19
Total 11 3 14 30 13 43 18 13 31 59 29 88
2014
Indicator
15-24 years 25-44 years 45+ years Total
In
dige
no
us
No
n-In
dig
eno
us
To
tal
In
dige
no
us
No
n-In
dig
eno
us
To
tal
In
dige
no
us
No
n-In
dig
eno
us
To
tal
In
dige
no
us
No
n-In
dig
eno
us
To
tal
Indicator
Full-time 1 0 1 13 13 26 9 16 25 23 29 52
Part-time 21 0 21 17 1 18 11 1 12 49 2 51
Total 22 0 22 30 14 44 20 17 37 72 31 103
Permanent 20 0 20 21 10 31 19 15 34 60 25 85
Temporary 2 0 2 9 4 13 1 2 3 12 6 18
Total 22 0 22 30 14 44 20 17 37 72 31 103
Public sector 5 0 5 22 11 33 15 11 26 42 22 64
Private sector 17 0 17 8 3 11 5 6 11 30 9 39
Total 22 0 22 30 14 44 20 17 37 72 31 103
27
2014 Jobs Profile ALI CURUNG
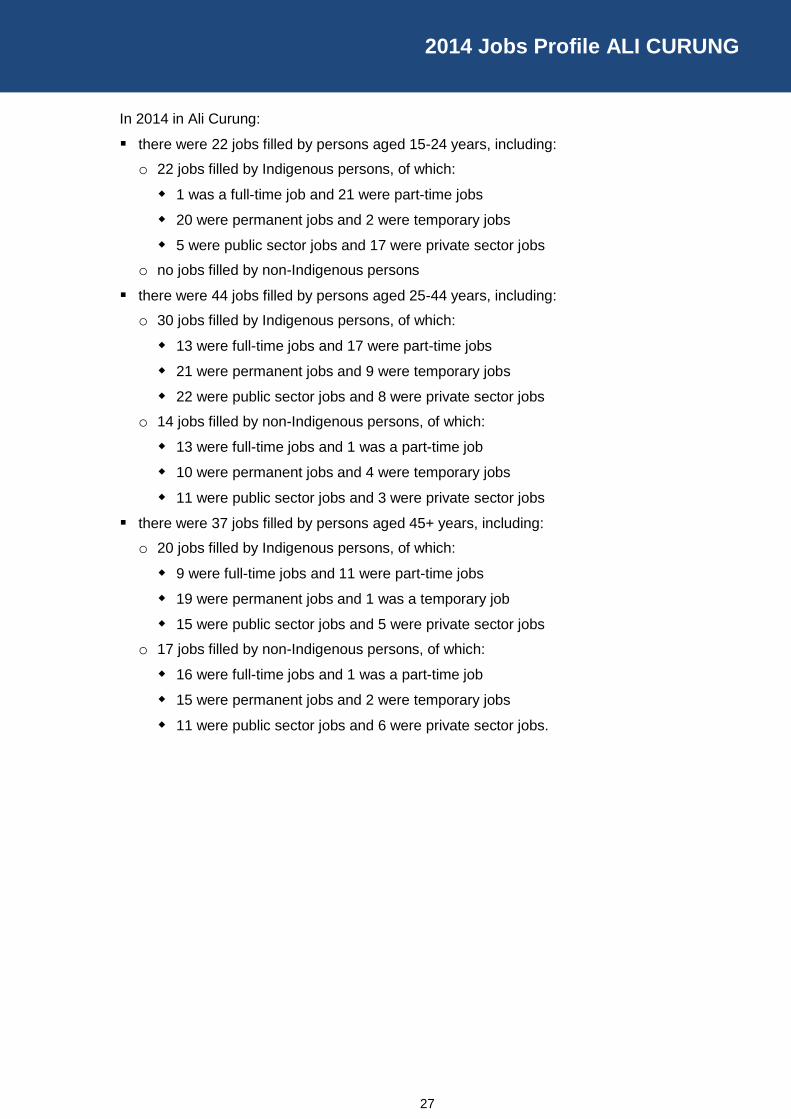
In 2014 in Ali Curung:
there were 22 jobs filled by persons aged 15-24 years, including:
o 22 jobs filled by Indigenous persons, of which:
1 was a full-time job and 21 were part-time jobs
20 were permanent jobs and 2 were temporary jobs
5 were public sector jobs and 17 were private sector jobs
o no jobs filled by non-Indigenous persons
there were 44 jobs filled by persons aged 25-44 years, including:
o 30 jobs filled by Indigenous persons, of which:
13 were full-time jobs and 17 were part-time jobs
21 were permanent jobs and 9 were temporary jobs
22 were public sector jobs and 8 were private sector jobs
o 14 jobs filled by non-Indigenous persons, of which:
13 were full-time jobs and 1 was a part-time job
10 were permanent jobs and 4 were temporary jobs
11 were public sector jobs and 3 were private sector jobs
there were 37 jobs filled by persons aged 45+ years, including:
o 20 jobs filled by Indigenous persons, of which:
9 were full-time jobs and 11 were part-time jobs
19 were permanent jobs and 1 was a temporary job
15 were public sector jobs and 5 were private sector jobs
o 17 jobs filled by non-Indigenous persons, of which:
16 were full-time jobs and 1 was a part-time job
15 were permanent jobs and 2 were temporary jobs
11 were public sector jobs and 6 were private sector jobs.
28
Vocational Education and Training
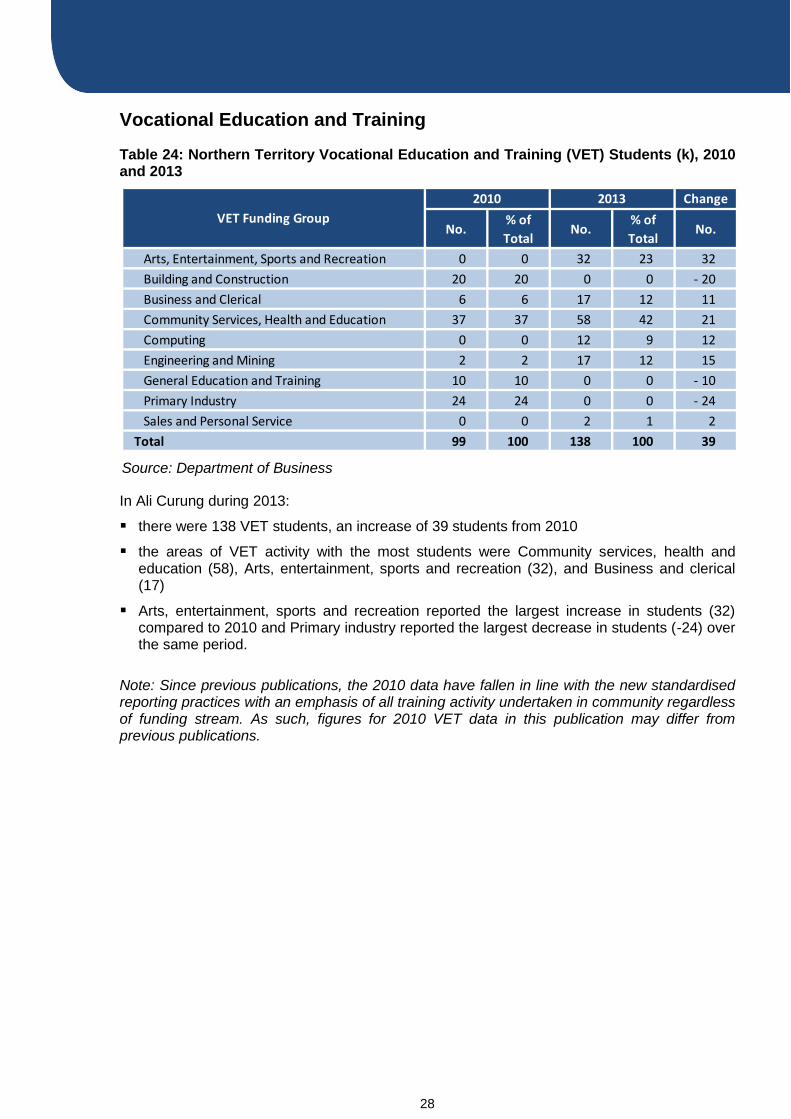
Table 24: Northern Territory Vocational Education and Training (VET) Students (k), 2010 and 2013
Source: Department of Business
In Ali Curung during 2013:
there were 138 VET students, an increase of 39 students from 2010
the areas of VET activity with the most students were Community services, health and education (58), Arts, entertainment, sports and recreation (32), and Business and clerical (17)
Arts, entertainment, sports and recreation reported the largest increase in students (32) compared to 2010 and Primary industry reported the largest decrease in students (-24) over the same period.
Note: Since previous publications, the 2010 data have fallen in line with the new standardised reporting practices with an emphasis of all training activity undertaken in community regardless of funding stream. As such, figures for 2010 VET data in this publication may differ from previous publications.
Change
No.% of
TotalNo.
% of
TotalNo.
Arts, Entertainment, Sports and Recreation 0 0 32 23 32
Building and Construction 20 20 0 0 - 20
Business and Clerical 6 6 17 12 11
Community Services, Health and Education 37 37 58 42 21
Computing 0 0 12 9 12
Engineering and Mining 2 2 17 12 15
General Education and Training 10 10 0 0 - 10
Primary Industry 24 24 0 0 - 24
Sales and Personal Service 0 0 2 1 2
Total 99 100 138 100 39
VET Funding Group
2010 2013

29
2014 Jobs Profile ALI CURUNG
Table 25: Northern Territory Vocational Education and Training (VET) Unit Enrolments (l), 2010 and 2013
Source: Department of Business
In Ali Curung during 2013:
there were 535 VET unit enrolments, an increase of 169 unit enrolments from 2010
the areas of VET activity with the most unit enrolments were Arts, entertainment, sports and recreation (192), Engineering and mining (117), and Business and clerical (83)
Arts, entertainment, sports and recreation reported the largest increase in unit enrolments (192) compared to 2010 and Building and construction reported the largest decrease in unit enrolments (-105) over the same period.
Note: Since previous publications, the 2010 data have fallen in line with the new standardised reporting practices with an emphasis of all training activity undertaken in community regardless of funding stream. As such, figures for 2010 VET data in this publication may differ from previous publications.
Change
No.% of
TotalNo.
% of
TotalNo.
Arts, Entertainment, Sports and Recreation 0 0 192 36 192
Building and Construction 105 29 0 0 - 105
Business and Clerical 52 14 83 16 31
Community Services, Health and Education 125 34 81 15 - 44
Computing 0 0 53 10 53
Engineering and Mining 6 2 117 22 111
General Education and Training 18 5 0 0 - 18
Primary Industry 60 16 0 0 - 60
Sales and Personal Service 0 0 9 2 9
Total 366 100 535 100 169
VET Funding Group
2010 2013
30
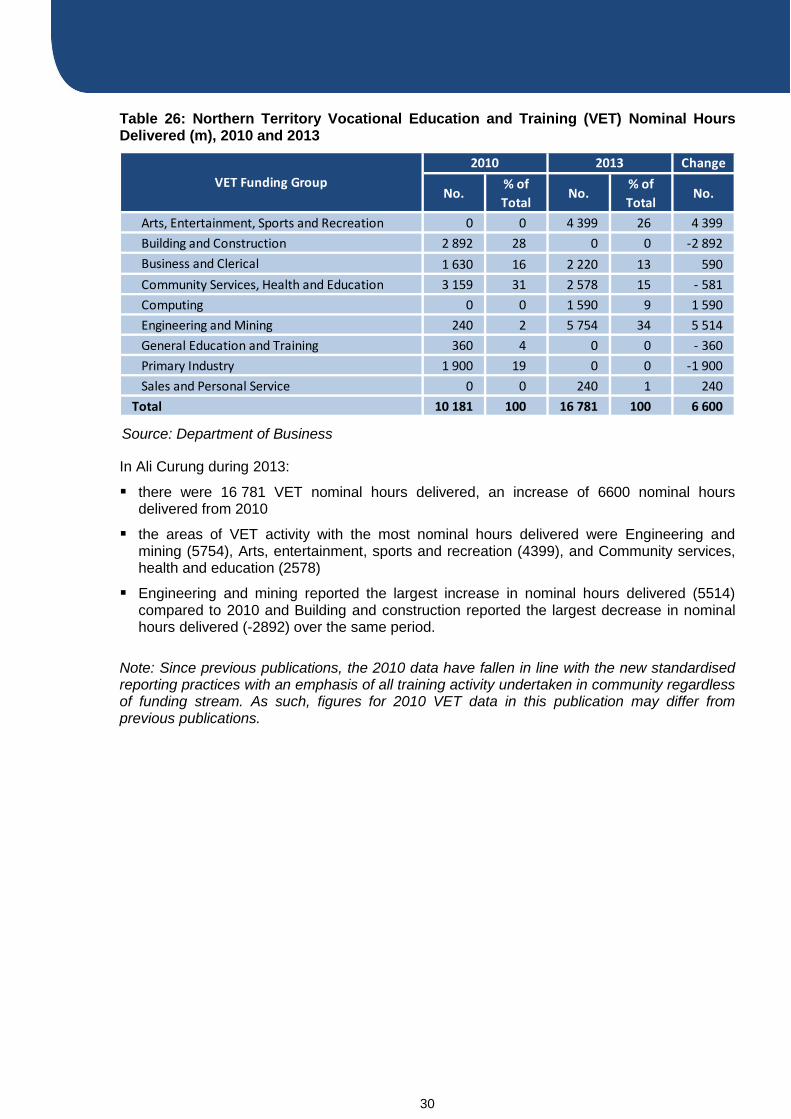
Table 26: Northern Territory Vocational Education and Training (VET) Nominal Hours Delivered (m), 2010 and 2013
Source: Department of Business
In Ali Curung during 2013:
there were 16 781 VET nominal hours delivered, an increase of 6600 nominal hours delivered from 2010
the areas of VET activity with the most nominal hours delivered were Engineering and mining (5754), Arts, entertainment, sports and recreation (4399), and Community services, health and education (2578)
Engineering and mining reported the largest increase in nominal hours delivered (5514) compared to 2010 and Building and construction reported the largest decrease in nominal hours delivered (-2892) over the same period.
Note: Since previous publications, the 2010 data have fallen in line with the new standardised reporting practices with an emphasis of all training activity undertaken in community regardless of funding stream. As such, figures for 2010 VET data in this publication may differ from previous publications.
Change
No.% of
TotalNo.
% of
TotalNo.
Arts, Entertainment, Sports and Recreation 0 0 4 399 26 4 399
Building and Construction 2 892 28 0 0 -2 892
Business and Clerical 1 630 16 2 220 13 590
Community Services, Health and Education 3 159 31 2 578 15 - 581
Computing 0 0 1 590 9 1 590
Engineering and Mining 240 2 5 754 34 5 514
General Education and Training 360 4 0 0 - 360
Primary Industry 1 900 19 0 0 -1 900
Sales and Personal Service 0 0 240 1 240
Total 10 181 100 16 781 100 6 600
VET Funding Group
2010 2013
31
2014 Jobs Profile ALI CURUNG
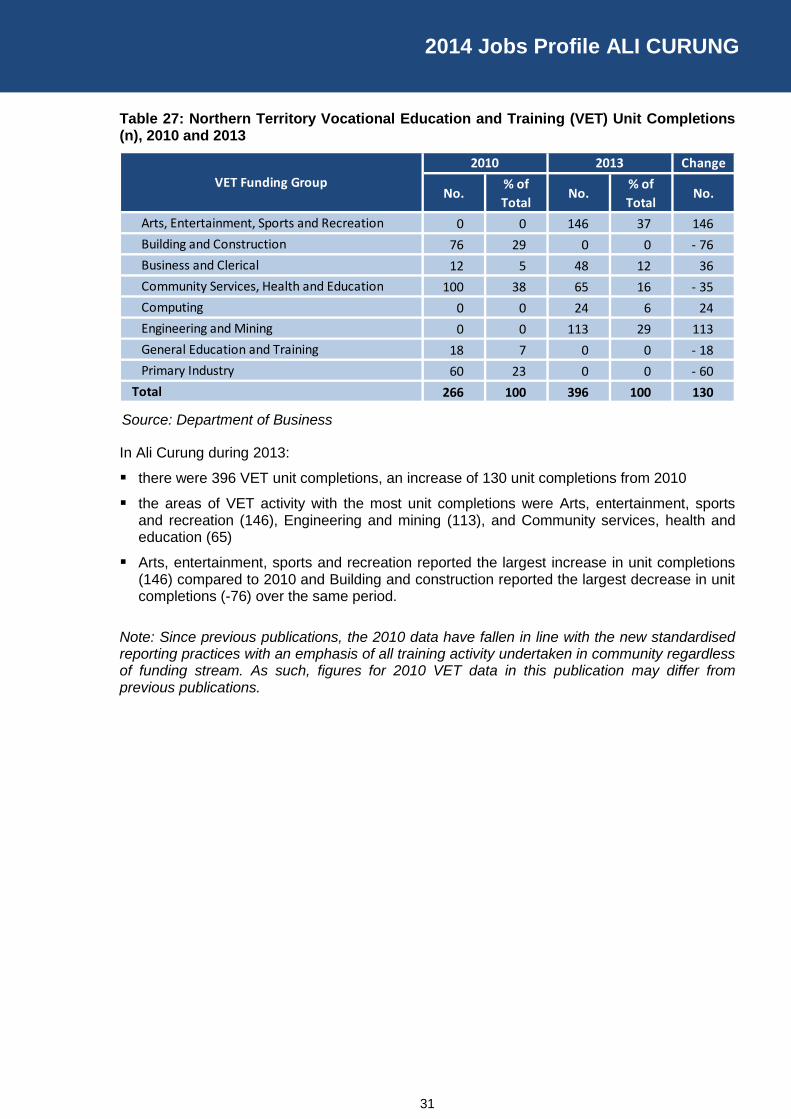
Table 27: Northern Territory Vocational Education and Training (VET) Unit Completions (n), 2010 and 2013
Source: Department of Business
In Ali Curung during 2013:
there were 396 VET unit completions, an increase of 130 unit completions from 2010
the areas of VET activity with the most unit completions were Arts, entertainment, sports and recreation (146), Engineering and mining (113), and Community services, health and education (65)
Arts, entertainment, sports and recreation reported the largest increase in unit completions (146) compared to 2010 and Building and construction reported the largest decrease in unit completions (-76) over the same period.
Note: Since previous publications, the 2010 data have fallen in line with the new standardised reporting practices with an emphasis of all training activity undertaken in community regardless of funding stream. As such, figures for 2010 VET data in this publication may differ from previous publications.
Change
No.% of
TotalNo.
% of
TotalNo.
Arts, Entertainment, Sports and Recreation 0 0 146 37 146
Building and Construction 76 29 0 0 - 76
Business and Clerical 12 5 48 12 36
Community Services, Health and Education 100 38 65 16 - 35
Computing 0 0 24 6 24
Engineering and Mining 0 0 113 29 113
General Education and Training 18 7 0 0 - 18
Primary Industry 60 23 0 0 - 60
Total 266 100 396 100 130
VET Funding Group
2010 2013
32
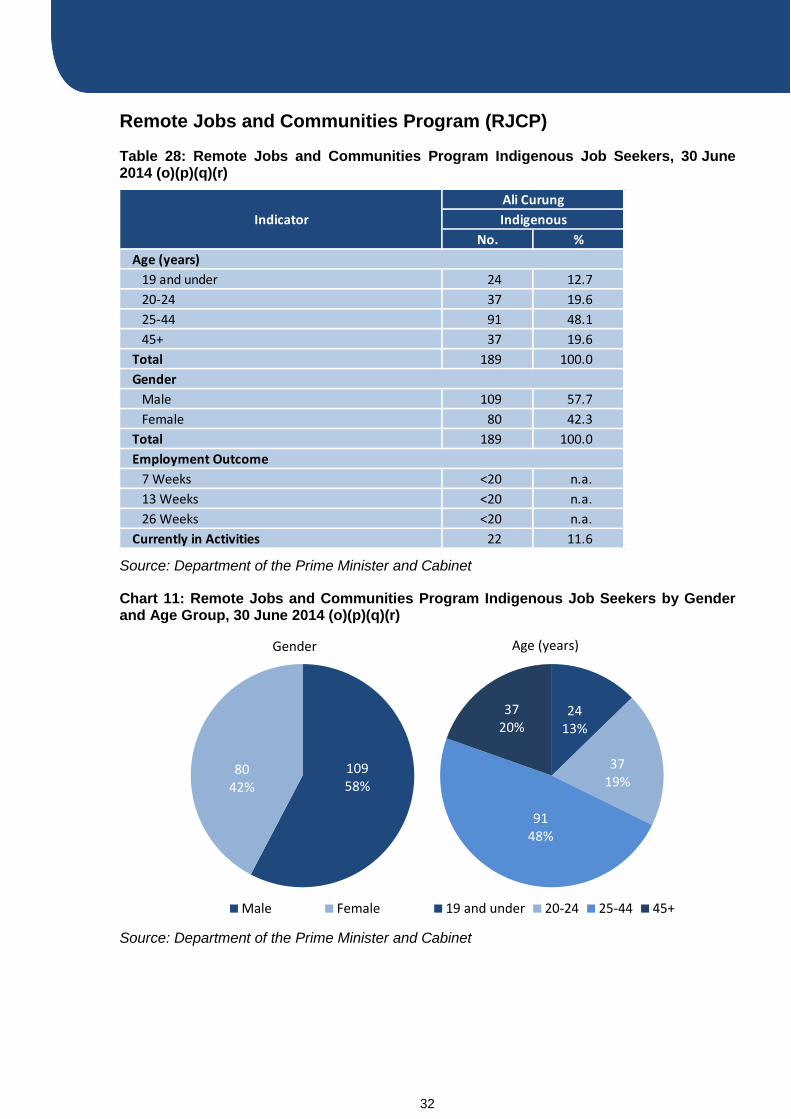
Remote Jobs and Communities Program (RJCP)
Table 28: Remote Jobs and Communities Program Indigenous Job Seekers, 30 June 2014 (o)(p)(q)(r)
Source: Department of the Prime Minister and Cabinet
Chart 11: Remote Jobs and Communities Program Indigenous Job Seekers by Gender and Age Group, 30 June 2014 (o)(p)(q)(r)
Source: Department of the Prime Minister and Cabinet
No. %
19 and under 24 12.7
20-24 37 19.6
25-44 91 48.1
45+ 37 19.6
Total 189 100.0
Male 109 57.7
Female 80 42.3
Total 189 100.0
7 Weeks <20 n.a.
13 Weeks <20 n.a.
26 Weeks <20 n.a.
Currently in Activities 22 11.6
Ali Curung
Indigenous
Age (years)
Gender
Employment Outcome
Indicator
10958%
8042%
Male Female
2413%
3719%
9148%
3720%
19 and under 20-24 25-44 45+
Gender Age (years)
33
2014 Jobs Profile ALI CURUNG
As at 30 June 2014 in Ali Curung:
there were 189 RJCP Indigenous job seekers
of these:
o 109 (57.7%) were male and 80 (42.3%) were female
o 24 (12.7%) were aged 19 years and under, 37 (19.6%) were aged 20-24 years, 91 (48.1%) were aged 25-44 years, and 37 (19.6%) were aged 45+ years
o less than 20 had reached the respective 7, 13 and 26 week reporting milestones
o 22 (11.6%) were currently in activities.
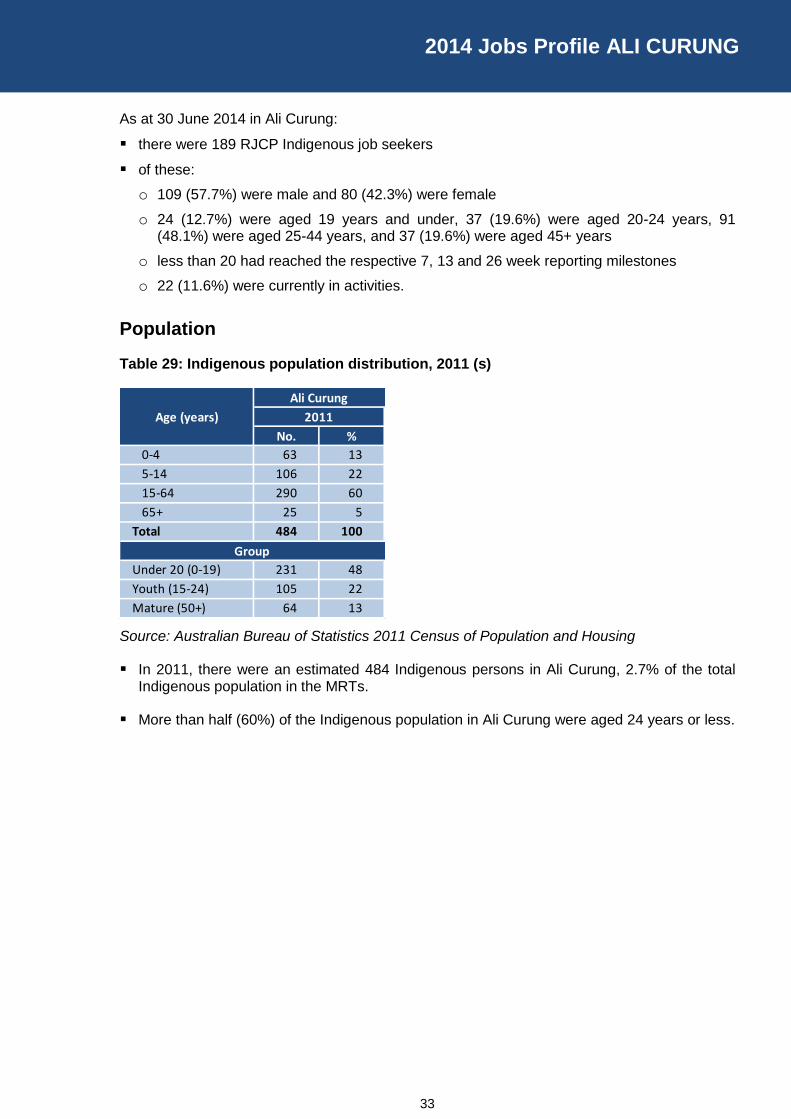
Population
Table 29: Indigenous population distribution, 2011 (s)
Source: Australian Bureau of Statistics 2011 Census of Population and Housing
In 2011, there were an estimated 484 Indigenous persons in Ali Curung, 2.7% of the total Indigenous population in the MRTs.
More than half (60%) of the Indigenous population in Ali Curung were aged 24 years or less.
No. %
0-4 63 13
5-14 106 22
15-64 290 60
65+ 25 5
Total 484 100
Under 20 (0-19) 231 48
Youth (15-24) 105 22
Mature (50+) 64 13
Age (years) 2011
Ali Curung
Group
34
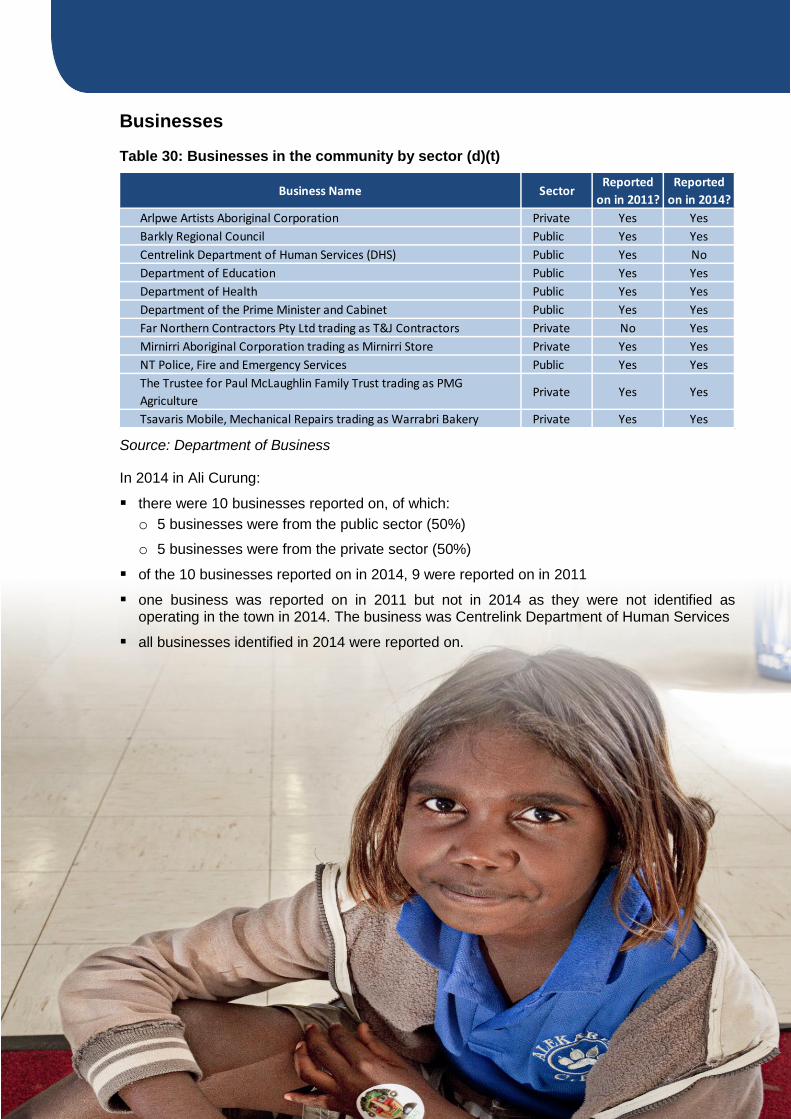
Businesses
Table 30: Businesses in the community by sector (d)(t)
Source: Department of Business
In 2014 in Ali Curung:
there were 10 businesses reported on, of which:
o 5 businesses were from the public sector (50%)
o 5 businesses were from the private sector (50%)
of the 10 businesses reported on in 2014, 9 were reported on in 2011
one business was reported on in 2011 but not in 2014 as they were not identified as operating in the town in 2014. The business was Centrelink Department of Human Services
all businesses identified in 2014 were reported on.
Business Name SectorReported
on in 2011?
Reported
on in 2014?
Arlpwe Artists Aboriginal Corporation Private Yes Yes
Barkly Regional Council Public Yes Yes
Centrelink Department of Human Services (DHS) Public Yes No
Department of Education Public Yes Yes
Department of Health Public Yes Yes
Department of the Prime Minister and Cabinet Public Yes Yes
Far Northern Contractors Pty Ltd trading as T&J Contractors Private No Yes
Mirnirri Aboriginal Corporation trading as Mirnirri Store Private Yes Yes
NT Police, Fire and Emergency Services Public Yes Yes
The Trustee for Paul McLaughlin Family Trust trading as PMG
AgriculturePrivate Yes Yes
Tsavaris Mobile, Mechanical Repairs trading as Warrabri Bakery Private Yes Yes
35
2014 Jobs Profile ALI CURUNG
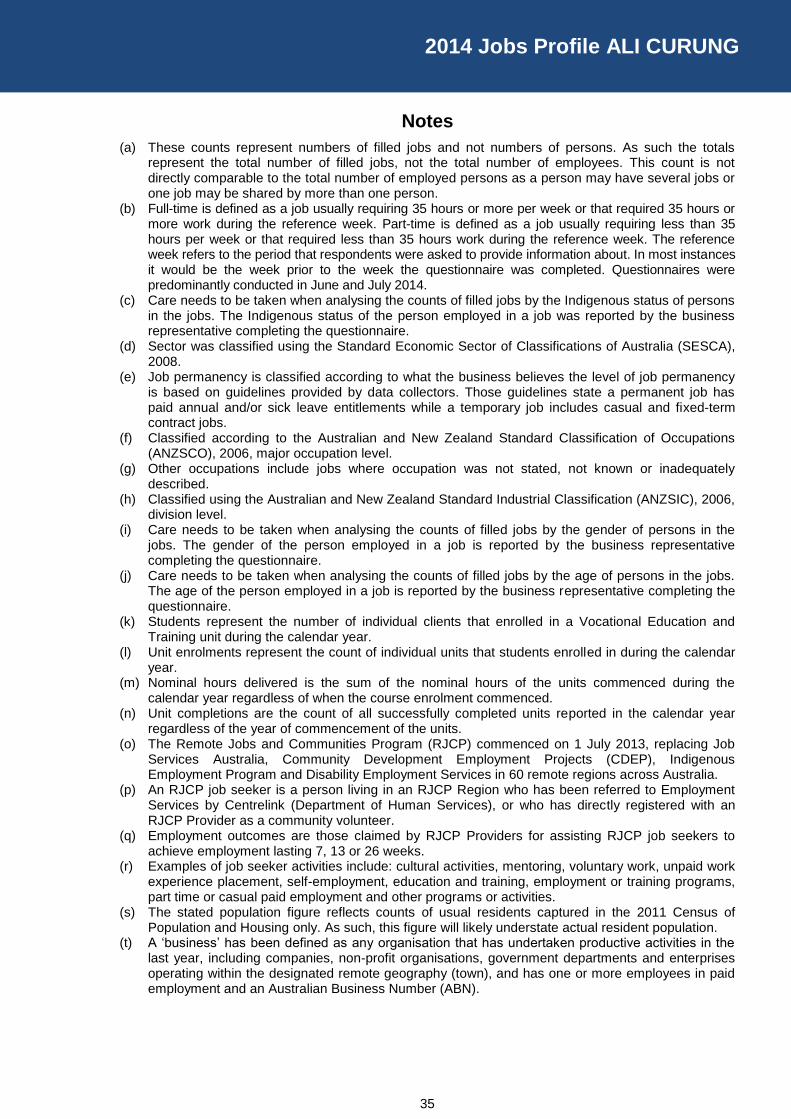
Notes
(a) These counts represent numbers of filled jobs and not numbers of persons. As such the totals represent the total number of filled jobs, not the total number of employees. This count is not directly comparable to the total number of employed persons as a person may have several jobs or one job may be shared by more than one person.
(b) Full-time is defined as a job usually requiring 35 hours or more per week or that required 35 hours or more work during the reference week. Part-time is defined as a job usually requiring less than 35 hours per week or that required less than 35 hours work during the reference week. The reference week refers to the period that respondents were asked to provide information about. In most instances it would be the week prior to the week the questionnaire was completed. Questionnaires were predominantly conducted in June and July 2014.
(c) Care needs to be taken when analysing the counts of filled jobs by the Indigenous status of persons in the jobs. The Indigenous status of the person employed in a job was reported by the business representative completing the questionnaire.
(d) Sector was classified using the Standard Economic Sector of Classifications of Australia (SESCA), 2008.
(e) Job permanency is classified according to what the business believes the level of job permanency is based on guidelines provided by data collectors. Those guidelines state a permanent job has paid annual and/or sick leave entitlements while a temporary job includes casual and fixed-term contract jobs.
(f) Classified according to the Australian and New Zealand Standard Classification of Occupations (ANZSCO), 2006, major occupation level.
(g) Other occupations include jobs where occupation was not stated, not known or inadequately described.
(h) Classified using the Australian and New Zealand Standard Industrial Classification (ANZSIC), 2006, division level.
(i) Care needs to be taken when analysing the counts of filled jobs by the gender of persons in the jobs. The gender of the person employed in a job is reported by the business representative completing the questionnaire.
(j) Care needs to be taken when analysing the counts of filled jobs by the age of persons in the jobs. The age of the person employed in a job is reported by the business representative completing the questionnaire.
(k) Students represent the number of individual clients that enrolled in a Vocational Education and Training unit during the calendar year.
(l) Unit enrolments represent the count of individual units that students enrolled in during the calendar year.
(m) Nominal hours delivered is the sum of the nominal hours of the units commenced during the calendar year regardless of when the course enrolment commenced.
(n) Unit completions are the count of all successfully completed units reported in the calendar year regardless of the year of commencement of the units.
(o) The Remote Jobs and Communities Program (RJCP) commenced on 1 July 2013, replacing Job Services Australia, Community Development Employment Projects (CDEP), Indigenous Employment Program and Disability Employment Services in 60 remote regions across Australia.
(p) An RJCP job seeker is a person living in an RJCP Region who has been referred to Employment Services by Centrelink (Department of Human Services), or who has directly registered with an RJCP Provider as a community volunteer.
(q) Employment outcomes are those claimed by RJCP Providers for assisting RJCP job seekers to achieve employment lasting 7, 13 or 26 weeks.
(r) Examples of job seeker activities include: cultural activities, mentoring, voluntary work, unpaid work experience placement, self-employment, education and training, employment or training programs, part time or casual paid employment and other programs or activities.
(s) The stated population figure reflects counts of usual residents captured in the 2011 Census of Population and Housing only. As such, this figure will likely understate actual resident population.
(t) A ‘business’ has been defined as any organisation that has undertaken productive activities in the last year, including companies, non-profit organisations, government departments and enterprises operating within the designated remote geography (town), and has one or more employees in paid employment and an Australian Business Number (ABN).
36
Abbreviations and Acronyms
ANZSCO Australian and New Zealand Standard Classification of Occupations
ANZSIC Australian and New Zealand Standard Industrial Classification
d.n.p Did not participate
ICT Information and communications technology
MRT Major Remote Town
n.a. Not available
No. Number
Perm Permanent
ppt Percentage point
RJCP Remote Jobs and Communities Program
RSD Remote Service Delivery
Temp Temporary
VET Vocational Education and Training
For more information, please contact:
Department of Business GPO Box 3200 Darwin NT 0801
Phone: 08 8982 1700 Fax: 08 8982 1725 Email: [email protected] Website: www.nt.gov.au/dob ACKNOWLEDGEMENTS:
Department of the Prime Minister and Cabinet
Barkly Regional Council Kieran Brockman and Joseph Kuhn Published by the Department of Business
© Northern Territory Government 2014
Apart from any use permitted under the Australian Copyright Act 1968 no part of this document may be reproduced without permission from the Northern Territory Government through the Department of Business.