ALGEBRA/ DATA ANALYSIS - School Improvement in...
27
ALGEBRA/ DATA ANALYSIS Public Release, Fall 2004
Transcript of ALGEBRA/ DATA ANALYSIS - School Improvement in...

ALGEBRA/DATA ANALYSIS
Public Release, Fall 2004

Developed and published under contract with the Maryland State Department of Education by Educational TestingService. Copyright © 2004 by the Maryland State Department of Education. All rights reserved. No part of thispublication may be reproduced or distributed in any form or by any means, or stored in a database or retrieval system,without the prior written permission of the Maryland State Department of Education. ETS and the ETS logo areregistered trademarks of Educational Testing Service.

Session 1
Algebra Fall 2004 Page 1Public Release, Fall 2004 © 2004 Maryland State Department of Education
Response Grid Questions
Several questions in this test require you to enter your answer on a special grid like the oneshown below.
0
1
2
3
4
5
7
8
0 0 0 0
1 1 1 1
2 2 2 2
3 3 3 3
4 4 4 4
5 5 5 5
6 6 6 6
7 7 7 7
8 8 8 8
9 9 9 99
6
answer boxesfraction barsdecimal points
number bubbles
Directions for Completing the Response Grids
1. Find the answer to the problem.
2. Write your answer in the boxes at the top of the grid.
• You may start your answer at either end of the answer box. Print your answer withthe first digit (or symbol) in the left answer box, or with the last digit in the rightanswer box.
• Print no more than one digit or symbol in each answer box. Do not leave a blankanswer box in the middle of an answer.
• Be sure to write a decimal point or fraction bar in the answer box if it is part of theanswer.
3. Fill in the appropriate bubble under each box in which you wrote your answer.
• Fill in only one bubble for each answer box used in your answer. Do not fill in abubble under an unused answer box.
• You must fill in the bubbles accurately to receive credit for your answer.
Session 1
Algebra Fall 2004 Page 2Public Release, Fall 2004 © 2004 Maryland State Department of Education
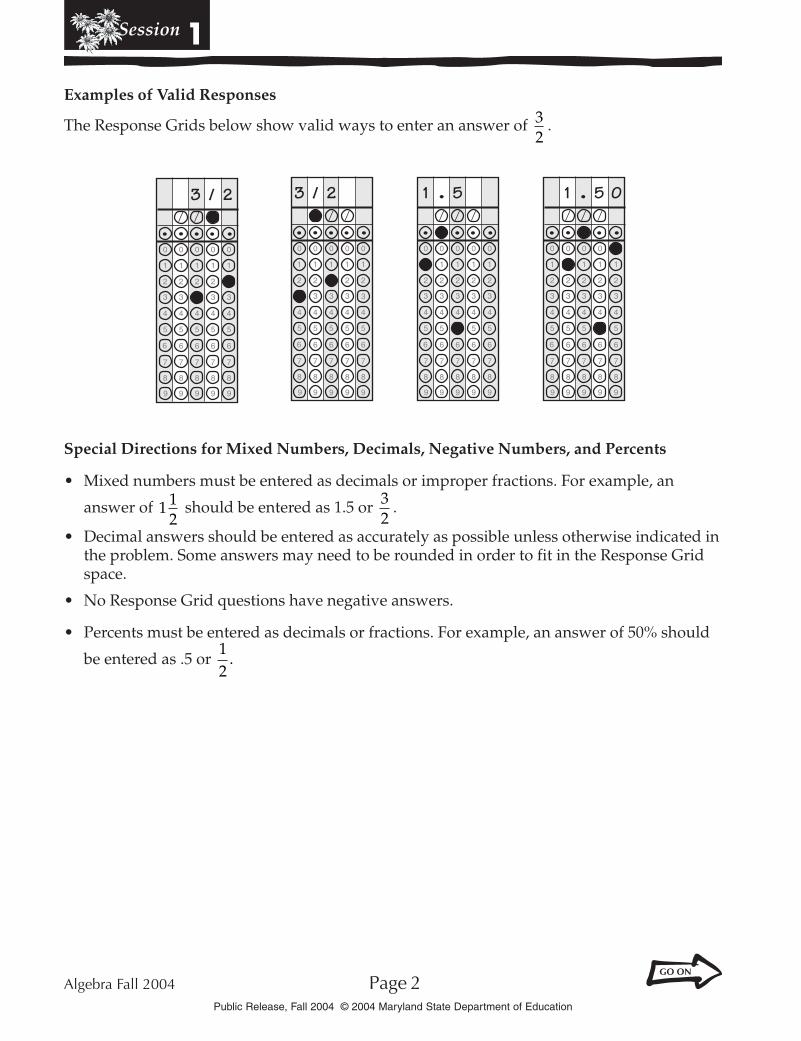
Examples of Valid Responses
The Response Grids below show valid ways to enter an answer of 32
.
0
1
2
3
4
5
7
8
0 0 0 0
1 1 1 1
2 2 2 2
3 3 3 3
4 4 4 4
5 5 5 5
6 6 6 6
7 7 7 7
8 8 8 8
9 9 9 99
. . . . ./ / /
6
3 / 2
0
1
2
3
4
5
7
8
0 0 0 0
1 1 1 1
2 2 2 2
3 3 3
4 4 4 4
5 5 5 5
6 6 6 6
7 7 7 7
8 8 8 8
9 9 9 99
. . . . ./ / /
6
3 / 2
0
1
2
3
4
5
7
8
0 0 0 0
1 1 1 1
2 2 2 2
3 3 3 3
4 4 4 4
5 5 5 5
6 6 6 6
7 7 7 7
8 8 8 8
9 9 9 99
. . . . ./ / /
6
1 . 5
0
1
2
3
4
5
7
8
0 0 0 0
1 1 1 1
2 2 2 2
3 3 3 3
4 4 4 4
5 5 5 5
6 6 6 6
7 7 7 7
8 8 8 8
9 9 9 99
. . . . ./ / /
6
1 . 5 0
3
Special Directions for Mixed Numbers, Decimals, Negative Numbers, and Percents
• Mixed numbers must be entered as decimals or improper fractions. For example, an
answer of 1 12
should be entered as 1.5 or 32
.
• Decimal answers should be entered as accurately as possible unless otherwise indicated inthe problem. Some answers may need to be rounded in order to fit in the Response Gridspace.
• No Response Grid questions have negative answers.
• Percents must be entered as decimals or fractions. For example, an answer of 50% should
be entered as .5 or 12
.

Session 1
Algebra Fall 2004 Page 3Public Release, Fall 2004 © 2004 Maryland State Department of Education
Directions
Use the Response Grid in theAnswer Book to complete Sample A.
Sample A
Diana earned the scores below onher science tests.
79, 98, 85, 91
What is the mean of these scores?
Sample B
Look at the pattern below.
0, 2, 4, 6, 8, . . .
If the pattern continues, what willbe the next term?
A 2
B 8
C 10
D 14
MDA00000
Sample C
The sum of the angles of a triangleis 180 degrees. The measures oftwo angles of a triangle are x and3x. Which of these expressionsrepresents the measure of the thirdangle?
F 180 3+ +x x
G 180 3− +x x
H 180 3− −x x
J 180 3+ −x xMDA00000

Session 1
Algebra Fall 2004 Page 4Public Release, Fall 2004 © 2004 Maryland State Department of Education
■1 Two ships travel in the Chesapeake Bay. The graph below shows the distancebetween the two ships during the time the ships travel.
y
x0 2010 30 5040 60
60
50
40
30
20
10Dis
tan
ce (i
n k
ilom
eter
s)
Travel Time (in minutes)
DISTANCE BETWEENTWO SHIPS
How many minutes have the ships traveled when the distance between themis the shortest?
A 10 minutes
B 20 minutes
C 40 minutes
D 60 minutes
(3) 51556
Session 1
Algebra Fall 2004 Page 5Public Release, Fall 2004 © 2004 Maryland State Department of Education
■2 A park ranger spent $208 to buy12 trees. Redwood trees cost$24 each and spruce trees cost$16 each. How many of each treedid the park ranger buy?
F 10 redwoods and 2 spruce
G 9 redwoods and 3 spruce
H 3 redwoods and 9 spruce
J 2 redwoods and 10 spruce
(4) 51538
■3 Paul earned scores of 76, 78, and 86on his first three science tests. Whatscore does he need on his fourth testto earn a mean score of 82?
A 78
B 80
C 84
D 88
(4) 51509
Session 1
Algebra Fall 2004 Page 6Public Release, Fall 2004 © 2004 Maryland State Department of Education
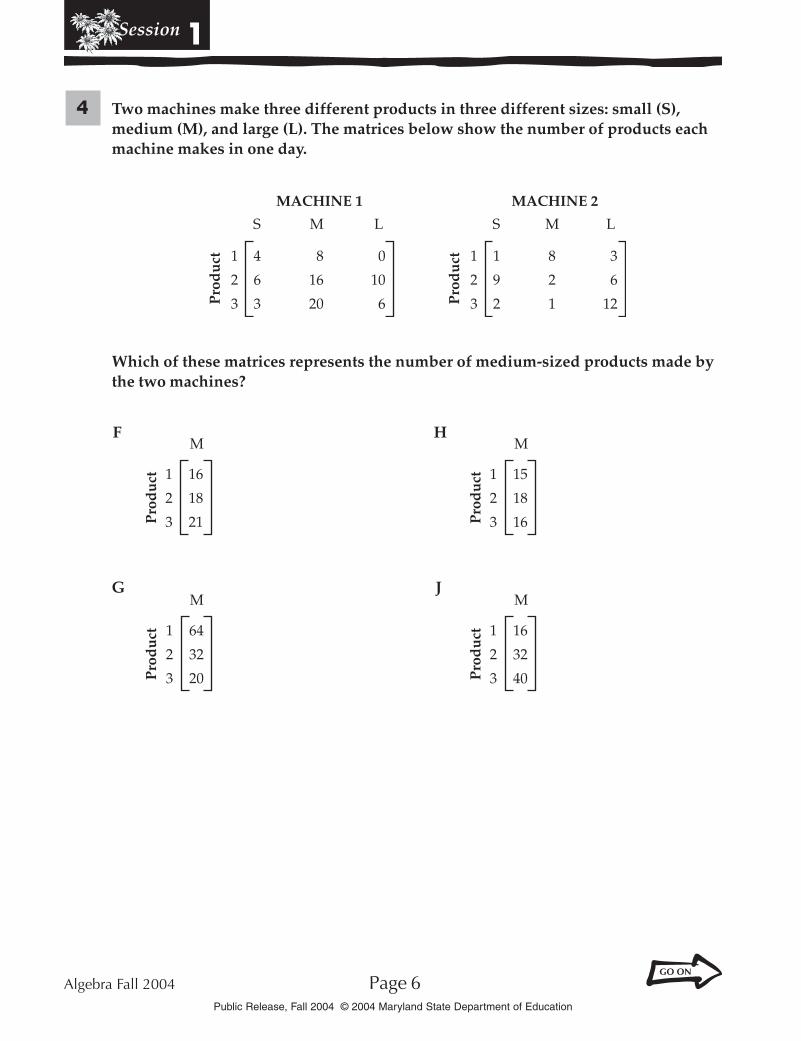
■4 Two machines make three different products in three different sizes: small (S),medium (M), and large (L). The matrices below show the number of products eachmachine makes in one day.
4
6
3
1
2
3
8
16
20
0
10
6
S M L
MACHINE 1P
rod
uct 1
9
2
1
2
3
8
2
1
3
6
12
S M L
MACHINE 2
Pro
du
ct
Which of these matrices represents the number of medium-sized products made bythe two machines?
16
32
40
1
2
3
M
Pro
du
ct
J
H
G
F
15
18
16
1
2
3
M
Pro
du
ct
64
32
20
1
2
3
M
Pro
du
ct
16
18
21
1
2
3
M
Pro
du
ct
(1) 51498

Session 1
Algebra Fall 2004 Page 7Public Release, Fall 2004 © 2004 Maryland State Department of Education
5BCR
Matt caught 6 fish and recorded each of their weights as shown in the table below.
FishWeight
(in pounds)
1
2
3
4
5
6
2
3
2
4
32
5
MATT’S FISH
Complete the following in the Answer Book:
• Find the mean and the median of the data.
• Which measure of central tendency, mean or median, should Matt use to bestrepresent the typical weight of the fish he caught? Use mathematics to justifyyour answer.
(~) 51537
Session 1
Algebra Fall 2004 Page 8Public Release, Fall 2004 © 2004 Maryland State Department of Education
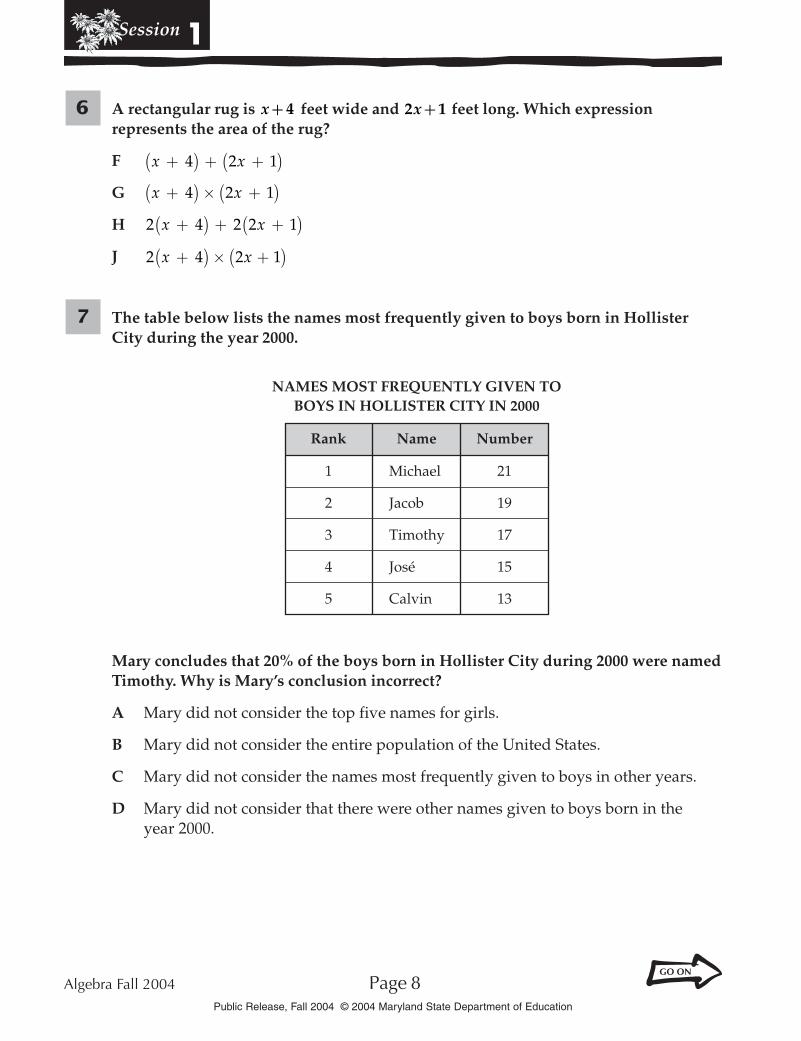
■6 A rectangular rug is x + 4 feet wide and 2 1x + feet long. Which expressionrepresents the area of the rug?
F x x+( ) + +( )4 2 1
G x x+( ) × +( )4 2 1
H 2 4 2 2 1x x+( ) + +( )
J 2 4 2 1x x+( ) × +( )(2) 51426
■7 The table below lists the names most frequently given to boys born in HollisterCity during the year 2000.
NAMES MOST FREQUENTLY GIVEN TOBOYS IN HOLLISTER CITY IN 2000
Rank
1
2
3
4
5
Number
21
19
17
15
13
Michael
Jacob
Timothy
José
Calvin
Name
Mary concludes that 20% of the boys born in Hollister City during 2000 were namedTimothy. Why is Mary’s conclusion incorrect?
A Mary did not consider the top five names for girls.
B Mary did not consider the entire population of the United States.
C Mary did not consider the names most frequently given to boys in other years.
D Mary did not consider that there were other names given to boys born in theyear 2000.
(4) 51573
Session 1
Algebra Fall 2004 Page 9Public Release, Fall 2004 © 2004 Maryland State Department of Education
■8 Bruce bought 4 candy bars and3 decks of cards. The candy barscost $1.35 each. Bruce spent nomore than $12.00. Which of theseinequalities best represents thecost (c) for one deck of cards?
F c ≤ $ .2 20
G c > $ .2 20
H c ≤ $ .3 55
J c > $ .3 55
(1) 51386
■9 Look at the pattern below.
12, 36, 108, 324, . . .
If this pattern continues, what willbe the next term?
A 540
B 648
C 972
D 1,296
(3) 51453
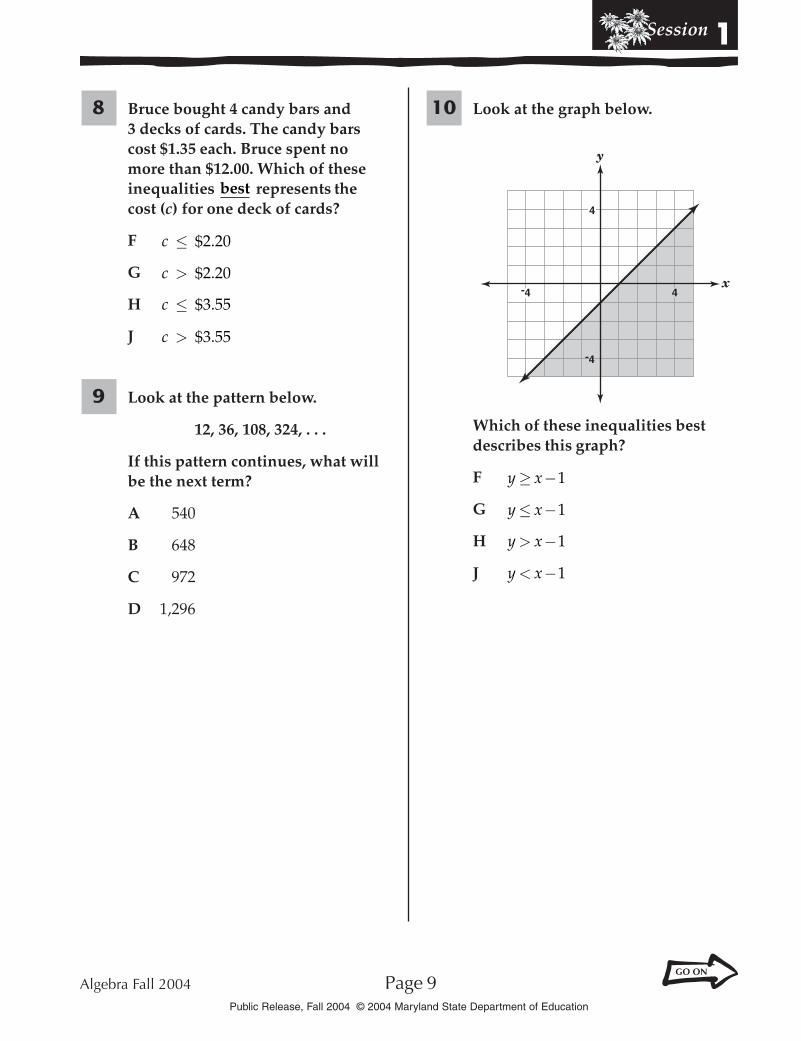
■10 Look at the graph below.
y
x-4
-4
4
4
Which of these inequalities bestdescribes this graph?
F y x≥ −1
G y x≤ −1
H y x> −1
J y x< −1
(2) 51564

Session 1
Algebra Fall 2004 Page 10Public Release, Fall 2004 © 2004 Maryland State Department of Education
11ECR
A city bus company requires exact change or a token to ride a bus. The companyconducted a random survey of 100 passengers to determine how they paid their busfare. The survey results are shown in the table below.
BUS PAYMENT SURVEY
Number of PeopleWho Use Exact Change
63
Number of PeopleWho Use Tokens
37
Complete the following in the Answer Book.
• Last week 2,000 passengers rode the bus. Based on this survey, how many ofthese passengers would be expected to use exact change to pay the bus fare? Usemathematics to explain how you determined your answer. Use words, symbols,or both in your explanation.
• Mr. Blake, a bus driver for the city bus company, reported that 44 passengerswho rode on his bus one morning paid using a token. Based on this survey,estimate how many passengers rode on his bus that morning. Use mathematicsto explain how you determined your answer. Use words, symbols, or both inyour explanation.
• Should a different city use these survey results to predict the number of buspassengers that would be expected to use exact change to ride the bus in theircity? Use mathematics to justify your answer.
(~) 51439

Session 1
Algebra Fall 2004 Page 11Public Release, Fall 2004 © 2004 Maryland State Department of Education
Directions
Use the Response Grids in the Answer Book to complete Numbers 12 through 15.
■12 The matrices below show what drinks high school and college students preferduring the winter and the summer.
408
650
200
200
560
700
College
Milk
Soda
Coffee
Winter
HighSchool
405
808
56
200
708
500
College
Milk
Soda
Coffee
Summer
HighSchool
DRINK PREFERENCE
How many high school and college students prefer milk in winter and summer?
(1213) 51568
■13 A bag contains 5 red apples, 7 yellow apples, and 8 green apples. Brett picks anapple from the bag without looking. What is the probability that Brett will pick agreen apple?
(0.4) 51507
■14 Martin and Anna buy books at a sale. Martin buys 3 hardcover books and4 paperback books for $6.50. Anna buys 2 hardcover books and 6 paperback booksfor $6.00. What is the cost, in dollars, of each hardcover book?
(1.5) 51394

Session 1
Algebra Fall 2004 Page 12Public Release, Fall 2004 © 2004 Maryland State Department of Education
■15 The senior class sold school spirit items. The table below shows the number ofitems sold on the first day of a two-day sale.
SCHOOL SPIRIT ITEMS SOLD ON THE FIRST DAY
Item
T-shirt
Frisbee
Hat
Pen
Ribbon
15
14
22
23
16
Number Sold
Based on sales from the first day, what is the probability that the first person on thesecond day of the sale will buy a hat?
(.2,.24,.244,.2444) 51376

Session 1
Algebra Fall 2004 Page 13Public Release, Fall 2004 © 2004 Maryland State Department of Education
■16 Look at the function that is graphedbelow.
y
x
6
5
4
3
2
1
-1 -2 -3 -4 -5 -6
-6 -5 -4 -3 -2 -1 10 2 3 4 5 6
Which of these represents thenumber of zeros of this function?
F 0
G 1
H 2
J 3
(4) 51475
■17 The mayor of a town conducted anopinion survey of 90 randomlyselected voters. The mayor wants todetermine if a new shopping mallshould be built in town. The surveyresults are shown in the table below.
OPINION SURVEY RESULTS
Want a New Mall
Do Not Want a New Mall
No Opinion
60
20
10
There are 1,440 voters in the town.How many voters would beexpected to want the new shoppingmall built?
A 160
B 320
C 860
D 960
(4) 51437
Session 1
Algebra Fall 2004 Page 14Public Release, Fall 2004 © 2004 Maryland State Department of Education
19ECR
Elizabeth joins a CD buyer’s club.She receives 10 free CDs when shejoins this club. She must buy 3 CDseach month.
Complete the following in theAnswer Book:
• Write an equation that representsthe number of CDs (y) Elizabethwill receive from the CD buyer’sclub after x months.
• What is the y-intercept of yourequation? What does they-intercept mean in the contextof this problem?
• Elizabeth wants to receive nomore than 55 CDs from this club.What is the maximum number ofmonths Elizabeth will remain inthe CD buyer’s club? Usemathematics to explain how youdetermined your answer. Usewords, symbols, or both in yourexplanation.
(~) 51424
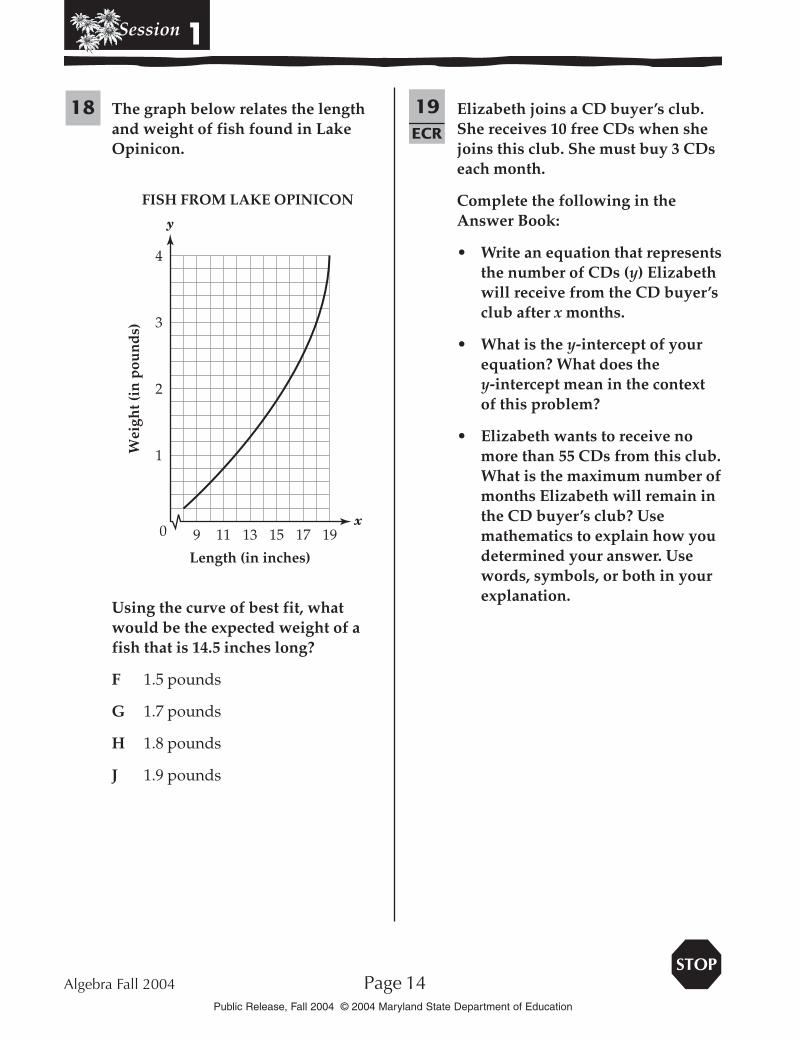
■18 The graph below relates the lengthand weight of fish found in LakeOpinicon.
90
y
x
4
3
2
1
11 13 17 1915
FISH FROM LAKE OPINICON
Wei
ght (
in p
oun
ds)
Length (in inches)
Using the curve of best fit, whatwould be the expected weight of afish that is 14.5 inches long?
F 1.5 pounds
G 1.7 pounds
H 1.8 pounds
J 1.9 pounds
(2) 51362

Session 2
Algebra Fall 2004 Page 15Public Release, Fall 2004 © 2004 Maryland State Department of Education

Session 2
Algebra Fall 2004 Page 16Public Release, Fall 2004 © 2004 Maryland State Department of Education
■20 One hundred randomly selected students from Western High School were surveyedto determine whether they would like school to start one hour later. Of the studentssurveyed, 58 favored the change. Western High School has 1,200 students.According to the survey results, which of these is a reasonable prediction of thetotal number of students who would favor this change?
F 42
G 58
H 504
J 696
(4) 52349

Session 2
Algebra Fall 2004 Page 17Public Release, Fall 2004 © 2004 Maryland State Department of Education
21 Donna drives from Baltimore to Miami. The total time, in hours, of Donna’s tripdepends on her speed, in miles per hour. This relationship is shown in the graphbelow.
y
x
40
35
30
25
20
15
10
5Tota
l Tim
e of
Don
na’
s Tr
ip (i
n h
ours
)
0 30 35 40 45 50 55 60 65 70
Donna’s Speed (in miles per hour)
BALTIMORE TO MIAMI
Approximately, how much longer does the trip take if Donna drives 55 miles perhour than if she drives 70 miles per hour?
F 2 hours
G 6 hours
H 15 hours
J 21 hours
(2) 51502
Session 2
Algebra Fall 2004 Page 18Public Release, Fall 2004 © 2004 Maryland State Department of Education
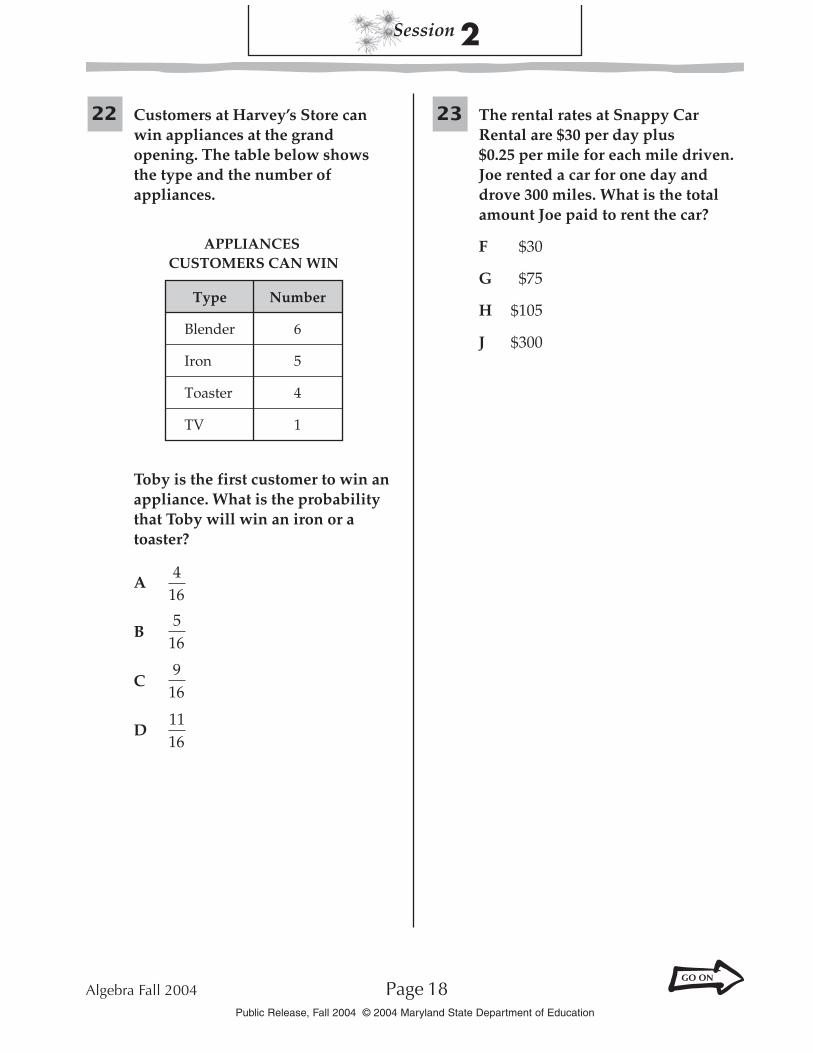
22 Customers at Harvey’s Store canwin appliances at the grandopening. The table below showsthe type and the number ofappliances.
APPLIANCESCUSTOMERS CAN WIN
Type
Blender
Iron
Toaster
TV
6
5
4
1
Number
Toby is the first customer to win anappliance. What is the probabilitythat Toby will win an iron or atoaster?
A4
16
B5
16
C9
16
D1116
(3) 51435
23 The rental rates at Snappy CarRental are $30 per day plus$0.25 per mile for each mile driven.Joe rented a car for one day anddrove 300 miles. What is the totalamount Joe paid to rent the car?
F $30
G $75
H $105
J $300
(3) 52346

Session 2
Algebra Fall 2004 Page 19Public Release, Fall 2004 © 2004 Maryland State Department of Education
24 A company bought equipment for x x2 5+ dollars. One year later the value of theequipment was x2 2+ dollars. Which expression represents the amount that theequipment value decreased?
A x x x2 25 2+( ) − +( )
B x x x2 22 5+( ) − −( )
C x x x2 25 2+( ) ÷ +( )
D x x x2 22 5+( ) × +( )(1) 51430
25 A credit card company investigates any purchase that is larger than the thirdquartile of a customer’s last 12 purchases. Mike’s last 12 purchases are shown below.
$ . $ . $ . $ .
$ . $ . $ . $ .
$ . $ .
6 98 15 92 31 84 39 55
7 56 19 47 36 64 40 03
14 95 26 34 $$ . $ .38 25 42 47
What is the largest purchase Mike could make next without having his purchaseinvestigated?
F $26.25
G $28.84
H $38.75
J $43.25
(3) 51458

Session 2
Algebra Fall 2004 Page 20Public Release, Fall 2004 © 2004 Maryland State Department of Education
26 Look at the function that is graphed below.
y
x
8
7
6
5
4
3
2
1
-1-2-3-4-5-6-7-8
-5-6-7-8 -4 -3 -2 -1 10 2 3 4 5 6 7 8
What is the range of this function?
A − ≤ ≤7 4y
B − ≤ ≤6 8y
C − ≤ ≤5 7y
D − ≤ ≤2 5y
(1) 51558
Session 2
Algebra Fall 2004 Page 21Public Release, Fall 2004 © 2004 Maryland State Department of Education
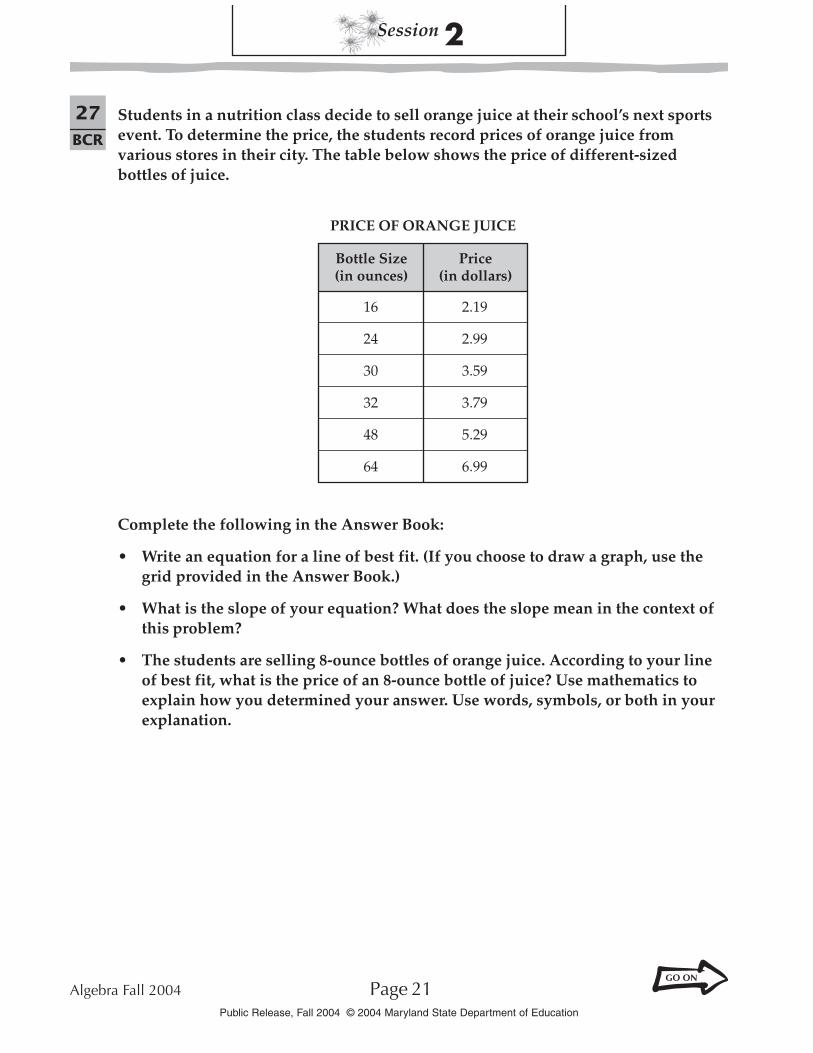
27BCR
Students in a nutrition class decide to sell orange juice at their school’s next sportsevent. To determine the price, the students record prices of orange juice fromvarious stores in their city. The table below shows the price of different-sizedbottles of juice.
PRICE OF ORANGE JUICE
Price(in dollars)
Bottle Size(in ounces)
2.19
2.99
3.59
3.79
5.29
6.99
16
24
30
32
48
64
Complete the following in the Answer Book:
• Write an equation for a line of best fit. (If you choose to draw a graph, use thegrid provided in the Answer Book.)
• What is the slope of your equation? What does the slope mean in the context ofthis problem?
• The students are selling 8-ounce bottles of orange juice. According to your lineof best fit, what is the price of an 8-ounce bottle of juice? Use mathematics toexplain how you determined your answer. Use words, symbols, or both in yourexplanation.
(~) 51560

Session 2
Algebra Fall 2004 Page 22Public Release, Fall 2004 © 2004 Maryland State Department of Education
28 The rectangular solid below has avolume of 5,600 cubic inches, awidth of 20 inches, and a height of8 inches.
8 in.
x
Note: The figure is not drawn to scale.
20 in.
What is the length (x) of therectangular solid?
A 20 inches
B 35 inches
C 200 inches
D 280 inches
(2) 51361
29 Which of these equations representsa line with an x-intercept of −3 anda y-intercept of 4?
F y x= −− 34
3
G y x= −34
3
H y x= +− 43
4
J y x= +43
4
(4) 51519

Session 2
Algebra Fall 2004 Page 23Public Release, Fall 2004 © 2004 Maryland State Department of Education
30 Look at the pattern below.
0, 3, 8, 15, 24, . . .
If the pattern continues, what willbe the 8th term?
A 35
B 48
C 63
D 80
(3) 51369
31 The table below shows arelationship between x and y.
5
7
9
11
1
2
3
4
x y
Which of these equations representsthis relationship?
F y x= +−2 7
G y x= +2 3
H y x= +3 2
J y x= −7 2(2) 51370
32 Sam needs to rent a van for a schoolfield trip. Van Company A charges aone-time fee of $250 plus $10 foreach mile driven. Van Company Bcharges a one-time fee of $150 plus$12 for each mile driven. Let xrepresent the number of milesdriven. Let y represent the total cost,in dollars, to rent the van. Whichsystem of equations models thissituation?
A y x
y x
= −= −
250 10150 12
B y x
y x
= −= −
10 25012 150
C y x
y x
= += +
250 10150 12
D y x
y x
= += +
10 25012 150
(4) 51381

Session 2
Algebra Fall 2004 Page 24Public Release, Fall 2004 © 2004 Maryland State Department of Education
33ECR
Toy blocks are used to build a tower. The surface area and volume of the tower builtwith these blocks is shown in the table below.
MODEL TOWER VALUES
Volume(in cubic centimeters)
Surface Area(in square centimeters)
Number ofBlocks
4
8
12
16
?
?
1
2
3
4
5
6
18
30
42
54
?
?
Complete the following in the Answer Book:
• Complete the table in the Answer Book to determine the surface area and thevolume for 5 and 6 blocks.
• Write an algebraic expression to represent the relationship between the numberof blocks and the surface area of the tower. Use mathematics to justify youranswer.
• If 10 blocks are used, what is the surface area and the volume of the tower?Use mathematics to explain how you determined your answers. Use words,symbols, or both in your explanation.
(~) 51504

Session 2
Algebra Fall 2004 Page 25Public Release, Fall 2004 © 2004 Maryland State Department of Education
Directions
Use the Response Grids in the Answer Book to complete Numbers 35 and 36.
34 Dominic rents a car for a trip. He pays $300 plus $0.20 per mile. Dominic has $750 tospend on the car rental. What is the maximum number of miles Dominic can drive?
(2250) 51547
35 The depth of a lake is 26 meters. Melting snow causes the lake to rise 0.05 meterseach day. At the end of 8 days, what will be the depth, in meters, of the lake?
(26.4) 51418