Rational Vs. Irrational Making sense of rational and Irrational numbers.
Unit 1, Activity 1, Identifying and Classifying Numbers
Blackline Masters, Algebra 1 Page 1-1
Algebra 1

Unit 1, Activity 1, Identifying and Classifying Numbers
Blackline Masters, Algebra 1 Page 1-1
Identifying and Classifying Numbers
1. Explain the difference between a rational and an irrational number. Classify the following numbers as rational or irrational. 2. ½ 3. 8 4. 6 5. 16 6. π 7. List the set of all natural numbers. 8. List the set of whole numbers less than 4. 9. List the set of integers such that –3 < x < 5. Classify the following numbers as rational, irrational, natural, whole and/or integer. (A number may belong to more than one set)
10. –3 12. 4 23
13. 3 14. 0
15. Using the following set of numbers:
{ }633.6 , 0.36, , 0.36, 0, 3 , 3, 36, 3.63363336 . . .6A = − − , place each element in the
appropriate subset. (Numbers may belong to more than one subset) rational numbers_______________________ irrational numbers_____________________ natural numbers_______________________ whole numbers_______________________ integers_______________________ True or False? 16. All whole numbers are rational numbers. 17. All integers are irrational numbers. 18. All natural numbers are integers.
Unit 1, Activity 1, Identifying and Classifying Numbers with Answers
Blackline Masters, Algebra 1 Page 1-2
Identifying and Classifying Numbers
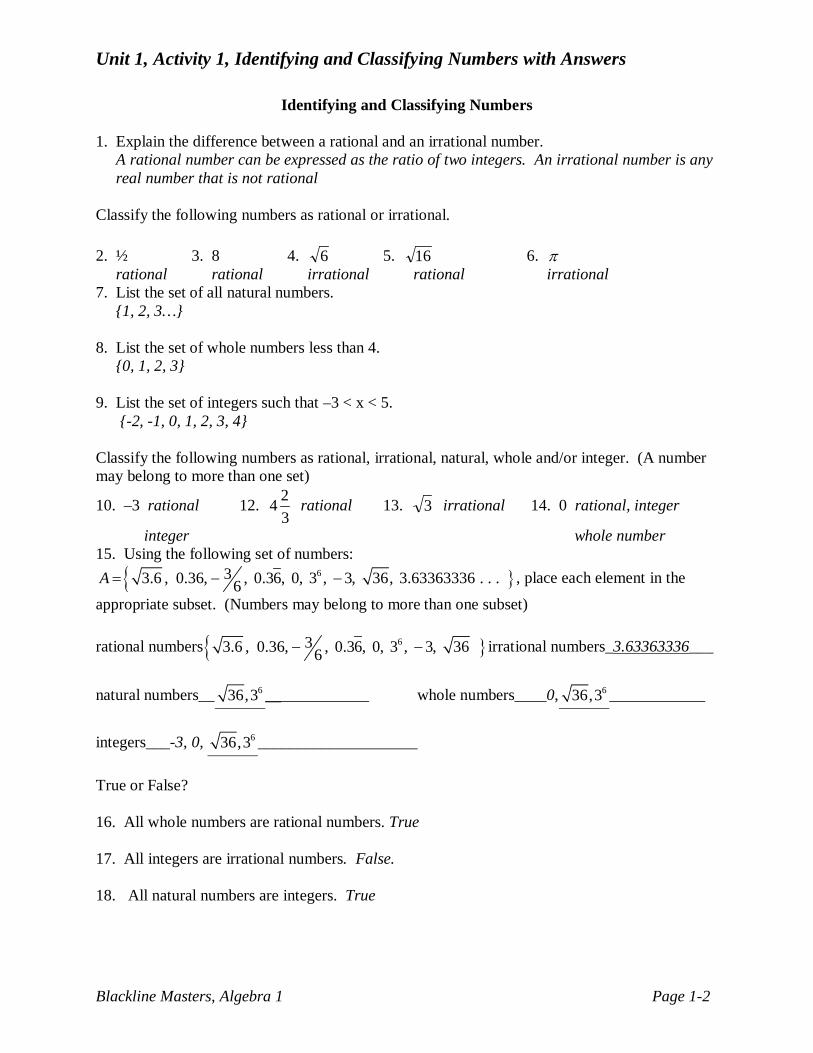
1. Explain the difference between a rational and an irrational number. A rational number can be expressed as the ratio of two integers. An irrational number is any real number that is not rational
Classify the following numbers as rational or irrational. 2. ½ 3. 8 4. 6 5. 16 6. π rational rational irrational rational irrational 7. List the set of all natural numbers. {1, 2, 3…} 8. List the set of whole numbers less than 4. {0, 1, 2, 3} 9. List the set of integers such that –3 < x < 5. {-2, -1, 0, 1, 2, 3, 4} Classify the following numbers as rational, irrational, natural, whole and/or integer. (A number may belong to more than one set)
10. –3 rational 12. 4 23
rational 13. 3 irrational 14. 0 rational, integer
integer whole number 15. Using the following set of numbers:
{ }633.6 , 0.36, , 0.36, 0, 3 , 3, 36, 3.63363336 . . .6A = − − , place each element in the
appropriate subset. (Numbers may belong to more than one subset) rational numbers{ }633.6 , 0.36, , 0.36, 0, 3 , 3, 366− − irrational numbers_3.63363336___
natural numbers__ 636,3 _____________ whole numbers____0, 636,3 ____________ integers___-3, 0, 636,3 ____________________ True or False? 16. All whole numbers are rational numbers. True 17. All integers are irrational numbers. False. 18. All natural numbers are integers. True
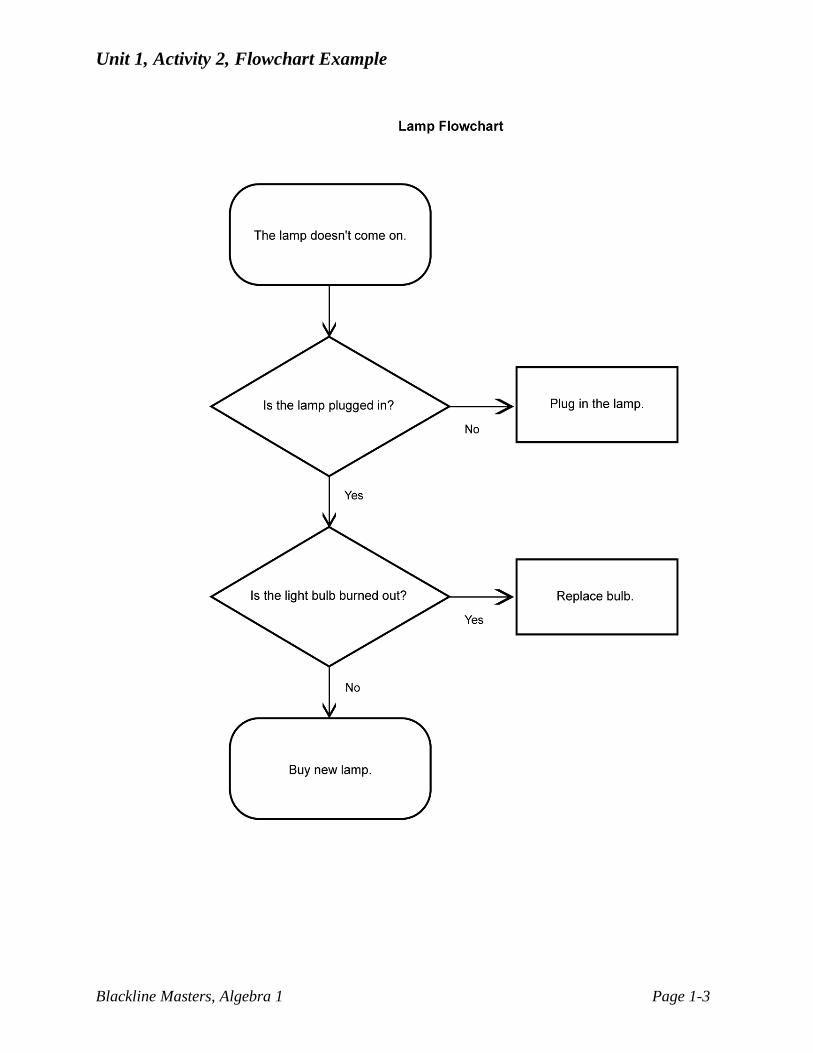
Unit 1, Activity 2, Flowchart Example
Blackline Masters, Algebra 1 Page 1-3
Unit 1, Activity 2, What is a Flowchart?
Blackline Masters, Algebra 1 Page 1-4
What is a Flowchart?
Flowchart Definitions and Objectives:
Flowcharts are maps or graphical representations of a process. Steps in a process are shown with symbolic shapes, and the flow of the process is indicated with arrows connecting the symbols. Computer programmers popularized flowcharts in the 1960s, using them to map the logic of programs. In quality improvement work, flowcharts are particularly useful for displaying how a process currently functions or could ideally function. Flowcharts can help you see whether the steps of a process are logical, uncover problems or miscommunications, define the boundaries of a process, and develop a common base of knowledge about a process. Flowcharting a process often brings to light redundancies, delays, dead ends, and indirect paths that would otherwise remain unnoticed or ignored. But flowcharts don't work if they aren't accurate.
A flowchart (also spelled flow-chart and flow chart) is a schematic representation of a process. It is commonly used in business/economic presentations to help the audience visualize the content better, or to find flaws in the process. The flowchart is one of the seven basic tools of quality control, which include the histogram, Pareto chart, check sheet, control chart, cause-and-effect diagram, flowchart, and scatter diagram. Examples include instructions for a bicycle's assembly, an attorney who is outlining a case's timeline, diagram of an automobile plant's work flow, or the decisions to make on a tax form. Generally the start point, end points, inputs, outputs, possible paths and the decisions that lead to these possible paths are included. Flow-charts can be created by hand or manually in most office software, but lately specialized diagram drawing software has emerged that can also be used for the intended purpose. See below for examples.
Flowchart History: Flowcharts were used historically in electronic data processing to represent the conditional logic of computer programs. With the emergence of structured programming and structured design in the 1980s, visual formalisms like data flow diagrams and structure charts began to supplant the use of flowcharts in database programming. With the widespread adoption of such ALGOL-like computer languages as Pascal, textual models have been used more and more often to represent algorithms. In the 1990s Unified Modeling Language began to synthesize and codify these modeling techniques. Today, flowcharts are one of the main tools of business analysts and others who seek to describe the logic of a process in a graphical format. Flowcharts and cross-functional flowcharts can commonly be found as a key part of project documentation or as a part of a
Unit 1, Activity 2, What is a Flowchart?
Blackline Masters, Algebra 1 Page 1-5
business process document. Flowcharts are widely used in education, clinical settings, service industries and other areas where graphical, logical depiction of a process is helpful.
When should flowcharts be used?
At the beginning of your process improvement efforts, an "as-is" flowchart helps your team and others involved in the process to understand how it currently works. The team may find it helpful to compare this "as-is flowchart" with a diagram of the way the process is supposed to work. Later, the team will develop a flowchart of the modified process again, to record how it actually functions. At some point, your team may want to create an ideal flowchart to show how you would ultimately like the process to be performed.
Among the benefits of using flowcharts are that they:
• Promote process understanding by explaining the steps pictorially. People may have differing ideas about how a process works. A flowchart can help you gain agreement about the sequence of steps. Flowcharts promote understanding in a way that written procedures cannot. One good flowchart can replace pages of words.
• Provide a tool for training employees. Because of the way they visually lay out the sequence of steps in a process, flowcharts can be very helpful in training employees to perform the process according to standardized procedures.
• Identify problem areas and opportunities for process improvement. Once you break down the process steps and diagram them, problem areas become more visible. It is easy to spot opportunities for simplifying and refining your process by analyzing decision points, redundant steps, and rework loops.
• Depict customer-supplier relationship, helping the process workers understand who their customers are, and how they may sometimes act as suppliers, and sometimes as customers in relation to other people.
What symbols are used in flowcharts?
The symbols that are commonly used in flowcharts have specific meanings and are connected by arrows indicating the flow from one step to another.
• Oval. An oval indicates both the starting point and the ending point of the process. • Box. A box represents an individual step or activity in the process. • Diamond. A diamond shows a decision point, such as yes/no or go/no-go. Each path
emerging from the diamond must be labeled with one of the possible answers. • Circle. A circle indicates that a particular step is connected within the page. A
numerical value is placed in the circle to indicate the sequence continuation. • Pentagon. A pentagon indicates that a particular step of the process is connected to
another page or part of the flowchart. A letter placed in the circle clarifies the continuation.
• Flow line. This indicates the direction flow of the process.
Excerpt taken from: http://www.edrawsoft.com/Flowchart-tutorial.php
Unit 1, Activity 2, DL-TA
Blackline Masters, Algebra 1 Page 1-6
DL-TA for (title)______________________________________________________ Prediction question(s):______________________________________________________ ________________________________________________________________________ ________________________________________________________________________ Using the title, your own background knowledge, and any other contextual clues, make your predictions. During reading:
Before reading:
During reading:
During reading:
After reading:
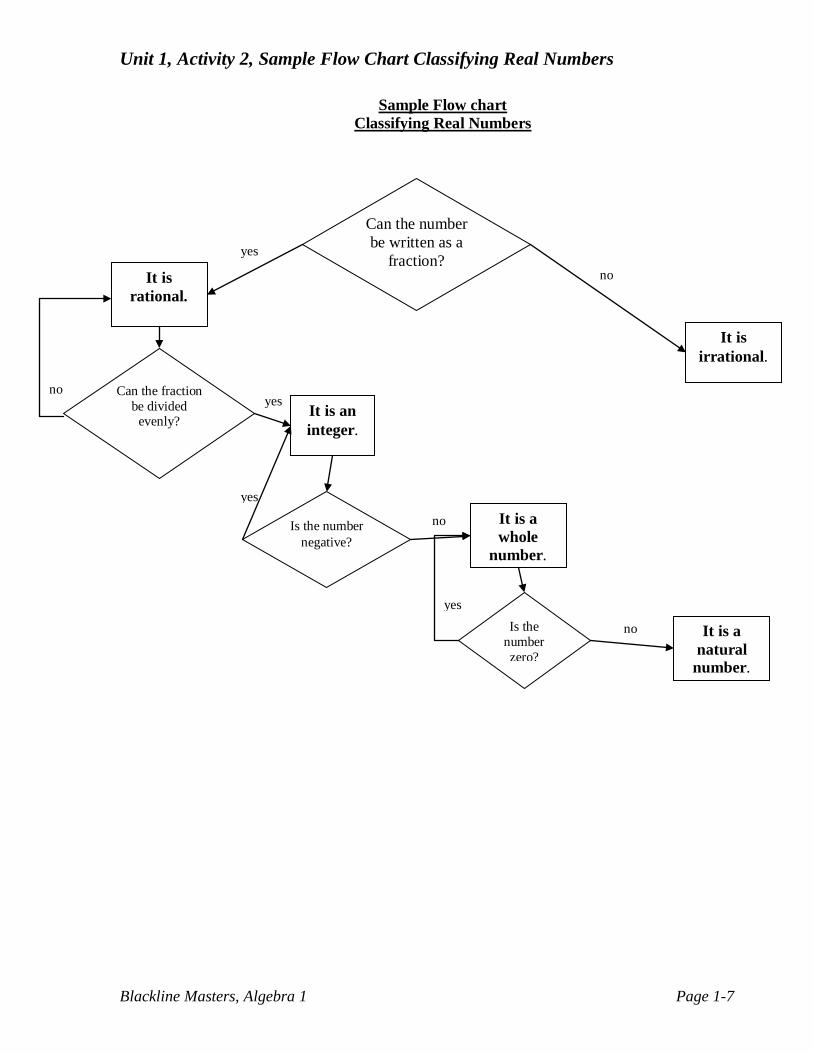
Unit 1, Activity 2, Sample Flow Chart Classifying Real Numbers
Blackline Masters, Algebra 1 Page 1-7
Can the number be written as a
fraction? It is
rational.
It is an integer.
Can the fraction be divided
evenly?
It is a whole
number.
Is the number negative?
It is irrational.
It is a natural
number.
yes
yes
yes
no
no
no
Is the number zero?
no
yes
Sample Flow chart Classifying Real Numbers
Unit 1, Activity 4, Classifying Numbers: Sums and Products of Rational and Irrational Numbers
Blackline Masters, Algebra 1 Page 1-8
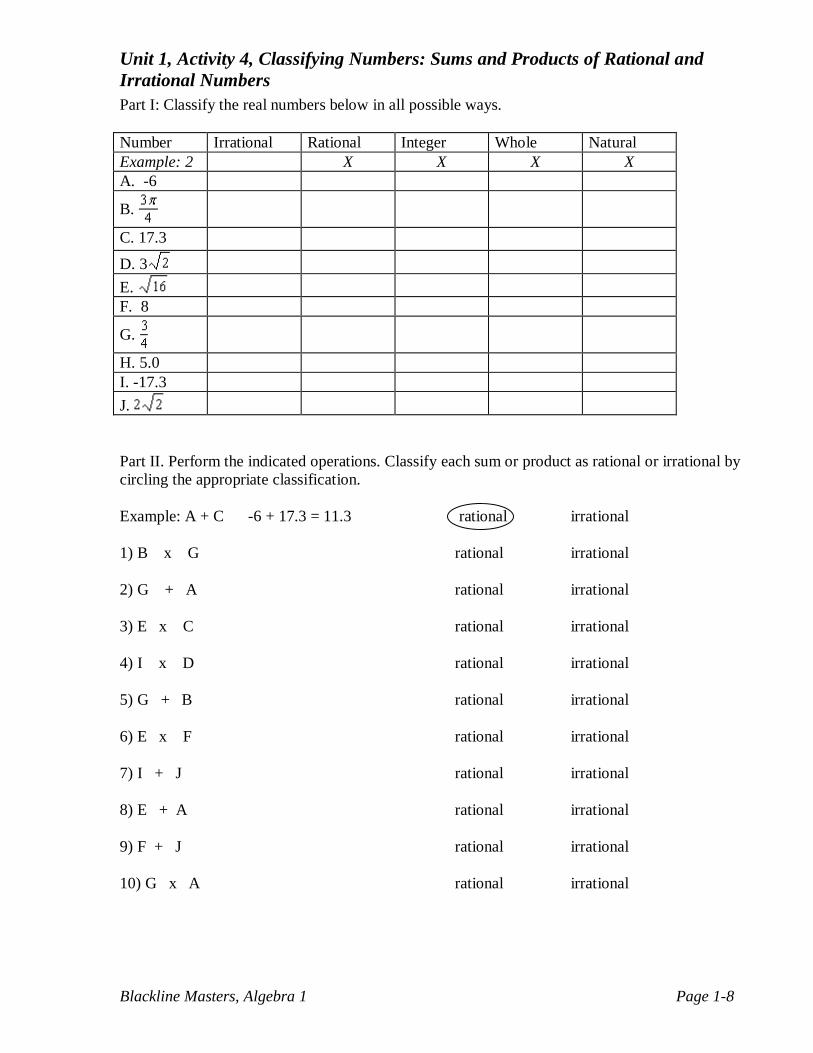
Part I: Classify the real numbers below in all possible ways.
Number Irrational Rational Integer Whole Natural Example: 2 X X X X A. -6
B.
C. 17.3
D. 3
E. F. 8
G.
H. 5.0 I. -17.3 J.
Part II. Perform the indicated operations. Classify each sum or product as rational or irrational by circling the appropriate classification.
Example: A + C -6 + 17.3 = 11.3 rational irrational 1) B x G rational irrational 2) G + A rational irrational 3) E x C rational irrational 4) I x D rational irrational 5) G + B rational irrational 6) E x F rational irrational 7) I + J rational irrational 8) E + A rational irrational 9) F + J rational irrational 10) G x A rational irrational
Unit 1, Activity 4, Classifying Numbers: Sums and Products of Rational and Irrational Numbers
Blackline Masters, Algebra 1 Page 1-9
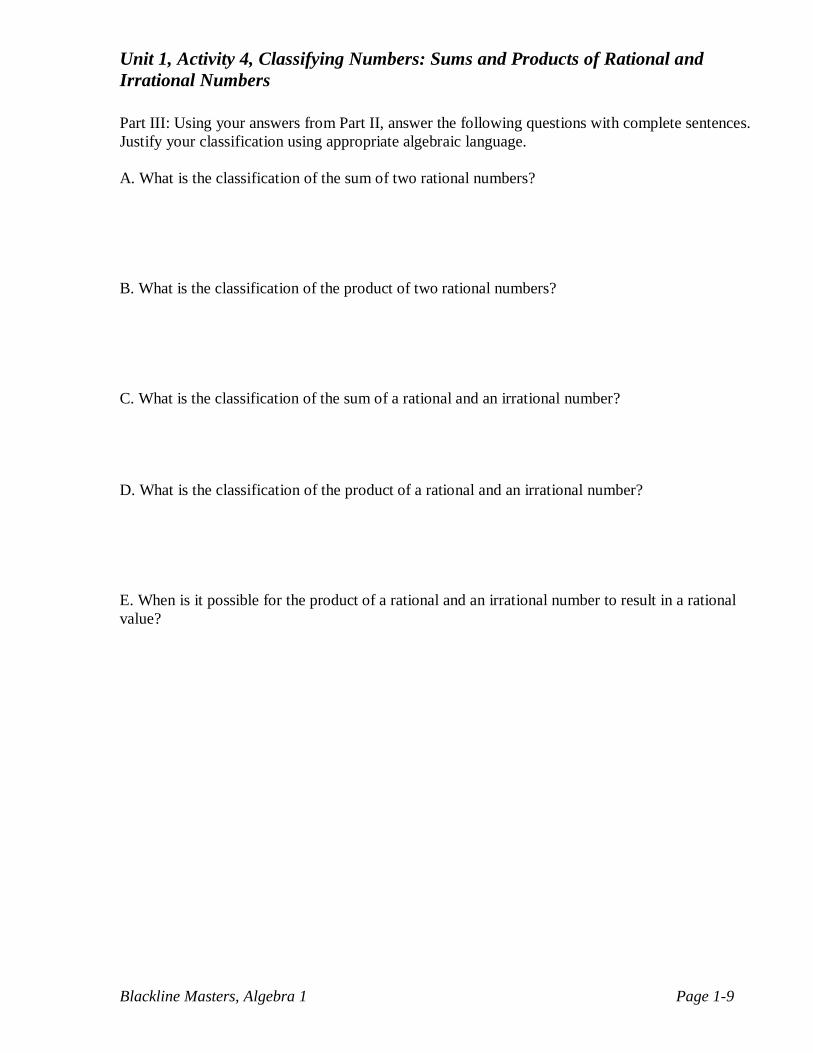
Part III: Using your answers from Part II, answer the following questions with complete sentences.
Justify your classification using appropriate algebraic language. A. What is the classification of the sum of two rational numbers? B. What is the classification of the product of two rational numbers? C. What is the classification of the sum of a rational and an irrational number? D. What is the classification of the product of a rational and an irrational number?
E. When is it possible for the product of a rational and an irrational number to result in a rational value?
Unit 1, Activity 4, Classifying Numbers: Sums and Products of Rational and Irrational Numbers with Answers
Blackline Masters, Algebra 1 Page 1-10
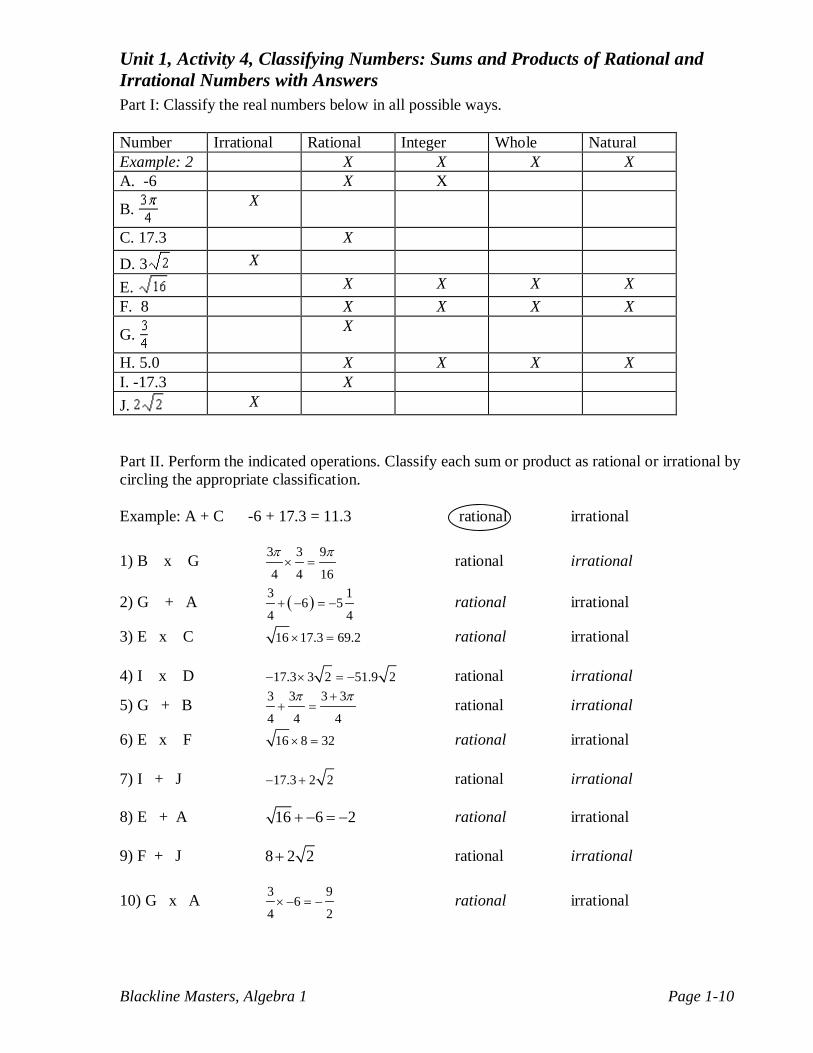
Part I: Classify the real numbers below in all possible ways.
Number Irrational Rational Integer Whole Natural Example: 2 X X X X A. -6 X X
B. X
C. 17.3 X
D. 3 X
E. X X X X F. 8 X X X X
G. X
H. 5.0 X X X X I. -17.3 X J. X
Part II. Perform the indicated operations. Classify each sum or product as rational or irrational by circling the appropriate classification. Example: A + C -6 + 17.3 = 11.3 rational irrational
1) B x G 3 3 9
4 4 16
π π× = rational irrational
2) G + A ( )3 16 5
4 4+ − = − rational irrational
3) E x C 16 17.3 69.2× = rational irrational
4) I x D 17.3 3 2 51.9 2− × = − rational irrational
5) G + B 3 3 3 3
4 4 4
π π++ = rational irrational
6) E x F 16 8 32× = rational irrational
7) I + J 17.3 2 2− + rational irrational
8) E + A 16 6 2+ − = − rational irrational 9) F + J 8 2 2+ rational irrational
10) G x A 3 96
4 2× − = − rational irrational
Unit 1, Activity 4, Classifying Numbers: Sums and Products of Rational and Irrational Numbers with Answers
Blackline Masters, Algebra 1 Page 1-11
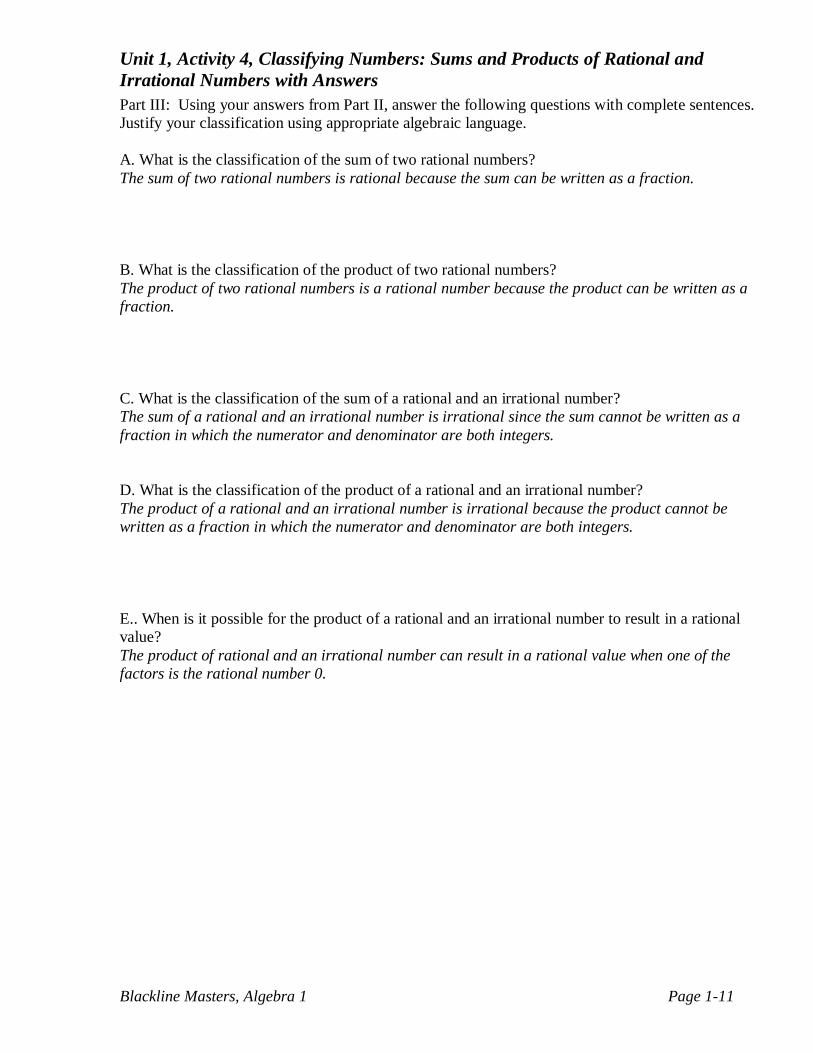
Part III: Using your answers from Part II, answer the following questions with complete sentences. Justify your classification using appropriate algebraic language. A. What is the classification of the sum of two rational numbers? The sum of two rational numbers is rational because the sum can be written as a fraction. B. What is the classification of the product of two rational numbers? The product of two rational numbers is a rational number because the product can be written as a fraction. C. What is the classification of the sum of a rational and an irrational number? The sum of a rational and an irrational number is irrational since the sum cannot be written as a fraction in which the numerator and denominator are both integers. D. What is the classification of the product of a rational and an irrational number? The product of a rational and an irrational number is irrational because the product cannot be written as a fraction in which the numerator and denominator are both integers.
E.. When is it possible for the product of a rational and an irrational number to result in a rational value? The product of rational and an irrational number can result in a rational value when one of the factors is the rational number 0.
Unit 1, Activity 4, Classifying Numbers: Sums and Products of Rational and Irrational Numbers Homework
Blackline Masters, Algebra 1 Page 1-12
Homework Assignment: Classification of Sums and Products
1. Find each sum or product. Determine its classification as rational or irrational. a. 1000 + ( -288) = ___________________ b. 54.25 + = ____________________ c. 0.7 17 = _________________________ d. 4.1 x = ________________________ e. -36 x = _________________________ .
2. Write an example for each condition. a. The product of two rational numbers: b. The sum of two rational numbers: c. The product of a rational and an irrational number: d. The sum of a rational and an irrational number.
Unit 1, Activity 4, Classifying Numbers: Sums and Products of Rational and Irrational Numbers Homework with Answers
Blackline Masters, Algebra 1 Page 1-13
1. Find each sum or product. Determine its classification as rational or irrational.
a. 1000 + ( -288) = 712 rational b. 54.25 + = 54.25 + irrational c. 0.7 17 = 11.9 rational d. 4.1 x = 28.7 rational e. -36 x = -36 irrational
2. Write an example for each condition. a. The product of two rational numbers: Answers will vary. b. The sum of two rational numbers: Answers will vary. c. The product of a rational and an irrational number: Answers will vary. d. The sum of a rational and an irrational number. Answers will vary.

Unit 1, Activity 5, Foot Length and Shoe Size
Blackline Masters, Algebra 1 Page 1-14
An Activity Comparing Foot Length and Shoe Size
Student Worksheet
Using the standard measuring edge of your ruler, measure and record the length of the student’s foot, in centimeters, and the student’s shoe size. Record 10 sets of data for girls and 10 sets for boys.
GIRLS BOYS
.
Answer these questions:
1. Which is the independent and which is the dependent variable? How do you know?
__________________________________________________________
2. Write ordered pairs on the line below, graph them, and look for a pattern.
__________________________________________________________
Length of Foot
Shoe Size Ratio of Foot Length to Shoe Size
Length of Foot
Shoe Size Ratio of Foot Length to Shoe Size
Unit 1, Activity 5, Foot Length and Shoe Size
Blackline Masters, Algebra 1 Page 1-15
3. Does the data appear to be linear? Explain your reasoning. ________________________________________________________
4. Using your calculator, find the average ratio of foot length to shoe size. This is the constant of variation. What does this value mean in the context of the data you have collected? ____________________________________________________________
_____________________________________________________________
5. Write an equation that models the situation. __________________
6. List three other examples of positive relationships from real-life.
Unit 1, Activity 5, Foot Length and Shoe Size
Blackline Masters, Algebra 1 Page 1-16
Unit 1, Activity 5, Dimensions of a Rectangle
Blackline Masters, Algebra 1 Page 1-17
An Activity to Study Dimension of a Rectangle
Student Worksheet
Each group has 36 algebra unit tiles. Using all of the tiles you have been given, arrange the tiles in a rectangle and record the height and width. Continue to make rectangles until you think you have created all possible rectangles. Record the area for each rectangle. Answer these questions: 1. Does it matter which variable is independent and which variable is dependent? Explain. __________________________________________________________ 2. Get together with other groups and decide which the entire class will use. Record the class decision below. _________________________________________________________________ 3. Using the table and the class decision about independent and dependent variables, write the ordered pairs below. _________________________________________________________________ 4. Graph these pairs on the paper provided and look for relationships in the graphed data. 5. Write an equation to model this situation._____________________________
Height (h) Width (w) Area
Unit 1, Activity 6, Exponential Growth and Decay
Blackline Masters, Algebra 1 Page 1-18
Exponential Growth and Decay
In this activity, fold a piece of computer paper in half as many times as possible. After each fold, stop to fill in a row of the table. Continue folding and recording until the table is filled.
NUMBER OF FOLDS NUMBER OF REGIONS AREA OF SMALLEST REGION 0 1 2 3 4 5 6 7 N
Part I: Label the axes of the graph below before you plot your data. One axis is for Number of Folds and one axis is for Number of Regions. Think about the scale of your range and plan your markings before you begin.
Unit 1, Activity 6, Exponential Growth and Decay
Blackline Masters, Algebra 1 Page 1-19
Answer the following questions with the class: 1. Identify the independent and the dependent variables. The independent variable is ____________________________________ The dependent variable is ____________________________________ 2. Is the graph linear? Explain your reasoning. _______________________________________
___________________________________________________________________________ 3. Describe the pattern that occurs in the data. ________________________________________
___________________________________________________________________________ 4. Write an equation to determine the number of regions if there are n folds.
_______________________________________ Part II: Label the axes of the graph below before you plot your data. One axis is for Number of Folds and one axis is Area of Smallest Region. Think about the scale of your range and plan your markings before you begin.
Unit 1, Activity 6, Exponential Growth and Decay
Blackline Masters, Algebra 1 Page 1-20
Answer the following questions with the class: 1. Identify the independent and the dependent variables. The independent variable is ____________________________________
The dependent variable is ____________________________________ 2. Is the graph linear? Explain your reasoning. _______________________________________
___________________________________________________________________________ 3. Describe the pattern that occurs in the data. ________________________________________
___________________________________________________________________________ 4. Write an equation to determine the number of regions if there are n folds.
_______________________________________
Unit 1, Activity 6, Exponential Growth and Decay with Answers
Blackline Masters, Algebra 1 Page 1-21
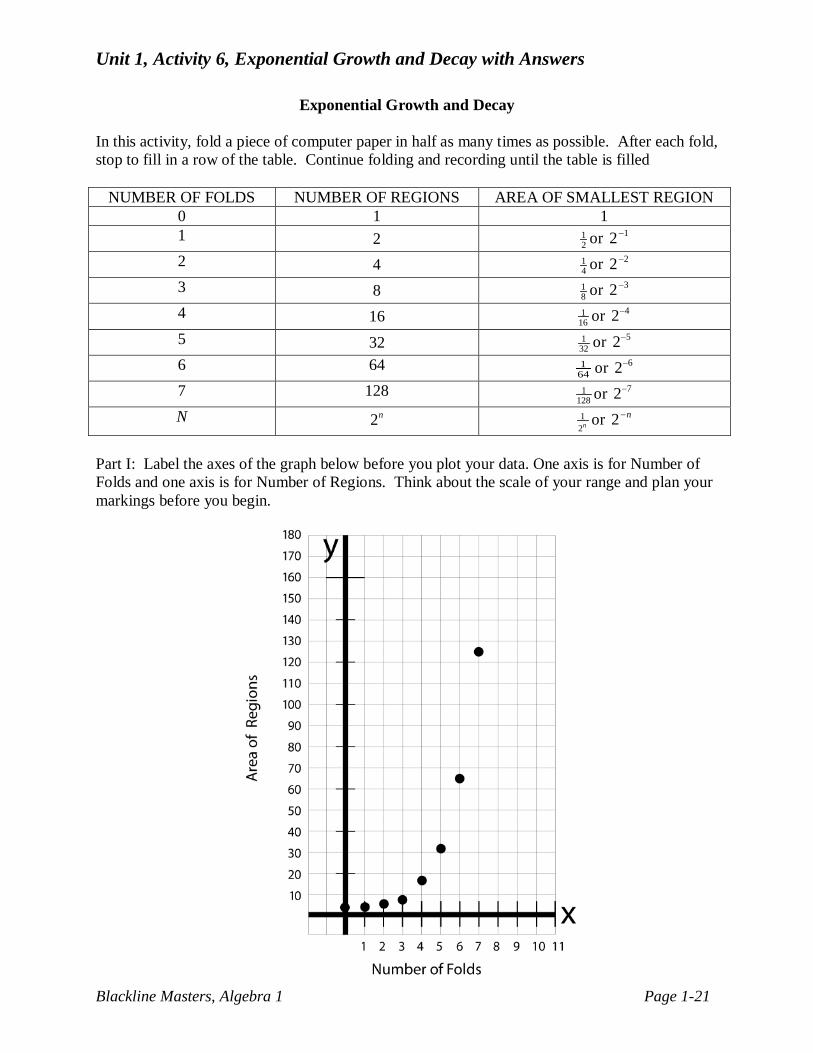
Exponential Growth and Decay In this activity, fold a piece of computer paper in half as many times as possible. After each fold, stop to fill in a row of the table. Continue folding and recording until the table is filled
NUMBER OF FOLDS NUMBER OF REGIONS AREA OF SMALLEST REGION 0 1 1 1 2 1
2 or 12− 2 4 1
4 or 22− 3 8 1
8 or 32− 4 16 1
16 or 42− 5 32 1
32 or 52− 6 64 1
64 or 62− 7 128 1
128 or 72− N 2n 1
2n or n−2 Part I: Label the axes of the graph below before you plot your data. One axis is for Number of Folds and one axis is for Number of Regions. Think about the scale of your range and plan your markings before you begin.
Unit 1, Activity 6, Exponential Growth and Decay with Answers
Blackline Masters, Algebra 1 Page 1-22
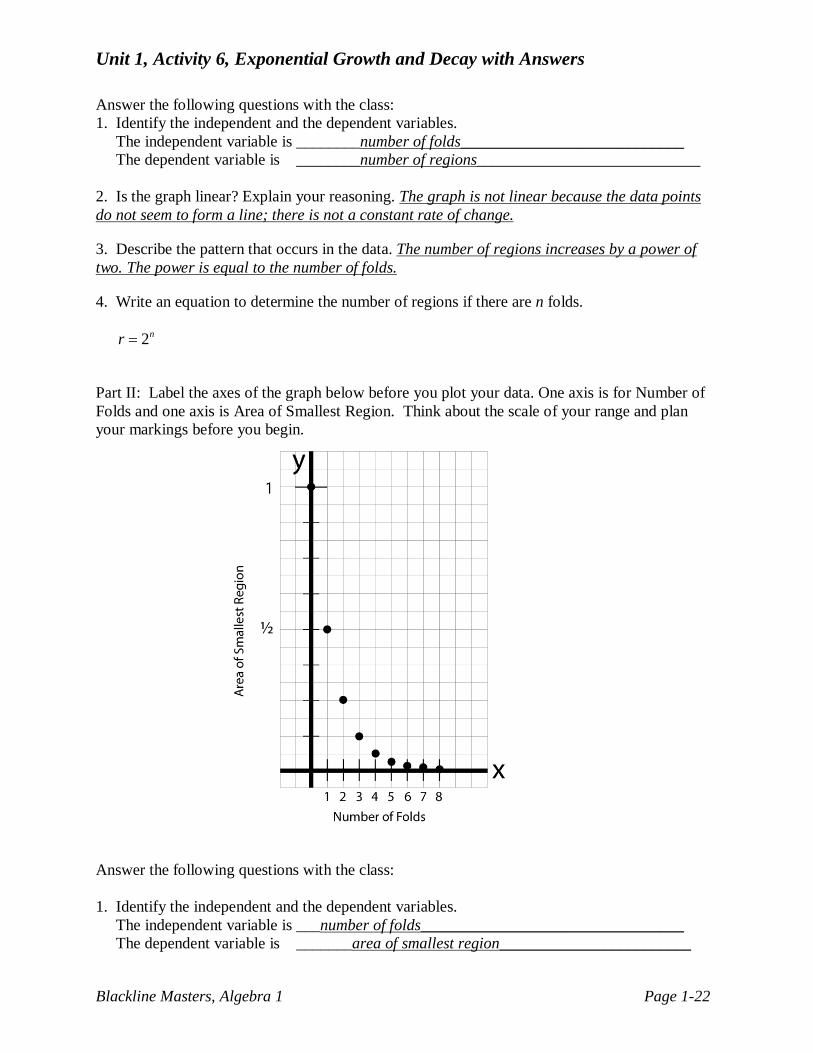
Answer the following questions with the class: 1. Identify the independent and the dependent variables. The independent variable is ________number of folds____________________________ The dependent variable is ________number of regions____________________________ 2. Is the graph linear? Explain your reasoning. The graph is not linear because the data points do not seem to form a line; there is not a constant rate of change.
3. Describe the pattern that occurs in the data. The number of regions increases by a power of two. The power is equal to the number of folds.
4. Write an equation to determine the number of regions if there are n folds.
2nr = Part II: Label the axes of the graph below before you plot your data. One axis is for Number of Folds and one axis is Area of Smallest Region. Think about the scale of your range and plan your markings before you begin. Answer the following questions with the class: 1. Identify the independent and the dependent variables. The independent variable is ___number of folds_________________________________ The dependent variable is _______area of smallest region________________________
Unit 1, Activity 6, Exponential Growth and Decay with Answers
Blackline Masters, Algebra 1 Page 1-23
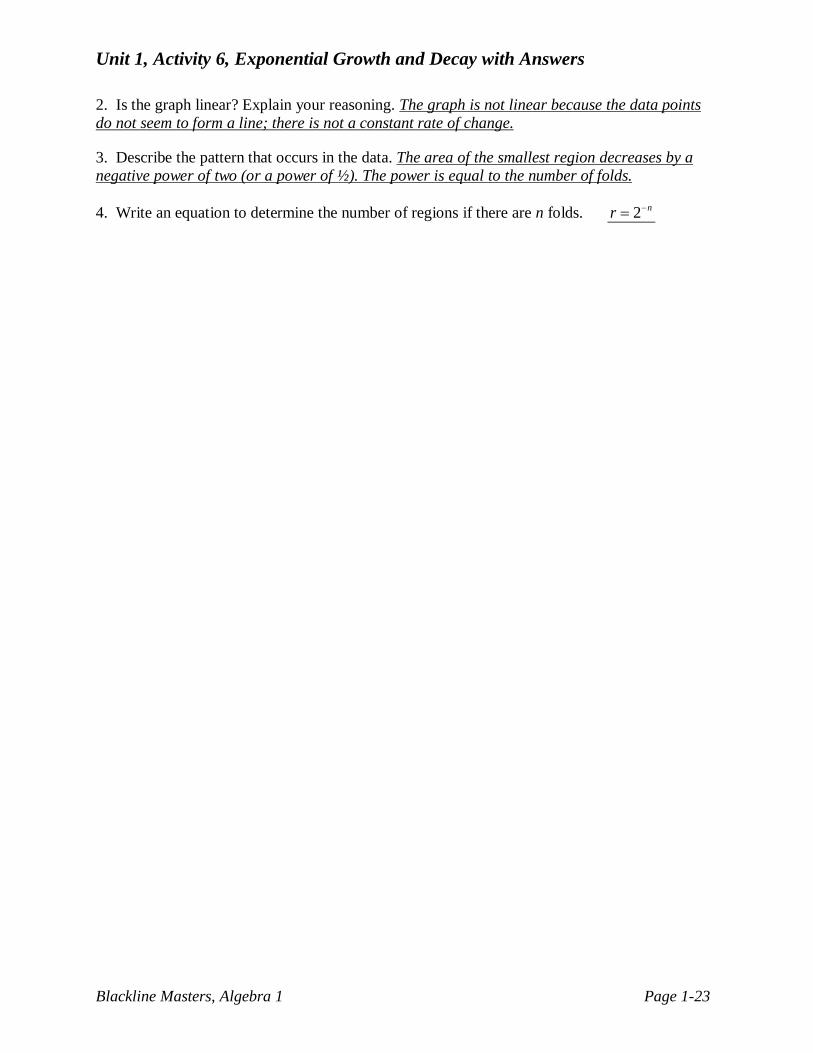
2. Is the graph linear? Explain your reasoning. The graph is not linear because the data points do not seem to form a line; there is not a constant rate of change.
3. Describe the pattern that occurs in the data. The area of the smallest region decreases by a negative power of two (or a power of ½). The power is equal to the number of folds.
4. Write an equation to determine the number of regions if there are n folds. 2 nr −=
Unit 1, Activity 7, Pay Day!
Blackline Masters, Algebra 1 Page 1-24
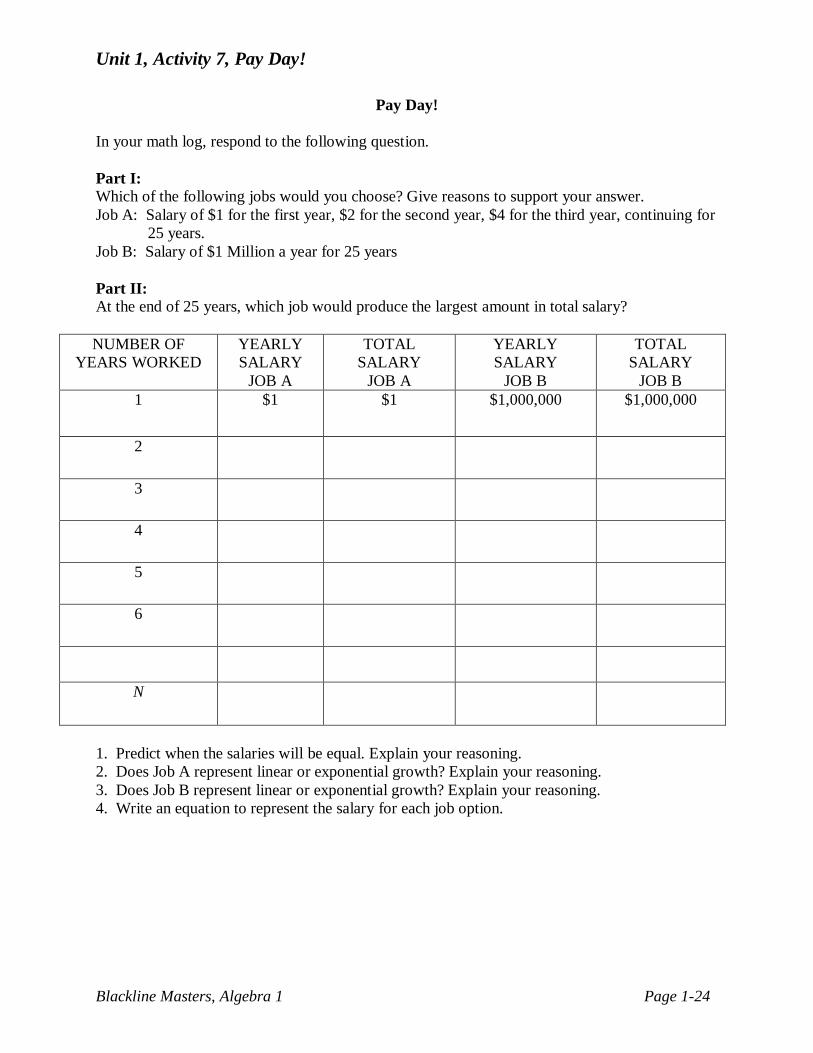
Pay Day!
In your math log, respond to the following question. Part I: Which of the following jobs would you choose? Give reasons to support your answer. Job A: Salary of $1 for the first year, $2 for the second year, $4 for the third year, continuing for 25 years. Job B: Salary of $1 Million a year for 25 years Part II: At the end of 25 years, which job would produce the largest amount in total salary? NUMBER OF
YEARS WORKED YEARLY SALARY
JOB A
TOTAL SALARY
JOB A
YEARLY SALARY
JOB B
TOTAL SALARY
JOB B 1 $1 $1 $1,000,000 $1,000,000
2
3
4
5
6
N
1. Predict when the salaries will be equal. Explain your reasoning. 2. Does Job A represent linear or exponential growth? Explain your reasoning. 3. Does Job B represent linear or exponential growth? Explain your reasoning. 4. Write an equation to represent the salary for each job option.
Unit 1, Activity 7, Pay Day! with Answers
Blackline Masters, Algebra 1 Page 1-25
Pay Day!
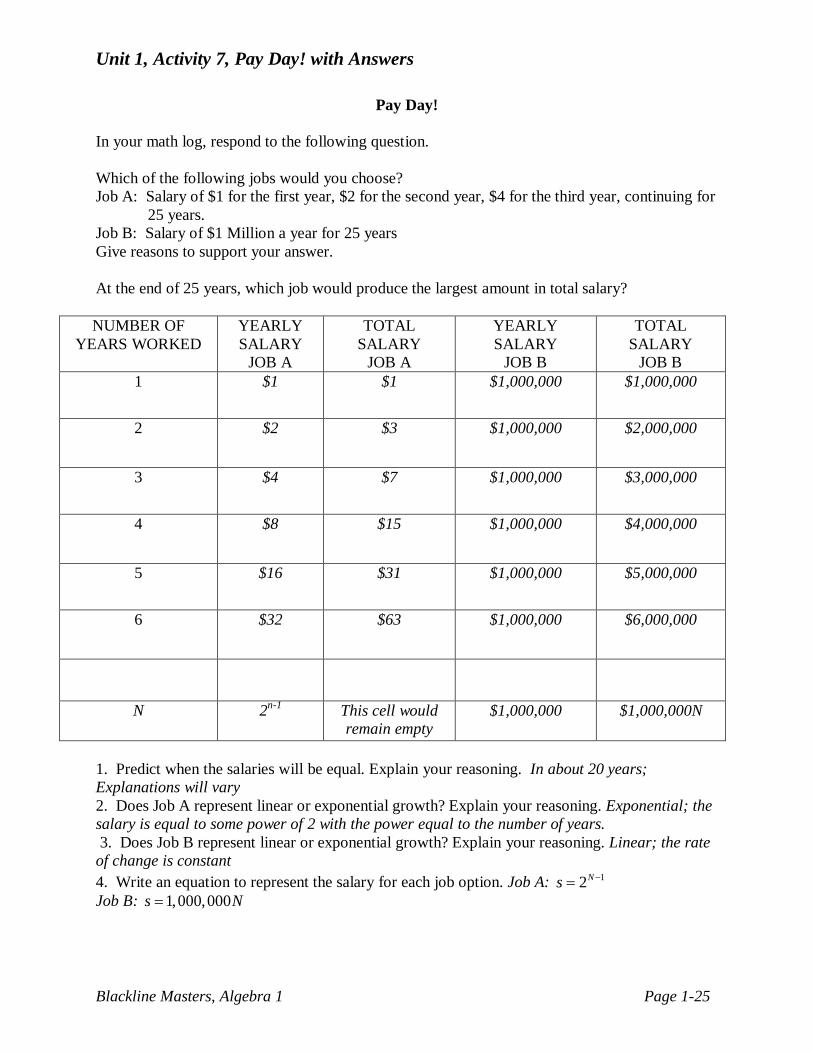
In your math log, respond to the following question. Which of the following jobs would you choose? Job A: Salary of $1 for the first year, $2 for the second year, $4 for the third year, continuing for 25 years. Job B: Salary of $1 Million a year for 25 years Give reasons to support your answer. At the end of 25 years, which job would produce the largest amount in total salary? NUMBER OF
YEARS WORKED YEARLY SALARY
JOB A
TOTAL SALARY
JOB A
YEARLY SALARY
JOB B
TOTAL SALARY
JOB B 1 $1 $1 $1,000,000 $1,000,000
2 $2 $3 $1,000,000 $2,000,000
3 $4 $7 $1,000,000 $3,000,000
4 $8 $15 $1,000,000 $4,000,000
5 $16 $31 $1,000,000 $5,000,000
6 $32 $63 $1,000,000 $6,000,000
N 2n-1 This cell would remain empty
$1,000,000 $1,000,000N
1. Predict when the salaries will be equal. Explain your reasoning. In about 20 years; Explanations will vary 2. Does Job A represent linear or exponential growth? Explain your reasoning. Exponential; the salary is equal to some power of 2 with the power equal to the number of years. 3. Does Job B represent linear or exponential growth? Explain your reasoning. Linear; the rate of change is constant 4. Write an equation to represent the salary for each job option. Job A: 12Ns −= Job B: 1,000,000s N=
Unit 1, Activity 8, Linear or Non-Linear
Blackline Masters, Algebra 1 Page 1-26
Linear or Non-Linear?
In this activity, you will construct a scatter plot using the data set you were given and determine if the data represents a linear or non-linear relationship. 1. Identify the independent and dependent variables and write them on the top left corner of the poster. 2. Construct the scatter plot on your poster board. 3. Describe the relationship between the two variables on the top right corner of the poster, including a decision about whether your data is linear or non-linear. 4. Present your findings to the class. Include in your presentation three informative points about your data and a discussion about why the data is linear or non-linear.
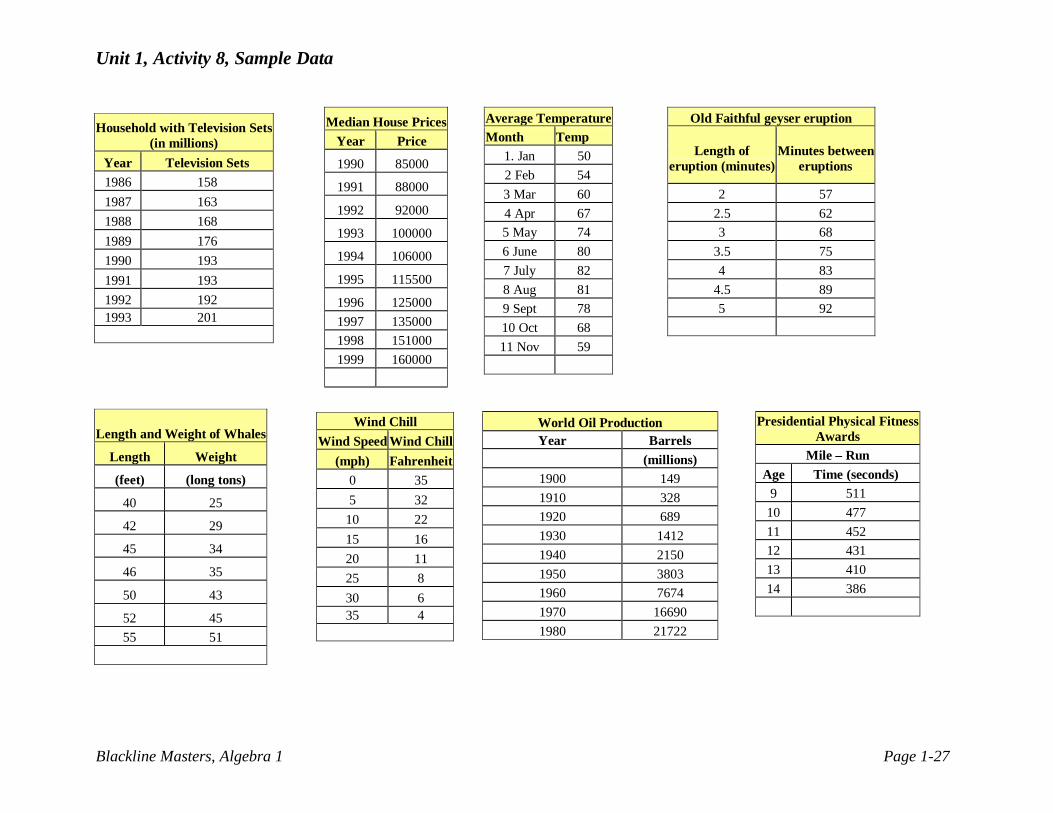
Unit 1, Activity 8, Sample Data
Blackline Masters, Algebra 1 Page 1-27
Household with Television Sets
(in millions) Year Television Sets 1986 158 1987 163 1988 168 1989 176 1990 193 1991 193 1992 192 1993 201
Median House Prices Year Price
1990 85000
1991 88000
1992 92000
1993 100000
1994 106000
1995 115500
1996 125000 1997 135000 1998 151000 1999 160000
Average Temperature Month Temp
1. Jan 50 2 Feb 54 3 Mar 60 4 Apr 67 5 May 74 6 June 80 7 July 82 8 Aug 81 9 Sept 78 10 Oct 68 11 Nov 59
Old Faithful geyser eruption
Length of eruption (minutes)
Minutes between
eruptions
2 57 2.5 62 3 68
3.5 75 4 83
4.5 89 5 92
Length and Weight of Whales
Length Weight
(feet) (long tons)
40 25
42 29
45 34
46 35
50 43
52 45 55 51
Wind Chill Wind Speed Wind Chill
(mph) Fahrenheit 0 35 5 32
10 22 15 16 20 11 25 8 30 6 35 4
World Oil Production Year Barrels
(millions) 1900 149 1910 328 1920 689 1930 1412 1940 2150 1950 3803 1960 7674 1970 16690 1980 21722
Presidential Physical Fitness Awards
Mile – Run Age Time (seconds)
9 511 10 477 11 452 12 431 13 410 14 386
Unit 1, Activity 8, Linear or Non-Linear Rubric
Blackline Masters, Algebra 1 Page 1-28
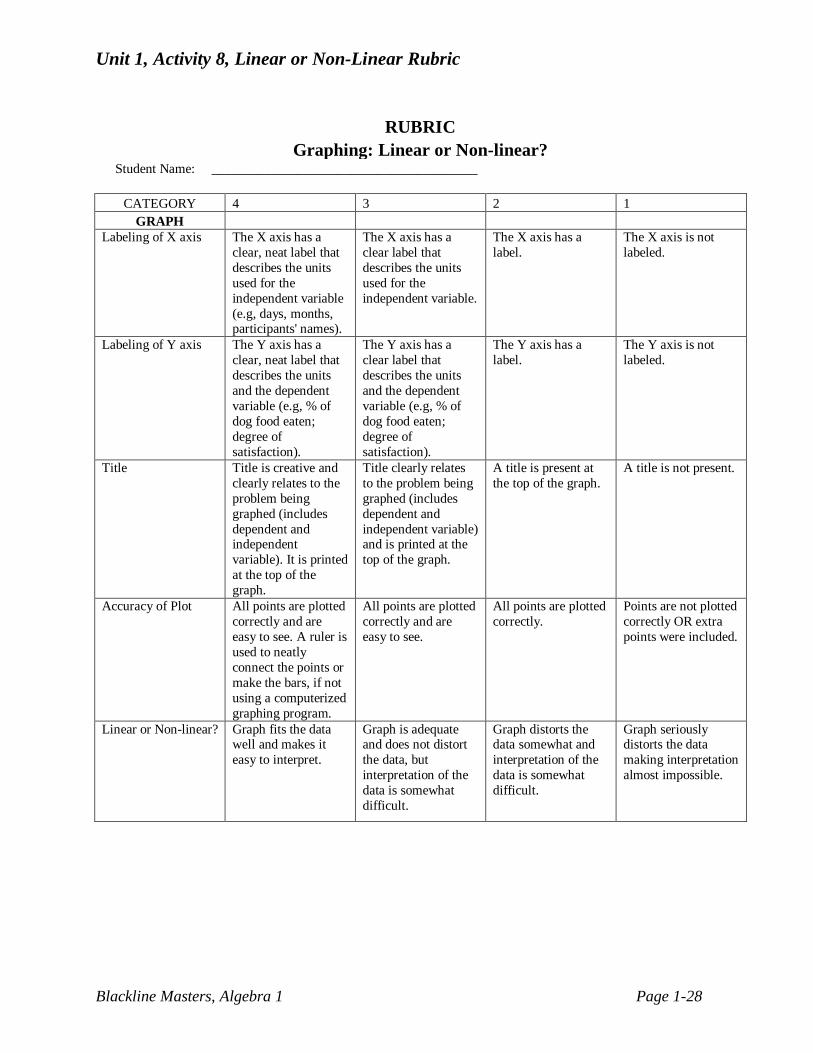
RUBRIC
Graphing: Linear or Non-linear? Student Name: ________________________________________
CATEGORY 4 3 2 1
GRAPH Labeling of X axis The X axis has a
clear, neat label that describes the units used for the independent variable (e.g, days, months, participants' names).
The X axis has a clear label that describes the units used for the independent variable.
The X axis has a label.
The X axis is not labeled.
Labeling of Y axis The Y axis has a clear, neat label that describes the units and the dependent variable (e.g, % of dog food eaten; degree of satisfaction).
The Y axis has a clear label that describes the units and the dependent variable (e.g, % of dog food eaten; degree of satisfaction).
The Y axis has a label.
The Y axis is not labeled.
Title Title is creative and clearly relates to the problem being graphed (includes dependent and independent variable). It is printed at the top of the graph.
Title clearly relates to the problem being graphed (includes dependent and independent variable) and is printed at the top of the graph.
A title is present at the top of the graph.
A title is not present.
Accuracy of Plot All points are plotted correctly and are easy to see. A ruler is used to neatly connect the points or make the bars, if not using a computerized graphing program.
All points are plotted correctly and are easy to see.
All points are plotted correctly.
Points are not plotted correctly OR extra points were included.
Linear or Non-linear? Graph fits the data well and makes it easy to interpret.
Graph is adequate and does not distort the data, but interpretation of the data is somewhat difficult.
Graph distorts the data somewhat and interpretation of the data is somewhat difficult.
Graph seriously distorts the data making interpretation almost impossible.
Unit 1, Activity 8, Linear or Non-Linear Rubric
Blackline Masters, Algebra 1 Page 1-29
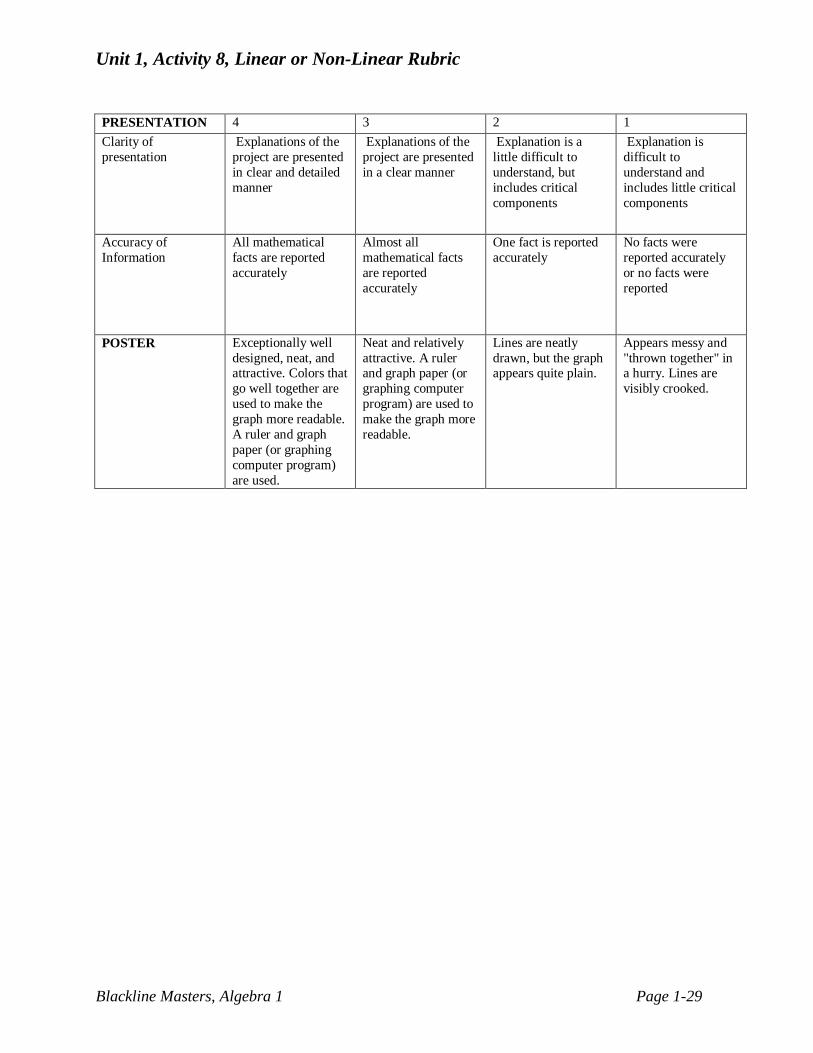
PRESENTATION 4 3 2 1 Clarity of presentation
Explanations of the project are presented in clear and detailed manner
Explanations of the project are presented in a clear manner
Explanation is a little difficult to understand, but includes critical components
Explanation is difficult to understand and includes little critical components
Accuracy of Information
All mathematical facts are reported accurately
Almost all mathematical facts are reported accurately
One fact is reported accurately
No facts were reported accurately or no facts were reported
POSTER Exceptionally well designed, neat, and attractive. Colors that go well together are used to make the graph more readable. A ruler and graph paper (or graphing computer program) are used.
Neat and relatively attractive. A ruler and graph paper (or graphing computer program) are used to make the graph more readable.
Lines are neatly drawn, but the graph appears quite plain.
Appears messy and "thrown together" in a hurry. Lines are visibly crooked.

Unit 1, Activity 8, Calculator Directions
Blackline Masters, Algebra 1 Page 1-30
Creating a scatter plot with the TI-83 graphing calculator:
1) Enter data into lists: STAT EDIT Clear lists by highlighting L1 then pressing Clear, Enter Highlight L2 press clear, enter Enter independent variable (x) in L1 Enter dependent variable (y) in L2 2) Turn on scatter plot:
2nd y=
Enter 1: On Type: scatter plot Xlist: L1 Ylist: L 2 Mark: (any) 3) Set window to fit your data:
WINDOW Xmin and Xmax should be set to fit the data in L1 Ymin and Ymax should be set to fit the data in L2 All other entries can be set at whatever you wish
4) Look at Graph
GRAPH
Unit 1, Activity 9, Understanding Data
Blackline Masters, Algebra 1 Page 1-31
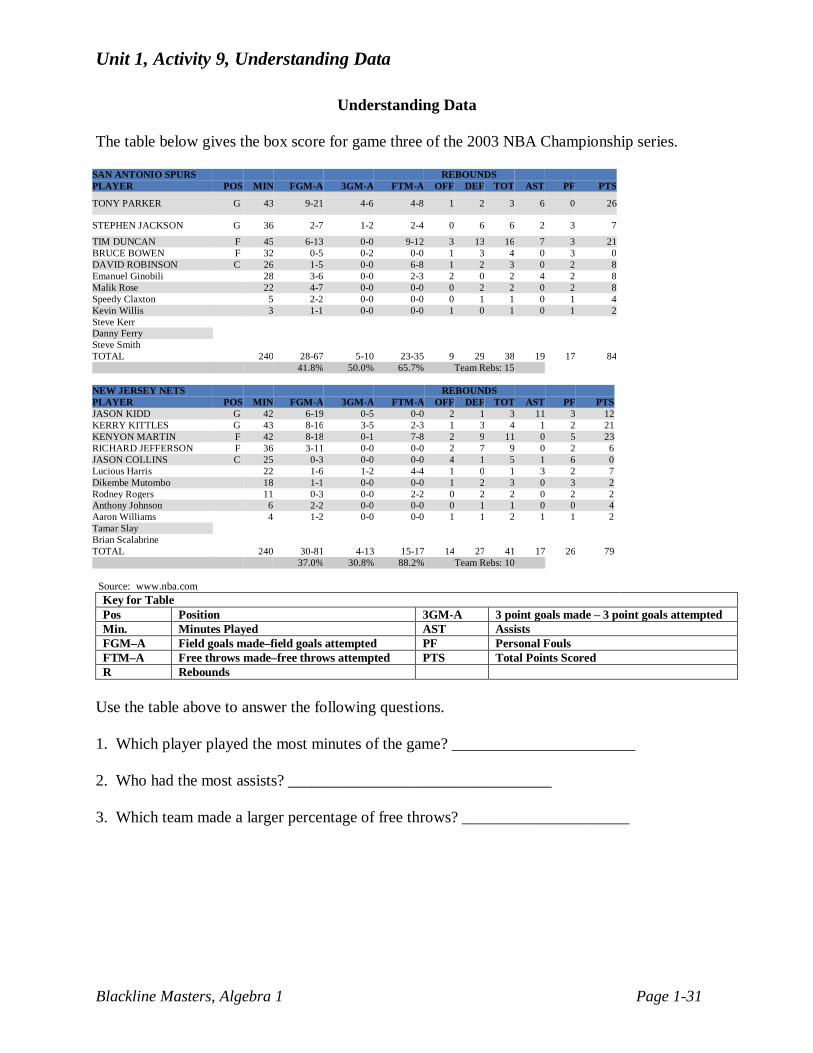
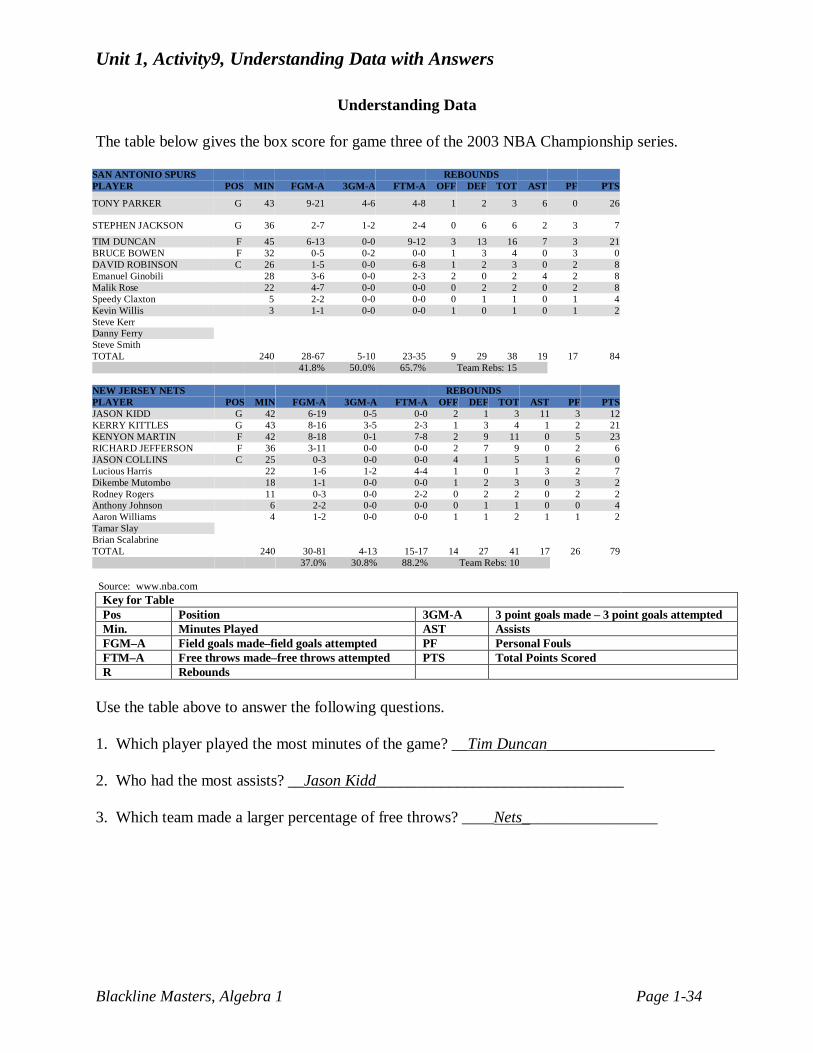
Understanding Data The table below gives the box score for game three of the 2003 NBA Championship series.
SAN ANTONIO SPURS REBOUNDS PLAYER POS MIN FGM-A 3GM-A FTM-A OFF DEF TOT AST PF PTS
TONY PARKER G 43 9-21 4-6 4-8 1 2 3 6 0 26
STEPHEN JACKSON G 36 2-7 1-2 2-4 0 6 6 2 3 7
TIM DUNCAN F 45 6-13 0-0 9-12 3 13 16 7 3 21 BRUCE BOWEN F 32 0-5 0-2 0-0 1 3 4 0 3 0 DAVID ROBINSON C 26 1-5 0-0 6-8 1 2 3 0 2 8 Emanuel Ginobili 28 3-6 0-0 2-3 2 0 2 4 2 8 Malik Rose 22 4-7 0-0 0-0 0 2 2 0 2 8 Speedy Claxton 5 2-2 0-0 0-0 0 1 1 0 1 4 Kevin Willis 3 1-1 0-0 0-0 1 0 1 0 1 2 Steve Kerr Danny Ferry Steve Smith TOTAL 240 28-67 5-10 23-35 9 29 38 19 17 84 41.8% 50.0% 65.7% Team Rebs: 15 NEW JERSEY NETS REBOUNDS PLAYER POS MIN FGM-A 3GM-A FTM-A OFF DEF TOT AST PF PTS JASON KIDD G 42 6-19 0-5 0-0 2 1 3 11 3 12 KERRY KITTLES G 43 8-16 3-5 2-3 1 3 4 1 2 21 KENYON MARTIN F 42 8-18 0-1 7-8 2 9 11 0 5 23 RICHARD JEFFERSON F 36 3-11 0-0 0-0 2 7 9 0 2 6 JASON COLLINS C 25 0-3 0-0 0-0 4 1 5 1 6 0 Lucious Harris 22 1-6 1-2 4-4 1 0 1 3 2 7 Dikembe Mutombo 18 1-1 0-0 0-0 1 2 3 0 3 2 Rodney Rogers 11 0-3 0-0 2-2 0 2 2 0 2 2 Anthony Johnson 6 2-2 0-0 0-0 0 1 1 0 0 4 Aaron Williams 4 1-2 0-0 0-0 1 1 2 1 1 2 Tamar Slay Brian Scalabrine TOTAL 240 30-81 4-13 15-17 14 27 41 17 26 79 37.0% 30.8% 88.2% Team Rebs: 10 Source: www.nba.com
Key for Table Pos Position 3GM-A 3 point goals made – 3 point goals attempted Min. Minutes Played AST Assists FGM–A Field goals made–field goals attempted PF Personal Fouls FTM–A Free throws made–free throws attempted PTS Total Points Scored R Rebounds
Use the table above to answer the following questions. 1. Which player played the most minutes of the game? _______________________ 2. Who had the most assists? _________________________________ 3. Which team made a larger percentage of free throws? _____________________
Unit 1, Activity 9, Understanding Data
Blackline Masters, Algebra 1 Page 1-32
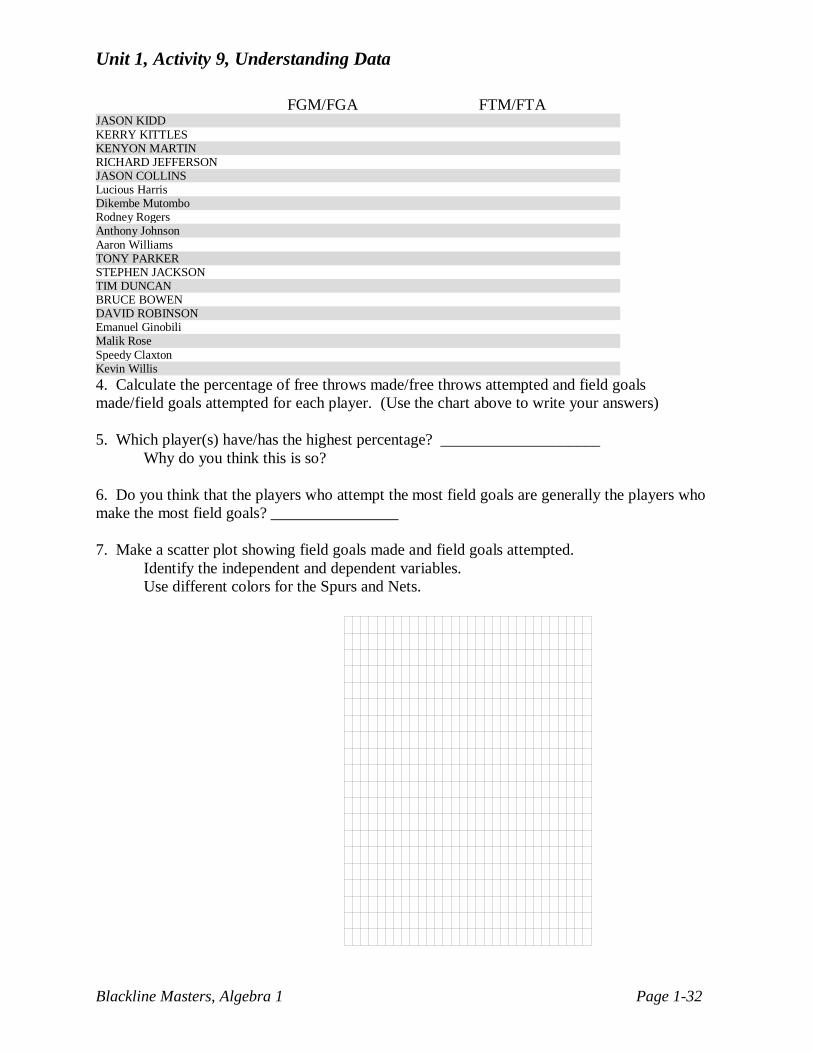
FGM/FGA FTM/FTA JASON KIDD KERRY KITTLES KENYON MARTIN RICHARD JEFFERSON JASON COLLINS Lucious Harris Dikembe Mutombo Rodney Rogers Anthony Johnson Aaron Williams TONY PARKER STEPHEN JACKSON TIM DUNCAN BRUCE BOWEN DAVID ROBINSON Emanuel Ginobili Malik Rose Speedy Claxton Kevin Willis 4. Calculate the percentage of free throws made/free throws attempted and field goals made/field goals attempted for each player. (Use the chart above to write your answers) 5. Which player(s) have/has the highest percentage? ____________________ Why do you think this is so? 6. Do you think that the players who attempt the most field goals are generally the players who make the most field goals? ________________ 7. Make a scatter plot showing field goals made and field goals attempted. Identify the independent and dependent variables. Use different colors for the Spurs and Nets.
Unit 1, Activity 9, Understanding Data
Blackline Masters, Algebra 1 Page 1-33
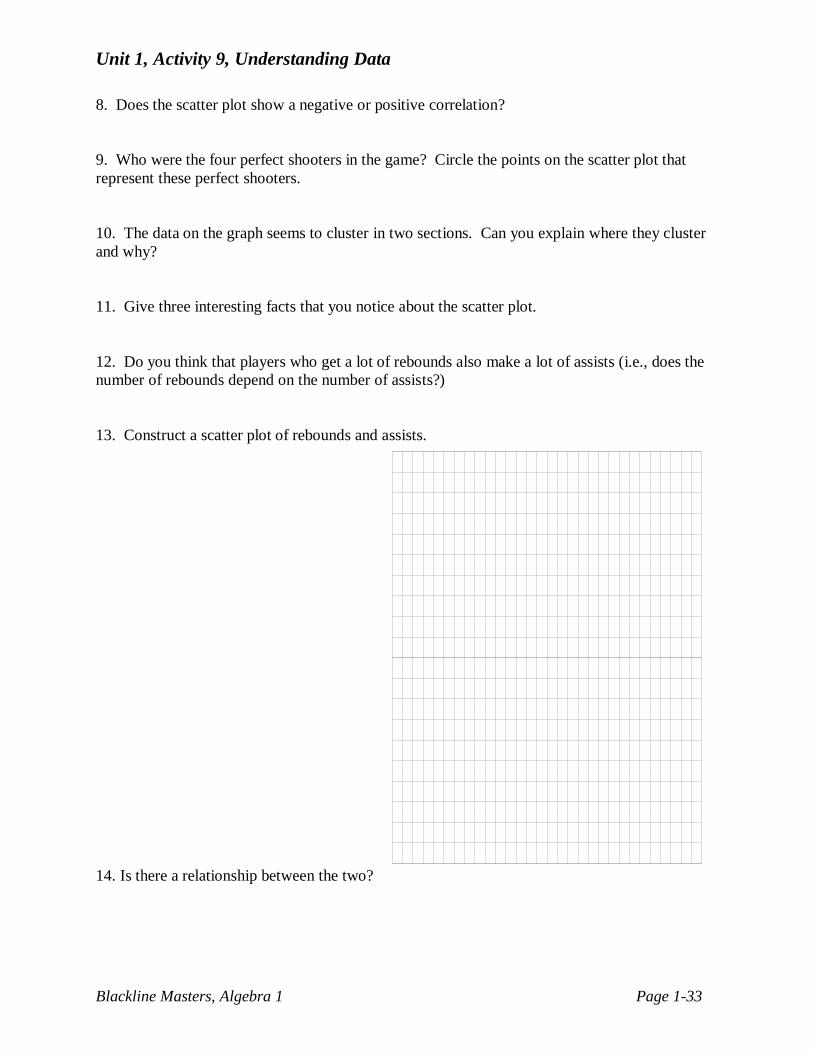
8. Does the scatter plot show a negative or positive correlation? 9. Who were the four perfect shooters in the game? Circle the points on the scatter plot that represent these perfect shooters. 10. The data on the graph seems to cluster in two sections. Can you explain where they cluster and why? 11. Give three interesting facts that you notice about the scatter plot. 12. Do you think that players who get a lot of rebounds also make a lot of assists (i.e., does the number of rebounds depend on the number of assists?) 13. Construct a scatter plot of rebounds and assists. 14. Is there a relationship between the two?
Unit 1, Activity9, Understanding Data with Answers
Blackline Masters, Algebra 1 Page 1-34
Understanding Data The table below gives the box score for game three of the 2003 NBA Championship series.
SAN ANTONIO SPURS REBOUNDS PLAYER POS MIN FGM-A 3GM-A FTM-A OFF DEF TOT AST PF PTS
TONY PARKER G 43 9-21 4-6 4-8 1 2 3 6 0 26
STEPHEN JACKSON G 36 2-7 1-2 2-4 0 6 6 2 3 7
TIM DUNCAN F 45 6-13 0-0 9-12 3 13 16 7 3 21 BRUCE BOWEN F 32 0-5 0-2 0-0 1 3 4 0 3 0 DAVID ROBINSON C 26 1-5 0-0 6-8 1 2 3 0 2 8 Emanuel Ginobili 28 3-6 0-0 2-3 2 0 2 4 2 8 Malik Rose 22 4-7 0-0 0-0 0 2 2 0 2 8 Speedy Claxton 5 2-2 0-0 0-0 0 1 1 0 1 4 Kevin Willis 3 1-1 0-0 0-0 1 0 1 0 1 2 Steve Kerr Danny Ferry Steve Smith TOTAL 240 28-67 5-10 23-35 9 29 38 19 17 84 41.8% 50.0% 65.7% Team Rebs: 15 NEW JERSEY NETS REBOUNDS PLAYER POS MIN FGM-A 3GM-A FTM-A OFF DEF TOT AST PF PTS JASON KIDD G 42 6-19 0-5 0-0 2 1 3 11 3 12 KERRY KITTLES G 43 8-16 3-5 2-3 1 3 4 1 2 21 KENYON MARTIN F 42 8-18 0-1 7-8 2 9 11 0 5 23 RICHARD JEFFERSON F 36 3-11 0-0 0-0 2 7 9 0 2 6 JASON COLLINS C 25 0-3 0-0 0-0 4 1 5 1 6 0 Lucious Harris 22 1-6 1-2 4-4 1 0 1 3 2 7 Dikembe Mutombo 18 1-1 0-0 0-0 1 2 3 0 3 2 Rodney Rogers 11 0-3 0-0 2-2 0 2 2 0 2 2 Anthony Johnson 6 2-2 0-0 0-0 0 1 1 0 0 4 Aaron Williams 4 1-2 0-0 0-0 1 1 2 1 1 2 Tamar Slay Brian Scalabrine TOTAL 240 30-81 4-13 15-17 14 27 41 17 26 79 37.0% 30.8% 88.2% Team Rebs: 10 Source: www.nba.com
Key for Table Pos Position 3GM-A 3 point goals made – 3 point goals attempted Min. Minutes Played AST Assists FGM–A Field goals made–field goals attempted PF Personal Fouls FTM–A Free throws made–free throws attempted PTS Total Points Scored R Rebounds
Use the table above to answer the following questions. 1. Which player played the most minutes of the game? __Tim Duncan_____________________ 2. Who had the most assists? __Jason Kidd_______________________________ 3. Which team made a larger percentage of free throws? ____Nets_________________
Unit 1, Activity9, Understanding Data with Answers
Blackline Masters, Algebra 1 Page 1-35
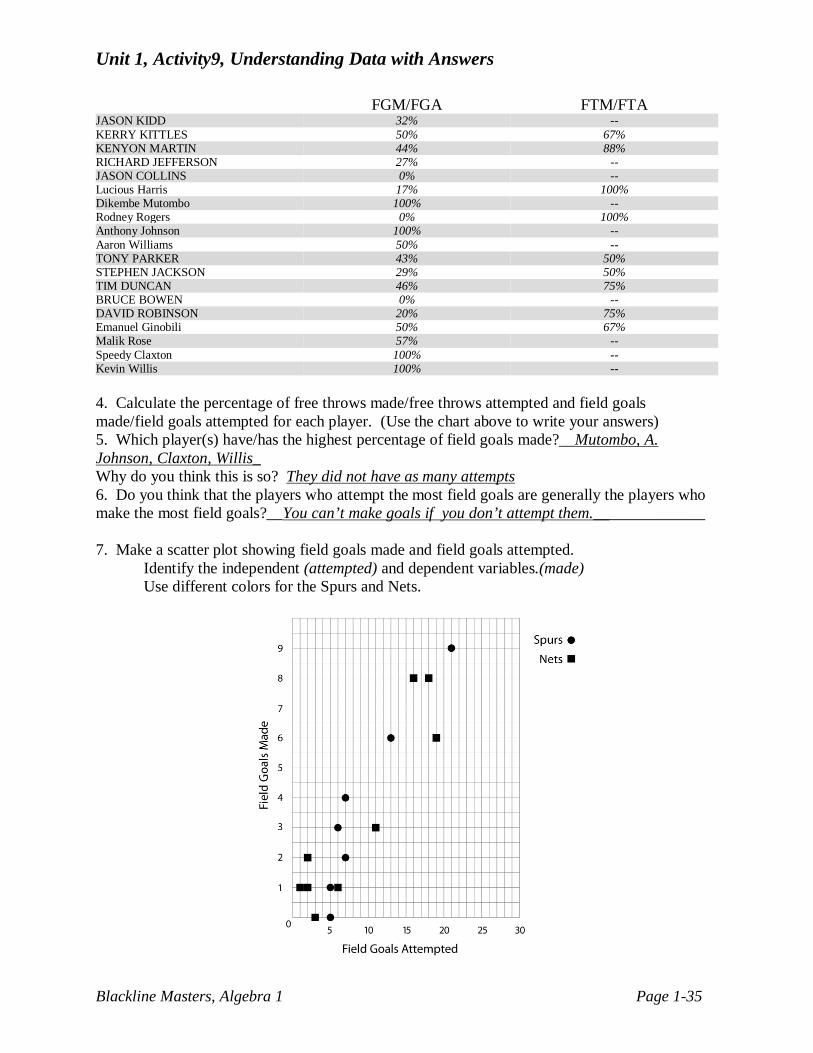
FGM/FGA FTM/FTA JASON KIDD 32% -- KERRY KITTLES 50% 67% KENYON MARTIN 44% 88% RICHARD JEFFERSON 27% -- JASON COLLINS 0% -- Lucious Harris 17% 100% Dikembe Mutombo 100% -- Rodney Rogers 0% 100% Anthony Johnson 100% -- Aaron Williams 50% -- TONY PARKER 43% 50% STEPHEN JACKSON 29% 50% TIM DUNCAN 46% 75% BRUCE BOWEN 0% -- DAVID ROBINSON 20% 75% Emanuel Ginobili 50% 67% Malik Rose 57% -- Speedy Claxton 100% -- Kevin Willis 100% -- 4. Calculate the percentage of free throws made/free throws attempted and field goals made/field goals attempted for each player. (Use the chart above to write your answers) 5. Which player(s) have/has the highest percentage of field goals made?__Mutombo, A. Johnson, Claxton, Willis_ Why do you think this is so? They did not have as many attempts 6. Do you think that the players who attempt the most field goals are generally the players who make the most field goals?__You can’t make goals if you don’t attempt them.______________ 7. Make a scatter plot showing field goals made and field goals attempted. Identify the independent (attempted) and dependent variables.(made) Use different colors for the Spurs and Nets.
Unit 1, Activity9, Understanding Data with Answers
Blackline Masters, Algebra 1 Page 1-36
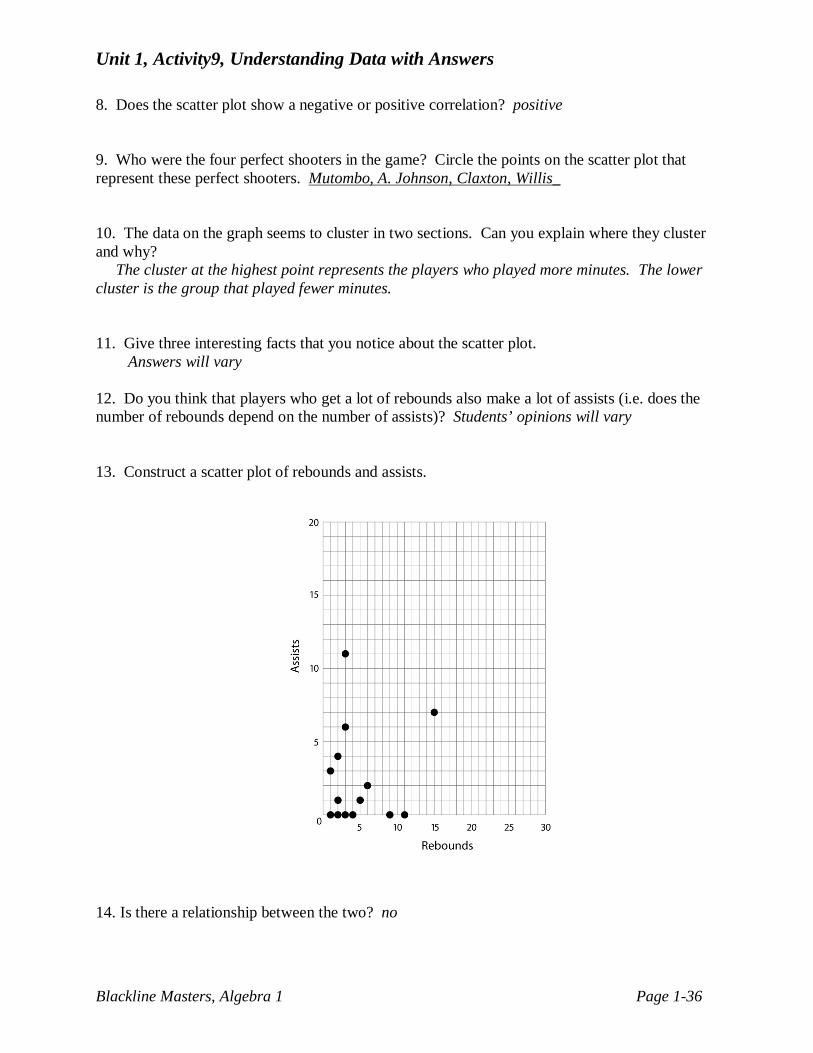
8. Does the scatter plot show a negative or positive correlation? positive 9. Who were the four perfect shooters in the game? Circle the points on the scatter plot that represent these perfect shooters. Mutombo, A. Johnson, Claxton, Willis_ 10. The data on the graph seems to cluster in two sections. Can you explain where they cluster and why? The cluster at the highest point represents the players who played more minutes. The lower cluster is the group that played fewer minutes. 11. Give three interesting facts that you notice about the scatter plot. Answers will vary 12. Do you think that players who get a lot of rebounds also make a lot of assists (i.e. does the number of rebounds depend on the number of assists)? Students’ opinions will vary 13. Construct a scatter plot of rebounds and assists. 14. Is there a relationship between the two? no
Unit 2, Activity 2, Split-Page Notetaking Example
Blackline Masters, Algebra 1 Page 2-1
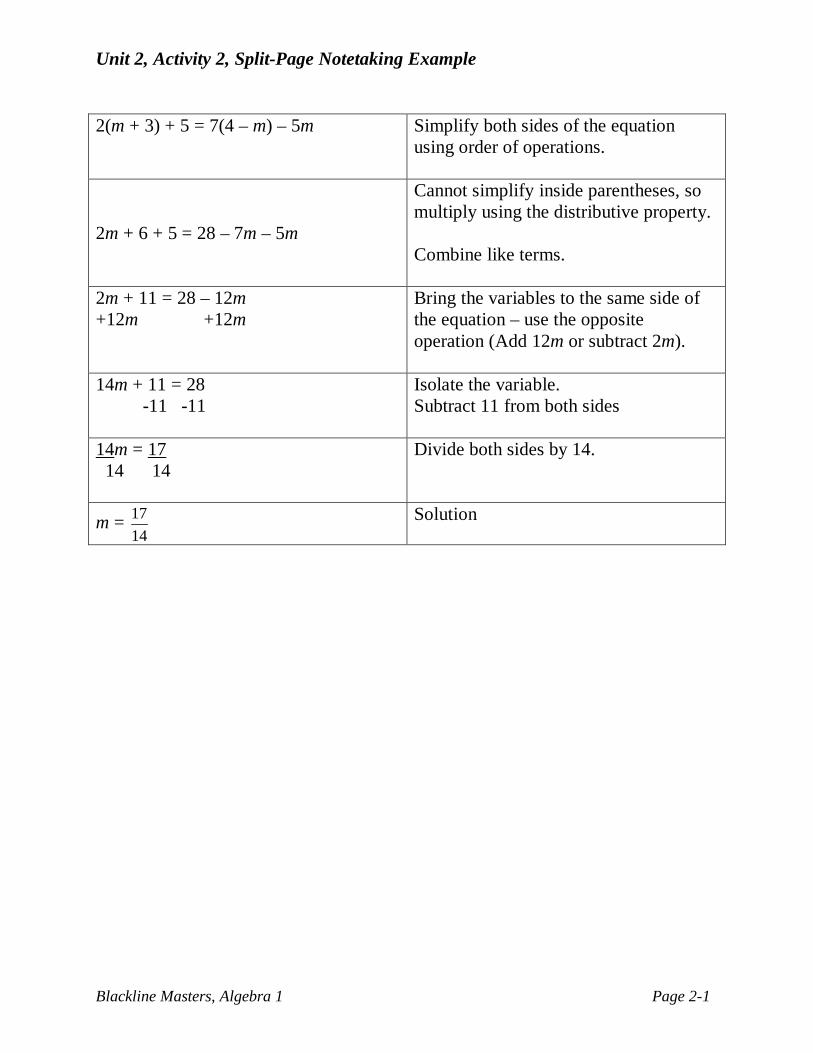
2(m + 3) + 5 = 7(4 – m) – 5m Simplify both sides of the equation
using order of operations.
2m + 6 + 5 = 28 – 7m – 5m
Cannot simplify inside parentheses, so multiply using the distributive property. Combine like terms.
2m + 11 = 28 – 12m +12m +12m
Bring the variables to the same side of the equation – use the opposite operation (Add 12m or subtract 2m).
14m + 11 = 28 -11 -11
Isolate the variable. Subtract 11 from both sides
14m = 17 14 14
Divide both sides by 14.
m = 1714
Solution
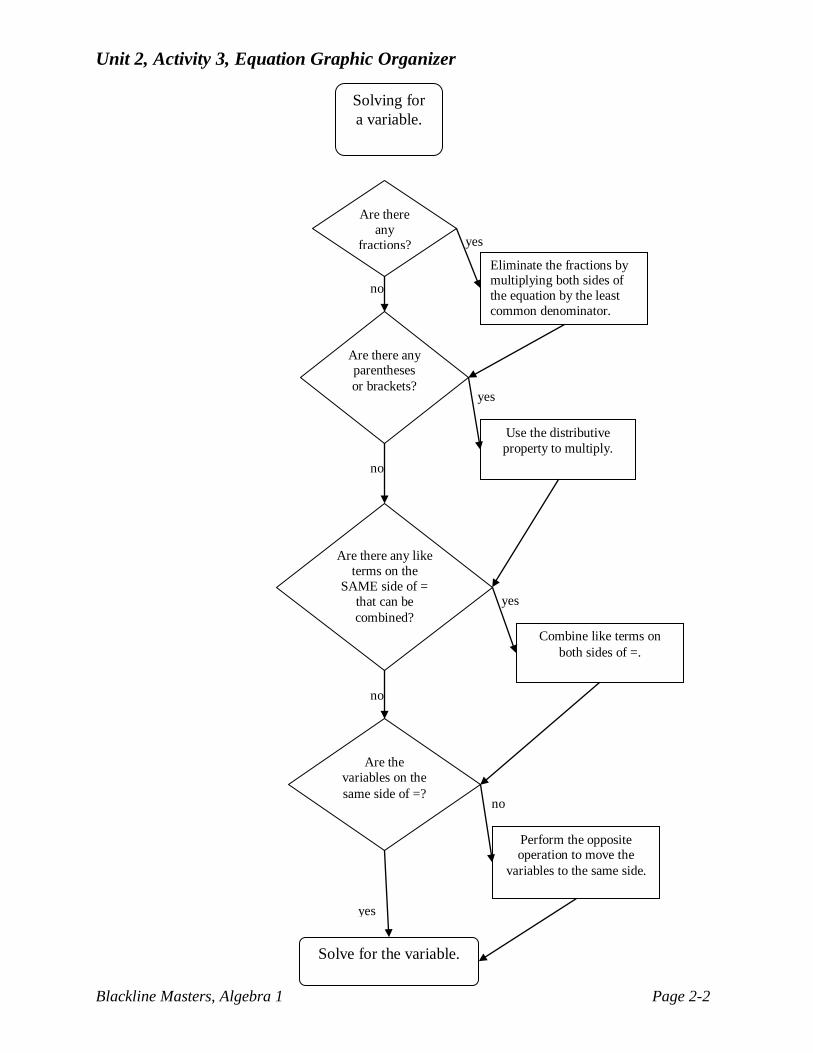
Unit 2, Activity 3, Equation Graphic Organizer
Blackline Masters, Algebra 1 Page 2-2
Are there any
fractions? Eliminate the fractions by multiplying both sides of the equation by the least common denominator.
Are there any parentheses or brackets?
Use the distributive property to multiply.
Are there any like terms on the
SAME side of = that can be combined?
Combine like terms on both sides of =.
Are the variables on the same side of =?
Perform the opposite operation to move the
variables to the same side.
Solve for the variable.
yes
yes
yes
no
no
no
no
yes
Solving for a variable.
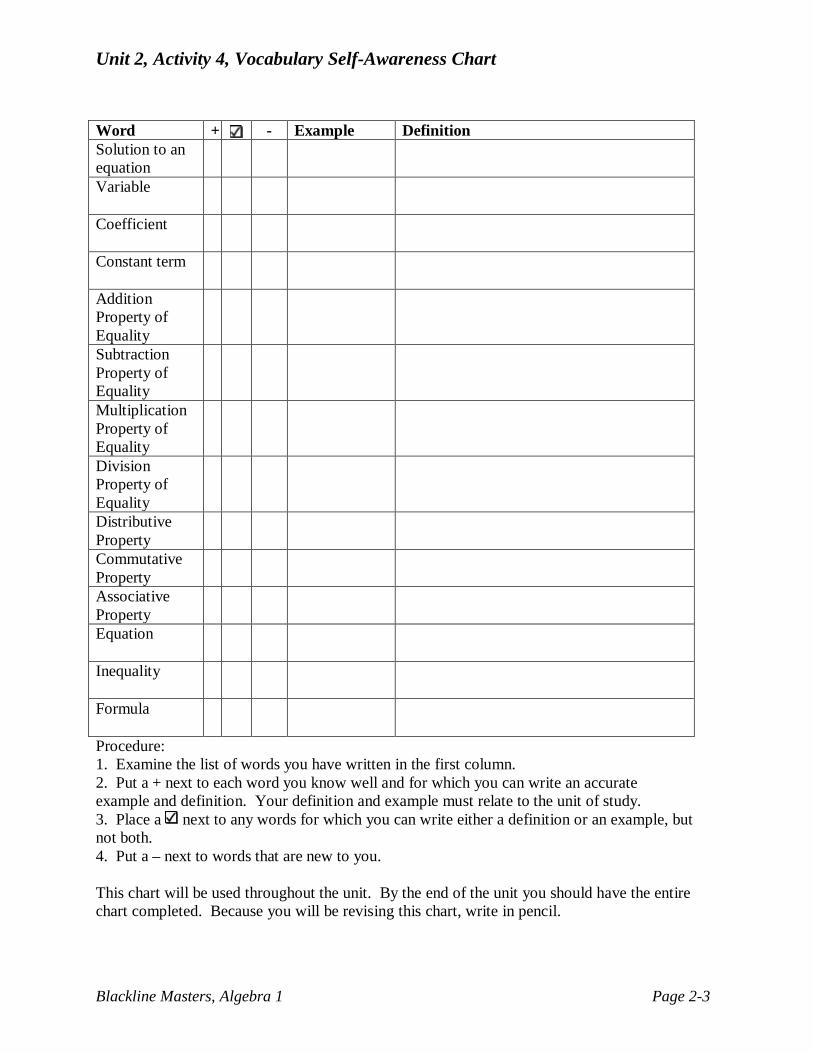
Unit 2, Activity 4, Vocabulary Self-Awareness Chart
Blackline Masters, Algebra 1 Page 2-3
Procedure: 1. Examine the list of words you have written in the first column. 2. Put a + next to each word you know well and for which you can write an accurate example and definition. Your definition and example must relate to the unit of study. 3. Place a next to any words for which you can write either a definition or an example, but not both. 4. Put a – next to words that are new to you. This chart will be used throughout the unit. By the end of the unit you should have the entire chart completed. Because you will be revising this chart, write in pencil.
Word + - Example Definition Solution to an equation
Variable
Coefficient
Constant term
Addition Property of Equality
Subtraction Property of Equality
Multiplication Property of Equality
Division Property of Equality
Distributive Property
Commutative Property
Associative Property
Equation
Inequality
Formula
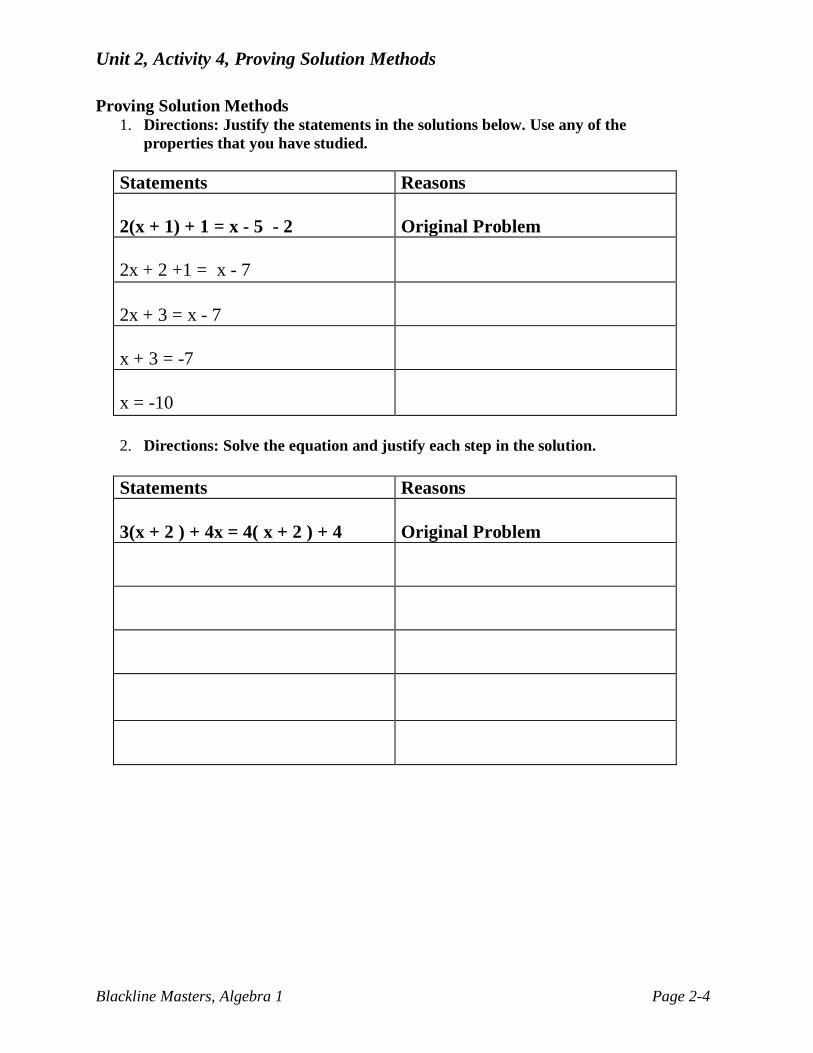
Unit 2, Activity 4, Proving Solution Methods
Blackline Masters, Algebra 1 Page 2-4
Proving Solution Methods
1. Directions: Justify the statements in the solutions below. Use any of the properties that you have studied.
Statements Reasons 2(x + 1) + 1 = x - 5 - 2
Original Problem
2x + 2 +1 = x - 7
2x + 3 = x - 7
x + 3 = -7
x = -10
2. Directions: Solve the equation and justify each step in the solution.
Statements Reasons 3(x + 2 ) + 4x = 4( x + 2 ) + 4
Original Problem
Unit 2, Activity 4, Proving Solution Methods
Blackline Masters, Algebra 1 Page 2-5
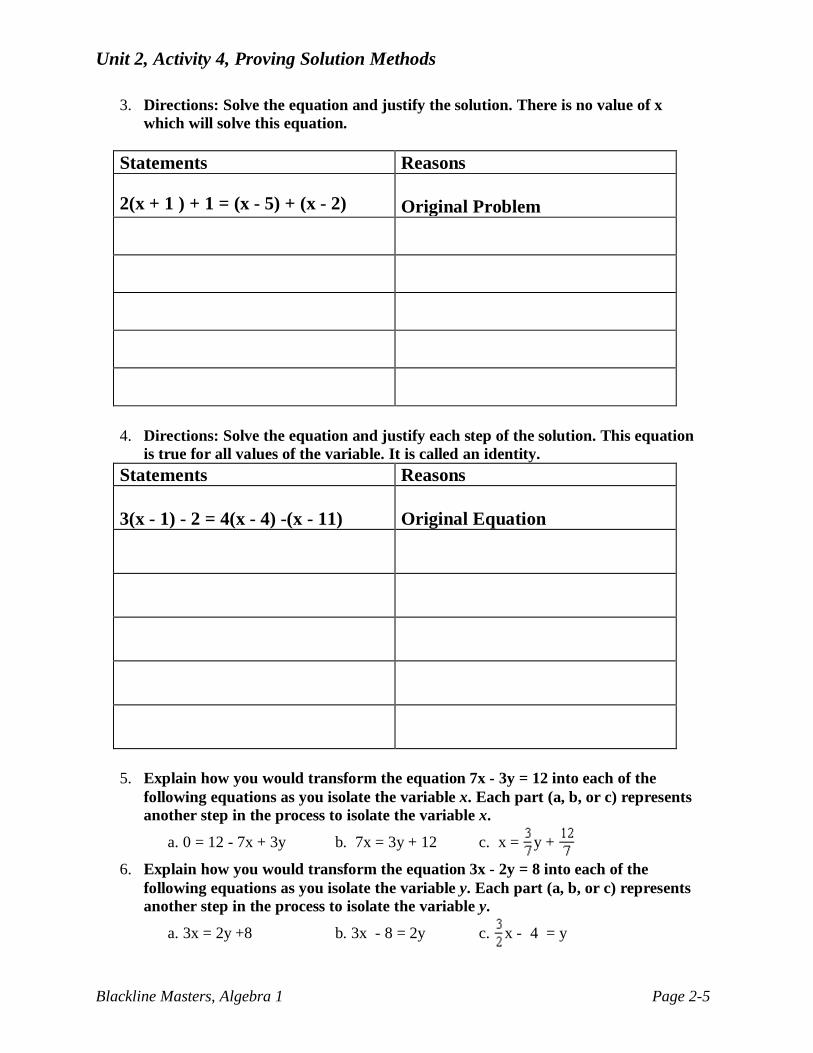
3. Directions: Solve the equation and justify the solution. There is no value of x which will solve this equation.
Statements Reasons 2(x + 1 ) + 1 = (x - 5) + (x - 2)
Original Problem
4. Directions: Solve the equation and justify each step of the solution. This equation
is true for all values of the variable. It is called an identity. Statements Reasons 3(x - 1) - 2 = 4(x - 4) -(x - 11)
Original Equation
5. Explain how you would transform the equation 7x - 3y = 12 into each of the
following equations as you isolate the variable x. Each part (a, b, or c) represents another step in the process to isolate the variable x.
a. 0 = 12 - 7x + 3y b. 7x = 3y + 12 c. x = y +
6. Explain how you would transform the equation 3x - 2y = 8 into each of the following equations as you isolate the variable y. Each part (a, b, or c) represents another step in the process to isolate the variable y.
a. 3x = 2y +8 b. 3x - 8 = 2y c. x - 4 = y
Unit 2, Activity 4, Proving Solution Methods with Answers
Blackline Masters, Algebra 1 Page 2-6
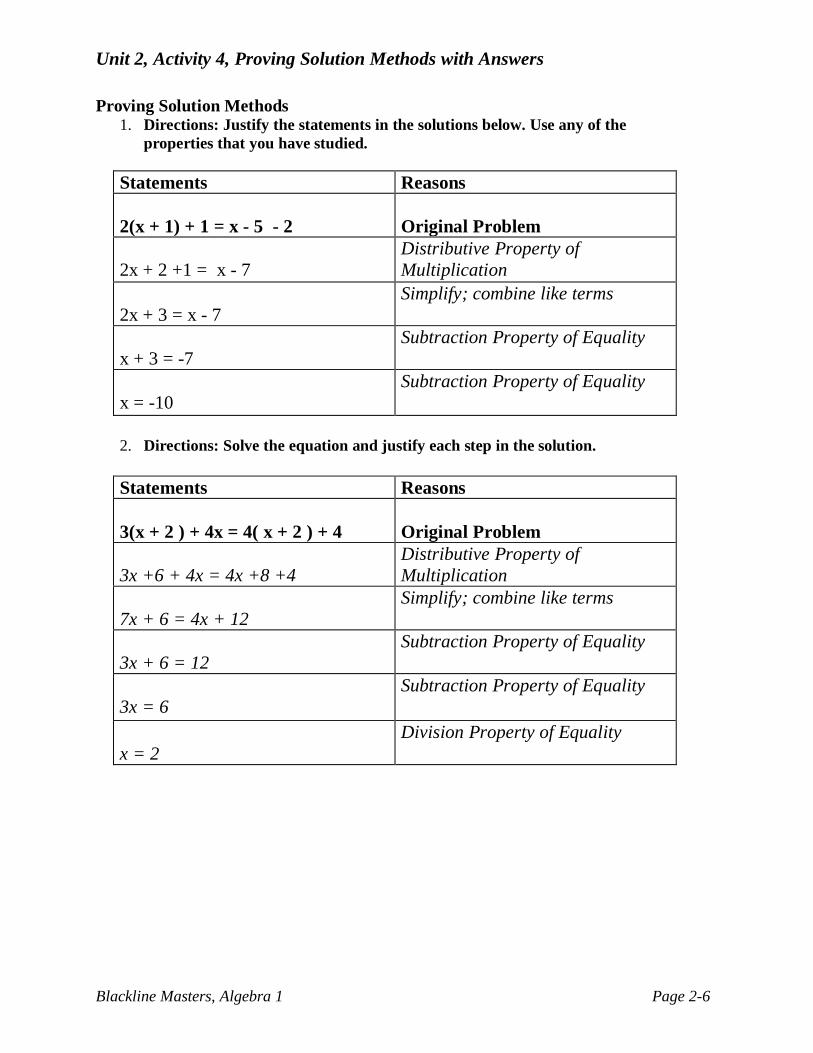
Proving Solution Methods
1. Directions: Justify the statements in the solutions below. Use any of the properties that you have studied.
Statements Reasons 2(x + 1) + 1 = x - 5 - 2
Original Problem
2x + 2 +1 = x - 7
Distributive Property of Multiplication
2x + 3 = x - 7
Simplify; combine like terms
x + 3 = -7
Subtraction Property of Equality
x = -10
Subtraction Property of Equality
2. Directions: Solve the equation and justify each step in the solution.
Statements Reasons 3(x + 2 ) + 4x = 4( x + 2 ) + 4
Original Problem
3x +6 + 4x = 4x +8 +4
Distributive Property of Multiplication
7x + 6 = 4x + 12
Simplify; combine like terms
3x + 6 = 12
Subtraction Property of Equality
3x = 6
Subtraction Property of Equality
x = 2
Division Property of Equality

Unit 2, Activity 4, Proving Solution Methods with Answers
Blackline Masters, Algebra 1 Page 2-7
3. Directions: Solve the equation and justify the solution. There is no value of x which will solve this equation.
Statements Reasons 2(x + 1 ) + 1 = (x - 5) + (x - 2)
Original Problem
2x +2 + 1 = 2x - 7
Distributive Property of Multiplication; combine like terms
2x + 3 = 2x - 7
Simplify; combine like terms
3 = -7
Subtraction Property of Equality
4. Directions: Solve the equation and justify each step of the solution. This equation
is true for all values of the variable. It is called an identity. Statements Reasons 3(x - 1) - 2 = 4(x - 4) -(x - 11)
Original Equation
3x - 3 -2 = 4x - 16 - x + 11
Distributive Property of Multiplication
3x - 5 = 3x - 5
Simplify; combine like terms
-5 = -5
Subtraction Property of Equality
0 = 0
Addition Property of Equality
0 = 0
Reflexive Property of Equality
Unit 2, Activity 4, Proving Solution Methods with Answers
Blackline Masters, Algebra 1 Page 2-8
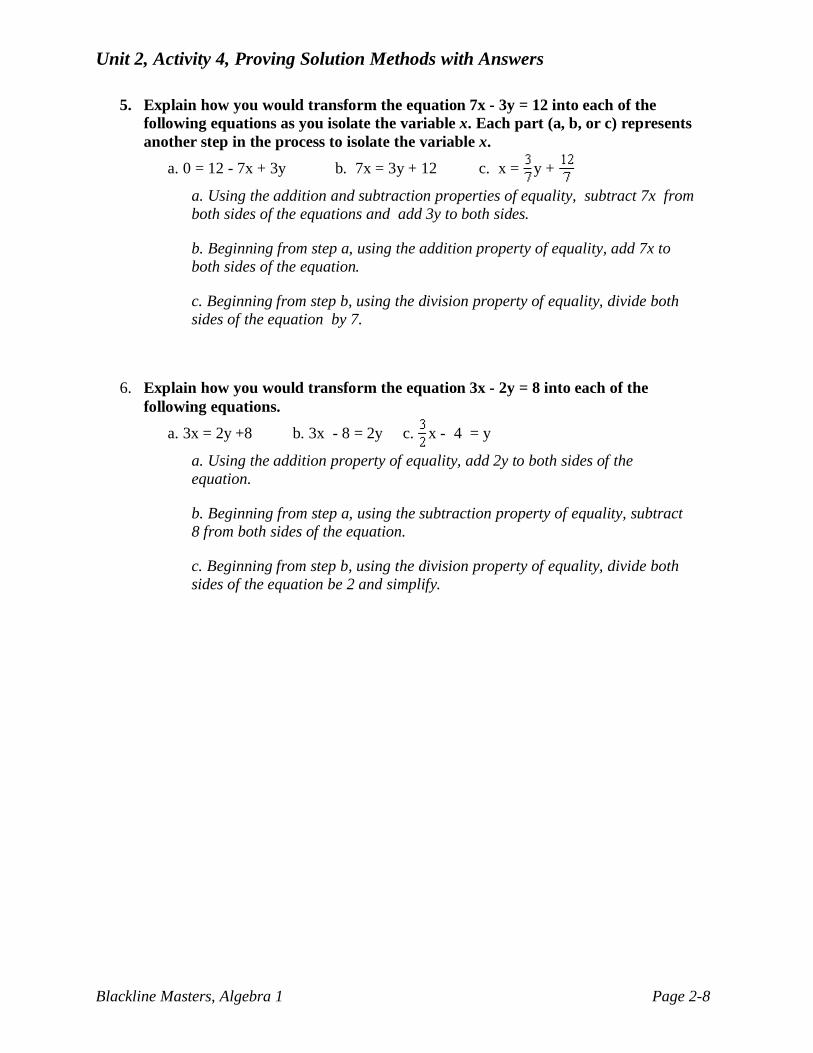
5. Explain how you would transform the equation 7x - 3y = 12 into each of the following equations as you isolate the variable x. Each part (a, b, or c) represents another step in the process to isolate the variable x.
a. 0 = 12 - 7x + 3y b. 7x = 3y + 12 c. x = y +
a. Using the addition and subtraction properties of equality, subtract 7x from both sides of the equations and add 3y to both sides.
b. Beginning from step a, using the addition property of equality, add 7x to both sides of the equation.
c. Beginning from step b, using the division property of equality, divide both sides of the equation by 7.
6. Explain how you would transform the equation 3x - 2y = 8 into each of the following equations.
a. 3x = 2y +8 b. 3x - 8 = 2y c. x - 4 = y
a. Using the addition property of equality, add 2y to both sides of the equation.
b. Beginning from step a, using the subtraction property of equality, subtract 8 from both sides of the equation.
c. Beginning from step b, using the division property of equality, divide both sides of the equation be 2 and simplify.

Unit 2, Activity 5 Linear Inequalities to Solve Problems
Blackline Masters, Algebra I Page 2-9
2(m + 3) + 5 < 7(4 – m) – 5m Simplify both sides of the inequality using order of operations.
2m + 6 + 5 < 28 – 7m – 5m
Cannot simplify inside parentheses, so multiply using the distributive property Combine like terms
2m + 11 < 28 – 12m +12m +12m
Bring the variables to the same side of the inequality – use the opposite operation (Add 12m or subtract 2m)
14m + 11 < 28 -11 -11
Isolate the variable Subtract 11 from both sides
14m < 17 14 14
Divide both sides by 14
m < 1714
Solution

Unit 2, Activity 6, Isolating Variables in Formulas
Blackline Masters, Algebra I Page 2-10
Isolating Variables in Formulas
Solve the equation or formula for the indicated variable.
1. , for t
2. , for U
3. 12
A bh= , for h
4. 2 2P l w= + , for l
5. ( ) ( )1 1y y m x x− = − , for m
6. Ax By C+ = , for y
7. ( )5 329
C F= − , for F
8. ( )1 212
A b b= + , for b 9. 4 3 7y x+ = , for x 10. 3 4 9y x− = , for y Solve the equation or formula for the indicated variable.
11. The formula for the time a traffic light remains yellow is , where t is the time
in seconds and s is the speed limit in miles per hour. a. Solve the equation for s. b. What is the speed limit at a traffic light that remains yellow for 4.5 seconds?
Unit 2, Activity 6, Isolating Variables in Formulas
Blackline Masters, Algebra I Page 2-11
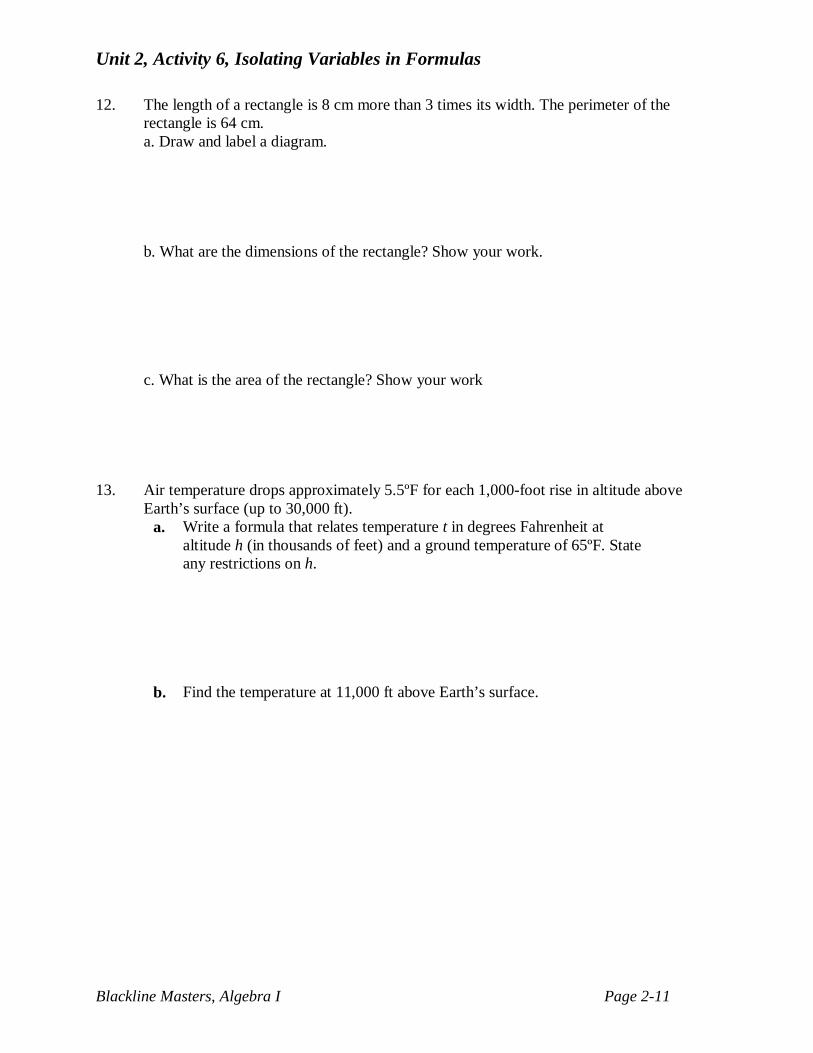
12. The length of a rectangle is 8 cm more than 3 times its width. The perimeter of the rectangle is 64 cm.
a. Draw and label a diagram. b. What are the dimensions of the rectangle? Show your work. c. What is the area of the rectangle? Show your work 13. Air temperature drops approximately 5.5ºF for each 1,000-foot rise in altitude above
Earth’s surface (up to 30,000 ft). a. Write a formula that relates temperature t in degrees Fahrenheit at
altitude h (in thousands of feet) and a ground temperature of 65ºF. State any restrictions on h.
b. Find the temperature at 11,000 ft above Earth’s surface.

Unit 2, Activity 6, Isolating Variables in Formulas with Answers
Blackline Masters, Algebra I Page 2-12
Isolating Variables in Formulas
Solve the equation or formula for the indicated variable.
1. , for t
2. , for U
3. 12
A bh= , for h 2A hb
=
4. 2 2P l w= + , for l 22
P w l−=
5. ( ) ( )1 1y y m x x− = − , for m ( )( )
1
1
y ym
x x−
=−
6. Ax By C+ = , for y C Ax yB−
=
7. ( )5 329
C F= − , for F 9 325
F C= +
8. ( )1 212
A b b= + , for b1 1 22b A b= −
9. 4 3 7y x+ = , for x 7 43
y x−=
10. 3 4 9y x− = , for y 9 4 4 or 33 3
xy y x+= = +
Solve the equation or formula for the indicated variable.
11. The formula for the time a traffic light remains yellow is , where t is the time
in seconds and s is the speed limit in miles per hour. a. Solve the equation for s. ( )8 1s t= − b. What is the speed limit at a traffic light that remains yellow for 4.5 seconds? s = 28 miles per hour

Unit 2, Activity 6, Isolating Variables in Formulas with Answers
Blackline Masters, Algebra I Page 2-13
12. The length of a rectangle is 8 cm more than 3 times its width. The perimeter of the rectangle is 64 cm.
a. Draw and label a diagram. w 3w +8 w = width; 3w + 8 = length b. What are the dimensions of the rectangle? Show your work.
P = 2w + 2l 64 = 2w + 2(3w + 8) 64 = 2w + 6w + 16
48 = 8w 6 cm = w
26 cm = length c. What is the area of the rectangle? Show your work
A = lw A = 6 x 26
A = 156 cm2
13. Air temperature drops approximately 5.5ºF for each 1,000-foot rise in altitude above
Earth’s surface (up to 30,000 ft). a. Write a formula that relates temperature t in degrees Fahrenheit at
altitude h (in thousands of feet) and a ground temperature of 65ºF. State any restrictions on h. t = temperature; h = height in number of thousands of feet Formula: t = 65 – 5.5h
b. Find the temperature at 11,000 ft above Earth’s surface. t = 65 – 5.5(11); t = 4.5 degrees Celsius
Unit 2, Activity 7, Solving Real World Application Problems Using a Formula
Blackline Masters, Algebra I Page 2-14
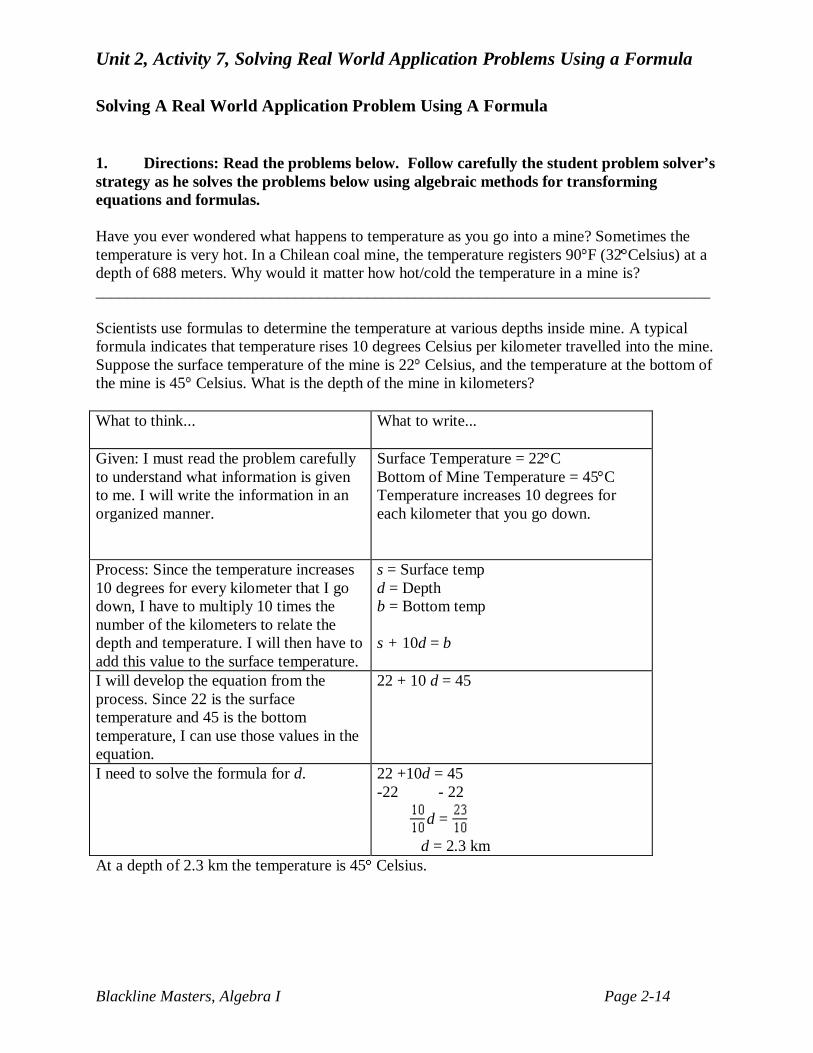
Solving A Real World Application Problem Using A Formula
1. Directions: Read the problems below. Follow carefully the student problem solver’s strategy as he solves the problems below using algebraic methods for transforming equations and formulas. Have you ever wondered what happens to temperature as you go into a mine? Sometimes the temperature is very hot. In a Chilean coal mine, the temperature registers 90 F (32 Celsius) at a depth of 688 meters. Why would it matter how hot/cold the temperature in a mine is? _____________________________________________________________________________ Scientists use formulas to determine the temperature at various depths inside mine. A typical formula indicates that temperature rises 10 degrees Celsius per kilometer travelled into the mine. Suppose the surface temperature of the mine is 22 Celsius, and the temperature at the bottom of the mine is 45 Celsius. What is the depth of the mine in kilometers? What to think...
What to write...
Given: I must read the problem carefully to understand what information is given to me. I will write the information in an organized manner.
Surface Temperature = 22 C Bottom of Mine Temperature = 45 C Temperature increases 10 degrees for each kilometer that you go down.
Process: Since the temperature increases 10 degrees for every kilometer that I go down, I have to multiply 10 times the number of the kilometers to relate the depth and temperature. I will then have to add this value to the surface temperature.
s = Surface temp d = Depth b = Bottom temp s + 10d = b
I will develop the equation from the process. Since 22 is the surface temperature and 45 is the bottom temperature, I can use those values in the equation.
22 + 10 d = 45
I need to solve the formula for d. 22 +10d = 45 -22 - 22
d =
d = 2.3 km At a depth of 2.3 km the temperature is 45 Celsius.

Unit 2, Activity 7, Solving Real World Application Problems Using a Formula
Blackline Masters, Algebra I Page 2-15
2. Now try this problem using this method of problem solving using a formula. The temperature on a ski slope decreases 2.5 Fahrenheit for every 1000 feet you are above the base of the slope. If the temperature at the base is 28 and the temperature at the summit is 24 degrees. How many thousand feet is the summit above the base? What to think...
What to write...
Given: I must read the problem carefully to understand what information is given to me. I will write the information in an organized manner.
Process: Since the temperature __________ degrees for every foot that I go ______, I have to _________ times the number of 1000s of feet to relate the height and temperature. I will then have to _______ this value from the _______ temperature.
I will develop the equation from the process using the values I know from the problem.
I need to solve the formula for x.
At a height of _______ the temperature is __________________.
3. Some problems involve geometric formulas. Suppose a rectangle has a perimeter of 96 centimeters. What is the formula for determining the perimeter of that shape? ____________________________________________________________________ The width of the rectangle is 2 less than its length. Determine the length and the width of the shape. Also, determine its area. First, draw and label a diagram before you begin to solve the problem. Wanted: l = length and w = width of the rectangle What to think...
What to write...
Given:
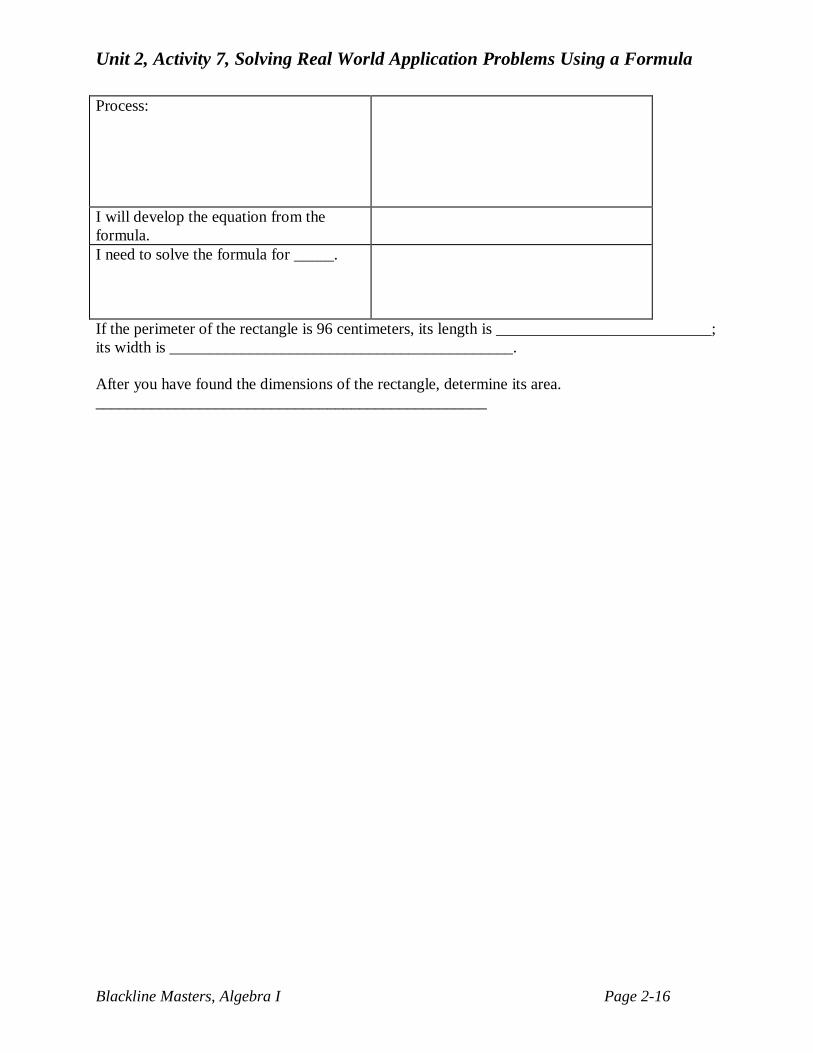
Unit 2, Activity 7, Solving Real World Application Problems Using a Formula
Blackline Masters, Algebra I Page 2-16
Process:
I will develop the equation from the formula.
I need to solve the formula for _____.
If the perimeter of the rectangle is 96 centimeters, its length is ___________________________; its width is ___________________________________________. After you have found the dimensions of the rectangle, determine its area. _________________________________________________
Unit 2, Activity 7, Solving Real world Application Problems Using a Formula with Answers
Blackline Masters, Algebra I Page 2-17
Solving A Real World Application Problem Using A Formula
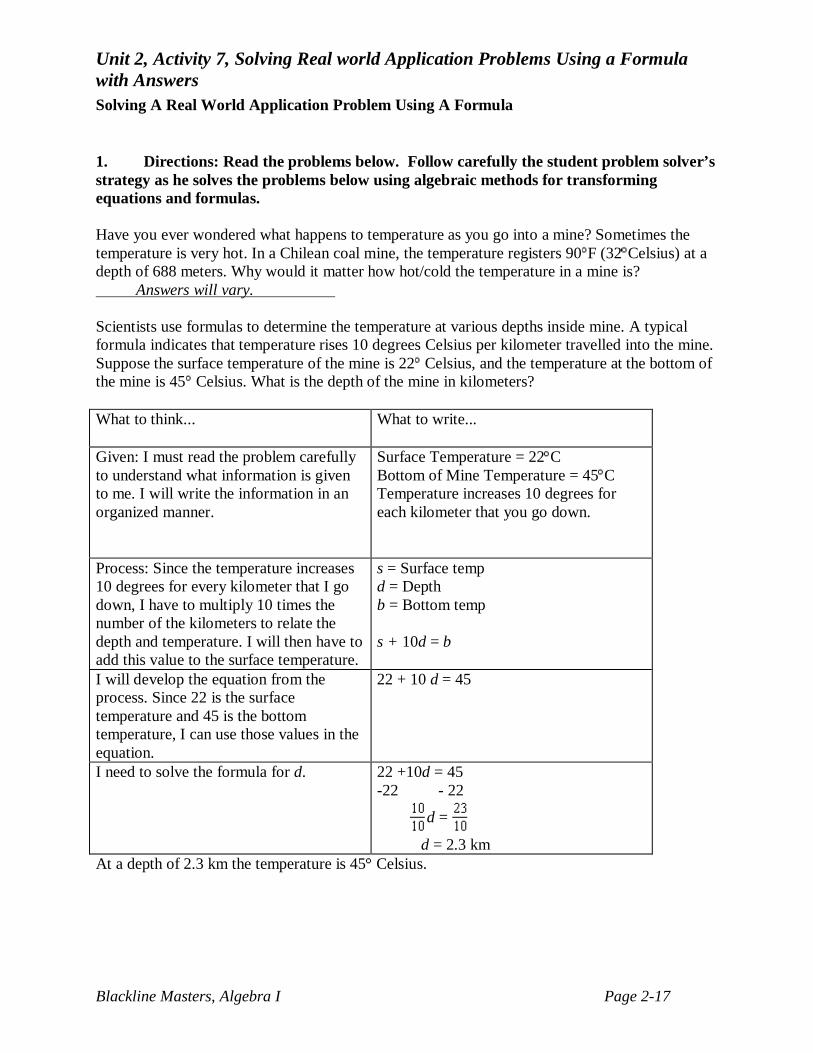
1. Directions: Read the problems below. Follow carefully the student problem solver’s strategy as he solves the problems below using algebraic methods for transforming equations and formulas. Have you ever wondered what happens to temperature as you go into a mine? Sometimes the temperature is very hot. In a Chilean coal mine, the temperature registers 90 F (32 Celsius) at a depth of 688 meters. Why would it matter how hot/cold the temperature in a mine is? Answers will vary. Scientists use formulas to determine the temperature at various depths inside mine. A typical formula indicates that temperature rises 10 degrees Celsius per kilometer travelled into the mine. Suppose the surface temperature of the mine is 22 Celsius, and the temperature at the bottom of the mine is 45 Celsius. What is the depth of the mine in kilometers? What to think...
What to write...
Given: I must read the problem carefully to understand what information is given to me. I will write the information in an organized manner.
Surface Temperature = 22 C Bottom of Mine Temperature = 45 C Temperature increases 10 degrees for each kilometer that you go down.
Process: Since the temperature increases 10 degrees for every kilometer that I go down, I have to multiply 10 times the number of the kilometers to relate the depth and temperature. I will then have to add this value to the surface temperature.
s = Surface temp d = Depth b = Bottom temp s + 10d = b
I will develop the equation from the process. Since 22 is the surface temperature and 45 is the bottom temperature, I can use those values in the equation.
22 + 10 d = 45
I need to solve the formula for d. 22 +10d = 45 -22 - 22
d =
d = 2.3 km At a depth of 2.3 km the temperature is 45 Celsius.
Unit 2, Activity 7, Solving Real world Application Problems Using a Formula with Answers
Blackline Masters, Algebra I Page 2-18
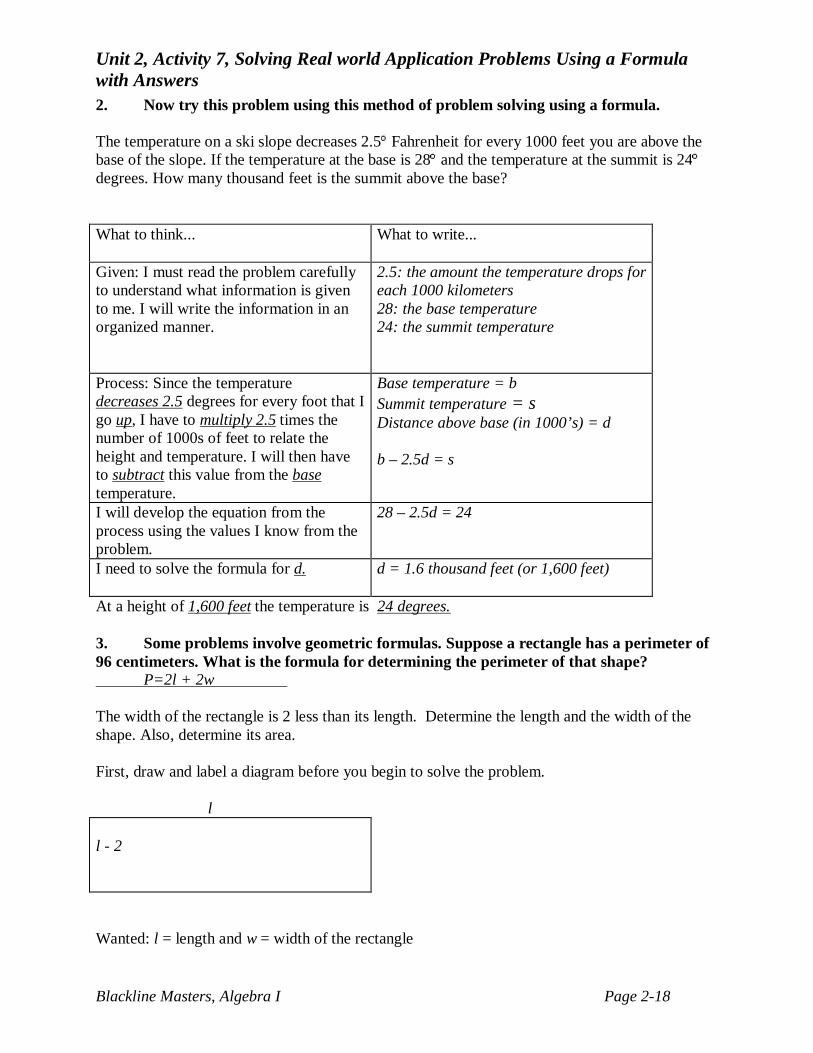
2. Now try this problem using this method of problem solving using a formula. The temperature on a ski slope decreases 2.5 Fahrenheit for every 1000 feet you are above the base of the slope. If the temperature at the base is 28 and the temperature at the summit is 24 degrees. How many thousand feet is the summit above the base? What to think...
What to write...
Given: I must read the problem carefully to understand what information is given to me. I will write the information in an organized manner.
2.5: the amount the temperature drops for each 1000 kilometers 28: the base temperature 24: the summit temperature
Process: Since the temperature decreases 2.5 degrees for every foot that I go up, I have to multiply 2.5 times the number of 1000s of feet to relate the height and temperature. I will then have to subtract this value from the base temperature.
Base temperature = b Summit temperature = s Distance above base (in 1000’s) = d b – 2.5d = s
I will develop the equation from the process using the values I know from the problem.
28 – 2.5d = 24
I need to solve the formula for d. d = 1.6 thousand feet (or 1,600 feet)
At a height of 1,600 feet the temperature is 24 degrees. 3. Some problems involve geometric formulas. Suppose a rectangle has a perimeter of 96 centimeters. What is the formula for determining the perimeter of that shape? P=2l + 2w The width of the rectangle is 2 less than its length. Determine the length and the width of the shape. Also, determine its area. First, draw and label a diagram before you begin to solve the problem. l l - 2 Wanted: l = length and w = width of the rectangle
Unit 2, Activity 7, Solving Real world Application Problems Using a Formula with Answers
Blackline Masters, Algebra I Page 2-19
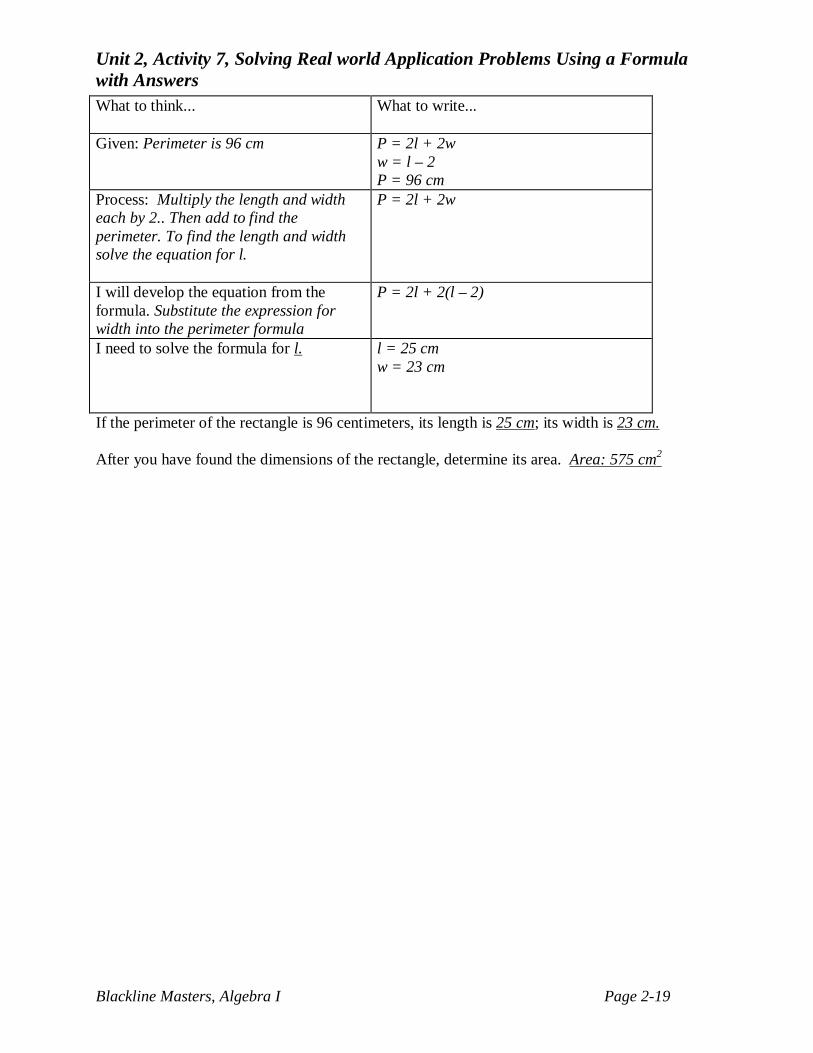
What to think...
What to write...
Given: Perimeter is 96 cm P = 2l + 2w w = l – 2 P = 96 cm
Process: Multiply the length and width each by 2.. Then add to find the perimeter. To find the length and width solve the equation for l.
P = 2l + 2w
I will develop the equation from the formula. Substitute the expression for width into the perimeter formula
P = 2l + 2(l – 2)
I need to solve the formula for l. l = 25 cm w = 23 cm
If the perimeter of the rectangle is 96 centimeters, its length is 25 cm; its width is 23 cm. After you have found the dimensions of the rectangle, determine its area. Area: 575 cm2

Unit 2, Activity 8, Linear Relationships
Blackline Masters, Algebra I Page 2-20
This is a chart of all of the hours worked, h, and the total pay, p, in your paycheck. h 1 2 3 4 5 6 p 6.00 12.00 18.00 24.00 30.00 36.00 1. Please plot these points on the graph. 2. Is the graph linear? ___________________________ 3. Does the line go through the origin? ______________ 4. What is the rate of change? _______________ 5. What is the real-life meaning of the rate of change of this linear relationship? ______________________________________________ 6. Write an equation to model this situation.__________ 7. If you need to earn $60.00 to buy school supplies, how many hours will you need to work? _________ This is a chart of all of the gallons of gas bought, g, and the total price, p, of your purchase. g 1 2 3 4 5 6 p 3.25 6.50 9.75 13.00 16.25 19.50 8. Please plot these points on the graph. 9. Is the graph linear? ___________________________ 10. Does the line go through the origin? _____________ 11. What is the rate of change? _______________ 12. What is the real-life meaning of the rate of change of this linear relationship? ______________________________________________ 13. Write an equation to model this situation._________ 14. If you have exactly $65.00 to spend on gas, how many gallons will you be able to buy? _______
Unit 2, Activity 8, Linear Relationships
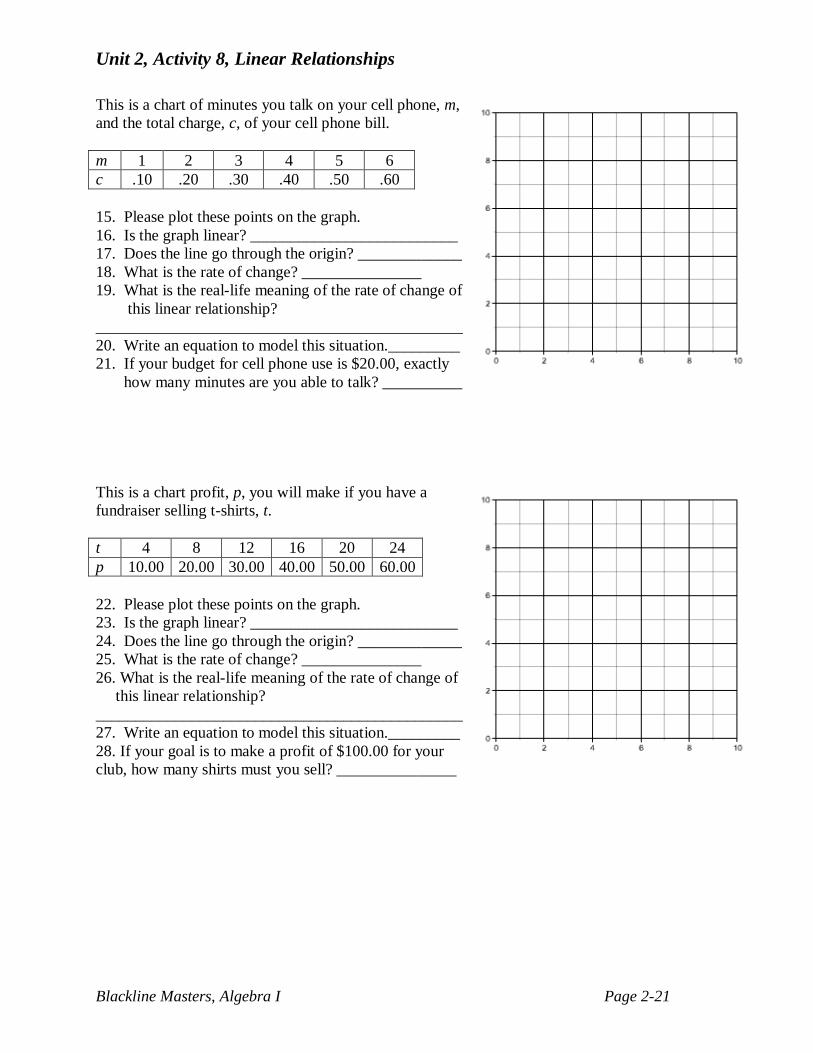
Blackline Masters, Algebra I Page 2-21
This is a chart of minutes you talk on your cell phone, m, and the total charge, c, of your cell phone bill. m 1 2 3 4 5 6 c .10 .20 .30 .40 .50 .60 15. Please plot these points on the graph. 16. Is the graph linear? __________________________ 17. Does the line go through the origin? _____________ 18. What is the rate of change? _______________ 19. What is the real-life meaning of the rate of change of this linear relationship? ______________________________________________ 20. Write an equation to model this situation._________ 21. If your budget for cell phone use is $20.00, exactly how many minutes are you able to talk? __________ This is a chart profit, p, you will make if you have a fundraiser selling t-shirts, t. t 4 8 12 16 20 24 p 10.00 20.00 30.00 40.00 50.00 60.00 22. Please plot these points on the graph. 23. Is the graph linear? __________________________ 24. Does the line go through the origin? _____________ 25. What is the rate of change? _______________ 26. What is the real-life meaning of the rate of change of this linear relationship? ______________________________________________ 27. Write an equation to model this situation._________ 28. If your goal is to make a profit of $100.00 for your club, how many shirts must you sell? _______________
Unit 2, Activity 8, Linear Relationships Keeping It Real with Answers
Blackline Masters, Algebra I Page 2-22
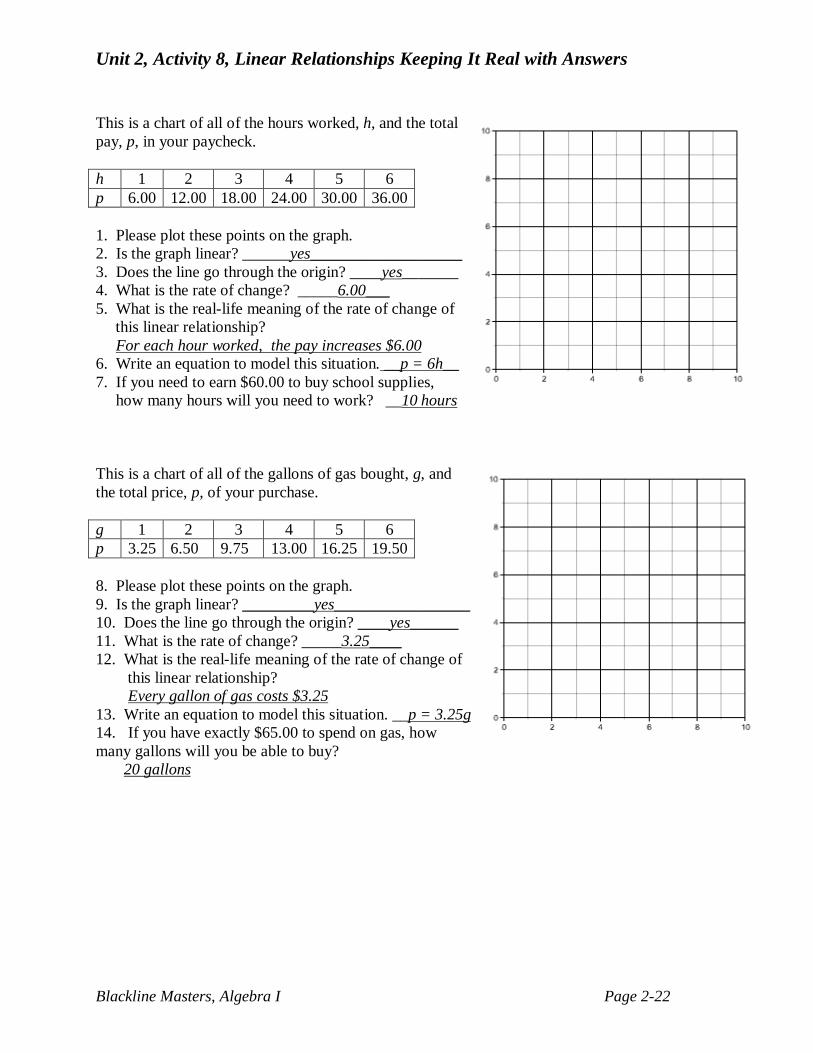
This is a chart of all of the hours worked, h, and the total pay, p, in your paycheck. h 1 2 3 4 5 6 p 6.00 12.00 18.00 24.00 30.00 36.00 1. Please plot these points on the graph. 2. Is the graph linear? ______yes___________________ 3. Does the line go through the origin? ____yes_______ 4. What is the rate of change? _____6.00___ 5. What is the real-life meaning of the rate of change of this linear relationship? For each hour worked, the pay increases $6.00 6. Write an equation to model this situation. __p = 6h__ 7. If you need to earn $60.00 to buy school supplies, how many hours will you need to work? __10 hours This is a chart of all of the gallons of gas bought, g, and the total price, p, of your purchase. g 1 2 3 4 5 6 p 3.25 6.50 9.75 13.00 16.25 19.50 8. Please plot these points on the graph. 9. Is the graph linear? _________yes_________________ 10. Does the line go through the origin? ____yes______ 11. What is the rate of change? _____3.25____ 12. What is the real-life meaning of the rate of change of this linear relationship? Every gallon of gas costs $3.25 13. Write an equation to model this situation. __p = 3.25g 14. If you have exactly $65.00 to spend on gas, how many gallons will you be able to buy? 20 gallons
Unit 2, Activity 8, Linear Relationships Keeping It Real with Answers
Blackline Masters, Algebra I Page 2-23
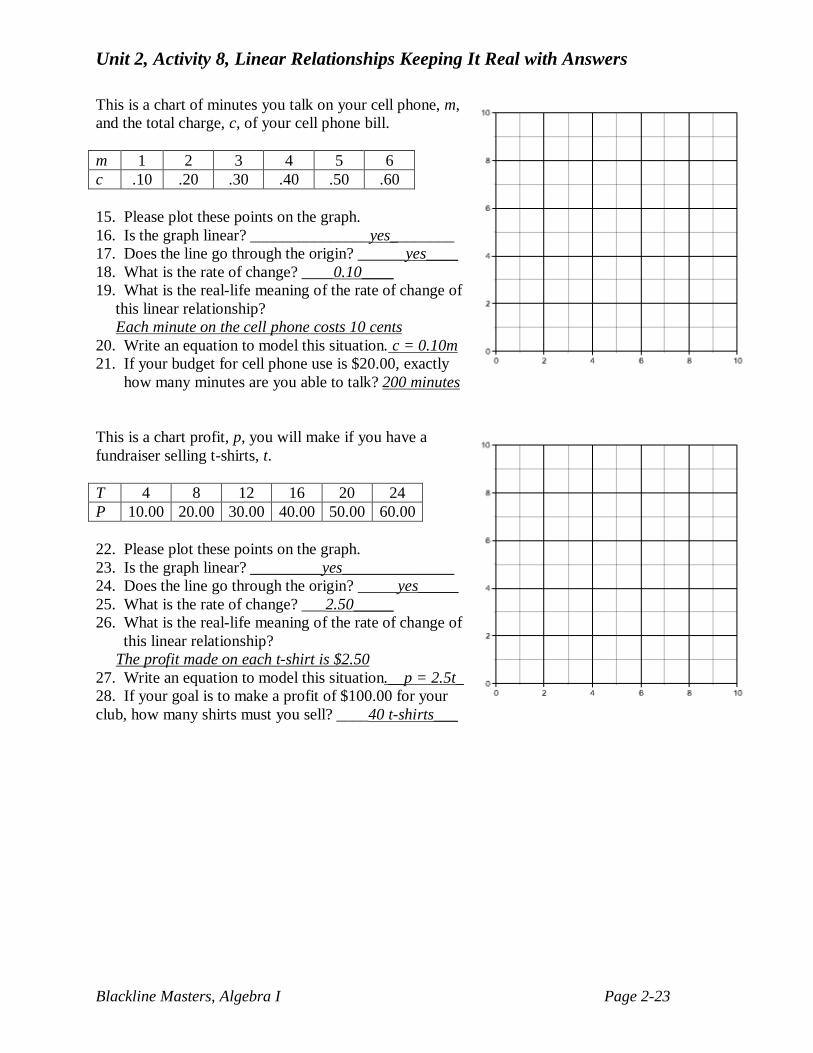
This is a chart of minutes you talk on your cell phone, m, and the total charge, c, of your cell phone bill. m 1 2 3 4 5 6 c .10 .20 .30 .40 .50 .60 15. Please plot these points on the graph. 16. Is the graph linear? _______________yes________ 17. Does the line go through the origin? ______yes____ 18. What is the rate of change? ____0.10____ 19. What is the real-life meaning of the rate of change of this linear relationship? Each minute on the cell phone costs 10 cents 20. Write an equation to model this situation. c = 0.10m 21. If your budget for cell phone use is $20.00, exactly how many minutes are you able to talk? 200 minutes This is a chart profit, p, you will make if you have a fundraiser selling t-shirts, t. T 4 8 12 16 20 24 P 10.00 20.00 30.00 40.00 50.00 60.00 22. Please plot these points on the graph. 23. Is the graph linear? _________yes______________ 24. Does the line go through the origin? _____yes_____ 25. What is the rate of change? ___2.50_____ 26. What is the real-life meaning of the rate of change of this linear relationship? The profit made on each t-shirt is $2.50 27. Write an equation to model this situation.__p = 2.5t_ 28. If your goal is to make a profit of $100.00 for your club, how many shirts must you sell? ____40 t-shirts___
Unit 2, Activity 9, Unit Conversion
Blackline Masters, Algebra I Page 2-24
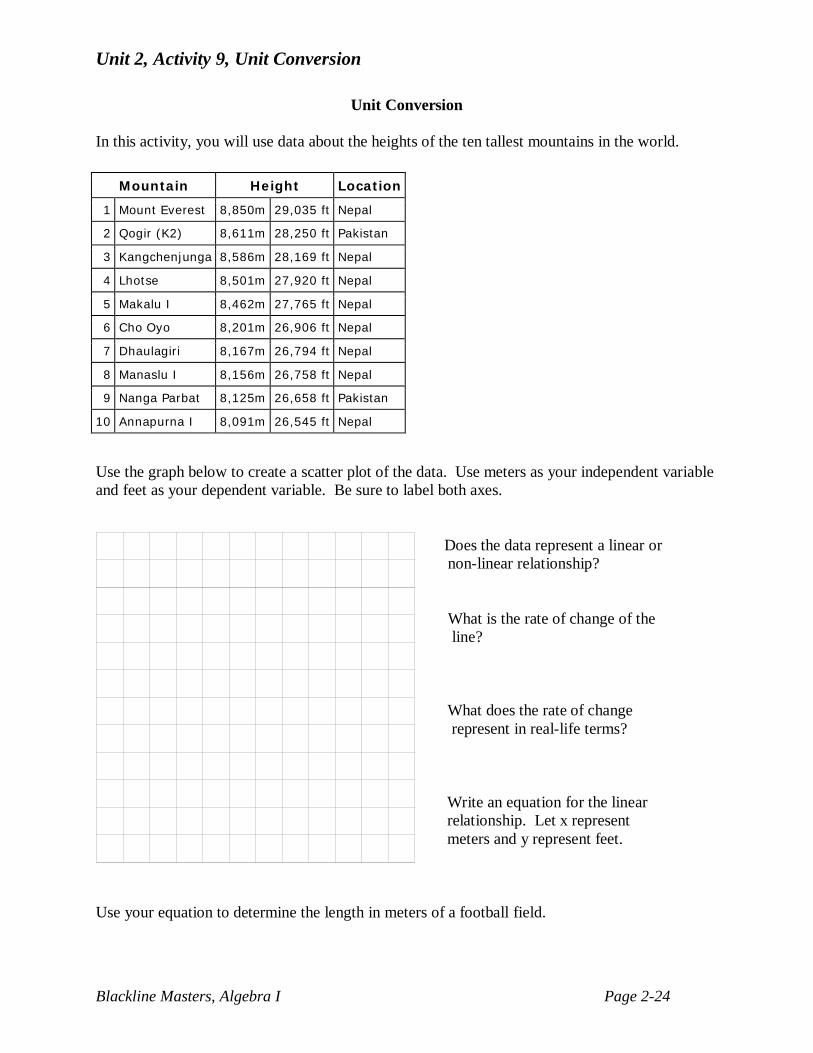
Unit Conversion
In this activity, you will use data about the heights of the ten tallest mountains in the world.
Use the graph below to create a scatter plot of the data. Use meters as your independent variable and feet as your dependent variable. Be sure to label both axes.
Does the data represent a linear or non-linear relationship? What is the rate of change of the line? What does the rate of change represent in real-life terms? Write an equation for the linear relationship. Let x represent meters and y represent feet.
Use your equation to determine the length in meters of a football field.
Mountain Height Location
1 Mount Everest 8,850m 29,035 ft Nepal
2 Qogir (K2) 8,611m 28,250 ft Pakistan
3 Kangchenjunga 8,586m 28,169 ft Nepal
4 Lhotse 8,501m 27,920 ft Nepal
5 Makalu I 8,462m 27,765 ft Nepal
6 Cho Oyo 8,201m 26,906 ft Nepal
7 Dhaulagiri 8,167m 26,794 ft Nepal
8 Manaslu I 8,156m 26,758 ft Nepal
9 Nanga Parbat 8,125m 26,658 ft Pakistan
10 Annapurna I 8,091m 26,545 ft Nepal
Unit 2, Activity 9, Unit Conversion
Blackline Masters, Algebra I Page 2-25
The rate of change is the same as the ________________ of the line. Use what you discovered about the equation for the relationship between meters and feet and write a direct variation equation for the relationship between miles and kilometers. Use your equation to determine how many miles are in 10 kilometers?
Reflect on the following statement:
All unit conversions are linear relationships.
In your math log, write a paragraph explaining why you agree or disagree with the statement. Include examples to justify your position.
Unit 2, Activity 9 Unit Conversion with Answers
Blackline Masters, Algebra I Page 2-26
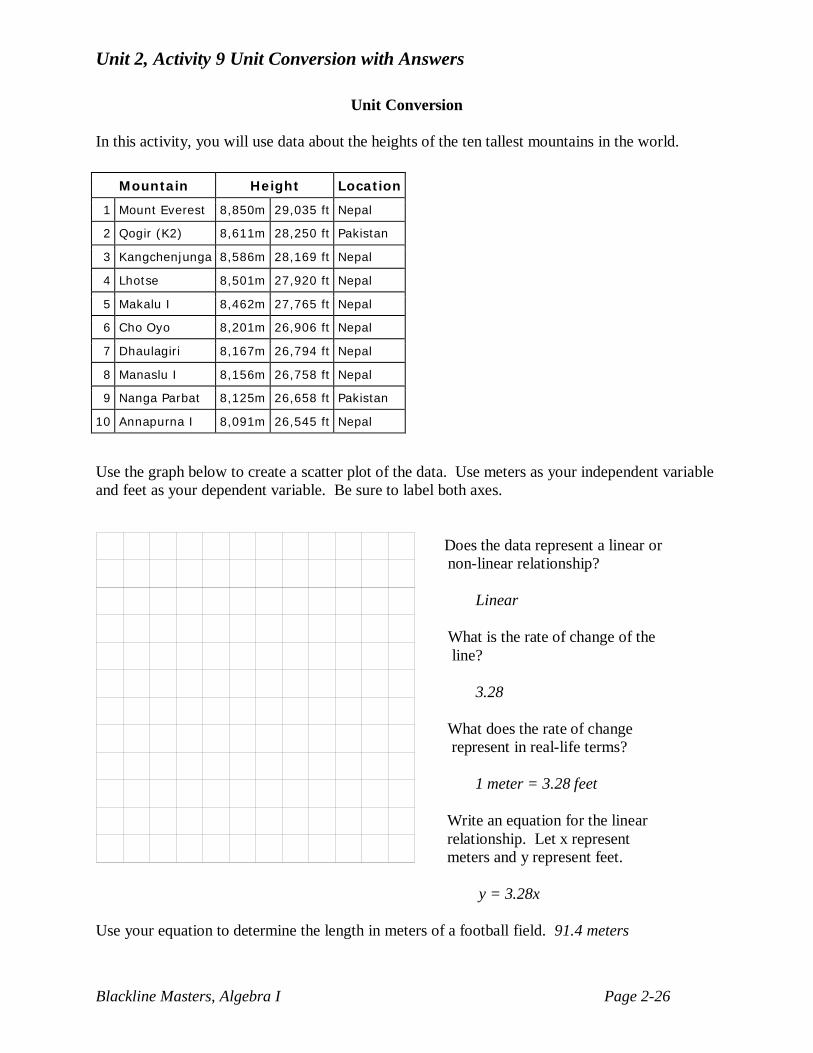
Unit Conversion
In this activity, you will use data about the heights of the ten tallest mountains in the world.
Use the graph below to create a scatter plot of the data. Use meters as your independent variable and feet as your dependent variable. Be sure to label both axes.
Does the data represent a linear or non-linear relationship?
Linear
What is the rate of change of the line? 3.28 What does the rate of change represent in real-life terms? 1 meter = 3.28 feet Write an equation for the linear relationship. Let x represent meters and y represent feet.
y = 3.28x Use your equation to determine the length in meters of a football field. 91.4 meters
Mountain Height Location
1 Mount Everest 8,850m 29,035 ft Nepal
2 Qogir (K2) 8,611m 28,250 ft Pakistan
3 Kangchenjunga 8,586m 28,169 ft Nepal
4 Lhotse 8,501m 27,920 ft Nepal
5 Makalu I 8,462m 27,765 ft Nepal
6 Cho Oyo 8,201m 26,906 ft Nepal
7 Dhaulagiri 8,167m 26,794 ft Nepal
8 Manaslu I 8,156m 26,758 ft Nepal
9 Nanga Parbat 8,125m 26,658 ft Pakistan
10 Annapurna I 8,091m 26,545 ft Nepal
Unit 2, Activity 9 Unit Conversion with Answers
Blackline Masters, Algebra I Page 2-27
The rate of change is the same as the slope_____ of the line. Use what you discovered about the equation for the relationship between meters and feet and write a direct variation equation for the relationship between miles and kilometers. Let y = km and x = miles. y = 1.6x Use your equation to determine how many miles are in 10 kilometers? 6.25 miles
Reflect on the following statement:
All unit conversions are linear relationships.
In your math log, write a paragraph explaining why you agree or disagree with the statement. Include examples to justify your position. All unit conversions are linear relationship. Justifications will vary.
Unit 2, Activity 10, Linear Situations
Blackline Masters, Algebra I Page 2-28
1. Rashaun has an overdue library book, and he is being charged $.25 for each day that it is overdue. Graph the total amount that he owes for his book as each day passes. 2. Jose is driving 65 miles per hour. Graph the distance that he has traveled as each hour passes. 3. Katherine wants to take her friends to a movie but only has a certain amount of money. Each movie ticket costs $6.50. Graph the total amount that she will spend on movie tickets if she takes f friends to a movie. 4. Courtney is renting a car to drive to another state. She is not sure how many days she will need the car. The cost of renting the car is $18 per day. Graph the total cost of renting the car as each day passes. 5. Drew is catering a party for his friends. He needs to buy grapes to use for his fruit tray. A pound of grapes cost $1.25 per pound. Graph the total cost for the grapes. 6. Ralph needs to give medicine to his pet hamster, Julian. The dosage says to administer 3 mgs each hour. Graph the total amount of medicine that Ralph gave to his hamster. 7. Jordan is piloting a hot air balloon that is rising at a rate of 500 feet per hour. Graph the height of the balloon. 8. One mile is the same as 1.6 kilometers. If John travels m miles, how many kilometers has he traveled?
Unit 3, Activity 1, Vocabulary Self-Awareness Chart
Blackline Masters, Algebra 1 Page 3-1
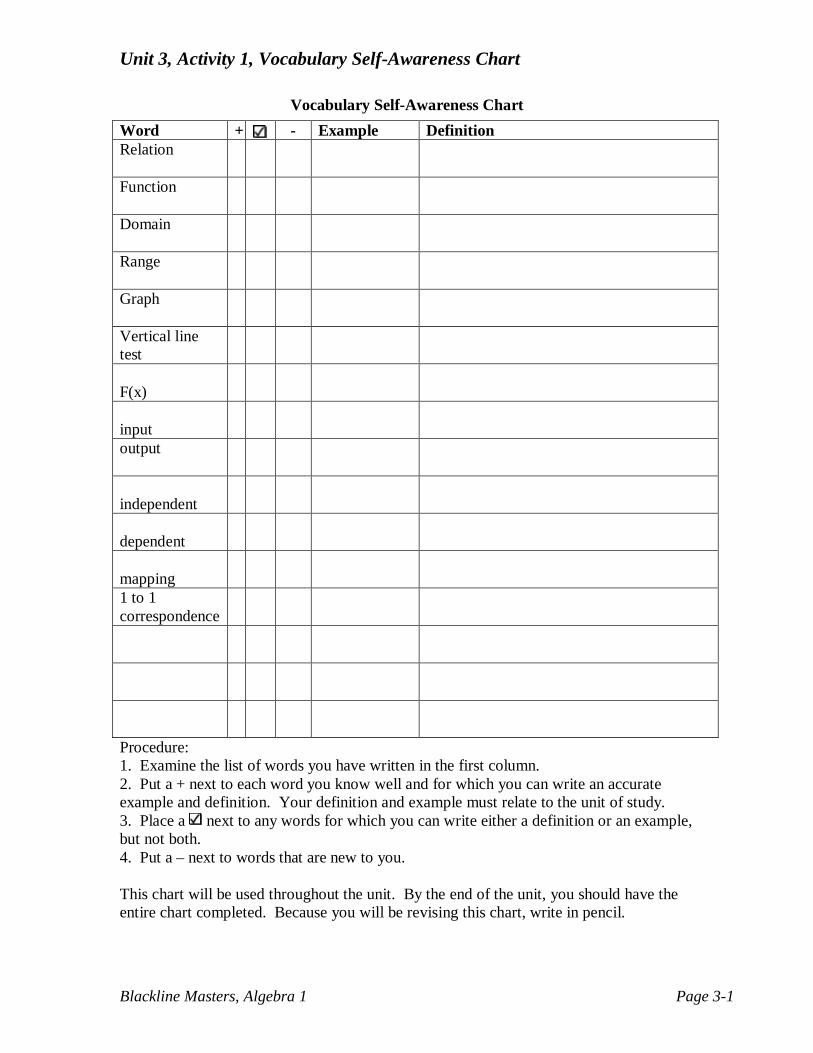
Vocabulary Self-Awareness Chart
Procedure: 1. Examine the list of words you have written in the first column. 2. Put a + next to each word you know well and for which you can write an accurate example and definition. Your definition and example must relate to the unit of study. 3. Place a next to any words for which you can write either a definition or an example, but not both. 4. Put a – next to words that are new to you. This chart will be used throughout the unit. By the end of the unit, you should have the entire chart completed. Because you will be revising this chart, write in pencil.
Word + - Example Definition Relation
Function
Domain
Range
Graph
Vertical line test
F(x)
input
output
independent
dependent
mapping
1 to 1 correspondence
Unit 3, Activity 1, What is a Function?
Blackline Masters, Algebra 1 Page 3-2
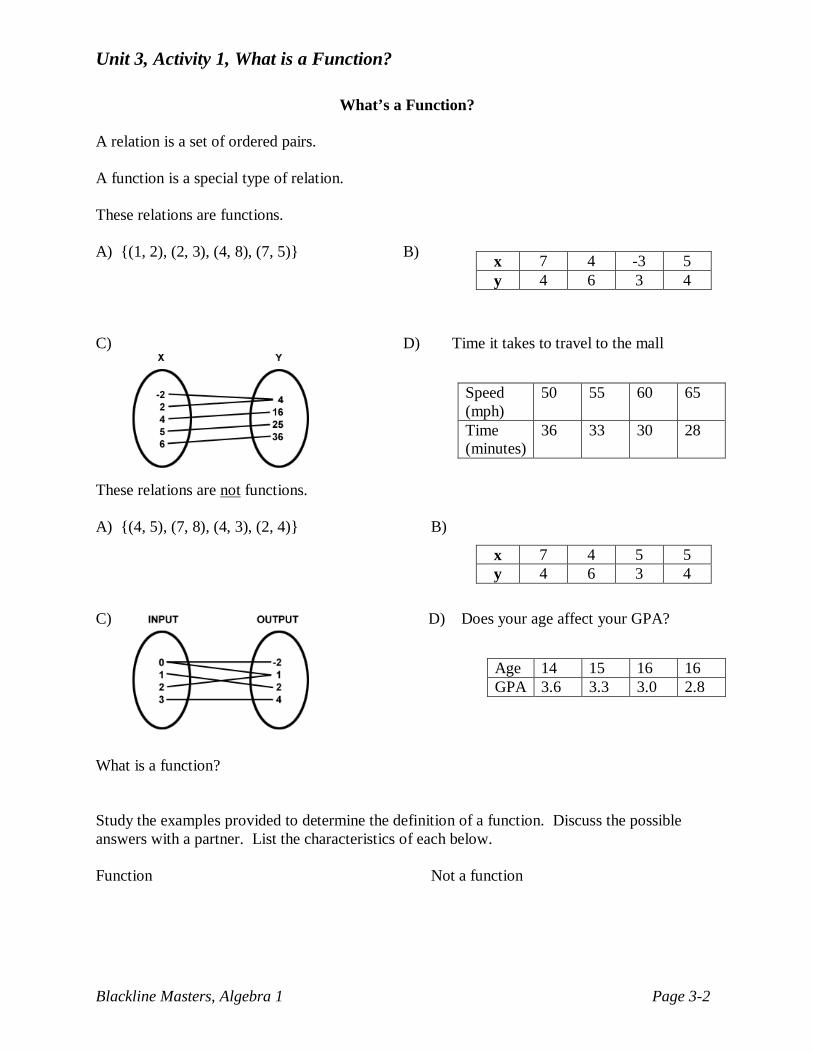
What’s a Function?
A relation is a set of ordered pairs. A function is a special type of relation. These relations are functions. A) {(1, 2), (2, 3), (4, 8), (7, 5)} B) C) D) Time it takes to travel to the mall
These relations are not functions. A) {(4, 5), (7, 8), (4, 3), (2, 4)} B) C) D) Does your age affect your GPA?
What is a function? Study the examples provided to determine the definition of a function. Discuss the possible answers with a partner. List the characteristics of each below. Function Not a function
x 7 4 -3 5 y 4 6 3 4
Speed (mph)
50 55 60 65
Time (minutes)
36 33 30 28
x 7 4 5 5 y 4 6 3 4
Age 14 15 16 16 GPA 3.6 3.3 3.0 2.8
Unit 3, Activity 1, What is a Function?
Blackline Masters, Algebra 1 Page 3-3
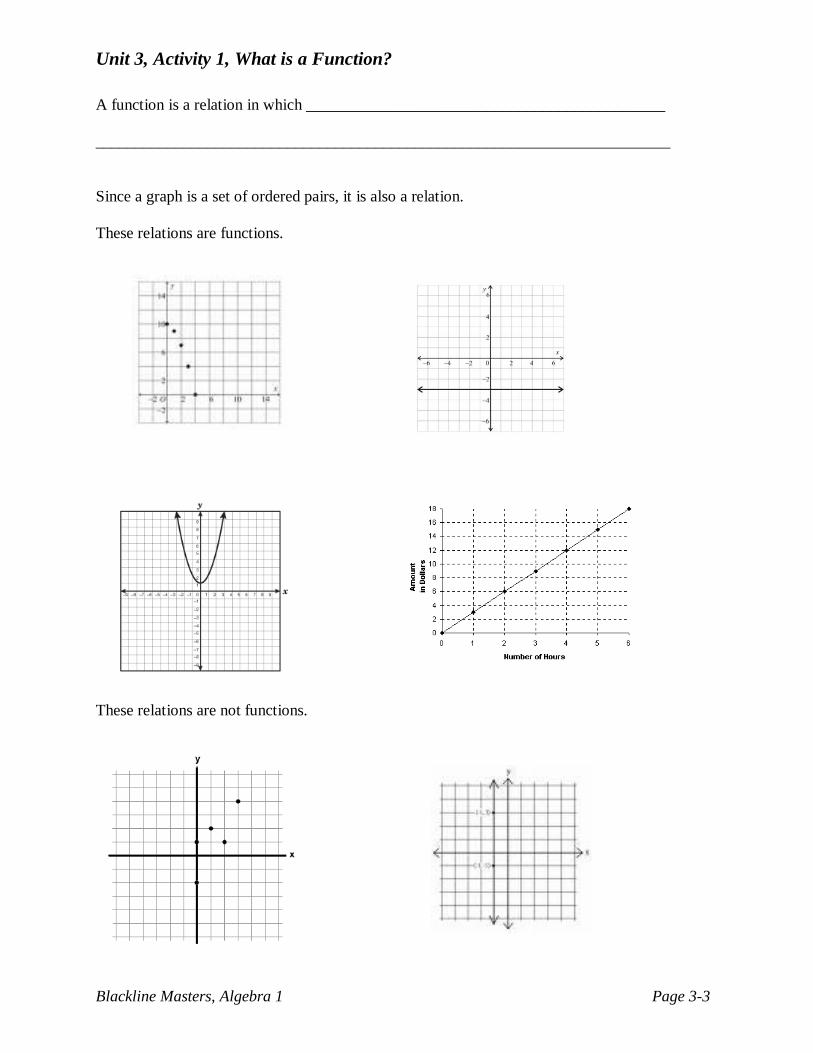
A function is a relation in which _____________________________________________ ________________________________________________________________________ Since a graph is a set of ordered pairs, it is also a relation. These relations are functions.
These relations are not functions.
Unit 3, Activity 1, What is a Function?
Blackline Masters, Algebra 1 Page 3-4
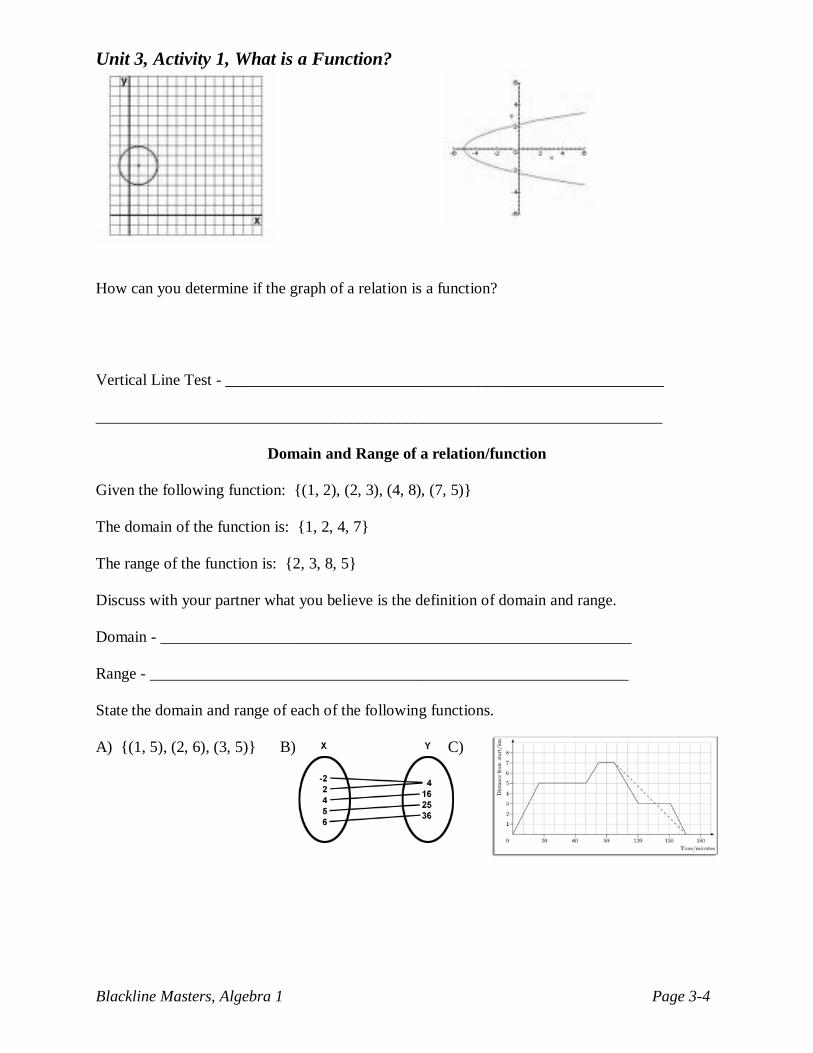
How can you determine if the graph of a relation is a function? Vertical Line Test - _______________________________________________________ _______________________________________________________________________
Domain and Range of a relation/function
Given the following function: {(1, 2), (2, 3), (4, 8), (7, 5)} The domain of the function is: {1, 2, 4, 7} The range of the function is: {2, 3, 8, 5} Discuss with your partner what you believe is the definition of domain and range. Domain - ___________________________________________________________ Range - ____________________________________________________________ State the domain and range of each of the following functions. A) {(1, 5), (2, 6), (3, 5)} B) C)
Unit 3, Activity 1, What is a Function?
Blackline Masters, Algebra 1 Page 3-5
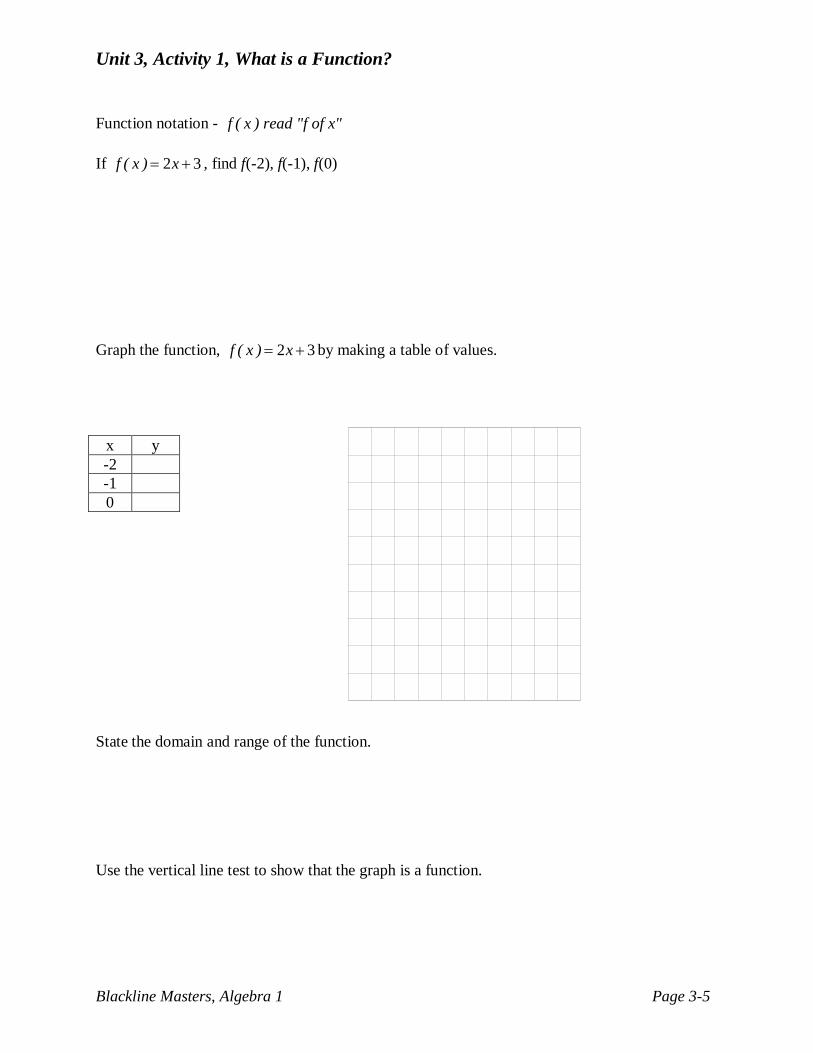
Function notation - f ( x ) read "f of x" If 2 3f ( x ) x= + , find f(-2), f(-1), f(0) Graph the function, 2 3f ( x ) x= + by making a table of values.
x y -2 -1 0
State the domain and range of the function. Use the vertical line test to show that the graph is a function.
Unit 3, Activity 1, What is a Function? With Answers
Blackline Masters, Algebra 1 Page 3-6
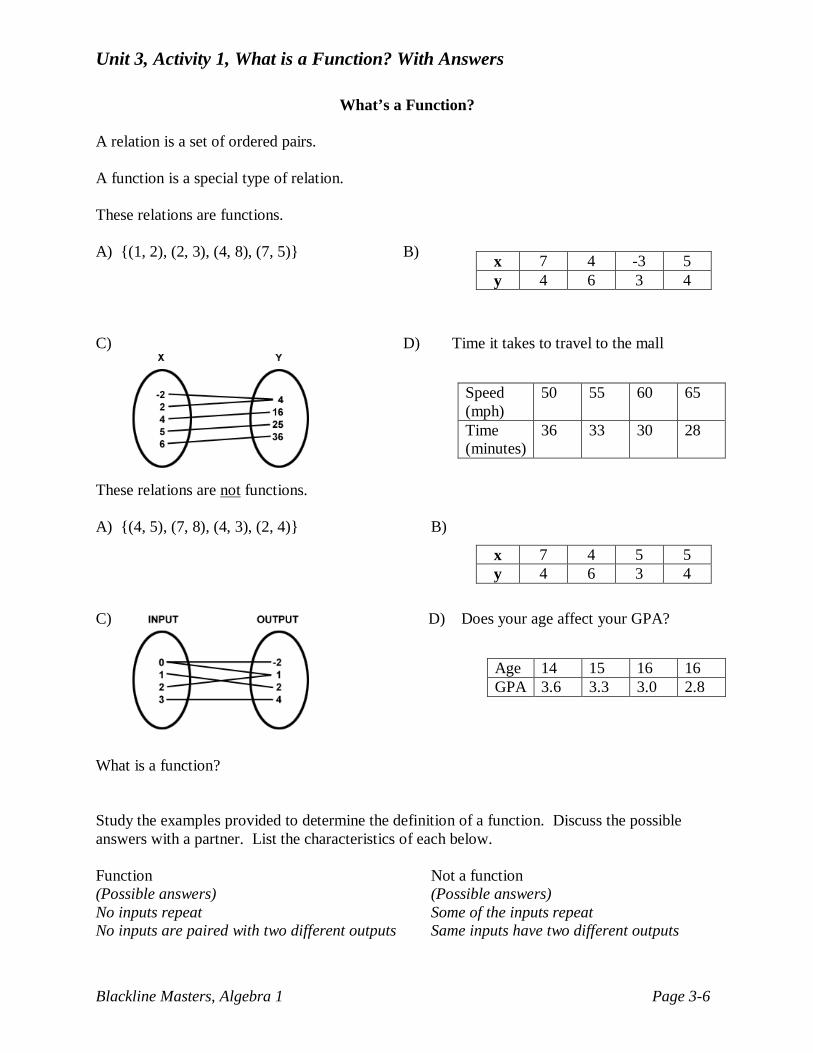
What’s a Function?
A relation is a set of ordered pairs. A function is a special type of relation. These relations are functions. A) {(1, 2), (2, 3), (4, 8), (7, 5)} B) C) D) Time it takes to travel to the mall
These relations are not functions. A) {(4, 5), (7, 8), (4, 3), (2, 4)} B) C) D) Does your age affect your GPA?
What is a function? Study the examples provided to determine the definition of a function. Discuss the possible answers with a partner. List the characteristics of each below. Function Not a function (Possible answers) (Possible answers) No inputs repeat Some of the inputs repeat No inputs are paired with two different outputs Same inputs have two different outputs
x 7 4 -3 5 y 4 6 3 4
Speed (mph)
50 55 60 65
Time (minutes)
36 33 30 28
x 7 4 5 5 y 4 6 3 4
Age 14 15 16 16 GPA 3.6 3.3 3.0 2.8

Unit 3, Activity 1, What is a Function? With Answers
Blackline Masters, Algebra 1 Page 3-7
A function is a relation in which every input has exactly one output ________________________________________________________________________ Since a graph is a set of ordered pairs, it is also a relation. These relations are functions.
These relations are not functions.
Unit 3, Activity 1, What is a Function? With Answers
Blackline Masters, Algebra 1 Page 3-8
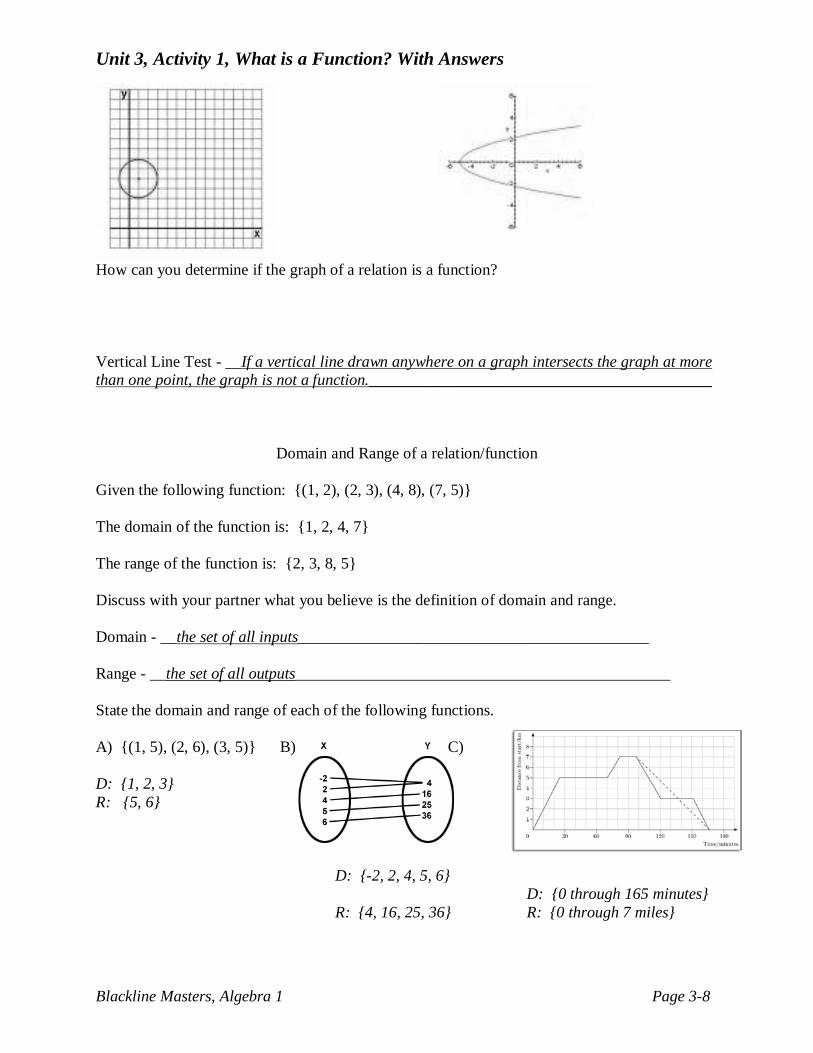
How can you determine if the graph of a relation is a function? Vertical Line Test - __If a vertical line drawn anywhere on a graph intersects the graph at more than one point, the graph is not a function.___________________________________________
Domain and Range of a relation/function
Given the following function: {(1, 2), (2, 3), (4, 8), (7, 5)} The domain of the function is: {1, 2, 4, 7} The range of the function is: {2, 3, 8, 5} Discuss with your partner what you believe is the definition of domain and range. Domain - __the set of all inputs____________________________________________ Range - __the set of all outputs_______________________________________________ State the domain and range of each of the following functions. A) {(1, 5), (2, 6), (3, 5)} B) C) D: {1, 2, 3} R: {5, 6} D: {-2, 2, 4, 5, 6} D: {0 through 165 minutes} R: {4, 16, 25, 36} R: {0 through 7 miles}
Unit 3, Activity 1, What is a Function? With Answers
Blackline Masters, Algebra 1 Page 3-9
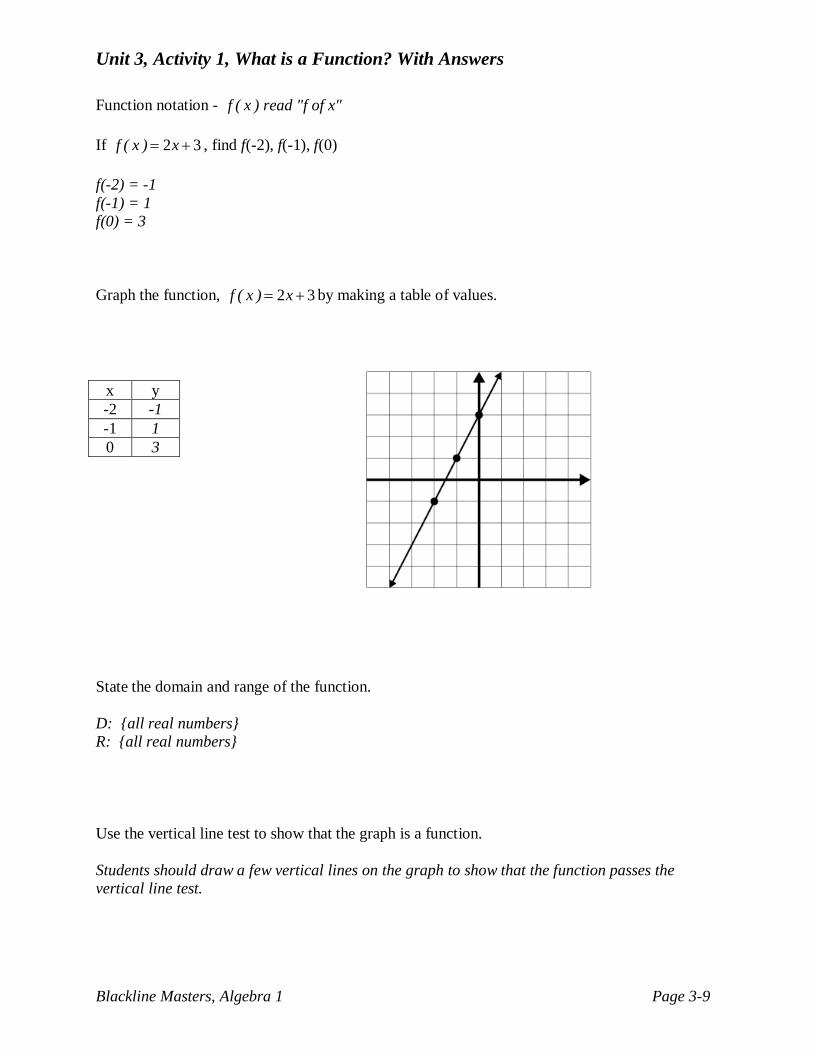
Function notation - f ( x ) read "f of x" If 2 3f ( x ) x= + , find f(-2), f(-1), f(0) f(-2) = -1 f(-1) = 1 f(0) = 3 Graph the function, 2 3f ( x ) x= + by making a table of values.
x y -2 -1 -1 1 0 3
State the domain and range of the function. D: {all real numbers} R: {all real numbers} Use the vertical line test to show that the graph is a function. Students should draw a few vertical lines on the graph to show that the function passes the vertical line test.

Unit 3, Activity 2, Identify
Blackline Masters, Algebra 1 Page 3-10
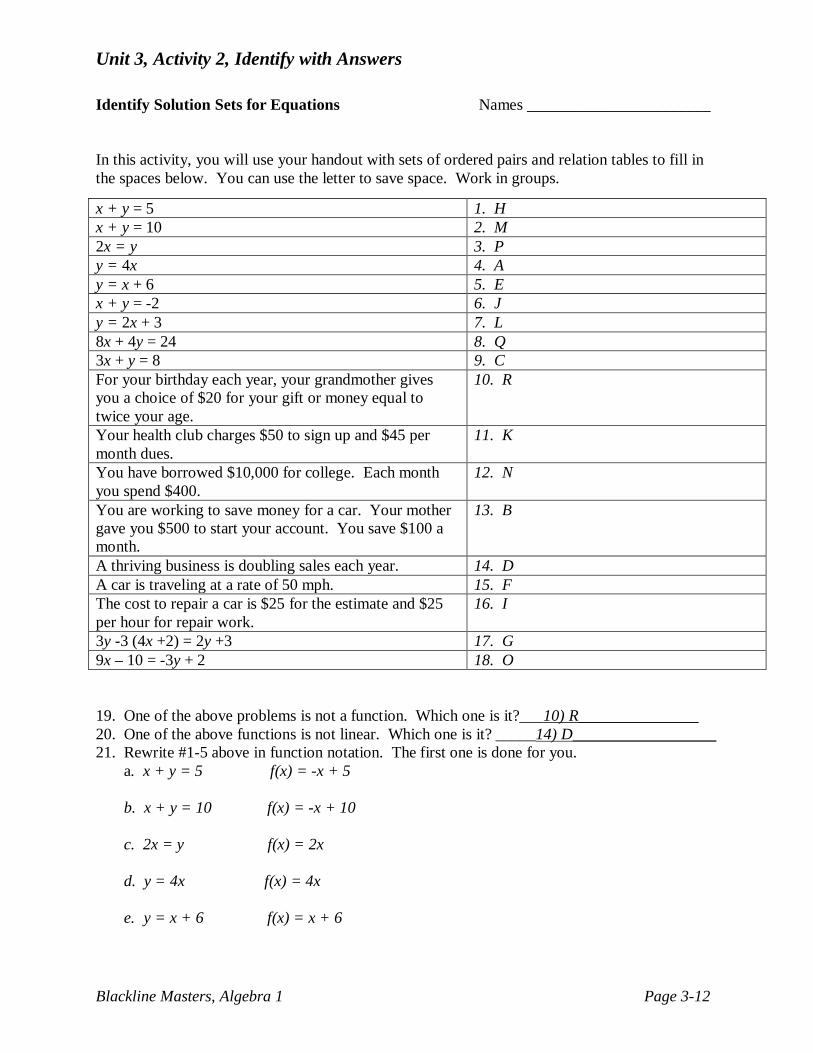
Identify Solution Sets for Equations Names _______________________ In this activity, you will use your handout with sets of ordered pairs and relation tables to fill in the spaces below. You can use the letter to save space. Work in groups.
19. One of the above problems is not a function. Which one is it? ________________________ 20. One of the above functions is not linear. Which one is it? ___________________________ 21. Rewrite #1-5 above in function notation. The first one is done for you. a. x + y = 5 f(x) = -x + 5 b. c. d. e.
x + y = 5 1. x + y = 10 2. 2x = y 3. y = 4x 4. y = x + 6 5. x + y = -2 6. y = 2x + 3 7. 8x + 4y = 24 8. 3x + y = 8 9. For your birthday each year, your grandmother gives you a choice of $20 for your gift or money equal to twice your age.
10.
Your health club charges $50 to sign up and $45 per month dues.
11.
You have borrowed $10,000 for college. Each month you spend $400.
12.
You are working to save money for a car. Your mother gave you $500 to start your account. You save $100 a month.
13.
A thriving business is doubling sales each year. 14. A car is traveling at a rate of 50 mph. 15. The cost to repair a car is $25 for the estimate and $25 per hour for repair work.
16.
3y -3 (4x +2) = 2y +3 17. 9x – 10 = -3y + 2 18.

Unit 3, Activity 2, Identify
Blackline Masters, Algebra 1 Page 3-11
Ordered Pairs and Relation Tables A. B. C. D. E. F. G. H. I. J. K. L. M. N. O. P. Q. R.
(-2,-8) , (-1,-4) , (0,0) , (1,4) , (2,8) (0, 500), (1, 600), (2, 700), (3, 800), (4, 900) (-2,14) , (-1,11) , (0,8) , (1,5) , (2,2) (1 , 10000) , (2 , 20000) , (3 , 40000) , (4 , 80000) (-2,4) , (-1,5) , (0,6) , (1,7) , (2,8) (1,50) , (2,100) , (3,150) , (4,200) , (5,250) (-2,-15) , (-1,-3) , (0,9) , (1,21) , (2,33) (-2,7) , (-1,6) , (0,5) , (1,4) , (2,3) (0,25) , (1,50) , (2,75) , (3,100) , (4,125)
Input -2 -1 0 1 2 3 output -4 -2 0 2 4 6
Input 0 1 2 3 4 5 Output 6 4 2 0 -2 -4
Input 9 9 10 11 11 12 Output 20 18 20 20 22 20
input output 0 50 1 95 2 140 3 185 4 230 input output -2 12 -1 11 0 10 1 9 2 8 input output -2 10 -1 7 0 4 1 1 2 -2
input output -2 0 -1 -1 0 -2 1 -3 2 -4 input output 1 5 2 7 3 9 4 11 5 13 input output 1 9600 2 9200 3 8800 4 8400 5 8000
Unit 3, Activity 2, Identify with Answers
Blackline Masters, Algebra 1 Page 3-12
Identify Solution Sets for Equations Names _______________________ In this activity, you will use your handout with sets of ordered pairs and relation tables to fill in the spaces below. You can use the letter to save space. Work in groups.
19. One of the above problems is not a function. Which one is it?___10) R_______________ 20. One of the above functions is not linear. Which one is it? _____14) D__________________ 21. Rewrite #1-5 above in function notation. The first one is done for you. a. x + y = 5 f(x) = -x + 5 b. x + y = 10 f(x) = -x + 10 c. 2x = y f(x) = 2x d. y = 4x f(x) = 4x e. y = x + 6 f(x) = x + 6
x + y = 5 1. H x + y = 10 2. M 2x = y 3. P y = 4x 4. A y = x + 6 5. E x + y = -2 6. J y = 2x + 3 7. L 8x + 4y = 24 8. Q 3x + y = 8 9. C For your birthday each year, your grandmother gives you a choice of $20 for your gift or money equal to twice your age.
10. R
Your health club charges $50 to sign up and $45 per month dues.
11. K
You have borrowed $10,000 for college. Each month you spend $400.
12. N
You are working to save money for a car. Your mother gave you $500 to start your account. You save $100 a month.
13. B
A thriving business is doubling sales each year. 14. D A car is traveling at a rate of 50 mph. 15. F The cost to repair a car is $25 for the estimate and $25 per hour for repair work.
16. I
3y -3 (4x +2) = 2y +3 17. G 9x – 10 = -3y + 2 18. O
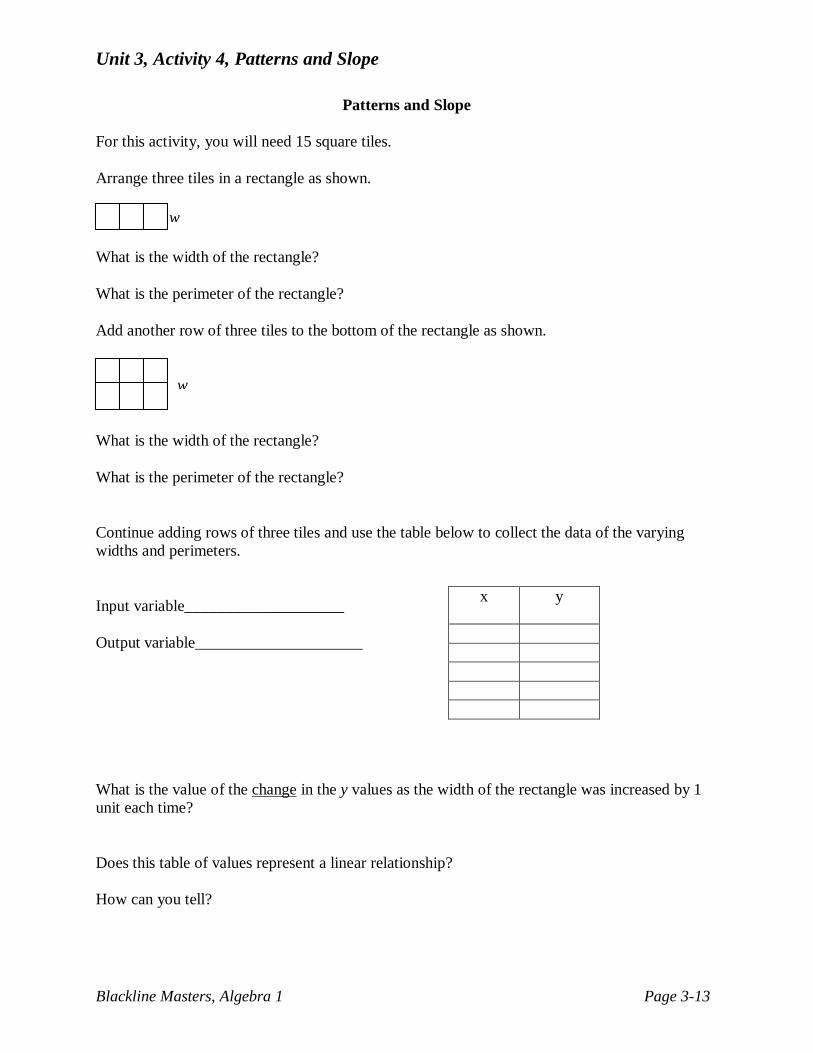
Unit 3, Activity 4, Patterns and Slope
Blackline Masters, Algebra 1 Page 3-13
Patterns and Slope
For this activity, you will need 15 square tiles. Arrange three tiles in a rectangle as shown.
What is the width of the rectangle? What is the perimeter of the rectangle? Add another row of three tiles to the bottom of the rectangle as shown.
What is the width of the rectangle? What is the perimeter of the rectangle? Continue adding rows of three tiles and use the table below to collect the data of the varying widths and perimeters. Input variable____________________ Output variable_____________________ What is the value of the change in the y values as the width of the rectangle was increased by 1 unit each time? Does this table of values represent a linear relationship? How can you tell?
x
y
w
w
Unit 3, Activity 4, Patterns and Slope
Blackline Masters, Algebra 1 Page 3-14
Graph the data on graph paper. Remember to title your graph, label both axes, and mark and label your intervals appropriately. Does the graph represent a linear relationship? How can you tell? How is the change in y values shown on the graph? How is the change in x values shown on the graph? When you were originally collecting your data with the rectangles, each time there was a value which stayed constant when you determined your perimeter. What is the constant value? Then, to that constant value each time you added one more unit to the width, the perimeter changed by______________________. This is called the rate of change or slope of the linear relationship.
RATE OF CHANGE/SLOPE = change in y(dependent variable)change in x(independent variable)
Write an equation to model the relationship between width (x) and perimeter (y). Circle the rate of change/slope in the equation. Explain and demonstrate how to find the rate of change of a linear relationship using a table, a graph, and a linear equation. Use another example of a linear relationship in your explanation.
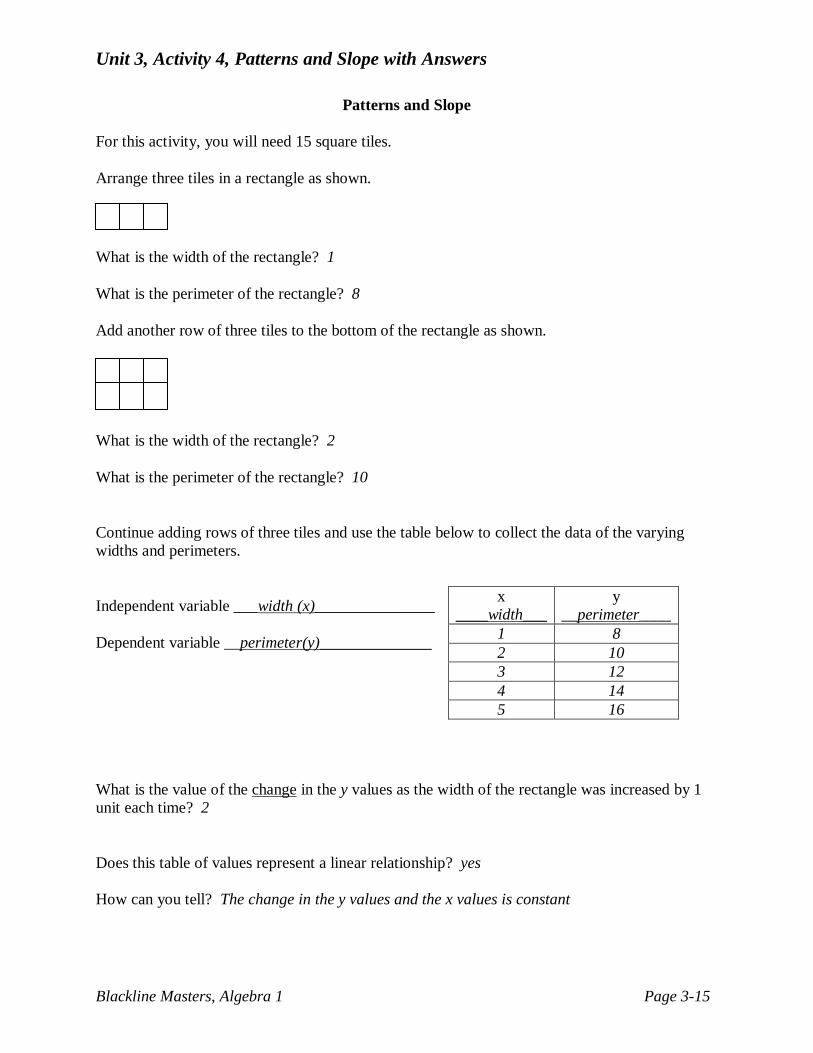
Unit 3, Activity 4, Patterns and Slope with Answers
Blackline Masters, Algebra 1 Page 3-15
Patterns and Slope
For this activity, you will need 15 square tiles. Arrange three tiles in a rectangle as shown.
What is the width of the rectangle? 1 What is the perimeter of the rectangle? 8 Add another row of three tiles to the bottom of the rectangle as shown.
What is the width of the rectangle? 2 What is the perimeter of the rectangle? 10 Continue adding rows of three tiles and use the table below to collect the data of the varying widths and perimeters. Independent variable ___width (x)_______________ Dependent variable __perimeter(y)______________ What is the value of the change in the y values as the width of the rectangle was increased by 1 unit each time? 2 Does this table of values represent a linear relationship? yes How can you tell? The change in the y values and the x values is constant
x ____width___
y __perimeter____
1 8 2 10 3 12 4 14 5 16

Unit 3, Activity 4, Patterns and Slope with Answers
Blackline Masters, Algebra 1 Page 3-16
Graph the data on graph paper. Remember to title your graph, label both axes, and mark and label your intervals appropriately. Does the graph represent a linear relationship? yes How can you tell? It makes a line How is the change in y values shown on the graph? The vertical rise How is the change in x values shown on the graph? The horizontal run When you were originally collecting your data with the rectangles, each time there was a value which stayed constant when you determined your perimeter. What is the constant value? 6 (the length of the rectangle times two because of the top and bottom of the rectangle) Then, to that constant value each time you added one more unit to the width, the perimeter changed by____2__________________. This is called the rate of change or slope of the linear relationship.
RATE OF CHANGE/SLOPE = change in y(dependent variable)change in x(independent variable)
Write an equation to model the relationship between width (x) and perimeter (y). y = 6 + 2x Circle the rate of change/slope in the equation. Explain and demonstrate how to find the rate of change of a linear relationship using a table, a graph, and a linear equation. Use another example of a linear relationship in your explanation.
Unit 3, Activity 6, Rate of Change
Blackline Masters, Algebra 1 Page 3-17
1. David owns a farm market. The amount a customer pays for sweet corn depends on the number of ears that are purchased. David sells a dozen ears of corn for $3.00. Complete the following:
a. Make a table reflecting prices for purchases of 6, 12, 18, and 24 ears of corn. b. Write and graph 4 ordered pairs that represent the number of ears of corn and the price of
the purchase. c. Write an explanation of how the table was developed, how the ordered pairs were
determined, and how the graph was constructed. d. Draw a line through the points on the graph. e. Find the slope of the line. f. Explain the real-life meaning for the slope. g. Determine the equation of the line by examining the graph for the slope and the y-
intercept. h. Explain which values for x and y are logical solutions to the linear equation.
2. You are saving money to buy a plasma television. You will be able to save $30.00 per week from your part-time job. Complete the following:
a. Make a table reflecting savings for 4 weeks, 8 weeks, 12 weeks, and 16 weeks. b. Write and graph 4 ordered pairs that represent the weeks and the amount of money saved
at each interval. c. Write an explanation of how the table was developed, how the ordered pairs were
determined, and how the graph was constructed. d. Draw a line through the points on the graph. e. Find the slope of the line. f. Explain the real-life meaning for the slope. g. What is the y- intercept of the graph? What is its meaning? h. Determine the equation of the line by examining the graph for the slope and the y-
intercept. i. How much have you saved after 18 weeks? j. How would the situation change if your Grandmother gives you $300 to begin your
savings program? k. How would the graph change and how would the y-intercept change? l. What would be the equation of the line? m. How much do you have saved after 18 weeks? n. Explain what types of numbers (x, y) are appropriate solutions to the linear equations
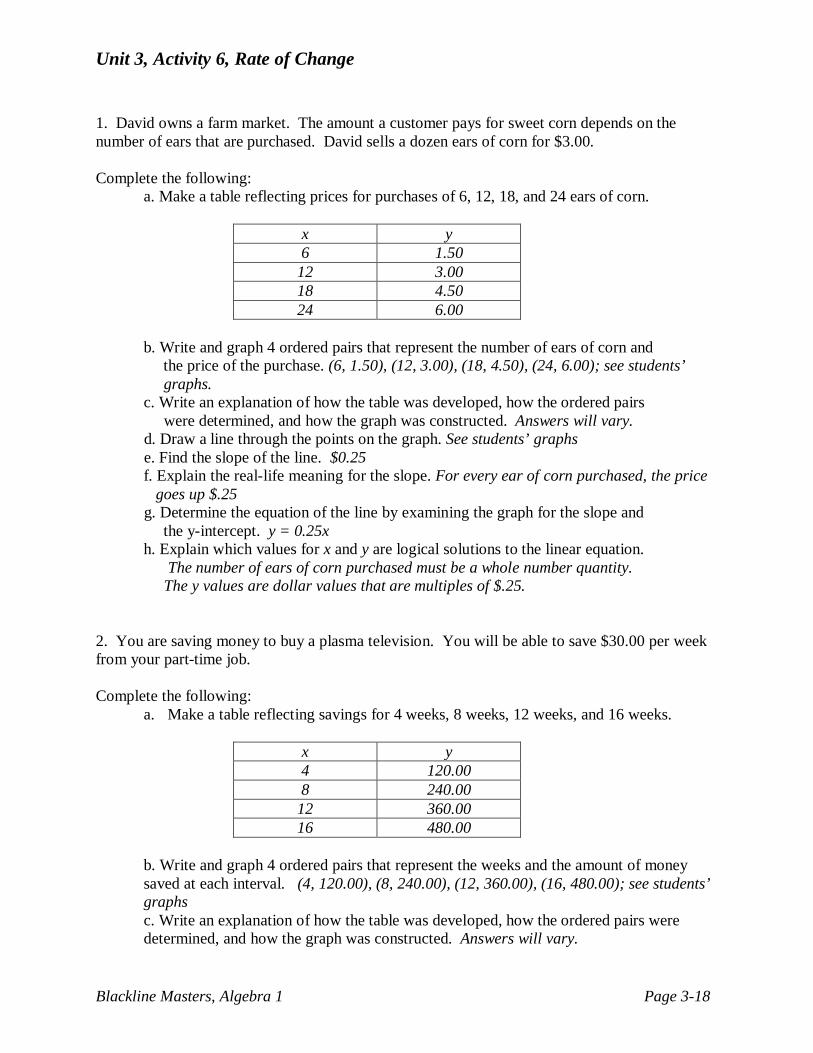
Unit 3, Activity 6, Rate of Change
Blackline Masters, Algebra 1 Page 3-18
1. David owns a farm market. The amount a customer pays for sweet corn depends on the number of ears that are purchased. David sells a dozen ears of corn for $3.00. Complete the following: a. Make a table reflecting prices for purchases of 6, 12, 18, and 24 ears of corn.
x y 6 1.50
12 3.00 18 4.50 24 6.00
b. Write and graph 4 ordered pairs that represent the number of ears of corn and the price of the purchase. (6, 1.50), (12, 3.00), (18, 4.50), (24, 6.00); see students’ graphs. c. Write an explanation of how the table was developed, how the ordered pairs
were determined, and how the graph was constructed. Answers will vary. d. Draw a line through the points on the graph. See students’ graphs e. Find the slope of the line. $0.25 f. Explain the real-life meaning for the slope. For every ear of corn purchased, the price goes up $.25 g. Determine the equation of the line by examining the graph for the slope and the y-intercept. y = 0.25x h. Explain which values for x and y are logical solutions to the linear equation. The number of ears of corn purchased must be a whole number quantity. The y values are dollar values that are multiples of $.25. 2. You are saving money to buy a plasma television. You will be able to save $30.00 per week from your part-time job. Complete the following:
a. Make a table reflecting savings for 4 weeks, 8 weeks, 12 weeks, and 16 weeks.
x y 4 120.00 8 240.00
12 360.00 16 480.00
b. Write and graph 4 ordered pairs that represent the weeks and the amount of money
saved at each interval. (4, 120.00), (8, 240.00), (12, 360.00), (16, 480.00); see students’ graphs
c. Write an explanation of how the table was developed, how the ordered pairs were determined, and how the graph was constructed. Answers will vary.
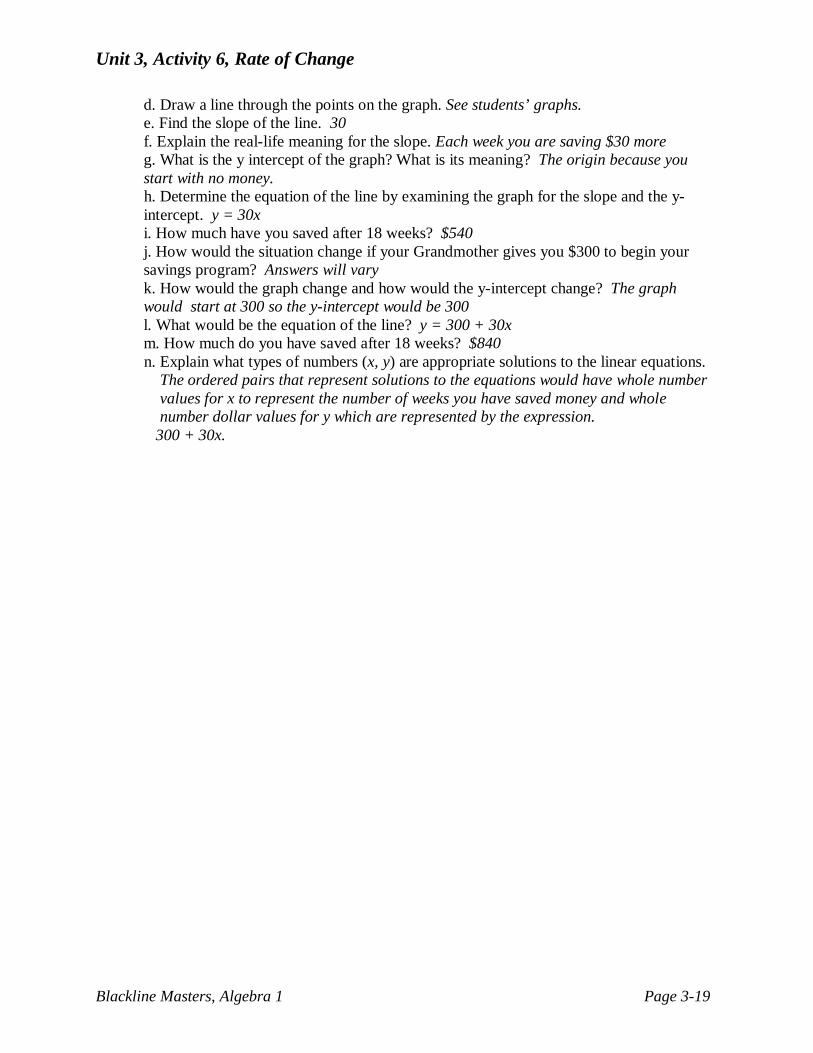
Unit 3, Activity 6, Rate of Change
Blackline Masters, Algebra 1 Page 3-19
d. Draw a line through the points on the graph. See students’ graphs. e. Find the slope of the line. 30 f. Explain the real-life meaning for the slope. Each week you are saving $30 more
g. What is the y intercept of the graph? What is its meaning? The origin because you start with no money.
h. Determine the equation of the line by examining the graph for the slope and the y-intercept. y = 30x
i. How much have you saved after 18 weeks? $540 j. How would the situation change if your Grandmother gives you $300 to begin your
savings program? Answers will vary k. How would the graph change and how would the y-intercept change? The graph
would start at 300 so the y-intercept would be 300 l. What would be the equation of the line? y = 300 + 30x m. How much do you have saved after 18 weeks? $840 n. Explain what types of numbers (x, y) are appropriate solutions to the linear equations. The ordered pairs that represent solutions to the equations would have whole number values for x to represent the number of weeks you have saved money and whole number dollar values for y which are represented by the expression. 300 + 30x.
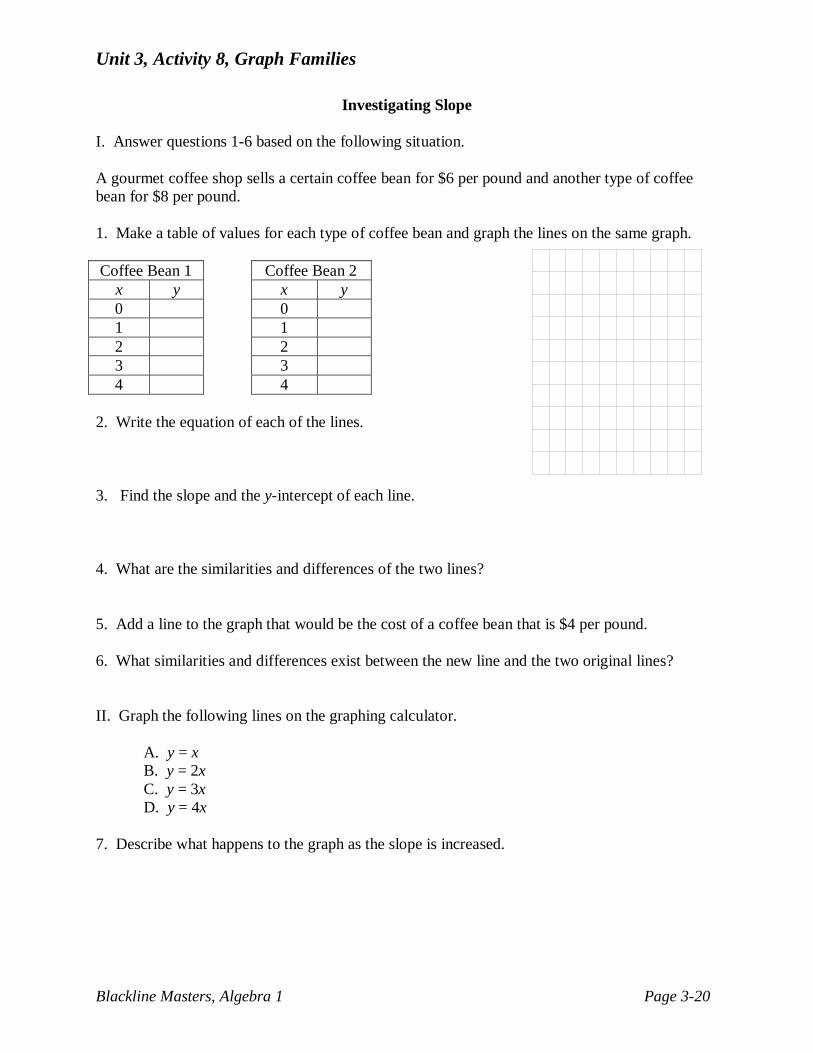
Unit 3, Activity 8, Graph Families
Blackline Masters, Algebra 1 Page 3-20
Investigating Slope I. Answer questions 1-6 based on the following situation. A gourmet coffee shop sells a certain coffee bean for $6 per pound and another type of coffee bean for $8 per pound. 1. Make a table of values for each type of coffee bean and graph the lines on the same graph. Coffee Bean 1 Coffee Bean 2
x y x y 0 0 1 1 2 2 3 3 4 4
2. Write the equation of each of the lines. 3. Find the slope and the y-intercept of each line. 4. What are the similarities and differences of the two lines? 5. Add a line to the graph that would be the cost of a coffee bean that is $4 per pound. 6. What similarities and differences exist between the new line and the two original lines? II. Graph the following lines on the graphing calculator.
A. y = x B. y = 2x C. y = 3x D. y = 4x
7. Describe what happens to the graph as the slope is increased.
Unit 3, Activity 8, Graph Families
Blackline Masters, Algebra 1 Page 3-21
III. Graph the following functions on the graphing calculator:
A. y = x + 5 B. y = 12
x + 5 C. y = x + 5 D. y = 13
x + 5
8. Describe what happens to the graph as the slope is decreased (but still a positive value). IV. Graph the following functions on the graphing calculator:
A. y = x - 2 B. y = -x - 2 C. y = -3x - 2
D. y = 12
−
x - 2
9. Describe what happens when the slope is a negative number. 10. Does the equation y = -2x have a positive or negative slope? Without graphing, does this line tilt to the right or to the left? Explain your answer. V. Graph the following functions on the graphing calculator
A. y = 5 B. y = -2 C. y = 1
11. Describe the lines that are graphed. 12. What is the slope of each line? 13. Write an equation of each line in slope-intercept form. V. Graph the following by hand.
A. x = 6 B. x = 3 C. x = -5
14. Describe the lines that are graphed. 15. What is the slope of each line? 16. What are the differences between the two equations y = 2 and x = 2?
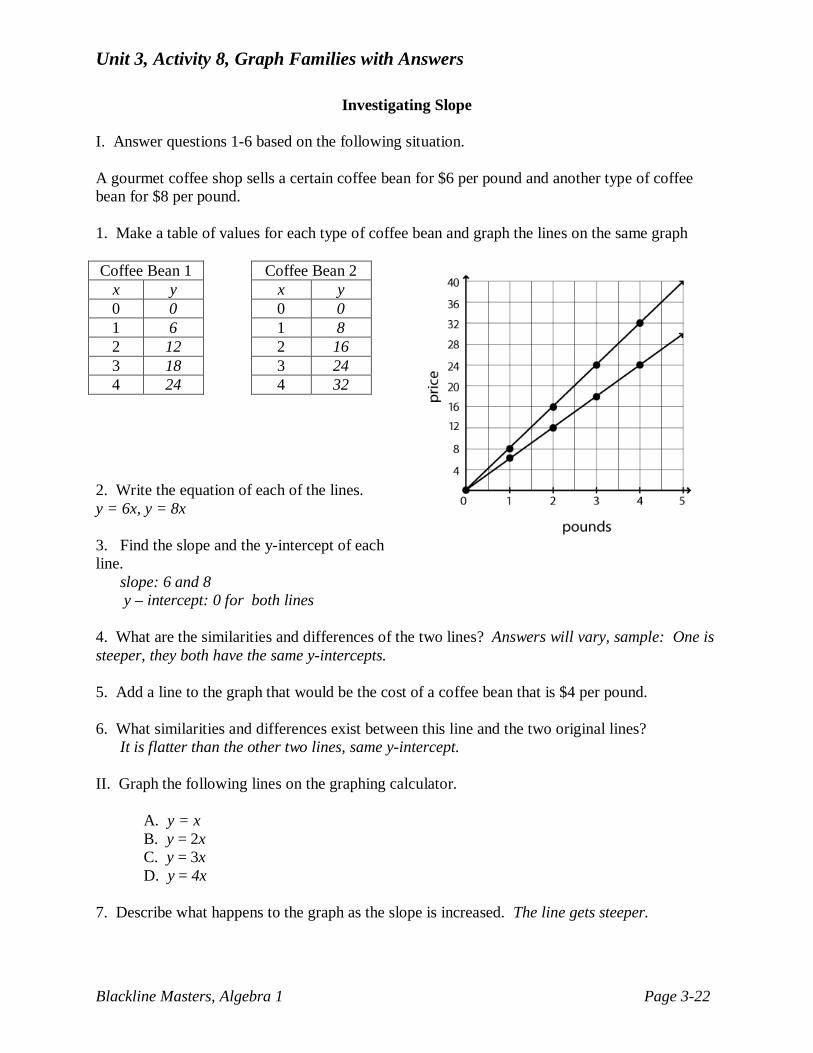
Unit 3, Activity 8, Graph Families with Answers
Blackline Masters, Algebra 1 Page 3-22
Investigating Slope I. Answer questions 1-6 based on the following situation. A gourmet coffee shop sells a certain coffee bean for $6 per pound and another type of coffee bean for $8 per pound. 1. Make a table of values for each type of coffee bean and graph the lines on the same graph
2. Write the equation of each of the lines. y = 6x, y = 8x 3. Find the slope and the y-intercept of each line. slope: 6 and 8 y – intercept: 0 for both lines 4. What are the similarities and differences of the two lines? Answers will vary, sample: One is steeper, they both have the same y-intercepts. 5. Add a line to the graph that would be the cost of a coffee bean that is $4 per pound. 6. What similarities and differences exist between this line and the two original lines? It is flatter than the other two lines, same y-intercept. II. Graph the following lines on the graphing calculator.
A. y = x B. y = 2x C. y = 3x D. y = 4x
7. Describe what happens to the graph as the slope is increased. The line gets steeper.
Coffee Bean 1 Coffee Bean 2 x y x y 0 0 0 0 1 6 1 8 2 12 2 16 3 18 3 24 4 24 4 32
Unit 3, Activity 8, Graph Families with Answers
Blackline Masters, Algebra 1 Page 3-23
III. Graph the following functions on the graphing calculator:
A. y = x + 5 B. y = 12
x + 5 C. y = 14
x + 5 D. y = 13
x + 5
8. Describe what happens to the graph as the slope is decreased (but still a positive value). The line gets flatter. IV. Graph the following functions on the graphing calculator:
A. y = x - 2 B. y = -x - 2 C. y = -3x - 2
D. y = 12
−
x - 2
9. Describe what happens when the slope is a negative number. The line slants in the opposite direction or as x increases, y decreases. 10. Does the equation y = -2x have a positive or negative slope? Without graphing, is this line tilted to the right or to the left? Explain your answer. Negative, left IV. Graph the following functions on the graphing calculator
A. y = 5 B. y = -2 C. y = 1
11. Describe the line that is graphed. horizontal 12. What is the slope of each line? 0 13. Write an equation of each line in slope-intercept form. y = 0x + 5, y = 0x – 2, y = 0x + 1 V. Graph the following by hand.
A. x = 6 B. x = 3 C. x = -5
14. Describe the line that is graphed. vertical 15. What is the slope of each line? undefined 16. What are the differences between the two equations y = 2 and x = 2? One is horizontal, and one is vertical.
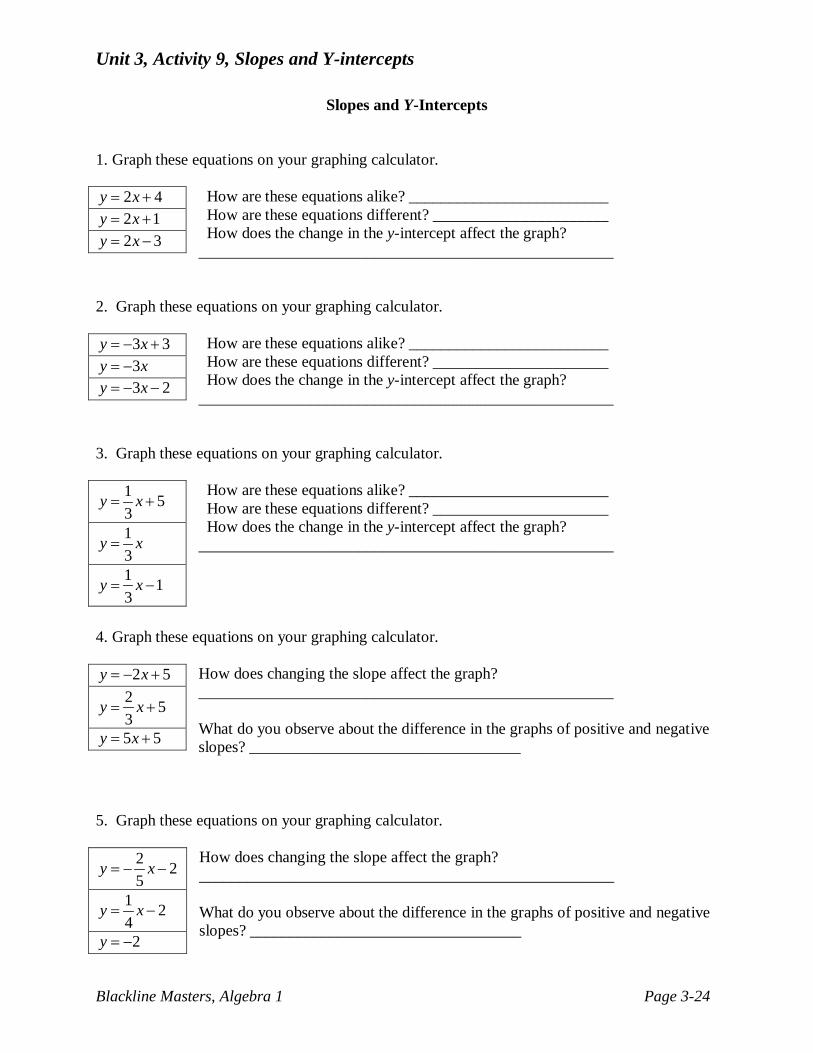
Unit 3, Activity 9, Slopes and Y-intercepts
Blackline Masters, Algebra 1 Page 3-24
Slopes and Y-Intercepts
1. Graph these equations on your graphing calculator.
How are these equations alike? _________________________ How are these equations different? ______________________ How does the change in the y-intercept affect the graph? ____________________________________________________
2. Graph these equations on your graphing calculator.
How are these equations alike? _________________________ How are these equations different? ______________________ How does the change in the y-intercept affect the graph? ____________________________________________________
3. Graph these equations on your graphing calculator.
How are these equations alike? _________________________ How are these equations different? ______________________ How does the change in the y-intercept affect the graph? ____________________________________________________
4. Graph these equations on your graphing calculator.
How does changing the slope affect the graph? ____________________________________________________ What do you observe about the difference in the graphs of positive and negative slopes? __________________________________
5. Graph these equations on your graphing calculator.
How does changing the slope affect the graph? ____________________________________________________ What do you observe about the difference in the graphs of positive and negative slopes? __________________________________
2 4y x= + 2 1y x= + 2 3y x= −
3 3y x= − + 3y x= − 3 2y x= − −
1 53
y x= +
13
y x=
1 13
y x= −
2 5y x= − + 2 53
y x= +
5 5y x= +
2 25
y x= − −
1 24
y x= −
2y = −
Unit 3, Activity 9, Slopes and Y-intercepts
Blackline Masters, Algebra 1 Page 3-25
6. Graph these equations on your graphing calculator.
How does changing the slope affect the graph? ____________________________________________________ What do you observe about the difference in the graphs of positive and negative slopes? __________________________________
7. Graph y = x 8. Graph y = -x
9. Make up 2 equations with horizontal lines and 2 equations with vertical lines. Graph them below and mark each one with the equation of the line.
132
y x= −
122
y x= − −
1 12 2
y x= −
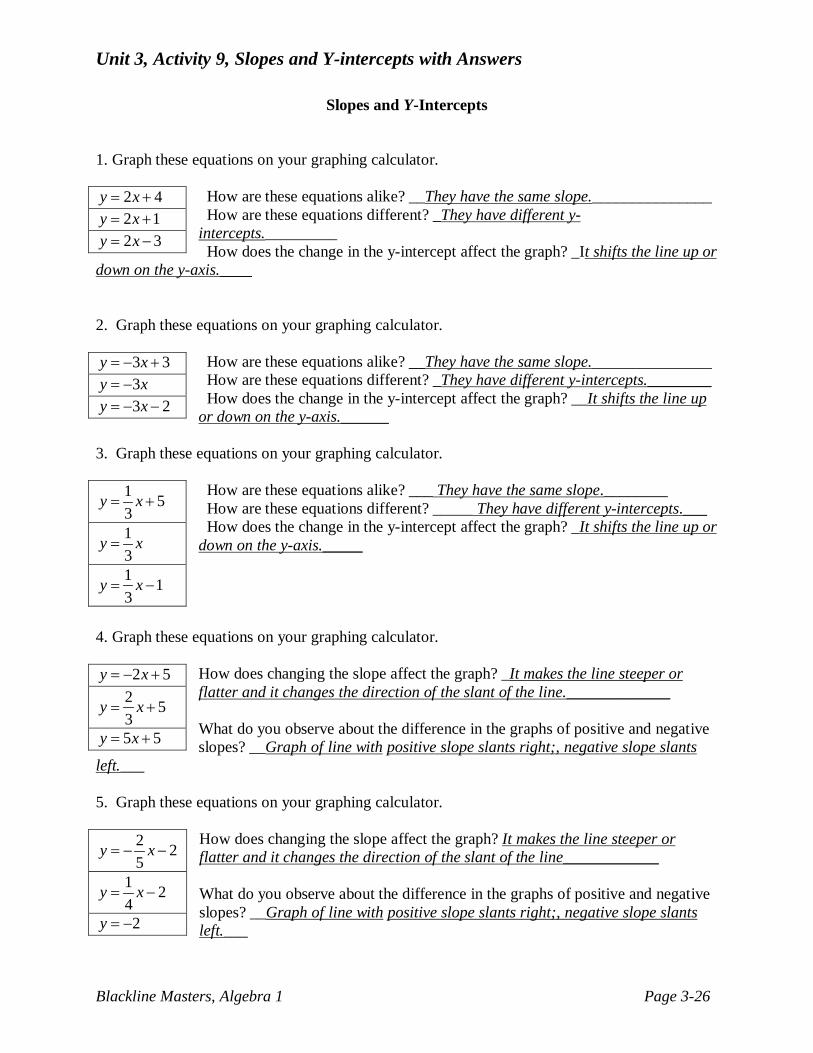
Unit 3, Activity 9, Slopes and Y-intercepts with Answers
Blackline Masters, Algebra 1 Page 3-26
Slopes and Y-Intercepts
1. Graph these equations on your graphing calculator.
How are these equations alike? __They have the same slope._______________ How are these equations different? _They have different y-intercepts._________ How does the change in the y-intercept affect the graph? _It shifts the line up or
down on the y-axis.____ 2. Graph these equations on your graphing calculator.
How are these equations alike? __They have the same slope._______________ How are these equations different? _They have different y-intercepts.________ How does the change in the y-intercept affect the graph? __It shifts the line up or down on the y-axis.______
3. Graph these equations on your graphing calculator.
How are these equations alike? ___ They have the same slope.________ How are these equations different? _____ They have different y-intercepts.___ How does the change in the y-intercept affect the graph? _It shifts the line up or down on the y-axis._____
4. Graph these equations on your graphing calculator.
How does changing the slope affect the graph? _It makes the line steeper or flatter and it changes the direction of the slant of the line._____________ What do you observe about the difference in the graphs of positive and negative slopes? __Graph of line with positive slope slants right;, negative slope slants
left.___
5. Graph these equations on your graphing calculator. How does changing the slope affect the graph? It makes the line steeper or flatter and it changes the direction of the slant of the line____________ What do you observe about the difference in the graphs of positive and negative slopes? __Graph of line with positive slope slants right;, negative slope slants left.___
2 4y x= + 2 1y x= + 2 3y x= −
3 3y x= − + 3y x= − 3 2y x= − −
1 53
y x= +
13
y x=
1 13
y x= −
2 5y x= − + 2 53
y x= +
5 5y x= +
2 25
y x= − −
1 24
y x= −
2y = −
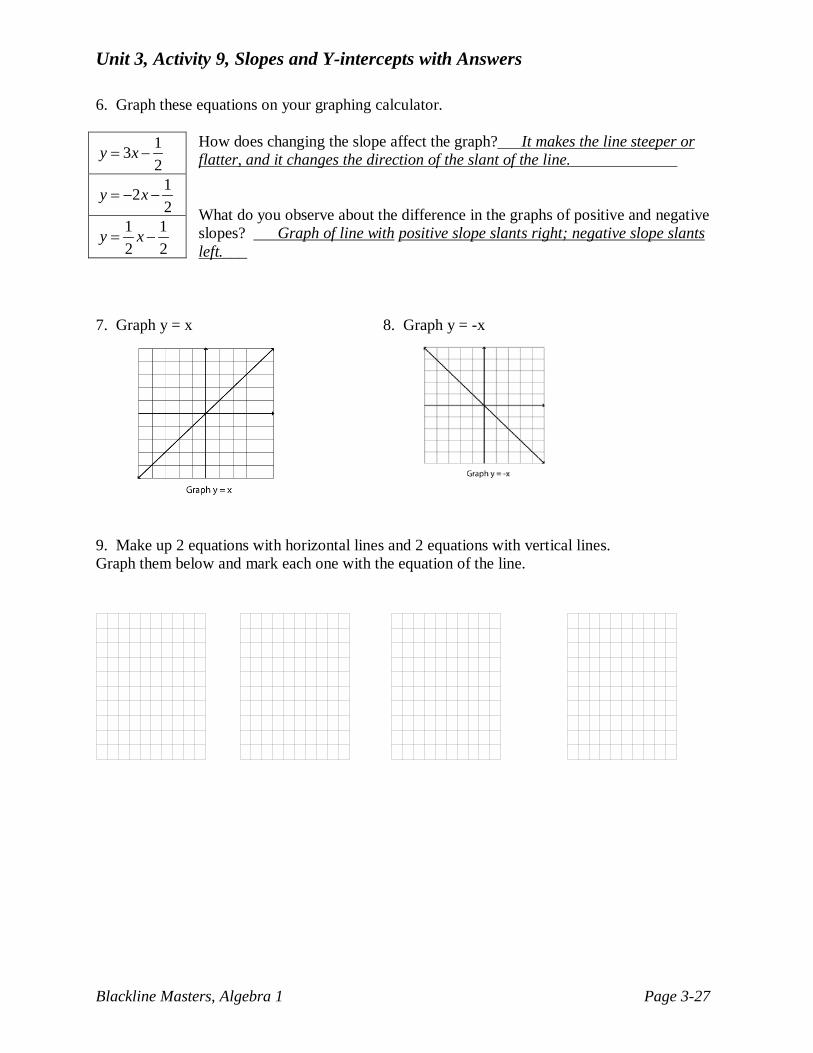
Unit 3, Activity 9, Slopes and Y-intercepts with Answers
Blackline Masters, Algebra 1 Page 3-27
6. Graph these equations on your graphing calculator. How does changing the slope affect the graph? It makes the line steeper or flatter, and it changes the direction of the slant of the line. What do you observe about the difference in the graphs of positive and negative slopes? Graph of line with positive slope slants right; negative slope slants left.___
7. Graph y = x 8. Graph y = -x
9. Make up 2 equations with horizontal lines and 2 equations with vertical lines. Graph them below and mark each one with the equation of the line.
132
y x= −
122
y x= − −
1 12 2
y x= −
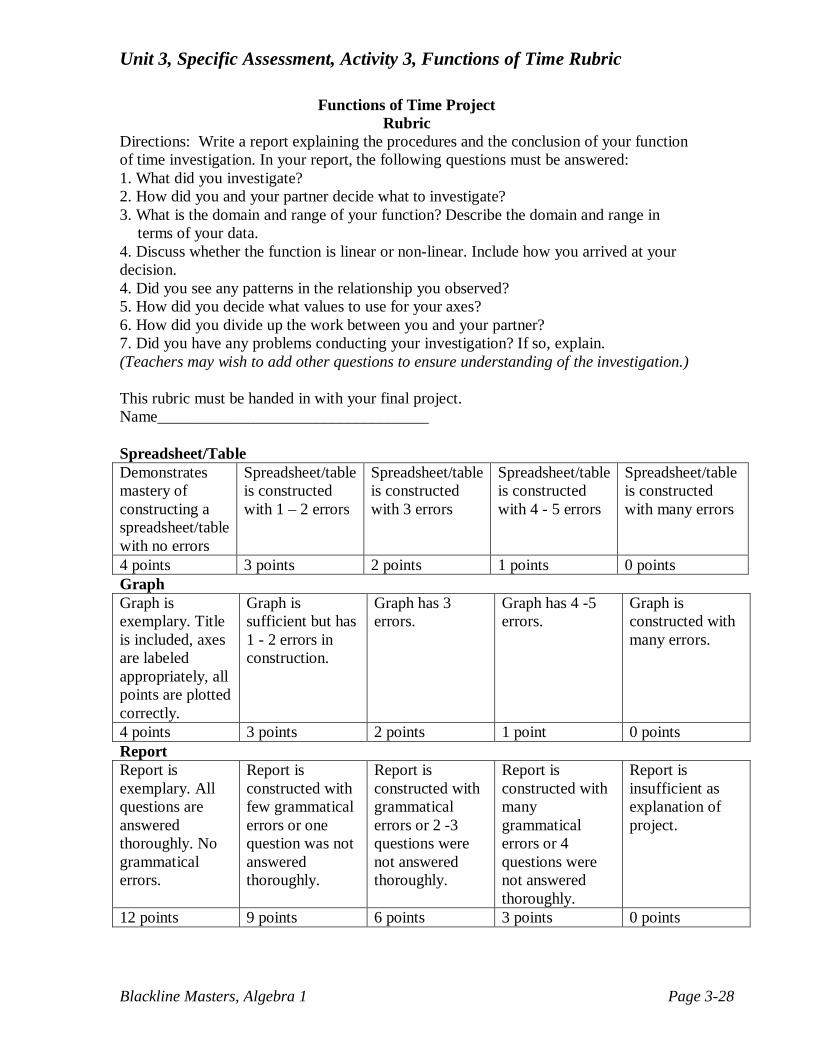
Unit 3, Specific Assessment, Activity 3, Functions of Time Rubric
Blackline Masters, Algebra 1 Page 3-28
Functions of Time Project Rubric
Directions: Write a report explaining the procedures and the conclusion of your function of time investigation. In your report, the following questions must be answered: 1. What did you investigate? 2. How did you and your partner decide what to investigate? 3. What is the domain and range of your function? Describe the domain and range in
terms of your data. 4. Discuss whether the function is linear or non-linear. Include how you arrived at your decision. 4. Did you see any patterns in the relationship you observed? 5. How did you decide what values to use for your axes? 6. How did you divide up the work between you and your partner? 7. Did you have any problems conducting your investigation? If so, explain. (Teachers may wish to add other questions to ensure understanding of the investigation.)
This rubric must be handed in with your final project. Name__________________________________ Spreadsheet/Table Demonstrates mastery of constructing a spreadsheet/table with no errors
Spreadsheet/table is constructed with 1 – 2 errors
Spreadsheet/table is constructed with 3 errors
Spreadsheet/table is constructed with 4 - 5 errors
Spreadsheet/table is constructed with many errors
4 points 3 points 2 points 1 points 0 points Graph Graph is exemplary. Title is included, axes are labeled appropriately, all points are plotted correctly.
Graph is sufficient but has 1 - 2 errors in construction.
Graph has 3 errors.
Graph has 4 -5 errors.
Graph is constructed with many errors.
4 points 3 points 2 points 1 point 0 points Report Report is exemplary. All questions are answered thoroughly. No grammatical errors.
Report is constructed with few grammatical errors or one question was not answered thoroughly.
Report is constructed with grammatical errors or 2 -3 questions were not answered thoroughly.
Report is constructed with many grammatical errors or 4 questions were not answered thoroughly.
Report is insufficient as explanation of project.
12 points 9 points 6 points 3 points 0 points

Unit 4, Activity 1, Vocabulary Awareness Chart
Blackline Masters Algebra I, Revised 2012 Page 4-1
Procedure: 1. Examine the list of words you have written in the first column. 2. Put a + next to each word you know well and for which you can write an accurate example and definition. Your definition and example must relate to the unit of study. 3. Place a next to any words for which you can write either a definition or an example, but not both. 4. Put a – next to words that are new to you. This chart will be used throughout the unit. By the end of the unit, you should have the entire chart completed. Because you will be revising this chart, write in pencil.
Word + - Example Definition Slope of a line
Slope-intercept form of a linear equation
Point-slope form of a linear equation
Standard form of a linear equation
Scatterplot Line of Best Fit
Line of Regression
Linear Interpolation
Linear Extrapolation
y-intercept x-intercept Correlation coefficient(r)
Rise Run
Coefficient of a variable
Constant term
Unit 4, Activity 1, Generating Equations
Blackline Masters Algebra I, Revised 2012 Page 4-2
Forms of Linear Equations
1. Given the slope and the y intercept, write the equation described in slope-intercept and
standard forms.
A. m = ; b = 3
B. m = 0; b = 1
C. m = - ; b = 3
D. m = -3; b = 2
E. m = ; b = 4
2. Write an equation in point slope, slope intercept and standard forms for the line through
the given point with the given slope. A. (3, -4); m = 6
B. (-2, -7); m = -
3. A line passes through the given points. Determine its slope. Write its equation in point-
slope, slope-intercept and standard forms. A. (-1, 0) (1, 2) B. (6, - 4) (-3, -5) C. (-3, -4) (3, -2)
Unit 4, Activity 1, Generating Equations With Answers
Blackline Masters Algebra I, Revised 2012 Page 4-3
Forms of Linear Equations with answers
1. Given the slope and the y intercept, write the equation described in slope intercept and
standard forms.
A. m = ; b = 3 Answers: y = x + 3 2x - 9y = -27
B. m = 0; b = 1 y = 1 0x + y = 1
C. m = - ; b = 3 y = - x + 3 9x + 2y = 6
D. m = -3; b = 2 y = - 3x + 2 3x + y = 2
E. m = ; b = 4 y = x + 4 3x - 2y = -8
2. Write an equation in point slope, slope intercept and standard forms for the line through
the given point with the given slope. A. (3, -4); m = 6 Answers: y + 4 = 6 (x - 3) y = 6x - 22 6x - y = 22
B. (-2, -7); m = - y + 7 = - (x + 2) y = - x -10 3x + 2y = -20
3. A line passes through the given points. Determine its slope. Write its equation in point-
slope, slope-intercept, and standard forms. A. (-1, 0) (1, 2) Answers: m = 1, y - 0 = 1(x + 1) or y - 2 = 1(x - 1); y = x + 1;
x - y = -1
B. (6, - 4) (-3, -5) m = ; ( y + 4) = (x - 6 ); y + 5 = (x + 3);
x - 9y = 42
C. (-3, -4) (3, -2) m = ; y + 4 = (x + 3) or y + 2 = (x - 3); y = x - 3;
x - 3y = 9
Unit 4, Activity 2, Graphing Equations
Blackline Masters Algebra I, Revised 2012 Page 4-4
Graphing Linear Equations
Graph each equation on a coordinate plane. You may use a table of values or ordered pairs and slope.
1. A. y = x + 3
B. y = 1
C. y = - x + 2
D. y = - 3x + 2
E. y = x + 4
2. A. y = 6x - 22
B. y = - x -
3. A. y = x + 1
B. y = -x + 1
C. y = x - 3
.
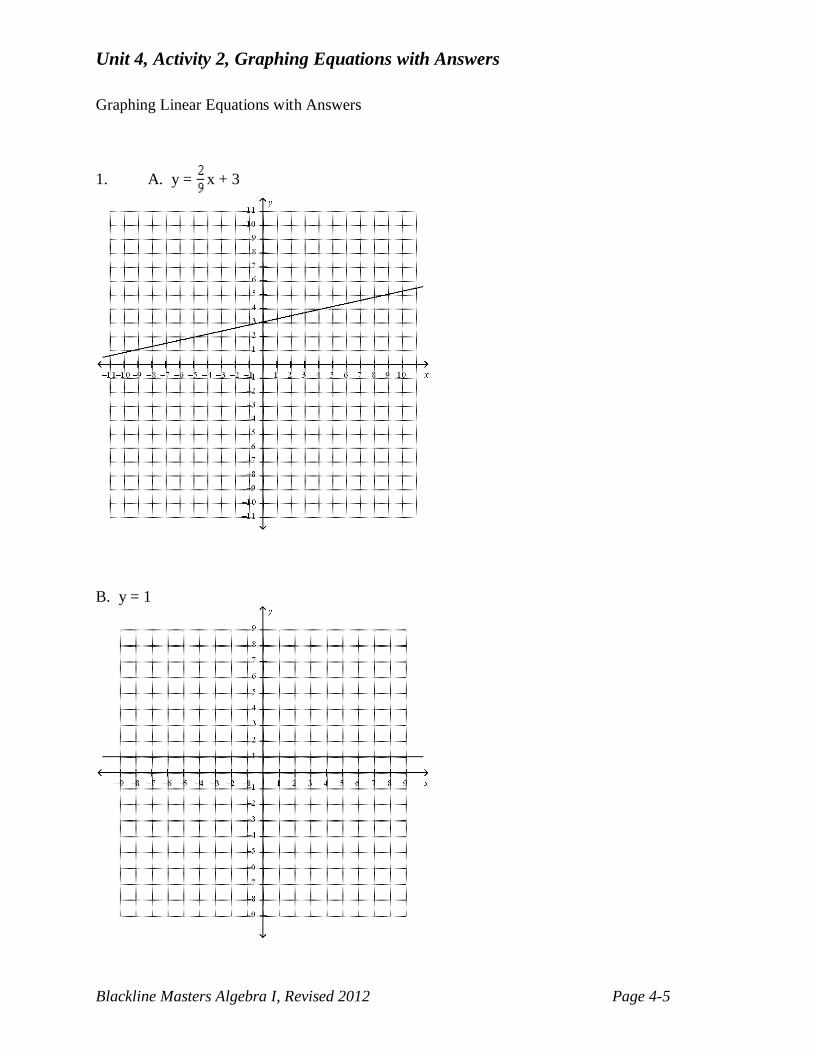
Unit 4, Activity 2, Graphing Equations with Answers
Blackline Masters Algebra I, Revised 2012 Page 4-5
Graphing Linear Equations with Answers
1. A. y = x + 3
B. y = 1
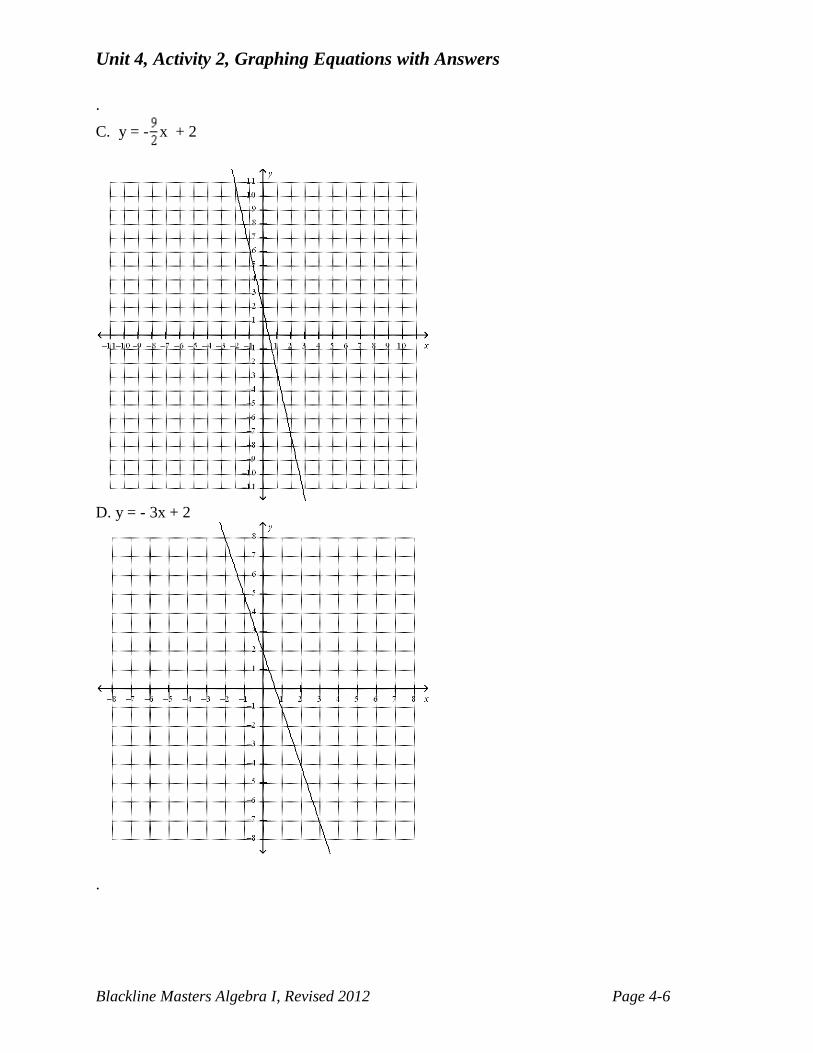
Unit 4, Activity 2, Graphing Equations with Answers
Blackline Masters Algebra I, Revised 2012 Page 4-6
.
C. y = - x + 2
D. y = - 3x + 2
.
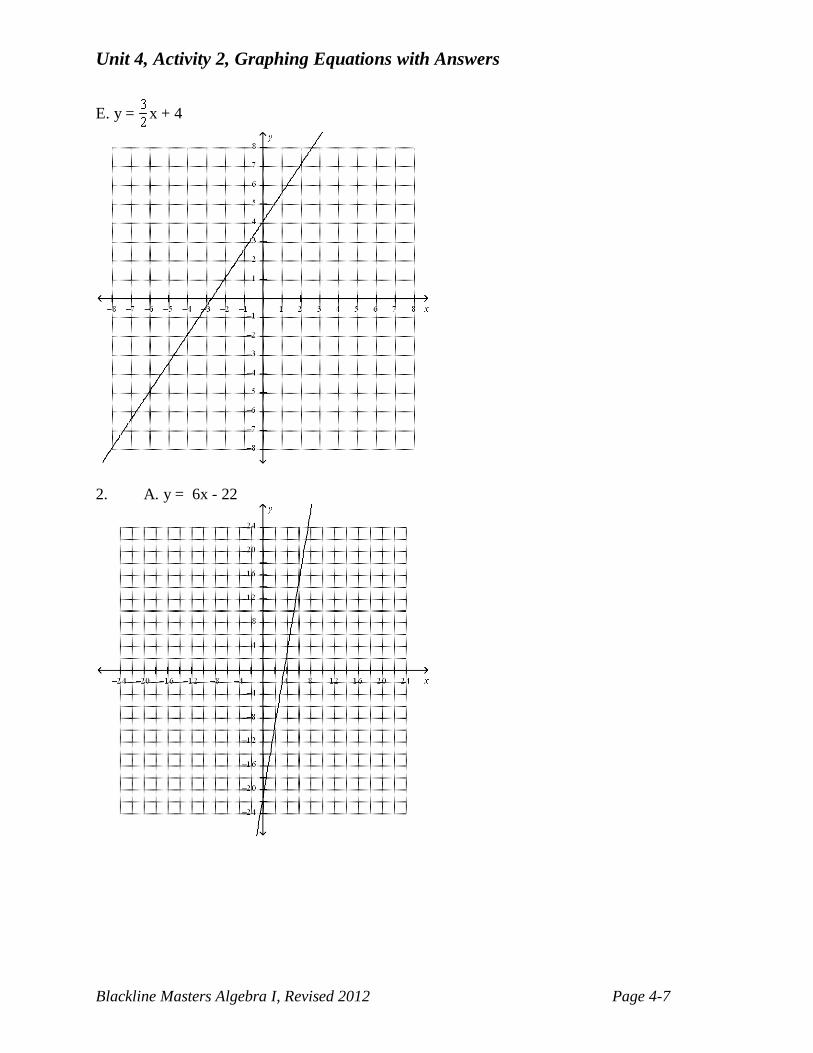
Unit 4, Activity 2, Graphing Equations with Answers
Blackline Masters Algebra I, Revised 2012 Page 4-7
E. y = x + 4
2. A. y = 6x - 22
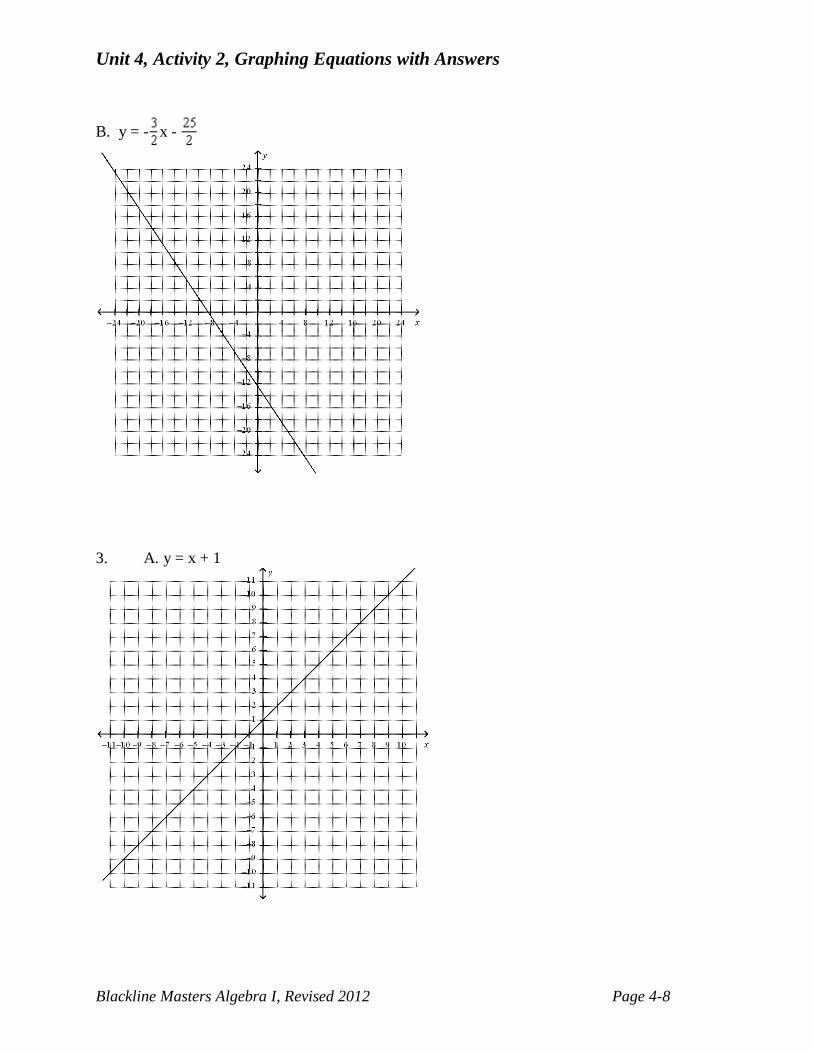
Unit 4, Activity 2, Graphing Equations with Answers
Blackline Masters Algebra I, Revised 2012 Page 4-8
B. y = - x -
3. A. y = x + 1

Unit 4, Activity 2, Graphing Equations with Answers
Blackline Masters Algebra I, Revised 2012 Page 4-9
B. y = -x + 1
C. y = x - 3
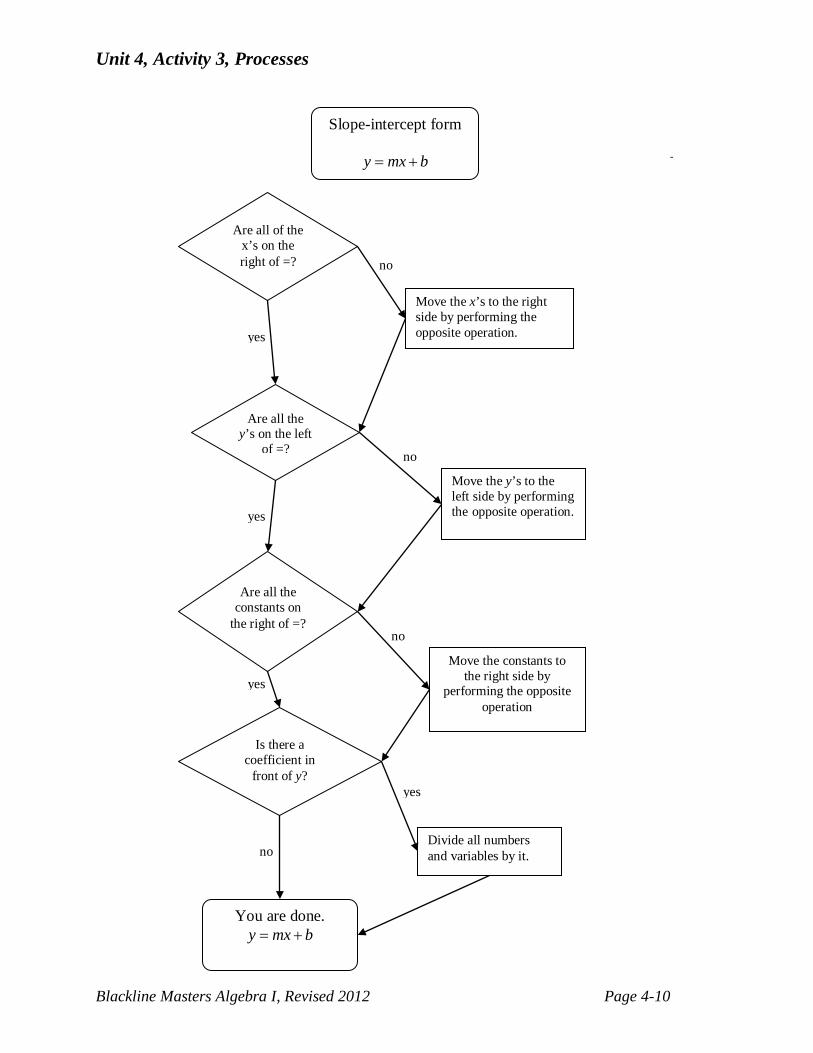
Unit 4, Activity 3, Processes
Blackline Masters Algebra I, Revised 2012 Page 4-10
Are all of the x’s on the right of =?
Move the x’s to the right side by performing the opposite operation.
Are all the y’s on the left
of =?
Move the y’s to the left side by performing the opposite operation.
Are all the constants on
the right of =?
Is there a coefficient in
front of y?
Move the constants to the right side by
performing the opposite operation
Divide all numbers and variables by it.
You are done. y mx b= +
yes
yes
yes
yes
no
no
no
no
Slope-intercept form
y mx b= +
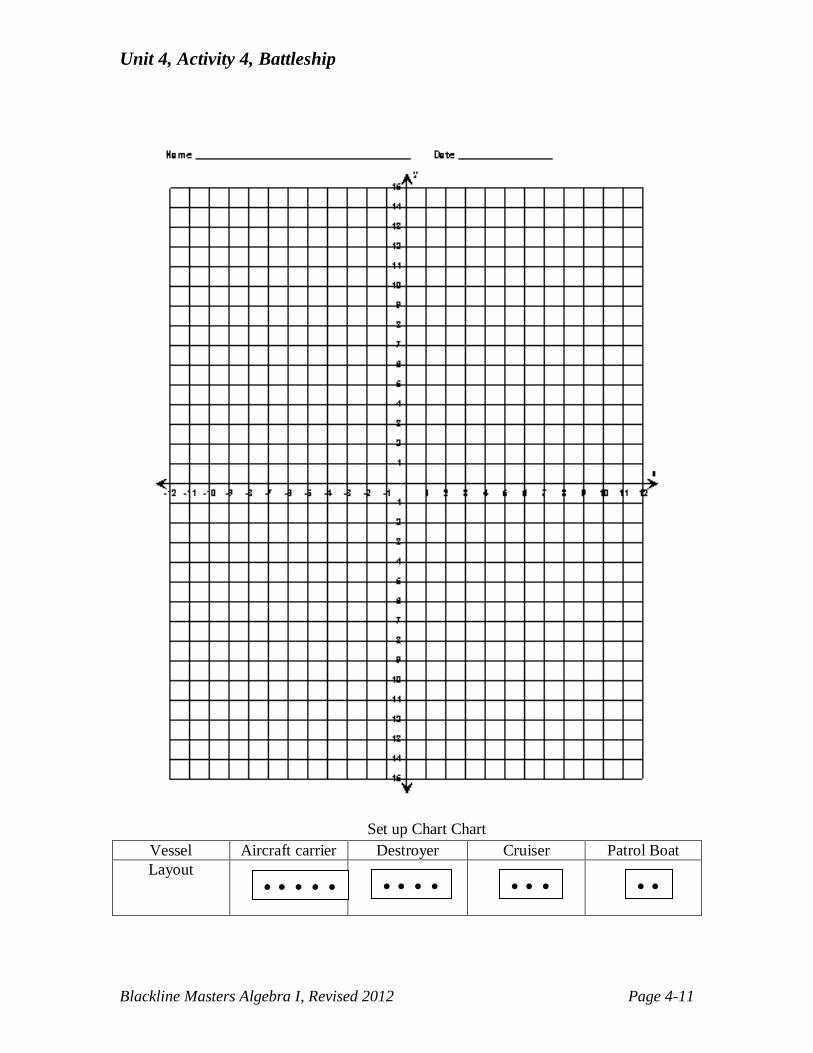
Unit 4, Activity 4, Battleship
Blackline Masters Algebra I, Revised 2012 Page 4-11
Set up Chart Chart
Vessel Aircraft carrier Destroyer Cruiser Patrol Boat Layout
• • • • • • • • • • • • • •
Unit 4, Activity 5, Applications
Blackline Masters Algebra I, Revised 2012 Page 4-12
In this activity, you will investigate the linear relationship between a person’s foot length and the length of the arm from the elbow to fingertip. Work in groups of 4. Foot Length is the independent variable and arm length is the dependent variable. Enter your data on this table. Then, graph your individual data on the coordinate plane displayed on the overhead. Answer these questions as a group:
1. Observing the characteristics of the graph on the overhead projector, do you see characteristics that suggest a relationship? _________________________________
2. What happens to the y-values as the x-values increase? _________________________
3. Observe the piece of spaghetti. Using that as a line of best fit, determine two
points that are contained in the line of best fit. ___________________________
4. Find the slope of the line. ______________________
5. Use the point-slope formula to write the equation. _________________________
6. What is the real-life meaning of the slope of the line? __________________________________________________________________
7. Measure your teacher’s foot. Using the equation you generated, estimate the arm length of your teacher. Length is approximately _____________________. 8. Enter your data from above into your graphing calculator. Enter the data from a
group near you. Find the linear regression and compare it to the equation in #5 above. How close are the results? _____________________________________
Foot Length (To the nearest millimeter)
Arm Length (To the nearest millimeter)

Unit 4, Activity 5, Transparency Graphs
Blackline Masters Algebra I, Revised 2012 Page 4-13
Unit 4, Activity 6, Experiment Descriptions
Blackline Masters Algebra I, Revised 2012 Page 4-14
Bouncing Ball Goal: to determine the relationship between the height of a ball’s bounce and the height from which it is dropped Materials: rubber ball, meter stick Procedure: Drop a ball and measure the height of the first bounce. To minimize experimental error, drop from the same height 3 times and use the average bounce height as the data value. Repeat using different heights.
Stretched Spring Goal: to determine the relationship between the distance a spring is stretched and the number of weights used to stretch it Materials: spring, paper cup, pipe cleaner, weights, measuring tape Procedure: Suspend a number of weights on a spring, and measure the length of the spring. A slinky (cut in half) makes a good spring; one end can be stabilized by suspending the spring on a meter stick held between two chair backs. A small paper cup (with a wire or pipe cleaner handle) containing weights, such as pennies, can be attached to the spring.
Burning Candle Goal: to determine the relationship between the time a candle burns and the height of the candle. Materials: birthday candle (secured to a jar lid), matches, ruler, stopwatch Procedure: Measure the candle. Light the candle while starting the stopwatch. Record time burned and height of candle.
Marbles in Water Goal: to determine the relationship between the number of marbles in a glass of water and the height of the water. Materials: glass with water, marbles, ruler Procedure: Measure the height of water in a glass. Drop one marble at a time into the glass of water, measuring the height of the water after each marble is added.
Unit 4, Activity 6, Experiment Descriptions
Blackline Masters Algebra I, Revised 2012 Page 4-15
Marbles and Uncooked Spaghetti Goal: to see how many pieces of spaghetti it takes to support a cup of marbles Materials: paper cup with a hook (paper clip) attached, spaghetti, marbles Procedure: place the hook on a piece of uncooked spaghetti supported between two chairs, drop in one marble at a time until the spaghetti breaks, repeat with two pieces of spaghetti, and so on.
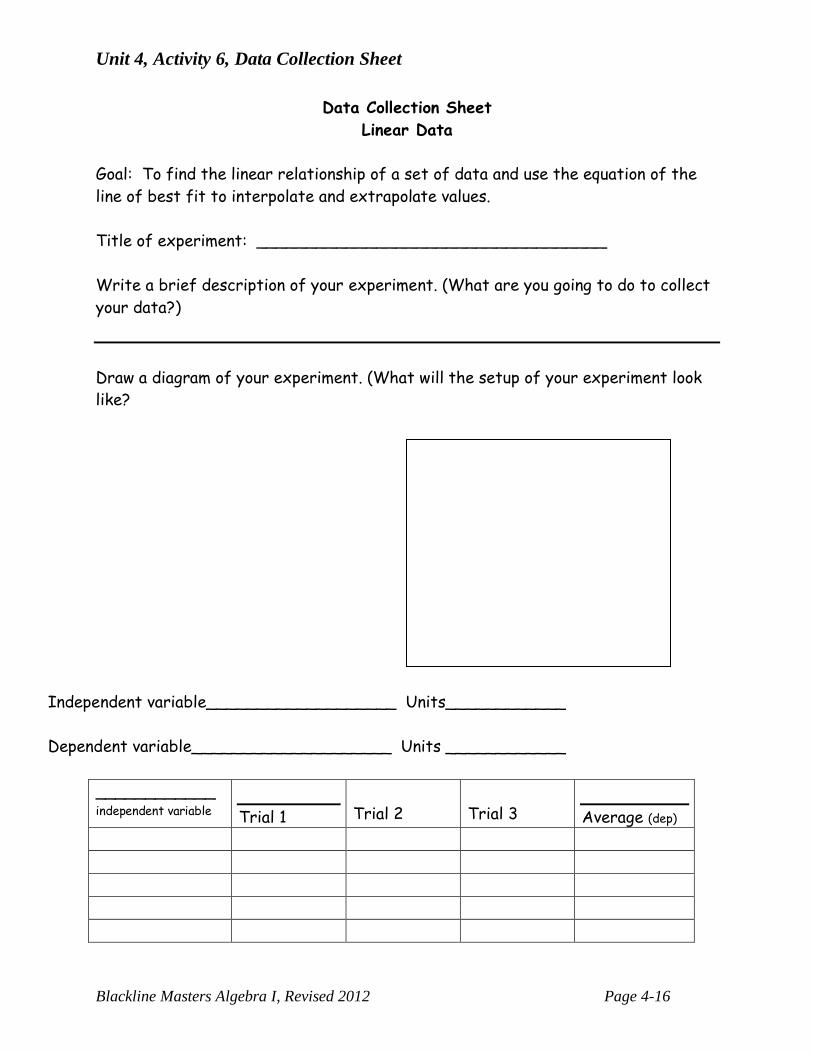
Unit 4, Activity 6, Data Collection Sheet
Blackline Masters Algebra I, Revised 2012 Page 4-16
Data Collection Sheet Linear Data
Goal: To find the linear relationship of a set of data and use the equation of the line of best fit to interpolate and extrapolate values. Title of experiment: ___________________________________ Write a brief description of your experiment. (What are you going to do to collect your data?) Draw a diagram of your experiment. (What will the setup of your experiment look like?
Independent variable___________________ Units____________ Dependent variable____________________ Units ____________
____________ independent variable
Trial 1
Trial 2
Trial 3
Average (dep)
Unit 4, Activity 6, Data Collection Sheet
Blackline Masters Algebra I, Revised 2012 Page 4-17
Data to be graphed (Use the average measurements) : Equation of the line of best fit (by hand) ________________________ Equation of the line of best fit (calculator)______________________ Slope__________ Real-life meaning__________________________________________ y-intercept____________________________ Real-life meaning__________________________________________ Interpolation (Choose a value within your data range and substitute for the independent variable in your equation): Extrapolation (Choose a value outside of your data range and substitute for the independent variable in your equation): Write a word problem that requires solving for the independent variable.
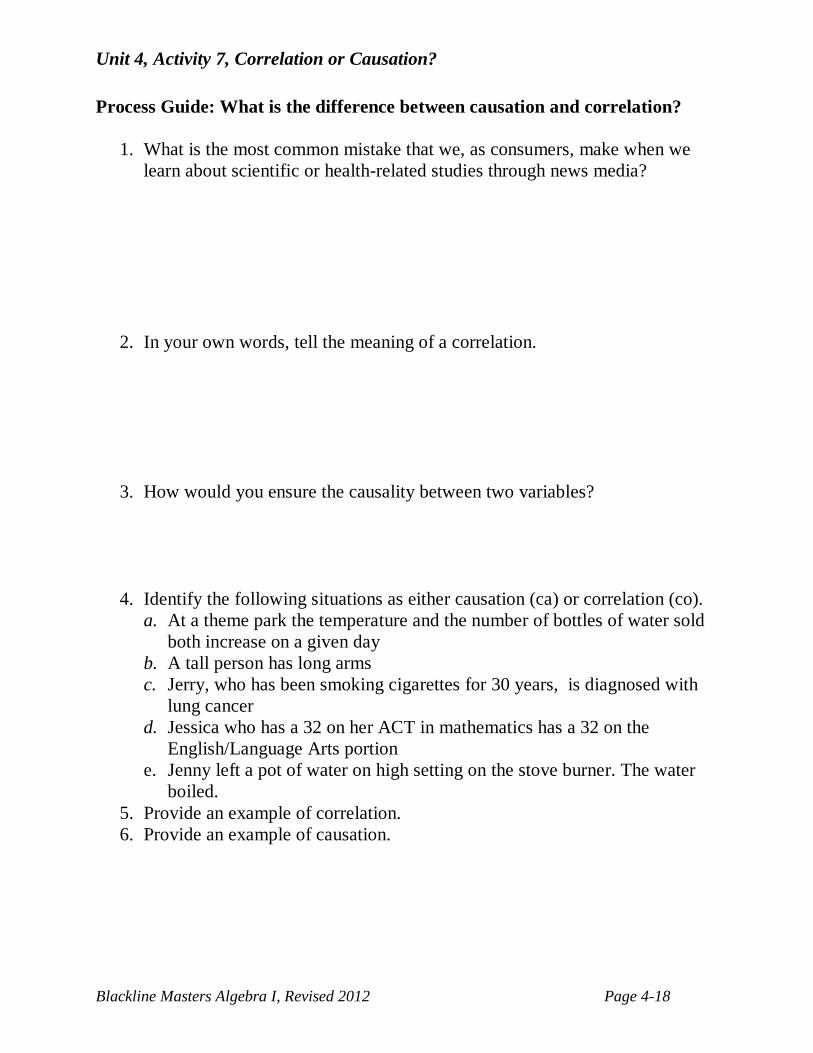
Unit 4, Activity 7, Correlation or Causation?
Blackline Masters Algebra I, Revised 2012 Page 4-18
Process Guide: What is the difference between causation and correlation?
1. What is the most common mistake that we, as consumers, make when we learn about scientific or health-related studies through news media?
2. In your own words, tell the meaning of a correlation.
3. How would you ensure the causality between two variables?
4. Identify the following situations as either causation (ca) or correlation (co). a. At a theme park the temperature and the number of bottles of water sold
both increase on a given day b. A tall person has long arms c. Jerry, who has been smoking cigarettes for 30 years, is diagnosed with
lung cancer d. Jessica who has a 32 on her ACT in mathematics has a 32 on the
English/Language Arts portion e. Jenny left a pot of water on high setting on the stove burner. The water
boiled. 5. Provide an example of correlation. 6. Provide an example of causation.
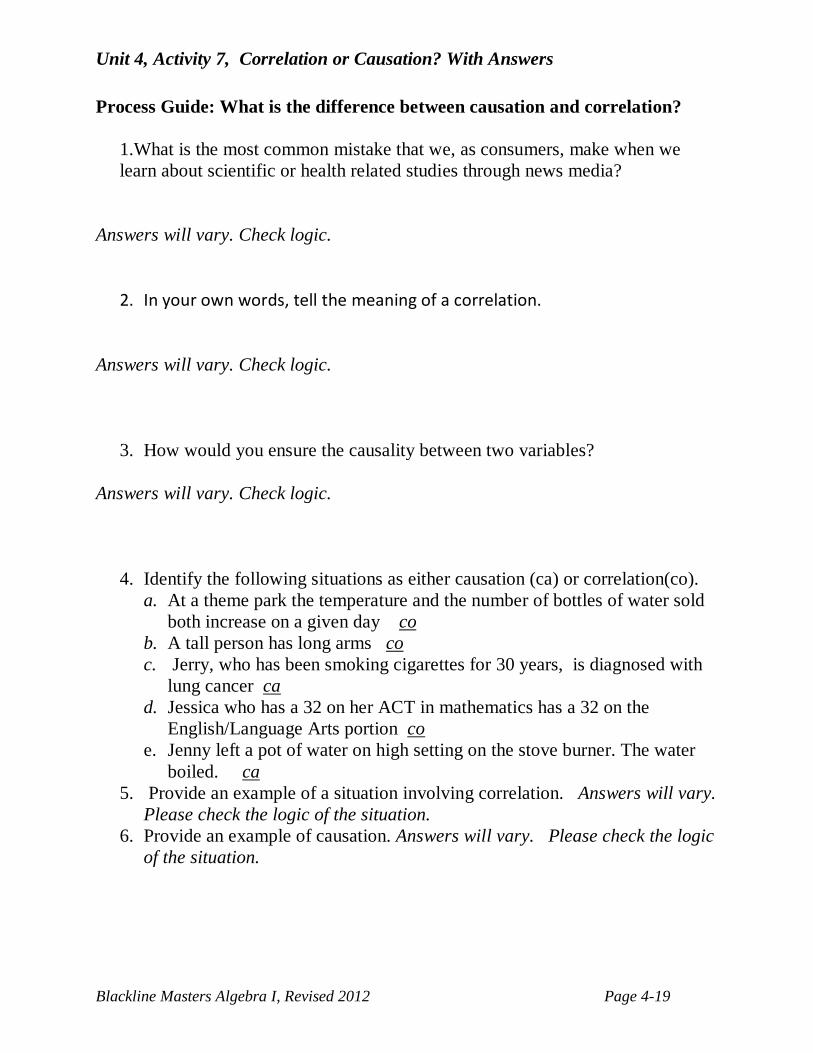
Unit 4, Activity 7, Correlation or Causation? With Answers
Blackline Masters Algebra I, Revised 2012 Page 4-19
Process Guide: What is the difference between causation and correlation?
1.What is the most common mistake that we, as consumers, make when we learn about scientific or health related studies through news media?
Answers will vary. Check logic.
2. In your own words, tell the meaning of a correlation. Answers will vary. Check logic.
3. How would you ensure the causality between two variables? Answers will vary. Check logic.
4. Identify the following situations as either causation (ca) or correlation(co). a. At a theme park the temperature and the number of bottles of water sold
both increase on a given day co b. A tall person has long arms co c. Jerry, who has been smoking cigarettes for 30 years, is diagnosed with
lung cancer ca d. Jessica who has a 32 on her ACT in mathematics has a 32 on the
English/Language Arts portion co e. Jenny left a pot of water on high setting on the stove burner. The water
boiled. ca 5. Provide an example of a situation involving correlation. Answers will vary.
Please check the logic of the situation. 6. Provide an example of causation. Answers will vary. Please check the logic
of the situation.
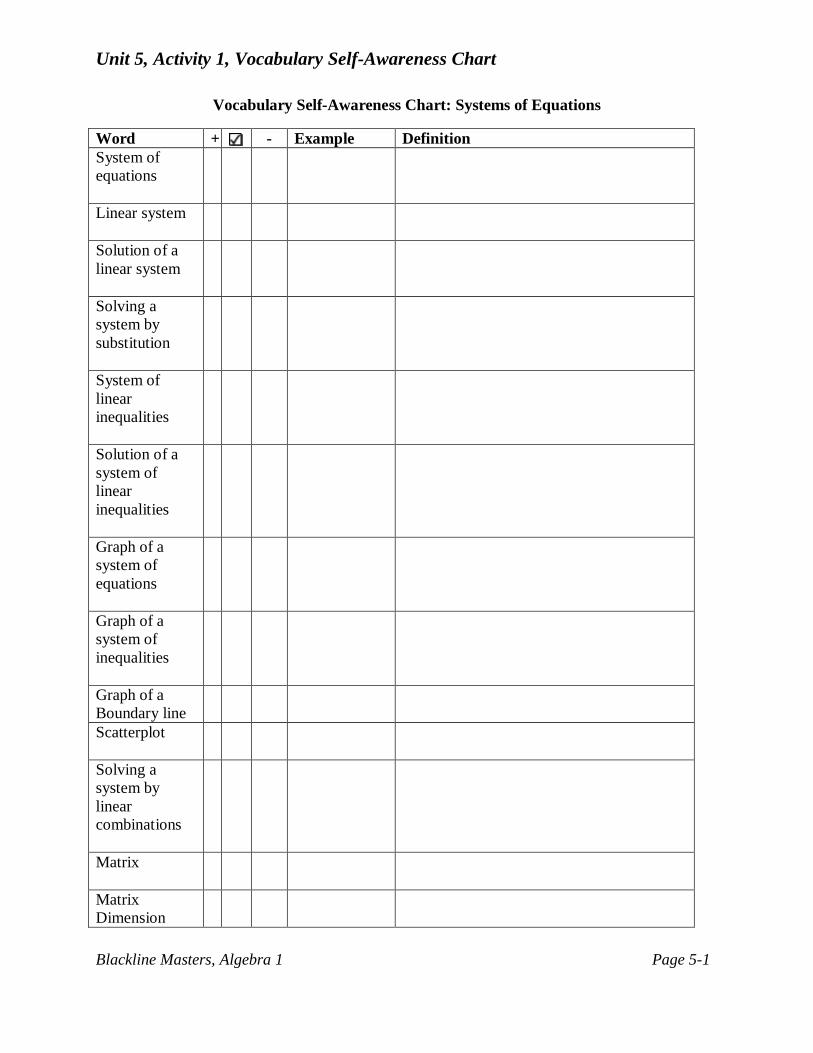
Unit 5, Activity 1, Vocabulary Self-Awareness Chart
Blackline Masters, Algebra 1 Page 5-1
Vocabulary Self-Awareness Chart: Systems of Equations
Word + - Example Definition System of equations
Linear system
Solution of a linear system
Solving a system by substitution
System of linear inequalities
Solution of a system of linear inequalities
Graph of a system of equations
Graph of a system of inequalities
Graph of a Boundary line
Scatterplot
Solving a system by linear combinations
Matrix
Matrix Dimension
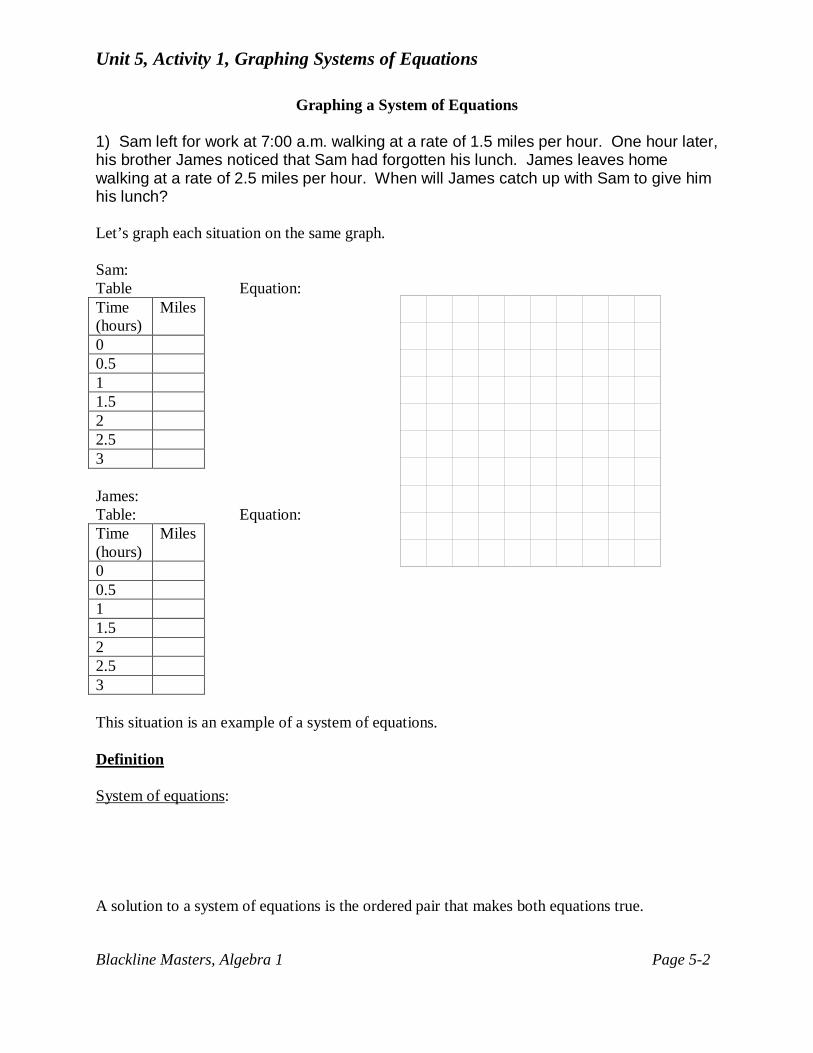
Unit 5, Activity 1, Graphing Systems of Equations
Blackline Masters, Algebra 1 Page 5-2
Graphing a System of Equations
1) Sam left for work at 7:00 a.m. walking at a rate of 1.5 miles per hour. One hour later, his brother James noticed that Sam had forgotten his lunch. James leaves home walking at a rate of 2.5 miles per hour. When will James catch up with Sam to give him his lunch? Let’s graph each situation on the same graph. Sam: Table Equation: Time (hours)
Miles
0 0.5 1 1.5 2 2.5 3 James: Table: Equation: Time (hours)
Miles
0 0.5 1 1.5 2 2.5 3 This situation is an example of a system of equations. Definition System of equations: A solution to a system of equations is the ordered pair that makes both equations true.
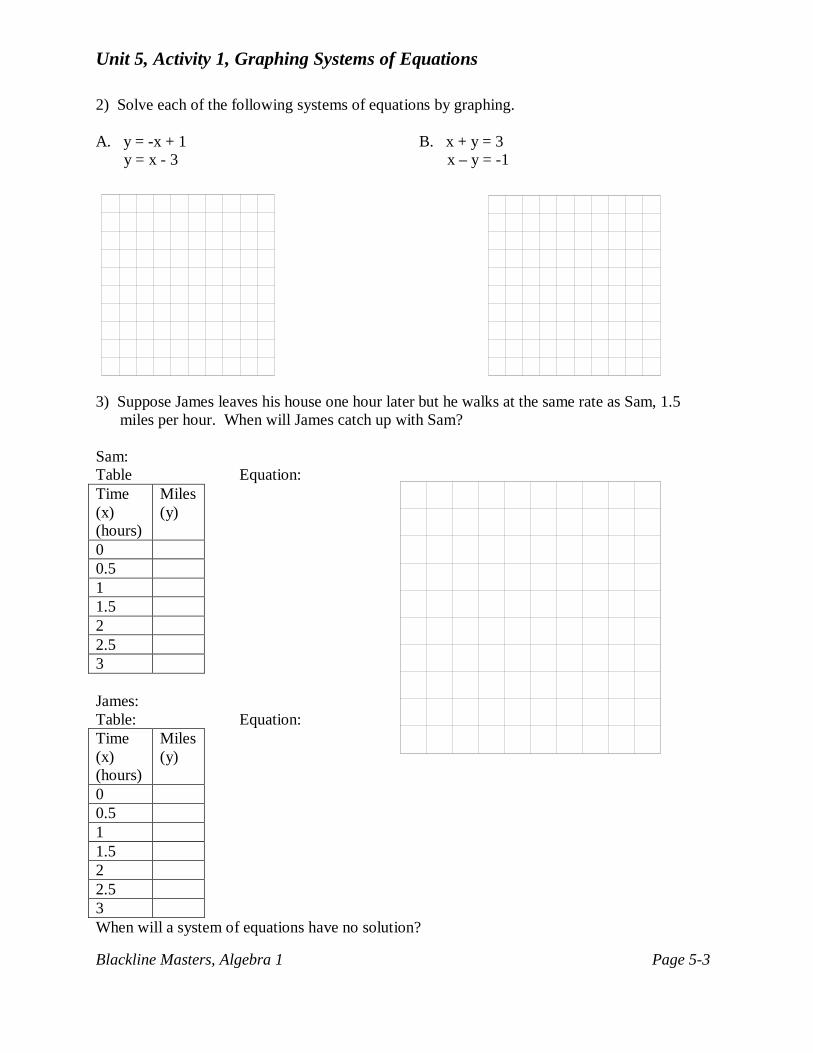
Unit 5, Activity 1, Graphing Systems of Equations
Blackline Masters, Algebra 1 Page 5-3
2) Solve each of the following systems of equations by graphing. A. y = -x + 1 B. x + y = 3 y = x - 3 x – y = -1
3) Suppose James leaves his house one hour later but he walks at the same rate as Sam, 1.5 miles per hour. When will James catch up with Sam? Sam: Table Equation: Time (x) (hours)
Miles (y)
0 0.5 1 1.5 2 2.5 3 James: Table: Equation: Time (x) (hours)
Miles (y)
0 0.5 1 1.5 2 2.5 3 When will a system of equations have no solution?
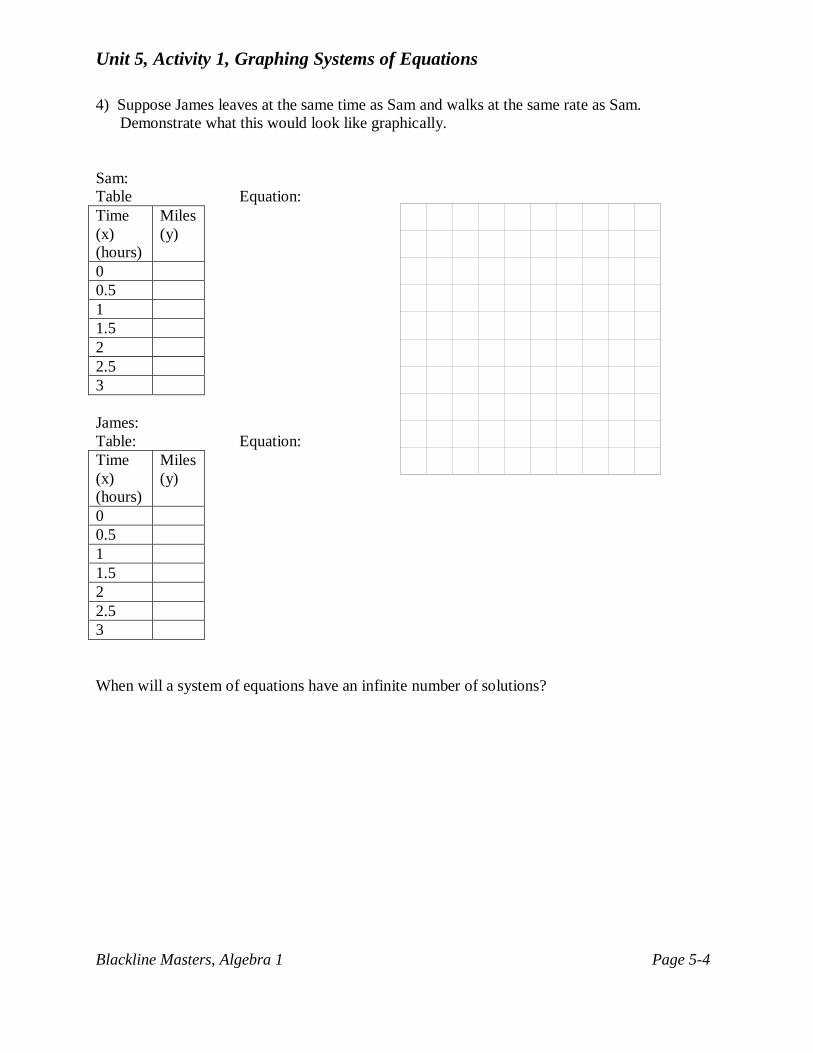
Unit 5, Activity 1, Graphing Systems of Equations
Blackline Masters, Algebra 1 Page 5-4
4) Suppose James leaves at the same time as Sam and walks at the same rate as Sam. Demonstrate what this would look like graphically. Sam: Table Equation: Time (x) (hours)
Miles (y)
0 0.5 1 1.5 2 2.5 3 James: Table: Equation: Time (x) (hours)
Miles (y)
0 0.5 1 1.5 2 2.5 3 When will a system of equations have an infinite number of solutions?
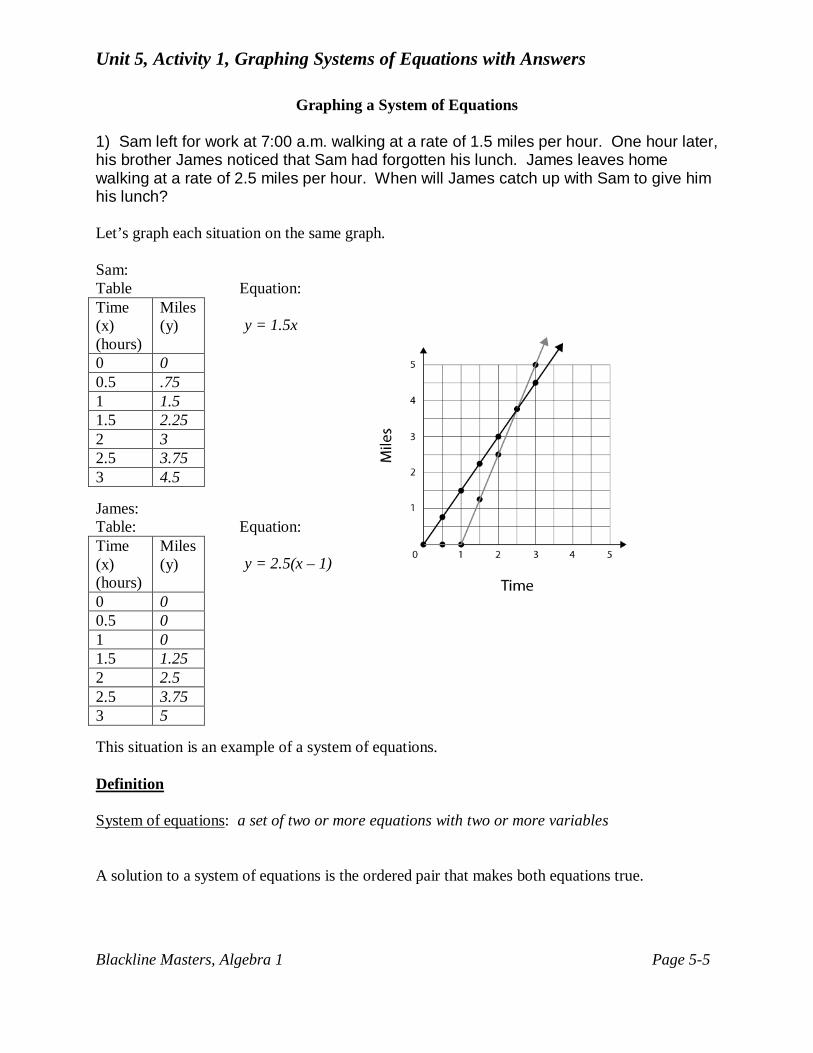
Unit 5, Activity 1, Graphing Systems of Equations with Answers
Blackline Masters, Algebra 1 Page 5-5
Graphing a System of Equations
1) Sam left for work at 7:00 a.m. walking at a rate of 1.5 miles per hour. One hour later, his brother James noticed that Sam had forgotten his lunch. James leaves home walking at a rate of 2.5 miles per hour. When will James catch up with Sam to give him his lunch? Let’s graph each situation on the same graph. Sam: Table Equation:
y = 1.5x
James: Table: Equation:
y = 2.5(x – 1)
This situation is an example of a system of equations. Definition System of equations: a set of two or more equations with two or more variables A solution to a system of equations is the ordered pair that makes both equations true.
Time (x) (hours)
Miles (y)
0 0 0.5 .75 1 1.5 1.5 2.25 2 3 2.5 3.75 3 4.5
Time (x) (hours)
Miles (y)
0 0 0.5 0 1 0 1.5 1.25 2 2.5 2.5 3.75 3 5
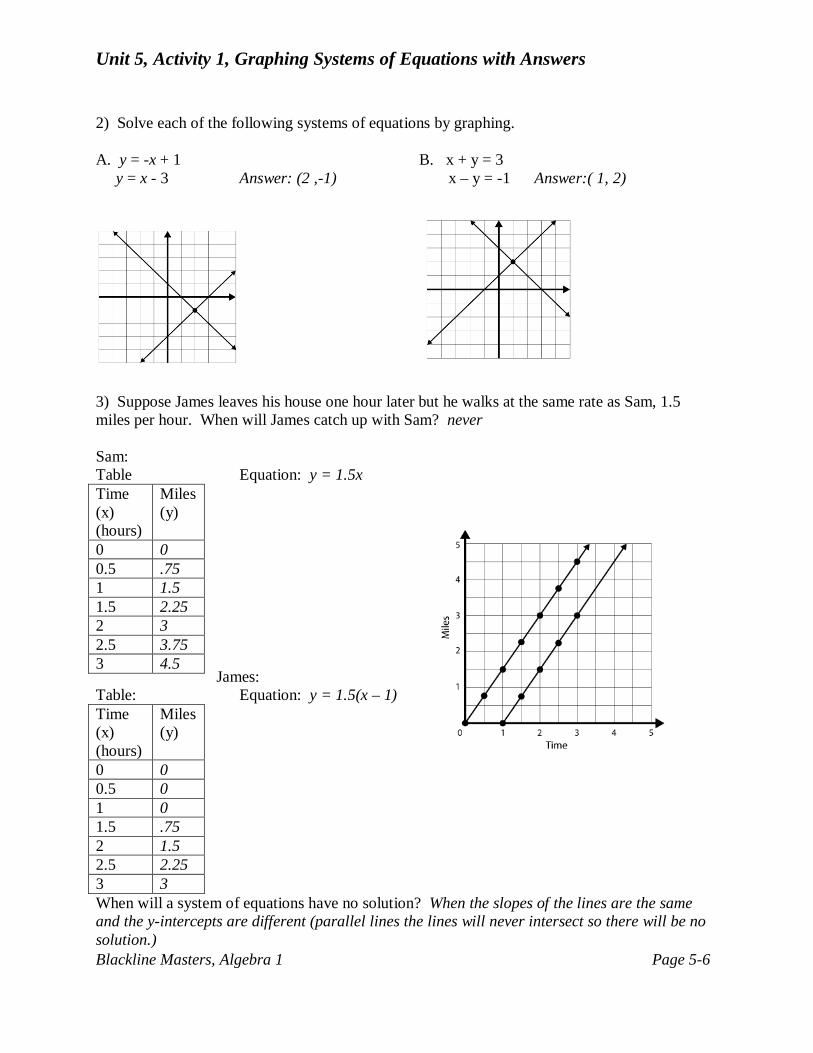
Unit 5, Activity 1, Graphing Systems of Equations with Answers
Blackline Masters, Algebra 1 Page 5-6
2) Solve each of the following systems of equations by graphing. A. y = -x + 1 B. x + y = 3 y = x - 3 Answer: (2 ,-1) x – y = -1 Answer:( 1, 2)
3) Suppose James leaves his house one hour later but he walks at the same rate as Sam, 1.5 miles per hour. When will James catch up with Sam? never Sam: Table Equation: y = 1.5x
James:
Table: Equation: y = 1.5(x – 1) Time (x) (hours)
Miles (y)
0 0 0.5 0 1 0 1.5 .75 2 1.5 2.5 2.25 3 3 When will a system of equations have no solution? When the slopes of the lines are the same and the y-intercepts are different (parallel lines the lines will never intersect so there will be no solution.)
Time (x) (hours)
Miles (y)
0 0 0.5 .75 1 1.5 1.5 2.25 2 3 2.5 3.75 3 4.5
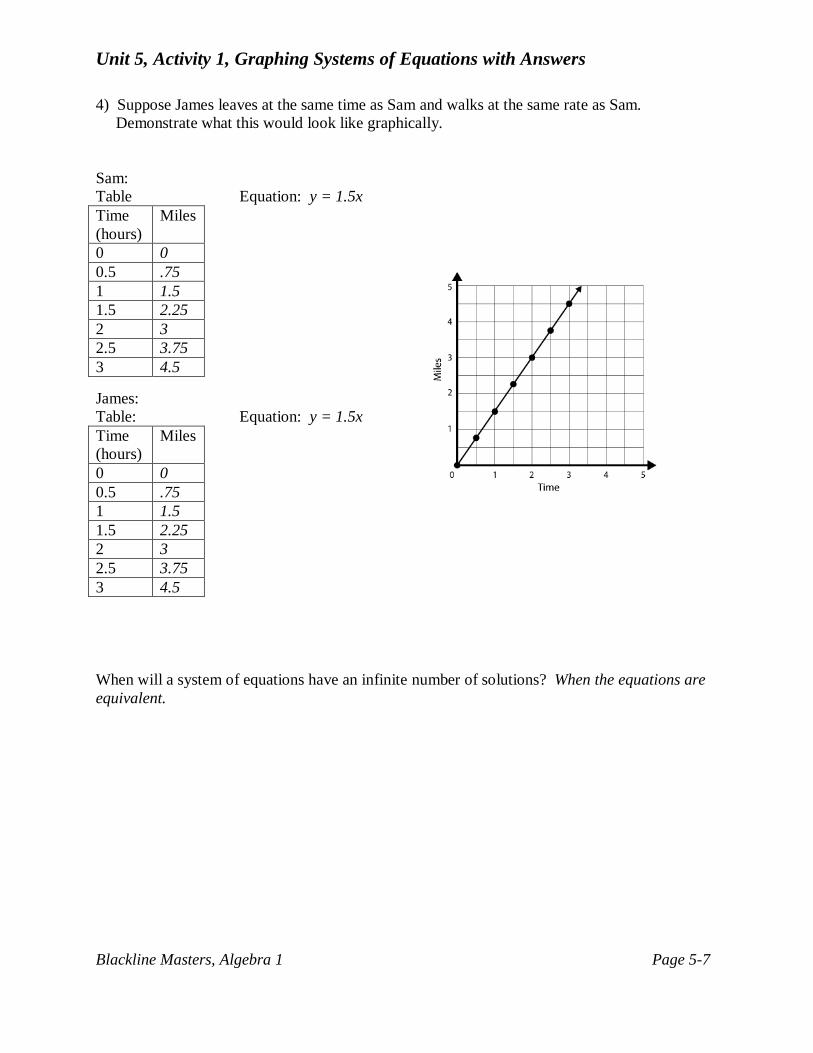
Unit 5, Activity 1, Graphing Systems of Equations with Answers
Blackline Masters, Algebra 1 Page 5-7
4) Suppose James leaves at the same time as Sam and walks at the same rate as Sam. Demonstrate what this would look like graphically. Sam: Table Equation: y = 1.5x
James: Table: Equation: y = 1.5x Time (hours)
Miles
0 0 0.5 .75 1 1.5 1.5 2.25 2 3 2.5 3.75 3 4.5 When will a system of equations have an infinite number of solutions? When the equations are equivalent.
Time (hours)
Miles
0 0 0.5 .75 1 1.5 1.5 2.25 2 3 2.5 3.75 3 4.5
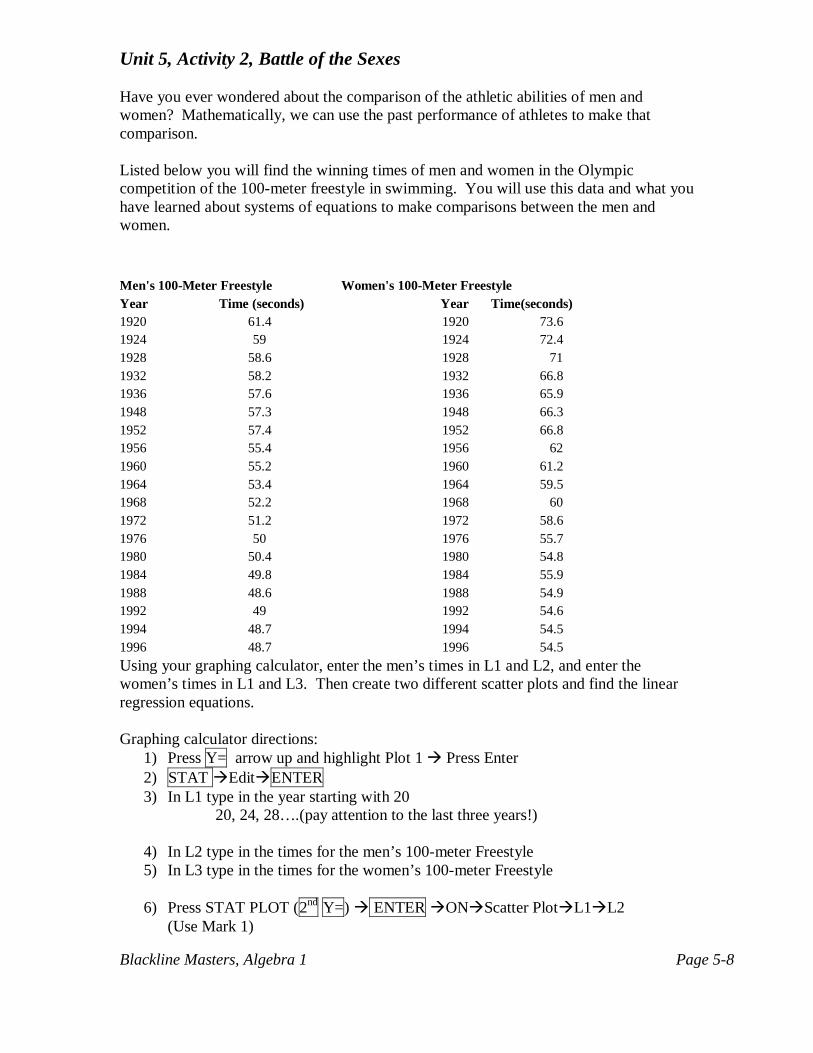
Unit 5, Activity 2, Battle of the Sexes
Blackline Masters, Algebra 1 Page 5-8
Have you ever wondered about the comparison of the athletic abilities of men and women? Mathematically, we can use the past performance of athletes to make that comparison. Listed below you will find the winning times of men and women in the Olympic competition of the 100-meter freestyle in swimming. You will use this data and what you have learned about systems of equations to make comparisons between the men and women.
Using your graphing calculator, enter the men’s times in L1 and L2, and enter the women’s times in L1 and L3. Then create two different scatter plots and find the linear regression equations. Graphing calculator directions:
1) Press Y= arrow up and highlight Plot 1 Press Enter 2) STAT EditENTER 3) In L1 type in the year starting with 20
20, 24, 28….(pay attention to the last three years!)
4) In L2 type in the times for the men’s 100-meter Freestyle 5) In L3 type in the times for the women’s 100-meter Freestyle
6) Press STAT PLOT (2nd Y=) ENTER ONScatter PlotL1L2
(Use Mark 1)
Men's 100-Meter Freestyle Women's 100-Meter Freestyle Year Time (seconds) Year Time(seconds) 1920 61.4 1920 73.6 1924 59 1924 72.4 1928 58.6 1928 71 1932 58.2 1932 66.8 1936 57.6 1936 65.9 1948 57.3 1948 66.3 1952 57.4 1952 66.8 1956 55.4 1956 62 1960 55.2 1960 61.2 1964 53.4 1964 59.5 1968 52.2 1968 60 1972 51.2 1972 58.6 1976 50 1976 55.7 1980 50.4 1980 54.8 1984 49.8 1984 55.9 1988 48.6 1988 54.9 1992 49 1992 54.6 1994 48.7 1994 54.5 1996 48.7 1996 54.5
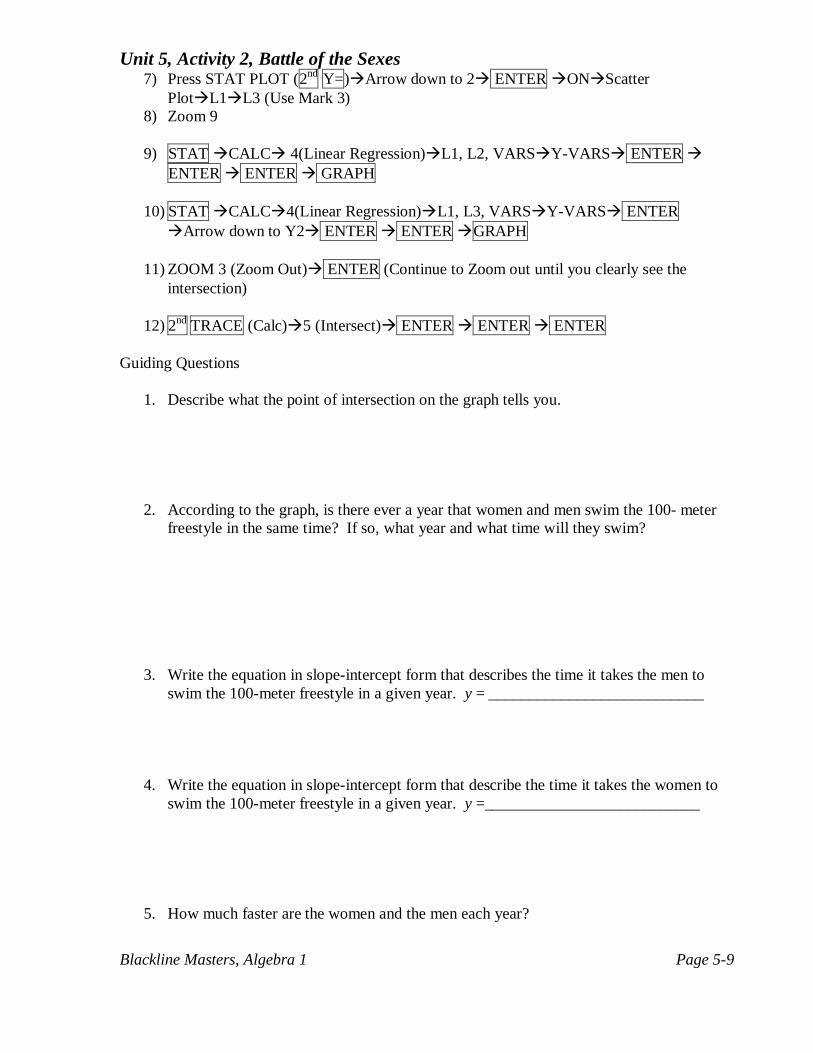
Unit 5, Activity 2, Battle of the Sexes
Blackline Masters, Algebra 1 Page 5-9
7) Press STAT PLOT (2nd Y=)Arrow down to 2 ENTER ONScatter PlotL1L3 (Use Mark 3)
8) Zoom 9
9) STAT CALC 4(Linear Regression)L1, L2, VARSY-VARS ENTER ENTER ENTER GRAPH
10) STAT CALC4(Linear Regression)L1, L3, VARSY-VARS ENTER Arrow down to Y2 ENTER ENTER GRAPH
11) ZOOM 3 (Zoom Out) ENTER (Continue to Zoom out until you clearly see the
intersection)
12) 2nd TRACE (Calc)5 (Intersect) ENTER ENTER ENTER Guiding Questions
1. Describe what the point of intersection on the graph tells you. 2. According to the graph, is there ever a year that women and men swim the 100- meter
freestyle in the same time? If so, what year and what time will they swim?
3. Write the equation in slope-intercept form that describes the time it takes the men to
swim the 100-meter freestyle in a given year. y = ___________________________ 4. Write the equation in slope-intercept form that describe the time it takes the women to
swim the 100-meter freestyle in a given year. y =___________________________
5. How much faster are the women and the men each year?
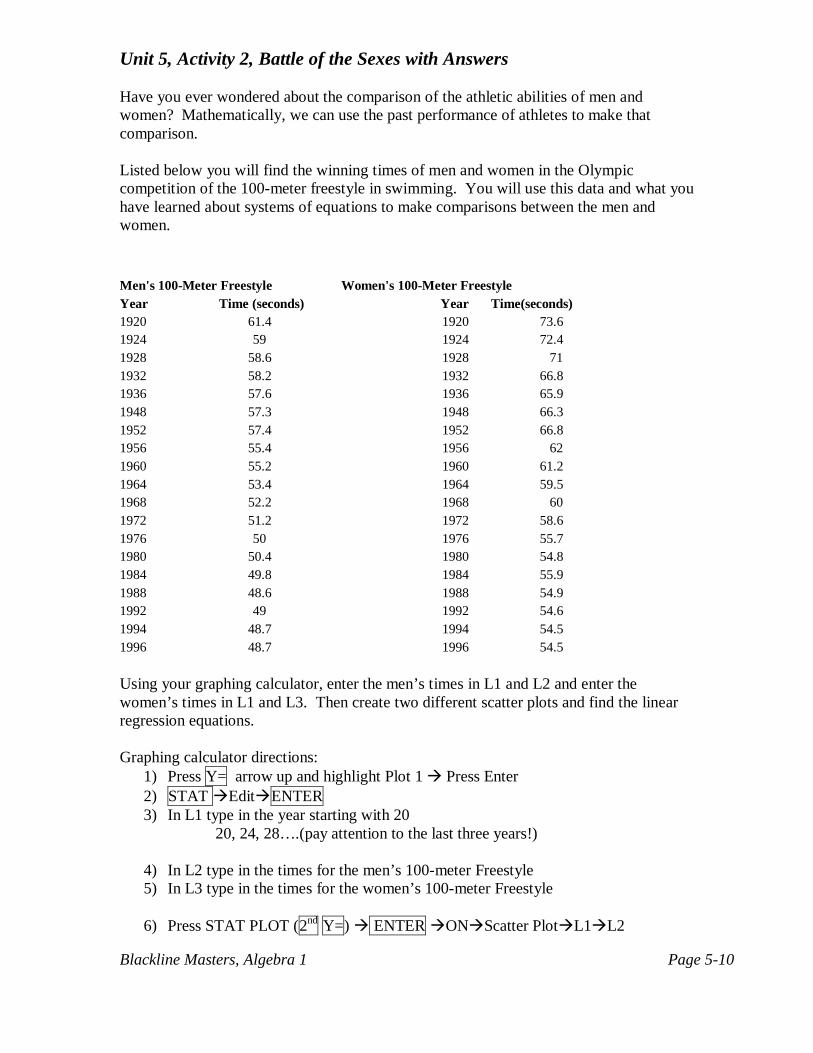
Unit 5, Activity 2, Battle of the Sexes with Answers
Blackline Masters, Algebra 1 Page 5-10
Have you ever wondered about the comparison of the athletic abilities of men and women? Mathematically, we can use the past performance of athletes to make that comparison. Listed below you will find the winning times of men and women in the Olympic competition of the 100-meter freestyle in swimming. You will use this data and what you have learned about systems of equations to make comparisons between the men and women.
Using your graphing calculator, enter the men’s times in L1 and L2 and enter the women’s times in L1 and L3. Then create two different scatter plots and find the linear regression equations. Graphing calculator directions:
1) Press Y= arrow up and highlight Plot 1 Press Enter 2) STAT EditENTER 3) In L1 type in the year starting with 20
20, 24, 28….(pay attention to the last three years!)
4) In L2 type in the times for the men’s 100-meter Freestyle 5) In L3 type in the times for the women’s 100-meter Freestyle
6) Press STAT PLOT (2nd Y=) ENTER ONScatter PlotL1L2
Men's 100-Meter Freestyle Women's 100-Meter Freestyle Year Time (seconds) Year Time(seconds) 1920 61.4 1920 73.6 1924 59 1924 72.4 1928 58.6 1928 71 1932 58.2 1932 66.8 1936 57.6 1936 65.9 1948 57.3 1948 66.3 1952 57.4 1952 66.8 1956 55.4 1956 62 1960 55.2 1960 61.2 1964 53.4 1964 59.5 1968 52.2 1968 60 1972 51.2 1972 58.6 1976 50 1976 55.7 1980 50.4 1980 54.8 1984 49.8 1984 55.9 1988 48.6 1988 54.9 1992 49 1992 54.6 1994 48.7 1994 54.5 1996 48.7 1996 54.5
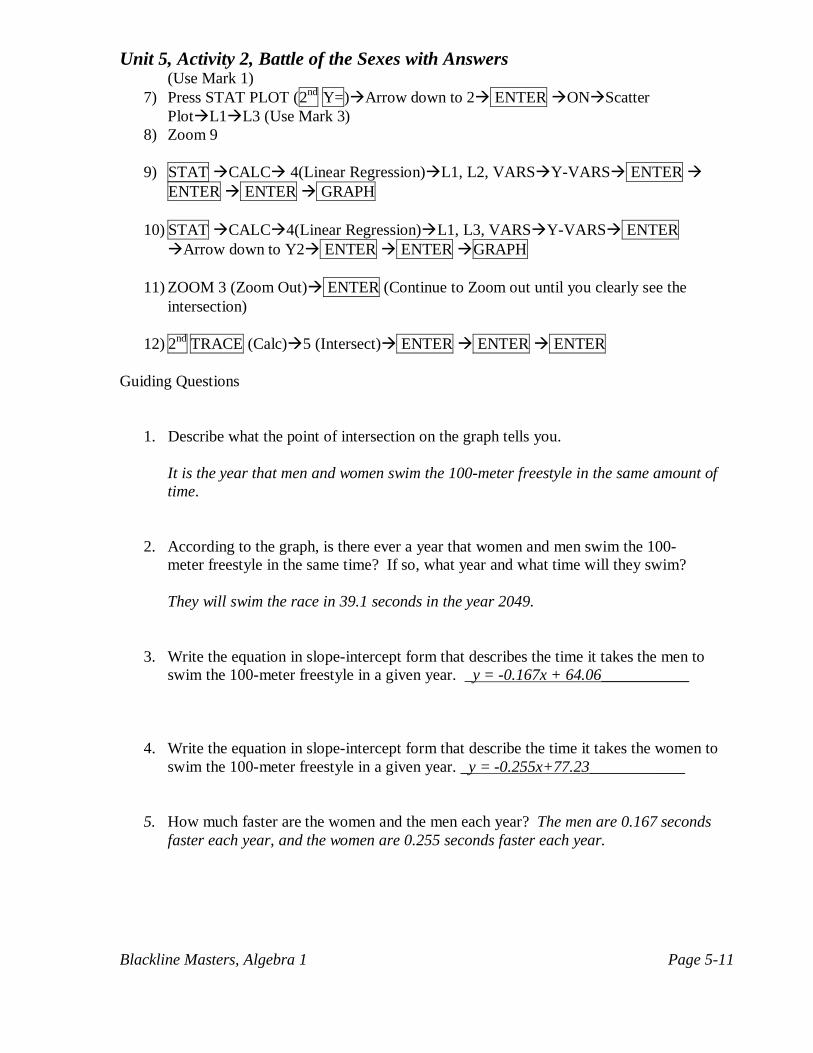
Unit 5, Activity 2, Battle of the Sexes with Answers
Blackline Masters, Algebra 1 Page 5-11
(Use Mark 1) 7) Press STAT PLOT (2nd Y=)Arrow down to 2 ENTER ONScatter
PlotL1L3 (Use Mark 3) 8) Zoom 9
9) STAT CALC 4(Linear Regression)L1, L2, VARSY-VARS ENTER
ENTER ENTER GRAPH
10) STAT CALC4(Linear Regression)L1, L3, VARSY-VARS ENTER Arrow down to Y2 ENTER ENTER GRAPH
11) ZOOM 3 (Zoom Out) ENTER (Continue to Zoom out until you clearly see the
intersection)
12) 2nd TRACE (Calc)5 (Intersect) ENTER ENTER ENTER Guiding Questions
1. Describe what the point of intersection on the graph tells you.
It is the year that men and women swim the 100-meter freestyle in the same amount of time.
2. According to the graph, is there ever a year that women and men swim the 100-
meter freestyle in the same time? If so, what year and what time will they swim?
They will swim the race in 39.1 seconds in the year 2049.
3. Write the equation in slope-intercept form that describes the time it takes the men to
swim the 100-meter freestyle in a given year. _y = -0.167x + 64.06___________ 4. Write the equation in slope-intercept form that describe the time it takes the women to
swim the 100-meter freestyle in a given year. _y = -0.255x+77.23____________ 5. How much faster are the women and the men each year? The men are 0.167 seconds
faster each year, and the women are 0.255 seconds faster each year.

Unit 5, Activity 8, Introduction to Matrices
Blackline Masters, Algebra 1 Page 5-12
The following charts give the electronic sales of A Plus Electronics for two store locations. Store A Store B Jan. Feb. Mar. Jan. Feb. Mar. Computers 55 26 42 Computers 30 22 35 DVD players
28 26 30 DVD players
12 24 15
Camcorders 32 25 20 Camcorders 20 21 15 TVs 34 45 37 TVs 32 33 14 Definition Matrix – 1) Arrange the store sales in two separate matrices. Definition Dimensions of a matrix – 2) Identify each of the following matrices using its dimensions.
[ ]2 6
87 0
6 103 8
-33 5
A B= C = 1 -9 64 67 D = 0-2
− = −
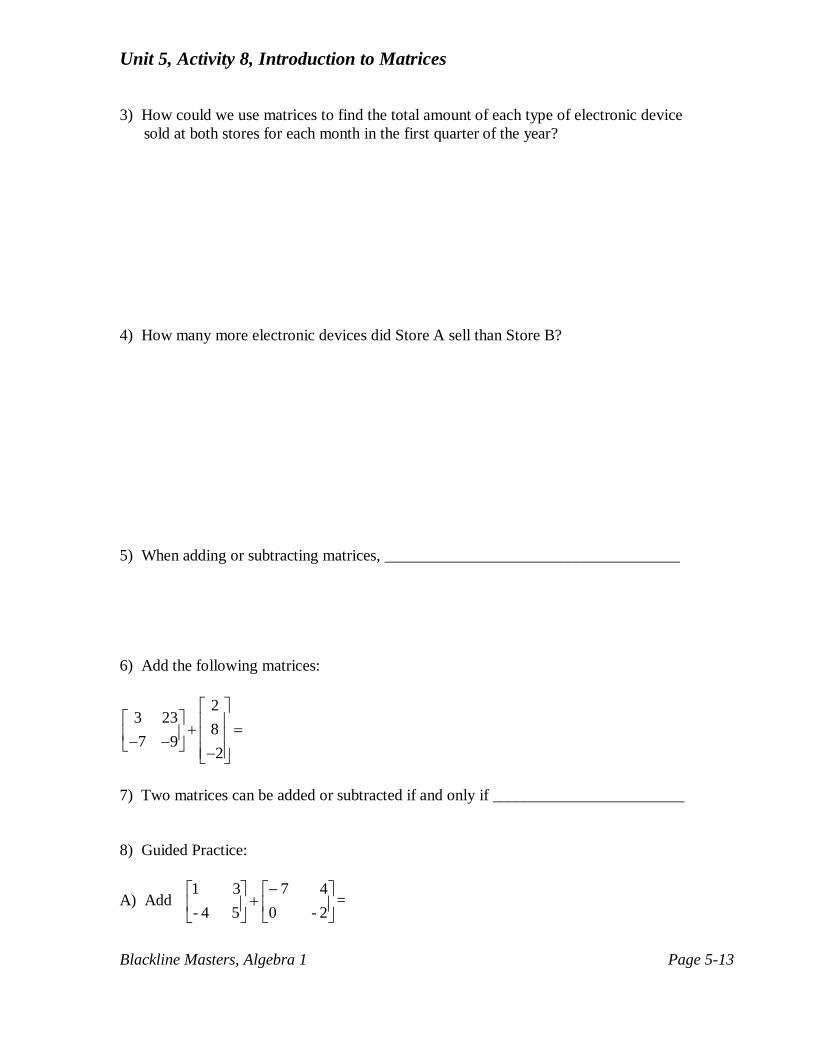
Unit 5, Activity 8, Introduction to Matrices
Blackline Masters, Algebra 1 Page 5-13
3) How could we use matrices to find the total amount of each type of electronic device sold at both stores for each month in the first quarter of the year? 4) How many more electronic devices did Store A sell than Store B? 5) When adding or subtracting matrices, _____________________________________ 6) Add the following matrices:
23 23
87 9
2
+ = − − −
7) Two matrices can be added or subtracted if and only if ________________________ 8) Guided Practice:
A) Add
−+
2- 04 7
5 4-3 1
=
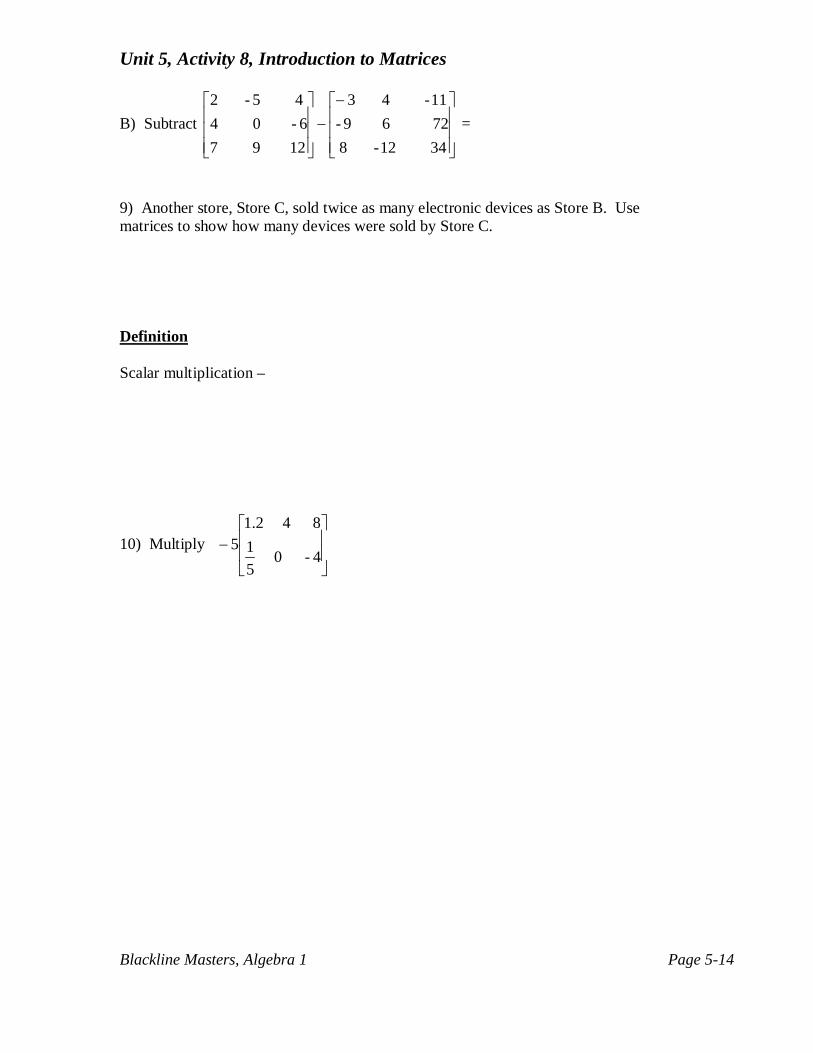
Unit 5, Activity 8, Introduction to Matrices
Blackline Masters, Algebra 1 Page 5-14
B) Subtract
−−
34 12- 8 72 6 9-11- 4 3
12 9 76- 0 4
4 5- 2 =
9) Another store, Store C, sold twice as many electronic devices as Store B. Use matrices to show how many devices were sold by Store C. Definition Scalar multiplication –
10) Multiply
−
4- 0 51
8 4 2.15
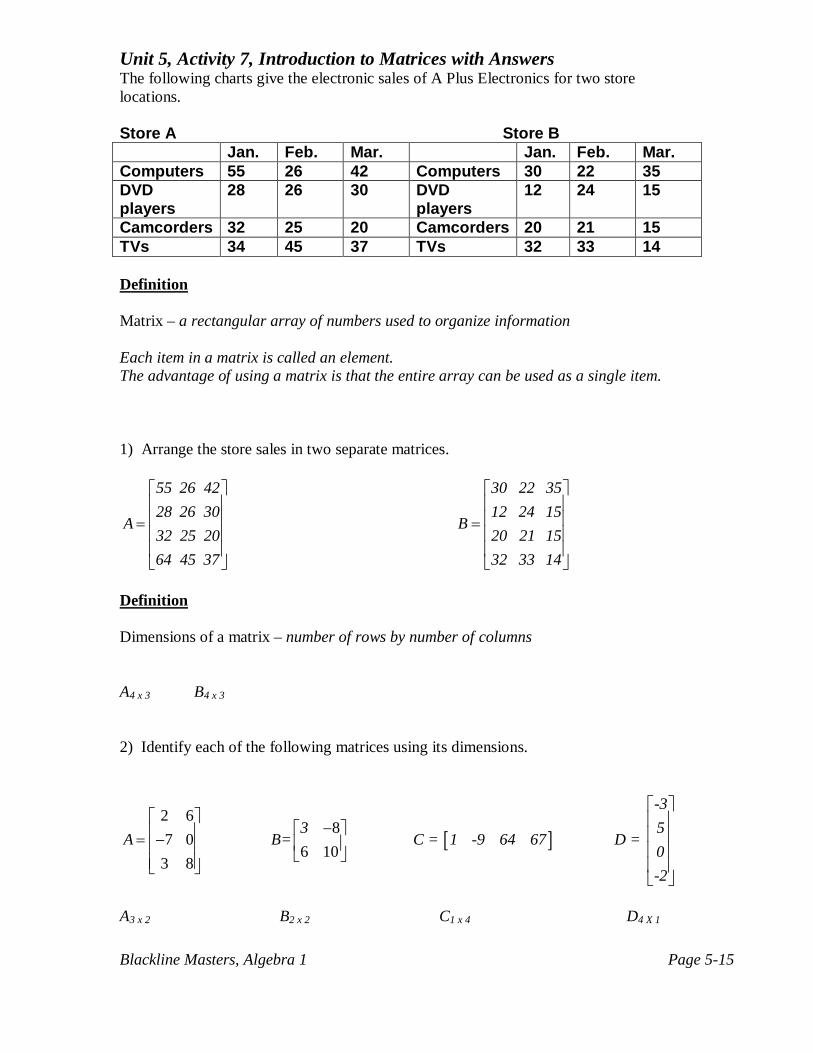
Unit 5, Activity 7, Introduction to Matrices with Answers
Blackline Masters, Algebra 1 Page 5-15
The following charts give the electronic sales of A Plus Electronics for two store locations. Store A Store B Jan. Feb. Mar. Jan. Feb. Mar. Computers 55 26 42 Computers 30 22 35 DVD players
28 26 30 DVD players
12 24 15
Camcorders 32 25 20 Camcorders 20 21 15 TVs 34 45 37 TVs 32 33 14 Definition Matrix – a rectangular array of numbers used to organize information Each item in a matrix is called an element. The advantage of using a matrix is that the entire array can be used as a single item. 1) Arrange the store sales in two separate matrices.
55 26 4228 26 30
A 32 25 2064 45 37
=
30 22 3512 24 15
B 20 21 1532 33 14
=
Definition Dimensions of a matrix – number of rows by number of columns A4 x 3 B4 x 3 2) Identify each of the following matrices using its dimensions.
[ ]2 6
87 0
6 103 8
-33 5
A B= C = 1 -9 64 67 D = 0-2
− = −
A3 x 2 B2 x 2 C1 x 4 D4 X 1
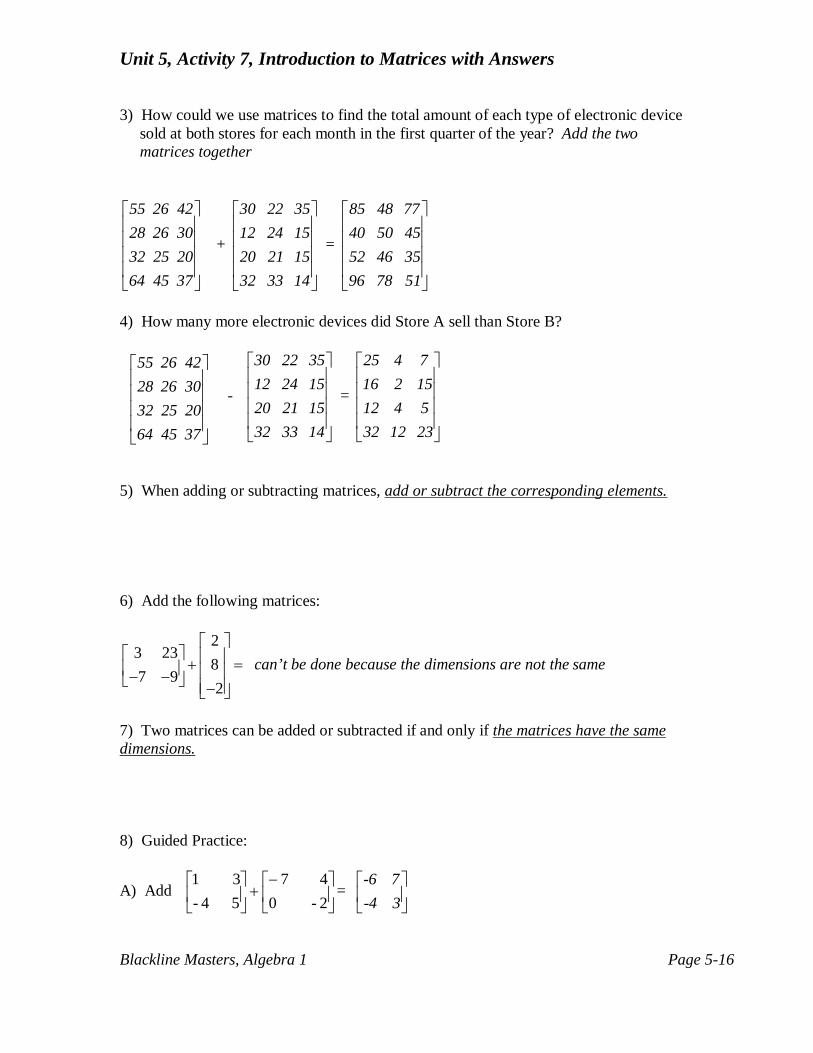
Unit 5, Activity 7, Introduction to Matrices with Answers
Blackline Masters, Algebra 1 Page 5-16
3) How could we use matrices to find the total amount of each type of electronic device sold at both stores for each month in the first quarter of the year? Add the two matrices together
+
30 22 3512 24 15
20 21 1532 33 14
=
85 48 7740 50 45
52 46 3596 78 51
4) How many more electronic devices did Store A sell than Store B?
-
30 22 3512 24 15
20 21 1532 33 14
=
25 4 716 2 15
12 4 532 12 23
5) When adding or subtracting matrices, add or subtract the corresponding elements. 6) Add the following matrices:
23 23
87 9
2
+ = − − −
can’t be done because the dimensions are not the same
7) Two matrices can be added or subtracted if and only if the matrices have the same dimensions. 8) Guided Practice:
A) Add
−+
2- 04 7
5 4-3 1
= -6 7-4 3
55 26 4228 26 30
32 25 2064 45 37
55 26 4228 26 30
32 25 2064 45 37

Unit 5, Activity 7, Introduction to Matrices with Answers
Blackline Masters, Algebra 1 Page 5-17
B) Subtract
−−
34 12- 8 72 6 9-11- 4 3
12 9 76- 0 4
4 5- 2 =
5 -9 1513 -6 -78-1 21 -22
9) Another store, Store C, sold twice as many electronic devices as Store B. Use matrices to show how many devices were sold by Store C.
30 22 35 60 44 7012 24 15 24 48 30
2 = 20 21 15 40 42 3032 33 14 64 66 28
Definition Scalar multiplication – multiplying a matrix by a number
10) Multiply 1 2 4 8
5 1 0 45
. -6 -20 -40
-1 0 20 -
− =
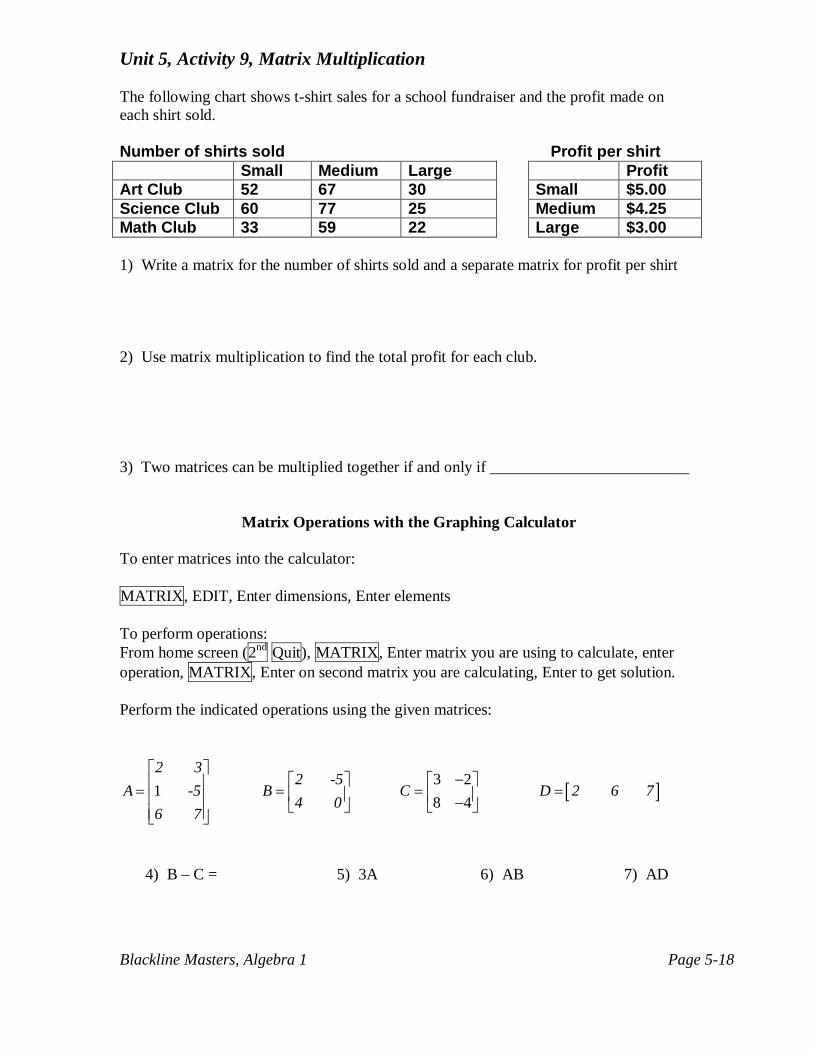
Unit 5, Activity 9, Matrix Multiplication
Blackline Masters, Algebra 1 Page 5-18
The following chart shows t-shirt sales for a school fundraiser and the profit made on each shirt sold. Number of shirts sold Profit per shirt Small Medium Large Profit Art Club 52 67 30 Small $5.00 Science Club 60 77 25 Medium $4.25 Math Club 33 59 22 Large $3.00 1) Write a matrix for the number of shirts sold and a separate matrix for profit per shirt
2) Use matrix multiplication to find the total profit for each club. 3) Two matrices can be multiplied together if and only if _________________________
Matrix Operations with the Graphing Calculator
To enter matrices into the calculator: MATRIX, EDIT, Enter dimensions, Enter elements To perform operations: From home screen (2nd Quit), MATRIX, Enter matrix you are using to calculate, enter operation, MATRIX, Enter on second matrix you are calculating, Enter to get solution. Perform the indicated operations using the given matrices:
[ ]3 21
8 4
2 32 -5
A -5 B C D 2 6 74 0
6 7
− = = = = −
4) B – C = 5) 3A 6) AB 7) AD

Unit 5, Activity 9, Matrix Multiplication with Answers
Blackline Masters, Algebra 1 Page 5-19
The following chart shows T-shirt sales for a school fundraiser and the profit made on each shirt sold. Number of shirts sold Profit per shirt Small Medium Large Profit Art Club 52 67 30 Small $5.00 Science Club
60 77 25 Medium $4.25
Math Club 33 59 22 Large $3.00 1) Write a matrix for the number of shirts sold and a separate matrix for profit per shirt
Number of shirts sold Profit per shirt
52 67 3060 77 2533 59 22
5
4.253
2) Use matrix multiplication to find the total profit for each club.
52 67 30 5 52(5)+67(4.25)+30(3) 634.7560 77 25 • 4.25 = 60(5)+77(4.25)+25(3) = 702.2533 59 22 3 33(5)+59(4.25)+22(3) 481.75
3) Two matrices can be multiplied together if and only if _their inner dimensions are equal.
Matrix Operations with the Graphing Calculator
To enter matrices into the calculator: MATRIX, EDIT, Enter dimensions, Enter elements To perform operations: From home screen (2nd Quit), MATRIX, Enter matrix you are using to calculate, enter operation, MATRIX, Enter on second matrix you are calculating, Enter to get solution.
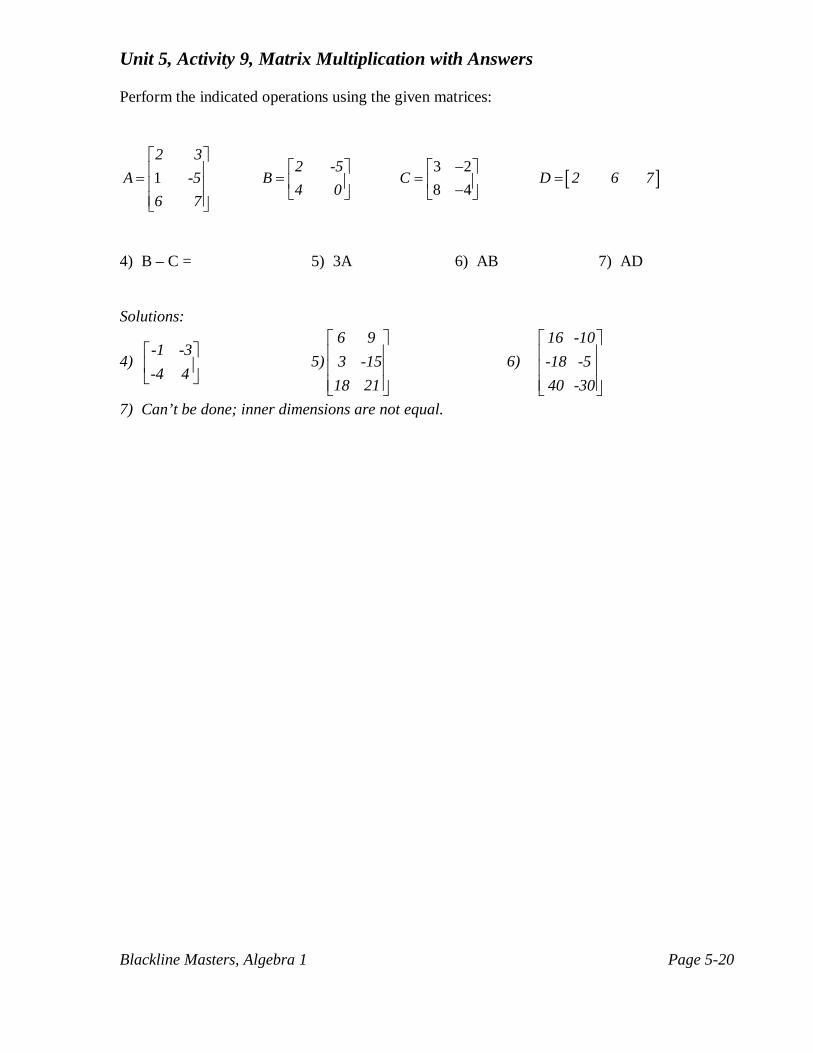
Unit 5, Activity 9, Matrix Multiplication with Answers
Blackline Masters, Algebra 1 Page 5-20
Perform the indicated operations using the given matrices:
[ ]3 21
8 4
2 32 -5
A -5 B C D 2 6 74 0
6 7
− = = = = −
4) B – C = 5) 3A 6) AB 7) AD Solutions:
4) -1 -3-4 4
5)6 93 -15
18 21
6) 16 -10-18 -540 -30
7) Can’t be done; inner dimensions are not equal.

Unit 5, Activity 10, Solving Systems of Equations Using Matrices
Blackline Masters, Algebra 1 Page 5-21
Multiply the following two matrices by hand.
1) 1 2
1 6xy
− =
2)
3 74 2
xy
− =
3) Given the following systems of equations, rewrite as a matrix multiplication equation.
5x – 4y = 23 7x + 8y = 5
This is what we have so far: [A]x = [B] 4) What would we do to solve for the unknown variable x? Instead of division, we will use A-1. To solve systems of equations using matrices: [A]-1[B] = x 5) Solve the systems of equation above using matrices. Try these: Solve using matrices. Write the matrices used. 6) 3x + 5y = 4 7) 2x – 2y = 4 8) x + y + z = 4 3x + 7y = 2 x + 3y = 1 x – 2y –z = 1 2x – y – 2z = -1
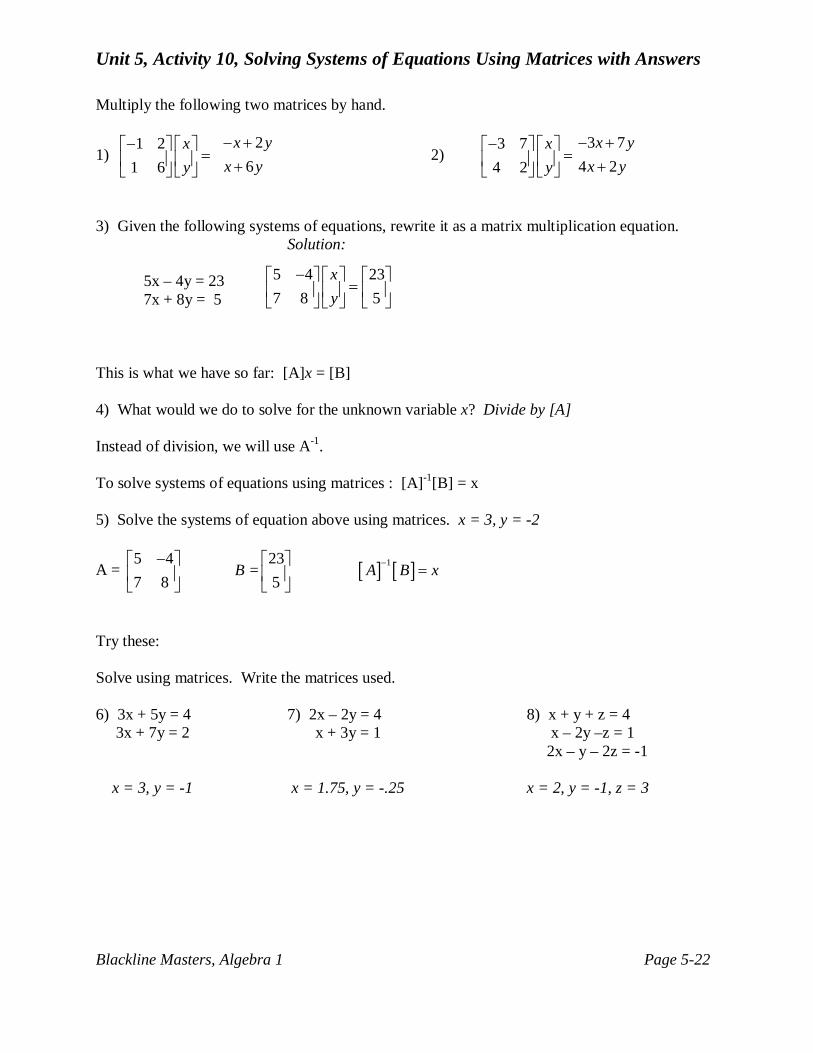
Unit 5, Activity 10, Solving Systems of Equations Using Matrices with Answers
Blackline Masters, Algebra 1 Page 5-22
Multiply the following two matrices by hand.
1) 1 2
1 6xy
− =
26
x yx y− ++
2) 3 7
4 2xy
− =
3 74 2
x yx y
− ++
3) Given the following systems of equations, rewrite it as a matrix multiplication equation. Solution:
5x – 4y = 23 7x + 8y = 5
This is what we have so far: [A]x = [B] 4) What would we do to solve for the unknown variable x? Divide by [A] Instead of division, we will use A-1. To solve systems of equations using matrices : [A]-1[B] = x 5) Solve the systems of equation above using matrices. x = 3, y = -2
A = [ ] [ ]15 4 237 8 5
B = A B x−− =
Try these: Solve using matrices. Write the matrices used. 6) 3x + 5y = 4 7) 2x – 2y = 4 8) x + y + z = 4 3x + 7y = 2 x + 3y = 1 x – 2y –z = 1 2x – y – 2z = -1 x = 3, y = -1 x = 1.75, y = -.25 x = 2, y = -1, z = 3
5 4 237 8 5
− =
xy
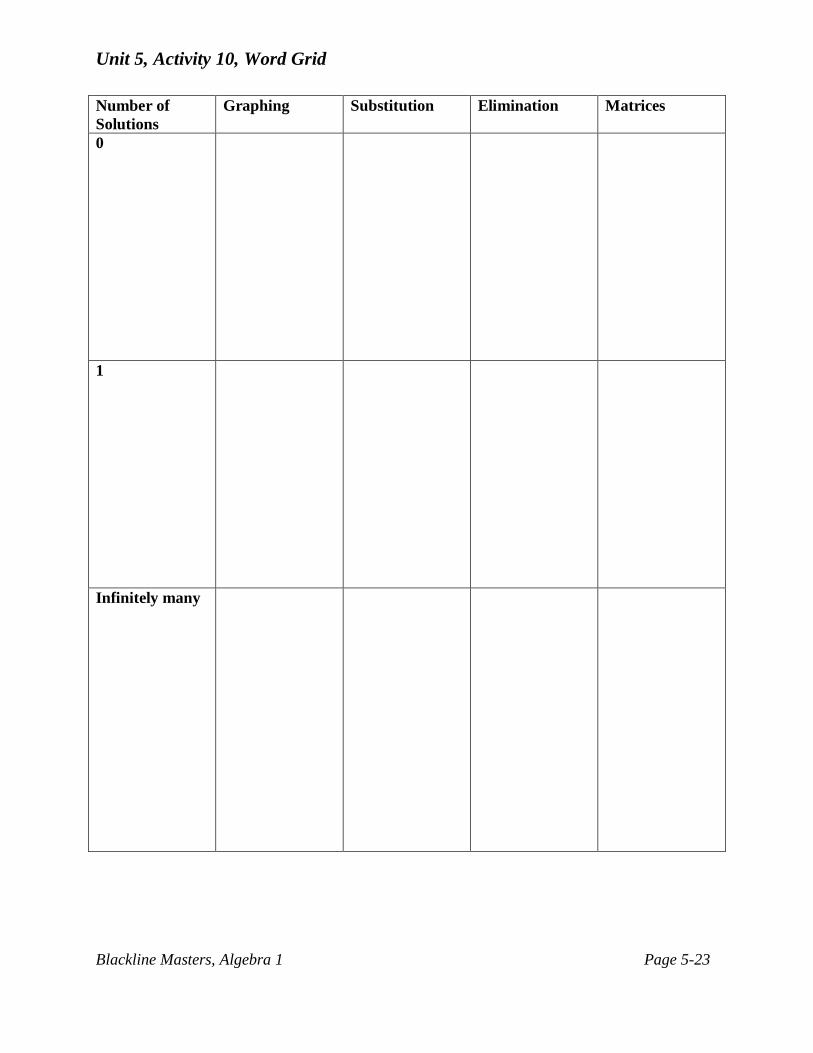
Unit 5, Activity 10, Word Grid
Blackline Masters, Algebra 1 Page 5-23
Number of Solutions
Graphing Substitution Elimination Matrices
0
1
Infinitely many

Unit 5, Activity 10, Word Grid with Answers
Blackline Masters, Algebra 1 Page 5-24
Number of Solutions
Graphing Substitution Elimination Matrices
0 Lines do not intersect (parallel)
All variables will cancel out and the result will be a false statement i.e., (3 = 4)
All variables will cancel out and the result will be a false statement i.e., (3 = 4)
Singular matrix error (use another method to determine number of solutions)
1 Lines intersect at a single point
Values can be found for both variables
Values can be found for both variables
Calculator gives answer in matrix form
Infinitely many
Lines are the same and lie on top of one another
All variables will cancel out and the result will be a true statement i.e., (0 = 0)
All variables will cancel out and the result will be a true statement i.e., (0 = 0)
Singular matrix error (use another method to determine number of solutions)
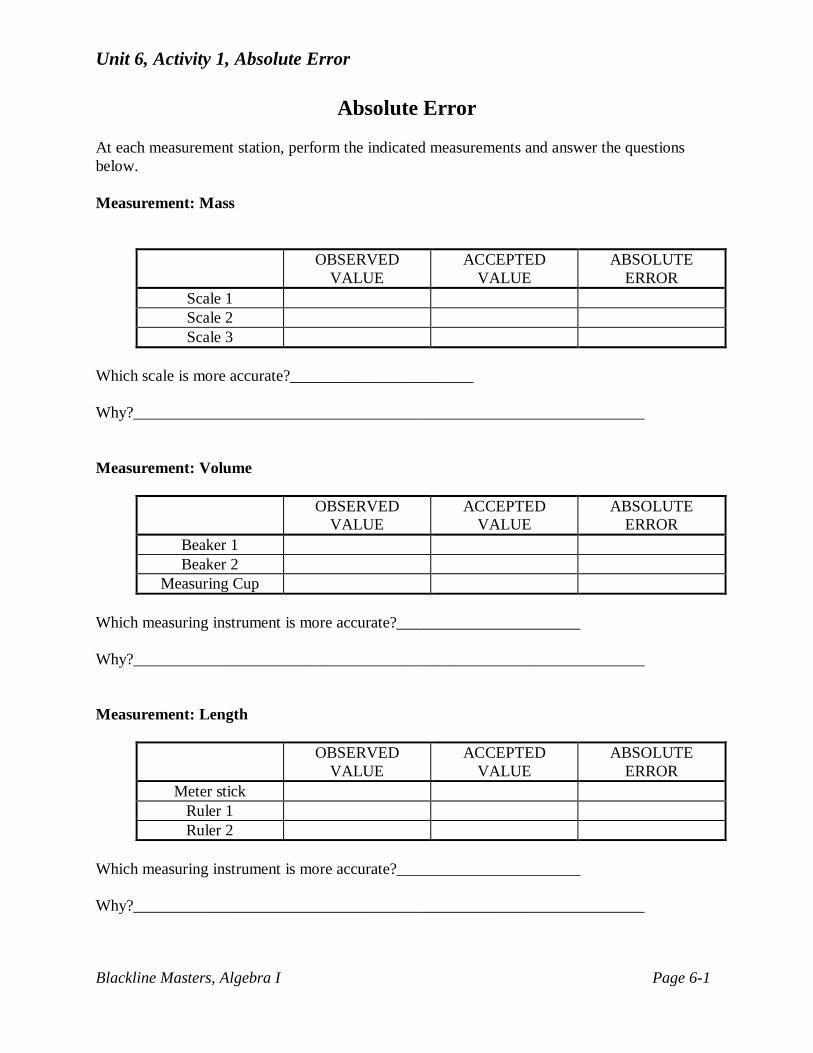
Unit 6, Activity 1, Absolute Error
Blackline Masters, Algebra I Page 6-1
Absolute Error At each measurement station, perform the indicated measurements and answer the questions below. Measurement: Mass
OBSERVED VALUE
ACCEPTED VALUE
ABSOLUTE ERROR
Scale 1 Scale 2 Scale 3
Which scale is more accurate?_______________________ Why?________________________________________________________________ Measurement: Volume
OBSERVED VALUE
ACCEPTED VALUE
ABSOLUTE ERROR
Beaker 1 Beaker 2
Measuring Cup Which measuring instrument is more accurate?_______________________ Why?________________________________________________________________ Measurement: Length
OBSERVED VALUE
ACCEPTED VALUE
ABSOLUTE ERROR
Meter stick Ruler 1 Ruler 2
Which measuring instrument is more accurate?_______________________ Why?________________________________________________________________
Unit 6, Activity 1, Absolute Error
Blackline Masters, Algebra I Page 6-2
Measurement: Time
OBSERVED VALUE
ACCEPTED VALUE
ABSOLUTE ERROR
Wrist watch Calculator Cell Phone
Which measuring instrument is more accurate?___________________________ Why?________________________________________________________________ Is it always possible to determine if a measuring instrument is accurate? Why or why not? Explain how to determine if a measuring instrument is accurate or not.
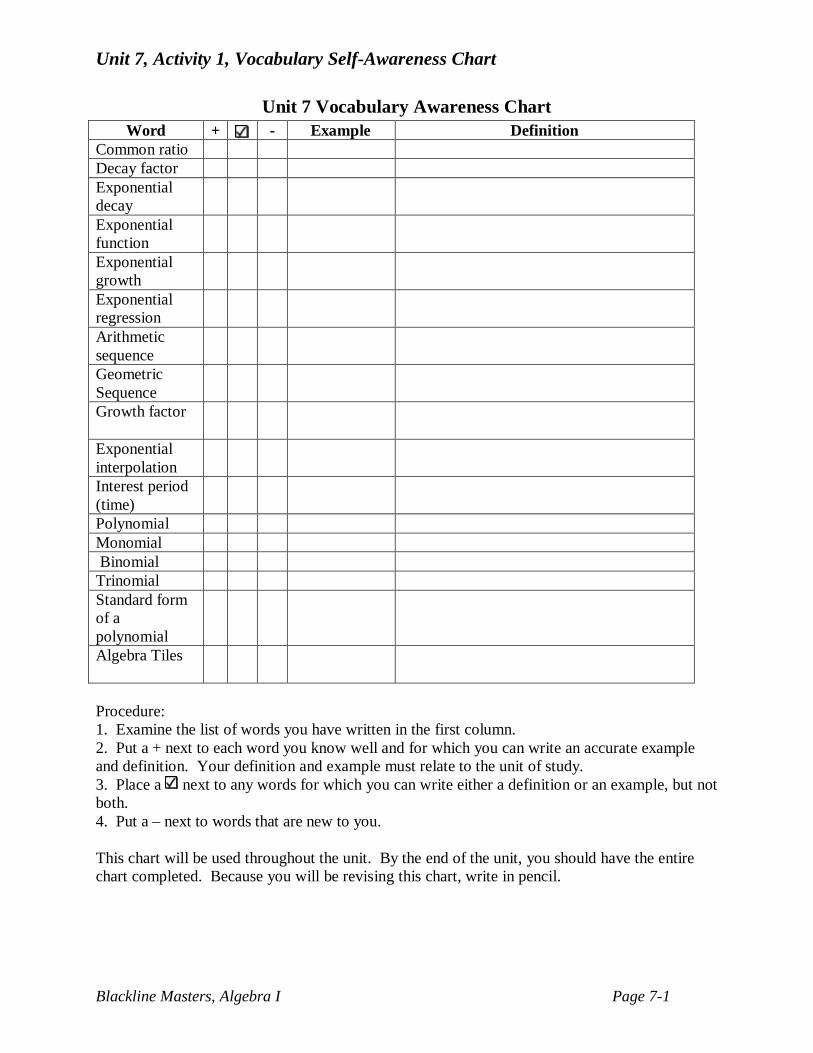
Unit 7, Activity 1, Vocabulary Self-Awareness Chart
Blackline Masters, Algebra I Page 7-1
Unit 7 Vocabulary Awareness Chart
Procedure: 1. Examine the list of words you have written in the first column. 2. Put a + next to each word you know well and for which you can write an accurate example and definition. Your definition and example must relate to the unit of study. 3. Place a next to any words for which you can write either a definition or an example, but not both. 4. Put a – next to words that are new to you. This chart will be used throughout the unit. By the end of the unit, you should have the entire chart completed. Because you will be revising this chart, write in pencil.
Word + - Example Definition Common ratio Decay factor Exponential decay
Exponential function
Exponential growth
Exponential regression
Arithmetic sequence
Geometric Sequence
Growth factor
Exponential interpolation
Interest period (time)
Polynomial Monomial Binomial Trinomial Standard form of a polynomial
Algebra Tiles
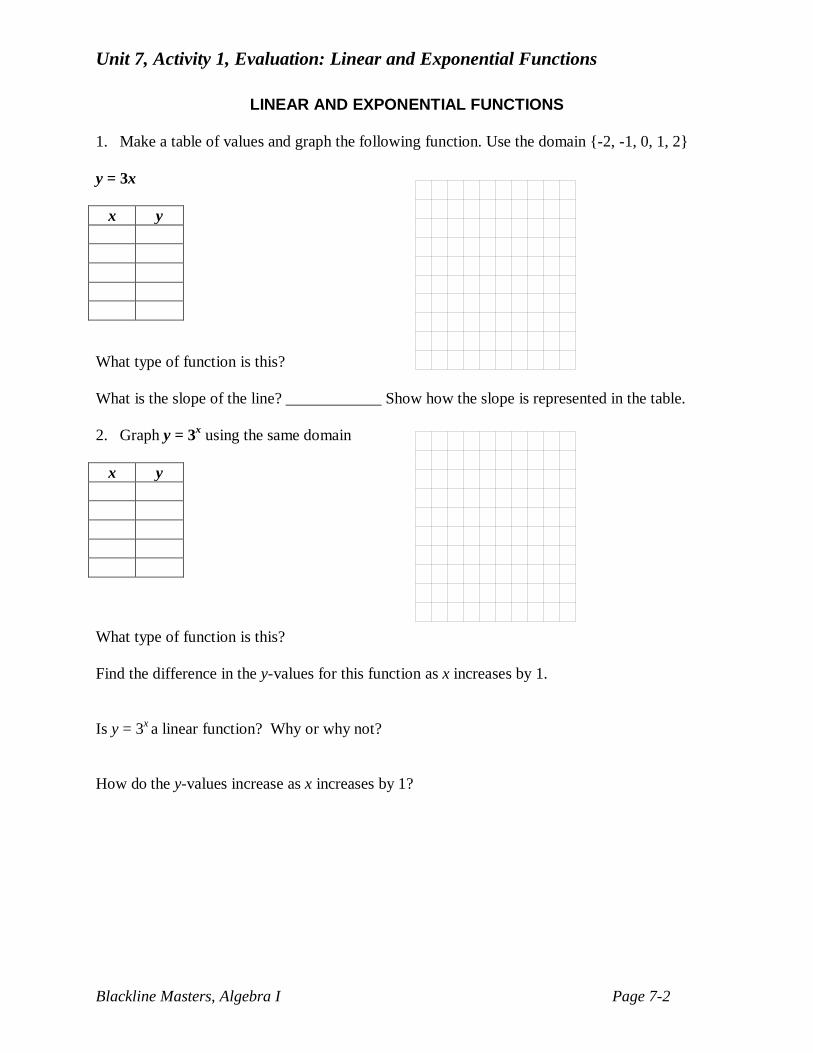
Unit 7, Activity 1, Evaluation: Linear and Exponential Functions
Blackline Masters, Algebra I Page 7-2
LINEAR AND EXPONENTIAL FUNCTIONS
1. Make a table of values and graph the following function. Use the domain {-2, -1, 0, 1, 2} y = 3x
What type of function is this? What is the slope of the line? ____________ Show how the slope is represented in the table. 2. Graph y = 3x using the same domain
What type of function is this? Find the difference in the y-values for this function as x increases by 1. Is y = 3x a linear function? Why or why not? How do the y-values increase as x increases by 1?
x y
x y

Unit 7, Activity 1, Evaluation: Linear and Exponential Functions
Blackline Masters, Algebra I Page 7-3
3. Compare the following functions by graphing on the graphing calculator. Use the table on the calculator to complete a table of values for each function.
a) y = 2x b) y = 3x c)y = 4x
4. What happens to the graph
as the base is increased? Show this using the table of values.
Graph y = 13
x
using the domain {-2, -1, 0, 1, 2}
x y
5. What is the difference between the graphs of the functions of y = 3x and y = 13
x
?
6. In the function y = 3x, as the x values increase, what happens to the y values?
7. In the function, y = 13
x
, as the x values increase, what happens to the y values?
8. y = bx is an example of an ___________________________________ function. Why?
9. y = b-x or 1b
xFHGIKJ is an example of an ________________________________function. Why?
x y
x Y
x y
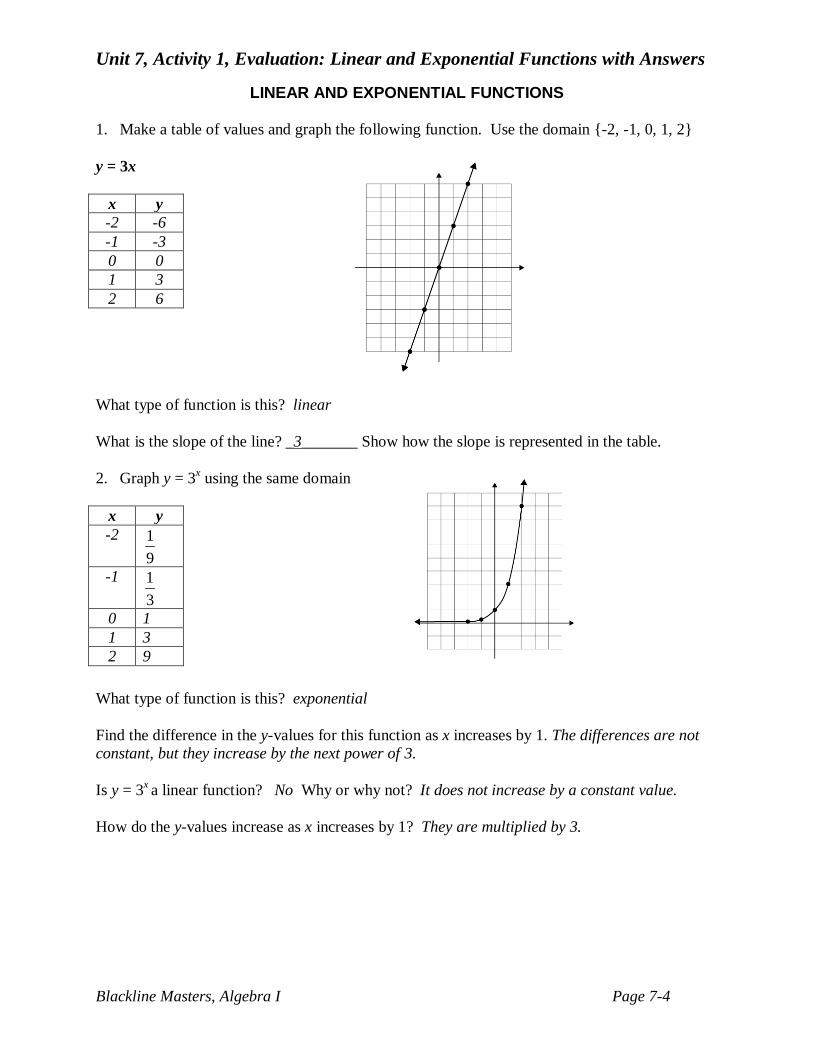
Unit 7, Activity 1, Evaluation: Linear and Exponential Functions with Answers
Blackline Masters, Algebra I Page 7-4
LINEAR AND EXPONENTIAL FUNCTIONS 1. Make a table of values and graph the following function. Use the domain {-2, -1, 0, 1, 2} y = 3x
What type of function is this? linear What is the slope of the line? _3_______ Show how the slope is represented in the table. 2. Graph y = 3x using the same domain
What type of function is this? exponential Find the difference in the y-values for this function as x increases by 1. The differences are not constant, but they increase by the next power of 3. Is y = 3x a linear function? No Why or why not? It does not increase by a constant value. How do the y-values increase as x increases by 1? They are multiplied by 3.
x y -2 -6 -1 -3 0 0 1 3 2 6
x y -2 1
9
-1 13
0 1 1 3 2 9
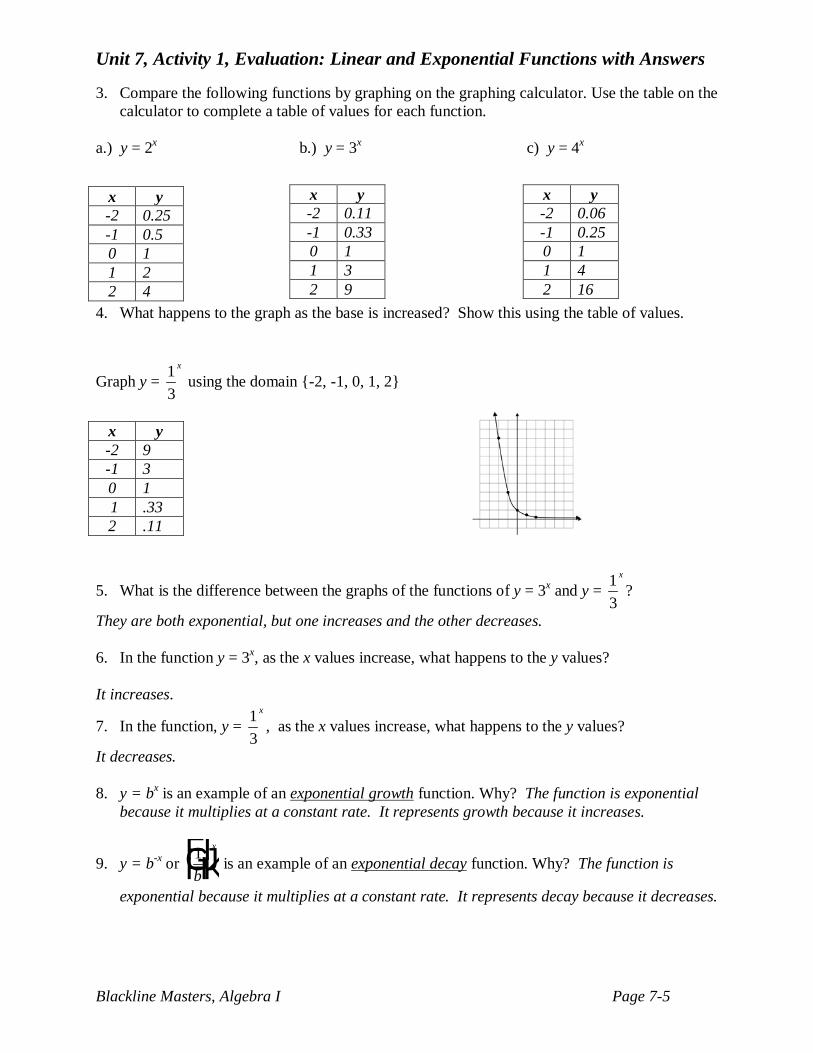
Unit 7, Activity 1, Evaluation: Linear and Exponential Functions with Answers
Blackline Masters, Algebra I Page 7-5
3. Compare the following functions by graphing on the graphing calculator. Use the table on the calculator to complete a table of values for each function.
a.) y = 2x b.) y = 3x c) y = 4x
4. What happens to the graph as the base is increased? Show this using the table of values.
Graph y = 13
x
using the domain {-2, -1, 0, 1, 2}
5. What is the difference between the graphs of the functions of y = 3x and y = 13
x
?
They are both exponential, but one increases and the other decreases. 6. In the function y = 3x, as the x values increase, what happens to the y values? It increases.
7. In the function, y = 13
x
, as the x values increase, what happens to the y values?
It decreases. 8. y = bx is an example of an exponential growth function. Why? The function is exponential
because it multiplies at a constant rate. It represents growth because it increases.
9. y = b-x or 1b
xFHGIKJ is an example of an exponential decay function. Why? The function is
exponential because it multiplies at a constant rate. It represents decay because it decreases.
x y -2 0.25 -1 0.5 0 1 1 2 2 4
x y -2 0.11 -1 0.33 0 1 1 3 2 9
x y -2 0.06 -1 0.25 0 1 1 4 2 16
x y -2 9 -1 3 0 1 1 .33 2 .11
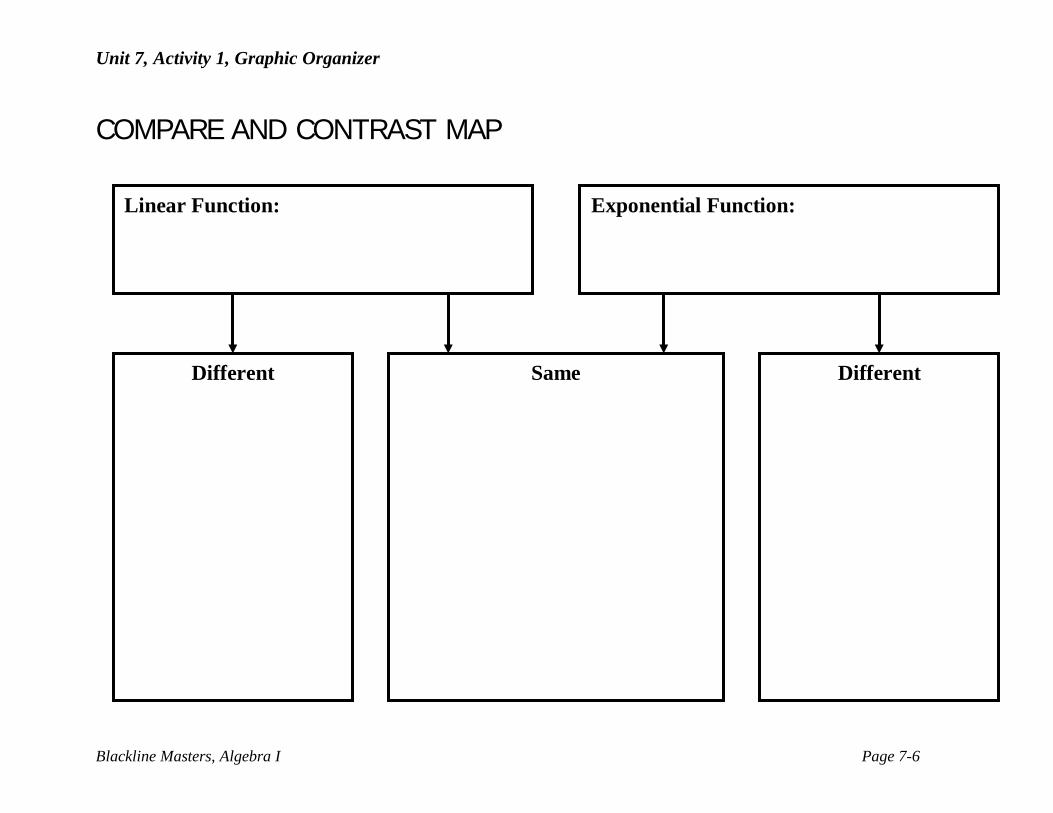
Unit 7, Activity 1, Graphic Organizer
Blackline Masters, Algebra I Page 7-6
COMPARE AND CONTRAST MAP
Linear Function: Exponential Function:
Different Different Same
Unit 7, Activity 2, Chessboard
Blackline Masters, Algebra I Page 7-7
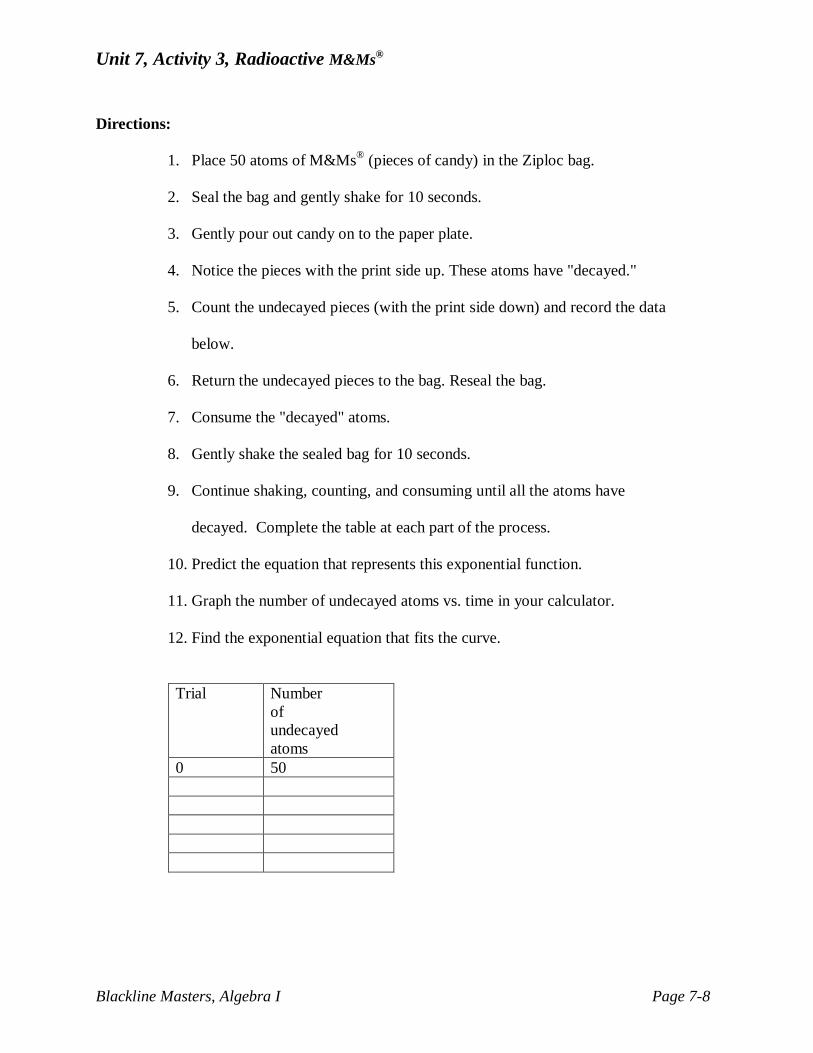
Unit 7, Activity 3, Radioactive M&Ms®
Blackline Masters, Algebra I Page 7-8
Directions:
1. Place 50 atoms of M&Ms® (pieces of candy) in the Ziploc bag.
2. Seal the bag and gently shake for 10 seconds.
3. Gently pour out candy on to the paper plate.
4. Notice the pieces with the print side up. These atoms have "decayed."
5. Count the undecayed pieces (with the print side down) and record the data
below.
6. Return the undecayed pieces to the bag. Reseal the bag.
7. Consume the "decayed" atoms.
8. Gently shake the sealed bag for 10 seconds.
9. Continue shaking, counting, and consuming until all the atoms have
decayed. Complete the table at each part of the process.
10. Predict the equation that represents this exponential function.
11. Graph the number of undecayed atoms vs. time in your calculator.
12. Find the exponential equation that fits the curve.
Trial Number of undecayed atoms
0 50
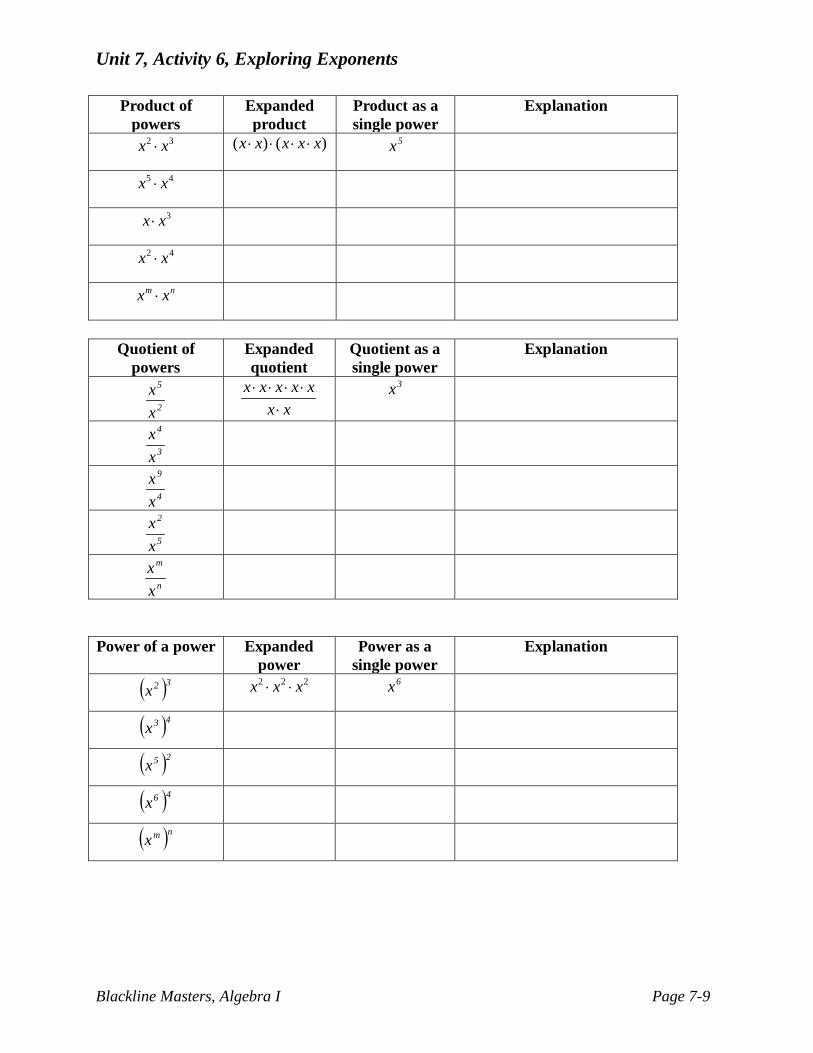
Unit 7, Activity 6, Exploring Exponents
Blackline Masters, Algebra I Page 7-9
Product of powers
Expanded product
Product as a single power
Explanation
2 3x x⋅ ( ) ( )x x x x x⋅ ⋅ ⋅ ⋅ 5x
5 4x x⋅
3x x⋅
2 4x x⋅
m nx x⋅
Quotient of
powers Expanded quotient
Quotient as a single power
Explanation
2
5
xx
x x x x xx x
⋅ ⋅ ⋅ ⋅⋅
3x
3
4
xx
4
9
xx
5
2
xx
n
m
xx
Power of a power Expanded
power Power as a
single power Explanation
( )32x 2 2 2x x x⋅ ⋅ 6x
( )43x
( )25x
( )46x
( )nmx
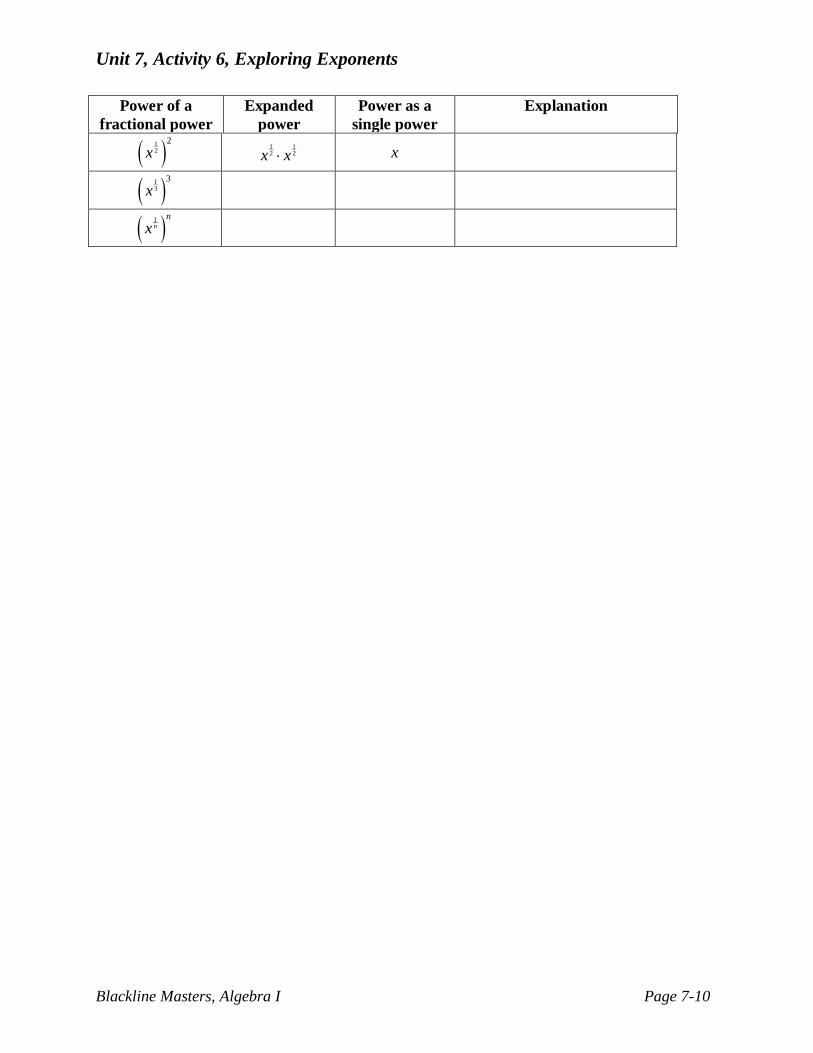
Unit 7, Activity 6, Exploring Exponents
Blackline Masters, Algebra I Page 7-10
Power of a fractional power
Expanded power
Power as a single power
Explanation
( )12
2x 1 1
2 2x x⋅ x
( )13
3x
( )1n
nx
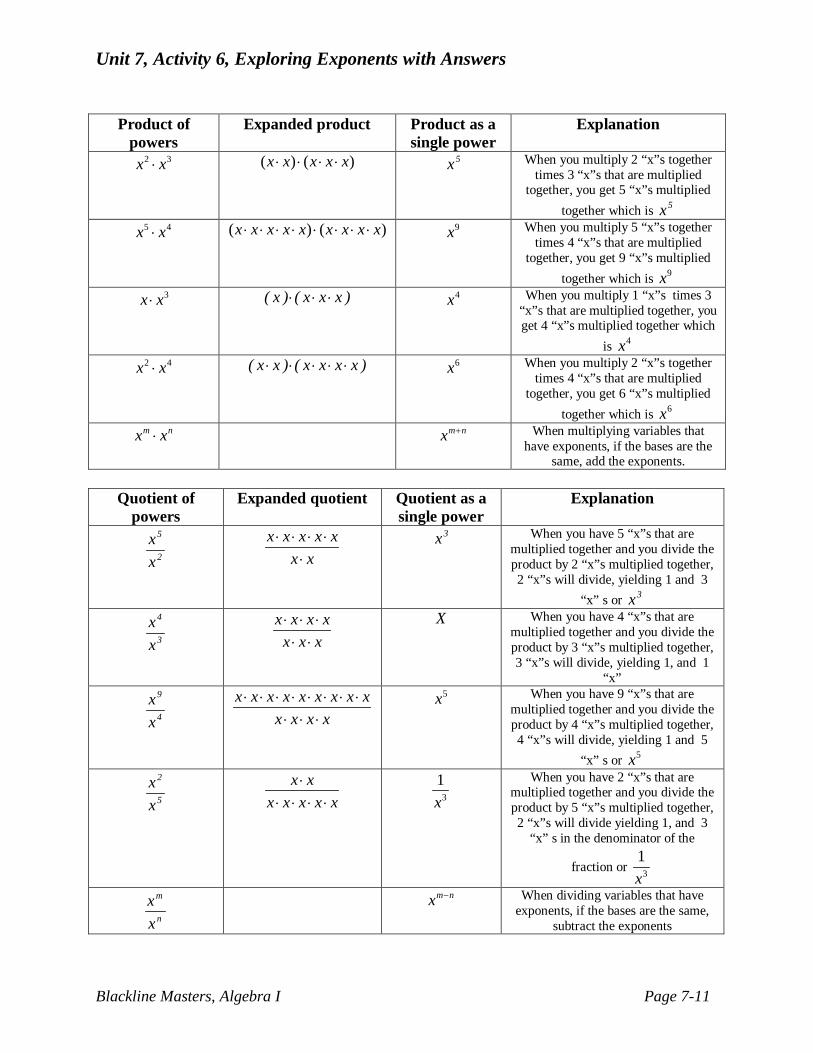
Unit 7, Activity 6, Exploring Exponents with Answers
Blackline Masters, Algebra I Page 7-11
Product of
powers Expanded product Product as a
single power Explanation
2 3x x⋅ ( ) ( )x x x x x⋅ ⋅ ⋅ ⋅ 5x When you multiply 2 “x”s together times 3 “x”s that are multiplied
together, you get 5 “x”s multiplied together which is 5x
5 4x x⋅ ( ) ( )x x x x x x x x x⋅ ⋅ ⋅ ⋅ ⋅ ⋅ ⋅ ⋅ 9x When you multiply 5 “x”s together times 4 “x”s that are multiplied
together, you get 9 “x”s multiplied together which is 9x
3x x⋅ ( x ) ( x x x )⋅ ⋅ ⋅ 4x When you multiply 1 “x”s times 3 “x”s that are multiplied together, you get 4 “x”s multiplied together which
is 4x 2 4x x⋅ ( x x ) ( x x x x )⋅ ⋅ ⋅ ⋅ ⋅ 6x When you multiply 2 “x”s together
times 4 “x”s that are multiplied together, you get 6 “x”s multiplied
together which is 6x m nx x⋅ m nx + When multiplying variables that
have exponents, if the bases are the same, add the exponents.
Quotient of
powers Expanded quotient Quotient as a
single power Explanation
2
5
xx
x x x x xx x
⋅ ⋅ ⋅ ⋅⋅
3x
When you have 5 “x”s that are
multiplied together and you divide the product by 2 “x”s multiplied together, 2 “x”s will divide, yielding 1 and 3
“x” s or 3x
3
4
xx
x x x xx x x⋅ ⋅ ⋅⋅ ⋅
X When you have 4 “x”s that are
multiplied together and you divide the product by 3 “x”s multiplied together, 3 “x”s will divide, yielding 1, and 1
“x”
4
9
xx
x x x x x x x x xx x x x
⋅ ⋅ ⋅ ⋅ ⋅ ⋅ ⋅ ⋅⋅ ⋅ ⋅
5x When you have 9 “x”s that are
multiplied together and you divide the product by 4 “x”s multiplied together, 4 “x”s will divide, yielding 1 and 5
“x” s or 5x
5
2
xx
x xx x x x x
⋅⋅ ⋅ ⋅ ⋅
3
1x
When you have 2 “x”s that are
multiplied together and you divide the product by 5 “x”s multiplied together, 2 “x”s will divide yielding 1, and 3
“x” s in the denominator of the
fraction or 3
1x
n
m
xx
m nx − When dividing variables that have exponents, if the bases are the same,
subtract the exponents
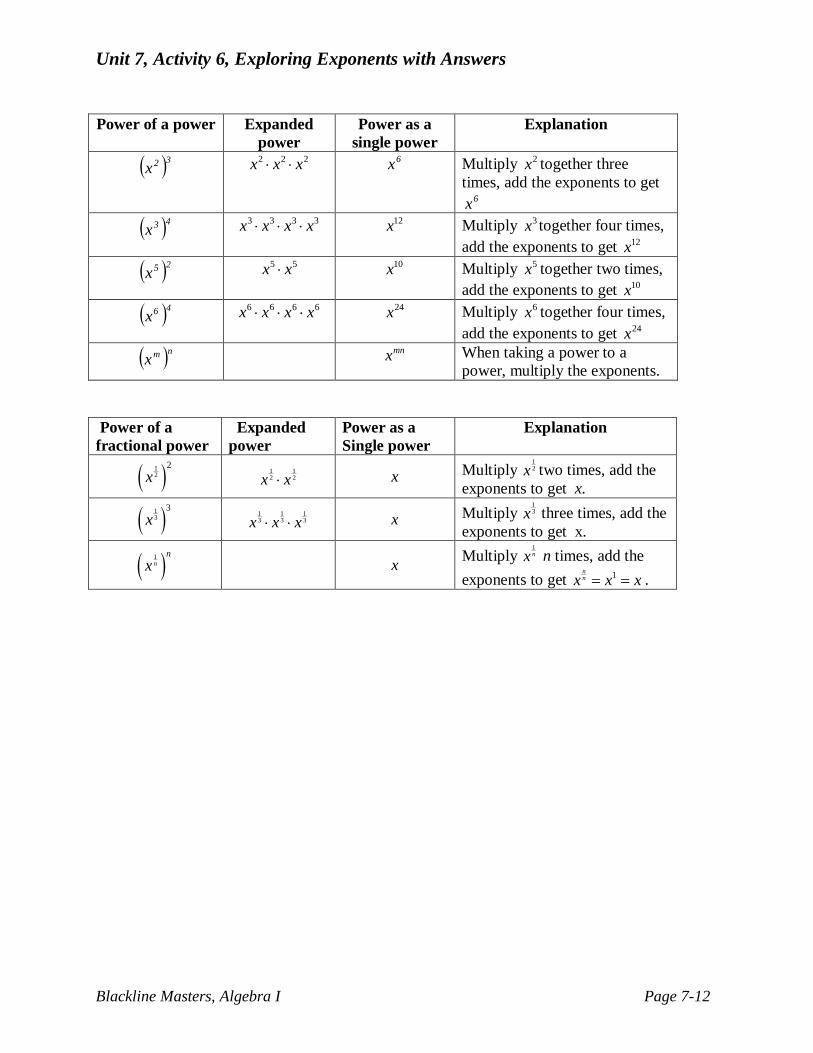
Unit 7, Activity 6, Exploring Exponents with Answers
Blackline Masters, Algebra I Page 7-12
Power of a power Expanded
power Power as a
single power Explanation
( )32x 2 2 2x x x⋅ ⋅ 6x Multiply 2x together three
times, add the exponents to get 6x
( )43x 3 3 3 3x x x x⋅ ⋅ ⋅ 12x Multiply 3x together four times,
add the exponents to get 12x ( )25x
5 5x x⋅ 10x Multiply 5x together two times, add the exponents to get 10x
( )46x 6 6 6 6x x x x⋅ ⋅ ⋅ 24x Multiply 6x together four times,
add the exponents to get 24x ( )nmx mnx When taking a power to a
power, multiply the exponents. Power of a fractional power
Expanded power
Power as a Single power
Explanation
( )12
2x 1 1
2 2x x⋅ x Multiply 12x two times, add the
exponents to get x.
( )13
3x 1 1 1
3 3 3x x x⋅ ⋅ x Multiply 13x three times, add the
exponents to get x.
( )1n
nx x Multiply 1
nx n times, add the exponents to get 1n
nx x x= = .
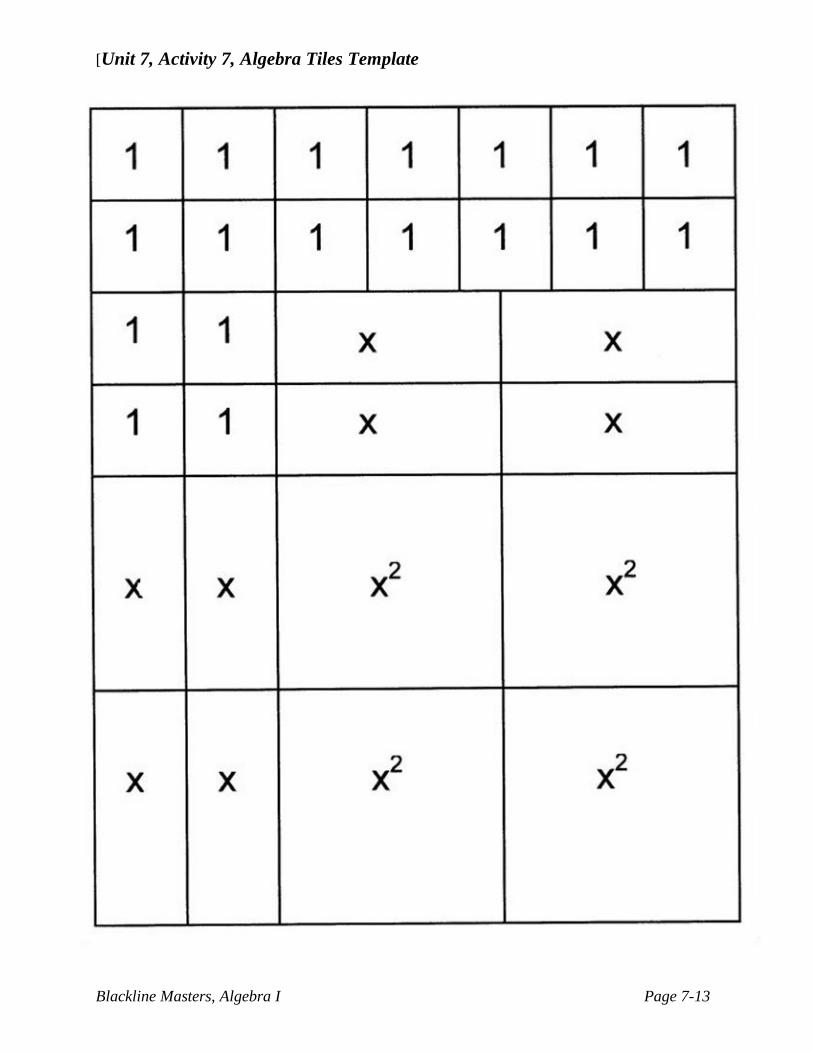
[Unit 7, Activity 7, Algebra Tiles Template
Blackline Masters, Algebra I Page 7-13

Unit 7, Activity 8, Arithmetic and Geometric Sequences
Blackline Masters, Algebra I Page 7-14
Read the following passages and provide the solutions to the problems below each passage. 1. Two types of number sequences are represented in this activity-arithmetic sequences and geometric sequences. When the terms of a sequence are based on adding a fixed number to each previous term, the pattern is known as an arithmetic sequence. The fixed number is called the common difference. Examples: Look at the pattern of -7, -3, 1, 5. What is the common difference between each of the terms? The common difference is +4. So to find the next term in the sequence, you would add 4 to 5 to obtain 9. Now, determine the common difference for 17, 13, 9, and 5. The common difference is __, and the next term in the sequence is ___. A rule for finding the nth term of an arithmetic sequence can be found by using the following guidelines: Consider the sequence 7, 11, 15, 19,... in which the common difference is +4. Let n = the term number of the sequence. Let A(n) = the value of the nth term of the sequence A(1) = 7; A(2) = 7 + 4 = 11; A(3) = 7 + 2(4) = 15; A(4) = 7 + 3(4) = 19; and A(n) = 7 + (n-1)4. If you were asked to find the 10th term of the sequence, A(10) = 7 + (10 - 1)4 = 43, the 20th term would be ________________________. Thus, the nth term A(n) rule for an arithmetic sequence is A(n) = a + ( n - 1) d where a = the first term, n = the term number, and d = the common difference.
Find the common difference of the arithmetic sequence. 2. 9, 13, 17, 21, . . .
3. 5, 5.3, 5.6, 5.9, . . .
4. 2, 189 , 17
9 , 123 , . . .
5. The common difference in an arithmetic sequence is ____________ a positive number.
Find the first, fourth, and tenth terms of the arithmetic sequence described by the given rule. 6. ( ) ( )( )12 1 3A n n= + −
7. ( ) ( ) 16 15
A n n = − + −
8. ( ) ( )( )3 1 2.2A n n= − + − − Geometric Sequences:
Unit 7, Activity 8, Arithmetic and Geometric Sequences
Blackline Masters, Algebra I Page 7-15
Two types of number sequences are represented in this activity-arithmetic sequences and geometric sequences. When the terms of a sequence are determined by multiplying a term in the sequence by a fixed number to find the next term, the sequence is called a geometric sequence. Examples: Look at the pattern of 3, 12, 48, 192. What is the common ratio between each of the terms? The common ratio is ×4. So to find the next term in the sequence, you would multiply 4 by 192 to obtain 768. Now, determine the common ratio for 80, 20, 5, and 1.25. The common ratio is ___, and the next term in the sequence is _________. A rule for finding the nth term of an geometric sequence can be found by using the following guidelines: Consider the sequence 1, 3, 9, 27,... in which the common ratio is ×3. Let n = the term number of the sequence. Let A(n) = the value of the nth term of the sequence. A(1) = 1; A(2) = 1(3) = 3; A(3) = 1(3)(3) = 1(3)2; A(4) = 1(3)(3)(3) = 1(3)3; and A(n) = ( ) 11 3 n− If you were asked to find the 10th term of the sequence, A(10) = 1(3)9 = 19,683, the 20th term would be ____________________________________. Thus, the nth term A(n) rule for an geometric sequence is 1( ) nA n a r −= ⋅ where a = the first term, n = the term number, and r = the common ratio. The common difference or the common ratio can be used to determine whether a sequence is arithmetic or geometric. If there is no common difference or ratio, then the sequence is neither geometric nor arithmetic. Examples: 2, 4, 6, 8... the common difference is 2 so the sequence is arithmetic. 2, 4, 8, 16 ... the common ratio is 2 so the sequence is geometric.
Find the common ratio of the sequence: 9. 2, –10, 50, –250, . . . 10. –164, –82, –41, –20.5, . . . 11. Find the next three terms of the sequence 3, 9, 27, 81... Determine whether the sequence is arithmetic or geometric. 12. –2, 10, –50, 250, . . . 13. Find the first, fourth, and eighth terms of the sequence. ( ) 12 2nA n −= − ⋅ 14. Find the next three terms of the sequence. Then, write a rule for the sequence. 648, 216, 72, 24
Unit 7, Activity 8, Arithmetic and Geometric Sequences with Answers
Blackline Masters, Algebra I Page 7-16
Read the following passages and provide the solutions to the problems below each passage. 1. Two types of number sequences are represented in this activity-arithmetic sequences and geometric sequences. When the terms of a sequence are based on adding a fixed number to each previous term, the pattern is known as an arithmetic sequence. The fixed number is called the common difference. Examples: Look at the pattern of -7, -3, 1, 5. What is the common difference between each of the terms? The common difference is +4. So to find the next term in the sequence, you would add 4 to 5 to obtain 9. Now, determine the common difference for 17, 13, 9, and 5. The common difference is -4, and the next term in the sequence is 1. A rule for finding the nth term of an arithmetic sequence can be found by using the following guidelines: Consider the sequence 7, 11, 15, 19,... in which the common difference is +4. Let n = the term number of the sequence. Let A(n) = the value of the nth term of the sequence. A(1) = 7; A(2) = 7 + 4 = 11; A(3) = 7 + 2(4) = 15; A(4) = 7 + 3(4) = 19; and A(n) = 7 + (n-1)4. If you were asked to find the 10th term of the sequence, A(10) = 7 + (10 - 1)4 = 43, the 20th term would be A(20) = 7 + (20-1)4 = 83. Thus, the nth term A(n) rule for an arithmetic sequence is A(n) = a + ( n - 1) d where a = the first term, n = the term number, and d = the common difference.
Find the common difference of the arithmetic sequence. 2. 9, 13, 17, 21, . . . Answer: +4
3. 5, 5.3, 5.6, 5.9, . . . Answer: +0.3
4. 2, 189 , 17
9 , 123 , . . . Answer: 1
9−
5. The common difference in an arithmetic sequence is sometimes a positive number.
Find the first, fourth, and tenth terms of the arithmetic sequence described by the given rule. 6. ( ) ( )( )12 1 3A n n= + − Answer: 12, 21, 39
7. ( ) ( ) 16 15
A n n = − + −
Answer: -6, 255
− , 145
−
8. ( ) ( )( )3 1 2.2A n n= − + − − Answer: -3, -9.6, -22.8 Geometric Sequences:
Unit 7, Activity 8, Arithmetic and Geometric Sequences with Answers
Blackline Masters, Algebra I Page 7-17
Two types of number sequences are represented in this activity-arithmetic sequences and geometric sequences. When the terms of a sequence are determined by multiplying a term in the sequence by a fixed number to find the next term, the sequence is called a geometric sequence. Examples: Look at the pattern of 3, 12, 48, 192. What is the common ratio between each of the terms? The common ratio is ×4. So to find the next term in the sequence, you would multiply 4 by 192 to obtain 768. Now, determine the common ratio for 80, 20, 5, and 1.25. The common ratio is 0.25, and the next term in
the sequence is 516
or 0.3125.
A rule for finding the nth term of an geometric sequence can be found by using the following guidelines: Consider the sequence 1, 3, 9, 27,... in which the common ratio is ×3. Let n = the term number of the sequence. Let A(n) = the value of the nth term of the sequence, A(1) = 1; A(2) = 1(3) = 3; A(3) = 1(3)(3) = 1(3)2; A(4) = 1(3)(3)(3) = 1(3)3; and A(n) = ( ) 11 3 n− . If you were asked to find the 10th term of the sequence, A(10) = 1(3)9 = 19,683.
the 20th term would be
20 1
19
(20) 1(3)1(3)1,162,261,467
A −=
==
Thus, the nth term A(n) rule for an geometric sequence is 1( ) nA n a r −= ⋅ where a = the first term, n = the term number, and r = the common ratio. The common difference or the common ratio can be used to determine whether a sequence is arithmetic or geometric. If there is no common difference or ratio, then the sequence is neither geometric nor arithmetic. Examples: 2, 4, 6, 8... the common difference is 2 so the sequence is arithmetic. 2, 4, 8, 16 ... the common ratio is 2 so the sequence is geometric.
Find the common ratio of the sequence. 9. 2, –10, 50, –250, . . . Answer: -5
10. –164, –82, –41, –20.5, . . . Answer: 12
11. Find the next three terms of the sequence 3, 9, 27, 81... Answer: 243, 729, 2187
Determine whether the sequence is arithmetic or geometric. Geometric 12. –2, 10, –50, 250, . . . Answer: -1250
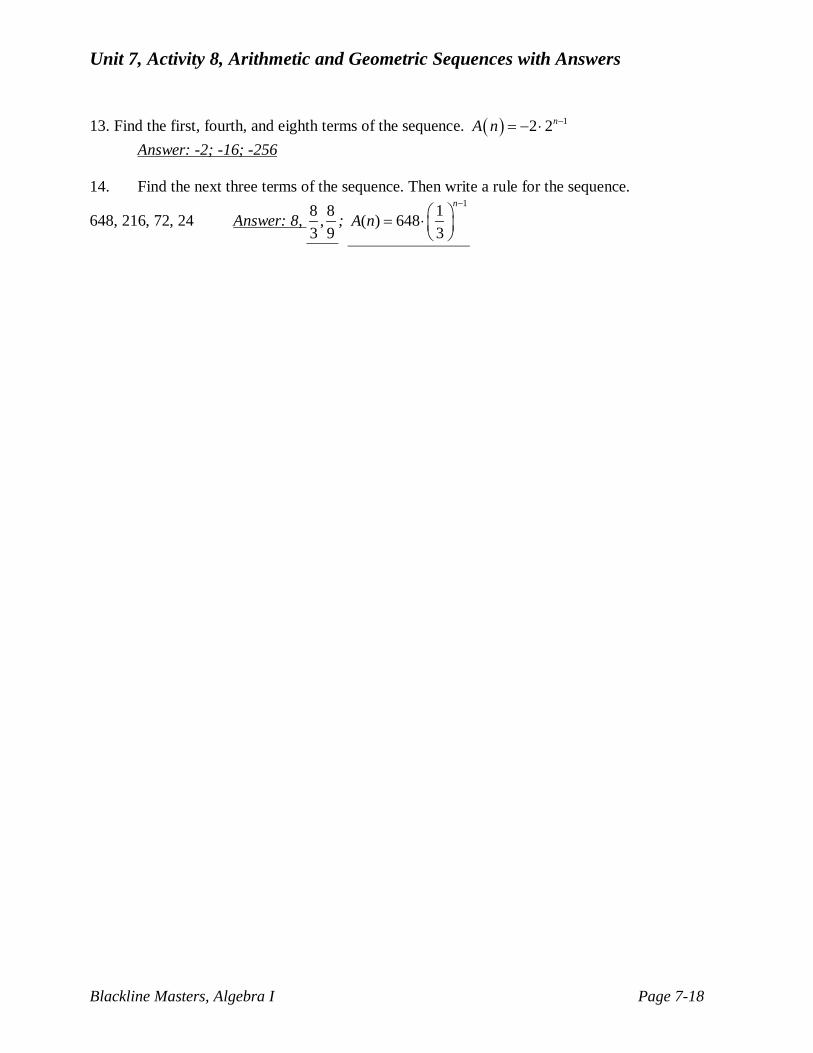
Unit 7, Activity 8, Arithmetic and Geometric Sequences with Answers
Blackline Masters, Algebra I Page 7-18
13. Find the first, fourth, and eighth terms of the sequence. ( ) 12 2nA n −= − ⋅ Answer: -2; -16; -256 14. Find the next three terms of the sequence. Then write a rule for the sequence.
648, 216, 72, 24 Answer: 8, 8 8,3 9
; 11( ) 648
3
n
A n−
= ⋅

Unit 7, Activity 9, Vocabulary Self-Awareness Chart 2
Blackline Masters, Algebra I Page 7-19
Procedure: 1. Examine the list of words you have written in the first column. 2. Put a + next to each word you know well and for which you can write an accurate example and definition. Your definition and example must relate to the unit of study. 3. Place a next to any words for which you can write either a definition or an example, but not both. 4. Put a – next to words that are new to you. This chart will be used throughout the unit. By the end of the unit you should have the entire chart completed. Because you will be revising this chart, write in pencil.
Word + - Example Definition Parabola
Quadratic Equation in Standard Form
Zeros Completing the Square
Scatterplot Discriminant Quadratic Formula
Vertex Axis of Symmetry
Y-intercept X-intercept Solutions to a quadratic equation
Real solution Complex Solution
Roots of a quadratic
Vertex form of a quadratic equation
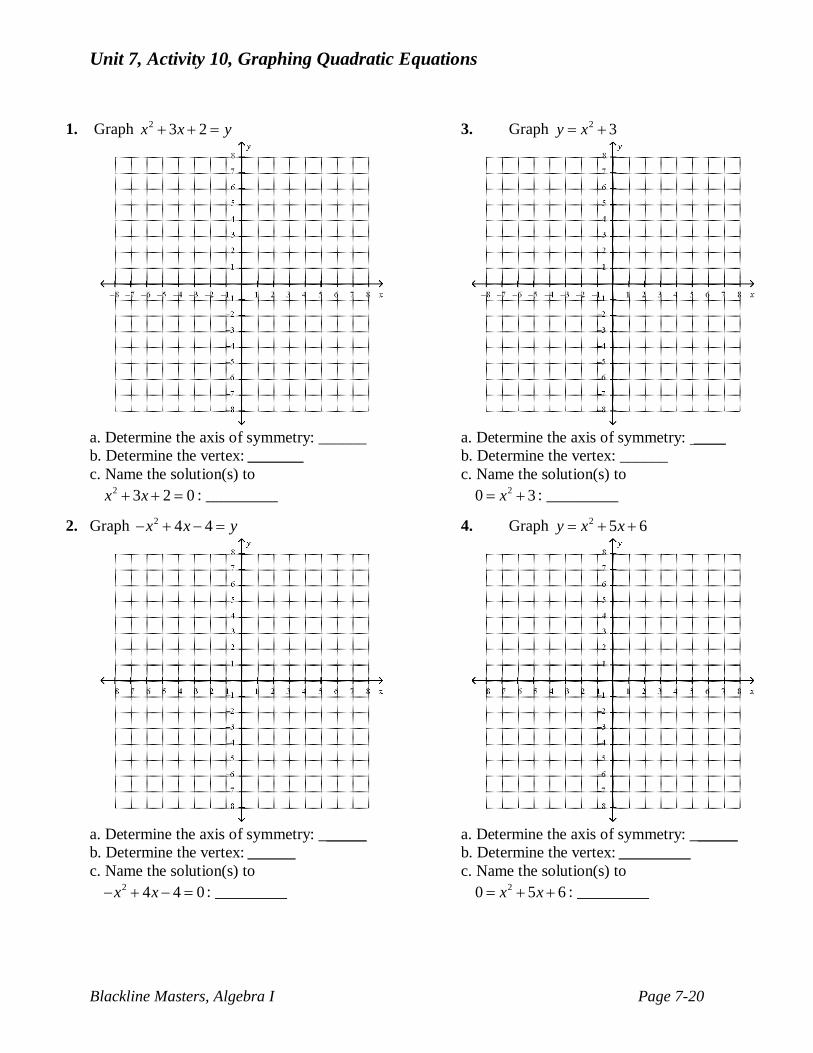
Unit 7, Activity 10, Graphing Quadratic Equations
Blackline Masters, Algebra I Page 7-20
1. Graph 2 3 2x x y+ + =
a. Determine the axis of symmetry: ______ b. Determine the vertex: _______ c. Name the solution(s) to 2 3 2 0x x+ + = : _________
2. Graph 2 4 4x x y− + − =
a. Determine the axis of symmetry: ______ b. Determine the vertex: ______ c. Name the solution(s) to 2 4 4 0x x− + − = : _________
3. Graph 2 3y x= +
a. Determine the axis of symmetry: ____ b. Determine the vertex: ______ c. Name the solution(s) to 20 3x= + : _________
4. Graph 2 5 6y x x= + +
a. Determine the axis of symmetry: ______ b. Determine the vertex: _________ c. Name the solution(s) to 20 5 6x x= + + : _________

Unit 7, Activity 10, Graphing Quadratic Equations with Answers
Blackline Masters, Algebra I Page 7-21
1. Graph 2 3 2x x y+ + =
a. Determine the axis of symmetry: _x = -1 b. Determine the vertex: ( -1.5, -.25 ) c. Name the solution(s) to 2 3 2 0x x+ + = : (-2, 0) ( -1, 0)
2. Graph 2 4 4x x y− + − =
a. Determine the axis of symmetry: _x = 2 b. Determine the vertex: ( 2, 0) c. Name the solution(s) to 2 4 4 0x x− + − = : (2, 0)
3. Graph 2 3y x= +
a. Determine the axis of symmetry: _x = 0 b. Determine the vertex: ( 0, 3 ) c. Name the solution(s) 20 3x= + : (No real solution)
4. Graph 2 5 6y x x= + +
a. Determine the axis of symmetry: _x = -2.5 b. Determine the vertex: ( -2.5, -.25) c. Name the solution(s) to 20 5 6x x= + + : (-3, 0) (-2,0)
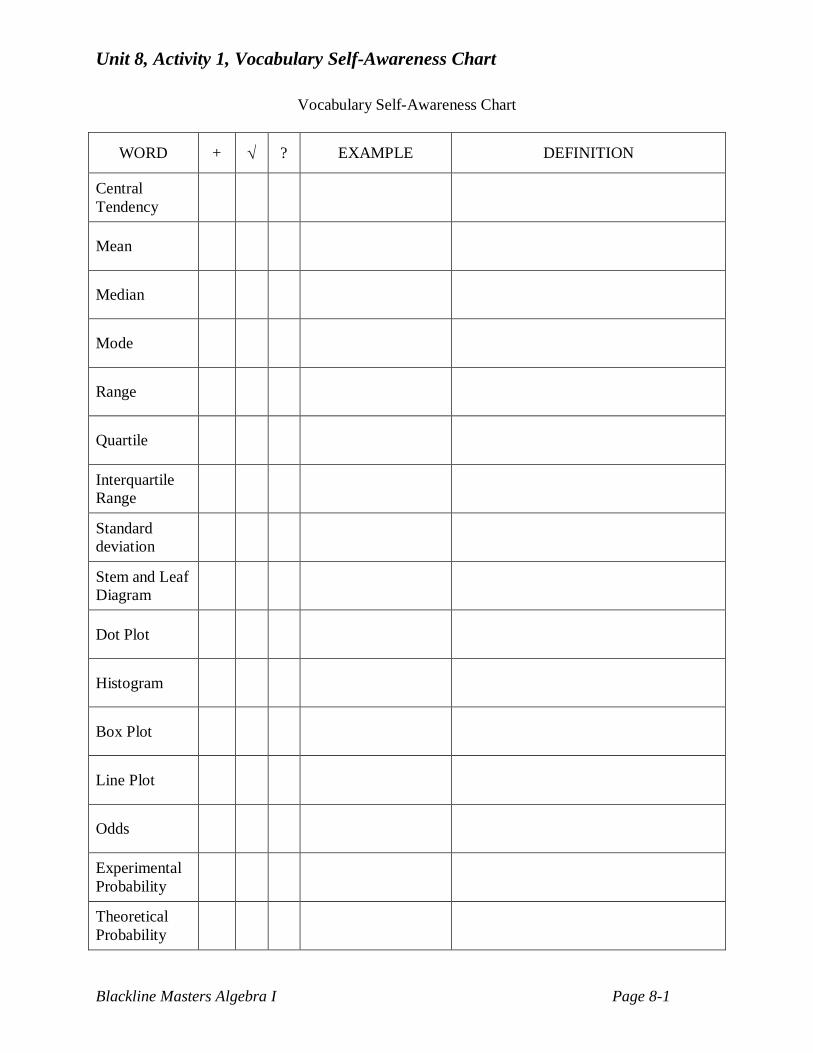
Unit 8, Activity 1, Vocabulary Self-Awareness Chart
Blackline Masters Algebra I Page 8-1
Vocabulary Self-Awareness Chart
WORD + √ ? EXAMPLE DEFINITION
Central Tendency
Mean
Median
Mode
Range
Quartile
Interquartile Range
Standard deviation
Stem and Leaf Diagram
Dot Plot
Histogram
Box Plot
Line Plot
Odds
Experimental Probability
Theoretical Probability

Unit 8, Activity 1, Vocabulary Self-Awareness Chart
Blackline Masters Algebra I Page 8-2
Geometric Probability
Permutations
Combinations
Sample Space
Independent Event
Dependent Event
Procedure: 1. Examine the list of words you have written in the first column. 2. Put a + next to each word you know well and for which you can write an accurate example and definition. Your definition and example must relate to the unit of study. 3. Place a next to any words for which you can write either a definition or an example, but not both. 4. Put a – next to words that are new to you. This chart will be used throughout the unit. By the end of the unit you should have the entire chart completed. Because you will be revising this chart, write in pencil.
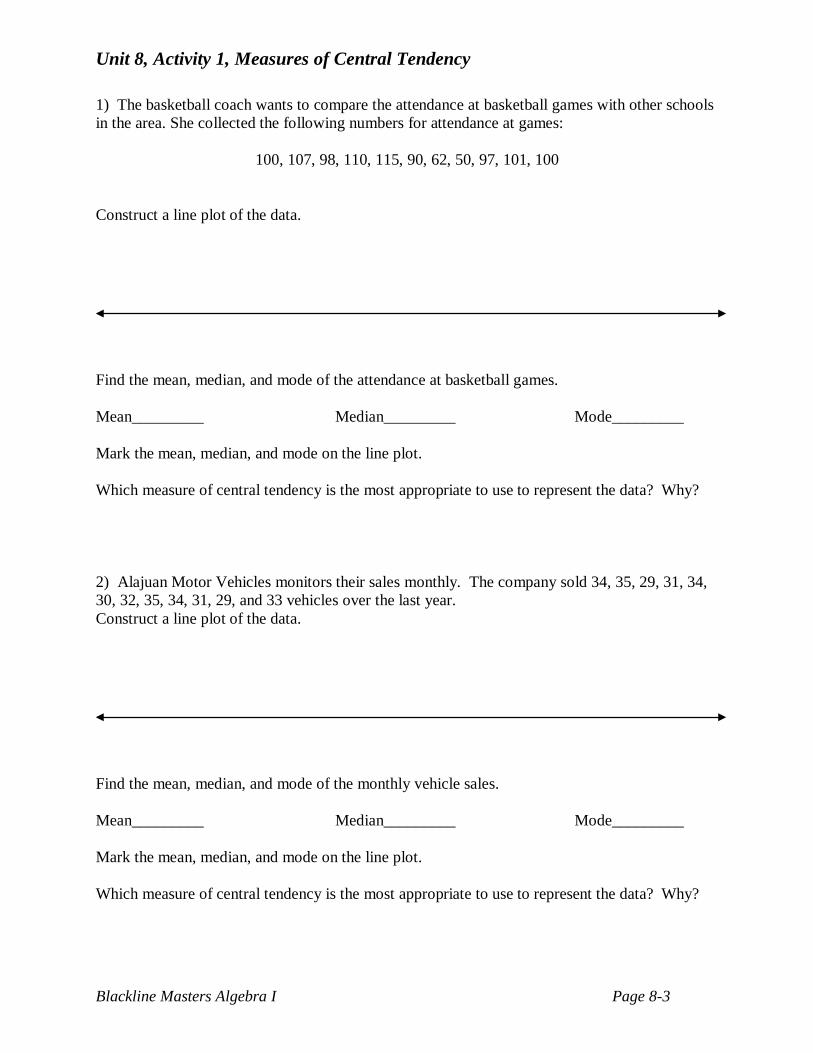
Unit 8, Activity 1, Measures of Central Tendency
Blackline Masters Algebra I Page 8-3
1) The basketball coach wants to compare the attendance at basketball games with other schools in the area. She collected the following numbers for attendance at games:
100, 107, 98, 110, 115, 90, 62, 50, 97, 101, 100 Construct a line plot of the data. Find the mean, median, and mode of the attendance at basketball games. Mean_________ Median_________ Mode_________ Mark the mean, median, and mode on the line plot. Which measure of central tendency is the most appropriate to use to represent the data? Why? 2) Alajuan Motor Vehicles monitors their sales monthly. The company sold 34, 35, 29, 31, 34, 30, 32, 35, 34, 31, 29, and 33 vehicles over the last year. Construct a line plot of the data. Find the mean, median, and mode of the monthly vehicle sales. Mean_________ Median_________ Mode_________ Mark the mean, median, and mode on the line plot. Which measure of central tendency is the most appropriate to use to represent the data? Why?
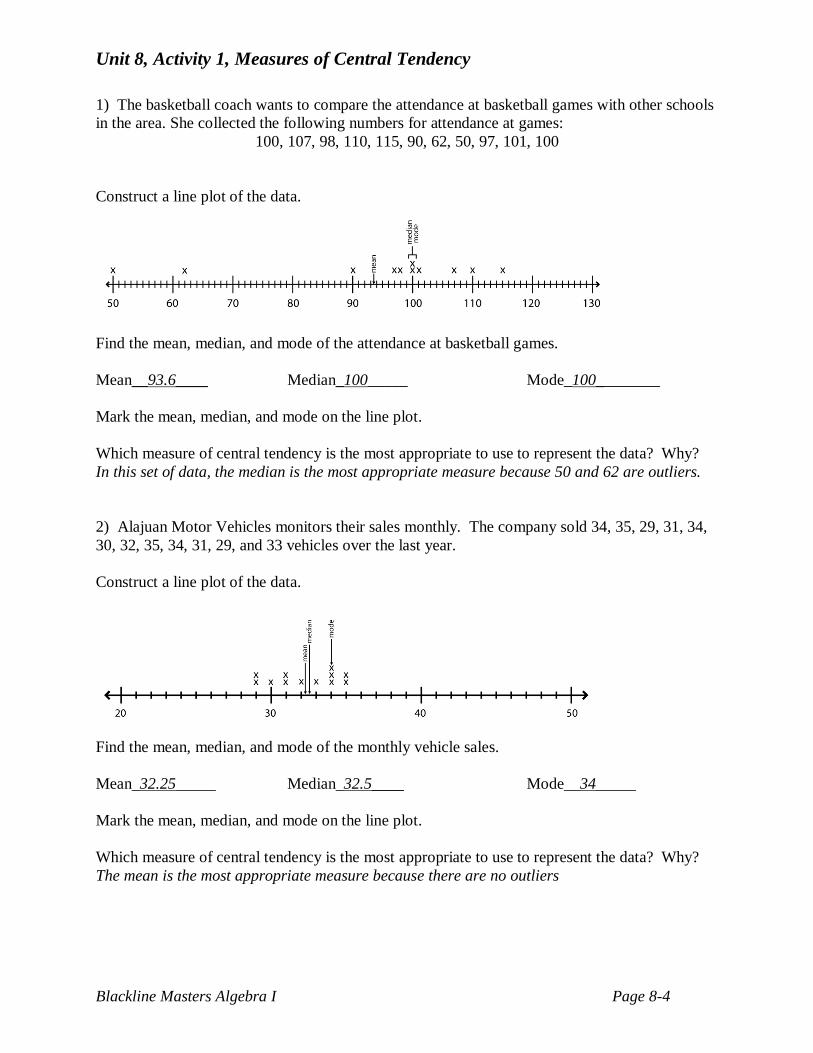
Unit 8, Activity 1, Measures of Central Tendency
Blackline Masters Algebra I Page 8-4
1) The basketball coach wants to compare the attendance at basketball games with other schools in the area. She collected the following numbers for attendance at games:
100, 107, 98, 110, 115, 90, 62, 50, 97, 101, 100 Construct a line plot of the data.
Find the mean, median, and mode of the attendance at basketball games. Mean__93.6____ Median_100_____ Mode_100________ Mark the mean, median, and mode on the line plot. Which measure of central tendency is the most appropriate to use to represent the data? Why? In this set of data, the median is the most appropriate measure because 50 and 62 are outliers. 2) Alajuan Motor Vehicles monitors their sales monthly. The company sold 34, 35, 29, 31, 34, 30, 32, 35, 34, 31, 29, and 33 vehicles over the last year. Construct a line plot of the data.
Find the mean, median, and mode of the monthly vehicle sales. Mean_32.25_____ Median_32.5____ Mode__34_____ Mark the mean, median, and mode on the line plot. Which measure of central tendency is the most appropriate to use to represent the data? Why? The mean is the most appropriate measure because there are no outliers
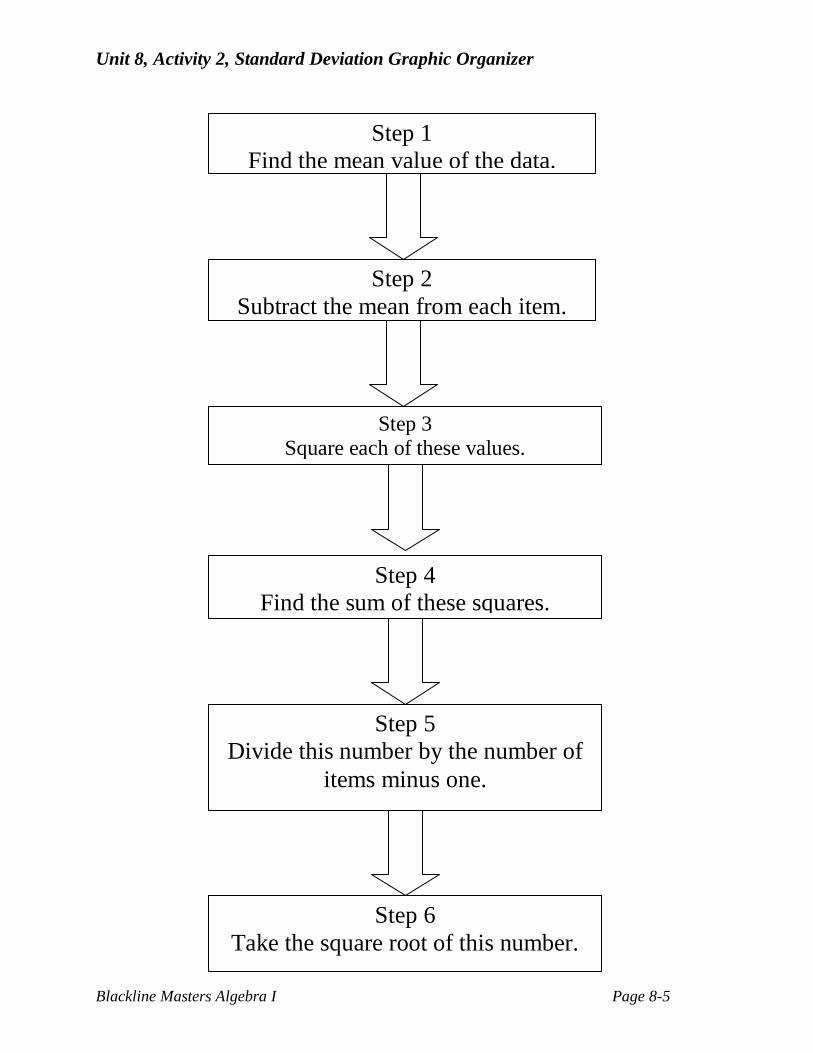
Unit 8, Activity 2, Standard Deviation Graphic Organizer
Blackline Masters Algebra I Page 8-5
Step 1
Find the mean value of the data.
Step 2 Subtract the mean from each item.
Step 3 Square each of these values.
Step 4 Find the sum of these squares.
Step 5 Divide this number by the number of
items minus one.
Step 6 Take the square root of this number.
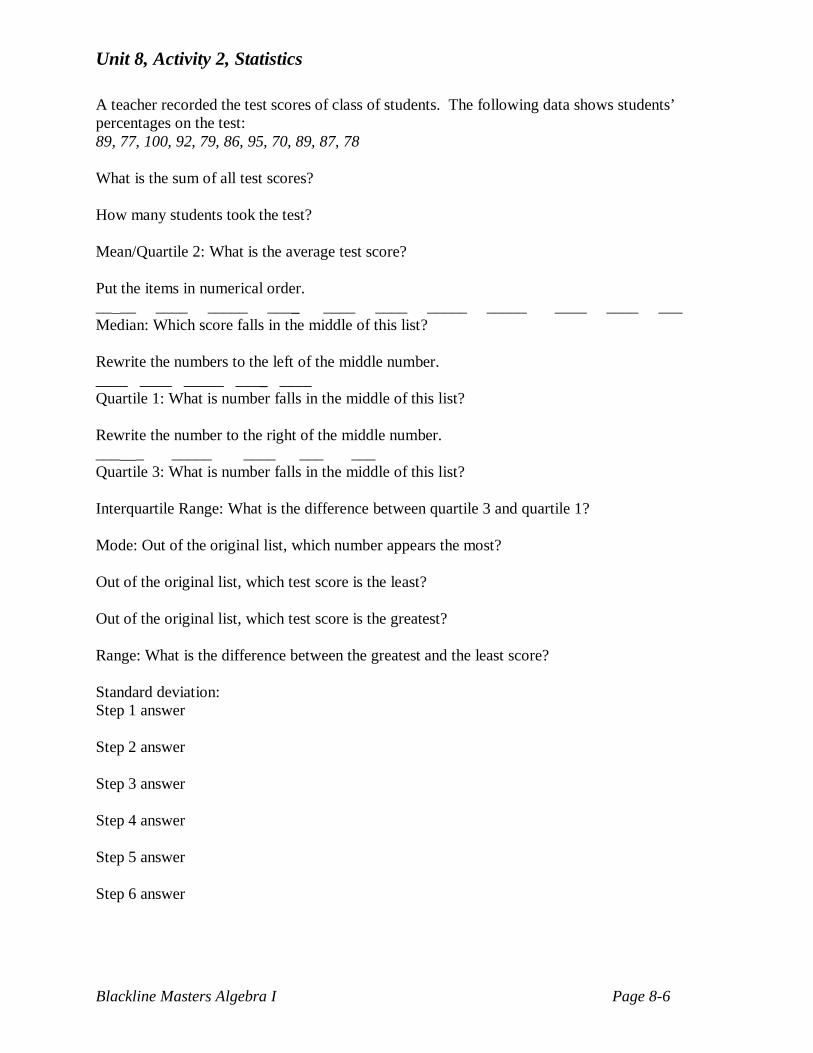
Unit 8, Activity 2, Statistics
Blackline Masters Algebra I Page 8-6
A teacher recorded the test scores of class of students. The following data shows students’ percentages on the test: 89, 77, 100, 92, 79, 86, 95, 70, 89, 87, 78 What is the sum of all test scores? How many students took the test? Mean/Quartile 2: What is the average test score? Put the items in numerical order. __ __ ____ _____ ____ ____ ____ _____ _____ ____ ____ ___ Median: Which score falls in the middle of this list? Rewrite the numbers to the left of the middle number. ____ ____ _____ ____ ____ Quartile 1: What is number falls in the middle of this list? Rewrite the number to the right of the middle number. ___ _ _____ ____ ___ ___ Quartile 3: What is number falls in the middle of this list? Interquartile Range: What is the difference between quartile 3 and quartile 1? Mode: Out of the original list, which number appears the most? Out of the original list, which test score is the least? Out of the original list, which test score is the greatest? Range: What is the difference between the greatest and the least score? Standard deviation: Step 1 answer Step 2 answer Step 3 answer Step 4 answer Step 5 answer Step 6 answer
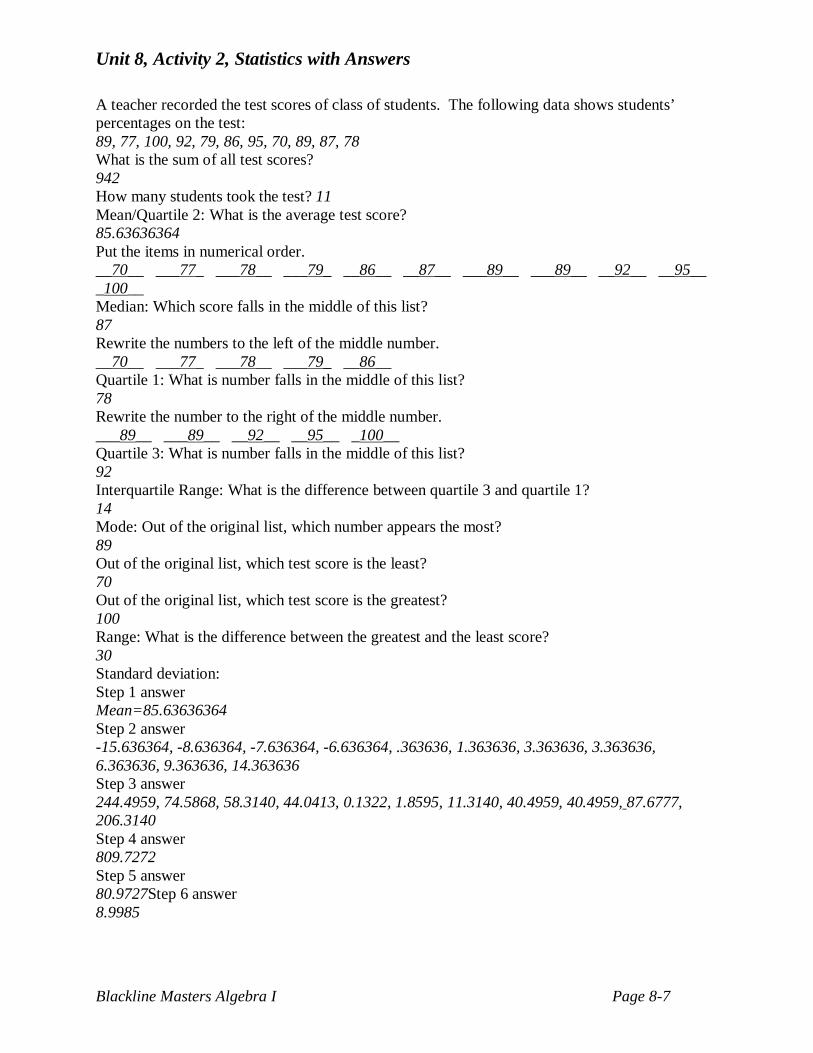
Unit 8, Activity 2, Statistics with Answers
Blackline Masters Algebra I Page 8-7
A teacher recorded the test scores of class of students. The following data shows students’ percentages on the test: 89, 77, 100, 92, 79, 86, 95, 70, 89, 87, 78 What is the sum of all test scores? 942 How many students took the test? 11 Mean/Quartile 2: What is the average test score? 85.63636364 Put the items in numerical order. __70__ ___77_ ___78__ ___79_ __86__ __87__ ___89__ ___89__ __92__ __95__ _100__ Median: Which score falls in the middle of this list? 87 Rewrite the numbers to the left of the middle number. __70__ ___77_ ___78__ ___79_ __86__ Quartile 1: What is number falls in the middle of this list? 78 Rewrite the number to the right of the middle number. ___89__ ___89__ __92__ __95__ _100__ Quartile 3: What is number falls in the middle of this list? 92 Interquartile Range: What is the difference between quartile 3 and quartile 1? 14 Mode: Out of the original list, which number appears the most? 89 Out of the original list, which test score is the least? 70 Out of the original list, which test score is the greatest? 100 Range: What is the difference between the greatest and the least score? 30 Standard deviation: Step 1 answer Mean=85.63636364 Step 2 answer -15.636364, -8.636364, -7.636364, -6.636364, .363636, 1.363636, 3.363636, 3.363636, 6.363636, 9.363636, 14.363636 Step 3 answer 244.4959, 74.5868, 58.3140, 44.0413, 0.1322, 1.8595, 11.3140, 40.4959, 40.4959, 87.6777, 206.3140 Step 4 answer 809.7272 Step 5 answer 80.9727Step 6 answer 8.9985
Unit 8, Activity 2, Music Scoring
Blackline Masters Algebra I Page 8-8
Students from two high schools went to a band competition. Each student gave a solo performance and was rated by the judges. The possible scores ranged from 3 (one point from each judge) to 21 (seven points from each judge). The data show the scores of two groups of students.
Westlake Student Scores: 8, 10, 15, 21, 3, 15, 10, 21, 15, 20
Northshore Student Scores: 5, 6, 19, 10, 12, 10, 12, 9, 20, 8
a. Find the mean and the range of the data for the Westlake High School students and for the Northshore High School students.
b. Find the standard deviation for each set of data. Round to the nearest tenth.
c. Draw a box and whisker plot.
d. Use your results from parts a and b to compare the scores of the students from the two high schools.
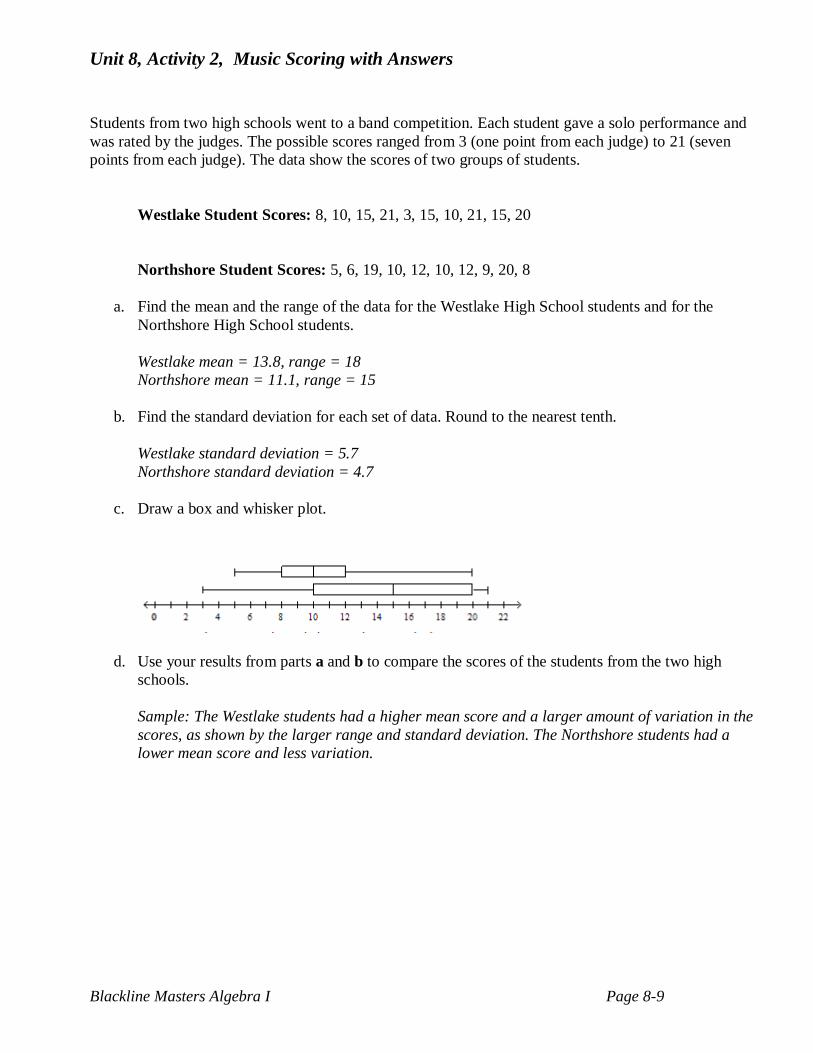
Unit 8, Activity 2, Music Scoring with Answers
Blackline Masters Algebra I Page 8-9
Students from two high schools went to a band competition. Each student gave a solo performance and was rated by the judges. The possible scores ranged from 3 (one point from each judge) to 21 (seven points from each judge). The data show the scores of two groups of students.
Westlake Student Scores: 8, 10, 15, 21, 3, 15, 10, 21, 15, 20
Northshore Student Scores: 5, 6, 19, 10, 12, 10, 12, 9, 20, 8
a. Find the mean and the range of the data for the Westlake High School students and for the Northshore High School students.
Westlake mean = 13.8, range = 18 Northshore mean = 11.1, range = 15
b. Find the standard deviation for each set of data. Round to the nearest tenth.
Westlake standard deviation = 5.7 Northshore standard deviation = 4.7
c. Draw a box and whisker plot.
d. Use your results from parts a and b to compare the scores of the students from the two high schools.
Sample: The Westlake students had a higher mean score and a larger amount of variation in the scores, as shown by the larger range and standard deviation. The Northshore students had a lower mean score and less variation.
Unit 8, Activity 7, It’s Conditional
Blackline Masters Algebra I Page 8-10
Determine whether the events are dependent or independent. Explain your answer, 1. Toss a penny and a nickel
2. Draw a name from a hat; without replacement, select another name
3. A basket contains orange and green balls. Select one, then return it and pick again.
Explain the difference between independent and dependent events. Provide an example of each.
4. Suppose you chose a letter tile form a bag containing 2 As, 3 Bs and 4 Cs. Replace the first tile chosen and choose again. Determine the probability.
A. P(A and A)
_____ B. P(B and C)
_____ C. P(C and C)
_____
5. Write the letters in the word “PROBABILITY,” one letter on each index card. Select one card;
without replacing the card, select another. Determine each probability. For this example “Y “ is a vowel.
A. P (vowel then vowel)
_____ B. P(consonant then vowel)
_____
C. P ( I then I)
_____ D. P( A then A) _____
6. Two letters are chosen from the alphabet randomly without replacement. Find the probability of choosing a vowel followed by a second vowel. P (vowel then vowel) =
______
7. Two letters of the alphabet are selected at random without replacement. What is the probability of selecting a consonant followed by another consonant. P ( consonant then consonant) =
______
8. Write four probability problems, two involving independent events and two involving dependent
events or conditional probability. Mix them up. Find a partner and exchange problems. Determine each of the probabilities.
Answers vary. Check student problems for logical situations and correct calculation of probabilities.
Unit 8, Activity 7, It’s Conditional with answers
Blackline Masters Algebra I Page 8-11
Determine whether the events are dependent or independent. Explain your answer, 1. Toss a penny and a nickel Independent because you still have 2 in the sample space for each
coin 2. Draw a name from a hat; without replacement, select another name Dependent because with one
name gone, the sample space has changed. 3. A basket contains orange and green balls. Select one, then return it and pick again. Independent
because the sample space has not changed.
Explain the difference between independent and dependent events. Provide an example of each. Answers will vary. Check student work for appropriate examples.
4. Suppose you chose a letter tile form a bag containing 2 As, 3 Bs and 4 Cs. Replace the first tile chosen and choose again. Determine the probability.
A. P(A and A) 481
B. P(B and C) 427
C. P(C and C)
5. Write the letters in the word “PROBABILITY,” one letter on each index card. Select one card;
without replacing the card, select another. Determine each probability. For this example “Y “ is a vowel.
A. P (vowel then vowel) 9110
B. P(consonant then vowel)
C. P (I then I) D. P( A then A) 0
6. Two letters are chosen from the alphabet randomly without replacement. Find the probability of
choosing a vowel followed by a second vowel. P (vowel then vowel) =
7. Two letters of the alphabet are selected at random without replacement. What is the probability of
selecting a consonant followed by another consonant. P ( consonant then consonant) = _
8. Write four probability problems, two involving independent events and two involving dependent
events or conditional probability. Mix them up. Find a partner and exchange problems. Determine each of the probabilities.
Answers vary. Check student problems for logical situations and correct calculation of probabilities.
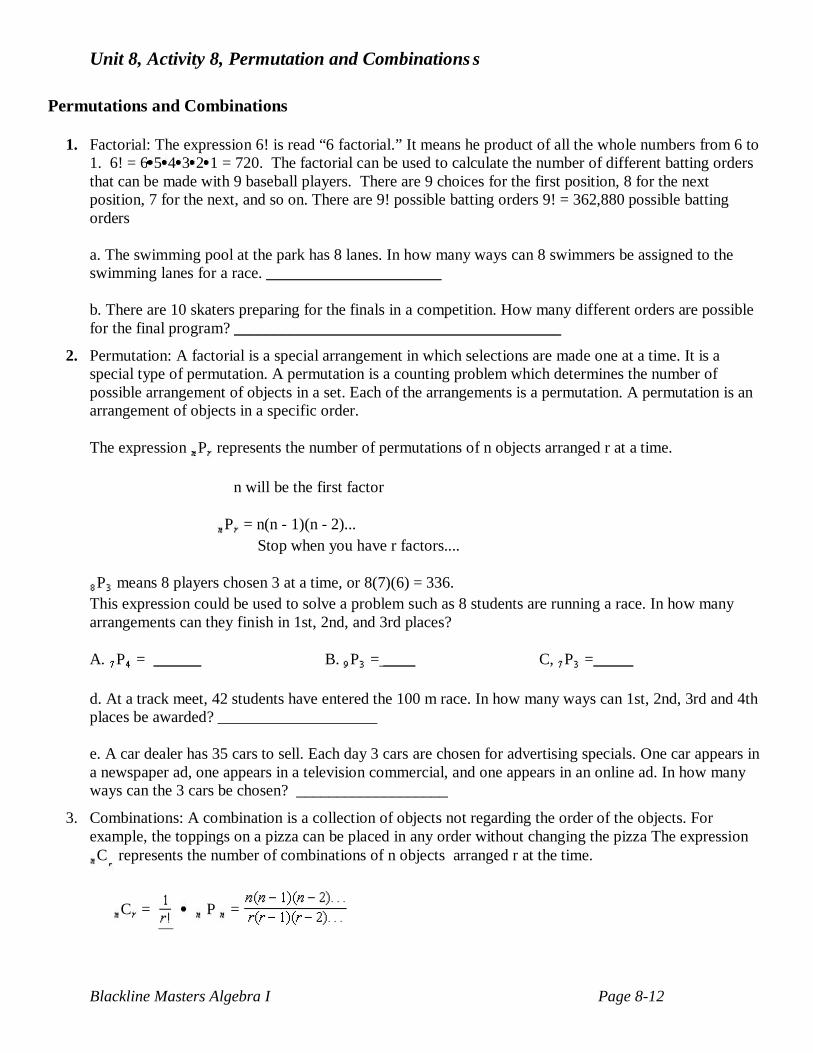
Unit 8, Activity 8, Permutation and Combinations s
Blackline Masters Algebra I Page 8-12
Permutations and Combinations
1. Factorial: The expression 6! is read “6 factorial.” It means he product of all the whole numbers from 6 to
1. 6! = 6 5 4 3 2 1 = 720. The factorial can be used to calculate the number of different batting orders that can be made with 9 baseball players. There are 9 choices for the first position, 8 for the next position, 7 for the next, and so on. There are 9! possible batting orders 9! = 362,880 possible batting orders a. The swimming pool at the park has 8 lanes. In how many ways can 8 swimmers be assigned to the swimming lanes for a race. ______________________ b. There are 10 skaters preparing for the finals in a competition. How many different orders are possible for the final program? _________________________________________
2. Permutation: A factorial is a special arrangement in which selections are made one at a time. It is a special type of permutation. A permutation is a counting problem which determines the number of possible arrangement of objects in a set. Each of the arrangements is a permutation. A permutation is an arrangement of objects in a specific order. The expression P represents the number of permutations of n objects arranged r at a time. n will be the first factor P = n(n - 1)(n - 2)... Stop when you have r factors.... P means 8 players chosen 3 at a time, or 8(7)(6) = 336.
This expression could be used to solve a problem such as 8 students are running a race. In how many arrangements can they finish in 1st, 2nd, and 3rd places? A. P = ______ B. P = ____ C, P =_____ d. At a track meet, 42 students have entered the 100 m race. In how many ways can 1st, 2nd, 3rd and 4th places be awarded? ____________________ e. A car dealer has 35 cars to sell. Each day 3 cars are chosen for advertising specials. One car appears in a newspaper ad, one appears in a television commercial, and one appears in an online ad. In how many ways can the 3 cars be chosen? ___________________
3. Combinations: A combination is a collection of objects not regarding the order of the objects. For example, the toppings on a pizza can be placed in any order without changing the pizza The expression C represents the number of combinations of n objects arranged r at the time.
C = P =
Unit 8, Activity 8, Permutation and Combinations s
Blackline Masters Algebra I Page 8-13
The numerator consists of r factors starting with n; the denominator consists of r factors, beginning with
r. The expression C = = 4. The expression could represent the number of 3-topping pizza
combinations that can be made from 4 possible toppings. A. C = ______ B. C = _______ C. C = ______ D. If twenty people report for jury duty, how many different ways can a twelve person jury be seated? _____________________________________________
4. Determine whether each situation is a combination or permutation, then determine the number of arrangements represented by the situation. a. At a party there are 12 people present. Each person at the party will shake hands with every other
person at the party exactly one time. How many handshakes occur? ___________________________________
b. A roller coaster has room for 10 people, all sitting single file, one behind the other. How many
different arrangements for the 10 passengers are possible? _______________________________________________________
c. In how many ways can a president. a vice president, a secretary, and a treasurer can be chosen from a
group of 25 running for office? _____________________________________ d. Fifteen students from the freshman class have volunteered to be on a committee to organize the spring
dance. In how many ways can 5 students be chosen for the committee? ___________________________________________
E. From fifty entries in the talent show, how many ways can five semi-finalists be chosen? ________________________
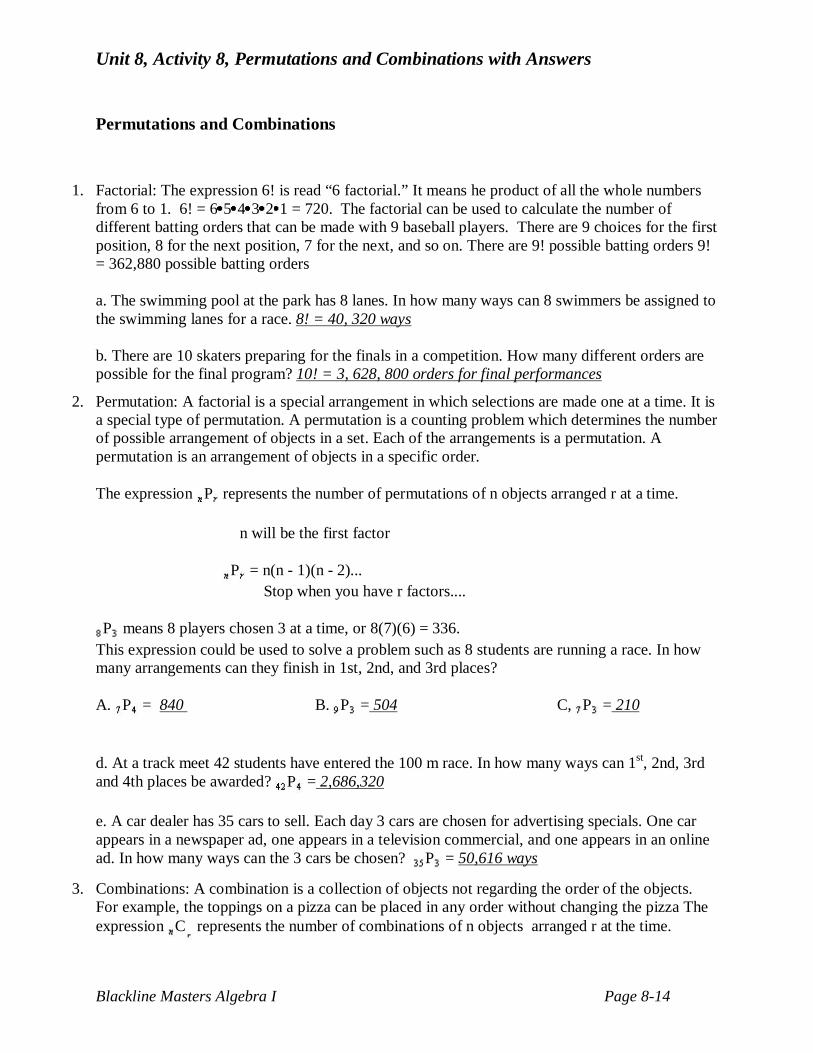
Unit 8, Activity 8, Permutations and Combinations with Answers
Blackline Masters Algebra I Page 8-14
Permutations and Combinations
1. Factorial: The expression 6! is read “6 factorial.” It means he product of all the whole numbers
from 6 to 1. 6! = 6 5 4 3 2 1 = 720. The factorial can be used to calculate the number of different batting orders that can be made with 9 baseball players. There are 9 choices for the first position, 8 for the next position, 7 for the next, and so on. There are 9! possible batting orders 9! = 362,880 possible batting orders a. The swimming pool at the park has 8 lanes. In how many ways can 8 swimmers be assigned to the swimming lanes for a race. 8! = 40, 320 ways b. There are 10 skaters preparing for the finals in a competition. How many different orders are possible for the final program? 10! = 3, 628, 800 orders for final performances
2. Permutation: A factorial is a special arrangement in which selections are made one at a time. It is a special type of permutation. A permutation is a counting problem which determines the number of possible arrangement of objects in a set. Each of the arrangements is a permutation. A permutation is an arrangement of objects in a specific order. The expression P represents the number of permutations of n objects arranged r at a time. n will be the first factor P = n(n - 1)(n - 2)... Stop when you have r factors.... P means 8 players chosen 3 at a time, or 8(7)(6) = 336.
This expression could be used to solve a problem such as 8 students are running a race. In how many arrangements can they finish in 1st, 2nd, and 3rd places? A. P = 840 B. P = 504 C, P = 210 d. At a track meet 42 students have entered the 100 m race. In how many ways can 1st, 2nd, 3rd and 4th places be awarded? P = 2,686,320 e. A car dealer has 35 cars to sell. Each day 3 cars are chosen for advertising specials. One car appears in a newspaper ad, one appears in a television commercial, and one appears in an online ad. In how many ways can the 3 cars be chosen? P = 50,616 ways
3. Combinations: A combination is a collection of objects not regarding the order of the objects. For example, the toppings on a pizza can be placed in any order without changing the pizza The expression C represents the number of combinations of n objects arranged r at the time.

Unit 8, Activity 8, Permutations and Combinations with Answers
Blackline Masters Algebra I Page 8-15
C = P =
The numerator consists of r factors starting with n; the denominator consists of r factors,
beginning with r. The expression C = = 4. The expression could represent the number
of 3-topping pizza combinations that can be made from 4 possible toppings. A. C = 6 B. C = 35 C. C = 210 D. If twenty people report for jury duty, how many different ways can a twelve person jury be seated. C = 125,970 twelve person juries
4. Determine whether each situation is a combination or permutation, then determine the number of arrangements represented by the situation. a. At a party there are 12 people present. Each person at the party will shake hands with every
other person at the party exactly one time. How many handshakes occur? Combination; 66 handshakes
b. A roller coaster has room for 10 people, all sitting single file, one behind the other. How many
different arrangements for the 10 passengers are possible? Permutation; 3,628,800 possible seating arrangements
c. In how many ways can a president. a vice president, secretary, treasurer can be chosen from a
group of 25 running for office? Permutation; 303,600 possible ways to fill the offices d. Fifteen students from the freshman class have volunteered to be on a committee to organize
the spring dance. In how many ways can 5 students be chosen for the committee? Combination; 3,003 possible ways
e. From fifty entries in the talent show, how many ways can five semi-finalists be chosen? Combination; 2, 118,760 possible ways