Alexandre Zebulan Ades: Global Ethanol Market
22
Global Ethanol Market National Ethanol Conference New Orleans, LA | February, 15 th – 17 th 2016 Alexandre Z. Ades
-
Upload
national-ethanol-conference -
Category
Education
-
view
425 -
download
1
Transcript of Alexandre Zebulan Ades: Global Ethanol Market

Global Ethanol Market National Ethanol Conference
New Orleans, LA | February, 15th – 17th 2016
Alexandre Z. Ades
Our Company
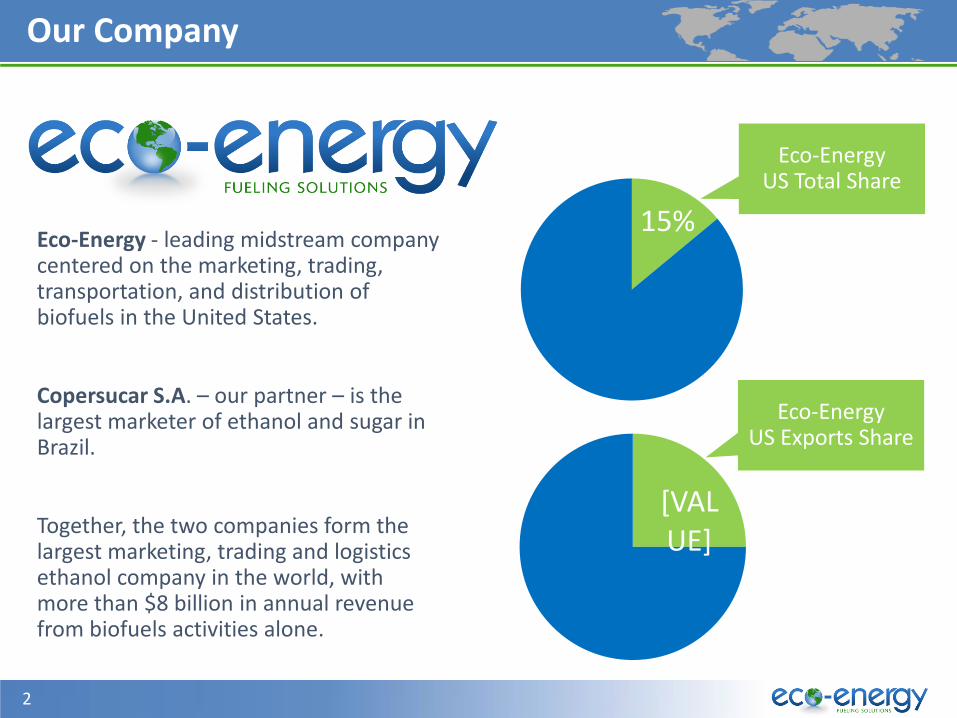
Eco-Energy - leading midstream company centered on the marketing, trading, transportation, and distribution of biofuels in the United States.
Copersucar S.A. – our partner – is the largest marketer of ethanol and sugar in Brazil.
Together, the two companies form the largest marketing, trading and logistics ethanol company in the world, with more than $8 billion in annual revenue from biofuels activities alone.
15%
[VALUE]
Eco-Energy US Exports Share
Eco-Energy US Total Share
2
Agenda
1 2015
2 Brazil
3 US Imports Parity
4 Global Exports Parity
5 2016
6 Conclusions
Source: ITC, SECEX, Green Pool and Eco-energy
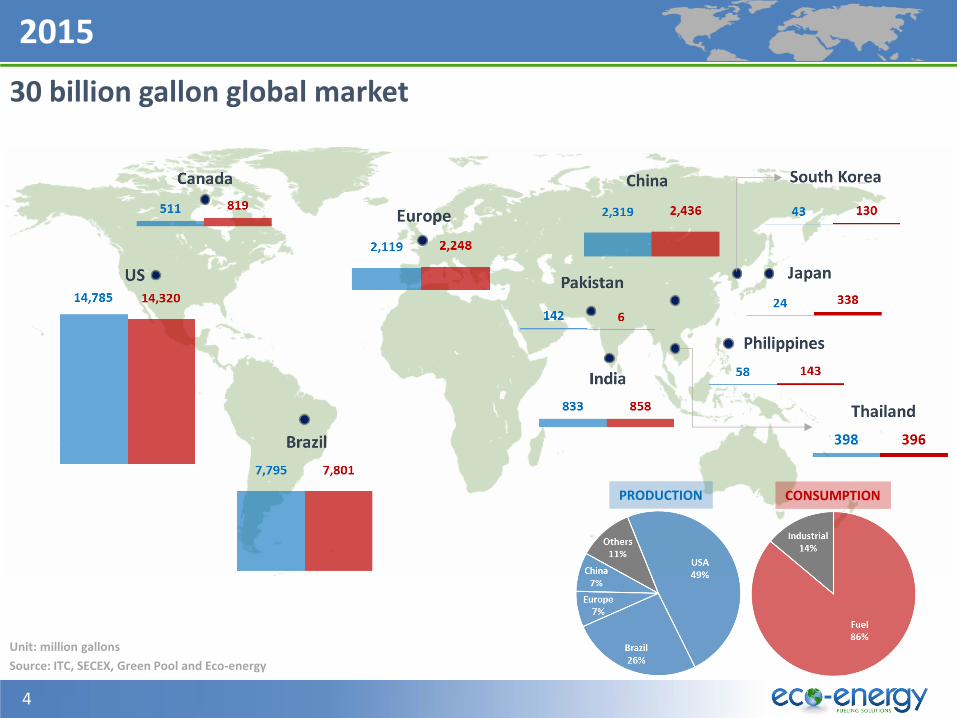
2015
30 billion gallon global market
PRODUCTION CONSUMPTION
Unit: million gallons
4
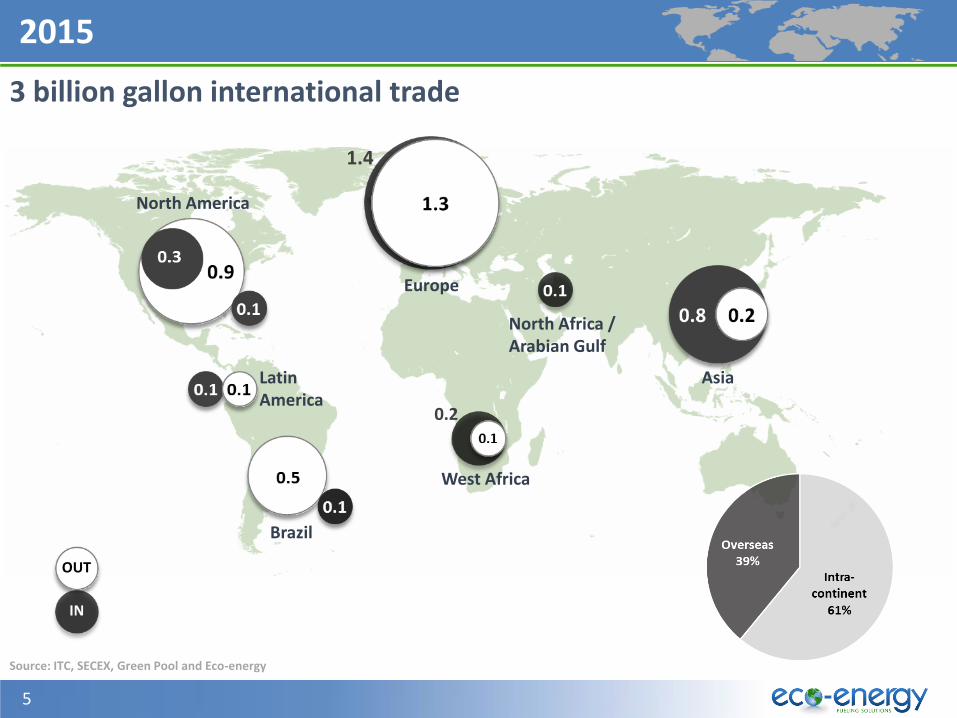
2015
3 billion gallon international trade
OUT
IN
Source: ITC, SECEX, Green Pool and Eco-energy
1.4
0.2
Europe
North Africa / Arabian Gulf
Asia
West Africa
Brazil
Latin America
North America
5
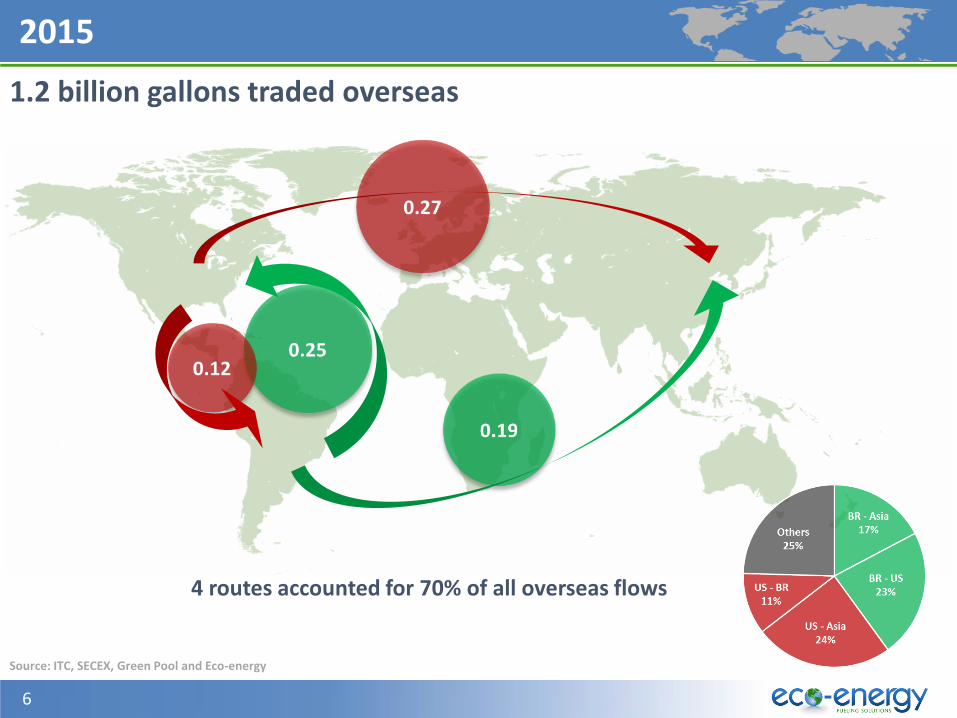
2015
6
1.2 billion gallons traded overseas
4 routes accounted for 70% of all overseas flows
Source: ITC, SECEX, Green Pool and Eco-energy
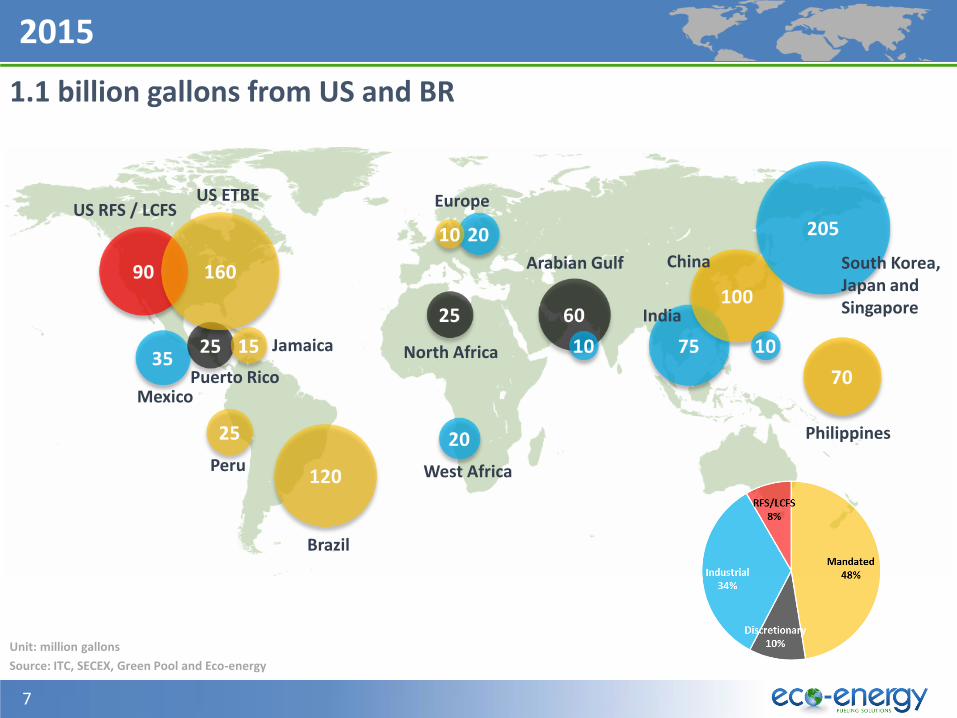
2015
7
Mexico
Jamaica
Peru
Brazil
West Africa
North Africa
Europe
Arabian Gulf
India
China South Korea, Japan and Singapore
Philippines
US ETBE
Puerto Rico
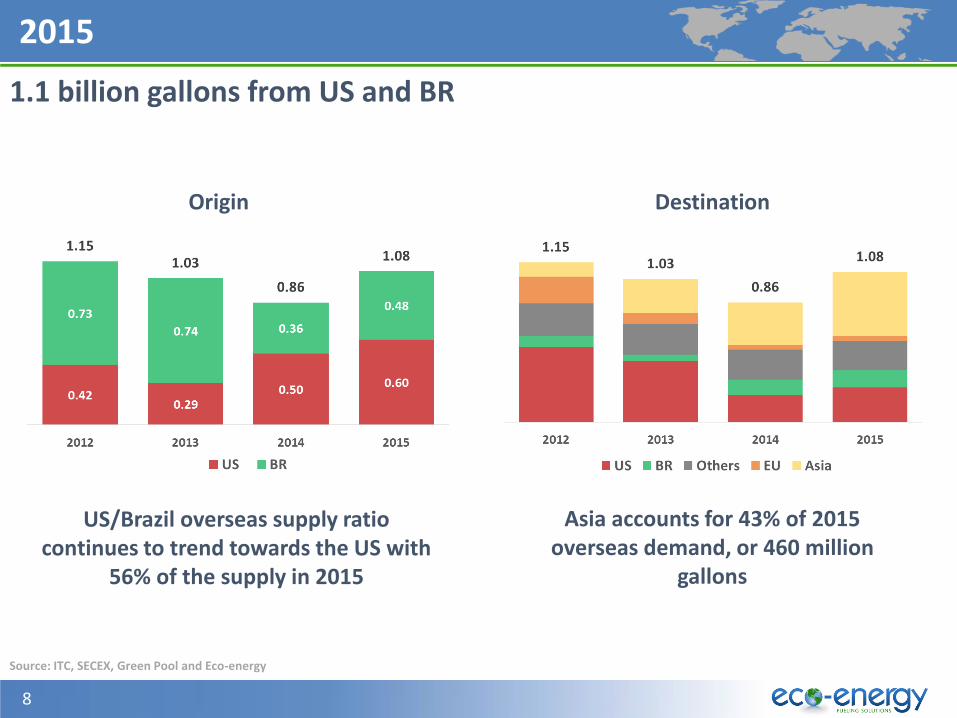
1.1 billion gallons from US and BR
US RFS / LCFS
Source: ITC, SECEX, Green Pool and Eco-energy
Unit: million gallons
2015
8
Asia accounts for 43% of 2015 overseas demand, or 460 million
gallons
US/Brazil overseas supply ratio continues to trend towards the US with
56% of the supply in 2015
Destination
Source: ITC, SECEX, Green Pool and Eco-energy
1.1 billion gallons from US and BR
Origin
Agenda
1 2015
2 Brazil
3 US Imports Parity
4 Global Exports Parity
5 2016
6 Conclusions
10
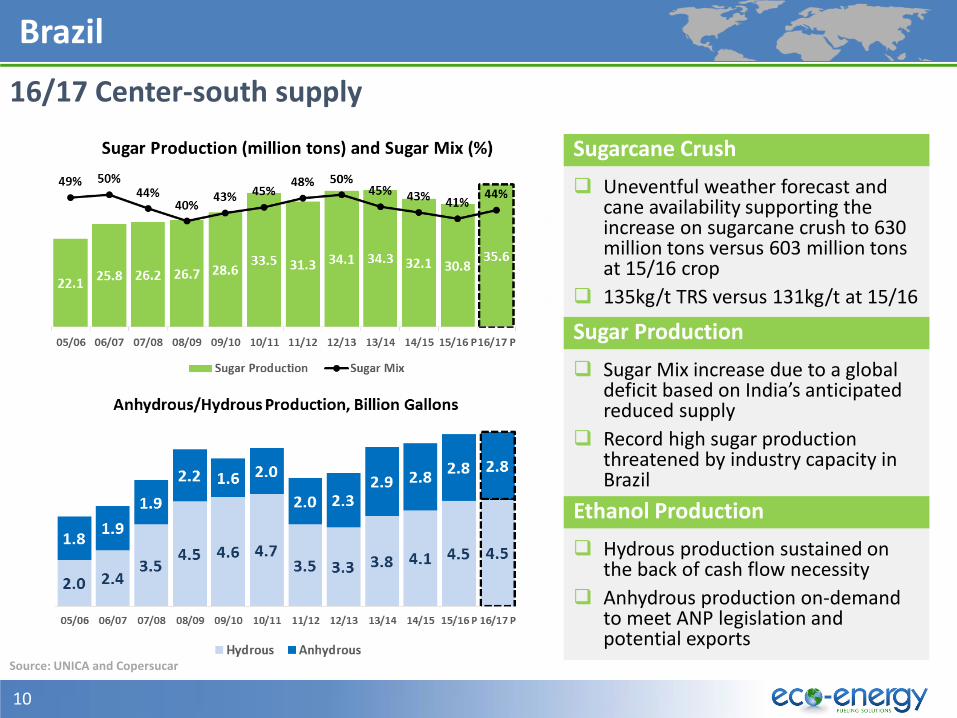
Brazil
Sugarcane Crush
Uneventful weather forecast and cane availability supporting the increase on sugarcane crush to 630 million tons versus 603 million tons at 15/16 crop
135kg/t TRS versus 131kg/t at 15/16
Sugar Production
Sugar Mix increase due to a global deficit based on India’s anticipated reduced supply
Record high sugar production threatened by industry capacity in Brazil
Ethanol Production
Hydrous production sustained on the back of cash flow necessity
Anhydrous production on-demand to meet ANP legislation and potential exports
16/17 Center-south supply
Source: UNICA and Copersucar
11
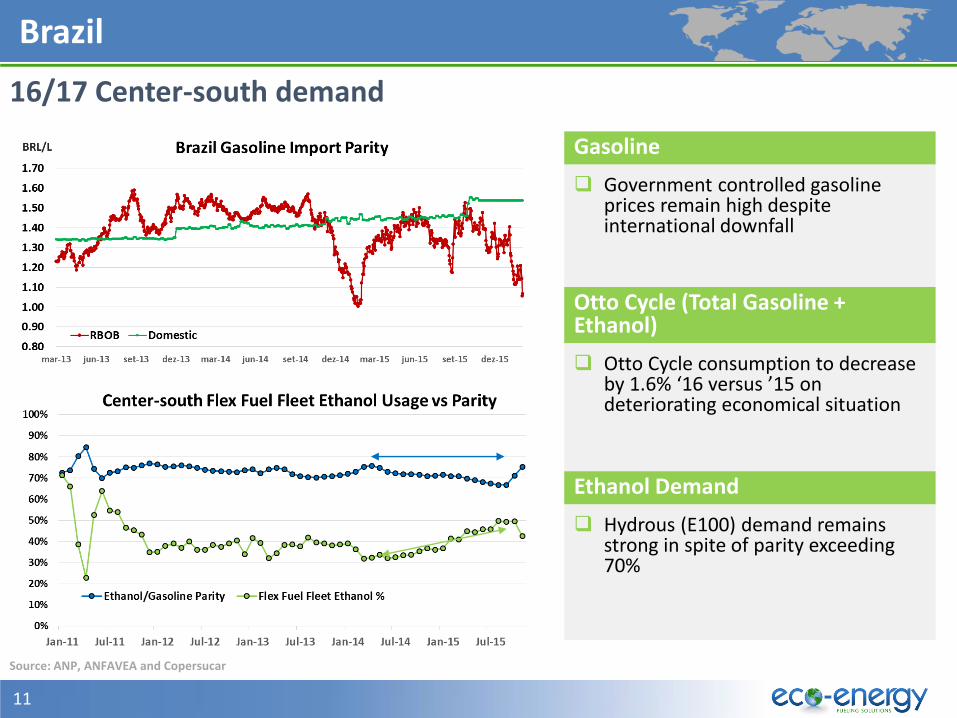
Brazil
Gasoline
Government controlled gasoline prices remain high despite international downfall
Otto Cycle (Total Gasoline + Ethanol)
Otto Cycle consumption to decrease by 1.6% ‘16 versus ’15 on deteriorating economical situation
Ethanol Demand
Hydrous (E100) demand remains strong in spite of parity exceeding 70%
16/17 Center-south demand
Source: ANP, ANFAVEA and Copersucar
12
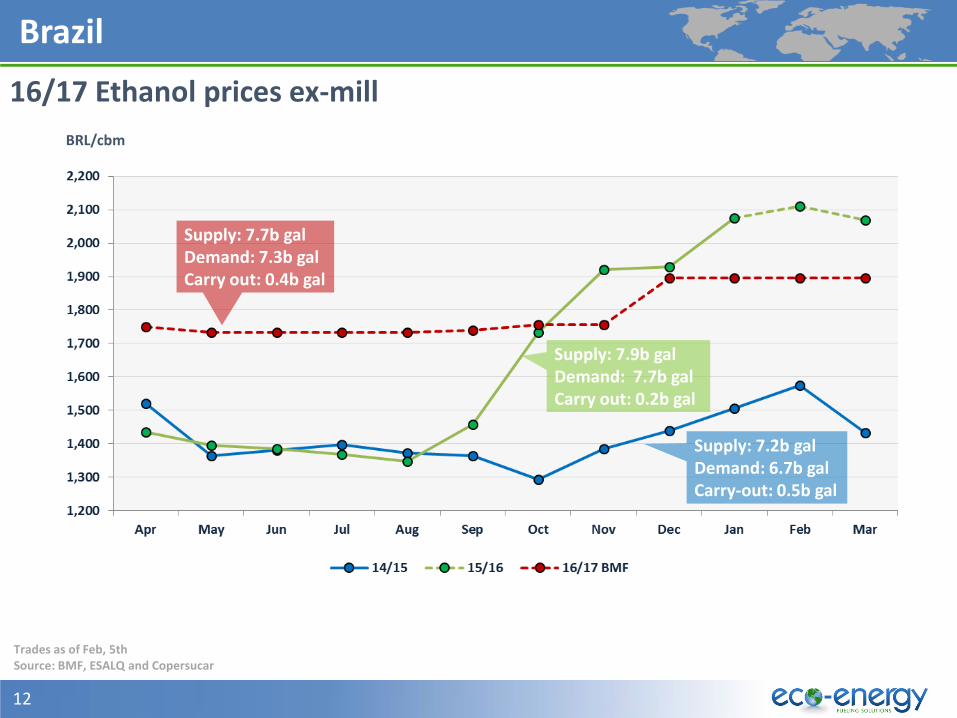
Brazil
Supply: 7.2b gal Demand: 6.7b gal Carry-out: 0.5b gal
16/17 Ethanol prices ex-mill
Supply: 7.9b gal Demand: 7.7b gal Carry out: 0.2b gal
Source: BMF, ESALQ and Copersucar
Supply: 7.7b gal Demand: 7.3b gal Carry out: 0.4b gal
BRL/cbm
Trades as of Feb, 5th
13
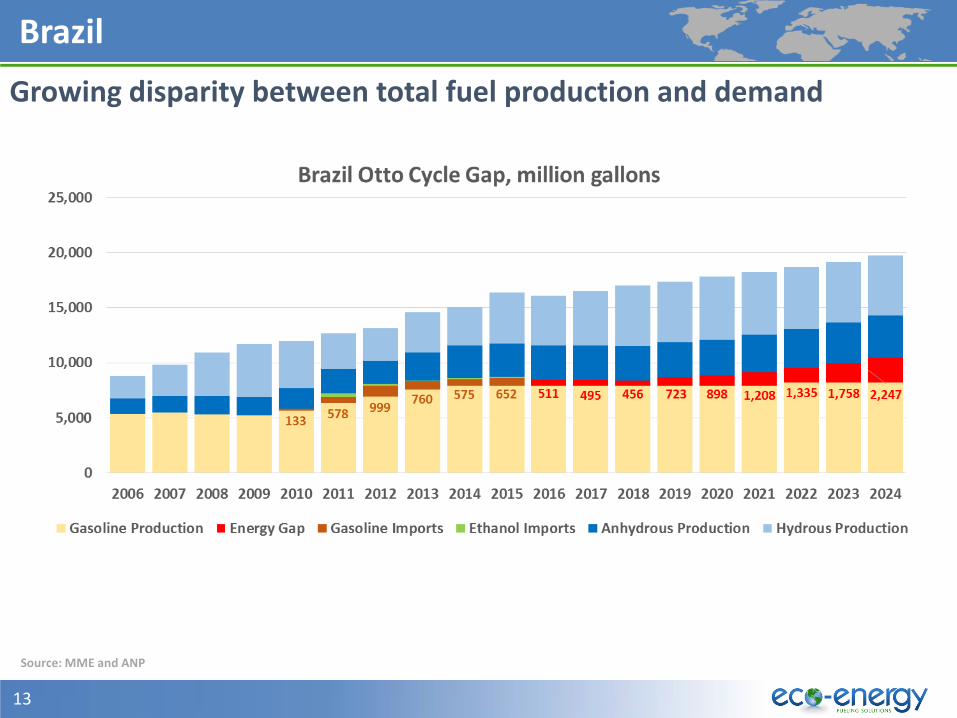
Brazil
Growing disparity between total fuel production and demand
Source: MME and ANP
Agenda
1 2015
2 Brazil
3 US Imports Parity
4 Global Exports Parity
5 2016
6 Conclusions
15
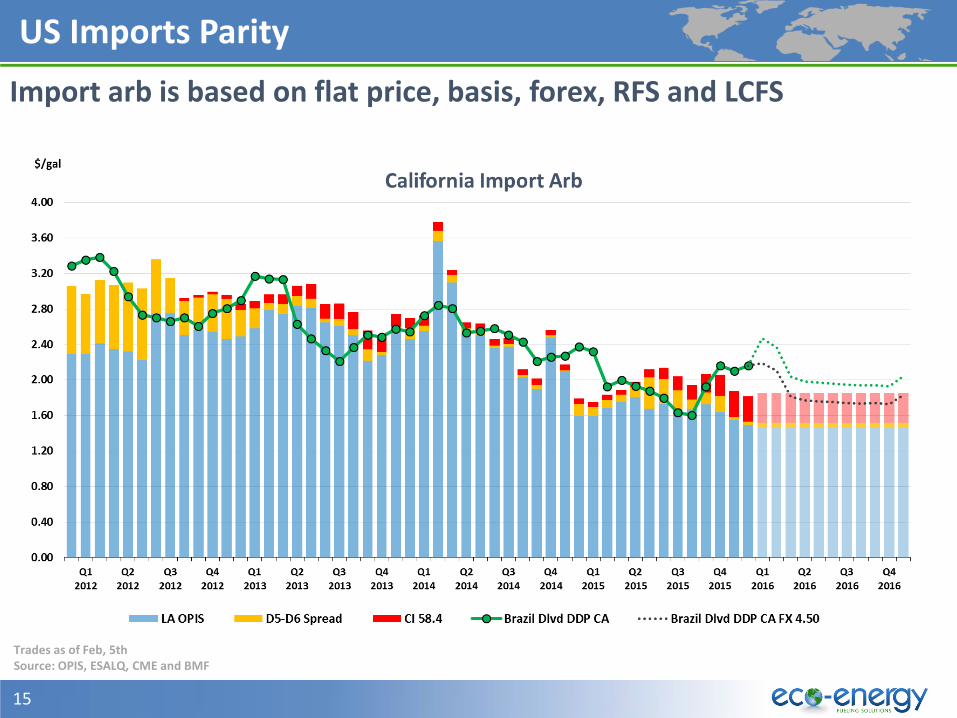
US Imports Parity
Import arb is based on flat price, basis, forex, RFS and LCFS
Source: OPIS, ESALQ, CME and BMF Trades as of Feb, 5th
16
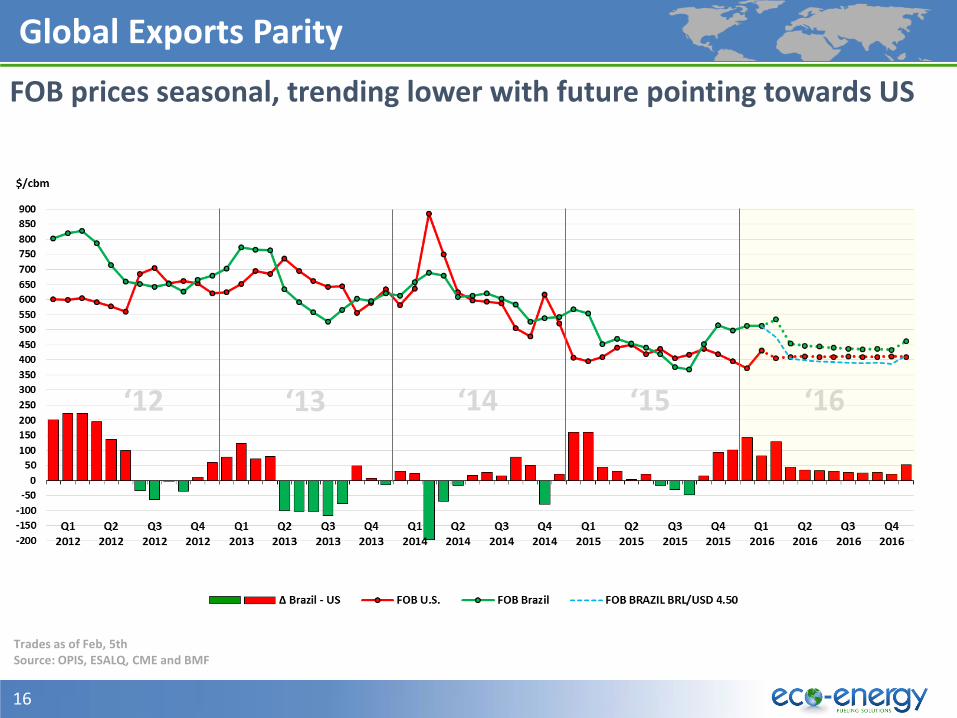
Global Exports Parity
FOB prices seasonal, trending lower with future pointing towards US
Source: OPIS, ESALQ, CME and BMF
‘12 ‘13 ‘14 ‘15 ‘16
Trades as of Feb, 5th
Agenda
1 2015
2 Brazil
3 US Imports Parity
4 Global Exports Parity
5 2016
6 Conclusions
18
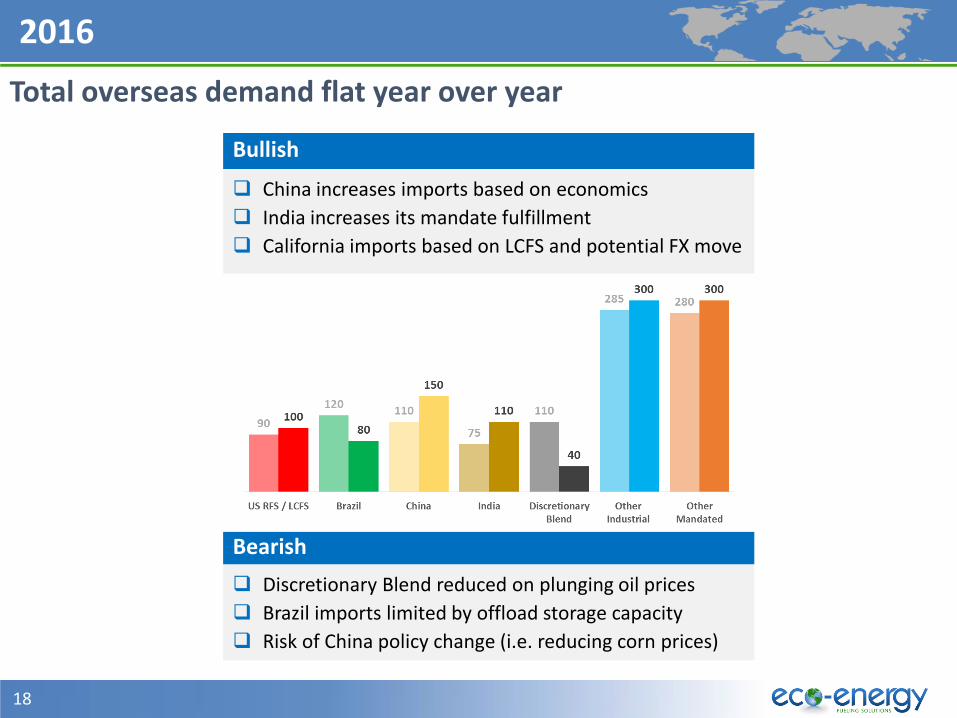
2016
Total overseas demand flat year over year
Bullish
China increases imports based on economics
India increases its mandate fulfillment
California imports based on LCFS and potential FX move
Bearish
Discretionary Blend reduced on plunging oil prices
Brazil imports limited by offload storage capacity
Risk of China policy change (i.e. reducing corn prices)
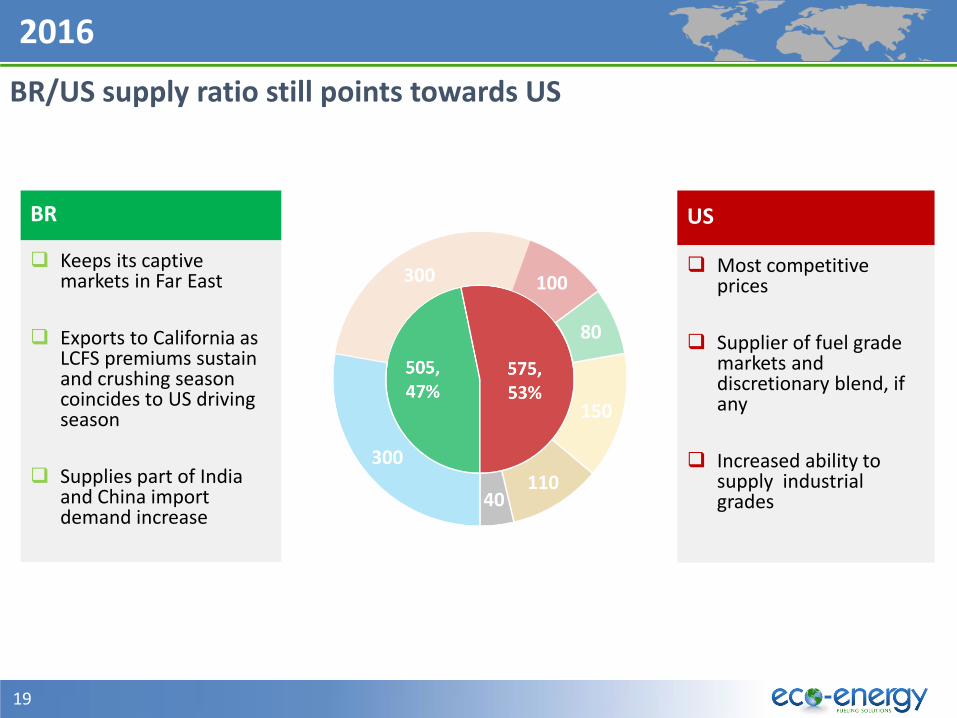
19
2016
BR/US supply ratio still points towards US
BR
Keeps its captive markets in Far East
Exports to California as LCFS premiums sustain and crushing season coincides to US driving season
Supplies part of India and China import demand increase
US
Most competitive prices
Supplier of fuel grade markets and discretionary blend, if any
Increased ability to supply industrial grades
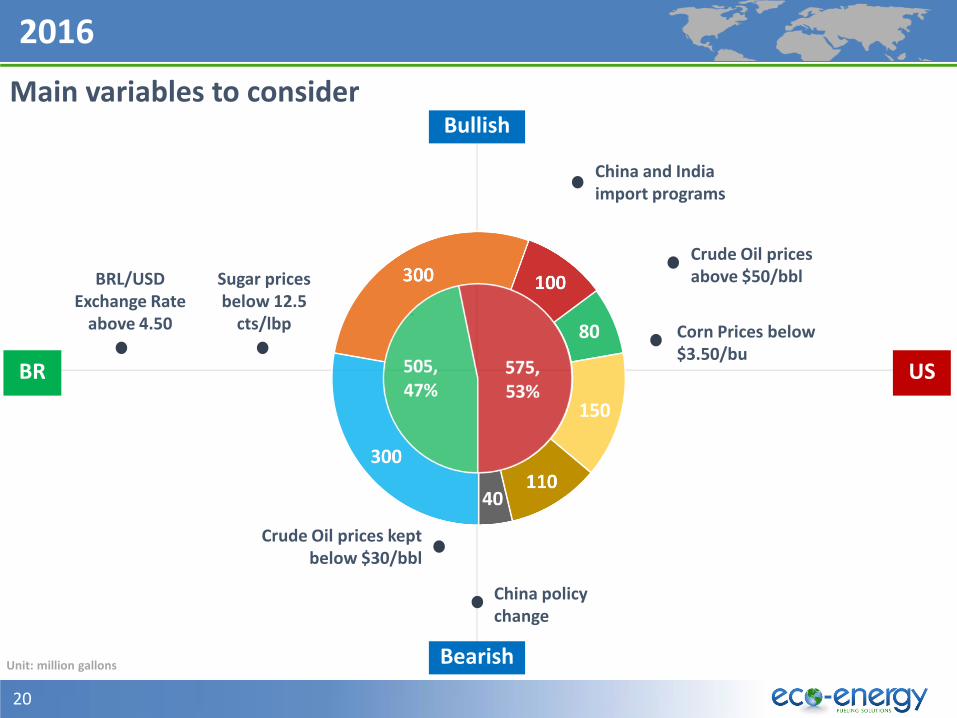
20
2016
RFS/LCFS
Sugar
Unit: million gallons
Sugar prices below 12.5
cts/lbp
BRL/USD Exchange Rate
above 4.50
China and India import programs
Crude Oil prices above $50/bbl
Corn Prices below $3.50/bu
Main variables to consider Bullish
Bearish
US BR
China policy change
Crude Oil prices kept below $30/bbl
21
Conclusions
Take-aways
Overseas demand flat year over year with China and India potentially replacing discretionary blend
Brazil/US ratio continuously pointing towards US
US imports to be opportunistic and limited in 2016
US remains significant net exporter
Brazil ethanol domestic consumption increasing versus its ethanol production in 16/17
Brazil short fuel mid and long term

Thank you