Alex Florea Michael Lavin Andrew Lee Victor Murthi Wei Yan March 11, 2010.
23
Alex Florea Michael Lavin Andrew Lee Victor Murthi Wei Yan March 11, 2010
-
Upload
kathlyn-burke -
Category
Documents
-
view
218 -
download
3
Transcript of Alex Florea Michael Lavin Andrew Lee Victor Murthi Wei Yan March 11, 2010.

Alex Florea
Michael Lavin
Andrew Lee
Victor Murthi
Wei Yan
March 11, 2010

Business OverviewWorld’s #1 fast-food chain by salesCompetitors:
Burger King Holdings, Inc. Yum! Bands, Inc. (KFC, Pizza Hut, Taco Bell, Long John Silver’s, and
A&W ) Wendy’s International, Inc. Doctor's Associates, Inc. (Subway)
Products: Hamburgers Chicken sandwiches and products French fries Breakfast items Salads Soft drinks Desserts
Source: http://www.adamseal.com/Portfolio/?p=261 (Assessed Nov. 15, 2009)
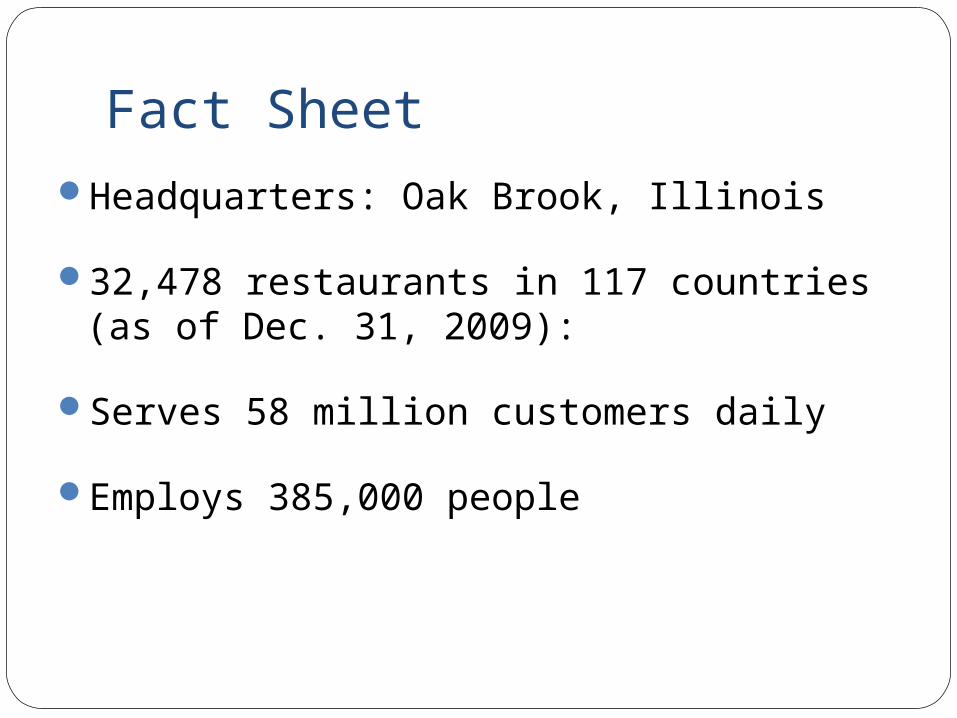
Fact SheetHeadquarters: Oak Brook, Illinois
32,478 restaurants in 117 countries (as of Dec. 31, 2009):
Serves 58 million customers daily
Employs 385,000 people

Types of RestaurantsCounter and drive-through servicesLocations:
Stand-alone basis in cities and suburban areasConnected to gas stations/convenience storesShopping mallsWal-Mart storesTruck stops
Features indoor and outdoor playgrounds for children

Business Model26,216 (80.72%) franchisee and affiliate
operated stores6,262 (19.28%) company operated stores Collects from franchisees:
Initial investment feesRoyalties (% of sales)Rent (% of sales)
Supply food and materials to restaurants through approved 3rd parties

FranchisingDown payment (Min. net worth of $.5MM)
25% for existing stores40% for new locations
FinancingEstablished relations with banks facilitate
loanOngoing Fees
4% of Sales Rent: Monthly base rent + % of Sales

Geographical Revenue Breakdown

Macroeconomic OutlookCompete in the high-margin beverages market with
"McCafe”Separate niches with McDonald's being the better value
proposition and Starbucks offering more of a quality experience
Strong International Growth is Driving Sales65% of sales occur outside of the United States
Changes in consumer preferencesConsumer preferences continue to gravitate towards healthy
mealsProviding free Wi-Fi in all U.S. outlets
Commodity Costs can Impact MarginsSince 2005, food prices have increased substantially, but
competition has prevented McDonald's from passing costs along to customers
Sensitive to the DollarHigher translated value

Industry OverviewThe current economic environment has
increased consumer focus on value, heightening pricing pressures across the industry
Higher commodity prices are driving increases in food costs.
Society's increasing awareness of the health risks associated with a high fat, salt and sugar diet.
Total market saturation Intense competitionLow level of concentration

Major Players
* Source: WikiInvest – McDonald’s on Feb. 21 2010
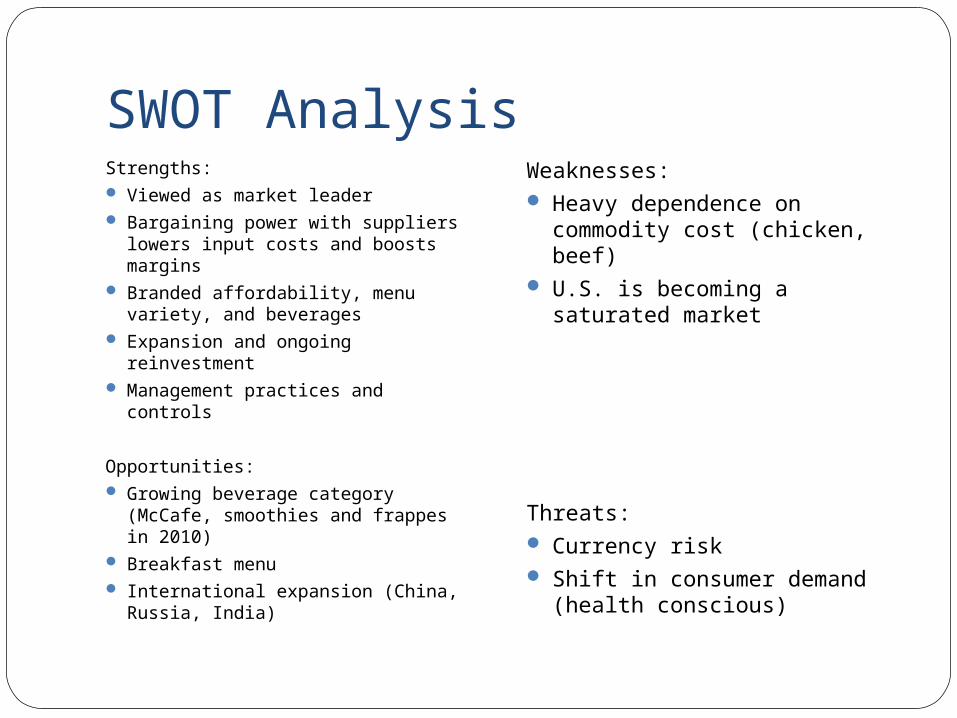
SWOT AnalysisStrengths: Viewed as market leader Bargaining power with suppliers
lowers input costs and boosts margins
Branded affordability, menu variety, and beverages
Expansion and ongoing reinvestment
Management practices and controls
Opportunities: Growing beverage category
(McCafe, smoothies and frappes in 2010)
Breakfast menu International expansion (China,
Russia, India)
Weaknesses: Heavy dependence on
commodity cost (chicken, beef)
U.S. is becoming a saturated market
Threats: Currency risk Shift in consumer demand
(health conscious)

5-Year Historical Performance
* Source: Yahoo Finance – McDonald’s on Feb. 21 2010

Recent News March. 15 (Future): Dividend payment of $0.55 / share
Feb. 10: Increases in comparable store sales growth for 20092.6% increase for United States – driven by continued
focus on classic menu favorites, dollar menus, McCafe, and Angus Burger
5.2% increase for Europe3.4% increase for APMEA
Jan. 22: Announced 2009Q4 EPS results of $1.03 (Analyst consensus $1.02)
Dec. 30: Unexpected departure of No.2 executive, Ralph Alvarez due to health concerns
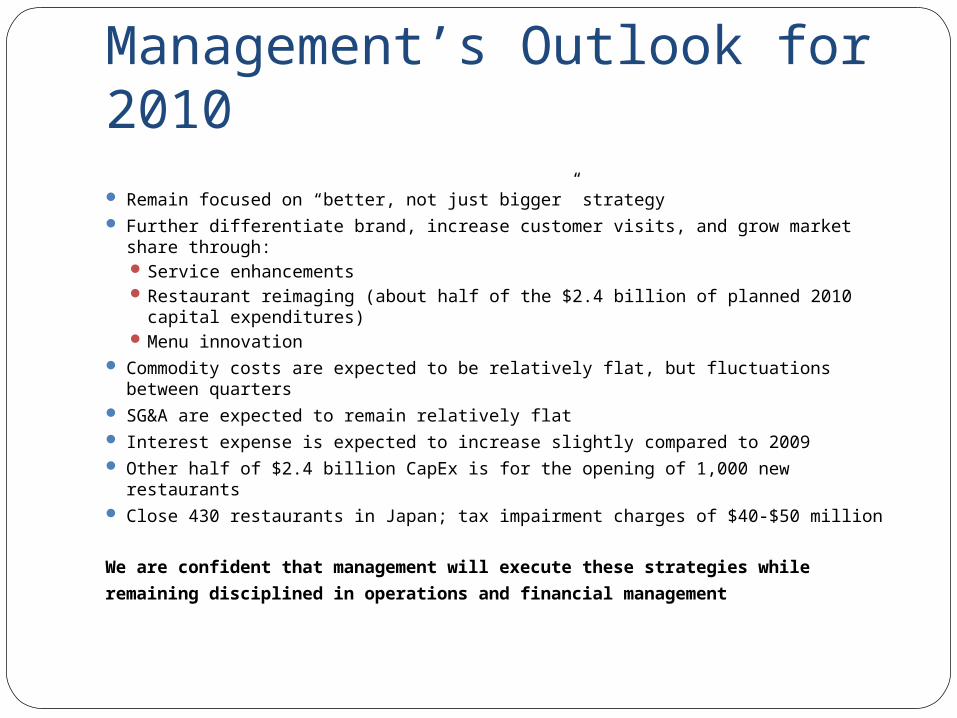
Management’s Outlook for 2010 Remain focused on “better, not just bigger” strategy Further differentiate brand, increase customer visits, and grow market share
through: Service enhancements Restaurant reimaging (about half of the $2.4 billion of planned 2010 capital
expenditures) Menu innovation
Commodity costs are expected to be relatively flat, but fluctuations between quarters
SG&A are expected to remain relatively flat Interest expense is expected to increase slightly compared to 2009 Other half of $2.4 billion CapEx is for the opening of 1,000 new restaurants Close 430 restaurants in Japan; tax impairment charges of $40-$50 million
We are confident that management will execute these strategies while
remaining disciplined in operations and financial management
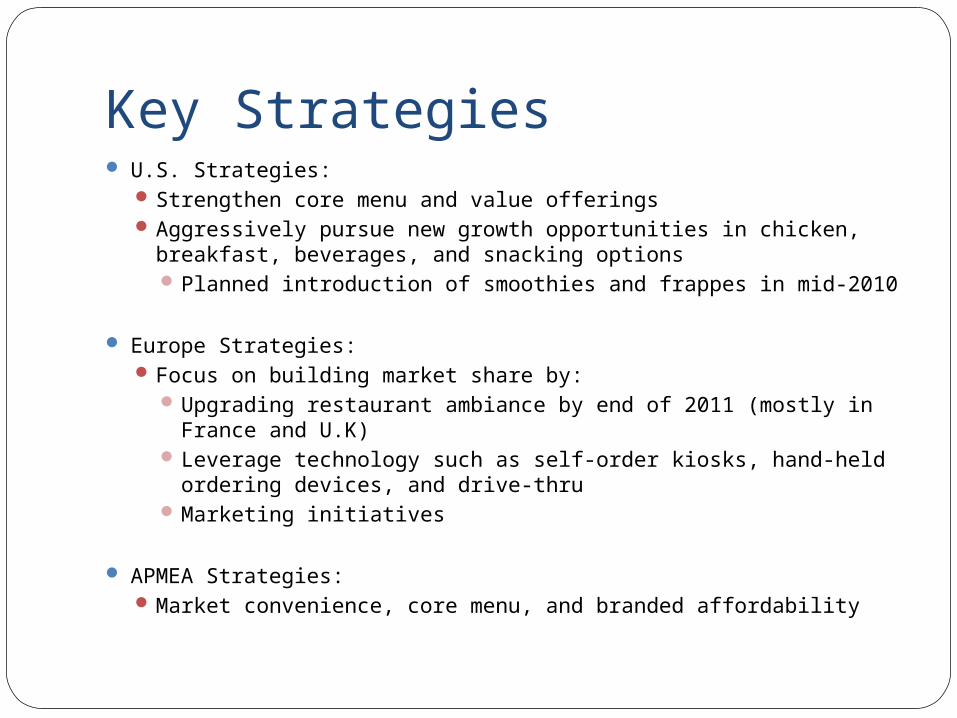
Key Strategies U.S. Strategies:
Strengthen core menu and value offeringsAggressively pursue new growth opportunities in chicken,
breakfast, beverages, and snacking optionsPlanned introduction of smoothies and frappes in mid-2010
Europe Strategies:Focus on building market share by:
Upgrading restaurant ambiance by end of 2011 (mostly in France and U.K)
Leverage technology such as self-order kiosks, hand-held ordering devices, and drive-thru
Marketing initiatives
APMEA Strategies:Market convenience, core menu, and branded affordability

Five-Step DuPont Analysis
Net Profit Margin
Sales per Restaurant
Comp. Sales Growth
ROE
2004 2005 2006 2007 2008 2009
EBIT/Sales (operating profit margin) 21% 21% 22% 24% 27% 29%
Sales/Assets (asset turnover) 67% 64% 72% 78% 83% 75%Interest/Assets (interest expense rate) 1% 1% 1% 1% 2% 2%
Assets/Equity (equity multiplier) 196% 198% 187% 192% 213% 215%
1-tax (tax retention rate) 71% 70% 69% 65% 70% 70%
ROE 13% 12% 15% 18% 20% 19%

Income Statement Assumptions
Forecast Assumptions2010 2011 2012-2015
Growth for company-operated sales 2.00% 5.00% 7.00%
Growth for franchised revenues 10% 11% 12%
COGS Margin62% 62% 62%
SG&A Margin9% 9% 9%
Income tax rate30% 30% 30%
Business
Check/Update

WACC CalculationCost of Equity ROE
ROE 21.32%Cost of Equity CAPM
beta 0.60
risk-free 2.42%equity premium 5.50%
CAPM 5.71%
Cost of Debt 4.11%
CAPM WACC = 5.04% ROE WACC = 16.96%
40% 60%
Triangulation = 12.19%

Discounted Cash FlowFCFF 3,335.24 3,882.20 4,395.34 4,880.06 5,415.93 6,008.41 6,969.22
Terminal Value
FCF Exit Multiple 19.25134,155.
21
Perpetuity Growth75,794.5
9
Discount Rate 12.19%
PV of FCF's 3,335.24 3,460.23 3,491.77 3,455.46 3,418.07 46,015.50
Sum of FCFs 63,176.28
DCF Valuation
Perpetuity
GrowthExit
Multiple
PV of Firm 63,176.28 96,005.06
Less Net Debt 12,052.00 12,052.00
Equity Value of Firm 51,124.28 83,953.06
Shares Outstanding 1,077.00 1,077.00
Value per Share 47.47 77.95
Business
Update

Public Comparables Analysis
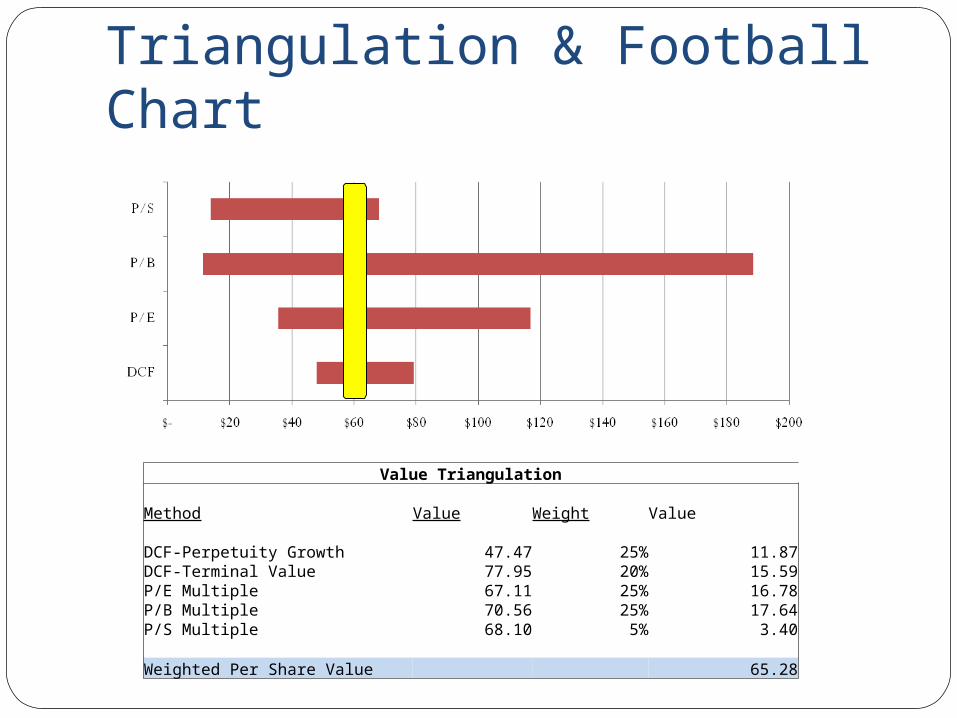
Triangulation & Football Chart
Value Triangulation Method Value Weight Value DCF-Perpetuity Growth 47.47 25% 11.87DCF-Terminal Value 77.95 20% 15.59P/E Multiple 67.11 25% 16.78P/B Multiple 70.56 25% 17.64P/S Multiple 68.10 5% 3.40 Weighted Per Share Value 65.28
Business
Update

Management Assessment The management has been consistent in its dividend policy: In
2009, the company returned $5.1B to shareholders through a combination of shares repurchased and dividends paid, bringing the three-year total to $16.6B (consistent with management’s $15B - $17B target).
Management reviews and analyzes business results in constant currencies however we believe the company has been conservative in hedging the currency risk.
Management continues to evaluate opportunities to optimize the mix of franchised and company-owned operations to boost the competitive margin.
McCafe had met sales expectations and has benefited from the high level of advertising that McDonald's has committed to it. Coffee sales now make up 5% of McDonald's total sales. We are confident that similar attention will be devoted to developing the rollout of more beverages in 2010.

RecommendationHoldings in McDonald’s are currently 200
shares bought at $52.44Closing price on March 10, 2010 was $64.94Using a triangulation of the methodologies, the
calculated intrinsic value is $65.28Qualitative factors:
MCD is a very attractive company with strong management
The stock is at an all time highMCD might outperform the market and its peers
during a market correction HOLD, but buy 100 shares if price falls to HOLD, but buy 100 shares if price falls to
$60.00$60.00
Business
Update