Alcohol Health and Social Problems: Policy Research Status and Opportunities Presentation to the...
20
Alcohol Health and Social Problems: Alcohol Health and Social Problems: Policy Research Status and Opportunities Policy Research Status and Opportunities Presentation to the Substance Use, Abuse, and Addiction Working Group, Scientific Management Review Board, NIH September 23, 2009 Thomas K. Greenfield, PhD, Center Director and Scientific Director Alcohol Research Group, Public Health Institute, Emeryville CA; Clinical Faculty, CSRTP, Department of Psychiatry University of California San Francisco Alcohol Research Alcohol Research Group Group National Alcohol Research National Alcohol Research Center Center
-
Upload
amanda-berry -
Category
Documents
-
view
213 -
download
0
Transcript of Alcohol Health and Social Problems: Policy Research Status and Opportunities Presentation to the...

Alcohol Health and Social Problems:Alcohol Health and Social Problems:Policy Research Status and OpportunitiesPolicy Research Status and Opportunities
Presentation to the Substance Use, Abuse, and Addiction Working Group,
Scientific Management Review Board, NIHSeptember 23, 2009
Thomas K. Greenfield, PhD,
Center Director and Scientific DirectorAlcohol Research Group, Public Health Institute, Emeryville CA;
Clinical Faculty, CSRTP, Department of PsychiatryUniversity of California San Francisco
Alcohol Research GroupAlcohol Research GroupNational Alcohol Research CenterNational Alcohol Research Center

Presenter DisclosuresPresenter Disclosures
The following personal financial relationships with organizations relevant to this presentation existed during the past 12 months:
Thomas K Greenfield
I am a grantee of NIAAA, a member of its Extramural Advisory Board, and serve on the Governing Council of the American Public Health Association

Overview of Topics covered Overview of Topics covered in my written submissionin my written submission
• Generating new knowledge that leads to improved health outcomes
• Linking alcohol consumption, patterns and problems
• Alcohol’s role in the burden of disease, both globally and nationally
• Estimates of social costs, state and federal revenues and market controls
• Studying alcohol externalities or harm to others, and drinking contexts
• Effects of alcohol policy changes

Prevention Policies “[Prevention policies] are all policies that operate in
a non- personalized way to alter the set of contingencies affecting individuals as they drink or engage in activities that (when combined with intoxication) are considered risky.”1
“Alcohol policy is defined broadly as any purposeful effort or authoritative decision on the part of government or non-government groups to minimize or prevent alcohol-related consequences.” 2
1Moore & Gerstein (1981), p 53 Beyond the Shadow of Prohibition2Babor et al. (2003), p 95 Alcohol: No Ordinary Commodity

Alcohol, Tobacco & DrAlcohol, Tobacco & Druugs Impose big gs Impose big BBurdens:urdens:Preventable Risks Preventable Risks in the GBDin the GBD, 2000 (, 2000 (% % total DALYS)total DALYS)
Developing countriesDeveloped countries
High mortality Low mortality
Underweight 14.9% Alcohol 6.2 % Tobacco 12.2 %
Unsafe sex 10.2 % Blood pressure 5.0 % Blood pressure 10.9 %
Unsafe water & sanitation 5.5 % Tobacco 4.0 % Alcohol 9.2 %
Indoor smoke (solid fuels) 3.6 % Underweight 3.1 % Cholesterol 7.6 %
Zinc deficiency 3.2 % Body mass index 2.7 % Body mass index 7.4 %
Iron deficiency 3.1 % Cholesterol 2.1 % Low fruit & vegetable intake 3.9 %
Vitamin A deficiency 3.0 % Low fruit & vegetable intake 1.9 % Physical inactivity 3.3 %
Blood pressure 2.5 % Indoor smoke from solid fuels 1.9 % Illicit drugs 1.8 %
Tobacco 2.0 % Iron deficiency 1.8 % Unsafe sex 0.8 %
Cholesterol 1.9 % Unsafe water & sanitation 1.8 % Iron deficiency 0.7 %
Ezzati M, Lopez A, Vander Hoorn S, Rodgers A, Murray CJL, CRA Collaborative Group. Selected major risk factors and global regional burden of disease. Lancet 2002; 360(9343):1347-1360
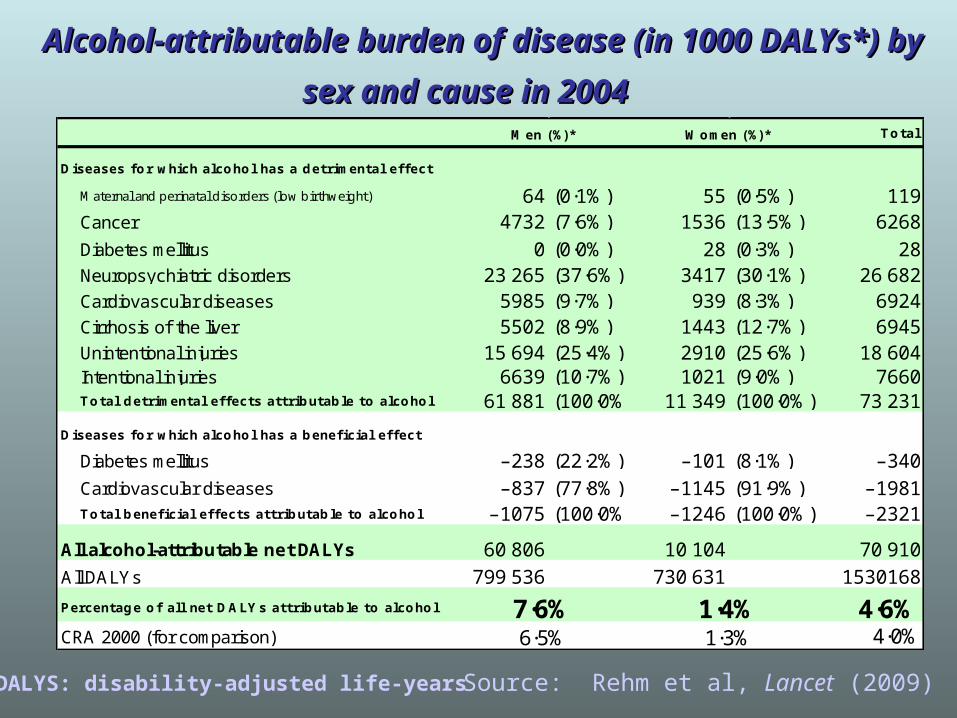
Alcohol-attributable burden of disease (in 1000 DALYs*) Alcohol-attributable burden of disease (in 1000 DALYs*)
by sex and cause in 2004by sex and cause in 2004 Total
Diseases for which alcohol has a detrimental eff ect
Maternal and perinatal disorders (low birthweight) 64 (0·1%) 55 (0·5%) 119Cancer 4732 (7·6%) 1536 (13·5%) 6268
Diabetes mellitus 0 (0·0%) 28 (0·3%) 28Neuropsychiatric disorders 23 265 (37·6%) 3417 (30·1%) 26 682Cardiovascular diseases 5985 (9·7%) 939 (8·3%) 6924Cirrhosis of the liver 5502 (8·9%) 1443 (12·7%) 6945Unintentional injuries 15 694 (25·4%) 2910 (25·6%) 18 604Intentional injuries 6639 (10·7%) 1021 (9·0%) 7660Total detrimental eff ects attributable to alcohol 61 881 (100·0% 11 349 (100·0%) 73 231
Diseases for which alcohol has a beneficial eff ect
Diabetes mellitus
Cardiovascular diseases –837 (77·8%) –1145 (91·9%) –1981Total beneficial eff ects attributable to alcohol –1075 (100·0% –1246 (100·0%) –2321
All alcohol-attributable net DALYs 60 806 10 104 70 910
All DALYs 799 536 730 631 1530168
Percentage of all net DALYs attributable to alcohol 4·6%CRA 2000 (for comparison) 4·0%
7·6% 1·4%6·5% 1·3%
–340
Men (%)* Women (%)*
–238 (22·2%) –101 (8·1%)
* DALYS: disability-adjusted life-years Source: Rehm et al, Lancet (2009)

Source: Kerr, Greenfield, Tujague, & Brown (2005)
U.S. Per Capita Consumption of Pure Alcohol from Beer, Wine and Spirits
0.00
0.25
0.50
0.75
1.00
1.25
1.50
1.75
2.00
2.25
2.50
2.75
3.00
1950
1952
1954
1956
1958
1960
1962
1964
1966
1968
1970
1972
1974
1976
1978
1980
1982
1984
1986
1988
1990
1992
1994
1996
1998
2000
2002
Ga
llon
s o
f Alc
oh
ol
Spirits
Wine
Beer
Total Alcohol
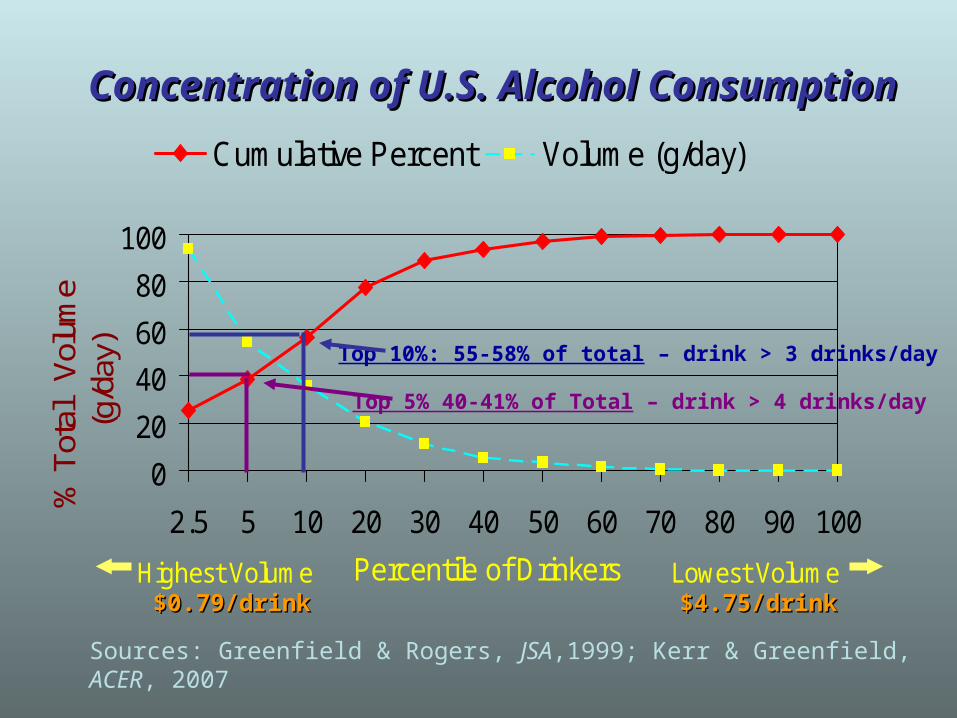
Concentration of U.S. Alcohol ConsumptionConcentration of U.S. Alcohol Consumption
0
20
40
60
80
100
2.5 5 10 20 30 40 50 60 70 80 90 100
Highest Volume Percentile of Drinkers Lowest Volume
% T
otal
V
olum
e (g
/day
)
Cumulative Percent Volume (g/day)
Sources: Greenfield & Rogers, JSA,1999; Kerr & Greenfield, ACER, 2007
Top 10%: 55-58% of total – drink > 3 drinks/day
Top 5% 40-41% of Total – drink > 4 drinks/day
$0.79/drink$0.79/drink $4.75/drink$4.75/drink
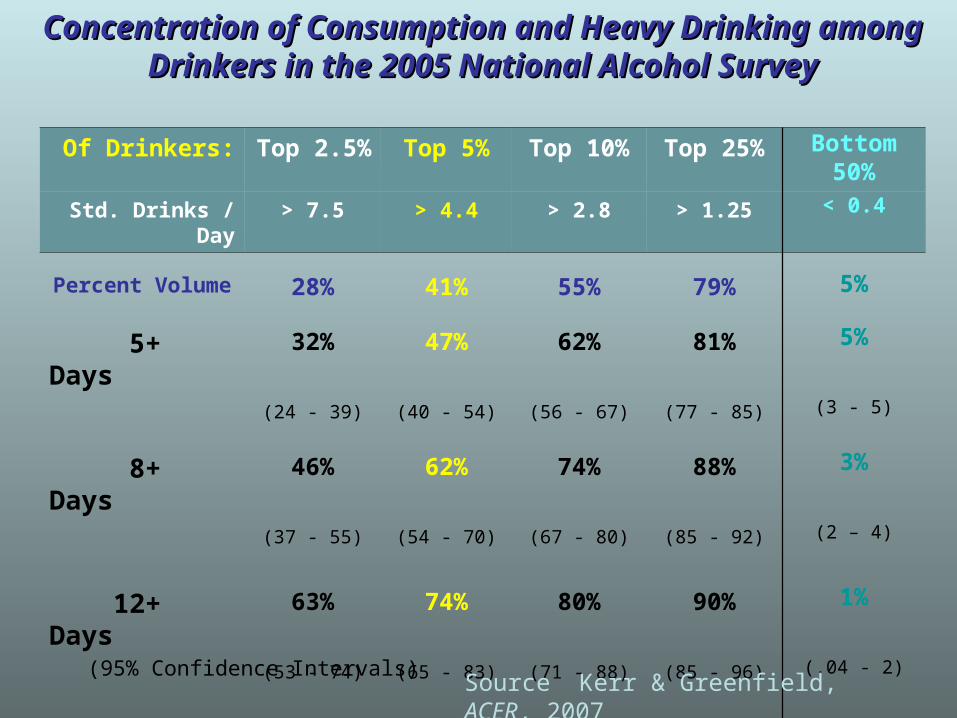
Concentration of Consumption and Heavy Drinking Concentration of Consumption and Heavy Drinking among Drinkers in the 2005 National Alcohol Surveyamong Drinkers in the 2005 National Alcohol Survey
(95% Confidence Intervals)
Of Drinkers: Top 2.5% Top 5% Top 10% Top 25% Bottom 50%
Std. Drinks / Day > 7.5 > 4.4 > 2.8 > 1.25 < 0.4
Percent Volume 28% 41% 55% 79% 5%
5+ Days 32% 47% 62% 81% 5%
(24 - 39) (40 - 54) (56 - 67) (77 - 85) (3 - 5)
8+ Days 46% 62% 74% 88% 3%
(37 - 55) (54 - 70) (67 - 80) (85 - 92) (2 – 4)
12+ Days 63% 74% 80% 90% 1%
(53 - 74) (65 - 83) (71 - 88) (85 - 96) (.04 - 2)
Source Kerr & Greenfield, ACER, 2007
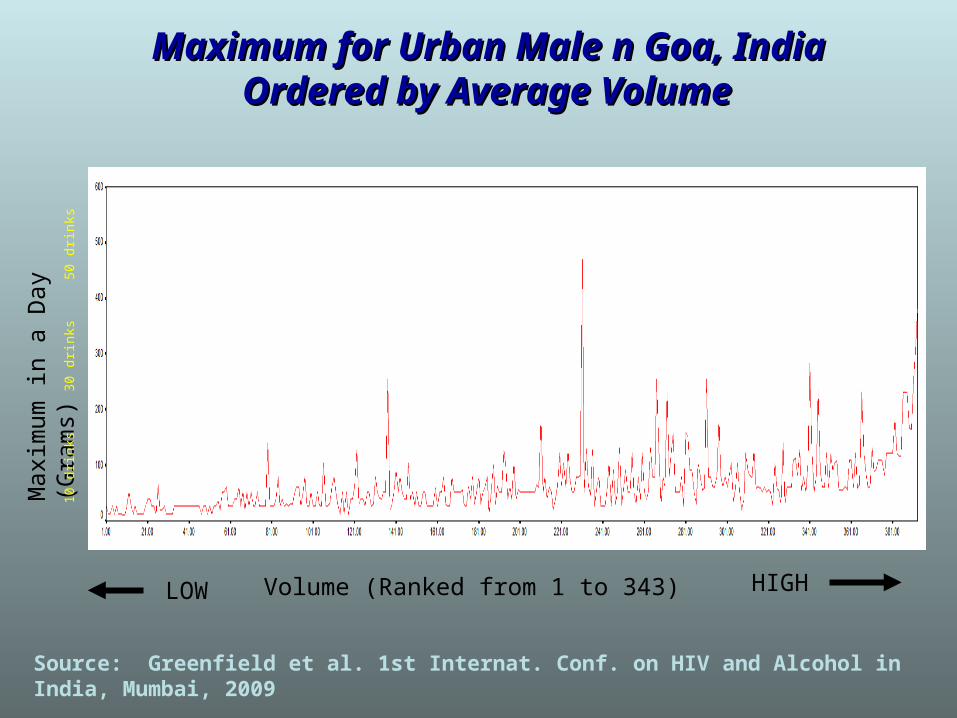
Volume (Ranked from 1 to 343)
Max
imum
in a
Day
(G
ram
s)10
drin
ks30
drin
ks50
drin
ksMaximum for Urban Male n Goa, India Maximum for Urban Male n Goa, India
Ordered by Average VolumeOrdered by Average Volume
LOW HIGH
Source: Greenfield et al. 1st Internat. Conf. on HIV and Alcohol in India, Mumbai, 2009
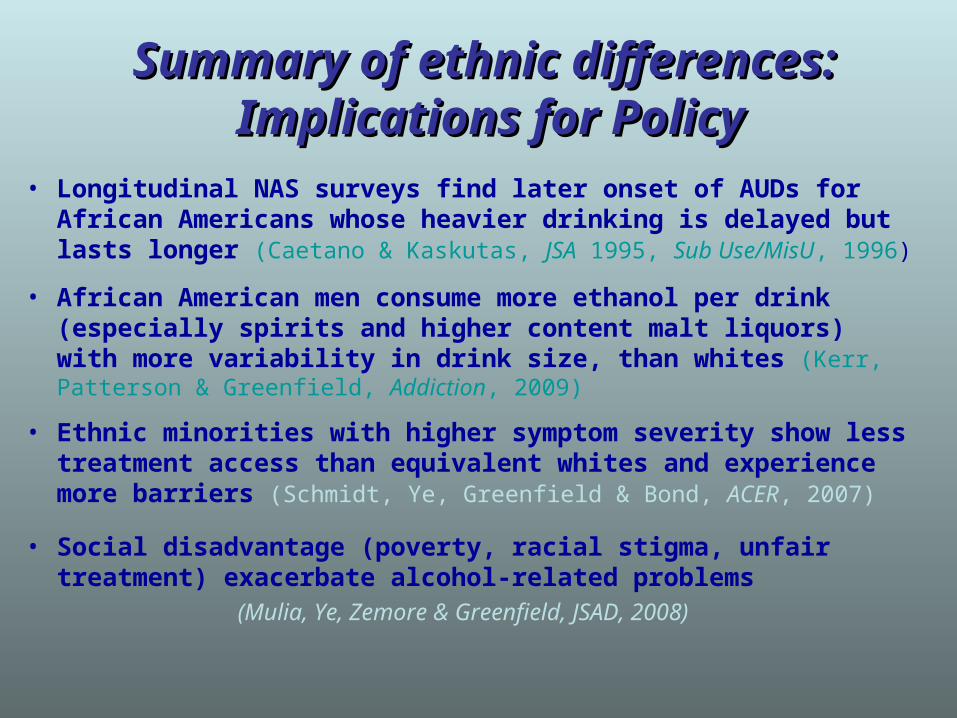
Summary of ethnic differences: Summary of ethnic differences: Implications for PolicyImplications for Policy
• Longitudinal NAS surveys find later onset of AUDs for African Americans whose heavier drinking is delayed but lasts longer (Caetano & Kaskutas, JSA 1995, Sub Use/MisU, 1996)
• African American men consume more ethanol per drink (especially spirits and higher content malt liquors) with more variability in drink size, than whites (Kerr, Patterson & Greenfield, Addiction, 2009)
• Ethnic minorities with higher symptom severity show less treatment access than equivalent whites and experience more barriers (Schmidt, Ye, Greenfield & Bond, ACER, 2007)
• Social disadvantage (poverty, racial stigma, unfair treatment) exacerbate alcohol-related problems
(Mulia, Ye, Zemore & Greenfield, JSAD, 2008)

Social disadvantage is associated with Social disadvantage is associated with alcohol-related social & health problemsalcohol-related social & health problems
0%
5%
10%
15%
20%
25%
30%
35%
POVERTY UNFAIR TX STIGMA EXTDISADV
lowmedhigh
***
***
***
***
***p<.001
% reporting1 or more tangible
consequences
Source: Mulia, Ye, Zemore & Greenfield, JSAD, 2008
Note: Consequences = criminal justice, accidents,family, aggression, workplace or health problems
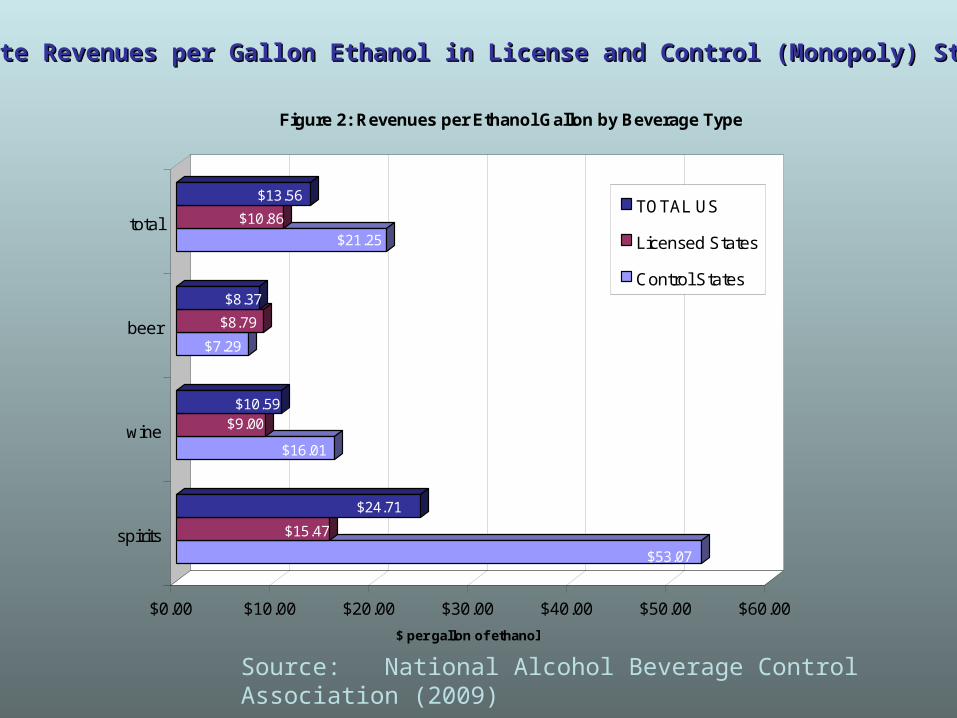
$53.07
$15.47
$24.71
$16.01
$9.00$10.59
$7.29
$8.79
$8.37
$21.25
$10.86
$13.56
$0.00 $10.00 $20.00 $30.00 $40.00 $50.00 $60.00
$ per gallon of ethanol
spirits
wine
beer
total
Figure 2: Revenues per Ethanol Gallon by Beverage Type
TOTAL US
Licensed States
Control States
State Revenues per Gallon Ethanol in License and Control (Monopoly) StatesState Revenues per Gallon Ethanol in License and Control (Monopoly) States
Source: National Alcohol Beverage Control Association (2009)
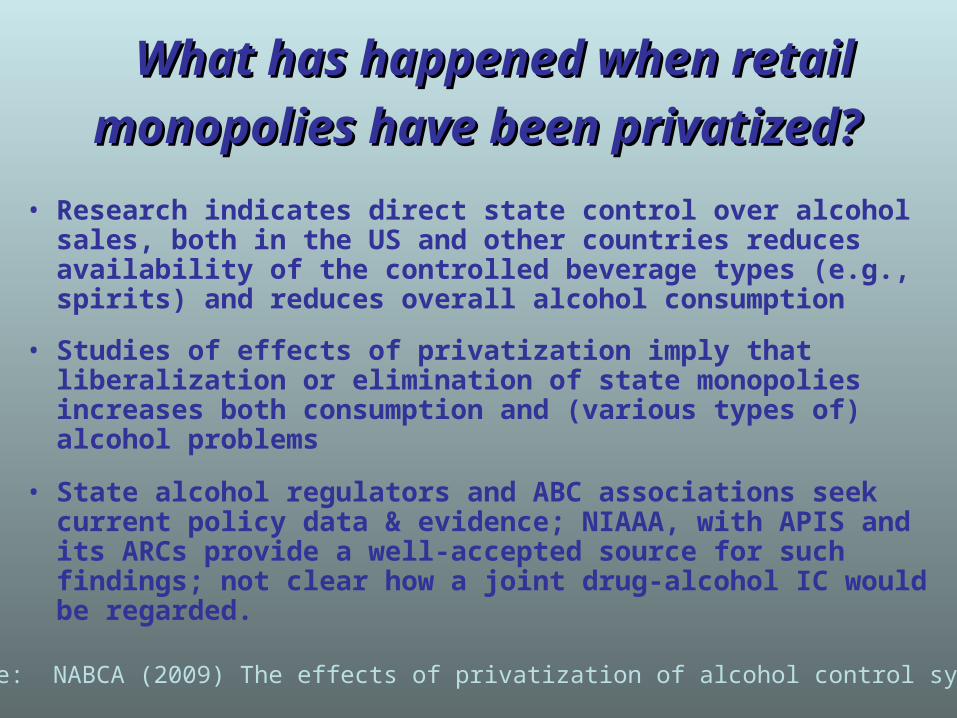
What has happened when retail What has happened when retail
monopolies have been privatized?monopolies have been privatized? • Research indicates direct state control over alcohol sales,
both in the US and other countries reduces availability of the controlled beverage types (e.g., spirits) and reduces overall alcohol consumption
• Studies of effects of privatization imply that liberalization or elimination of state monopolies increases both consumption and (various types of) alcohol problems
• State alcohol regulators and ABC associations seek current policy data & evidence; NIAAA, with APIS and its ARCs provide a well-accepted source for such findings; not clear how a joint drug-alcohol IC would be regarded.
Source: NABCA (2009) The effects of privatization of alcohol control systems

Externalities in 2005: Ever Harmed by Someone Else’s Drinking?Externalities in 2005: Ever Harmed by Someone Else’s Drinking?
Source: Greenfield APHA 2006 (under review)
0% 10% 20% 30% 40% 50% 60%
Passenger w / DrunkDriver
Being Assulted
Family/MarriageHarms
Property Vandalized
Vehicular Accident
Financial Harms
Women Men
W
W
M
M
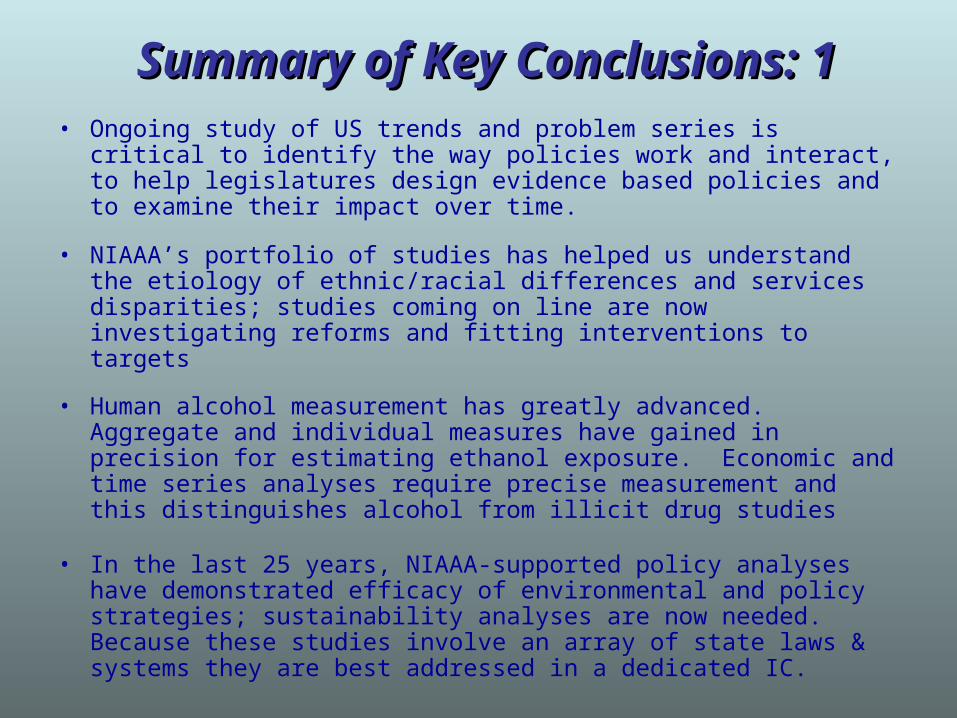
Summary of Key Conclusions: 1Summary of Key Conclusions: 1• Ongoing study of US trends and problem series is critical to identify
the way policies work and interact, to help legislatures design evidence based policies and to examine their impact over time.
• NIAAA’s portfolio of studies has helped us understand the etiology of ethnic/racial differences and services disparities; studies coming on line are now investigating reforms and fitting interventions to targets
• Human alcohol measurement has greatly advanced. Aggregate and individual measures have gained in precision for estimating ethanol exposure. Economic and time series analyses require precise measurement and this distinguishes alcohol from illicit drug studies
• In the last 25 years, NIAAA-supported policy analyses have demonstrated efficacy of environmental and policy strategies; sustainability analyses are now needed. Because these studies involve an array of state laws & systems they are best addressed in a dedicated IC.
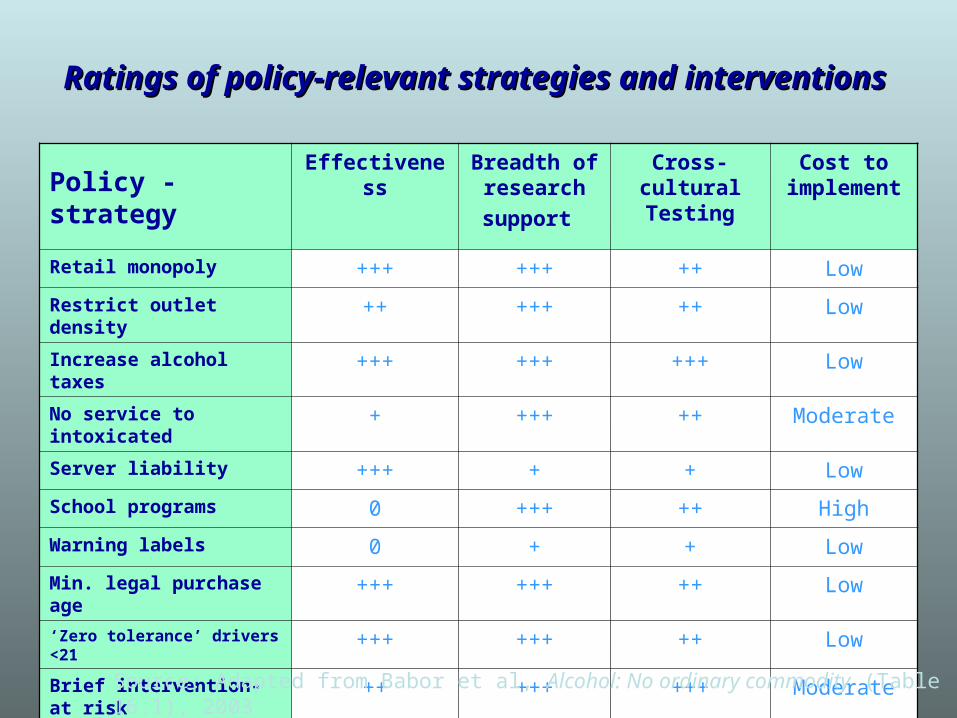
Ratings of policy-relevant strategies and interventionsRatings of policy-relevant strategies and interventions
Policy - strategy
Effectiveness Breadth of research
support
Cross-cultural Testing
Cost to implement
Retail monopoly +++ +++ ++ Low
Restrict outlet density ++ +++ ++ Low
Increase alcohol taxes +++ +++ +++ Low
No service to intoxicated + +++ ++ Moderate
Server liability +++ + + Low
School programs 0 +++ ++ High
Warning labels 0 + + Low
Min. legal purchase age +++ +++ ++ Low
‘Zero tolerance’ drivers <21 +++ +++ ++ Low
Brief intervention-at risk ++ +++ +++ Moderate
Source: Adapted from Babor et al, Alcohol: No ordinary commodity (Table 16.1), 2003

Key Points 2Key Points 2
• Public opinions about alcohol policies and prevention show erosion
• NIAAA is in the best position to focus efforts to mobilize research that will inform the public, Congress and the states on effective treatments and policies needed to address alcohol problems
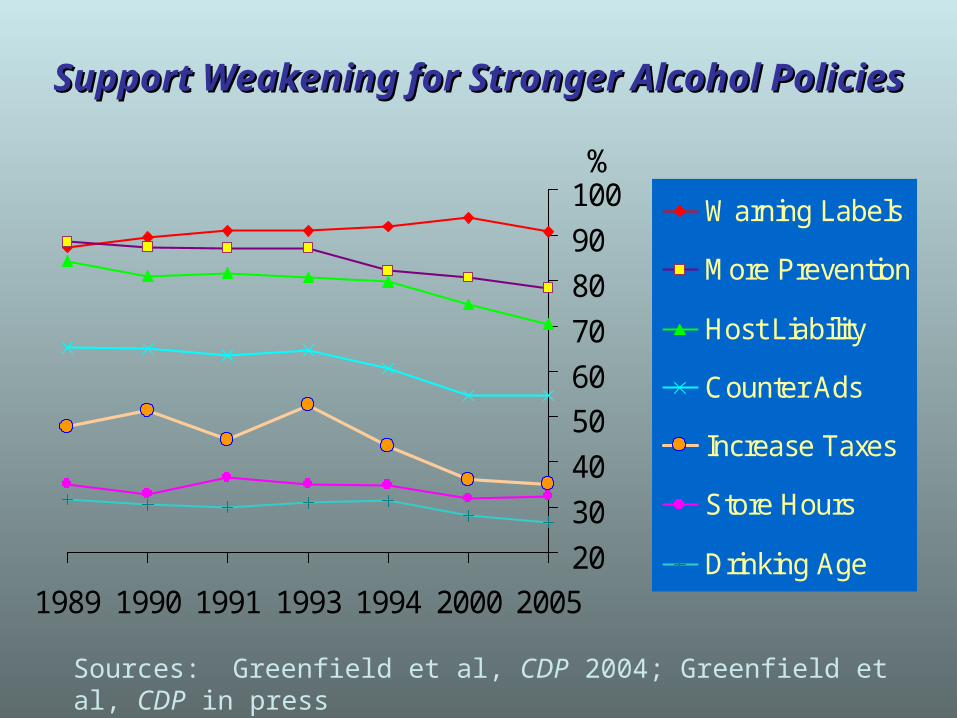
Support Weakening for Stronger Alcohol PoliciesSupport Weakening for Stronger Alcohol Policies
20
30
40
50
60
70
80
90
100
1989 1990 1991 1993 1994 2000 2005
Warning Labels
More Prevention
Host Liability
Counter Ads
Increase Taxes
Store Hours
Drinking Age
Sources: Greenfield et al, CDP 2004; Greenfield et al, CDP in press
%

Final Key PointsFinal Key Points• The majority of drinkers drink moderately, but many exceed
safe limits; on metrics of DALYs, injuries and externalities from hazardous drinking by younger people add much to the toll; dependent drinkers add most to mortality in late life.
• There is wide concern about loss of scientific momentum and disruption to the successful, multi-systems approach of NIAAA in a merged IC
• Alcohol’s potential for both moderate and destructive use argue for a distinct, integrated, nuanced approach to guiding research, at which NIAAA has been highly effective. There are unique features of this model IC.
• State regulators and many public health leaders have serious concerns about the wisdom of mixing alcohol within a broader addictions framework and have expressed concern about such an untested structure