ALCOHOL ETC. (SCOTLAND) BILL - The Scottish...
24
ALCOHOL ETC. (SCOTLAND) BILL SUPPLEMENTARY WRITTEN FINANCIAL INFORNIA TION USING THE REVISED SHEFFIELD REPORT (APRIL 2010) INTRODUCTION 1. This document relates to the Alcohol etc. (Scotland) Bill introduced in the Scottish Parliament on 25 November 2009, and provides updated information using findings from the report Model-Based Appraisal of Alcohol Minimum Pricing and Off-Licensed Trade Discount Bans in Scotland using the Sheffield Alcohol Policy Model (v2): An update Based on Newly Available Datal. The report, published on 22 April 2010, incorporates new data on alcohol consumption from the Scottish Health Survey (SHeS) 2008 and the Scottish Schools Adolescent Lifestyle and Substance Use Survey (SALSUS) 2008, market research data, updated (2008) alcohol-related mortality and crime (2008-09) statistics. Background 2. The Scottish Government issued a consultation Changing Scotland's relationship with alcohol: a discussion paper on our strategic approach 2 in June 2008 which set out the scale of the alcohol misuse problem in Scotland, and the Scottish Government's approach to tackling it, drawing on the best available international evidence. Responses to this consultation are available on the Scottish Government's website 3 . 3. The Scottish Government published Changing Scotland's relationship with alcohol: A Framework for Action 4 on 2 March 2009 after considering the consultation responses, and this identifies that sustained action is required in 4 areas, one of which is reduced alcohol consumption. The measures included in the Bill mainly concentrate on this area. 4. Alcohol is not an ordinary commodity - it is a psychoactive and potentially toxic and addictive substance and is a contributory factor in fifty different causes of illness and death ranging from stomach cancer and strokes to assaults and road deaths 5 . The harms are not just limited to health and not just experienced solely by the drinker - damage can occur to family and friends, communities, employers, and Scotland as a whole. Alcohol misuse acts as a brake on Scotland's social and economic growth, costinf an estimated £2.48 billion to £4.64 billion (with a midpoint estimate of £3.56 billion) in 2007. For the midpoint estimate, this includes £866 million in lost productivity, a cost of £269 million to the NHS and £727 million to crime costs. 1 http://www.scotland.goy.uk/Publications/20 I0/04/20091852/0 2 http://www.scotiand.goy.uk/Publications/2008/06/16084348/0 3 http://www.scotland.gov.uk/Publications/2008/l I/26115423/Contents 4 http://www.scotland.gov. uk/Publications/2009/03/04144 703/0 5 Alcohol attributable mortality and morbidity: alcohol population attributable fractions for Scotland, Grant, Springbett and Graham, ISD 2009 http://www.scotpho.org.uk/alcohoIPAFreport 6 The Societal Cost of Alcohol Misuse in Scotland for 2007 http://www .scotland. gOY.uk/Pub lications/2009 /12/29122804/0
Transcript of ALCOHOL ETC. (SCOTLAND) BILL - The Scottish...

ALCOHOL ETC. (SCOTLAND) BILL
SUPPLEMENTARY WRITTEN FINANCIAL INFORNIA TION USINGTHE REVISED SHEFFIELD REPORT (APRIL 2010)
INTRODUCTION
1. This document relates to the Alcohol etc. (Scotland) Bill introduced in the ScottishParliament on 25 November 2009, and provides updated information using findings from thereport Model-Based Appraisal of Alcohol Minimum Pricing and Off-Licensed Trade DiscountBans in Scotland using the Sheffield Alcohol Policy Model (v2): An update Based on NewlyAvailable Datal. The report, published on 22 April 2010, incorporates new data on alcoholconsumption from the Scottish Health Survey (SHeS) 2008 and the Scottish Schools AdolescentLifestyle and Substance Use Survey (SALSUS) 2008, market research data, updated (2008)alcohol-related mortality and crime (2008-09) statistics.
Background
2. The Scottish Government issued a consultation Changing Scotland's relationship withalcohol: a discussion paper on our strategic approach2 in June 2008 which set out the scale ofthe alcohol misuse problem in Scotland, and the Scottish Government's approach to tackling it,drawing on the best available international evidence. Responses to this consultation areavailable on the Scottish Government's website3.
3. The Scottish Government published Changing Scotland's relationship with alcohol: AFramework for Action4 on 2 March 2009 after considering the consultation responses, and thisidentifies that sustained action is required in 4 areas, one of which is reduced alcoholconsumption. The measures included in the Bill mainly concentrate on this area.
4. Alcohol is not an ordinary commodity - it is a psychoactive and potentially toxic andaddictive substance and is a contributory factor in fifty different causes of illness and deathranging from stomach cancer and strokes to assaults and road deaths5
. The harms are not justlimited to health and not just experienced solely by the drinker - damage can occur to family andfriends, communities, employers, and Scotland as a whole. Alcohol misuse acts as a brake onScotland's social and economic growth, costinf an estimated £2.48 billion to £4.64 billion (witha midpoint estimate of £3.56 billion) in 2007. For the midpoint estimate, this includes £866million in lost productivity, a cost of £269 million to the NHS and £727 million to crime costs.
1 http://www.scotland.goy.uk/Publications/20 I0/04/20091852/02 http://www.scotiand.goy.uk/Publications/2008/06/16084348/03 http://www.scotland.gov.uk/Publications/2008/l I/26115423/Contents4 http://www.scotland.gov. uk/Publications/2009/03/04144 703/05 Alcohol attributable mortality and morbidity: alcohol population attributable fractions for Scotland, Grant,Springbett and Graham, ISD 2009 http://www.scotpho.org.uk/alcohoIPAFreport6 The Societal Cost of Alcohol Misuse in Scotland for 2007http://www .scotland. gOY.uk/Pub lications/2009 /12/29122804/0
5. Alcohol sales data from the Nielsen Company shows that enough alcohol was sold inScotland in every year since 2005 to enable every man and woman over the age of 16 to exceedthe sensible weekly drinking limits for men every week of the year. Average weekly sales ofalcohol units per adult over the age of 16 in Scotland in 2009 were estimated to be 22.7 units7•This is the equivalent of around 540 pints of beer or 45 bottles of vodka per person per year. TheScottish Health Survey 2008 found that, of those who drank in the previous week, 63% of menand women exceeded daily guidelines (3 to 4 units for men; 2 to 3 units for women) on at leastone occasion per week. 8
6. International research has shown that the average consumption of alcohol in a populationis directly linked to the amount of harm9 - the more we drink, the greater the risk of harm I0 II.
As overall consumption has increased in Scotland over recent decades so have the resultantharms. The World Health Organisation (WHO) identifies alcohol as the third highest risk factorfor ill health in developed countries, behind only tobacco and high blood pressurel2.
7. The School of Health and Related Research (ScHARR) at the University of Sheffieldundertook a systematic review of the evidence available and found strong and consistentevidence to suggest that price increases have a significant effect in reducing demand for alcohol.The effects of price changes on alcohol consumption were found to be of a substantially largersize than other alcohol policy interventions. Following this review, ScHARR undertookeconomic modelling of the potential impact of pricing and promotion policies for alcohol inEngland. The results were published in December 2008 in an Independent Review of the Effectsof Alcohol Pricing and PromotionI3. The work was commissioned by the UK Government andwas based on information relating to alcohol consumption in England. The modellingdemonstrated that increases in the price of alcohol would reduce hazardous and harmful alcoholconsumption, alcohol dependence, the harm done by alcohol, and the harm done by alcohol toothers in addition to the drinker. Because the harmful consequences of drinking are not confinedto the heaviest drinkers, a reduction in overall consumption can be expected to have a positiveeffect on the whole population as well as reducing harm in high risk groups.
8. Following the publication of the ScHARR appraisal, the Scottish Governmentcommissioned ScHARR to undertake analysis using Scottish data, as far as possible, in order tomodel the potential effect of the introduction of minimum pricing per unit of alcohol (hereafterreferred to as "minimum pricing"), the potential effect of introducing a ban on price-basedpromotions in the off-trade (hereafter referred to as "a discount ban"), and the potential effect ofintroducing minimum pricing simultaneously with a discount ban in Scotland. The report, Model-Based Appraisal of Alcohol Minimum Pricing and Off-Licensed Trade Discount Bans inScotland, was published by the Scottish Government on 28 September 200914• This was thenupdated, as new data became available, in the report Model-Based Appraisal of AlcoholMinimum Pricing and Off-Licensed Trade Discount Bans in Scotland using the Sheffield Alcohol
7 http://www.healthscotland.com/documents/3 974 .aspxg The Scottish Health Survey 2008, Scottish Government, September 20099 European Comparative Alcohol Study: Alcohol in Postwar Europe, Liefman, Osterberg & Ramstedt (2002)European Commission10 Babor et al (2003) Alcohol: No Ordinary Commodity. Oxford. Oxford University PressII Anderson, P & Baumberg B (2006) Alcohol in Europe, IAS12 Global Burden of Disease Project, World Health Organisation13 http://www.dh.qov.uk/en/Publichealth/HealthimprovementlAlcoholmisuse/DH 4001740.14 http://www.scotland.gov.ukIPublications/2009l09124131201
2

Policy Model (v2): An Update Based on Newly Available Data which was published on 22 April201015• With regard to minimum pricing, the Bill contains an enabling power to set a minimumprice rather than specifying a minimum price.
9. It is worth noting that the Licensing (Scotland) Act 2005, which came fully into force on1 September 2009, already bans certain "irresponsible promotions" in the on-tradel6 (such aspubs, clubs and restaurants) including where a drinks promotion "involves the supply of analcoholic drink free of charge or at a reduced price on the purchase of one or more drinks(whether or not alcoholic drinks)". This Bill is seeking to apply similar restrictions to cover theoff-trade (such as supermarkets and convenience stores).
10. The Scottish Government's policy intention is to introduce minimum pricing (sections 1and 2 of the Bill) and a ban on quantity discounts for off-sales premises (section 3 of the Bill)simultaneously. A minimum price combined with a discount ban was modelled by ScHARR aswell as minimum price and a discount ban being modelled separately. For minimum pricing,specific prices from 25p to 70p in 5p steps were modelled. The discount ban modelling wascarried out on the basis that all price-based promotions in the off-trade are banned i.e. quantitydiscounts (such as "3 for 2", "12 for the price of 10", "3 bottles for £10") and price reductions(such as "was £10, now £5"). The Scottish Government's intention is to ban quantity discountsin the off-trade so, in this respect, the ScHARR modelling goes further than we intend. Data isavailable for England on the prevalence and magnitude of short-term discounts on alcohol in themajor multiple retailers, however no data is available on the magnitude of purchasing that maybe required to qualify for the discount, for example, "3 for 2" in effect is a 33% discount for bulkbuying. This means that straight discounting from list price cannot be differentiated fromquantity-based promotions. In the absence of being able to ascertain the proportion of quantitydiscounts to price reductions, the model was run incorporating both. The model results showthat a total ban on off-trade price-based promotions is estimated to reduce overall consumptionby 3.1%. Since the Scottish Government intends to introduce a ban on quantity discounts, theeffect on consumption is likely to be less than 3.1%, however, given it is not possible todifferentiate between the magnitude of the price-based promotions, it is not possible to quantifyhow much less.
11. Information on promotions included in the model was derived from Nielsen data forEngland for 2008 as no Scottish promotions data was available. It was assumed that thedistribution of promotions is similar in Scotland to England and this seems to be borne out by theScottish Retail Consortium's consultation response in which it states that the price of alcohol andthe incidence of promotions is broadly the same across the UK.
15 http://www.scotland.gov.uk/Publications/20 10/04/20091852/016 Licensing (Scotland) Act 2005 schedule 3, paragraph 8(2)(b)
3

Change in consumption (%)-3.2-3.4-4.0-5.1-6.7-8.7-11.2-13.7-16.5-19.5
COMBINATION OF SECTIONS 1 AND 2 OF THE ALCOHOL ETC. (SCOTLAND)BILL(MINIMUM PRICE OF ALCOHOL) AND SECTION 3 OF THE ALCOHOL ETC.(SCOTLAND) BILL (OFF-SALES: RESTRICTION ON SUPPLY OF ALCOHOLICDRINKS FREE OF CHARGE OR AT A REDUCED PRICE)
12. The ScHARR workl? modelled 21 separate scenarios. The results of 10 ofthese scenariosshow the estimated impact of minimum price thresholds combined with a discount ban onalcohol consumption, and health, crime and employment related harms. The modelling wassubject to sensitivity analyses and details of this can be found in section 3.2 of the report. Theintroduction of a minimum price combined with a quantity discount ban is the preferred policyproposal. The model results presented in table 1 show that increasing levels of minimum pricingcombined with a discount ban show steep increases in effectiveness:
Table 1: impact of minimum price & discount ban onconsumptionMinimum price per unit
2Sp30p3Sp40p4SpSOpSSp60p6Sp70p
13. The results ofthe modelling show that as the minimum price threshold increases:
• more deaths are avoided;
• hospital admissions fall;
• number of crimes reduces;
• absenteeism from work reduces;
• unemployment due to alcohol problems reduces;
• the financial value of harm reductions increases;
• healthcare costs reduce;
• crime costs reduce;
• revenue for alcohol industry increases;
• VAT and alcohol duty receipts reduce.
17 Model~Based Appraisal of Alcohol Minimum Pricing and Off-Licensed Trade Discount Bans in Scotland usingthe Sheffield Alcohol Policy Model (v2): An Update Based on Newly Available Datahttp://www.scotland.gov.uk/Publications/20 10/04/20091852/0
4
14. At lower minimum price thresholds, the combined effect of a minimum price and adiscount ban is close to the individual effects of the two policies. At higher minimum pricethresholds, the marginal increased effectiveness of a discount ban is reduced. The effect of bothof these policies is considered across different drinking groups: moderate, hazardous, harmful.Moderate drinkers are defined in the ScHARR report as those who drink within therecommended limits of 21 units a week for men and 14 units a week for womenl8. Hazardousdrinkers are defined as those who drink between 21 to 50 units a week for men and 14 to 35 unitsa week for women. Harmful drinkers are defined as those who drink more than 50 units a weekfor men and more than 35 units a week for women 19. It should be noted that the modellingestimates that there are around 2.5 million moderate drinkers in Scotland, around 850,000hazardous and around 240,000 harmful.
Costs on the Scottish Administration
15. Research to inform the potential impact of setting a minimum price was undertaken byScHARR at a cost of £64,000 for the initial report and £31,000 for the updated report. In June2008, the Scottish Government established a Monitoring and Evaluation Reference Group forAlcohol (MERGA) to oversee the development of a portfolio of monitoring and evaluationstudies to measure the extent to which the actions set out in the Framework for Action and otheralcohol interventions are effective in delivering the intended outcomes. This work is currentlybeing taken forward by NHS Health Scotland under the Monitoring and Evaluating Scotland'sAlcohol Strategy (MESAS) banner. The policy proposals in the Bill will form part of themeasures that are to become routinely monitored. It is, therefore, not considered appropriate toapportion a specific cost to anyone measure.
16. There will be costs associated with setting and varying the minimum price. A decisionhas not been taken on the preferred method for varying the minimum price and how often thiswould be carried out. A methodology for varying the minimum price will be considered when aspecific minimum price is being considered.
17. There is estimated to be a net effect of a reduction of between £6m and £70m in receiptsto the Exchequer taking the range of prices from 25p to 70p combined with a discount ban. Theactual effect will depend on the specific minimum price set. Under the terms of the Statement ofFunding between Scottish Ministers and the UK Government, the reduction in VAT and dutyfalls as a cost to the Scottish Administration.
Costs on local authorities
18. The position of Licensing Standards Officers (LSOs) was created through the Licensing(Scotland) Act 2005. LSOs work on behalf of local authorities and are responsible for themonitoring and enforcement of the new licensing regime which became fully operational from 1September 2009. LSOs ensure compliance with any conditions attached to premises licences.The Licensing (Scotland) Act 2005 and associated secondary legislation sets out a number ofconditions that are attached to a premises licence including such conditions covering anoperating plan, premises manager, staff training, pricing and promotion of alcohol, payment offees, display of notices, and alcohol display areas. Minimum pricing and a discount ban would
18 Sensible drinking: Report of an inter-departmental working group, Department of Health, 199519 These definitions are extensively used to classify the risk associated with different levels of consumption.
5
be added to this number. Since the additional number of new conditions is small in relation tothe number already being checked, and are not considered onerous compared to some of theother conditions, the additional work is considered to be small in relation to the overall work ofthe LSOs and, as such, costs are likely to be marginal. COSLA has confirmed this and we haveagreed that the position will be reviewed around a year after implementation. The cost ofrunning the licensing system, including the costs of LSOs, are generally recovered by LicensingBoards from fee income in line with The Licensing (Fees) (Scotland) Regulations 2007 (SSI2007 No. 553).
Costs on other bodies, individuals and businesses
Individuals
19. On the introduction of a minimum price and a discount ban, those consumers affectedwill be those that previously purchased products that were priced below the minimum set, andthose that previously purchased products that were on a price-based promotion. Consumerbehaviour will respond to price changes. Consumers may continue to spend the same amount asthey did before and so purchase less alcohol; or purchase the same products in less quantity butincrease their spending; or switch to other products. This will depend on how responsive theyare to changes in actual and relative prices. The ScHARR modelling separated drinkers into thecategories moderate, hazardous and harmful. The results show that whilst the introduction ofminimum pricing and a discount ban would lead to a decrease in consumption, it would result inan increase in consumers' spending, particularly for hazardous and harmful drinkers. The modeltakes into account switching behaviour through incorporating elasticities which provideinformation on the responsiveness of the population to price changes. They inform the scale ofexpected reduction in purchasing of a category of alcohol if its price changes, and also informthe knock-on effects on purchasing of other products. Table 2 shows the estimated effect onconsumers' spending for each of these groups and for each of the minimum pricing scenarios,combined with a discount ban, modelled.
6

Table 2: minimum price & discount ban: impact on consumption and spendingMinimum Moderate Hazardous Harmfulprice and drinkers drinkers drinkersdiscountban
25p30p35p40p45p50p55p60p65p70p
Change inmean annualconsumptionper drinker-all beverages
(°/0)-2.1-2.1-2.3-2.9-3.7-4.8-6.2-7.9-9.7
-11.7
Change inspend perdrinker
per annum
(£)+6+7+8+10+12+15+18+20+22+24
Change inmean annualconsumptionper drinker-all beverages
(%)-3.3-3.3-3.7-4.5-6.0-7.9-10.3-12.9-15.7-18.8
Change inspend perdrinker
perannum
(£)+30+35+43+55+68+80+90+99+106+108
Change inmean annualconsumptionper drinker-all beverages
(%)-4.2-4.7-5.9-7.9-10.5-13.6-17.1-20.4-24.1-27.8
Change inspend perdrinker
per annum
(£)+74+84+103+126+147+161+167+172+167+151
20. The greatest impact of minimum pricing and a discount ban, both in terms of reducedconsumption and increased spend, is estimated to be on those who currently drink the most:hazardous and harmful drinkers. The effect on moderate drinkers is marginal as they drink lessand also tend not to drink cheaply priced alcohol. Taking a 40p minimum price and the discountban together as an example, consumption changes are estimated to be greatest for harmfuldrinkers (a decrease of 7.9%) whilst the model suggests that moderate drinkers are affected to alesser extent (a decrease of 2.9%). In terms of units of alcohol (one unit is defined as 10ml ofpure alcohol) consumed, this represents an estimated decrease of 5.7 units per week for harmfuldrinkers and an estimated decrease of 0.2 units per week for moderate drinkers.
21. Minimum pricing combined with a discount ban are estimated to lead to reductions inhealth, crime and employment harms. The higher the minimum price, the greater the estimatedreduction in alcohol-related harms. The greatest health benefits accrued from minimum pricingare seen amongst hazardous and harmful drinkers.
22. The following paragraphs and table 3 use a 40p minimum price combined with a discountban as an illustrative example. A 40p minimum price is used as this is the figure shown as anillustrative example by the ScHARR team in the Department of Health report and referred to inthe Framework document. It does not pre-empt any decision on the level of minimum price.Similar information for other prices modelled from 25p to 70p per unit is provided in theScHARR report.
23. On health benefits, deaths are estimated to reduce by around 60 within the first year ofimplementation and a full effect after 10 years of around 260 per annum. For the 10 year effect,
7

deaths are differentially distributed across the groups with around 20 amongst moderate drinkers,around 140 amongst hazardous drinkers and around 100 amongst harmful drinkers. Illness alsodecreases with an estimated reduction of around 1,200 chronic and acute illnesses within the firstyear. For the full 10 year effect, illnesses are estimated to reduce by around 3,000 per annumdifferentially distributed across the groups with around 600 amongst moderate drinkers, around1,300 amongst hazardous drinkers, and around 1,100 amongst harmful drinkers. Hospitaladmissions are estimated to reduce by around 1,500 in the first year, and a full effect in year 10of around 4,800 differentially distributed across the groups with around 800 amongst moderatedrinkers, around 2,000 amongst hazardous drinkers, and around 2,000 amongst harmful drinkers.Healthcare service costs are estimated to reduce by around £6m in the first year, with a QualityAdjusted Life Years (QAL y20) gain valued at around £17m. For the full 10 year effect, thehealthcare service costs are estimated to reduce by around £98m, with a QALY gain valued ataround £437m.
24. Overall, crime volumes are estimated to fall by around 3,100 offences per annum. Thedistribution of the effect varies across the groups with reductions of around 300 offences frommoderate drinkers, around 1,000 offences from hazardous drinkers and around 1,600 offencesfrom harmful drinkers. The harm avoided in terms of victim quality of life is valued at around£2m in the first year and around £17m over 10 years21• Direct costs of crime are estimated toreduce by around £3m in the first year, and by around £22m over 10 years.
25. Workplace harms are estimated to reduce by around 1,200 fewer unemployed people andaround 30,500 fewer sick days per year. The estimated reduction in unemployment comes fromthe harmful drinking group. The sick days are differentially distributed across the groups witharound 9,400 amongst moderate drinkers, around 10,500 amongst hazardous drinkers and around10,300 amongst harmful drinkers. For the first year, the costs of sick days are estimated to bearound Bm and the cost of unemployment around £27m. The cost of sick days andunemployment is estimated at around £250m over 10 years.
26. The estimated societal value of these harms in the first year is estimated at around £58mmade up as follows: NHS cost reductions (£6m), value of QAL Ys saved (£17m), crime costssaved (£3m), value of crime QAL Ys saved (£2m) and employment related harms avoided(BOrn). The societal value of these harm reductions over the 10 year period is estimated ataround £824m and is distributed across the different groups as follows: £426m for harmful(52%), £245m for hazardous (30%) and £147m for moderate (18%).
Table 3: Financial value of harm reduction (£m): 40p minimum price & discount ban
20 A quality adjusted life year is a measure of health outcome which combines quantity of life with quality: where 0= death and I = I year in full health. Measured in this way a QAL Y of 0.5, for example, could be 6 months at fullhealth or I year in a health state valued at 0.5.21 Direct physical and emotional impacts on victims of crime are valued at £81,000 per QAL Y, Dubourg et al (2005)
8

Year 1
Cumulative 10years
Scotland Moderate Hazardous HarmfulHealth costs 6 2 2 2Crime costs 3 0 1 1Employment costs 30 1 1 28Total direct costs 39 3 4 31Health QALYs 17 6 7 5Crime QALYs 2 0 1 1Total societalvalue 58 9 12 37Health costs 98 24 41 33Crime costs 22 3 7 11Employment costs 250 7 8 235Total direct costs 370 34 56 279Health QALYs 437 111 184 139Crime QALYs 17 2 5 8Total societalvalue 824 147 245 426
27. The effect of a 40p minimum price combined with a discount ban is estimated to increaseoverall spend by consumers by around £103m per annum, as shown in table 4, with harmfuldrinkers spending around BOm more per annum, hazardous drinkers spending around £46mmore per annum and moderate drinkers spending around £25m more per annum. As shown intable 2, this represents £126 for harmful drinkers, £55 for hazardous drinkers and £10 formoderate drinkers (£27 per drinker per annum for all drinkers). This represents an increasedspend of approximately 4.4% overall- split by 5.0%,5.0% and 3.2% for harmful, hazardous andmoderate drinkers respectively. This additional spend needs to be balanced against the benefit ofreduced harms.
Table 4: Effect on sales (£m)22: 40p minimum price & discount banScotland Moderate Hazardous
Total change Off-trade 61 16 25in value of per annumsales for On-trade per 42 9 21population annum
Total per 103 25 46annum
Harmful
18
12
30
28. Table 5 summarises the estimated effects on individuals for each of the minimum pricescenarios modelled combined with a discount ban. This illustrates the estimated financial effecton costs to the consumer per annum and the estimated financial value of harm reductions inhealth, crime and employment in the first year and over 10 years.
Table 5: Summary of financial valuation on health, crime and employment alcohol relatedharms reductions: minimum price & discount ban
22 Excluding duty and VAT
9

Minimum Costs to Health (including Crime (including Employmentprice and individuals QALYs) QALYs)discount ban per annum
(£m) (£m) (£m) (£m)Year 1 Over 10 Year 1 Over 10 Year 1 Over 10
years years years2Sp 60 16 342 3 27 17 14330p 68 16 358 3 28 19 1573Sp 83 19 417 4 32 23 19340p 103 24 535 5 39 30 2504Sp 125 32 710 6 51 39 324SOp 146 42 929 8 66 49 409SSp 163 54 1192 10 84 60 49660p 179 67 1470 12 103 69 5776Sp 189 81 1767 14 125 79 65970p 193 95 2063 17 147 89 740
Businesses
29. All minimum price scenarios combined with a discount ban result in estimated increasedrevenue to the alcohol industry (excluding VAT and duty). The increases can be seen in both theoff and on-trade sectors. Higher minimum prices lead to greater additional revenues. Theestimates are high-level estimates of revenue changes to the alcohol industry as a whole. It wasbeyond the remit of the modelling to consider where the change in revenue may accrue i.e.whether the estimated increases benefit retailers, wholesalers or producers, or all of them tosome extent.
30. A minimum pricing policy combined with a discount ban is likely to affect the off-tradesector more than the on-trade sector due to cheaper alcohol being sold in the off-trade sector.The average price of a unit of alcohol in the on-trade for 2009 is £1.3123 (ranging from £1.08 forcider to £2.62 for fortified wines) whilst for the off-trade the corresponding figures are £0.43 forthe average price (ranging from £0.25 for perry to £0.86 for Ready to Drink (RTDs». Increasesin revenue might be expected to only apply to the off-trade, however, the on-trade sector is alsoestimated to see increases in revenues due to switching effects. As the differential betweenprices in the off-trade and on-trade reduces, some drinkers may switch from purchasing in theoff-trade to purchasing in the on-trade.
31. Table 6 shows the estimated effects of minimum pricing scenarios combined with adiscount ban on the revenues for the on and off-trade sectors per annum:
Table 6: Effect on revenue for alcohol industry (excluding VAT and duty)Minimum Off-trade sector On-trade sector Total per annumprice and a per annum per annum
23 Data supplied to NHS Health Scotland by The Nielsen Company:http://www.healthscotland.comldocuments/3 974 .aspx
10

discount ban (£m) (£m) (£m)25p +52 +14 +6630p +56 +18 +7435p +66 +24 +9040p +81 +32 +11345p +98 +43 +14150p +114 +54 +16855p +129 +67 +19560p +142 +80 +22265p +150 +95 +24570p +152 +111 +263
32. There is estimated to be an increase of between £66m and £263m per annum in revenuefor the alcohol industry taking the range of minimum prices from 25p to 70p combined with adiscount ban. The actual effect will depend on the specific minimum price set. The greatestestimated total increase in revenue at a minimum price of 70p combined with a discount ban(£263m) represents 7.3% of the estimated value of total alcohol sales for both the on and off-trade sectors (£3,597m24
) in Scotland in 2007.
33. There will be costs to retailers associated with the implementation of a minimum pricingscheme such as re-pricing products, altering bar codes and shelf tickets. The costs to retailersthat operate only in Scotland will form part of their usual operational practice when alteringprices. Those retailers that operate on a UK-wide basis may incur costs associated with adifferent pricing and promotion regime operating in Scotland. These retailers are predominantlylarge supermarket chains. There is likely to be a lead in time prior to introduction. That,coupled with the resources available to them, should allow retailers to investigate the most costeffective method of implementing differential pricing across stores in different parts of the UK.There is also the possibility that any additional cost may be offset against the estimated increasedrevenue from alcohol sales. An alternative approach for those that operate on a UK-wide basiswould be to use the Scottish pricing regime across the whole of the UK thus minimising the costof operating different pricing structures.
34. Various questions in relation to introducing minimum pricing and a discount ban wereposed to groups representing the majority of retailers and producers of alcohol in Scotland:Scottish Orocers Pederation (SOP), Wine and Spirits Trade Association (WST A), Scottish RetailConsortium (SRC), Scotch Whisky Association (SW A). The SOP is the trade association for theScottish convenience store sector, representing most of the Scottish Co-ops, Somerfield, SPARand local independent retailers. The WST A represents businesses which work across the entiretyof the supply chain in wines and spirits in Scotland and the UK. Their membership includesproducers, importers, wholesalers, brand owners and off-licence retailers including supermarketsand specialist stores. The SRC is a retail trade association and includes major high streetretailers and supermarkets to trade associations representing smaller retailers. The SWA is thetrade association for the Scotch Whisky industry, and its members account for more than 95% ofproduction and sales of Scotch Whisky. The response from SOP is included within thisdocument. The responses from SOP and SWA are included in the Regulatory ImpactAssessment.
24 Ibid
11

35. On the question of what impact would minimum pricing be estimated to have on sales ata specific price of SOp and 70p, SGP members estimate that a minimum price of SOp wouldresult in an estimated reduction in sales of 10% and a 70p minimum price would have anestimated reduction in sales of 25%. On the question of what the administrative costs ofintroducing minimum pricing might be, the SGP has not provided a figure for this but their viewis that a check of all prices would require to be carried out between knowledge of minimum pricelevel and the date of implementation. Additional costs would not be significant for stores withhead office support, however for independent/unattached retailers this may be equivalent to onemember of staff for several days.
36. On the question of what percentage of alcohol sales are usually estimated to be onpromotion (quantity discount and price cut) at anyone time, the SGP members have estimatedthat promotions would typically account for between 25 to 30% of alcohol sales. On thequestion of if all quantity discounts and price promotions were banned, what effect would this bepredicted to have on volume of sales of alcohol, the SGP has indicated that this is difficult toanswer. Retailers promote alcohol to sell products and gain footfall. If all retailers were notpermitted to promote, arguably sales could remain constant with consumers persuaded to visitstores for other reasons. However, SGP's view is that sales would probably fall by between 15to 25% with sales of beer and wine probably worst affected.
UK Government
37. The effects on sales tax (VAT) and duty receipts are estimated to be relatively small dueto the counter-balancing nature ofthe two taxes. Duty is applied to the volume of sales (which isestimated to reduce overall) but the VAT is applied to the monetary value of sales (which isestimated to increase overall).
38. Table 7 shows the estimated effects of minimum pricing scenarios combined with adiscount ban on VAT and duty for the on and off-trade sectors per annum:
12

Table 7: Effect on VAT and dutyMinimum Off-trade On-trade Net effect Net effectprice and sector per sector per per annum as % ofa discount annum annum total VAT
ban (£m) (£m) (£m) and alcoholduties forUK
25p -11 +4 -6 0.00630p -11 +5 -6 0.00635p -14 +7 -7 0.00840p -20 +10 -10 0.0145p -28 +13 -15 0.0250p -39 +16 -23 0.0255p -53 +20 -33 0.0460p -67 +24 -43 0.0565p -84 +28 -56 0.0670p -102 +32 -70 0.08
39. There is estimated to be a net effect of a reduction of between £6m and £70m in receiptsto the Exchequer taking the range of prices from 25p to 70p combined with a discount ban. Theactual effect will depend on the specific minimum price set. Total receipts from VAT in the UKwere £84,695m in 2007-08 and from alcohol duties in the UK were £8,629m25
. Taking themaximum effect of a reduction of £70m (70p minimum price combined with a discount ban),this represents a reduction of 0.08% of total receipts from VAT and alcohol duties in the UK.
The National Health Service
40. Alcohol misuse costs the National Health Service (NHS) an estimated £269m each year.Health harms are estimated to reduce by between £l6m and £95m in the first year, and bybetween £342m and £2,063m over 10 years (table 5). These savings are included in thesummary table at paragraph 70 under individuals.
Wider costs of crime to society
41. The wider costs of crime to society (not including direct costs to victims) are estimated toreduce by between Bm and £l7m in the first year and by between £27m and £147m over 10years (table 5). The costs of crime include value of property stolen, damaged or destroyed,insurance administration and criminal justice system costs. These savings are included in thesummary table at paragraph 70 under individuals.
25http://customs.hmrc. gov. uk!channe IsPortal WehApp/ channe IsPortal WehApp. portal? nfpb=true& page Labe l=pageVAT ShowContent&id=HMCE PROD1 029459&propertvType=document
13

SECTIONS 1 AND 2 OF THE ALCOHOL ETC. (SCOTLAND) BILL (MINIMUMPRICE OF ALCOHOL) ONLY
42. The ScHARR work26 modelled 21 separate scenarios. The results for 10 of thesescenarios show the estimated impact of minimum price thresholds only on alcohol consumptionand health, crime and employment related harms. The modelling was subject to sensitivityanalyses and details of this can be found in section 3.2 of the report. Whilst the preferred policyoption is to introduce minimum price combined with a quantity discount ban, the results ofmodelling a range of minimum prices alone are included in order to show the results of thispolicy separately. The model results presented in table 8 show that increasing levels ofminimum pricing show steep increases in effectiveness:
Table 8: impact of minimum price on consumptionMinimum price per unit Change in consumption (%)
25p -0.130p -0.335p -1.040p -2.345p -4.350p -6.755p -9.560p -12.365p -15.370p -18.4
43. The results of the modelling show that as the minimum price threshold increases:
• more deaths are avoided;
• hospital admissions fall;
• number of crimes reduces;
• absenteeism from work reduces;
• unemployment due to alcohol problems reduces;
• the financial value of harm reductions increases;
• healthcare costs reduce;
• crime costs reduce;
• revenue for alcohol industry increases;
• VAT and alcohol duty receipts mainly reduce.
44. As mentioned previously, the ScHARR results show that minimum pricing will impactmost on high strength, cheaply priced alcohol products. As the ScHARR modelling
26 Model-Based Appraisal of Alcohol Minimum Pricing and Off-Licensed Trade Discount Bans in Scotland usingthe Sheffield Alcohol Policy Model (v2): An Update Based on Newly Available Datahttp://www.scotIand.gov.ukJPublications/20 10/04/20091852/0
14

demonstrates, cheap alcohol (i.e. relatively low price per unit of alcohol) is mostly drunk byharmful and hazardous drinkers.
Costs on the Scottish Administration
45. Research to inform the potential impact of setting a minimum price was undertaken byScHARR at a cost of £64,000 for the initial report and £31,000 for the updated report. In June2008, the Scottish Government established a Monitoring and Evaluation Reference Group forAlcohol (MERGA) to oversee the development of a portfolio of monitoring and evaluationstudies to measure the extent to which the actions set out in the Framework for Action and otheralcohol interventions are effective in delivering the intended outcomes. This work is currentlybeing taken forward by NHS Health Scotland under the Monitoring and Evaluating Scotland'sAlcohol Strategy (MESAS) banner. The policy proposals in the Bill will form part of themeasures that are to become routinely monitored. It is, therefore, not considered appropriate toapportion a specific cost to anyone measure.
46. There will be costs associated with setting and varying the minimum price. A decisionhas not been taken on the preferred method for revising the minimum price and how often thiswould be carried out. A revision methodology will be considered when a specific minimumprice is being considered.
47. There is estimated to be a net effect of an increase of between £ 1m and a reduction of£66m in receipts to the Exchequer taking the range of prices from 25p to 70p. The actual effectwill depend on the specific minimum price set. Under the terms of the Statement of Fundingbetween Scottish Ministers and the UK Government, the reduction in VAT and duty falls as acost to the Scottish Administration.
Costs on local authorities
48. Similar to other additional conditions being attached to licences, the costs would bemarginal as this would be added to the duties of LSOs to ensure compliance with licenceconditions (see paragraph 18).
Costs on other bodies, individuals and businesses
Individuals
49. On the introduction of a minimum price, those consumers affected will be those thatpreviously purchased products that were priced below the minimum set. Consumer behaviourwill respond to price changes. Consumers may continue to spend the same amount as they didbefore and so purchase less alcohol; or purchase the same products in less quantity but increasetheir spending; or switch to other products. This will depend on how responsive they are tochanges in actual and relative prices. The ScHARR modelling separated drinkers into thecategories moderate, hazardous and harmful. The results show that whilst the introduction of aminimum price for a unit of alcohol would lead to a decrease in consumption, it would result inan increase in consumers' spending, particularly for hazardous and harmful drinkers. The modeltakes into account switching behaviour through incorporating elasticities which provideinformation on the responsiveness of the population to price changes. Table 9 shows the
15
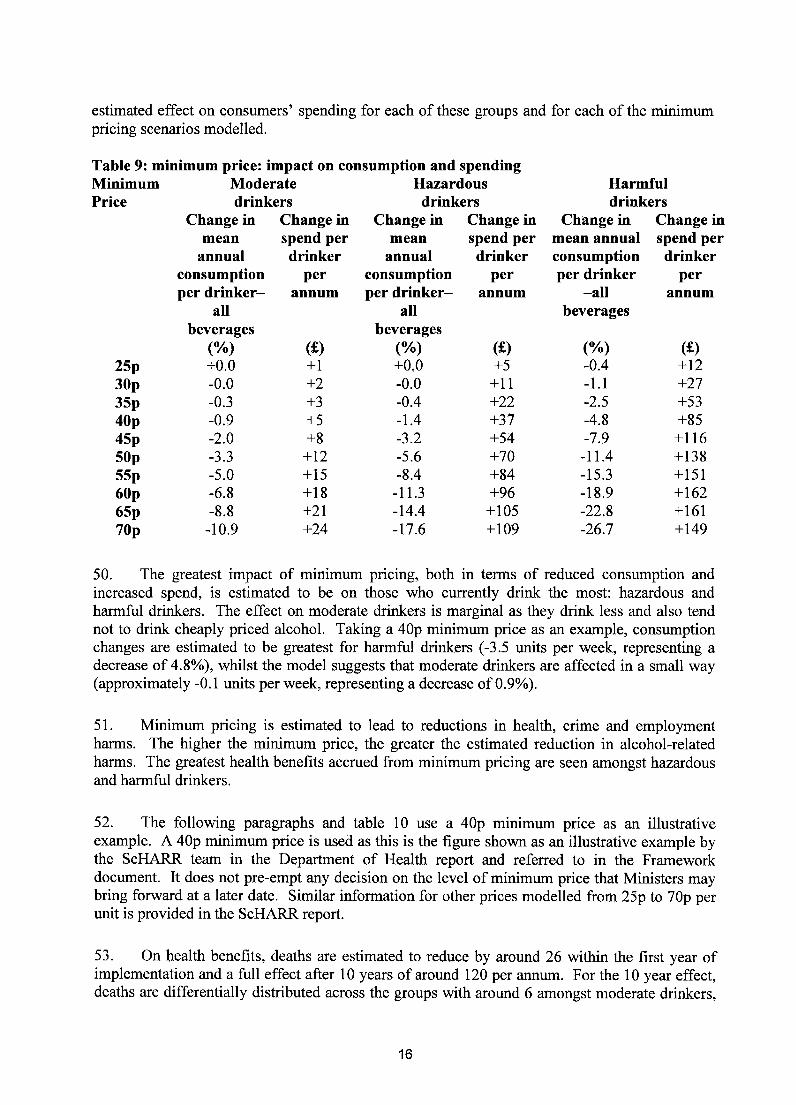
estimated effect on consumers' spending for each of these groups and for each of the minimumpricing scenarios modelled.
Table 9: minimum price: impact on consumption and spending
(£)+5+11+22+37+54+70+84+96+105+109
MinimumPrice
25p30p35p40p45p50p55p60p65p70p
Moderatedrinkers
Change in Change inmean spend per
annual drinkerconsumption perper drinker- annum
allbeverages
(01'0) (£)+0.0 + 1-0.0 +2-0.3 +3-0.9 +5-2.0 +8-3.3 +12-5.0 + 15-6.8 + 18-8.8 +21-10.9 +24
Hazardousdrinkers
Change in Change inmean spend per
annual drinkerconsumption perper drinker- annum
allbeverages
(%)+0.0-0.0-0.4-1.4-3.2-5.6-8.4-11.3-14.4-17.6
Harmfuldrinkers
Change in Change inmean annual spend perconsumption drinkerper drinker per
-all annumbeverages
(%) (£)-0.4 +12-1.1 +27-2.5 +53-4.8 +85-7.9 +116
-11.4 +138-15.3 +151-18.9 +162-22.8 +161-26.7 +149
50. The greatest impact of minimum pricing, both in terms of reduced consumption andincreased spend, is estimated to be on those who currently drink the most: hazardous andharmful drinkers. The effect on moderate drinkers is marginal as they drink less and also tendnot to drink cheaply priced alcohol. Taking a 40p minimum price as an example, consumptionchanges are estimated to be greatest for harmful drinkers (-3.5 units per week, representing adecrease of 4.8%), whilst the model suggests that moderate drinkers are affected in a small way(approximately -0.1 units per week, representing a decrease of 0.9%).
51. Minimum pricing is estimated to lead to reductions in health, crime and employmentharms. The higher the minimum price, the greater the estimated reduction in alcohol-relatedharms. The greatest health benefits accrued from minimum pricing are seen amongst hazardousand harmful drinkers.
52. The following paragraphs and table lOuse a 40p minimum price as an illustrativeexample. A 40p minimum price is used as this is the figure shown as an illustrative example bythe ScHARR team in the Department of Health report and referred to in the Frameworkdocument. It does not pre-empt any decision on the level of minimum price that Ministers maybring forward at a later date. Similar information for other prices modelled from 25p to 70p perunit is provided in the ScHARR report.
53. On health benefits, deaths are estimated to reduce by around 26 within the first year ofimplementation and a full effect after 10 years of around 120 per annum. For the 10 year effect,deaths are differentially distributed across the groups with around 6 amongst moderate drinkers,
16

around 50 amongst hazardous drinkers and around 60 amongst harmful drinkers. Illness alsodecreases with an estimated reduction of around 500 chronic and acute illnesses within the firstyear. For the full 10 year effect, illnesses are expected to reduce by around 1,300 per annumdifferentially distributed across the groups with around 200 amongst moderate drinkers, around500 amongst hazardous drinkers, and around 600 amongst harmful drinkers. Hospitaladmissions are estimated to reduce by around 640 in the first year, and a full effect in year 10 ofaround 2,200 differentially distributed across the groups with around 300 amongst moderatedrinkers, around 700 amongst hazardous drinkers, and around 1,200 amongst harmful drinkers.Healthcare service costs are estimated to reduce by around Bm in the first year, with a QAL Ygain valued at around £7m. For the full 10 year effect, the healthcare service costs are estimatedto reduce by around £43m, with a QAL Y gain valued at around £193m.
54. Overall, crime volumes are estimated to fall by around 1,400 offences per annum. Thedistribution of the effect varies across the groups with reductions of around 300 offences fromhazardous drinkers and around 1,000 offences from harmful drinkers. There is a marginalincrease of around 50 offences amongst moderate drinkers27. The harm avoided in terms ofvictim quality of life is valued at around £1m in the first year and around £6m over 10 years.Direct costs of crime are estimated to reduce by around £1m in the first year, and by around£ 1Om over 10 years.
55. Workplace harms are estimated to reduce by around 700 fewer unemployed people andaround 11,700 fewer sick days per year. The estimated reduction in unemployment comes fromthe harmful drinking group. The sick days are differentially distributed across the groups witharound 2,300 amongst moderate drinkers, around 3,000 amongst hazardous drinkers and around6,300 amongst harmful drinkers. For the first year, the costs of sick days are estimated to bearound £1m and the cost of unemployment around £l6m. The costs of sick days andunemployment is estimated at around £ 145m over 10 years.
56. The estimated societal value of these harms in the first year is estimated at around £29mmade up as follows: NHS cost reductions (£3m), value of QAL Ys saved (£7m), crime costssaved (£1m), value of crime QAL Ys saved (£lm) and employment related harms avoided(£17m). The societal value of these harm reductions over the 10 year period is estimated atB98m and is distributed across the different groups as follows: £254m for harmful (64%), £89mfor hazardous (23%) and £53m for moderate (13%).
27 The increase in offences in the moderate drinker category is driven by slight consumption increases in 18 to 24year old male drinkers resulting from a 40p minimum price policy. The majority of consumption by this group is inthe on-trade so small switching effects from off-trade to on-trade, in relative terms, can outweigh the reductions inoff-trade consumption arising from the policy.
17

Table 10: Financial value of harm reduction (£m): 40p minimum priceScotland Moderate Hazardous Harmful
Year 1 Health costs 3 1 1 1Crime costs 1 0 0 1Employment costs 17 0 0 17Total direct costs 21 1 1 19Health QALYs 7 2 2 3Crime QAL Ys 1 0 0 1Total societal value 29 3 4 23
Cumulative Health costs 43 9 15 1910 years Crime costs 10 0 2 7
Employment costs 145 2 2 141Total direct costs 198 11 19 167Health QALYs 193 42 68 81Crime QALYs 7 0 1 5Total societal value 398 53 89 254
57. The effect of a 40p minimum price is estimated to increase overall spend by consumersby around £66m per annum, as shown in table 11, with harmful drinkers spending around £20mmore per annum, hazardous drinkers spending around £31m more per annum and moderatedrinkers spending around £14m more per annum. As shown in table 9, this represents £85 forharmful drinkers, £37 for hazardous drinkers and £5 for moderate drinkers (£ 17 per drinker perannum for all drinkers). This represents an increased spend of approximately 2.8% overall -split by 3.4%, 3.3% and 1.8% for harmful, hazardous and moderate drinkers respectively. Thisadditional spend needs to be balanced against the benefit of reduced harms.
Table 11: Effect on drinkers for total population (£m): 40p minimum priceScotland Moderate Hazardous
33 7 15Total changein value ofsales forpopulation
Off-tradeper annumOn-trade per 33 7 16annumTotal per 66 14 31annum
Harmful11
9
20
58. Table 12 summarises the estimated effects on individuals for each of the minimum pricescenarios modelled. This illustrates the estimated financial effect on costs to the consumer perannum and the estimated financial value of harm reductions in health, crime and employment inthe first year and over 10 years.
18

Table 12: Summary of financial valuation on health, crime and employment alcohol relatedharms reductions: minimum priceMinimum Costs to Health (includingprice individuals QALYs)
Crime (includingQAL Ys)
Employment
per annum
(£m) (£m) (£m) (£m)Year 1 Over 10 Year 1 Over 10 Year 1 Over 10
years years years25p 9 +1 +15 0 0 2 1430p 20 +0 10 0 2 4 3335p 39 4 91 1 7 9 7540p 66 10 236 2 17 17 14545p 96 20 452 4 31 28 237SOp 123 32 715 6 50 41 3385Sp 148 46 1019 8 71 53 44260p 169 60 1331 11 92 64 53365p 184 75 1648 13 115 75 62370p 191 90 1965 16 138 85 710
Businesses
59. All minimum price scenarios modelled result in estimated increased revenue to thealcohol industry (excluding VAT and duty). The increases can be seen in both the off and on-trade sectors. Higher minimum prices lead to greater additional revenues. The estimates arehigh-level estimates of revenue changes to the alcohol industry as a whole. It was beyond theremit of the modelling to consider where the change in revenue may accrue i.e. whether theestimated increases benefit retailers, wholesalers or producers, or all of them to some extent.
60. A minimum pricing policy is likely to affect the off-trade sector more than the on-tradesector due to cheaper alcohol being sold in the off-trade sector. The average price of a unit ofalcohol in the on-trade for 2009 was £1.3128 whilst for the off-trade the corresponding figure was£0.43. Increases in revenue might be expected to only apply to the off-trade, however, the on-trade sector is also estimated to see increases in revenues due to switching effects. As thedifferential between prices in the off-trade and on-trade reduces, some drinkers may switch frompurchasing in the off-trade to purchasing in the on-trade.
61. Table 13 shows the estimated effects of minimum pricing scenarios on the revenues forthe on and off-trade sectors per annum:
28 Data supplied to NHS Health Scotland by The Nielsen Company:http://www.healthscotland.comldocuments/3 974 .aspx
19

Table 13: Effect on revenue for alcohol industry (excluding VATand duty)
Minimumprice
2Sp30p3Sp40p4SpSOpSSp60p6Sp70p
Off-trade sectorper annum
(£m)+5+11+24+43+67+91
+112+130+143+148
On-trade sectorper annum
(£m)+3+8
+15+25+37+49+63+77+92+109
Total perannum(£m)+8
+19+39+68+104+140+175+207+235+257
62. There is estimated to be an increase of between £8m and £257m per annum in revenuefor the alcohol industry taking the range of minimum prices from 25p to 70p. The actual effectwill depend on the specific minimum price set. The greatest estimated total increase in revenueat a minimum price of70p (£257m) represents 7.1% of the estimated value of total alcohol salesfor both the on and off-trade sectors (£3,597m29
) in Scotland in 2007.
63. There will be costs to retailers associated with the implementation of a minimum pricingscheme such as re-pricing products, altering bar codes and shelf tickets. The costs to retailersthat operate only in Scotland, will form part of their usual operational practice when alteringprices. Those retailers that operate on a UK-wide basis may incur costs associated with adifferent pricing and promotion regime operating in Scotland. These retailers are predominantlylarge supermarket chains. There is likely to be a lead in time prior to introduction. That,coupled with the resources available to them, should allow retailers to investigate the most costeffective method of implementing differential pricing across stores in different parts of the UK.There is also the possibility that any additional cost may be offset against the estimated increasedrevenue from alcohol sales. An alternative approach for those that operate on a UK-wide basiswould be to use the Scottish pricing regime across the whole of the UK thus minimising the costof operating different pricing structures.
64. Various questions in relation to introducing minimum pricing were posed to groupsrepresenting the majority of retailers of alcohol in Scotland, and information and responses areprovided at paragraphs 35 and 36.
UK Government
65. The effects on sales tax (VAT) and duty receipts are estimated to be relatively small dueto the counter-balancing nature of the two taxes. Duty is applied to the volume of sales (which isestimated to reduce overall) but the VAT is applied to the monetary value of sales (which isestimated to increase overall).
29 Gp. cit., The Nielsen Company
20

66. Table 14 shows the estimated effects of minimum pricing scenarios on VAT and duty forthe on and off-trade sectors per annum:
Table 14: Effect on VAT and dutyMinimum Off-trade On-trade Net effect Net effect as
price sector per sector per per annum % of totalannum annum VAT and
alcohol(£m) (£m) (£m) duties for
UK2Sp 0 +1 +1 +0.00130p -1 +2 +2 +0.0023Sp -4 +5 +1 +0.00140p -10 +8 -2 0.0024Sp -20 +11 -8 0.009SOp -31 +15 -17 0.02SSp -46 +19 -27 0.0360p -61 +23 -38 0.046Sp -79 +27 -51 0.0570p -97 +32 -66 0.07
67. There is estimated to be a net effect of an increase of between £lm and a reduction of£66m in receipts to the Exchequer taking the range of prices from 25p to 70p. The actual effectwill depend on the specific minimum price set. Total receipts from VAT in the UK were£84,695m in 2007-08 and from alcohol duties in the UK were £8,629m30
. Taking the maximumeffect of a reduction of £66m (70p minimum price), this represents a reduction of 0.07% of totalreceipts from VAT and alcohol duties in the UK.
The National Health Service
68. Alcohol misuse costs the National Health Service (NHS) an estimated £269m each year.Health harms are estimated to reduce by up to £90m in the first year, and by up to £1,965m over10 years (table 12).
Wider costs of crime to society
69. The wider costs of crime to society (not including direct costs to victims) are estimated toreduce by up to £16m in the first year and by up to £138m over 10 years (table 12). The costs ofcrime include value of property stolen, damaged or destroyed, insurance administration andcriminal justice system costs.
SUMMARY
70. The following table summarises the overall financial impact of minimum pricing:
30http://customs.hmrc. gov. ukl channe IsPorta! WebAppl channelsPortal WebApp. portal? nfpb=true& page Labe l=pageVAT ShowContent&id=HMCE PRODJ 029459&propertyType=document
21
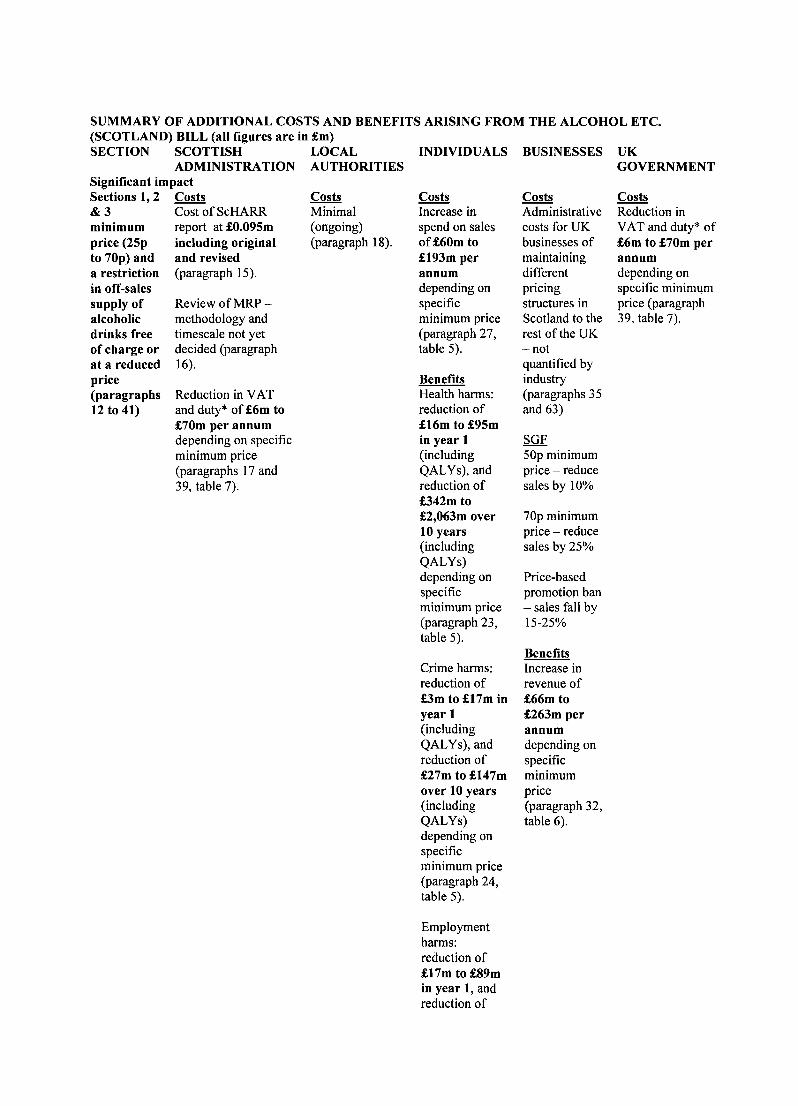
SUMMARY OF ADDITIONAL COSTS AND BENEFITS ARISING FROM THE ALCOHOL ETC.(SCOTLAND) BILL (all figures are in £m)
Review of MRP -methodology andtimescale not yetdecided (paragraph16).
Reduction in VATand duty* of £6m to£70m per annumdepending on specificminimum price(paragraphs 17 and39, table 7).
SECTION SCOTTISHADMINISTRATION
Significant impactSections 1,2 Costs& 3 Cost of ScHARRminimum report at £0.095mprice (25p including originalto 70p) and and reviseda restriction (paragraph 15).in off-salessupply ofalcoholicdrinks freeof charge orat a reducedprice(paragraphs12 to 41)
LOCALAUTHORITIES
CostsMinimal(ongoing)(paragraph 18).
INDIVIDUALS
CostsIncrease inspend on salesof £60m to£193m perannumdepending onspecificminimum price(paragraph 27,table 5).
BenefitsHealth harms:reduction of£16m to £95min year 1(includingQAL Ys), andreduction of£342m to£2,063m over10 years(includingQAL Ys)depending onspecificminimum price(paragraph 23,table 5).
Crime harms:reduction of£3m to £17m inyear 1(includingQALYs), andreduction of£27m to £147mover 10 years(includingQALYs)depending onspecificminimum price(paragraph 24,table 5).
Employmentharms:reduction of£17m to £89min year 1, andreduction of
BUSINESSES
CostsAdministrativecosts for UKbusinesses ofmaintainingdifferentpricingstructures inScotland to therest of the UK-hotquantified byindustry(paragraphs 35and 63)
SGF50p minimumprice - reducesales by 10%
70p minimumprice - reducesales by 25%
Price-basedpromotion ban- sales fall by15-25%
BenefitsIncrease inrevenue of£66m to£263m perannumdepending onspecificminimumprice(paragraph 32,table 6).
UKGOVERNMENT
CostsReduction inVAT and duty* of£6m to £70m perannumdepending onspecific minimumprice (paragraph39, table 7).

£143m to£740m over 10years dependingon specificminimum price(paragraph 25,table 5).


![National Parks (Scotland) Bill - Scottish Parliament Parks (Scotland) Bill/b12s1.pdf · National Parks (Scotland) Bill [AS INTRODUCED] An Act of the Scottish Parliament to make provision](https://static.fdocuments.in/doc/165x107/5edd51c8ad6a402d66685e3b/national-parks-scotland-bill-scottish-parks-scotland-billb12s1pdf-national.jpg)