Alcohol Consumption: Why do you do it? Anna Kheyfets Guillermo Morini Drew Vinson Econ...
18
Alcohol Consumption: Alcohol Consumption: Why do you do it? Why do you do it? Anna Kheyfets Anna Kheyfets Guillermo Morini Guillermo Morini Drew Vinson Drew Vinson Econ 120:Statistics Econ 120:Statistics Professor Yoon Professor Yoon 5 May 2009 5 May 2009
-
Upload
baldric-mitchell -
Category
Documents
-
view
215 -
download
1
Transcript of Alcohol Consumption: Why do you do it? Anna Kheyfets Guillermo Morini Drew Vinson Econ...

Alcohol Consumption:Alcohol Consumption:Why do you do it?Why do you do it?
Anna KheyfetsAnna KheyfetsGuillermo MoriniGuillermo MoriniDrew VinsonDrew Vinson
Econ 120:StatisticsEcon 120:StatisticsProfessor YoonProfessor Yoon
5 May 20095 May 2009

IntroductionIntroduction
Research QuestionResearch Question What variables affect What variables affect
alcohol consumption?alcohol consumption? RelevanceRelevance
Alcohol might lead to Alcohol might lead to substance abusesubstance abuse
Risk to human health Risk to human health ≈ 4% disease worldwide≈ 4% disease worldwide
College students want to drink legallyCollege students want to drink legally

Alcohol Alcohol Consumption Consumption
WorldwideWorldwide
Burden of Burden of Disease Disease
from from AlcoholAlcohol

Variables TestedVariables Tested ŷ ŷ = A= Alcohol consumption (L of pure lcohol consumption (L of pure
alcohol/capita) among adults (15 years)alcohol/capita) among adults (15 years)
XX1 1 = Minimum Legal Drinking Age= Minimum Legal Drinking Age XX2 2 = Government Education Expenditures = Government Education Expenditures
(% of GDP)(% of GDP) XX3 3 = GDP per capita ($1000)= GDP per capita ($1000) XX4 4 = Unemployment Rate (%)= Unemployment Rate (%) XX5 5 = Global Peace Index (Score)= Global Peace Index (Score) XX6 6 = Inflation rate (%)= Inflation rate (%) XX7 7 = Homicide Rate (per 100,000)= Homicide Rate (per 100,000) n = 65 countriesn = 65 countries

PredictionsPredictions Positively correlated with Positively correlated with
alcohol consumptionalcohol consumption Unemployment RateUnemployment Rate Inflation RateInflation Rate GDP per capitaGDP per capita Homicide RateHomicide Rate
Negatively correlated with Negatively correlated with alcohol consumptionalcohol consumption Minimum Legal Drinking AgeMinimum Legal Drinking Age Global Peace IndexGlobal Peace Index Government Education ExpendituresGovernment Education Expenditures

XX1 1 = Minimum Legal Drinking Age= Minimum Legal Drinking Age
18 or 21 ?18 or 21 ?

The mission of MADD is toThe mission of MADD is to stop drunk drivingstop drunk driving support the victims of this violent crimesupport the victims of this violent crime prevent underage drinkingprevent underage drinking
MADD supports the 21 Legal Drinking Age MADD supports the 21 Legal Drinking Age
Since the 21 Minimum Legal Drinking Age law was enacted in 1984, an estimated 25,000 lives have been
saved.

Amethyst Amethyst
Movement of US college presidents Movement of US college presidents calling for the reconsideration of US calling for the reconsideration of US drinking age laws drinking age laws
Current signatory count: 135 Current signatory count: 135 Signed by President David Oxtoby, Signed by President David Oxtoby,
Pomona College Pomona College
““Alcohol education that mandates Alcohol education that mandates abstinence as the only legal option has not abstinence as the only legal option has not
resulted in significant constructive resulted in significant constructive behavioral change among our students”behavioral change among our students”
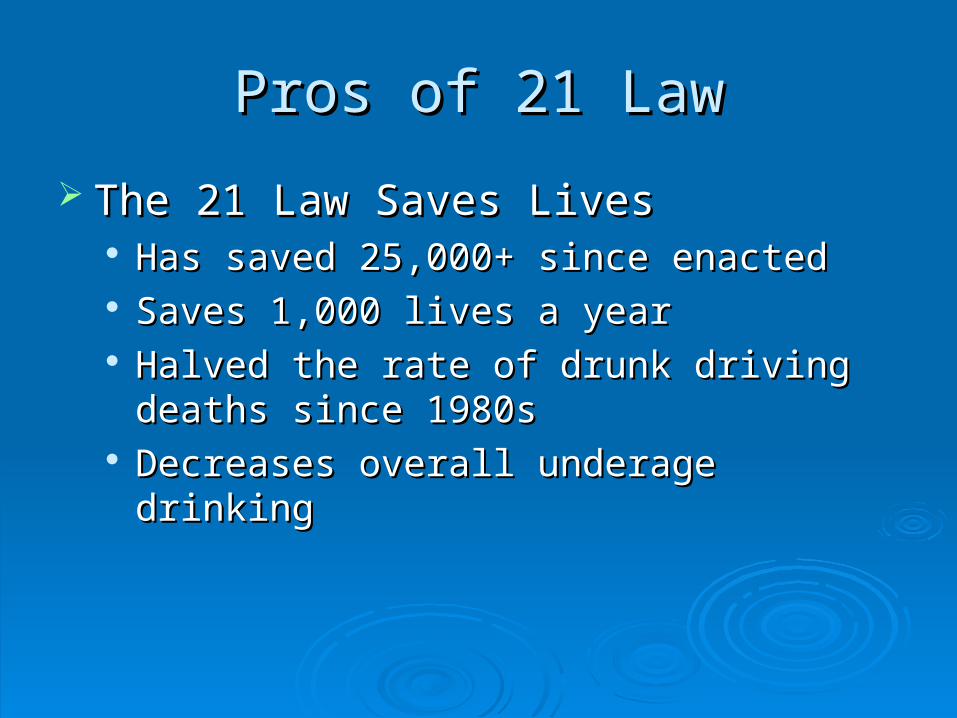
Pros of 21 LawPros of 21 Law
The 21 Law Saves Lives The 21 Law Saves Lives Has saved 25,000+ since enactedHas saved 25,000+ since enacted Saves 1,000 lives a yearSaves 1,000 lives a year Halved the rate of drunk driving deaths since Halved the rate of drunk driving deaths since
1980s1980s Decreases overall underage drinkingDecreases overall underage drinking

Amethyst vs. MADDAmethyst vs. MADD The studies of lives saved quoted by MADD, The studies of lives saved quoted by MADD,
do not focus on people under 21do not focus on people under 21 Lives saved between 18-20 are diluted by the fatalities Lives saved between 18-20 are diluted by the fatalities
in the 21-24 groupin the 21-24 group Alcohol-related traffic fatalities declined (1982 -1992)Alcohol-related traffic fatalities declined (1982 -1992)
• United Kingdom: United Kingdom: 50% decline 50% decline • Germany: Germany: 37% decline 37% decline • Australia:Australia: 32% decline 32% decline • The Netherlands:The Netherlands: 28% decline 28% decline • Canada: Canada: 28% decline 28% decline • United States: United States: 26% decline 26% decline
All countries except for US: min drinking age = 18 yrs.All countries except for US: min drinking age = 18 yrs.Factors other than drinking age are involvedFactors other than drinking age are involved

Validity of ModelValidity of ModelRegression Statistics
Multiple R 0.6646
R Square 0.4417
Adjusted R Square 0.3732
Standard Error 3.0543
Observations 65
ANOVA
df SS MS F Significance F
Regression 7 420.7 60.10 6.442 1.334 E-05
Residual 57 531.7 9.328
Total 64 952.4
F- Stat
H0: β1 = β2 = β3 = β4 = β5 = β6 = β7 = 0
H1: at least one of βs ≠ 0
REJECT H0
Coefficient
sStandard
Error t Stat P-value
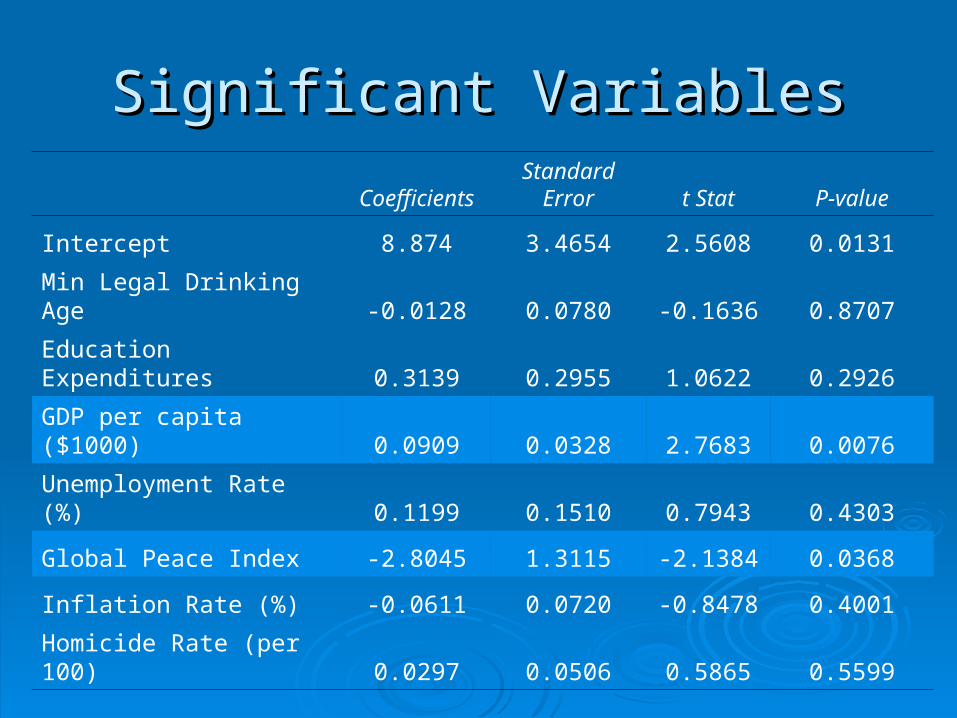
Intercept 8.874 3.4654 2.5608 0.0131
Min Legal Drinking Age -0.0128 0.0780 -0.1636 0.8707
Education Expenditures 0.3139 0.2955 1.0622 0.2926
GDP per capita ($1000) 0.0909 0.0328 2.7683 0.0076
Unemployment Rate (%) 0.1199 0.1510 0.7943 0.4303
Global Peace Index -2.8045 1.3115 -2.1384 0.0368
Inflation Rate (%) -0.0611 0.0720 -0.8478 0.4001
Homicide Rate (per 100) 0.0297 0.0506 0.5865 0.5599
Significant VariablesSignificant Variables

Regression ModelRegression Model
Var b Statistic Unit ValueEffect on ŷ,
per unit increase
ŷ Alcohol consumption L per capita
8.8743 Intercept
x1 -0.0128 Min Legal Drinking Age 1 year - 4 L
x2 0.3139 Education Expenditures 1% -1.3 L
x3 0.0909 GDP per capita $1,000 + 9 L
x4 0.1199 Unemployment Rate 1% + 12 L
x5 -2.8045 Global Peace Index 1 Unit - 280 L
x6 -0.0611 Inflation rate 1% - 6 L
x7 0.0297 Homicide Rateper 100,000
people + 3 L
ŷ = 8.8743 - 0.0128xŷ = 8.8743 - 0.0128x11 + 0.3139x + 0.3139x22+ 0.0909x+ 0.0909x33+ 0.1199x+ 0.1199x44- 2.8045x- 2.8045x55- 0.0611x- 0.0611x66+ 0.0297x+ 0.0297x77

Check for NormalityCheck for Normality
0
2
4
6
8
10
12
14
16
18
-8 -6 -4 -2 0 2 4 6 8 More
Residuals
Frequency

Results Compared with Predictions Results Compared with Predictions Positively correlated with Positively correlated with
alcohol consumptionalcohol consumption Unemployment Rate : TRUEUnemployment Rate : TRUE Inflation Rate : FALSEInflation Rate : FALSE GDP per capita : TRUEGDP per capita : TRUE Homicide Rate : TRUEHomicide Rate : TRUE
Negatively correlated with Negatively correlated with alcohol consumptionalcohol consumption Minimum Legal Drinking Age : TRUEMinimum Legal Drinking Age : TRUE Global Peace Index: TRUEGlobal Peace Index: TRUE Government Education Expenditures : FALSEGovernment Education Expenditures : FALSE

ConclusionConclusion Testing this hypothesis,Testing this hypothesis,
where Xwhere X1 1 = min drinking age= min drinking ageHH00: B: B11 = 0 = 0HH11: B: B11 ≠ 0 ≠ 0
Using a t-test at the 5% significance level, Using a t-test at the 5% significance level, we rejected the alternative hypothesis. we rejected the alternative hypothesis.
Therefore, there is no significant relationship Therefore, there is no significant relationship between the minimum legal drinking age and the between the minimum legal drinking age and the consumption of alcohol per capita in a country.consumption of alcohol per capita in a country.
This data supports the argument of the Amethyst This data supports the argument of the Amethyst Initiative.Initiative.

ConclusionConclusion
Recalling our concern about the Recalling our concern about the connection between alcohol and connection between alcohol and disease…disease…
Governments cannot control any of the Governments cannot control any of the significant variables from our modelsignificant variables from our model Unless the government wants to go to war to Unless the government wants to go to war to
curb alcohol consumptioncurb alcohol consumption

AcknowledgementsAcknowledgements
Professor Yoon for your guidance and Professor Yoon for your guidance and statistics course.statistics course.
AudienceAudience SourcesSources
www.who.orgwww.who.org www.cia.govwww.cia.gov www.amethystinitiative.org/www.amethystinitiative.org/ www.madd.orgwww.madd.org www.photius.com/rankings/murder_rate_of_countrieswww.photius.com/rankings/murder_rate_of_countries
_2000-2004.html_2000-2004.html