Alcohol and other drug use in regional and remote ...
76
Alcohol and other drug use in regional and remote Australia: consumption, harms and access to treatment 2016–17
Transcript of Alcohol and other drug use in regional and remote ...

Alcohol and other drug use in regional and remote Australia: consumption, harms and access to treatment
2016–17


Alcohol and other drug use in regional and remote Australia: consumption, harms and access to treatment
2016–17
The Australian Institute of Health and Welfare is a major national agency whose purpose is to create authoritative and accessible information and statistics
that inform decisions and improve the health and welfare of all Australians.
© Australian Institute of Health and Welfare 2019
This product, excluding the AIHW logo, Commonwealth Coat of Arms and any material owned by a third party or protected by a trademark, has been released under a Creative Commons BY 3.0 (CC BY 3.0) licence. Excluded material owned by third parties may include, for example, design and layout, images obtained under licence from third parties and signatures. We have made all reasonable efforts to identify and label material owned by third parties.You may distribute, remix and build upon this work. However, you must attribute the AIHW as the copyright holder of the work in compliance with our attribution policy available at <www.aihw.gov.au/copyright/>. The full terms and conditions of this licence are available at <http://creativecommons.org/licenses/by/3.0/au/>.
ISBN 978-1-76054-496-6 (PDF) ISBN 978-1-76054-497-3 (Print)
Suggested citationAustralian Institute of Health and Welfare 2019. Alcohol and other drug use in regional and remote Australia: consumption, harms and access to treatment, 2016–17. Cat. no. HSE 212. Canberra: AIHW.
Australian Institute of Health and WelfareBoard ChairMrs Louise Markus
Chief Executive OfficerMr Barry Sandison
Any enquiries about or comments on this publication should be directed to:Australian Institute of Health and WelfareGPO Box 570Canberra ACT 2601Tel: (02) 6244 1000Email: [email protected]
Published by the Australian Institute of Health and Welfare.
Please note that there is the potential for minor revisions of data in this report.Please check the online version at <www.aihw.gov.au> for any amendments.

iiiAlcohol and other drug use in regional and remote Australia: consumption, harms and access to treatment 2016–17
Contents
Summary ....................................................................................................................................................... v
1 Introduction ............................................................................................................................................. 1
Regional and remote Australia ...................................................................................................................1
Population decline in regional and remote Australia ........................................................................2
Remoteness and harms .........................................................................................................................2
Quality and access to health care in regional and remote areas .....................................................3
2 Alcohol and other drug consumption across Australia ..................................................................... 5
Alcohol ...........................................................................................................................................................5
Consumption ...........................................................................................................................................5
Who consumes alcohol at risky levels? ................................................................................................6
Where is alcohol consumed at risky levels? ........................................................................................9
Other drug use ...........................................................................................................................................10
Consumption .........................................................................................................................................10
Who uses illicit drugs? ..........................................................................................................................11
Where are illicit drugs consumed? .....................................................................................................13
Wastewater analysis .............................................................................................................................13
3 Harms from alcohol and other drug use ........................................................................................... 14
Burden of disease ......................................................................................................................................14
Burden of alcohol use ..........................................................................................................................16
Burden of illicit drug use ......................................................................................................................17
Ambulance attendances ............................................................................................................................18
Drug-related hospitalisations ...................................................................................................................19
Drug-induced deaths .................................................................................................................................21
Usual residence.....................................................................................................................................24
Alcohol-induced deaths .............................................................................................................................24
4 Alcohol and other drug treatment services ...................................................................................... 26
Agencies ......................................................................................................................................................26
Clients ..........................................................................................................................................................27
Client profile ..........................................................................................................................................27
Principal drug of concern ..........................................................................................................................28
Source of referral ..................................................................................................................................29
Main treatment type ............................................................................................................................30
iv Alcohol and other drug use in regional and remote Australia: consumption, harms and access to treatment 2016–17
Treatment delivery setting ........................................................................................................................31
Treatment delivery setting by principal drug of concern ................................................................32
Treatment delivery setting by main treatment type ........................................................................32
Treatment duration ..............................................................................................................................33
Reason for ending treatment ..............................................................................................................34
Cessation by main treatment type .....................................................................................................35
Indigenous treatment services .................................................................................................................36
Substance-use services ........................................................................................................................36
Substance use issues .................................................................................................................................38
5 Access to treatment ............................................................................................................................. 39
Travel time and distance ...........................................................................................................................39
Client demographics ............................................................................................................................40
Principal drugs of concern ...................................................................................................................41
Treatment provided .............................................................................................................................43
6 Conclusion ............................................................................................................................................. 46
Appendix A: Data sources ......................................................................................................................... 47
Appendix B: Methodology for measuring client travel time/distance to services ............................ 53
Acknowledgments ..................................................................................................................................... 55
Abbreviations ............................................................................................................................................. 56
Symbols ....................................................................................................................................................... 56
Glossary ...................................................................................................................................................... 57
References .................................................................................................................................................. 61
List of tables ............................................................................................................................................... 63
List of figures .............................................................................................................................................. 64
Related publications .................................................................................................................................. 66

vAlcohol and other drug use in regional and remote Australia: consumption, harms and access to treatment 2016–17
Summary
Australians who live in areas outside Major cities tend to have poorer health outcomes than those living in Major cities (AIHW 2017b). This can be due to lower educational attainment and higher levels of unemployment and poorer access to, and use of, health services. It can also reflect the higher proportion of the population living outside Major cities who are Aboriginal and Torres Strait Islander (AIHW 2017a; Roche & McIntee 2017).
This report identifies trends and differences in alcohol and other drug use, harms and treatment in Major cities and Regional and remote Australia and includes online supplementary interactive maps and tables (those with a prefix of S).
People living in Regional and remote areas of Australia were more likely than people living in Major cities to have consumed alcohol at quantities that placed them at risk of harm from an alcohol-related disease or injury
• Results from the 2016 National Drug Strategy Household Survey (NDSHS) showed that people aged 14 or older living in Regional and remote areas were significantly more likely than people living in Major cities to:
– consume alcohol daily (8.0% compared with 5.0%)
– drink in excess of the lifetime risk guideline (21% compared with 15.4%) and of the single occasion risk guideline (at least monthly) (29% compared with 24%).
Levels of recent drug use were similar between remoteness areas, however the type of illicit drug used varied
• People aged 14 or older living in Major cities and in Regional and remote areas had similar levels of drug use in the past 12 months (both 15.6%). However, those in Major cities were significantly more likely than those in Regional and Remote areas to have recently used ecstasy (2.5% compared with 1.5%) and cocaine (3.2% compared with 1.1%).
The burden of drug and alcohol use increases with remoteness
• Remote and Very remote areas experienced 2.1 and 2.7 times, respectively, the burden of disease attributable to alcohol use, compared with Major cities in 2011.
• Major cities experienced the highest burden for Illicit drug dependence overall in 2011, compared with other areas. However, the rate of burden due to Illicit drug use increased as remoteness increased, for Suicide and self-inflicted injuries, Chronic liver disease and Road traffic injuries—motor vehicle occupant.
• Over the past decade, the rate of drug-induced deaths has increased at a faster rate in Regional and remote areas, up 41% since 2008, compared with a 16% increase in Major cities over the same period. As a result, the rate of drug-induced deaths was higher in Regional and remote areas than in Major cities between 2012 and 2016.

vi Alcohol and other drug use in regional and remote Australia: consumption, harms and access to treatment 2016–17
Higher rates of alcohol and other drug treatment outside of Major cities
• In 2016–17, agencies in Regional and remote areas had a higher rate of clients who sought treatment, compared with agencies in Major cities (652 clients per 100,000 population compared with 586 clients per 100,000).
• Of all remoteness areas, agencies in Remote and very remote areas had the highest rate of clients who sought treatment (1,294 clients per 100,000 population) in 2016–17, despite having the smallest number of clients, and smallest average number of episodes per client.
Clients who sought treatment in Regional and remote areas were more likely than clients in Major cities to travel 1 hour or longer to treatment services
• In 2016–17, clients who sought treatment in Regional and remote areas travelled 1 hour or longer in 28% of closed treatment episodes, compared with 10% of closed treatment episodes in Major cities. This varied by principal drug of concern and main treatment type.

1
Intr
oduc
tion
1
Alcohol and other drug use in regional and remote Australia: consumption, harms and access to treatment 2016–17
1 Introduction
Alcohol and other drug use are major health issues in Australia and are associated with a number of harms both physical and social, including chronic disease, mental illness, injury, premature death and dependence (AIHW 2018d).
Australians living in remote areas often have worse outcomes, compared with people living in metropolitan areas. This can be due to lower educational attainment and higher levels of unemployment, poorer access to, and use of, health services. It can also reflect the higher proportion of the population who are Aboriginal and Torres Strait Islander (AIHW 2017b; Roche & McIntee 2017).
Recent evidence indicates that people living in Remote areas were more likely than those people living in Major cities to have used illicit drugs in the preceding 12 months and to have consumed alcohol in a risky manner (AIHW 2017a).
Where alcohol and drug use become problematic, this may lead people to seek treatment. However, for people in remote areas of Australia, access to alcohol and other drug treatment agencies is difficult, with only 7% of services located within these areas (AIHW 2018c).
The Australian Government has recognised this as an issue, identifying the enhancement of ‘access to evidence-informed, effective and affordable treatment and support services for the whole population’ as a priority issue under the 2017–2026 National Drug Strategy (DoH 2017). The National Drug Strategy has also identified Indigenous Australians as a priority population due to the level of harm suffered from alcohol and drug use.
The purpose of this report is to identify trends in alcohol and other drug use in Regional and remote Australia, with a primary focus on treatment and variation in treatment types and completion rates. This is provided in the context of available geographic data reflecting consumptions and harms. Further information about the data sources used in this report can be found in Appendix A.
Regional and remote Australia The term Regional and remote generally covers all areas outside Australia’s Major cities, as classified by the Australian Statistical Geography Standard (ASGS). The ASGS classifies remoteness into 5 categories: Major cities, Inner regional, Outer regional, Remote and Very remote Australia (ABS 2018a). These are classified in terms of accessibility to services and population centres (see Appendix A for further information). In 2017, the majority of Australians (17.7 million or 72%) lived in Major cities (Table S1.1).
Not all jurisdictions contain every one of the 5 remoteness categories. For example, Hobart and Darwin are not classified as Major cities; while the Australian Capital Territory only contains Major cities and Inner regional areas.
This report presents comparisons between people living in Major cities and Regional and remote areas, where possible. Differences may exist between the remoteness areas that form the Regional and remote area and these differences are highlighted where necessary. For example, additional alcohol and other drug use figures are presented for Remote and very remote Australia, due to substantial differences in usage.

2
Intr
oduc
tion
1
Alcohol and other drug use in regional and remote Australia: consumption, harms and access to treatment 2016–17
Population decline in regional and remote AustraliaOver the past 10 years, the population grew at a higher rate in Major cities (up 21.3%) than in Inner regional Australia (13.2%), Outer regional Australia (7.7%), Remote (0.5%) or Very remote Australia (4.1%). In terms of annual changes, Major cities continue to experience the greatest growth, up 2% in 2016–17 compared with the previous year (Table S1.1). Furthermore, Sydney, Melbourne and Brisbane accounted for over 70% of Australia’s annual population growth in 2016–17 (ABS 2018d). In contrast, Remote and Very remote Australia declined in population (both by 0.5%).
Remoteness and harmsPeople living in Remote and Very remote areas of Australia are more likely to engage in risky behaviours associated with poor health outcomes. Figure 1.1 shows that the proportion of health risk factors increased as remoteness increased, particularly daily smoking; low or no levels of exercise; exceeding the lifetime alcohol risk guideline; and mental health problems.
Figure 1.1: Proportion of different health behaviours and risk factors, by remoteness area, 2014–15 (%)
Notes1. ‘%’ represents prevalence of risk factor in each region (excluding Very remote areas of Australia).2. ‘Proportions’ are not age-standardised and, in some instances, higher prevalence may reflect the older age profiles in
Inner regional and Outer regional and remote areas.
Source: S1.2.
0
10
20
30
40
50
60
70
80
Current dailysmoker
Overweight orobese
No/low levelsof exercise
Exceedlifetime
alcohol riskguideline
High bloodpressure
Mental healthproblems
Per cent
Health behaviours and risk factors
Major cities Inner regional Outer regional and remote

3
Intr
oduc
tion
1
Alcohol and other drug use in regional and remote Australia: consumption, harms and access to treatment 2016–17
Life expectancy at birth for Australians was lowest in areas outside of Major cities in 2015–17, a pattern that was particularly evident for Indigenous Australians in Remote and very remote areas (ABS 2018c). Compared with Major cities, the life expectancy at birth for Indigenous Australians in Remote and very remote areas was 6.2 and 6.9 years lower for males and for females, respectively. For non-Indigenous Australians, life expectancy at birth in 2015–17 was lowest in Inner and outer regional areas—a gap of 1.6 and 0.9 years for males and for females—compared with Major cities (ABS 2018c).
Quality and access to health care in regional and remote areasThe Patient Experience Survey is an annual survey which collects data on access and barriers to health care services for Australians aged 15 and over. Health care services include general practitioners (GPs); medical specialists; imaging and pathology tests; dental professionals; hospital admissions; and emergency department visits (ED) (ABS 2017b).
Data from 2016–17 shows that, in the last 12 months:
• the proportion of people who reported seeing a GP and were living in Outer regional, remote and very remote areas (81.5%) was slightly lower than for those living in Inner regional areas (83.8%) or Major cities (82.4%)
• 5.8% of persons living in Outer regional, remote and very remote areas reported that they saw an after-hours GP, compared with 9.3% of those living in Major cities
• fewer people living in Outer regional, remote and very remote areas reported that they saw a dental professional (41.3%), compared with those living in Major cities (50%)
• almost 18% of persons living in Outer regional, remote and very remote areas reported visiting a hospital emergency department, compared with 12.7% living in Major cities (Table 1.1).
Table 1.1: Experience of health services in the last 12 months, by remoteness area, persons aged 15 and over, 2016–17 (%)
Health care service Major cities Inner regional
Outer regional, remote and very remote
Saw a GP 82.4 83.8 81.5
Saw a GP for urgent medical attention 8.9 9.8 10.8
Saw an after-hours GP 9.3 6.6 5.8
Received a prescription for medication from a GP 67.4 71.3 69.5
Saw a dental professional 50.0 44.6 41.3
Saw a medical specialist 36.3 36.4 33.6
Visited a hospital emergency department 12.7 15.8 17.9
GP = general practitioner
Source: ABS 2017b.

4
Intr
oduc
tion
1
Alcohol and other drug use in regional and remote Australia: consumption, harms and access to treatment 2016–17
Experiences with general practitioner care and out-of-pocket costs (additional patient costs paid for health services subsidised by Medicare) varied by remoteness.
In 2016–17:
• 21% of people in Outer regional, remote and very remote areas waited longer than they felt was acceptable to get an appointment with a general practitioner (compared with 19% in Inner regional areas and 18% in Major cities)
• 33% of people in Outer regional, remote and very remote areas reported they could not see their preferred general practitioner on 1 or more occasions (compared with 28% in Inner regional areas and 25% in Major cities) (ABS 2017b)
• The median total out-of-pocket costs per patient was highest in Major cities. Outside of Major cities, the median cost was higher in Inner regional local areas ($123) than in Outer regional ($117) and Remote ($106) local areas (AIHW 2018f).
Hospital admissions
In 2016–17, the number of hospital separations per 1,000 increased as remoteness increased, with the separation rate for patients living in Very remote areas (823.6 separations per 1,000 population) almost twice the rate for those living in Major cities (419.7 separations per 1,000 population) (AIHW 2018b).
‘Potentially preventable hospitalisations’ are those that are thought to be avoidable if timely and adequate non-hospital care had been provided, either to prevent the condition occurring or to prevent hospitalisation for the condition. These conditions are divided into 3 categories: vaccine preventable, acute conditions and chronic conditions. In 2016–17, potentially preventable hospitalisations increased by remoteness for all categories. Overall, potentially preventable hospitalisations were highest for patients living in Remote and Very remote areas (43 and 67 per 1,000, respectively) and lowest for patients living in Major cities (26 per 1,000) (AIHW 2018b).

Alco
hol a
nd o
ther
dru
g co
nsum
ptio
n ac
ross
Aus
tral
ia
2
5Alcohol and other drug use in regional and remote Australia: consumption, harms and access to treatment 2016–17
2 Alcohol and other drug consumption across Australia
Alcohol Alcohol is widely consumed in Australia and is associated with many social and cultural activities. While most Australians drink alcohol at levels that cause few harmful effects, a large proportion drink at levels that increase their risk of harm—affecting not only themselves but also families, bystanders and the broader community (NHMRC 2009).
The short- and long-term harms of alcohol use are usually associated with different drinking patterns and are outlined in the Australian guidelines to reduce health risks from drinking alcohol (see Box 2.1). This report uses several measures to show trends in the use associated with harmful effects, particularly those that are likely to result in people needing treatment.
Box 2.1: Summary of the Australian guidelines to reduce health risks from drinking alcohol
The National Health and Medical Research Council (NHMRC) publishes guidelines for reducing the health risks of drinking alcohol. The data presented in this report focus on 2 of those recommendations:
• Guideline 1: To reduce the risk of alcohol-related harm over a lifetime (such as chronic disease or injury), a healthy adult should drink no more than 2 standard drinks a day.
• Guideline 2: To reduce the risk of injury on a single occasion of drinking, a healthy adult should drink no more than 4 standard drinks on any 1 occasion (NHMRC 2009). For this report, the proportion exceeding this guideline has been reported on a monthly and yearly basis.
ConsumptionThe consumption of alcohol by people aged 14 or older living in Regional and remote areas of Australia was consistently higher than for those living in Major cities. While Inner regional, Outer regional, Remote and Very remote areas have been grouped as Regional and remote areas for the purposes of this report, it is clear that the consumption of alcohol increases with remoteness, with people living in Remote and very remote areas generally reporting higher levels of consumption than those living in regional areas and Major cities (Figure 2.1).
Regional and remote Australians were also more likely to drink alcohol in quantities that placed them at risk of harm from an alcohol-related disease or injury over a lifetime or at risk of alcohol-related injury from a single drinking occasion. Specifically, Australians living in Regional and remote areas were significantly more likely than Australians in Major cities to:
• consume alcohol daily (8.0% compared with 5.0%)
• drink in excess of the lifetime risk guideline (21% compared with 15.4%) (see guideline 1 in Box 2.1)
• drink in excess of the single occasion risk guideline, at least monthly (29% compared with 24%) (see guideline 2 in Box 2.1)

Alco
hol a
nd o
ther
dru
g co
nsum
ptio
n ac
ross
Aus
tral
ia
2
6 Alcohol and other drug use in regional and remote Australia: consumption, harms and access to treatment 2016–17
• consume 11 standard drinks or more at least once a year (17.9% compared with 14.4%)
• consume 11 standard drinks or more at least once a month (8.8% compared with 6.3%) (Table S2.1).
The consumption of alcohol at risky levels was significantly different for people living in Remote and very remote areas, compared with those living in Major cities (Figure 2.1).
Figure 2.1: Drinking status, people aged 14 and over, by remoteness area, 2016 (%)
(a) On average, had more than 2 standard drinks per day. (b) Had more than 4 standard drinks at least once a month.(c) ‘At least yearly’ and ‘At least monthly’ are not mutually inclusive.
Source: Table S2.2.
There were no significant changes in alcohol consumption for people living in Regional and remote areas of Australia between 2013 and 2016 (Table S2.2).
For people living in Major cities, significantly fewer people consumed alcohol daily (5.7% in 2013 compared with 5.0% in 2016) and consumed, on average, more than 2 standard drinks per day (16.7% in 2013 compared with 15.4% in 2016) (Table S2.2).
Who consumes alcohol at risky levels?The consumption of alcohol at quantities that place a person at risk of harm from an alcohol-related disease or injury over a lifetime, or at risk of alcohol-related injury from a single drinking occasion, varied by age, sex, Indigenous status, education status and remoteness area.
0
5
10
15
20
25
30
35
40
Daily Lifetime risk:Risky(a)
Single occasion: At least monthly(b)
11 or more drinks:At least yearly(c)
11 or more drinks:At least monthly(c)
Per cent
Drinking status
Major cities Inner regional Outer regional Remote and very remote

Alco
hol a
nd o
ther
dru
g co
nsum
ptio
n ac
ross
Aus
tral
ia
2
7Alcohol and other drug use in regional and remote Australia: consumption, harms and access to treatment 2016–17
SexAccording to the 2016 NDSHS, males living in Regional and remote areas of Australia were significantly more likely than males living in Major cities to:
• consume alcohol daily (10.8% compared with 6.3%) (Table S2.3)
• drink in excess of the lifetime risk guideline (30% compared with 22%) (Figure 2.2)
• drink in excess of the single occasion risk guideline, at least monthly (39% compared with 33%) (Table S2.4)
• consume 11 standard drinks or more at least once a year (26% compared with 21%) (Table S2.5)
• consume 11 standard drinks or more at least once a month (13.5% compared with 9.8%) (Table S2.5).
Similarly, females living in Regional and remote areas of Australia were significantly more likely than females in Major cities to consume alcohol at harmful levels, but at lower levels than males (tables S2.4 and S2.5).
Figure 2.2: Drank in excess of the lifetime risk guideline(a), people aged 14 and over, by age, sex and remoteness area, 2016 (%)
(a) On average, had more than 2 standard drinks per day.
Source: Table S2.4.
AgeThe 2016 NDSHS data show that the harmful consumption of alcohol by people living in Regional and remote areas was significantly higher than for people living in Major cities across most age groups.
0
5
10
15
20
25
30
35
14–19 20–29 30–39 40–49 50–59 60–69 70+ Male Female
Per cent Major cities Regional and remote
Alco
hol a
nd o
ther
dru
g co
nsum
ptio
n ac
ross
Aus
tral
ia
2
8 Alcohol and other drug use in regional and remote Australia: consumption, harms and access to treatment 2016–17
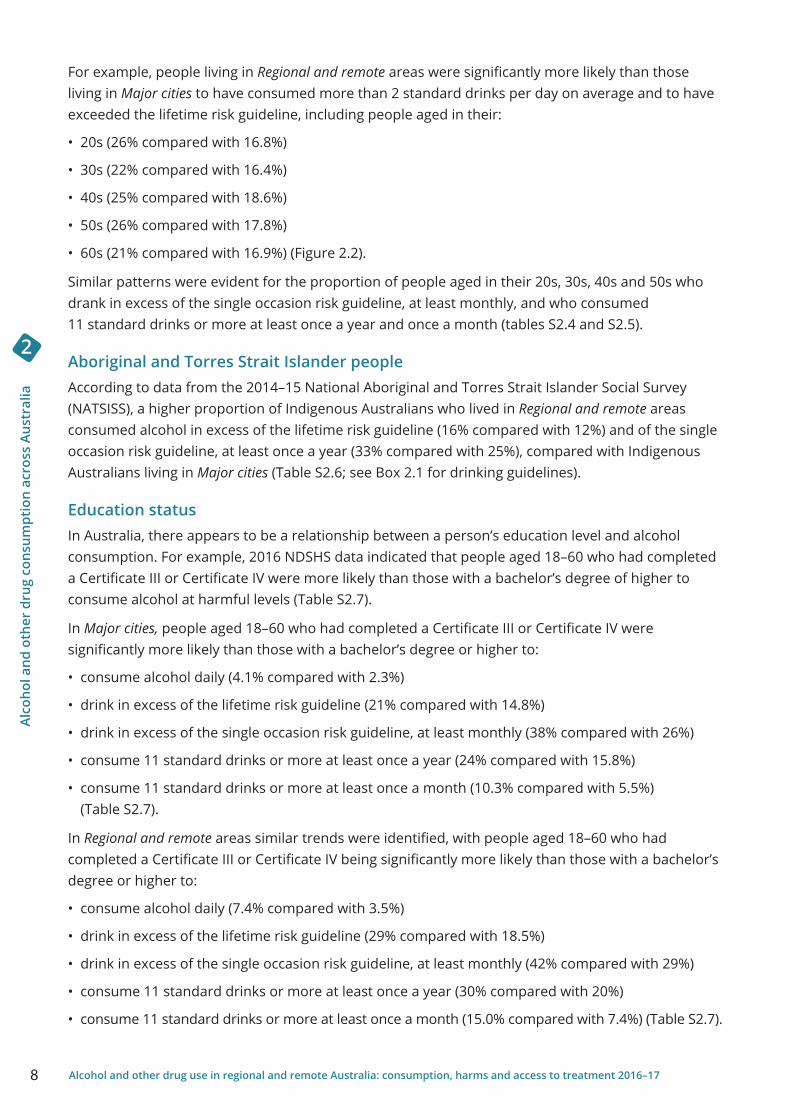
For example, people living in Regional and remote areas were significantly more likely than those living in Major cities to have consumed more than 2 standard drinks per day on average and to have exceeded the lifetime risk guideline, including people aged in their:
• 20s (26% compared with 16.8%)
• 30s (22% compared with 16.4%)
• 40s (25% compared with 18.6%)
• 50s (26% compared with 17.8%)
• 60s (21% compared with 16.9%) (Figure 2.2).
Similar patterns were evident for the proportion of people aged in their 20s, 30s, 40s and 50s who drank in excess of the single occasion risk guideline, at least monthly, and who consumed 11 standard drinks or more at least once a year and once a month (tables S2.4 and S2.5).
Aboriginal and Torres Strait Islander peopleAccording to data from the 2014–15 National Aboriginal and Torres Strait Islander Social Survey (NATSISS), a higher proportion of Indigenous Australians who lived in Regional and remote areas consumed alcohol in excess of the lifetime risk guideline (16% compared with 12%) and of the single occasion risk guideline, at least once a year (33% compared with 25%), compared with Indigenous Australians living in Major cities (Table S2.6; see Box 2.1 for drinking guidelines).
Education statusIn Australia, there appears to be a relationship between a person’s education level and alcohol consumption. For example, 2016 NDSHS data indicated that people aged 18–60 who had completed a Certificate III or Certificate IV were more likely than those with a bachelor’s degree of higher to consume alcohol at harmful levels (Table S2.7).
In Major cities, people aged 18–60 who had completed a Certificate III or Certificate IV were significantly more likely than those with a bachelor’s degree or higher to:
• consume alcohol daily (4.1% compared with 2.3%)
• drink in excess of the lifetime risk guideline (21% compared with 14.8%)
• drink in excess of the single occasion risk guideline, at least monthly (38% compared with 26%)
• consume 11 standard drinks or more at least once a year (24% compared with 15.8%)
• consume 11 standard drinks or more at least once a month (10.3% compared with 5.5%) (Table S2.7).
In Regional and remote areas similar trends were identified, with people aged 18–60 who had completed a Certificate III or Certificate IV being significantly more likely than those with a bachelor’s degree or higher to:
• consume alcohol daily (7.4% compared with 3.5%)
• drink in excess of the lifetime risk guideline (29% compared with 18.5%)
• drink in excess of the single occasion risk guideline, at least monthly (42% compared with 29%)
• consume 11 standard drinks or more at least once a year (30% compared with 20%)
• consume 11 standard drinks or more at least once a month (15.0% compared with 7.4%) (Table S2.7).

Alco
hol a
nd o
ther
dru
g co
nsum
ptio
n ac
ross
Aus
tral
ia
2
9Alcohol and other drug use in regional and remote Australia: consumption, harms and access to treatment 2016–17
Where is alcohol consumed at risky levels?Analysis of drinking patterns by remoteness area within each state and territory further illustrates the point that the consumption of alcohol at levels placing people at risk of alcohol-related harm is highest in Remote and Very remote areas and lowest in Major cities.
The highest proportion of people exceeding the NHMRC guidelines for lifetime risk by consuming more than 2 standard drinks per day, on average, were mainly living within Remote and Very remote areas of Queensland, Western Australia and the Northern Territory. Overall, Remote Western Australia (36%) had the highest proportion of people who drank alcohol at levels that placed them at harm over a lifetime. Conversely, the remoteness areas with the lowest proportion of people exceeding the lifetime risk guideline were living in Major cities—with the exception of Outer regional Tasmania (Table 2.1).
Table 2.1: Proportion of people aged 14 or older drinking alcohol at levels that placed them at harm over a lifetime, by top and bottom 5 areas of remoteness, 2016
Top 5 Bottom 5Remoteness area and state Per cent Remoteness area and state Per centRemote Western Australia 36% Outer regional Tasmania 13.4%
Very remote Northern Territory 29% Major cities Victoria 14.0%
Outer regional Northern Territory 29% Major cities Australian Capital Territory 14.3%
Very remote Western Australia *29% Major cities South Australia 14.5%
Remote Queensland 25% Major cities New South Wales 14.9%
Note: * Estimates have a relative standard error between 25% and 50% and should be used with caution.
Source: Table S2.8.
Similar to lifetime risk, the remoteness areas with the highest proportion of people who consumed more than 4 standard drinks on a single drinking occasion at least once a month were concentrated in Outer regional, Remote and Very remote areas of Western Australia and the Northern Territory. The remoteness areas with the lowest proportions were mostly in Major cities, with the exception of Inner regional Western Australia (Table 2.2).
Table 2.2: Proportion of people aged 14 or older drinking alcohol at levels that place them at harm on a single occasion, at least monthly, by top and bottom 5 areas of remoteness, 2016
Top 5 Bottom 5Remoteness area and state Per cent Remoteness area and state Per centVery remote Western Australia 44% Major cities Australian Capital Territory 22.6%
Remote Western Australia 44% Major cities New South Wales 22.6%
Very remote Northern Territory 43% Major cities Victoria 23.1%
Outer regional Western Australia 35% Major cities South Australia 23.8%
Outer regional Northern Territory 35% Inner regional Western Australia 24.1%
Source: Table S2.8.

Alco
hol a
nd o
ther
dru
g co
nsum
ptio
n ac
ross
Aus
tral
ia
2
10 Alcohol and other drug use in regional and remote Australia: consumption, harms and access to treatment 2016–17
Other drug use The use and misuse of licit and illicit drugs is commonly recognised as a health problem in Australia, with a wide range of associated health, social and economic harms of concern to the community (DoH 2017). The use of illicit drugs was estimated to cost the Australian society 8.19 billion dollars in 2004–05 (Collins & Lapsley 2008).
ConsumptionAccording to the 2016 NDSHS, the overall consumption of illicit drugs in the past 12 months by people aged 14 or older living in Major cities and in Regional and remote areas was similar (both 15.6%), however the type of illicit drug used varied (Table S2.1).
Specifically, levels of recent cannabis (10.4% compared with 10.5%) and meth/amphetamine (1.4% compared with 1.5%) use were at similar levels for people living in Major cities and Regional and remote areas (Table S2.1).
People living in Major cities were significantly more likely than those living in Regional and remote areas to have recently used:
• ecstasy (2.5% compared with 1.5%)
• cocaine (3.2% compared with 1.1%) (Table S2.1)
However, for people living in Remote and very remote areas the recent consumption of illicit drugs was significantly different compared with those living in Major cities, in particular for any illicit drug (25% compared with 15.6%) and for cannabis (17.0% compared with 10.4%) (Table S2.1).
Figure 2.3: Recent(a) illicit drug use, people aged 14 and over, by remoteness area, 2016 (%)
(a) Used in the previous 12 months.(b) For non-medical purposes.
Source: Table S2.2.
0 5 10 15 20
Cannabis
Ecstasy
Meth/amphetamine(b)
Cocaine
Drug type
Per cent
Major cities
Inner regional
Outer regional
Remote and very remote

Alco
hol a
nd o
ther
dru
g co
nsum
ptio
n ac
ross
Aus
tral
ia
2
11Alcohol and other drug use in regional and remote Australia: consumption, harms and access to treatment 2016–17
Compared with 2013, there was a significantly lower proportion of people aged 14 or older living in Major cities who had recently used meth/amphetamine in 2016 (1.4% compared with 2.1%). Conversely, there were significantly more people in Major cities who had used cocaine in 2016 than in 2013 (3.2% compared with 2.6%).
Who uses illicit drugs?The use of illicit drugs in the previous 12 months varied by age, sex, Indigenous status, education status and remoteness area.
SexAccording to the 2016 NDSHS, males living in Regional and remote areas of Australia were significantly more likely than males living in Major cities to have recently used:
• painkillers/analgesics and opioids (4.4% compared with 3.4%) and less likely to have recently used:
• ecstasy (1.8% compared with 2.9%)
• cocaine (1.4% compared with 3.8%).
Similarly, females living in Regional and remote areas of Australia were significantly less likely than those in Major cities to have recently used ecstasy and cocaine (Table S2.9).
Males and females living in Remote and very remote areas of Australia were significantly more likely than those in Major cities to have recently used any illicit drug (Figure 2.4).
AgeThe 2016 NDSHS data show that the consumption of illicit drugs varied considerably by age and remoteness area. For example, people in their 50s living in Regional and remote areas were significantly more likely than those living in Major cities to have recently used cannabis (9.2% compared with 6.3%) (Table S2.10). As a result, recent cannabis use, particularly in Remote and very remote areas, was 1 of the main reasons why people in their 50s living in Regional and remote areas were significantly more likely those living in Major cities to have recently used any illicit drug (14.2% compared with 10.5%) (Figure 2.4).
Conversely, people in their 20s (7.7% compared with 5.1%) and 30s (2.9% compared with 1.7%) living in Major cities were significantly more likely than people living in Regional and remote areas to have recently used ecstasy.

Alco
hol a
nd o
ther
dru
g co
nsum
ptio
n ac
ross
Aus
tral
ia
2
12 Alcohol and other drug use in regional and remote Australia: consumption, harms and access to treatment 2016–17
Figure 2.4: Recent illicit drug use, people aged 14 and over, by age, sex and remoteness area, 2016 (%)
Note: Recent illicit drug use figures for people 70 or older in Remote and very remote areas were not reported due to reliability issues.Sources: Tables S2.9 and S2.10.
Aboriginal and Torres Strait Islander peopleAccording to data from the 2014–15 National Aboriginal and Torres Strait Islander Social Survey (NATSISS), a higher proportion of Indigenous Australians who lived in Major cities than those in Regional and remote areas reported the use of a substance in the last 12 months (35% compared with 25%) (ABS 2016). Of all remoteness areas, Indigenous Australians living in Very remote areas had the lowest proportion (18%) of people who had used a substance in the last 12 months (Table S2.6).
Education statusAs with alcohol, in Australia there appears to be a relationship between a person’s education level and illicit drug use. For example, 2016 NDSHS data indicated that across all education levels, people aged 18–60 who had completed a Certificate III or Certificate IV had the highest rate of any illicit drug consumption in the past 12 months (Table S2.7).
In Major cities, people aged 18–60 who had completed a Certificate III or Certificate IV were significantly more likely than those with a bachelor’s degree or higher to have recently used:
• any illicit drug (24% compared with 15.0%)
• cannabis (16.9% compared with 10.0%)
• ecstasy (4.1% compared with 2.7%)
• meth/amphetamine (3.1% compared with 1.2%)
• pain-killers/analgesics and opioids for non-medical purposes (5.5% compared with 2.2%)
• any pharmaceutical for non-medical purposes (6.6% compared with 3.6%) (Table S2.7).
0
5
10
15
20
25
30
35
40
20–29 30–39 40–49 50–59 60–69 70+ Male Female
Per centMajor cities Inner regional Outer regional Remote and very remote

Alco
hol a
nd o
ther
dru
g co
nsum
ptio
n ac
ross
Aus
tral
ia
2
13Alcohol and other drug use in regional and remote Australia: consumption, harms and access to treatment 2016–17
Similarly, in Regional and remote areas, people aged 18–60 who had a Certificate III or Certificate IV were significantly more likely than those with a bachelor’s degree or higher to have recently used:
• any illicit drug (21% compared with 14.7%)
• cannabis (15.6% compared with 11.3%).
Where are illicit drugs consumed? Analysis of illicit drug use in the past 12 months by remoteness area within each state and territory shows that, of the top 5 areas, 4 were located in Remote and Very remote areas.
The area with the highest proportion of recent illicit drug use was Remote Western Australia (36%), while the area with the lowest was Outer regional New South Wales (11.4%) (Table 2.3).
Table 2.3: Proportion of people aged 14 or older who recently used an illicit drug, by top and bottom 5 areas of remoteness, 2016
Top 5 Bottom 5Remoteness area and state Per cent Remoteness area and state Per cent
Remote Western Australia 36% Outer regional New South Wales 11.4%
Very remote Northern Territory 24% Inner regional Victoria 11.5%
Outer regional Western Australia 22% Outer regional Victoria 12.8%
Remote Northern Territory 22% Major cities Australian Capital Territory 12.9%
Remote Queensland 22% Outer regional Queensland 13.1%
Source: Table S2.8.
Wastewater analysisWastewater analysis provides estimates of drug usage in a population by measuring concentrations of drug metabolites (excreted into the sewer system after consumption) in wastewater samples. The National Wastewater Drug Monitoring Program (NWDMP) collects data from capital cities within each state and territory as well as from regional areas. This reporting differs to the classifications used in the Australian Statistical Geography Standard, which are used throughout this report to classify data.
Findings from the NWDMP show that variation between capital cities and regional areas depends on the type of drug used. Across the main types of drugs measured by the NWDMP, key estimates include:
• the average cannabis consumption in regional sites was more than double that for capital cities
• there was a high presence of methamphetamine metabolites in wastewater across capital city and regional sites—higher in regional sites than in capital cities
• based on analysis of the presence of MDMA metabolites, the consumption of ecstasy (MDMA) is reported to be generally low across the country with the average being lower in capital cities than in regional sites
• cocaine was typically a capital city drug with the consumption in capital city sites higher than the average in regional areas, which is consistent with findings from the 2016 NDSHS
• the licit and illicit consumption of pharmaceutical opioids oxycodone and fentanyl were detected at higher levels in regional areas than in capital city areas (ACIC 2019).

Har
ms
from
alc
ohol
and
oth
er d
rug
use
3
14 Alcohol and other drug use in regional and remote Australia: consumption, harms and access to treatment 2016–17
3 Harms from alcohol and other drug use
Australians living in areas outside Major cites tend to have worse health outcomes than those living in Major cities—including shorter lives and higher levels of disease and injury. The proportion of adults who tend to engage in behaviours such as illicit drug use and alcohol misuse, which are associated with poorer health, is generally higher in areas outside Major cities. These outcomes may be due to a range of factors such as access to health services, including specialised health services such as AOD treatment (AIHW 2017b).
Higher death rates and poorer health outcomes outside Major cities, especially in remote areas, also reflect the higher proportion of the population in those areas who are Aboriginal or Torres Strait Islander Australians (AIHW 2015).
This section of the report presents data on alcohol and drug-related harms, using ‘burden of disease’ data. It also presents data by remoteness area for ambulance attendances, hospitalisations and deaths. The data show that alcohol and illicit drug use in Regional and remote areas results in substantial harms in these communities, in particular for Remote and Very remote areas.
Burden of disease The Australian Burden of Disease Study estimates the burden of around 200 specific diseases and injuries, and the contribution of 30 risk factors—including alcohol use and illicit drug use—to this disease burden (AIHW 2018d). See Box 3.1 for more information on common terms used in burden of disease analysis.
Box 3.1: Burden of disease
Burden of disease analysis measures the combined impact of dying prematurely, as well as of living with disease. It takes into account age at death and severity of disease for all diseases, conditions and injuries, in a consistent and comparable way. As well as describing the disease burden, the analysis estimates the contribution of various risk factors—termed ‘attributable burden’—for this health loss.
Fatal burden is the impact of dying prematurely from disease or injury. It is measured using years of life lost (YLL) due to premature death, which is the years lost between the age at which a person dies and the number of years they could have potentially gone on to live.
Non-fatal burden is the impact of living with ill health as measured by years lived with disability. In this report this is reported as disability-adjusted life years (DALY), which is a measure (in years) of healthy life lost, either through premature death—defined as dying before the ideal life span (years of life lost, or YLL)—or, equivalently, through living with ill health due to illness or injury (years lived with disability, or YLD).
Linked disease is a disease or injury for which there is evidence that its likelihood is increased by the risk factor in question.
(continued)
Har
ms
from
alc
ohol
and
oth
er d
rug
use
3
15Alcohol and other drug use in regional and remote Australia: consumption, harms and access to treatment 2016–17
Box 3.1 (continued): Burden of disease
This report examines the health burden in Australia attributable to alcohol and illicit drug use, both as distinct dependency disorders (for example, alcohol dependence) and as risk factors for other diseases and injuries (for example, alcohol use). The following terms are used in this report and may differ from those previously used in Australian Burden of Disease reports:
• ‘alcohol dependence’ (also referred to as ‘alcohol use disorders’)
• ‘illicit drug dependence’ (also referred to as ‘drug use disorders (excluding alcohol))’
• ‘illicit drug use’ (a risk factor, also referred to as ‘drug use’).
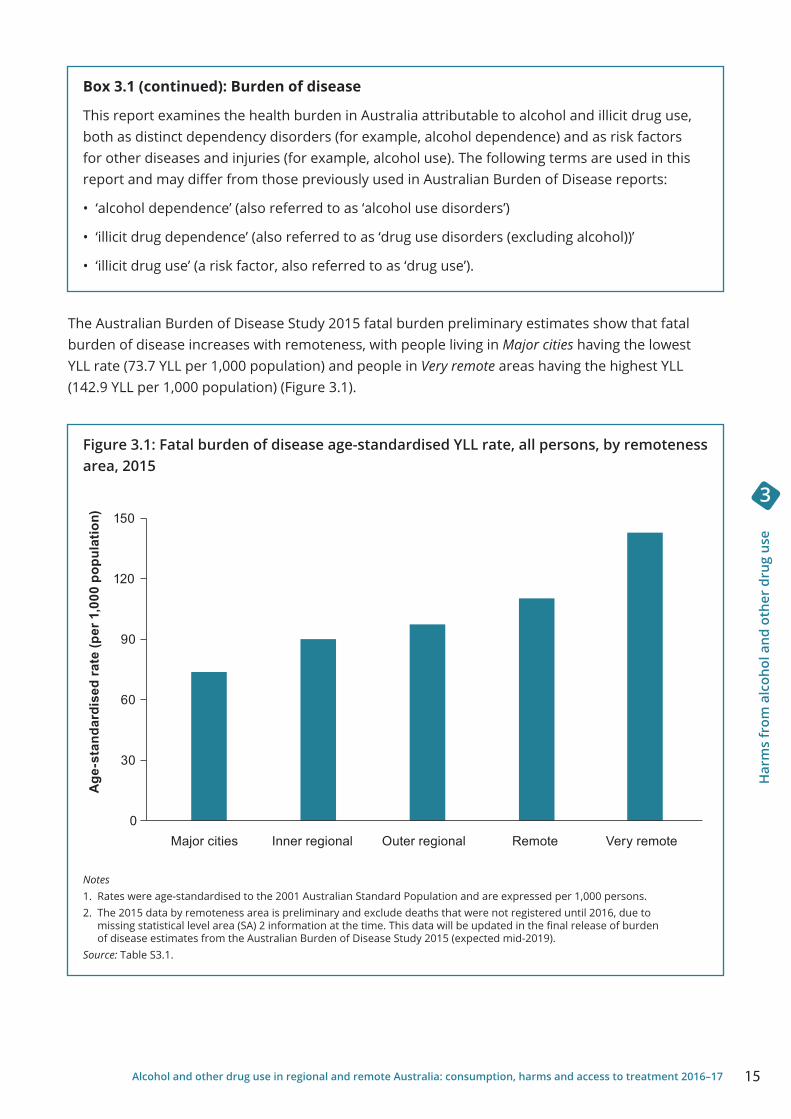
The Australian Burden of Disease Study 2015 fatal burden preliminary estimates show that fatal burden of disease increases with remoteness, with people living in Major cities having the lowest YLL rate (73.7 YLL per 1,000 population) and people in Very remote areas having the highest YLL (142.9 YLL per 1,000 population) (Figure 3.1).
Figure 3.1: Fatal burden of disease age-standardised YLL rate, all persons, by remoteness area, 2015
Notes1. Rates were age-standardised to the 2001 Australian Standard Population and are expressed per 1,000 persons.2. The 2015 data by remoteness area is preliminary and exclude deaths that were not registered until 2016, due to
missing statistical level area (SA) 2 information at the time. This data will be updated in the final release of burden of disease estimates from the Australian Burden of Disease Study 2015 (expected mid-2019).
Source: Table S3.1.
0
30
60
90
120
150
Major cities Inner regional Outer regional Remote Very remote
Age
-sta
ndar
dise
d ra
te (p
er 1
,000
pop
ulat
ion)

Har
ms
from
alc
ohol
and
oth
er d
rug
use
3
16 Alcohol and other drug use in regional and remote Australia: consumption, harms and access to treatment 2016–17
Analysis by disease group showed that, in 2015, the age-standardised YLL rate for alcohol dependence was 3.4 times higher in Very remote areas, compared with Major cities (0.76 YLL compared with 0.22 YLL per 1,000 population). Similarly, the age-standardised YLL rate for Illicit drug dependence was 2.9 times higher in Very remote areas, compared with Major cities (0.19 YLL compared with 0.06 YLL per 1,000 population). The burden of these disorders increases with remoteness (Table S3.2).
Additional analysis from the Australian Burden of Disease Study 2011 examined the impact of alcohol and illicit drug use on the health burden of disease and injury in Australia, including by remoteness. These results are presented below.
Burden of alcohol useAlcohol use, as a risk factor for other diseases and injuries, contributed to 4.6% of the total burden of disease and injury experienced by Australians in 2011 (AIHW 2018e). Overall, the greatest alcohol attributable burden was experienced in Major cities (141,119 DALY) and the smallest in Very remote areas (4,382 DALY). However, after adjustment for population size and age structure, there was a clear pattern of alcohol attributable burden increasing as remoteness increased (Table S3.3). The burden was greatest in Remote and Very remote areas, which experienced 2.1 and 2.7 times, respectively, of the burden attributable to alcohol use, compared with Major cities (Table S3.3).
When examining the type of linked disease attributable to the risk factor alcohol use, Very remote areas experienced the highest DALY rates for:
• Alcohol dependence (5.1 per 1,000 attributable DALYS)
• Suicide and self-inflicted injuries (3.5 per 1,000 attributable DALYs)
• Chronic liver disease (1.4 per 1,000 attributable DALYs) (Figure 3.2).
Figure 3.2: Age-standardised attributable DALY rate due to alcohol use, by selected linked diseases, by remoteness area, 2011
Note: Rates were age-standardised to the 2001 Australian Standard Population and are expressed per 1,000 persons.Source: Table S3.4.
0
1
2
3
4
5
6
Age
-sta
ndar
dise
d D
ALY
rate
(per
1,0
00 p
opul
atio
n)
Linked disease
Alcohol dependence
Sucicide and self-inflicted
injuries
Road traffic injuries–
motor vehicle occupants
Chronic liver
disease
Epilepsy Accidential poisoning
Bowel cancer
Breast cancer
Major cities Inner regional Outer regional Remote Very remote

Har
ms
from
alc
ohol
and
oth
er d
rug
use
3
17Alcohol and other drug use in regional and remote Australia: consumption, harms and access to treatment 2016–17
Burden of alcohol use for Indigenous AustraliansIndigenous Australians make up a substantial proportion of people living in Regional and remote areas of Australia—in particular in Very remote areas. As such, it is important to examine the impact of the burden of alcohol use on Indigenous Australians. (Please refer to Appendix A for information regarding differences in the methodology for calculating attributable burden for alcohol use.)
In 2011, alcohol use as a risk factor was responsible for 8% of the total burden of disease and injury in Indigenous Australians (AIHW 2016a). This captures both the immediate impact of alcohol consumption (resulting in injury) and the long-term impact (chronic diseases).
Alcohol dependence was ranked as the 4th highest specific disease contributing to total burden (DALY) for Indigenous Australians (4.2%), behind:
• Coronary heart disease (7.2%)
• Suicide and self-inflicted injuries (4.5%)
• Anxiety disorders (4.4%).
Burden of illicit drug useIllicit drug use, as a risk factor for other diseases and injuries, contributed to 2.3% of the total burden of disease and injury experienced by Australians in 2011 (AIHW 2018e). Similar to the burden attributable to alcohol use, the rate of burden attributable to illicit drug use in 2011 varied by remoteness. The greatest burden attributable to illicit drug use was experienced in Major cities (76,951 DALY) and the smallest in Very remote areas (1,322 DALY). However, across remoteness areas there were similar proportions of the total burden of disease in each area (1.7%–2.7%) (Table S3.5).
After adjustment for population size and age structure, differences in the overall rate of burden attributable to illicit drug use emerged across the different remoteness areas (Table S3.5). When compared with Major cities, the burden was higher for both Remote and Very remote areas (rate ratios of 1.3 each); slightly lower in Inner regional areas (a rate ratio of 0.9) and similar in Outer regional areas (a rate ratio of 1.0).
When examining the type of linked disease attributable to illicit drug use, Major cities experienced the highest DALY rates for Illicit drug dependence, compared with other areas (1.8 per 1,000 compared with 0.9–1.0 per 1,000) (Figure 3.3). The rate of burden due to illicit drug use was higher in Remote and Very remote areas for Suicide and self-inflicted injuries, Chronic liver disease and Road traffic injuries—motor vehicle occupants.

Har
ms
from
alc
ohol
and
oth
er d
rug
use
3
18 Alcohol and other drug use in regional and remote Australia: consumption, harms and access to treatment 2016–17
Figure 3.3: Age-standardised attributable DALY rate due to illicit drug use, by selected linked diseases, by remoteness area, 2011
Note: Rates were age-standardised to the 2001 Australian Standard Population and are expressed per 1,000 persons.Source: Table S3.6.
Burden of illicit drug use for Indigenous AustraliansOf the linked diseases analysed, Illicit drug dependence, Chronic liver disease and Suicide and self-inflicted injuries were responsible for the greatest burden due to illicit drug use for Indigenous Australians (AIHW 2016a). (Please refer to Appendix A for information regarding differences in the methodology for calculating attributable burden for illicit drug use.)
Illicit drug use contributed to 3.7% of the total burden of disease and injury experienced by Indigenous Australians in 2011. This captures the impact of injecting drug use as well as cocaine, opioid, amphetamine and cannabis dependence. Illicit drug use was responsible for 4% of the total gap in disease burden between Indigenous and non-Indigenous Australians in 2011 (AIHW 2016a).
Ambulance attendancesNational data on alcohol and drug-related ambulance attendances are currently not available, but available data show the number and rates of attendances in Victorian metropolitan and regional areas. (Note: the geographical terms used in this section differ to those used in the Australian Statistical Geography Standard which is utilised throughout this report.)
In 2016–17, in Victoria, the rate of alcohol intoxication-related ambulance attendances in regional Victoria was 366.6 per 100,000 population (5,595 attendances), while it was similar in metropolitan areas (365.1 per 100,000 population or 16,988 attendances). For metropolitan and regional areas, the rate of ambulance attendances has been relatively stable since 2014–15, following a large increase between 2011–12 and 2014–15 (Turning Point 2017).
0.0
0.5
1.0
1.5
2.0
Age
-sta
ndar
dise
d DA
LY ra
te (p
er 1
,000
pop
ulat
ion)
Linked disease
Illicit drug dependence
Accidential poisoning
Sucicide and self-inflicted
injuries
Chronic liver
disease
Liver cancer
Road traffic injuries–
motor vehicle occupants
Road traffic injuries–
motorcyclists
Major cities Inner regional Outer regional Remote Very remote

Har
ms
from
alc
ohol
and
oth
er d
rug
use
3
19Alcohol and other drug use in regional and remote Australia: consumption, harms and access to treatment 2016–17
For any illicit drug-related ambulance attendances in 2016–17, the rate of ambulance attendances was higher in Victorian metropolitan areas (196.5 per 100,000 or 9,145 attendances) than in regional areas (125.7 per 100,000 population or 1,918 attendances). Since 2011–12, the rate of any illicit drug-related attendances has risen faster in regional areas—up 2.3 times (from 53.6 attendances per 100,000), compared with 1.8 times in metropolitan areas (from 112.1 attendances per 100,000) (Turning Point 2017).
Males and young people aged 15–24 had the highest rate of ambulance attendances in metropolitan and regional areas for alcohol intoxication and any illicit drug use (Turning Point 2017).
Drug-related hospitalisationsInformation on drug-related hospitalisations is taken from the National Hospital Morbidity Database (NHMD), which includes almost all public hospitals that provided data for this collection in 2016–17. (See Box 3.2 for the definition of drug-related hospital separations.)
Drugs described in this section include:
• legal, accessible drugs, such as alcohol and tobacco
• drugs available by prescription or over-the-counter, such as analgesics and antidepressants
• drugs generally not obtained through legal means, such as heroin and ecstasy.
As a result, a proportion of the separations reported in this chapter might result from harm arising from the therapeutic use of drugs; that is drugs used to treat disease. The inclusion of therapeutic use in these data might mean the burden on the hospital system appears larger than would be expected.
Box 3.2: Definition of drug-related separations in the National Hospital Morbidity Database
A hospital separation is a completed episode of admitted hospital care ending with discharge, death, or transfer, or a portion of a hospital stay starting or ending in a change to another type of care (for example, from acute care to rehabilitation).
Hospital separations data do not include episodes of non-admitted patient care provided in outpatient clinics or emergency departments. Patients treated in these settings might be admitted subsequently, with the care provided to them as admitted patients being included in the NHMD.
Drug-related separations refer to hospital care with selected principal diagnoses (that is, the diagnosis established to be chiefly responsible for occasioning an episode of admitted patient care) of substance-use disorder or harm (all forms of harm, including accidental, intended, or self-inflicted) due to selected substances.
Hospital separations where the diagnosis of drug-related harm or disorder is additional to the principal diagnosis (such as problems related to certain chronic conditions caused by the use of drugs like tobacco and alcohol) have been excluded.
In 2016–17, there were a total of about 11.0 million hospitalisations in public and private hospitals combined (AIHW 2018b). Drug-related principal diagnoses (considered to be responsible for an episode of admitted care to hospital) accounted for about 1% (or 137,000) of those (Table S3.7)—a proportion similar to previous years (AIHW 2018b).

Har
ms
from
alc
ohol
and
oth
er d
rug
use
3
20 Alcohol and other drug use in regional and remote Australia: consumption, harms and access to treatment 2016–17
NHMD data showed that, of hospitalisations with a drug-related principal diagnosis in 2016–17, the highest number were for alcohol, which accounted for about half (51%) of those separations. This was consistent for hospitalisations for people usually residing in Major cities and in Regional and remote areas (that is, in areas outside of Major cities. See Appendix A for further information). For people usually residing in Remote and very remote areas, hospital separations for alcohol accounted for nearly three-quarters (72%) of hospitalisations with a drug-related principal diagnosis—the highest proportion of all remoteness areas.
For people usually residing in Major cities and in Regional and remote areas, minimal differences were evident for separations where the principal diagnosis related to:
• opioids (including heroin, opium, morphine and methadone) (6.6% compared with 5.5%)
• cannabinoids (4.5% compared with 5.1%)
• other sedatives and hypnotics (7.8% compared with 7.1%)
• methamphetamines (6.4% compared with 5.0%).
Compared with all other remoteness areas, for people usually residing in Remote and very remote areas there was a lower proportion of separations where the principal diagnosis related to:
• opioids (2.2%)
• other sedatives and hypnotics (2.4%)
• methamphetamines (2.8%).
The proportion of separations for cannabinoids (5.7%) was higher for people usually residing in Remote and very remote areas, compared with other remoteness areas (Figure 3.4).
Figure 3.4: Proportion of hospital separations for drug-related principal diagnoses, by remoteness area, 2016–17 (%)
Source: Table S3.7.
0 10 20 30 40 50 60 70 80
Alcohol
Opioids
Non-opioid analgesics
Other sedatives and hypnotics
Cannabinoids
Methamphetamines
Drug of concern diagnosis
Per cent
Major cities
Inner regional
Outer regional
Remote and very remote

Har
ms
from
alc
ohol
and
oth
er d
rug
use
3
21Alcohol and other drug use in regional and remote Australia: consumption, harms and access to treatment 2016–17
Data from the 2016–17 NHMD showed that the rate of drug-related hospital separations for alcohol was similar for people usually residing in Major cities and in Regional and remote areas (286.7 per 100,000 population compared with 272.1 per 100,000 population). Of all remoteness areas, the rate of drug-related hospital separations for alcohol was highest for people usually residing in Remote and very remote areas (1,624.9 per 100,000 population)—almost 6 times higher than for people usually residing in Major cities (Table S3.8).
The rate of drug-related hospital separations for cannabinoids was similar for people usually residing in Major cities and Regional and remote areas, but was 5 times higher for people usually residing in Remote and very remote areas, compared with those in Major cities (129.0 per 100,000 population compared with 24.9 per 100,000 population).
Hospital separation rates per 100,000 population were higher for people usually residing in Remote and very remote areas, compared with Major cities for:
• non-opioid analgesics (3.0 times)
• methamphetamines (1.8 times)
• opioids (1.4 times)
• other sedatives and hypnotics (1.2 times) (Table S3.8).
Drug-induced deathsDrug-induced deaths are defined as those that can be directly attributable to drug use, as determined by toxicology and pathology reports (ABS 2017a). Multiple drug types may have been reported on a single death record. As a result, the sum of each drug type may be more than the total number of deaths.
In 2017, 1,795 deaths were drug-induced (a rate of 7.4 per 100,000 population) (Table S3.9). While the number of drug-induced deaths in 2017 was the second highest on record, the rate is still lower than that of drug-induced deaths recorded in 1999 (9.1 deaths per 100,000 population). The rate then fell to a low of 4.6 deaths per 100,000 population in 2006 and has been trending upwards since (Table S3.9).
By remoteness area, the number of drug-induced deaths in 2017 was substantially higher in Major cities than in Regional and remote areas (1,294 compared with 483) (Table S3.10). The rate of drug-induced deaths was slightly higher in Major cities (7.4 per 100,000 population), compared with Regional and remote areas (7.2 per 100,000 population) (Table S3.11).
Over the past decade, the rate of drug-induced deaths has increased at a faster rate in Regional and remote areas, up 41% since 2008, compared with a 16% increase in Major cities over the same period. As a result, the rate of drug-induced deaths was higher in Regional and remote areas than in Major cities between 2012 and 2016 (Figure 3.5).

Har
ms
from
alc
ohol
and
oth
er d
rug
use
3
22 Alcohol and other drug use in regional and remote Australia: consumption, harms and access to treatment 2016–17
Figure 3.5: Rate of drug-induced deaths in Major cities and Regional and remote areas, 2008 to 2017
Notes1. ‘Regional and remote’ includes all areas outside Major cities (that is, Inner regional, Outer regional, Remote and
Very remote). 2. Drug-induced deaths capture the underlying causes of deaths (including any associated causes) that align with the
definition of drug-induced deaths used by the ABS reporting in 3303.0 - Causes of death, Australia, 2015, Appendix 2.Source: Table S3.11.
In 2017, benzodiazepines were the drug type most commonly identified in drug-induced deaths in Major cities (592 deaths) and in Regional and remote areas (221 deaths), with a similar rate of death (tables S3.10 and S3.11). The number of drug-induced deaths where benzodiazepines were present rose sharply between 2008 and 2016 in Major cities (297 to 592 deaths, up 99%) and Regional and remote areas (104 to 221 deaths, up 113%) (Table S3.10).
Opioids are commonly identified in drug-induced deaths in Australia, with clear differences evident by remoteness area. For example, in 2017 the rate of drug-induced deaths where heroin was identified was higher in Major cities than in Regional and remote areas (1.9 deaths per 100,000 population compared with 1.1 deaths per 100,000 population).
0
1
2
3
4
5
6
7
8
9
2008 2009 2010 2011 2012 2013 2014 2015 2016 2017
Rat
e pe
r 100
,000
pop
ulat
ion
Major cities Regional and remote

Har
ms
from
alc
ohol
and
oth
er d
rug
use
3
23Alcohol and other drug use in regional and remote Australia: consumption, harms and access to treatment 2016–17
In 2017, drug-induced deaths involving prescription opioids occurred at a similar rate in Regional and remote areas and in Major cities for the drug types other opioids (including oxycodone and codeine) and methadone (Figure 3.6). Overall, in 2017, the rate of druginduced deaths for other synthetic opioids (including fentanyl and tramadol) and any opioid excluding heroin was higher in Regional and remote areas than in Major cities (1.5 and 4.0 deaths per 100,000 population compared with 0.9 and 3.3 deaths per 100,000 population). Rates for other drug types were similar across remoteness areas (Table S3.11).
Figure 3.6: Rate of opioid-induced deaths in Major cities and Regional and remote areas, 2008 and 2017
Notes1. Regional and remote includes all areas outside Major cities (that is, Inner regional, Outer regional, Remote and Very remote). 2. Multiple drug types may have been reported on a single death record. As a result, the sum of each drug type may be more
than the total number of deaths. Source: Table S3.11.
0
1
2
3
4
5
6
0
1
2
3
4
5
6
2017
Rat
e pe
r 100
,000
pop
ulat
ion
2008
Major cities Regional and remote Major cities Regional and remote
Heroin Other opioid
Methadone Other synthetic
opioid
Any opioid
Any opioid excluding
heroin
Heroin Other opioid
Methadone Other synthetic
opioid
Any opioid
Any opioid excluding
heroin

Har
ms
from
alc
ohol
and
oth
er d
rug
use
3
24 Alcohol and other drug use in regional and remote Australia: consumption, harms and access to treatment 2016–17
Usual residenceIn general, people living outside of a capital city in 2016 were more likely to die from drug use (ABS 2017a). However, in Western Australia, South Australia and Tasmania people were more likely to die from drug use in the capital city (Figure 3.7). Interestingly, Queensland was the only state where the proportion of drug-induced deaths was higher outside of the capital city (55.1% compared with 44.6% in a capital city) (Table S3.12). This may reflect the population distribution in Queensland, where slightly more than half the population lives outside the capital city (ABS 2018d).
Figure 3.7: Rate of drug-induced deaths, by region of usual residence, 2016
Notes1. Standardised death rates. Deaths per 100,000 of estimated mid-year population.2. Causes of death data for 2016 are preliminary and subject to revision.3. Deaths registered on Norfolk Island from 1 July 2016 are included in this publication for the first time.Source: Table S3.12.
Alcohol-induced deathsAlcohol-induced deaths are defined as those that can be directly attributable to alcohol use, as determined by a doctor or by a coroner as part of a police, toxicology, pathology or coronial reports (ABS 2018).
In 2017, there were 5.1 alcohol-induced deaths per 100,000 population (Table S3.13), down from 6.6 in 1997. Since 2013, the rate of alcohol-induced deaths per 100,000 population has remained stable (ABS 2018b).
There were 1,366 alcohol-induced deaths recorded in 2017, with an additional 2,820 (alcohol-related) deaths where alcohol was mentioned as a contributing factor to mortality (ABS 2018b).
0
2
4
6
8
10
12
14
NSW Vic Qld SA WA Tas ACT AustStan
dard
ised
dea
th ra
te p
er 1
00,0
00 p
opul
atio
n Capital city Rest of state

Har
ms
from
alc
ohol
and
oth
er d
rug
use
3
25Alcohol and other drug use in regional and remote Australia: consumption, harms and access to treatment 2016–17
The most common cause of alcohol-induced death was Alcoholic liver disease, while Mental and behavioural conditions due to alcohol use (including alcohol addiction) is the most common contributor to alcohol-related deaths. Mental and behavioural disorders due to alcohol abuse also made up about 20% of alcohol-induced deaths in 2017 (ABS 2018b).
Alcohol-induced deaths, by region, show that higher rates of alcohol-induced deaths were recorded in all jurisdictions for regions outside of capital cities. On average, the rate of alcohol-induced deaths in regions outside of capital cities were about 1.5 times higher than in capital cities; the difference was highest in the Northern Territory (3.2 times) and lowest in Queensland (1.2 times). Overall, the highest alcohol-induced death rate was in the Northern Territory’s ‘rest-of-state’ region, at 28.5 per 100,000 persons (Figure 3.8).
Figure 3.8: Rate of alcohol-induced deaths, by region of usual residence, 2017
Notes1. Causes of death data for 2017 are preliminary and subject to a revisions process.2. The data presented for alcohol-induced deaths are based on an alcohol-induced death tabulation created by the
Office of National Statistics in the United Kingdom.3. Standardised death rates. Deaths per 100,000 of estimated mid-year population.Source: Table S3.13.
0
5
10
15
20
25
30
NSW Vic Qld SA WA Tas NT ACT Aust
Stan
dard
ised
dea
th ra
te p
er 1
00,0
00 p
opul
atio
n
Capital city Rest of state

Alco
hol a
nd o
ther
dru
g tr
eatm
ent s
ervi
ces
4
26 Alcohol and other drug use in regional and remote Australia: consumption, harms and access to treatment 2016–17
4 Alcohol and other drug treatment services
Specialist alcohol and other drug (AOD) treatment services assist people to tackle their drug use through a range of treatments. Treatment objectives can include reduction or cessation of drug use, as well as improving social and personal functioning. Treatment and assistance may also be provided to support the family and friends of people using drugs. Treatment services include detoxification and rehabilitation, counselling and pharmacotherapy, and are delivered in residential and non-residential settings (AIHW 2018c).
In Australia, publicly funded treatment services for AOD use are available in all states and territories. Most of these services are funded by state and territory governments, while some are funded by the Australian Government. Information on publicly funded AOD treatment services in Australia, and the people and drugs treated, are collected through the Alcohol and Other Drug Treatment Services National Minimum Data Set (AODTS NMDS). (Refer to Appendix A for information on the scope and coverage of the AODTS NMDS.)
AgenciesNationally, in 2016–17, over half (482 or 58%) of the treatment agencies were located in Major cities. For agencies in Regional and remote areas, most were in Inner regional (22%) and Outer regional (13%) areas, with relatively few agencies located in Remote and very remote areas (7% in total). Across most states and territories, the proportion of agencies in Remote and very remote areas was low, with the exception of Western Australia (23%) and the Northern Territory (57%) (AIHW 2018c).
Treatment agencies in Major cities provided almost three-quarters (71%) of all closed treatment episodes. Agencies in Remote and very remote areas provided 1 in every 29 (3.5%) treatment episodes (Table 4.1). Overall, agencies in Regional and remote areas (all treatment services located outside Major cities—see Appendix A for further information) provided 29% of all closed treatment episodes.
Table 4.1: Closed treatment episodes, by remoteness area, states and territories, 2016–17 (%)
NSW Vic Qld WA SA Tas ACT NT Aust
Major cities 65.8 80.6 66.8 78.3 73.9 — 100.0 — 71.2
Inner regional 30.0 15.0 12.6 7.7 9.3 76.3 — — 16.3
Outer regional 3.1 4.3 16.9 7.3 9.6 23.7 — 53.1 9.0
Remote 1.2 — 3.2 5.3 5.5 — — 38.7 2.9
Very remote — — 0.5 1.4 1.6 — — 8.2 0.6
Remote and very remote 1.2 — 3.7 6.7 7.2 — — 46.9 3.5
Regional and remote 34.2 19.4 33.2 21.7 26.1 100.0 0 100.0 28.8
Total 100.0 100.0 100.0 100.0 100.0 100.0 100.0 100.0 100.0
Notes1. Regional and remote includes all areas outside Major cities (that is, Inner regional, Outer regional, Remote and Very remote).2. In Victoria, alcohol and other drug treatment activity is generally recorded against a service provider’s administrative address
rather than the location where the activity was delivered. As a result, Victoria’s remoteness reporting may not accurately reflect the actual distribution across the state. It is anticipated that this will be improved with the implementation of a new data collection from October 2018.
Source: AIHW 2018c.
Al
coho
l and
oth
er d
rug
trea
tmen
t ser
vice
s
4
27Alcohol and other drug use in regional and remote Australia: consumption, harms and access to treatment 2016–17
ClientsIn 2016–17, an estimated 127,404 clients aged 10 and over received 200,751 closed treatment episodes from publicly funded AOD treatment agencies across Australia, which equates to 605 clients per 100,000 population (Table S4.1). The majority (122,413 or 96%) of clients sought treatment for their own drug use (AIHW 2018c).
More than two-thirds (69%) of clients received treatment in Major cities, with an estimated 87,883 clients receiving 142,880 closed treatment episodes or about 1.6 treatment episodes per client (Table S4.1). There were an estimated 39,521 clients who received 57,871 closed treatment episodes in Regional and remote areas (about 1.5 episodes per client). This equates to 586 clients per 100,000 population in Major cities, compared with 652 clients per 100,000 population in Regional and remote areas.
Overall, agencies in Remote and very remote areas had the highest rate of clients who sought treatment (1,294 clients per 100,000 population), compared with other remoteness areas, despite having the smallest number of clients (5,486), and smallest average number of episodes per client (1.3 episodes per client or 7,088 episodes) (Table S4.1).
Client profileAbout 2 in every 3 clients (66%) who received treatment in 2016–17 were male, irrespective of remoteness area (AIHW 2018c). Most clients were aged between 20 and 39 and there was little difference in the age profile of clients who received treatment in Major cities and in Regional and remote areas (Figure 4.1).
Compared with clients in Major cities, the age of clients who received treatment in Remote and very remote areas was younger, with a higher proportion of clients aged between 10 and 29 (46% compared with 39% in Major cities) (Table S4.2).
A higher proportion of Indigenous clients received treatment in Regional and remote areas than in Major cities (28% compared with 9.0%). The proportion of Indigenous clients who received treatment increases with remoteness, with 3 in 5 clients (62%) in Remote and very remote areas being Indigenous (Table S4.3).

Alco
hol a
nd o
ther
dru
g tr
eatm
ent s
ervi
ces
4
28 Alcohol and other drug use in regional and remote Australia: consumption, harms and access to treatment 2016–17
Figure 4.1: Proportion of clients by age and remoteness area, 2016–17 (%)
Note: In Victoria, alcohol and other drug treatment activity is generally recorded against a service provider’s administrative address rather than the location where the activity was delivered. As a result, Victoria’s remoteness reporting may not accurately reflect the actual distribution across the state. It is anticipated that this will be improved with the implementation of a new data collection from October 2018. Source: S4.2.
Principal drug of concernIn 2016–17, alcohol was the most common principal drug of concern of all closed treatment episodes for people’s own drug use (32% of all closed treatment episodes and 31% of clients) (tables S4.4 and S4.5).
By remoteness area, alcohol made up a higher proportion of treatment episodes (39% compared with 30%) and of clients receiving treatment (38% compared with 28%) in Regional and remote areas compared with Major cities. This disparity increases with remoteness, with more than half of the treatment episodes (61%) and of clients (60%) in Remote and very remote areas treated for alcohol as a principal drug of concern (tables S4.4 and S4.5).
Amphetamines were the second most common principal drug of concern of all closed treatment episodes (26% of closed episodes and 24% of clients), followed by cannabis (22% of closed episodes and 24% of clients) (tables S4.4 and S4.5).
By remoteness area, amphetamines made up a higher proportion of treatment episodes in Major cities than in both Regional and remote and Remote and very remote areas (27% compared with 23% and 11%, respectively). Cannabis made up a higher proportion of treatment episodes in Regional and remote areas than in Major cities (26% compared with 20%) (Table S4.4). Similar patterns were evident among clients (Table S4.5).
0
5
10
15
20
25
30
35
10 –19 20 –29 30 –39 40 –49 50 –59 60+
Per cent
Major cities Inner regional Outer regional Remote and very remote

Al
coho
l and
oth
er d
rug
trea
tmen
t ser
vice
s
4
29Alcohol and other drug use in regional and remote Australia: consumption, harms and access to treatment 2016–17
Figure 4.2: Proportion of closed treatment episodes for own drug use, by principal drug of concern and remoteness area, 2016–17 (%)
Note: In Victoria, alcohol and other drug treatment activity is generally recorded against a service provider’s administrative address rather than the location where the activity was delivered. As a result, Victoria’s remoteness reporting may not accurately reflect the actual distribution across the state. It is anticipated that this will be improved with the implementation of a new data collection from October 2018.Source: Table S4.4.
The proportion of closed treatment episodes where a pharmaceutical was the drug of principal concern was similar in Major cities and in Regional and remote areas (4.8% compared with 5.3%), but lower in Remote and very remote areas (1.3%, Figure 4.2).
The proportion of closed treatment episodes where heroin was the drug of principal concern was higher in Major cities than in Regional and remote areas (6.4% compared with 2.2%) (Table S4.4). This difference may be greater due to the exclusion of treatment agencies whose sole function is prescribing or providing dosing services for opioid pharmacotherapy from the AODTS NMDS (AIHW 2018c).
Source of referral For closed treatment episodes in 2016–17 for own drug use, the most common referral sources were:
• self/family (37%)
• health services (28%)
• police and court-based diversion programs (17%) (Table S4.6).
With the exception of cannabis, this was a consistent pattern across the most common principal drugs of concern and remoteness areas, including in Major cities and in Regional and remote areas (Table S4.6). For cannabis, police and court-based diversion programs was the most common referral source for each remoteness area except Remote and very remote areas.
0
10
20
30
40
50
60
70
Alcohol Amphetamines Cannabis Pharmaceuticals Heroin
Per cent
Principal drug of concern
Major cities Inner regional Outer regional Remote and very remote

Alco
hol a
nd o
ther
dru
g tr
eatm
ent s
ervi
ces
4
30 Alcohol and other drug use in regional and remote Australia: consumption, harms and access to treatment 2016–17
Main treatment type In 2016–17, the most common main type of treatment (the primary activity used to treat the client’s alcohol and other drug problem) was counselling (39%). This was followed by:
• assessment only (16%)
• support and case management only (14%)
• withdrawal management (12%) (Table S4.7).
The proportion of closed treatment episodes where the main treatment type was counselling, was higher in Regional and remote areas than in Major cities (47% compared with 36%)—a difference more distinct in Remote and very remote areas (57%). Rehabilitation made up a higher proportion of episodes in Regional and remote areas than in Major cities (8.2% compared with 4.8%) (Table S4.7).
The proportion of closed treatment episodes in Major cities was higher than in Regional and remote areas for the main treatment types:
• pharmacotherapy (2.6% compared with 1.5%)
• support and case management only (16.3% compared with 9.2%)
• withdrawal management (13.9% compared with 8.6%) (Figure 4.3).
Figure 4.3: Proportion of closed treatment episodes for own drug use, by main treatment type, and remoteness area, 2016–17 (%)
Note: In Victoria, alcohol and other drug treatment activity is generally recorded against a service provider’s administrative address rather than the location where the activity was delivered. As a result, Victoria’s remoteness reporting may not accurately reflect the actual distribution across the state. It is anticipated that this will be improved with the implementation of a new data collection from October 2018.Source: Table S4.7.
0 10 20 30 40 50 60
Counselling
Withdrawal management
Assessment only
Support and case management only
Rehabilitation
Pharmacotherapy
Information and education only
Other
Main treatment type
Per cent
Major cities
Inner regional
Outer regional
Remote and very remote

Al
coho
l and
oth
er d
rug
trea
tmen
t ser
vice
s
4
31Alcohol and other drug use in regional and remote Australia: consumption, harms and access to treatment 2016–17
There were differences in the main treatment type received by principal drug of concern and remoteness area. For example, where alcohol was the principal drug of concern, the proportion of closed treatment episodes in Regional and remote areas was higher than in Major cities for:
• counselling (51% in Regional and remote areas compared with 39% in Major cities), and
• rehabilitation (9.6% compared with 4.8%)
but lower for:
• withdrawal management (10% compared with 21%).
These trends were similar among other common principal drugs of concern including heroin, amphetamines, cannabis and pharmaceuticals (Table S4.7).
Treatment delivery settingIn 2016–17, the majority of treatment episodes for clients receiving treatment for their own drug use were provided by non-residential treatment facilities (66%). This was followed by:
• outreach settings (which include any public or private location where services are provided away from the main service location, or a mobile service) (13%)
• residential treatment facilities (13%).
More than two-thirds of closed treatment episodes provided for the most common principal drugs of concern—alcohol (68%), amphetamines (70%), cannabis (71%), pharmaceuticals (72%) and heroin (76%) were in non-residential treatment facilities (Table S4.8).
Differences in the treatment delivery setting appeared to be minimal between Regional and remote areas and Major cities, with a similar proportion of closed treatment episodes in non-residential facilities (68% compared with 66%) and in outreach settings (15% compared with 12%).
Compared with Major cities, the proportion of treatment episodes in Remote and very remote areas was lower in non-residential treatment facilities (51% in Remote and very remote areas compared with 66% in Major cities) but higher for:
• outreach settings (23% compared with 12%)
• residential facilities (17% compared with 13%) (Figure 4.4).

Alco
hol a
nd o
ther
dru
g tr
eatm
ent s
ervi
ces
4
32 Alcohol and other drug use in regional and remote Australia: consumption, harms and access to treatment 2016–17
Figure 4.4: Proportion of closed treatment episodes for own drug use, by treatment delivery setting and remoteness area, 2016–17 (%)
Note: In Victoria, alcohol and other drug treatment activity is generally recorded against a service provider’s administrative address rather than the location where the activity was delivered. As a result, Victoria’s remoteness reporting may not accurately reflect the actual distribution across the state. It is anticipated that this will be improved with the implementation of a new data collection from October 2018. Source: Table S4.8.
Treatment delivery setting by principal drug of concernDifferences by remoteness area in treatment delivery setting were evident among the most common principal drugs of concerns (Table S4.8). For example, in non-residential facilities there was a higher proportion of closed treatment episodes in Major cities than in Regional and remote areas for alcohol (69% compared with 66%), amphetamines (70% compared with 67%), and heroin (77% compared with 66%) (Table S4.8).
For treatment in outreach settings, there were higher proportions of treatment episodes in Regional and remote areas than in Major cities for heroin (17% compared with 4%), alcohol (15% compared with 13%), and pharmaceuticals (17% compared with 15%) (Table S4.8).
Treatment delivery setting by main treatment typeIn 2016–17, the main treatment types with the largest proportion of treatment episodes within a non-residential treatment facility in Major cities were:
• counselling (50%)
• assessment only (18%)
• information and education only (11%).
Of all remoteness areas, the proportion of treatment episodes with counselling in non-residential treatment facilities was highest in Remote and very remote areas (85%) (Table S4.9).
0
10
20
30
40
50
60
70
80
Non-residentialtreatment facility
Residential treatmentfacility
Home Outreach setting Other
Per cent
Treatment delivery setting
Major cities Inner regional Outer regional Remote and very remote

Al
coho
l and
oth
er d
rug
trea
tmen
t ser
vice
s
4
33Alcohol and other drug use in regional and remote Australia: consumption, harms and access to treatment 2016–17
In residential treatment facilities, the main treatment types were similar in Major cities and Regional and remote areas, although the proportion of closed treatment episodes for each varied:
• withdrawal management (52% in Major cities compared with 19% in Regional and remote areas)
• rehabilitation (31% compared with 50%)
• assessment only (8% compared with 20%).
In Remote and very remote areas only, almost two-thirds (63%) of treatment episodes in residential treatment facilities were for a main treatment type of rehabilitation and about 1 in 10 (9%) were for withdrawal management (Table S4.9).
In an outreach setting, the main treatment types were similar in Major cities and Regional and remote areas, although the proportion of episodes for each varied:
• support and case management only (35% in Major cities compared with 21% in Regional and remote areas)
• assessment only (25% compared with 15%)
• counselling (23% compared with 40%).
In Remote and very remote areas, counselling (43%) was the main treatment type, while information and education only (24%) was a more common treatment type than in any other remoteness area (Table S4.9).
Treatment duration In 2016–17, treatment duration was generally shorter in Major cities than in Regional and remote areas. A higher proportion of closed treatment episodes in Major cities than in Regional and remote areas lasted for 29 days or less (61% compared with 45%).
Overall, a slightly higher proportion of treatment episodes lasted for 365 days or longer in Regional and remote areas than in Major cities (2.7% compared with 2.1%) (Table S4.10).
This was a consistent pattern across the most common principal drugs of concern, with treatment duration of closed treatment episodes for heroin, alcohol, amphetamines, pharmaceuticals and cannabis generally shorter in Major cities than in Regional and remote areas. Treatment duration of episodes were generally longer in Remote and very remote areas than in any other remoteness area (Table S4.11).
By main treatment type, treatment duration of episodes was generally shorter in Major cities than in Regional and remote areas, in particular for withdrawal management and support and case management only (Table S4.12). Conversely, the duration of pharmacotherapy episodes was generally shorter in Regional and remote areas than in Major cities.
Reason for ending treatment In 2016–17, every 3 in 5 (62%) closed treatment episodes ended with an expected cessation. About 1 in 5 (21%) episodes ended unexpectedly (that is, the client ceased to participate against advice, without notice due to non-compliance), while 1 in 20 episodes ended due to a change in treatment episode (Table S4.12). A small proportion (1.2%) of episodes ended due to the client being imprisoned (other than a drug court sanction) (Table S4.13).

Alco
hol a
nd o
ther
dru
g tr
eatm
ent s
ervi
ces
4
34 Alcohol and other drug use in regional and remote Australia: consumption, harms and access to treatment 2016–17
Of the most common principal drugs of concern, treatment episodes for cannabis had the highest proportion of expected cessation (74%) and pharmaceuticals (56%) had the lowest. Amphetamines was the principal drug of concern that had the highest proportion (29%) of unexpected cessation (Table S4.13).
By remoteness area, for closed treatment episodes, there were similar levels of expected cessation in Major cities (63%) and in Regional and remote areas (59%). However, in Remote and very remote areas, the proportion of treatment episodes that ended with expected cessation was substantially lower (52%) (Figure 4.5).
Levels of unexpected cessation were higher in Regional and remote areas (27%) than in Major cities (18%); in particular, unexpected cessation was higher in Remote and very remote areas (31%). The proportion of treatment episodes that ended with imprisonment (other than a drug court sanction) was slightly higher in Remote and very remote areas (2.1%) compared with Major cities (1.0%) (Table S4.13).
Figure 4.5: Proportion of closed treatment episodes for own drug use that ended expectedly, by principal drug of concern and remoteness area, 2016–17 (%)
Note: In Victoria, alcohol and other drug treatment activity is generally recorded against a service provider’s administrative address rather than the location where the activity was delivered. As a result, Victoria’s remoteness reporting may not accurately reflect the actual distribution across the state. It is anticipated that this will be improved with the implementation of a new data collection from October 2018.Source: Table S4.13.
Across the most common principal drugs of concern, there was a higher proportion of treatment episodes that ended with expected cessation in Major cities than in Regional and remote areas (Figure 4.5). The largest differences in expected cessation were for pharmaceuticals (62% compared with 44%) and alcohol (69% compared with 56%).
Levels of expected cessation for closed episodes in Remote and very remote areas were substantially lower for all principal drug of concerns, with alcohol (52%) having the highest proportion and heroin (41%) the lowest (Figure 4.5).
0
10
20
30
40
50
60
70
80
90
Alcohol Amphetamines Cannabis Pharmaceuticals Heroin Total
Per cent
Principal drug of concern
Major cities Inner regional Outer regional Remote and very remote
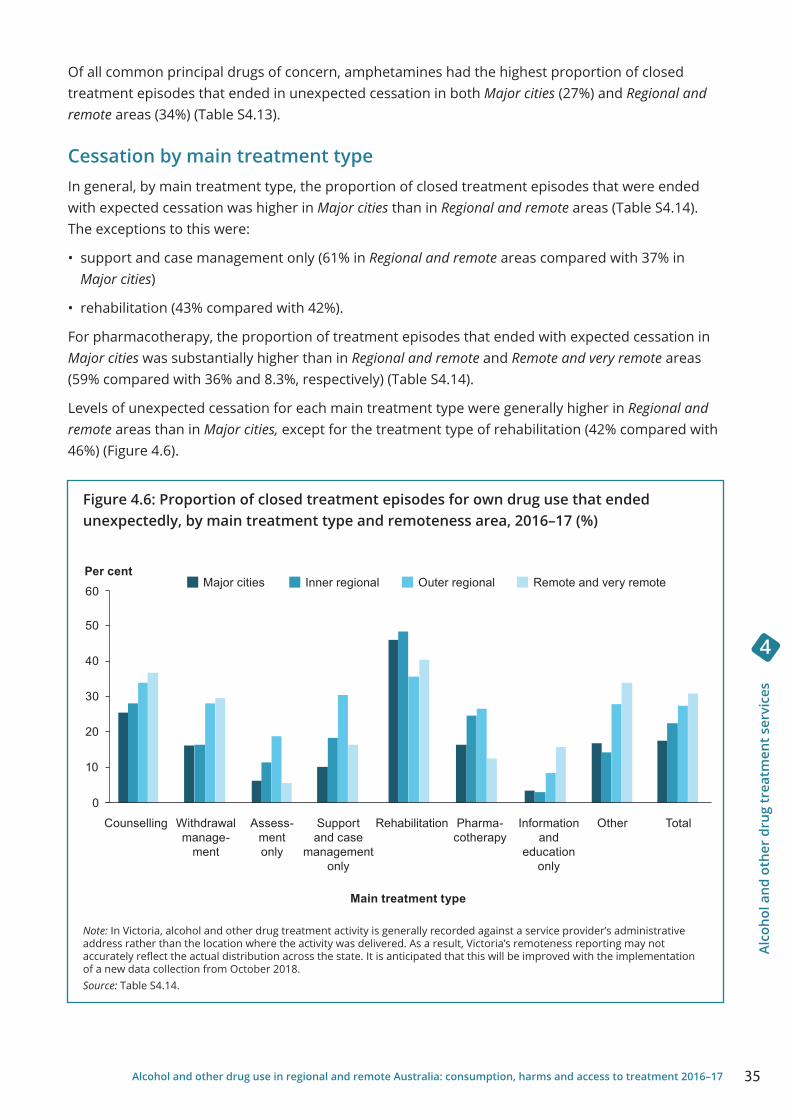
Al
coho
l and
oth
er d
rug
trea
tmen
t ser
vice
s
4
35Alcohol and other drug use in regional and remote Australia: consumption, harms and access to treatment 2016–17
Of all common principal drugs of concern, amphetamines had the highest proportion of closed treatment episodes that ended in unexpected cessation in both Major cities (27%) and Regional and remote areas (34%) (Table S4.13).
Cessation by main treatment typeIn general, by main treatment type, the proportion of closed treatment episodes that were ended with expected cessation was higher in Major cities than in Regional and remote areas (Table S4.14). The exceptions to this were:
• support and case management only (61% in Regional and remote areas compared with 37% in Major cities)
• rehabilitation (43% compared with 42%).
For pharmacotherapy, the proportion of treatment episodes that ended with expected cessation in Major cities was substantially higher than in Regional and remote and Remote and very remote areas (59% compared with 36% and 8.3%, respectively) (Table S4.14).
Levels of unexpected cessation for each main treatment type were generally higher in Regional and remote areas than in Major cities, except for the treatment type of rehabilitation (42% compared with 46%) (Figure 4.6).
Figure 4.6: Proportion of closed treatment episodes for own drug use that ended unexpectedly, by main treatment type and remoteness area, 2016–17 (%)
Note: In Victoria, alcohol and other drug treatment activity is generally recorded against a service provider’s administrative address rather than the location where the activity was delivered. As a result, Victoria’s remoteness reporting may not accurately reflect the actual distribution across the state. It is anticipated that this will be improved with the implementation of a new data collection from October 2018.Source: Table S4.14.
0
10
20
30
40
50
60Per cent
Main treatment type
Major cities Inner regional Outer regional Remote and very remote
Withdrawal manage-
ment
Counselling Assess-ment only
Support and case
management only
Pharma-cotherapy
Information and
education only
Other TotalRehabilitation

Alco
hol a
nd o
ther
dru
g tr
eatm
ent s
ervi
ces
4
36 Alcohol and other drug use in regional and remote Australia: consumption, harms and access to treatment 2016–17
Indigenous treatment services Information on the majority of Australian Government-funded Aboriginal and Torres Strait Islander substance-use services are available from the Online Services Report (OSR) data collection. Many projects funded by the Australian Government are designed to reduce substance abuse through culturally appropriate AOD prevention, education, counselling, treatment, rehabilitation and after-care service for Aboriginal and Torres Strait Islander people. Indigenous substance-use services are funded by the Department of the Prime Minister and Cabinet, under the Indigenous Advancement Strategy. While the number of treatment episodes for Aboriginal and Torres Strait Islander people is reported through the Alcohol and Other Drug Treatment Services National Minimum Data Set (AODTS NMDS), it does not represent all alcohol and other drug treatments provided to Indigenous people in Australia. The OSR and AODTS NMDS have different collection purposes, scope and counting rules (see Box 4.2 for details).
Box 4.2: Comparison of treatment episode definitions in the Online Services Report (OSR) and AODTS NMDS
The OSR definition of ‘episode of care’ starts at admission and ends at discharge (for residential treatment/rehabilitation and sobering-up/respite). ‘Other care’ refers to non-residential programs where the definition of ‘episode of care’ relates more to the number of visits or phone calls undertaken with clients. In contrast to the definition of ‘closed treatment episode’ used in the AODTS NMDS, the definition used in this collection does not require agencies to begin a new ‘episode of care’ when the main treatment type (‘treatment type’) or primary drug of concern (‘substance/drug’) changes. It is therefore likely that this concept of ‘episode of care’ produces smaller estimates of activity than the AODTS NMDS concept of ‘closed treatment episode’.
The OSR collection, managed by the AIHW, records information about clients of any age, whereas the AODTS NMDS reports only on clients aged 10 and over.
These differences mean that the 2 collections are not directly comparable.
Substance-use servicesIn 2016–17, OSR substance-use services provided:
• 197,671 episodes of care
• to 39,448 clients
• by 80 organisations (AIHW 2018a).
By remoteness area, about 80% of agencies were located in Regional and remote areas. Specifically, almost 2 in every 5 (39%) organisations were located in Remote and very remote areas, in comparison with 20% in Major cities.
Organisations in Regional and remote areas provided services to almost two-thirds of OSR clients (65%) and of episodes (63%). About 2 in every 5 clients (44%) and episodes (40%) were in Remote and very remote areas (Table 4.2).

Al
coho
l and
oth
er d
rug
trea
tmen
t ser
vice
s
4
37Alcohol and other drug use in regional and remote Australia: consumption, harms and access to treatment 2016–17
Table 4.2: Number of Aboriginal and Torres Strait Islander substance-use organisations, clients and episodes, by remoteness area, 2016–17
Organisations Clients Episodes
No. % No. % No. %
Major cities 16 20.0 13,802 35.0 72,362 36.6
Inner regional 12 15.0 1,981 5.0 13,743 7.0
Outer regional 21 26.3 6,229 15.8 33,033 16.7
Remote 19 23.8 12,802 32.5 30,495 15.4
Very remote 12 15.0 4,634 11.7 48,038 24.3
Regional and remote 64 80.0 25,646 65.0 125,309 63.4
Total 80 100 39,448 100 197,671 100
Notes1. Regional and remote includes all areas outside Major cities (that is, Inner regional, Outer regional, Remote and Very remote).2. Per cents may sum to more than 100 due to rounding.Source: AIHW 2018 (OSR).
Over time, the number of substance-use clients increased from 23,178 in 2008–09 to 39,448 in 2016–17—a 70% increase (Table S4.15). In this time, the proportion of substance-use clients from Regional and remote areas increased from 52% to 65%, with a decline in the proportion of clients in Major cities. In particular, the proportion of substance-use clients in Remote and very remote areas increased from 37% in 2008–09 to 44% in 2016–17 (Figure 4.7). These increases may be due to an increase in the number of agencies reporting (AIHW 2018a).
Figure 4.7: Proportion of substance-use Indigenous clients, by remoteness area, 2008–09 to 2016–17 (%)
Note: In 2014–15, the reporting period was 1 June 2014 to 31 May 2015. In other years, it was the financial year from 1 July to 30 June.Source: Table S4.15.
0
10
20
30
40
50
60
70
80
90
100
2008– 09 2009–10 2010–11 2011–12 2012–13 2013–14 2014 –15 2015–16 2016–17
Per cent
Major cities
Inner regional
Outer regional
Remote
Very remote

Alco
hol a
nd o
ther
dru
g tr
eatm
ent s
ervi
ces
4
38 Alcohol and other drug use in regional and remote Australia: consumption, harms and access to treatment 2016–17
Substance use issuesThe most common substance-use issues reported in 2016–17, in terms of staff time and organisational resources, were alcohol, cannabis and amphetamines (Table 4.2). In 2016–17, all of the 80 organisations (16 in Major cities and 64 in Regional and remote areas) reported alcohol as 1 of the most common substance-use issues.
By remoteness area, organisations in Regional and remote areas, compared with those in Major cities, were more likely to report cannabis (98% compared with 81% of organisations) and tobacco/nicotine (73% compared with 38% of organisations) among the most common substance-use issues. Conversely, amphetamines were a more common substance-use issue for organisations in Major cities than in Regional and remote areas (88% compared with 78%) (Table 4.2).
Table 4.3: Number of organisations reporting common substance-use issues, by remoteness area, 2016–17
Substance-use issue
Major cities
Inner regional
Outer regional Remote
Very remote
Regional and
remote Total
Alcohol 16 12 21 19 12 64 80
Cannabis/marijuana 13 12 20 19 12 63 76
Amphetamines 14 12 21 10 7 50 64
Tobacco/nicotine 6 8 15 13 11 47 53
Multiple drug use 10 8 14 10 6 38 48
Notes
1. Organisations were asked to report on their 5 most important substance-use issues in terms of staff time and organisational resources.
2. Regional and remote includes all areas outside Major cities (that is, Inner regional, Outer regional, Remote and Very remote).Source: AIHW analyses of OSR data collection, 2016–17.

Acce
ss to
trea
tmen
t
5
39Alcohol and other drug use in regional and remote Australia: consumption, harms and access to treatment 2016–17
5 Access to treatment
Engagement with specialist AOD treatment helps reduce problematic substance-use, among other socio-economic benefits (Lubman et al. 2014). Engagement with a treatment service is limited by the accessibility of that service to the client. Geographic location is 1 of the prominent factors impacting the accessibility of a service, particularly for clients living or seeking treatment in Remote and Very remote areas of Australia.
In the 2016–17 AODTS NMDS, just over 3 in 5 (61%) closed treatment episodes were provided to clients whose last known usual place of residence was outside the geographical area in which the treatment agency was located (see Appendix B for geographical specifications). In larger geographical areas (that is, those exceeding 1,000,000 square km), 30% of closed treatment episodes were provided to a client who lived outside of this area (Table 5.1). This notable proportion of episodes was the motivation for conducting travel time analysis to further explore the time and distance required of clients to access specialist AOD treatment.
One way in which geographic accessibility of AOD specialist treatment services can be measured is through the travel time and distances required of a client seeking treatment. Using the AODTS NMDS, the times and distances by road, travelled by clients who sought specialist AOD treatment in 2016–17, were estimated to provide an indication of geographic accessibility (see Appendix B for information about the methodology used to measured clients travel time/distance to treatment).
Table 5.1: Proportion of closed episodes, by location of the client’s last known usual residence to the Statistical Area Level 3 (SA3) of the agency and size of area (km2), 2016–17
Size of SA3
The client’s last known usual residence is inside the SA3 of the agency (%)
The client’s last known usual residence is outside the
SA3 of the agency (%)
0–100,000 km2 17 80
100,001–1 million km2 43 55
1 million+ km2 69 30
All SA3’s 37 61
Notes1. The SA3 of the client’s last known usual residence was assigned from the client’s postcode. 2. Totals may not equal 100%, as records with an invalid postcode are excluded from the analysis and/or results are rounded.Source: AODTS NMDS, 2016–17.
Travel time and distanceTo measure geographic access to treatment services, the travel time and distance by road vehicle required by the client was estimated for each closed treatment episode. Similar analysis has been conducted in other epidemiological fields (AIHW 2016b). In 2016–17, all clients who sought specialist AOD treatment travelled a median of 17.9 minutes and 12.9 kilometres to access their treatment service (Table S5.1).
In 85% of closed treatment episodes, the client travelled less than 1 hour to the treatment service, while in 5.2% of episodes, the client travelled for more than 3 hours (Table S5.2). Similarly, in 89% of closed treatment episodes the client travelled less than 100 kilometres to the treatment service, while in 4.2% the client travelled more than 300 kilometres (Table S5.5).

Acce
ss to
trea
tmen
t
5
40 Alcohol and other drug use in regional and remote Australia: consumption, harms and access to treatment 2016–17
Clients who sought treatment from a service located within Major cities travelled a median time of 18.2 minutes and a median distance of 13.2 kilometres (Table S5.1). Those who sought treatment from a service located within a Regional and remote area travelled a median time of 13.9 minutes, or 10.7 kilometres. However, clients who sought treatment in a Remote and very remote area travelled for a median time of just over 1.5 hours (91.6 minutes), or 102.7 kilometres.
Clients who sought treatment in Regional and remote areas travelled 1 hour or longer in 28% of closed treatment episodes, compared with 10% of closed treatment episodes in Major cities (Table S5.2).
Differences in travel time and distance may reflect the availability of services, with fewer services located in Regional and remote areas than in Major cities (see chapter 4).
Figure 5.1: Closed episodes, travel time by remoteness area of treatment service, 2016–17 (%)
Note: In Victoria, alcohol and other drug treatment activity is generally recorded against a service provider’s administrative address rather than the location where the activity was delivered. As a result, Victoria’s remoteness reporting may not accurately reflect the actual distribution across the state. It is anticipated that this will be improved with the implementation of a new data collection from October 2018.Source: Table S5.2.
Client demographicsThe AODTS NMDS collects information on clients who seek treatment for their own drug use (96% of clients in 2016–17) and for those who seek treatment for another’s drug use (4.7% in 2016–17) (AIHW 2018c). In 2016–17, the proportion of closed treatment episodes where the client travelled for 1 hour or longer to treatment for their own drug use was greater than the proportion of closed episodes where the client travelled for 1 hour or longer to treatment for another’s drug use (15% compared with 8%, respectively) (Table S5.2).
0% 20% 40% 60% 80% 100%
Major cities
Inner regional
Outer regional
Remote and very remote
Closed treatment episodes (%)
<1 hour 1+ hours

Acce
ss to
trea
tmen
t
5
41Alcohol and other drug use in regional and remote Australia: consumption, harms and access to treatment 2016–17
In 2016–17, the greatest proportion of closed treatment episodes (17%) where clients travelled for 1 hour or longer to their treatment service was for clients aged 20–29 (Table S5.4). This was consistent in Major cities (12%), while in Regional and remote areas a slightly higher proportion of clients aged 30–39 travelled for 1 hour or longer to their treatment service (29%). In contrast, the smallest proportion of closed treatment episodes (10%) where clients travelled for 1 hour or longer to their treatment service was for clients aged 60 or older.
In 2016–17, Indigenous clients travelled for 1 hour or longer to their treatment service in about 1 in 4 (26%) closed treatment episodes. About 1 in 8 (13%) closed treatment episodes for non-Indigenous clients had a travel time of 1 hour or longer to their treatment service (Table S5.6).
Travel time for Indigenous and non-Indigenous clients varied by remoteness. Indigenous clients who sought treatment in Regional and remote areas travelled for 1 hour or longer to the treatment service in more than 1 in 3 (37%) closed treatment episodes, compared with 13% of closed treatment episodes for Indigenous clients in Major cities. A similar pattern existed for the closed treatment episodes of non-Indigenous clients by remoteness area (25% in Regional and remote areas, compared with 9% in Major cities) (Table S5.6).
Principal drugs of concern
Median travel time and distanceIn 2016–17, the median travel time and distance for clients who sought treatment for their own alcohol or drug use varied slightly by the principal drug of concern. Clients travelled a median of:
• 16.3 minutes or 12 kilometres for alcohol
• 18.7 minutes or 13.5 kilometres for amphetamines
• 14.4 minutes or 11 kilometres for cannabis
• 16.3 minutes or 11.4 kilometres for heroin
• 15.4 minutes or 11.4 kilometres for pharmaceuticals (Table S5.9).
Travelled for 1 hour or longerThe proportion of clients who travelled more than 1 hour to treatment services in 2016–17 was consistently higher in Regional and remote areas than in Major cities for the most common principal drugs of concern, including:
• alcohol (29% compared with 7%)
• amphetamines (31% compared with 10%)
• cannabis (25% compared with 7%)
• heroin (33% compared with 7%)
• pharmaceuticals (25% compared with 9%) (Figure 5.2).

Acce
ss to
trea
tmen
t
5
42 Alcohol and other drug use in regional and remote Australia: consumption, harms and access to treatment 2016–17
Figure 5.2: Proportion of closed treatment episodes where the client sought treatment for their own drug use and travelled 1 hour or longer to the service, by principal drug of concern and remoteness area of the treatment service, 2016–17
Note: In Victoria, alcohol and other drug treatment activity is generally recorded against a service provider’s administrative address rather than the location where the activity was delivered. As a result, Victoria’s remoteness reporting may not accurately reflect the actual distribution across the state. It is anticipated that this will be improved with the implementation of a new data collection from October 2018.Source: Table S5.15.
Aboriginal and Torres Strait Islander peopleA higher proportion of closed treatment episodes for Indigenous clients who sought treatment in Regional and remote areas for their own alcohol or drug use travelled 1 hour or longer, compared with Indigenous clients in Major cities (37% and 14%, respectively). This was consistent across the most common principal drugs of concern, including:
• alcohol (38% in Regional and remote areas compared with 11% in Major cities)
• amphetamines (37% compared with 16%)
• cannabis (34% compared with 13%)
• heroin (36% compared with 7%)
• pharmaceuticals (28% compared with 19%) (Table S5.12).
Similar patterns existed for non-Indigenous clients, with a higher proportion who sought treatment in Regional and remote areas who travelled 1 hour or longer, compared with non-Indigenous clients in Major cities across the most common principal drugs of concern (Table S5.12).
As previously noted, differences in travel time and distance may reflect the availability of services in Regional and remote areas.
0
5
10
15
20
25
30
35
40
Alcohol Amphetamines Cannabis Heroin Pharmaceuticals
Clo
sed
trea
tmen
t epi
sode
s
Principal drug of concern
Major cities Regional and remote

Acce
ss to
trea
tmen
t
5
43Alcohol and other drug use in regional and remote Australia: consumption, harms and access to treatment 2016–17
Main treatment typeAcross all treatment types and the most common principal drugs of concern, clients who sought treatment from Regional and remote areas for their alcohol or drug use were more likely to travel 1 hour or longer than clients who sought treatment in Major cities.
Regardless of principal drug of concern, a substantially higher proportion of clients who sought treatment for their alcohol or drug use in Regional and remote areas had to travel 1 hour or longer for assessment only as their main treatment type, compared with those in Major cities. This is particularly evident where the principal drug of concern was heroin (60% compared with 6%) and amphetamines (48% compared with 12%) (Table S5.15).
Similarly, a higher proportion of clients who sought treatment in Regional and remote areas—compared with those in Major cities—had to travel 1 hour or longer where the main treatment type was rehabilitation and the principal drug of concern was heroin (78% compared with 15%) and pharmaceuticals (55% compared with 28%). This was also evident where amphetamines were the principal drug of concern and the main treatment type was withdrawal management (43% in Regional and remote areas compared with 16% in Major cities) (Table S5.15).
Treatment provided
Main treatment typeCounselling was the most common main treatment type provided to all clients in 2016–17 (40%) (AIHW 2018c). Clients who were provided with counselling travelled a median of 13.9 minutes or 10.5 kilometres to the service, the shortest median travel time and distance of all main treatment types (Table S5.16). Conversely, clients who were provided a main treatment type of rehabilitation travelled (on median) the longest time to their treatment service (32.3 minutes or 29.5 kilometres).
Where counselling was the main treatment type, clients who sought treatment in Regional and remote areas were more likely to travel 1 hour or longer to treatment compared with those in Major cities (24% and 4% of closed treatment episodes, respectively). A similar pattern was evident when rehabilitation was the main treatment type: the client travelled 1 hour or longer in 50% of closed treatment episodes in Regional and remote areas, compared with 25% in Major cities (Table S5.17). Clients who sought treatment in Regional and remote areas who were provided with a main treatment type of assessment only travelled 1 hour or longer in 41% of closed episodes, compared with 9% in Major cities (Figure 5.3).
Unlike other treatment types, clients who sought treatment in Major cities and were provided with a main treatment type of support and case management only, were more likely to travel 1 hour or longer to the treatment service than clients who sought treatment in Regional and remote areas (23% compared with 19% of closed episodes, respectively).

Acce
ss to
trea
tmen
t
5
44 Alcohol and other drug use in regional and remote Australia: consumption, harms and access to treatment 2016–17
Figure 5.3: Proportion of closed treatment episodes where the client travelled for 1 hour or longer to the service, by main treatment type and remoteness area of the treatment service, 2016–17
Note: In Victoria, alcohol and other drug treatment activity is generally recorded against a service provider’s administrative address rather than the location where the activity was delivered. As a result, Victoria’s remoteness reporting may not accurately reflect the actual distribution across the state. It is anticipated that this will be improved with the implementation of a new data collection from October 2018.Source: Table S5.17.
Source of referralIn 2016–17, clients who were referred from a corrective service had the greatest proportion of closed treatment episodes where they travelled for 1 hour or longer to their treatment service (26%), followed by travel to health services (15%) and to ‘other’ sources (14%). Clients who were diverted from the criminal justice system were the least likely to travel 1 hour or longer to their treatment service (11%) (Table S5.18). In Major cities, 25% of referrals from a corrective service involved 1 hour or more of travel time, compared with 5.3%–9.2% for all other sources of referral. There was little difference in travel time by source of referral for clients in Regional and remote areas, ranging from 23% for clients diverted from the criminal justice system to 34% for other sources of referral.
Delivery settingIn 2016–17, clients who sought treatment from a residential facility travelled for 1 hour or longer to the service in 30% of closed episodes, while those who sought treatment from a non-residential facility travelled for 1 hour or longer in 11% of closed episodes (Table S5.19).
Clients who sought treatment from a residential facility located within Major cities travelled 1 hour or longer in 21% of closed treatment episodes, compared with 51% of closed treatment episodes in Regional and remote areas. By comparison, clients who sought treatment from a non-residential facility travelled 1 hour or longer in 5% of closed episodes when the service was located in Major cities and in 24% of closed episodes when the service was located in a Regional and remote area.
0 10 20 30 40 50 60
Counselling
Withdrawal management
Assessment only
Support and case management only
Rehabilitation
Information and education only
Other (inc. pharmacotherapy)
Closed treatment episodes %
Major cities
Regional and remote

Acce
ss to
trea
tmen
t
5
45Alcohol and other drug use in regional and remote Australia: consumption, harms and access to treatment 2016–17
Reasons for ending treatment In 2016–17, clients who travelled 1 hour or longer to their treatment ceased treatment unexpectedly in 21% of closed episodes, which was a similar proportion to those who travelled less than 1 hour to treatment (20%) (Table S5.22). The proportion of clients with treatment episodes ending unexpectedly was higher in Regional and remote areas than in Major cities (26% compared with 18%), which was a generally consistent difference, regardless of travel time and distance to a service.
There was some variation by treatment type in the proportion of treatment episodes that ended unexpectedly, for example, clients who:
• sought treatment in Regional and remote areas and travelled for more than 1 hour were more likely to end their treatment unexpectedly for all treatment types, with the exception of assessment only and rehabilitation (Figure 5.4)
• travelled more than 1 hour to rehabilitation were more likely to end their treatment episode unexpectedly than for any other treatment type in both Major cities (52%) and Regional and remote areas (43%).
Figure 5.4. Proportion of closed treatment episodes with a travel time of over an hour ending unexpectedly, by main treatment type and remoteness area of the treatment service, 2016–17
Notes1. Episodes that end unexpectedly include instances where the client ceased to participate against advice, without notice
due to non-compliance.2. In Victoria, alcohol and other drug treatment activity is generally recorded against a service provider’s administrative
address rather than the location where the activity was delivered. As a result, Victoria’s remoteness reporting may not accurately reflect the actual distribution across the state. It is anticipated that this will be improved with the implementation of a new data collection from October 2018.
Source: Table S5.22.
0 10 20 30 40 50 60
Counselling
Withdrawal management
Assessment only
Support and case management only
Rehabilitation
Information and education only
Other (inc. pharmacotherapy)
Closed treatment episodes %
Major cities
Regional and remote

Conc
lusi
on
6
46 Alcohol and other drug use in regional and remote Australia: consumption, harms and access to treatment 2016–17
6 Conclusion
This report highlights the disparity of the consumption patterns, impacts and treatment services in Major cities and Regional and remote areas for alcohol and other drugs.
Australians living in Regional and remote areas were more likely than those living in Major cities to drink alcohol in quantities that placed them at risk of harm from an alcohol-related disease or injury over a lifetime, or at risk of alcohol-related injury from a single drinking occasion.
The recent consumption of illicit drugs was similar in Major cities and Regional and remote areas; however the consumption of illicit drugs such as cocaine and ecstasy were more prominent in Major cities. For all remoteness areas, cannabis use was highest in Remote and very remote areas of Australia. Data from the National Wastewater Monitoring Program also shows a higher prevalence of opioids such as oxycodone and fentanyl in regional areas.
Alcohol remains the most common cause of hospitalisations with a drug-related principal diagnosis and was highest for people usually residing in Remote and very remote areas. Regardless of where a person resides, the rate of hospital separations for alcohol is significantly higher than for other drugs such as methamphetamines and opioids, cannabis and other sedatives and hypnotics.
Over the past decade, the rate of drug-induced deaths has increased at a faster rate in Regional and remote areas, up 41% since 2008, compared with a 16% increase in Major cities. In particular, the report highlights the growth in the rate of deaths involving opioids in Regional and remote areas. The rate of drug-induced deaths for any opioid (excluding heroin) was substantially higher in Regional and remote areas (4.0 deaths per 100,000 population) than in Major cities (3.3 deaths per 100,000 population). The rate of drug-induced deaths for heroin remained higher in Major cities than in Regional and remote areas (1.9 compared with 1.1 deaths per 100,000 population).
Nationally, in 2016–17, over half (58%) of the treatment agencies were located in Major cities and accounted for 71% of closed treatment episodes. Agencies in Remote and very remote areas had the highest rate of clients who sought treatment (1,294 clients per 100,000 population) in 2016–17, compared with other remoteness areas, despite having the smallest number of clients, and smallest average number of episodes per client.
This report provides a snapshot of clients’ travel time and distance to treatment services during 2016–17. The data showed that clients who sought services in Regional and remote areas were more likely than those in Major cities to travel 1 hour or longer to reach these services. Differences in travel time and distance may reflect the availability of services in Regional and remote areas.
This pattern was the same across the most common principal drugs of concern and main treatment types in 2016–17. Heroin and amphetamines had the highest proportion of clients who sought treatment in Regional and remote areas and who travelled more than 1 hour to treatment services (33% and 31%, respectively). Clients who sought treatment in Regional and remote areas and who were provided with a main treatment type of rehabilitation (50%) and assessment only (41%) had the highest proportions who travelled more than 1 hour to treatment services. Future analysis will examine whether travel times and distances for clients accessing AOD treatment have changed over time.
The main limitation of this report is that the analysis can provide insights only about the accessibility of services for those clients who accessed AOD treatment services; it cannot provide information about service demand. Additional data is needed to understand whether geographic accessibility for potential clients of AOD treatment services is a barrier to commencing treatment.

Appe
ndix
A: D
ata
sour
ces
47Alcohol and other drug use in regional and remote Australia: consumption, harms and access to treatment 2016–17
Appendix A: Data sourcesAlcohol and Other Drug Treatment Services National Minimum Data Set (AODTS NMDS)It is difficult to fully quantify the scope of alcohol and other drug services in Australia. There are a variety of settings in which people receive treatment for alcohol and other drug-related issues that are not in scope for this collection. These include agencies that do not receive any public funding; that primarily provide accommodation (for example, sobering-up shelters); are based in correctional institutions; provide services primarily concerned with health promotion; are located in acute care/psychiatric hospitals and provide treatment only to admitted patients; or have the sole function of prescribing or providing dosing services for opioid pharmacotherapy. These data are captured in the AIHW’s National Opioid Pharmacotherapy Statistics Annual Data Collection.
The AODTS NMDS does not cover all agencies that provide substance-use services to Aboriginal and Torres Strait Islander people. These agencies provide data to the Online Services Report Collection. Data from the AODTS NMDS presented in this report are based on information about closed treatment episodes and are not directly comparable with data presented on people—as a person may have multiple treatment episodes in a reference period. In the AODTS NMDS, data on people have not been collected before 2012–13, so population rates for treatment have not been reported.
Australian Statistical Geography Standard (ASGS)The Australian Statistical Geography Standard (ASGS) (2018a) was used to classify Remoteness Areas into 5 classes of relative remoteness across Australia:
• Major cities of Australia (representing 72% of Australia’s population in 2016)
• Inner regional Australia (17.8%)
• Outer regional Australia (8.3%)
• Remote Australia (1.2%)
• Very remote Australia (0.8%).
The 5 classes of remoteness are determined using a process that provides a consistent definition across Australia and over time. This is because the concept of ‘remoteness’ is dynamic and needs to take into account changes in population centres and size, and road infrastructure improvements.
Not all jurisdictions contain every one of the 5 remoteness categories. For example, Hobart and Darwin are not classified as Major cities; while the Australian Capital Territory only contains Major cities and Inner regional areas. Please see online supplementary interactive maps for a visual representation of remoteness across Australia.
Relative remoteness is measured using the Accessibility and Remoteness Index of Australia (ARIA+). The ARIA+ was developed by the Hugo Centre for Migration and Population Research at the University of Adelaide and is derived by measuring the road distance from a point to the nearest urban centres and localities in 5 separate population ranges (Figure A1).
Different data sets report data at different levels of remoteness around Australia. The Australian Bureau of Statistics (ABS) uses the ARIA+; others may report data comparing capital cities and the rest of state in each jurisdiction.

Appe
ndix
A: D
ata
sour
ces
48 Alcohol and other drug use in regional and remote Australia: consumption, harms and access to treatment 2016–17
National Drug Strategy Household SurveyThe NDSHS is the leading national population-based survey of licit and illicit drug use in Australia. The 2016 survey was the 12th done under the auspices of the National Drug Strategy. Previous surveys were done in 1985, 1988, 1991, 1993, 1995, 1998, 2001, 2004, 2007, 2010, and 2013. The data collected through these surveys have contributed to the development of policies for Australia’s response to drug-related issues.
The Department of Health commissioned the Australian Institute of Health and Welfare (AIHW) to manage the 2016 survey, and the AIHW commissioned Roy Morgan Research to collect the data.
In 2016, 23,772 people aged 12 and over gave information on their drug use patterns, attitudes, and behaviours (Table A1). The sample was based on households, so people who were homeless or institutionalised were not included in the survey (consistent with the approach in previous years). Most of the analyses are based on the population aged 14 and over (unless specified), as this allows consistent comparison with earlier survey results.
Table A1: National Drug Strategy Household Survey sample sizes
Survey year Respondents
2016 23,772
2013 23,855
2010 26,648
2007 23,356
2004 29,445
2001 26,744
1998 10,030
1995 3,850
1993 3,500
The NDSHS covers a significant variety of people and uses a method that is powerful enough to enable generalisation of the results.
Not all population groups are included in the data: for example, people in institutional settings, hostels, or motels, or those who are homeless are not included. Foreign language interviews are not done, and the survey is not specifically designed to obtain reliable national estimates for Indigenous Australians. It requires a good comprehension of the English language, as the questionnaire is self-completed. In 2016, the NDSHS was unable to include many Aboriginal communities with relatively low levels of English literacy. The exclusion of these communities makes it difficult to generalise NDSHS results to the whole Indigenous population.

Appe
ndix
A: D
ata
sour
ces
49Alcohol and other drug use in regional and remote Australia: consumption, harms and access to treatment 2016–17
Pharmaceutical Benefits Scheme (PBS)The Australian Government subsidises the cost of prescription medicines through the Pharmaceutical Benefits Scheme (PBS) and the Repatriation Pharmaceutical Benefits Scheme (RPBS) for eligible war veterans and their dependants. Most prescriptions for general schedule medicines (Section 85) are dispensed through community pharmacies, but PBS-subsidised drugs are also available in private hospitals and through eligible public hospitals to patients on discharge and to day patients (in all jurisdictions except New South Wales and the Australian Capital Territory).
Some drugs are distributed under alternative arrangements, and come under section 100 of the National Health Act 1953. Examples are the highly specialised drugs program, including the Opiate Dependence Treatment Program (which includes opioids used in opioid substitution therapy) and general schedule medicines that are supplied directly to Indigenous patients via Aboriginal Health Services in remote areas of Australia.
Note that drugs used in the Opiate Dependence Treatment Program are provided under section 100 of the National Health Act 1953 and have been excluded from the analysis, as script-level data are not available for this program.
The PBS does not include:
• private prescriptions
• over-the-counter medicines
• medicines supplied to some public hospital inpatients.
Private prescriptions and low-dose codeine combinations sold over-the-counter are not included in the dataset (except for a limited number of low-dose codeine preparations subsidised through the RPBS).
National Hospital Morbidity Database (NHMD)Information on drug-related hospitalisations is taken from the AIHW National Hospital Morbidity Database (NHMD), which includes almost all public hospitals that provided data for this database in 2016–17. (The exception was an early parenting centre in the Australian Capital Territory.)
The great majority of private hospitals also provided data, except for the private free-standing day hospital facilities in the Australian Capital Territory.
Hospital separations dataThe hospital separations data included in this report were extracted from the AIHW NHMD using a selection of codes from the International Statistical Classification of Diseases and Related Health problems, 10th revision, Australian modification, 9th edition (ICD-10-AM) (ACCD 2014) (see Table A2).

Appe
ndix
A: D
ata
sour
ces
50 Alcohol and other drug use in regional and remote Australia: consumption, harms and access to treatment 2016–17
Table A2: Relationship between the drug of concern and the ICD-10-AM codes
Drug of concern identified in principal diagnosis ICD-10-AM codes
Analgesics
Opioids (includes heroin, opium, morphine and methadone) F11.0–11.9, T40.0–40.4
Non-opioid analgesics (includes paracetamol) F55.2, T39.0, T39.1, T39.3, T39.4, T39.8, T39.9,
Sedatives and hypnotics
Alcohol (includes ethanol) E52, F10.0–10.9, G31.2, I42.6, K29.2, K70.0–70.9, K85.2, K86.0, T51.0–51.9, Z71.4
Other sedatives and hypnotics (includes barbiturates and benzodiazepines; excludes ethanol) F13.0–13.9, T41.2, T42.3–42.8
Stimulants and hallucinogens
Cannabinoids (includes cannabis) F12.0–12.9, T40.7
Hallucinogens (includes LSD) F16.0–16.9, T40.8, T40.9
Cocaine F14.0–14.9, T40.5
Tobacco and nicotine F17.0–17.9, T65.2, Z58.7, Z71.6
Other stimulants (includes amphetamines and caffeine) F15.0–15.9, T40.6, T43.6, T46.0, T46.3
Antidepressants and antipsychotics F55.0, T43.0–43.5
Volatile solvents F18.0–18.9, T52.0–52.9, T53.0–9, T59.0, T59.8
Other and unspecified drugs of concern
Multiple drug use F19.0–19.9
Unspecified drug use and other drugs not elsewhere classified (includes psychotropic drugs not elsewhere classified; diuretics; anabolic and androgenic steroids; and opiate antagonists)
F55.1, F55.3–6, F55.8, F55.9, N14.1–3, T38.7, T43.8–9, T50.1–3, T50.7, Z71.5
Fetal and perinatal-related conditions
Fetal and perinatal-related conditions (includes conditions caused by the mother’s alcohol, tobacco, or other drug addiction) P04.2–4, Q86.0
Note: Data for 2016–17 were reported to the National Hospital Morbidity Database using the ICD-10-AM.
National Mortality Database (NMD)The AIHW National Mortality Database (NMD) holds records for deaths in Australia from 1964 onwards. Cause of Death Unit Record File data are provided to the AIHW by the Registries of Births, Deaths and Marriages and the National Coronial Information System (managed by the Victorian Department of Justice) and include cause of death coded by the ABS. The data are maintained by the AIHW in the NMD.
The database comprises information about causes of death and other characteristics of the person, such as sex; age at death; area of usual residence; and Indigenous status. Both the year in which the death occurred and the year in which it was registered are provided. For the purposes of this report, mortality data are shown based on the year of death registration. Mortality data by geographical regions in this report were derived using the place of a person’s residence at the time of death.

Appe
ndix
A: D
ata
sour
ces
51Alcohol and other drug use in regional and remote Australia: consumption, harms and access to treatment 2016–17
Deaths registered in 2014 and earlier are based on the final version of cause of death data: deaths registered in 2015 are based on revised data; deaths registered in 2016 and 2017 are based on preliminary data. Revised and preliminary data are subject to further revision by the ABS. The data quality statements underpinning the AIHW NMD can be found on the following ABS internet pages:
• ABS quality declaration summary for Deaths, Australia (ABS cat. no. 3302.0) <http://www.abs.gov.au/ausstats/abs%40.nsf/mf/3302.0/>
• ABS quality declaration summary for Causes of death, Australia (ABS cat. no. 3303.0) <http://www.abs.gov.au/ausstats/abs%40.nsf/mf/3303.0/>.
For more information on the AIHW NMD see Deaths data at AIHW <https://www.aihw.gov.au/about-our-data/our-data-collections/national-mortality-database>.
Table A3: Relationship between the drug type and ICD-10 codes
Drug type ICD-10 codes
Heroin T40.1Other opioid T40.2Methadone T40.3Other synthetic opioid T40.4Other unspecified opioid T40.6Cannabinoids T40.7Any opioid T40.0, T40.1, T40.2, T40.3, T40.4, T40.6Any opioid excluding heroin T40.0, T40.2, T40.3, T40.4, T40.6Benzodiazepam T42.4All depressants T42.0–T42.9Methamphetamine T43.6Other antidepressants T43.2All antidepressants T43.0, T43.1, T43.2Other antipsychotic T43.5All antipsychotics T43.3, T43.4, T43.5Alcohol T51.9Paracetamol T39.1Non-opioid analgesics T39.0–T39.9
Australian Burden of Disease Study 2011In the Australian Burden of Disease Study 2011, data to develop burden of disease estimates were obtained from many different sources. Deaths data to estimate fatal burden were sourced from the AIHW’s NMD. Morbidity data to estimate non-fatal burden were drawn from a wide variety of existing sources of epidemiological measures (such as incidence, prevalence and mortality) from disease registers, administrative data, surveys and epidemiological studies.
Risk factor exposure data were sourced from a variety of data sources including national surveys, registry data and monitoring programs. Relative risks were obtained mostly from the Global Burden of Disease Study 2010 or 2013, or from direct evidence from Australian data sources where available.
Other inputs were obtained from the 2010 or 2013 Global Burden of Disease. These included the standard life table for fatal burden, health states and disability weights for the non-fatal burden. Population estimates underpinning all estimates were sourced from the Australian Demographic Statistics from the ABS.

Appe
ndix
A: D
ata
sour
ces
52 Alcohol and other drug use in regional and remote Australia: consumption, harms and access to treatment 2016–17
The method for calculating attributable burden for alcohol and illicit drug use in the Australian Burden of Disease Study 2011 has been updated for the report Impact of alcohol and illicit drug use on the burden of disease and injury in Australia: Australian Burden of Disease Study 2011. See Chapter 1.6 of that report for the developments made (AIHW 2018e).
For full details on the various methods, data sources and standard inputs, see also Australian Burden of Disease Study 2011: methods and supplementary material available on the AIHW website at: <https://www.aihw.gov.au/reports/burden-of-disease/australian-burden-of-disease-study-2011-methods-and-supplementary-material/contents/table-of-contents>.
National Wastewater Drug Monitoring Program (NWDMP), ACICThe method underlying wastewater-based monitoring of drug use in a given population is based on the principle that any given compound that is consumed (irrespective of whether it is swallowed, inhaled/smoked or injected) will subsequently be excreted (either in the chemical form in which it is consumed and/or in a chemically modified form that is referred to as a metabolite). The excreted compound or metabolite will eventually arrive in the sewer system.
Collectively, waste products in the sewer system arrive at a wastewater treatment plant (WWTP) where wastewater samples are collected over a defined sampling period. Measuring the amount of target compound in the wastewater stream allows for a backcalculation factor to be applied to determine the amount of drug that was used over the collection period. The method is non-invasive and is done on a population-scale level, so individuals are not targeted and privacy is respected.
Wastewater consists of highly complex mixtures which derive from toilets, bathrooms, kitchen and laundry appliances, as well as all other domestic, industrial or commercial plumbed structures. To obtain an estimate of drug use, representative samples are collected over a given period (typically 24 hours) using autosamplers that collect time or flow proportional samples. Wastewater treatment plant operators provide assistance with collecting the samples from the influent autosampler (where the wastewater enters the treatment plants). Pertinent information on the volume of wastewater entering the WWTP (flow volume) that is associated with a given sample is also collected by local operators. It should be noted that rain events may, for example, cause an increase in the volume of wastewater that enters a treatment plant—but providing that the flow volume is available for each sampling period, this will not affect the overall estimate of the amount of drugs that have been used by the population that contributed to this wastewater.

Appe
ndix
B: M
etho
dolo
gy fo
r m
easu
ring
clie
nt tr
avel
tim
e/di
stan
ce to
ser
vice
s
53Alcohol and other drug use in regional and remote Australia: consumption, harms and access to treatment 2016–17
Appendix B: Methodology for measuring client travel time/distance to services
To measure geographic access to treatment services, the travel time and distance by road vehicle required by the client was estimated for each closed treatment episode. Similar analysis has been conducted in other epidemiological fields (AIHW 2016b).
The travel time/distance by road was estimated using Esri ArcGIS software. The software estimated the optimised travel time and distance by road based on road rules, speed limits and road types between an origin and destination points. While the inclusion of traffic conditions was available, it was omitted from this analysis due to the lack of contemporary data.
The client’s location (origin) was based on the Australian Standard Geographical Standard (ASGS) Statistical Area Level 3 2011 (SA3). This was calculated via concordance of the postcode of the client’s last known place of usual residence using the ABS Postal Area 2011 to SA3 2011 correspondence.
The treatment service location (destination) was based on the ASGS 2011 Statistical Area Level 2 (SA2) of the treatment service location.
The selection of SA3 as the origin geography, and not the equivalent SA2, was due to the higher concordance quality of Postal Area 2011 to SA3 2011 (a quality indicator measure of ‘Good’), compared with Postal Area 2011 to SA2 2011 (a quality indicator measure of ‘Poor’). As postcodes can cover multiple SA3s, the SA3 allocation with the majority proportion of the postal area was selected. 15 postal areas have a majority SA3 allocation of 50% or less. One postal area has an allocation exactly on 50%, of which the closest SA3 PWC (population-weighted centroid) to the postal area’s geographic centroid was selected.
Population-weighted centroids (PWC) Origin and destination geographic points were allocated based on the geographic distribution of the population in the respective areas, generating a median population-weighted centroid (PWC). This is a common method to best represent the location of people and services within an area. PWCs that were generated in invalid areas (for example, bodies of water) were manually adjusted to the nearest valid location. In cases where the origin or destination PWC location did not lie on a road, the travel time/ distance was calculated from or to the point on a road closest to the PWC calculated by the shortest geodesic distance. This did not incur a time/travel penalty.
Using a single PWC over large areas could provide inaccurate results for those large areas with a wide population spread. One solution to this issue would be to develop multiple centroids for 1 area. Following testing the inclusion of multiple centroids, no significant differences were found in median duration and travel time; therefore single PWC were used for computational efficiency.

Appe
ndix
B: M
etho
dolo
gy fo
r m
easu
ring
clie
nt tr
avel
tim
e/di
stan
ce to
ser
vice
s
54 Alcohol and other drug use in regional and remote Australia: consumption, harms and access to treatment 2016–17
ExclusionsPaths between origin and destination PWC that have severed road networks were excluded from the analysis. For example, a client can reside on an island with no vehicle ferry access to mainland Australia; therefore, if they received treatment on the mainland with a postcode on an island, then their travel path will render ‘unreachable’ and be excluded from the analysis. In total, 19 unique origin-destination paths were ‘unreachable’.
• The analysis excludes treatment episodes with an unallocated client postcode.
• Closed episodes with a treatment delivery setting of home or outreach setting were excluded from the analysis. Both these codes refer to a treatment delivery setting not equal to the assigned destination location. It is unknown where these episodes are conducted. In 2016–17, 1% of closed episodes had a delivery setting of home and 13% of closed episodes had a delivery setting of outreach setting.
Caveats• Travel time/distance is an optimised estimation and is limited by the road network of the software.
• The accuracy of the travel time/distance estimate will decrease as the size of the SA3 and SA2 increases, as there are greater distances between the PWC and potential localities. This potentially indicates that, as remoteness increases (that is, becomes more remote), the accuracy of the estimates will decrease, as remote statistical areas are larger in size than metropolitan.
• Clients who are temporarily residing in a location and receive treatment near that location may have an inflated estimate, as the origin point is based on their usual residence. The potential number of episodes with this issue was indeterminable.
• Traffic was omitted from the analysis model, due to the lack of contemporary traffic data and the minimal impact that inclusion of traffic had.
• Travel paths with an origin centroid located on Tasmania and a destination centroid in mainland Australia, or vice versa, may have inflated estimates to account for ferry travel. These paths’ travel times are typically inflated by approximately 800 to 1200 minutes.
• The analysis assumes private road travel and does not account for clients who travel to treatment via public transport. This assumption may have an impact on the estimates for those locations where public transport is commonly used (for example, in central business districts).
55Alcohol and other drug use in regional and remote Australia: consumption, harms and access to treatment 2016–17
Acknowledgments
The authors of this report were Mr Josh Sweeney, Mr Lachlan Facchini and Ms Marissa Veld from the Tobacco, Alcohol and Other Drugs Unit of the Australian Institute of Health and Welfare.
Ms Cathy Claydon and Ms Kristina Da Silva assisted with the data analysis, and Ms Katherine Green, Ms Moira Hewitt, Ms Kristy Raithel and Mr Matthew James provided essential advice and guidance. The contributions, comments and advice of the Alcohol and Other Drug Treatment Services National Minimum Data Set Working Group are gratefully acknowledged.
The Department of Health provided funding for this report.
Thanks are extended to the data managers and staff in the following departments:
• Australian Government Department of Health
• New South Wales Ministry of Health
• Victorian Department of Health and Human Services
• Queensland Department of Health
• Western Australian Mental Health Commission
• South Australian Department of Health
• Tasmanian Department of Health
• Australian Capital Territory Health Directorate
• Northern Territory Department of Health.

56 Alcohol and other drug use in regional and remote Australia: consumption, harms and access to treatment 2016–17
Abbreviations
ABS Australian Bureau of Statistics
AIHW Australian Institute of Health and Welfare
AODTS NMDS Alcohol and Other Drug Treatment Services National Minimum Data Set
ASGS Australian Statistical Geography Standard
NDSHS National Drug Strategy Household Survey
PBS Pharmaceutical Benefits Scheme
NHMRC National Health and Medical Research Council
Symbols
— nil or rounded to zero
. . not applicable
n.a. not available
n.p. not publishable because of small numbers, confidentiality or other concerns about the quality of the data

57Alcohol and other drug use in regional and remote Australia: consumption, harms and access to treatment 2016–17
Glossary
Aboriginal or Torres Strait Islander: A person of Aboriginal and/or Torres Strait Islander descent who identifies as an Aboriginal and/or Torres Strait Islander.
abstainer (alcohol): Has not consumed a full serve of alcohol in the previous 12 months.
additional drugs: Clients receiving treatment for their own drug use nominate a principal drug of concern that has led them to seek treatment and additional drugs of concern, of which up to 5 are recorded in the AODTS NMDS. Clients receiving treatment for someone else’s drug use do not nominate drugs of concern.
additional treatment type: Clients receive 1 main treatment type in each episode and additional treatment types as appropriate, of which up to 4 are recorded in the AODTS NMDS.
administrative cessation: Includes episodes that ended due to a change in main treatment type, delivery setting or principal drug of concern, or where the client was transferred to another service provider.
alcohol: A central nervous system depressant made from fermented starches. Alcohol inhibits brain functions, dampens the motor and sensory centres and makes judgement, coordination and balance more difficult.
amphetamines: Stimulants that include methamphetamine, also known as methylamphetamine. Amphetamines speed up the messages going between the brain and the body. Common names are speed, fast, up, uppers, louee, goey and whiz. Crystal methamphetamine is also known as ice, shabu, crystal meth, base, whiz, goey or glass.
Australian Statistical Geography Standard (ASGS): Common framework defined by the ABS for collection and dissemination of geographically classified statistics. The ASGS replaced the Australian Standard Geographical Classification (ASGC) in July 2011.
Australian Statistical Geography Standard (ASGS) Remoteness Area: The ABS ASGS Remoteness Area classification allocates 1 of 5 remoteness categories to areas, based on their relative accessibility to goods and services (such as general practitioners, hospitals and specialist care) as measured by road distance. These classifications reflect the level of remoteness at the time of the 2011 Census. Areas are classified as Major cities, Inner regional, Outer regional, Remote and Very remote. For analysis, Remote and Very remote are often grouped together.
benzodiazepines: Also known as minor tranquillisers, these drugs are most commonly prescribed by doctors to relieve stress and anxiety, and to help people sleep.
burden of disease (and injury): The quantified impact of a disease or injury on a population, using the disability-adjusted life year (DALY) measure.
client type: The status of a person in terms of whether the treatment episode concerns their own alcohol and/or other drug use or that of another person. Clients may seek treatment or assistance concerning their own alcohol and/or other drug use, or treatment and/or assistance in relation to the alcohol and/or other drug use of another person.
closed treatment episode: A period of contact between a client and a treatment provider or team of providers. An episode is closed when treatment is completed, there has been no further contact between the client and the treatment provider for 3 months or when treatment is ceased (see reason for cessation).

58 Alcohol and other drug use in regional and remote Australia: consumption, harms and access to treatment 2016–17
diversion client type: Clients who received at least 1 AOD treatment episode during a collection year resulting from a referral by a police or court diversion program. The 2 subtypes in this group are:
diversion-only clients—received treatment as a result of diversion referrals only
diversion client with non-diversion episodes—received at least 1 treatment episode of treatment resulting from a diversion referral, but also received at least 1 treatment episode resulting from a non-diversion referral in a collection year.
ecstasy (MDMA): The popular street name for a range of drugs containing the substance 3, 4-methylenedioxymethamphetamine (MDMA)—a stimulant with hallucinogenic properties. Common names for ecstasy include Adam, Eve, MDMA, X, E, the X, XTC and the love drug.
expected cessation: Includes episodes where the treatment was completed, or where the client ceased to participate at expiation, or by mutual agreement.
fatal burden: The burden from dying ‘prematurely’ as measured by years of life lost. Often used synonymously with YLL, and also referred to as ‘life lost’.
heroin: One of a group of drugs known as opioids, which are strong pain-killers with addictive properties. Heroin and other opioids are classified as ‘depressant’ drugs. Common names for heroin include smack, skag, dope, H, junk, hammer, slow, gear, harry, big harry, horse, black tar, China white, Chinese H, white dynamite, dragon, elephant, boy, home-bake or poison.
hospital separation: The term used to refer to the episode of care, which can be a total hospital stay (from admission to discharge, transfer or death), or a portion of a hospital stay beginning or ending in a change of type of care (for example, from acute to rehabilitation).
illicit drug use: Includes:
• the use of illegal drugs—drugs that are prohibited from manufacture, sale, or possession in Australia, such as cannabis, cocaine, heroin and ecstasy
• misuse, non-medical or extra-medical use of pharmaceuticals—drugs that are available from a pharmacy, over-the-counter, or by prescription, which may be subject to misuse, such as opioid-based pain relief medications, opioid substitution therapies, benzodiazepines, over-the-counter codeine and steroids
• use of other psychoactive substances—legal or illegal, potentially used in a harmful way, such as kava, or inhalants such as petrol, paint or glue (but not including tobacco or alcohol).
lifetime risk (alcohol): the accumulated risk from drinking—either on many drinking occasions, or regularly (for example, daily)—over a lifetime. The lifetime risk of harm from alcohol-related disease or injury increases with the amount consumed.
main treatment type: The principal activity that is determined, at assessment by the treatment provider, to treat the client’s alcohol or other drug problem for the principal drug of concern.
median: The midpoint of a list of observations ranked from the smallest to the largest.
nicotine: The highly addictive stimulant drug in tobacco.
non-government agency: An agency that receives some government funding, but is not controlled by the government, and is directed by a group of officers or an executive committee. A non-government agency may be an income tax-exempt charity.

59Alcohol and other drug use in regional and remote Australia: consumption, harms and access to treatment 2016–17
non-medical use: Use of drugs either alone or with other drugs to induce or enhance a drug experience, for performance-enhancement or for cosmetic purposes. In this report, this includes pain-killers/analgesics, tranquilisers/sleeping pills, steroids and meth/amphetamines and other opioids such as morphine or pethidine.
principal drug of concern: The main substance that the client stated led them to seek treatment from an alcohol and drug treatment agency.
reason for cessation: The reason the client ceased to receive a treatment episode from an alcohol and other drug treatment service. The client can have:
• ceased to participate against advice—where the service provider is aware of the client’s intention to stop participating in treatment, and the client ceases despite advice from staff that such action is against the client’s best interests
• ceased to participate at expiation—where the client has fulfilled their obligation to satisfy expiation requirements (for example, participation in a treatment program to avoid having a criminal conviction being recorded against them) as part of a police or court diversion scheme, and chooses not to continue with further treatment
• ceased to participate by mutual agreement—where the client ceases participation by mutual agreement with the service provider, even though the treatment plan has not been completed. This may include situations where the client has moved out of the area
• ceased to participate involuntarily—where the service provider stops the treatment due to non-compliance with the rules or conditions of the program
• ceased to participate without notice
• a change in the delivery setting
• a change in the principal drug of concern
• a change in the main treatment type
• died
• been to a drug court or sanctioned by a court diversion service—where the client is returned to court or jail due to non-compliance with the program
• been imprisoned (other than sanctioned by a drug court or diversion service)
• completed treatment—where the treatment was completed as planned
• been transferred to another service provider—including where the service provider is no longer the most appropriate, and the client is transferred or referred to another service. (For example, transfers could occur for clients between non-residential and residential services, or between residential services and a hospital.) This excludes situations where the original treatment was completed before the client transferred to a different provider for other treatment.
referral source: The source from which the client was transferred or referred to the alcohol and other drug treatment service.
single occasion risk (alcohol): A single occasion is a sequence of drinks taken without the blood alcohol concentration reaching zero in between. The risk of an alcohol-related injury arising from a single occasion of drinking increases with the amount consumed.

60 Alcohol and other drug use in regional and remote Australia: consumption, harms and access to treatment 2016–17
standard drink: Contains 10 grams of alcohol (equivalent to 12.5 millilitres of alcohol). Also referred to as a ‘full serve’.
tobacco: A plant, Nicotiana tabacum, whose leaves are dried and used for smoking and chewing and in snuff. Its major pharmacologically active substance is the alkaloid nicotine (see nicotine).
treatment episode: The period of contact between a client and a treatment provider or a team of providers. Each treatment episode has 1 principal drug of concern and 1 main treatment type. If the principal drug or main treatment changes, then a new episode is recorded.
treatment type: The type of activity that is used to treat the client’s alcohol or other drug problem, which includes:
• assessment only—where only assessment is provided to the client (service providers would normally include an assessment component in all treatment types)
• counselling—can include cognitive behaviour therapy, brief intervention, relapse intervention and motivational interviewing
• information and education only
• pharmacotherapy—where the client receives another type of treatment in the same treatment episode, and includes drugs such as naltrexone, buprenorphine and methadone used as maintenance therapies or for relapse prevention for people who are addicted to certain types of opioids. Where a pharmacotherapy is used for withdrawal, it is included in the withdrawal category. Due to the complexity of the pharmacotherapy sector, this report provides only limited information on agencies whose sole function is to provide pharmacotherapy
• rehabilitation—focuses on supporting clients in stopping their drug use, and preventing psychological, legal, financial, social and physical consequences of problematic drug use. Rehabilitation can be delivered in several ways, including residential treatment services, therapeutic communities and community-based rehabilitation services
• support and case management only—‘support’ includes helping a client who occasionally calls an agency worker for emotional support, while ‘case management’ is usually more structured than ‘support’. It can assume a more holistic approach, taking into account all client needs (including general welfare needs) and it includes assessment, planning, linking, monitoring and advocacy
• withdrawal management (detoxification)—includes medicated and non-medicated treatment to help manage, reduce or stop the use of a drug of concern.
unexpected cessation: Includes episodes where the client ceased to participate against advice, without notice, or due to non-compliance.
YLL (years of life lost): Years of life lost due to premature death, defined as dying before the ideal life span. YLL represent fatal burden.

61Alcohol and other drug use in regional and remote Australia: consumption, harms and access to treatment 2016–17
References
ABS (Australian Bureau of Statistics) 2016. National Aboriginal and Torres Strait Islander Social Survey, 2014–15. ABS cat. no. 4714.0. Canberra: ABS.
ABS 2017a. Causes of death, Australia, 2016. ABS cat no. 3303.0. Canberra: ABS.
ABS 2017b. Patient experiences in Australia: summary of findings, 2016–17. ABS cat. no. 4839.0. Canberra: ABS.
ABS 2018a. Australian Statistical Geography Standard (ASGS): volume 5—Remoteness Structure, July 2016. ABS Cat no. 1270.0.55.005. Canberra: ABS.
ABS 2018b. Causes of death, Australia, 2017. ABS cat no. 3303.0. Canberra: ABS.
ABS 2018c. Life tables for Aboriginal and Torres Strait Islander Australians, 2015–17. ABS cat. no. 3302.0.55.003 Canberra: ABS.
ABS 2018d. Regional population growth, Australia, 2016–17. ABS cat. no. 3218.0. Canberra: ABS.
ACIC (Australian Criminal Intelligence Commission) 2019. National Wastewater Drug Monitoring Program: report 6, December 2018. Canberra: ACIC. Viewed 28 February 2019, <https://www.acic.gov.au/publications/intelligence-products/national-wastewater-drug-monitoring-program-report>.
AIHW (Australian Institute of Health and Welfare) 2015. The health and welfare of Australia’s Aboriginal and Torres Strait Islander peoples 2015. Cat. no. IHW 147. Canberra: AIHW.
AIHW 2016a. Australian Burden of Disease Study: impact and causes of illness and death in Aboriginal and Torres Strait Islander people 2011. Australian Burden of Disease Study series no. 6. Cat. no. BOD 7. Canberra: AIHW.
AIHW 2016b. Spatial distribution of the supply of the clinical health workforce 2014: relationship to the distribution of the Indigenous population. Cat. no. IHW 170. Canberra: AIHW.
AIHW 2017a. National Drug Strategy Household Survey 2016: detailed findings. Drug statistics series no. 31. Cat. no. PHE 214. Canberra: AIHW. Viewed 14 December 2017.
AIHW 2017b. Rural and remote health. Web report. Canberra: AIHW. Viewed 1 July 2018, <https://www.aihw.gov.au/reports/rural-health/rural-remote-health/contents/rural-health>.
AIHW 2018a. Aboriginal and Torres Strait Islander health organisations: Online Services Report—key results 2016–17. Aboriginal and Torres Strait Islander health services report no. 9. Cat. no. IHW 196. Canberra: AIHW.
AIHW 2018b. Admitted patient care 2016–17: Australian hospital statistics. Health services series no. 84. Cat. no. HSE 201. Canberra: AIHW.
AIHW 2018c. Alcohol and other drug treatment services in Australia: 2016–17. Drug treatment series no. 31. Cat no. HSE 207. Canberra: AIHW.
AIHW 2018d. Australian Burden of Disease Study 2015: fatal burden preliminary estimates. Web report. Canberra: AIHW. Viewed 1 August 2018, <https://www.aihw.gov.au/reports/ burden-of-disease/fatal-burden-2015-preliminary-estimates/contents/remoteness-areas>.

62 Alcohol and other drug use in regional and remote Australia: consumption, harms and access to treatment 2016–17
AIHW 2018e. Impact of alcohol and illicit drug use on the burden of disease and injury in Australia: Australian Burden of Disease Study 2011. Australian Burden of Disease Study series no. 17. Cat. no. BOD 19. Canberra: AIHW.
AIHW 2018f. Patients’ out-of-pocket spending on Medicare services 2016–17. Cat. no. HPF 35. Canberra: AIHW.
Collins DJ & Lapsley HM 2008. The costs of tobacco, alcohol and illicit drug abuse to Australian society in 2004/05. National Drug Strategy Monograph Series No. 64.
DoH (Department of Health) 2017. National Drug Strategy 2017–2026. Canberra: Department of Health.
Lubman D, Manning V, Best D, Berends L, Mugavin J, Lloyd B et al. 2014. A study of patient pathways in alcohol and other drug treatment: Patient Pathways National Project final report. Fitzroy: Turning Point.
NHMRC (National Health and Medical Research Council) 2009. Australian guidelines to reduce health risks from drinking alcohol. Canberra: NHMRC. Viewed 12 October 2017, <https://nhmrc.gov.au/health-advice/alcohol>.
Roche A & McEntee A 2017. Ice and the outback: patterns and prevalence of methamphetamine use in rural Australia. Australian Journal of Rural Health 25(4):200–9.
Turning Point 2017. Ambo-AODstats. Melbourne: Victoria. Viewed 17 September 2018, <http://amboaodstats.org.au/>.

63Alcohol and other drug use in regional and remote Australia: consumption, harms and access to treatment 2016–17
List of tables
Table 1.1: Experience of health services in the last 12 months, by remoteness area, persons aged 15 and over, 2016–17 (%) .................................................................................. 3
Table 2.1: Proportion of people aged 14 or older drinking alcohol at levels that placed them at harm over a lifetime, by top and bottom 5 areas of remoteness, 2016 ............... 9
Table 2.2: Proportion of people aged 14 or older drinking alcohol at levels that place them at harm on a single occasion, at least monthly, by top and bottom 5 areas of remoteness, 2016 .................................................................................................................. 9
Table 2.3: Proportion of people aged 14 or older who recently used an illicit drug, by top and bottom 5 areas of remoteness, 2016 ................................................................. 13
Table 4.1: Closed treatment episodes, by remoteness area, states and territories, 2016–17 (%) ............................................................................................................................... 26
Table 4.2: Number of Aboriginal and Torres Strait Islander substance-use organisations, clients and episodes, by remoteness area, 2016–17 ........................................................... 37
Table 4.3: Number of organisations reporting common substance-use issues, by remoteness area, 2016–17 ................................................................................................. 38
Table 5.1: Proportion of closed episodes, by location of the client’s last known usual residence to the Statistical Area Level 3 (SA3) of the agency and size of area (km2), 2016–17 ......... 39
Table A1: National Drug Strategy Household Survey sample sizes .................................................... 48
Table A2: Relationship between the drug of concern and the ICD-10-AM codes .............................. 50
Table A3: Relationship between the drug type and ICD-10 codes ...................................................... 51

64 Alcohol and other drug use in regional and remote Australia: consumption, harms and access to treatment 2016–17
List of figures
Figure 1.1: Proportion of different health behaviours and risk factors, by remoteness area, 2014–15 (%) ............................................................................................................................ 2
Figure 2.1: Drinking status, people aged 14 and over, by remoteness area, 2016 (%) .................... 6
Figure 2.2: Drank in excess of the lifetime risk guideline(a), people aged 14 and over, by age, sex and remoteness area, 2016 (%) ....................................................................... 7
Figure 2.3: Recent illicit drug use, people aged 14 and over, by remoteness area, 2016 (%) ....... 10
Figure 2.4: Recent illicit drug use, people aged 14 and over, by age, sex and remoteness area, 2016 (%) ................................................................................................. 12
Figure 3.1: Fatal burden of disease age-standardised YLL rate, all persons, by remoteness area, 2015 .................................................................................................. 15
Figure 3.2: Age-standardised attributable DALY rate due to alcohol use, by selected linked diseases, by remoteness area, 2011 .....................................................................16
Figure 3.3: Age-standardised attributable DALY rate due to illicit drug use, by selected linked diseases, by remoteness area, 2011 .....................................................................18
Figure 3.4: Proportion of hospital separations for drug-related principal diagnoses, by remoteness area, 2016–17 (%) .....................................................................................20
Figure 3.5: Rate of drug-induced deaths in Major cities and Regional and remote areas, 2008 to 2017 ........................................................................................................................22
Figure 3.6: Rate of opioid-induced deaths in Major cities and Regional and remote areas, 2008 and 2017 .....................................................................................................................23
Figure 3.7: Rate of drug-induced deaths, by region of usual residence, 2016 ................................24
Figure 3.8: Rate of alcohol-induced deaths, by region of usual residence, 2017 ............................25
Figure 4.1: Proportion of clients by age and remoteness area, 2016–17 (%) ..................................28
Figure 4.2: Proportion of closed treatment episodes for own drug use, by principal drug of concern and remoteness areas, 2016–17 (%) ..............................................................29
Figure 4.3: Proportion of closed treatment episodes for own drug use, by main treatment type, and remoteness area, 2016–17 (%) .......................................................30
Figure 4.4: Proportion of closed treatment episodes for own drug use, by treatment delivery setting and remoteness area, 2016–17 (%) ........................................................32
Figure 4.5: Proportion of closed treatment episodes for own drug use that ended expectedly, by principal drug of concern and remoteness area, 2016–17 (%) ............34
Figure 4.6: Proportion of closed treatment episodes for own drug use that ended unexpectedly, by main treatment type and remoteness area, 2016–17 (%) ................35
Figure 4.7: Proportion of substance-use Indigenous clients, by remoteness area, 2008–09 to 2016–17 (%) ......................................................................................................37

65Alcohol and other drug use in regional and remote Australia: consumption, harms and access to treatment 2016–17
Figure 5.1: Closed episodes, travel time by remoteness area of treatment service, 2016–17 (%) ............................................................................................................................40
Figure 5.2: Proportion of closed treatment episodes where the client sought treatment f or their own drug use and travelled 1 hour or longer to the service, by principal drug of concern and remoteness area of the treatment service, 2016–17 ....................42
Figure 5.3: Proportion of closed treatment episodes where the client travelled for 1 hour or longer to the service, by main treatment type and remoteness area of the treatment service, 2016–17 ...........................................................................................44
Figure 5.4. Proportion of closed treatment episodes with a travel time of over an hour ending unexpectedly, by main treatment type and remoteness area of the treatment service, 2016–17 ...................................................................................................45

66 Alcohol and other drug use in regional and remote Australia: consumption, harms and access to treatment 2016–17
Related publications
This report is part of an annual series. The 3 earlier editions and any published subsequently can be downloaded from the AIHW website <https://www.aihw.gov.au/reports-statistics/ health-welfare-services/alcohol-other-drug-treatment-services/reports>. The website also includes information on ordering printed copies.
The following AIHW publications relating to alcohol and other drugs may also be of interest:
• AIHW 2017. National Drug Strategy Household Survey 2016: detailed findings. Drug statistics series no. 31. Cat. no. PHE 214. Canberra: AIHW.
• AIHW 2018. Alcohol and other drug treatment services in Australia 2016–17. Drug treatment services no. 31. Cat. no. HSE 207. Canberra: AIHW.
• AIHW 2018. Alcohol, tobacco, & other drugs in Australia—Notes. Cat. no. PHE 221. Canberra: AIHW.
• AIHW 2018. Impact of alcohol and illicit drug use on the burden of disease and injury in Australia: Australian Burden of Disease Study 2011. Australian Burden of Disease Study series no. 17. Cat. no. BOD 19. Canberra: AIHW.


Stronger evidence, better decisions, improved health and welfare
aihw.gov.au
This report identifies trends and differences in alcohol and other drug use, harms and treatment in Major cities and Regional and remote Australia. The consumption of alcohol at levels placing people at risk of alcohol-related harm was higher for clients in Regional and remote Australia compared with those in Major cities. While the consumption of illicit drugs was similar for clients in Major cities and Regional and remote areas, the type of illicit drug used varied. Clients in Regional and remote areas were more likely than those in Major cities to travel 1 hour or longer to access services.