Alberta Midstream Chemical Cluster Site Requirements … · Offgas. Intermediates. Gasification....
43
© FdP Associates 2009 Alberta Midstream Chemical Cluster Site Requirements Study Assessment of the Land Use, Infrastructure, and Logistics Requirements, Costs and Benefits for the Midstream Chemical Cluster in Alberta’s Industrial Heartland Government Date: October 2009 Calgary and Edmonton
Transcript of Alberta Midstream Chemical Cluster Site Requirements … · Offgas. Intermediates. Gasification....

© FdP Associates 2009
Alberta Midstream Chemical Cluster Site Requirements Study
Assessment of the Land Use, Infrastructure, and Logistics Requirements, Costs and Benefits for the Midstream Chemical Cluster in Alberta’s Industrial Heartland
GovernmentDate: October 2009Calgary and Edmonton

FdP Associates © FdP Associates 2009 Page 2
Agenda
Contents
Approach to Study
Cluster Best Practice
Feedstock Scenarios
1
2
3
Market Supply/Demand4
Cluster Configurations5
Logistics & Infrastructure6
Concept Site Plans7
Socio Economic Analysis8
Cost Benefit Analysis9
Observations & Conclusions10

FdP Associates © FdP Associates 2009 Page 3
The Study was conducted in a six-stage work program
Approach
Obj
ectiv
es
Integrate the findings of previous studies into the basis for the Land Use Study
Develop the cluster con-figurations based on the feedstock scenarios for investment in the period 2010 to 2040
Assess current and long term supply/ demand for the products that could be produced in the Midstream cluster
Develop the Land Use site plan and define the public and site specific infrastructure and logistics systems to move products to market
Assess land use best practice in existing and emerging clusters and assemble key learnings
Under- standing the Market potential and selecting products
Assemble and Integrate inputs from other studiesSt
age
1 2Assess Best Practices from existing and emerging Clusters
Developing the Conceptual Midstream Cluster Concepts
Develop Land Use Infrastructure and Logistics plan
3 4 5Socio- Economic Impact and Cost – Benefit analysis
6
Conduct detailed Socio-economic Analysis the goal of establishing the cost-benefit to the Capital Region

FdP Associates © FdP Associates 2009 Page 4
The Midstream cluster will become an important producer of commodities and intermediates for the CoE Cluster and North American Market
Approach
Ups
trea
m
Mid
stre
am C
lust
er(s
)
CoE
Dow
nstr
eam
Upgraders,Integrated Gasifiers,Refineries
Phase 2 DerivativesFabrication
CompoundingR&D / Tech CentresNew Technologies
Methanol Acetic Acid VAM
Urea
Ammonium Nitrate
Ammonia UAN
Acrylic Acid
Propylene Oxide
Polypropylene
Propylene
PolyethyleneEthylene
MTO
Pipe Rack to Midstream Cluster(s)
Rail to US and West Coast
Truck & Pipe to DownstreamCluster and domestic markets
C1, C2, C3 Value Chains
Potentially World Scale Volumes
C4, C6, C7/8 Value Chains
RefineryOffgas
Intermediates
Gasification
RefineryCracker(s)
EthanePropane
Syn Gas
Gasification

FdP Associates © FdP Associates 2009 Page 5
Petcoke or Residues from Upgrading could be key to Value-Add in Alberta’s Midstream Chemical Cluster via a Poly-Gen configuration
Approach
Syngas
Petcoke gasification
Upgrader with
delayed coker
Petcoke from Oilsands/Upgraders
Bitumen from Oilsands
Upgrader with POX
unit
IGCC-Power
Hydrogen
Methanol-Petrochemicals
Fertilizers
CO2 Capture
FuelsSulphur
SyngasCoke
Poly – Gen Configuration

FdP Associates © FdP Associates 2009 Page 6
Agenda
Contents
Approach to Study
Cluster Best Practice
Feedstock Scenarios
1
2
3
Market Supply/Demand4
Cluster Configurations5
Logistics & Infrastructure6
Concept Site Plans7
Socio Economic Analysis8
Cost Benefit Analysis9
Observations & Conclusions10

FdP Associates © FdP Associates 2009 Page 7
The globally significant chemical clusters rely on several key sources of competitiveness
Cluster Best Practice
Feedstock availability and flexibility
Market proximity, diversity and critical mass
Supply Chain efficiency (feedstocks and products)
Cluster critical mass and operational efficiency
Maximising the combination of these leads to “best in class”
Cluster “Attributes” –
only manageable to a limited extent
Cluster “Key Performance Criteria” –
mostly manageable

FdP Associates © FdP Associates 2009 Page 8
Singapore
Globally significant Chemical Clusters were analysed to develop key learning points on infrastructure and logistics “Best Practice”
Cluster Best Practice
Houston
Antwerp
Jubail – Saudi Kayan

FdP Associates © FdP Associates 2009 Page 9
Summary of Key Findings of the analysis of globally significant clusters relevant to the Midstream cluster (1/2)
Cluster Planning and Design:
−All successful on-purpose clusters have benefited from directed master-planning of their clusters
−Phasing of development, has been favoured by the major on-purpose cluster developments to mitigate investment risk
Role of Government:
−Has played a central role in the development of on-purpose clusters
−Has begun to intervene in the vision, mission and strategies of the evolved clusters, consciously directing planning and investment in infrastructure to support regional cluster focal points and environmental initiatives
−Both government-
and stakeholder-driven strategies are successfully employed. The common practice in both models is to follow a strongly consultative approach to the development of vision, mission, strategies and implementation
Cluster Best Practice

FdP Associates © FdP Associates 2009 Page 10
Summary of Key Findings of the analysis of globally significant clusters relevant to the Midstream cluster (2/2)
Infrastructure and Supply Chain
−Global Logistics Service Providers play a significant role in all successful clusters –
this includes those clusters strongly directed by government.
−The provision of pre-built infrastructure, and provision of utilities is considered fundamental to kick-starting clusters
Utilities:
−Most clusters have multiple supplies of electrical power from a regional grid and from power stations within the cluster
−There is a clear trend toward centralisation of waste water management. In several cases government has played a significant role in directing and managing these activities
Investment Attraction
−Attracting anchor investors in feedstock preparation, integrated
chemical production, logistics, utilities and services is important to build momentum
in the cluster
− Incentives are widely used, in many different forms, for investment attraction
Cluster Best Practice
FdP Associates © FdP Associates 2009 Page 11
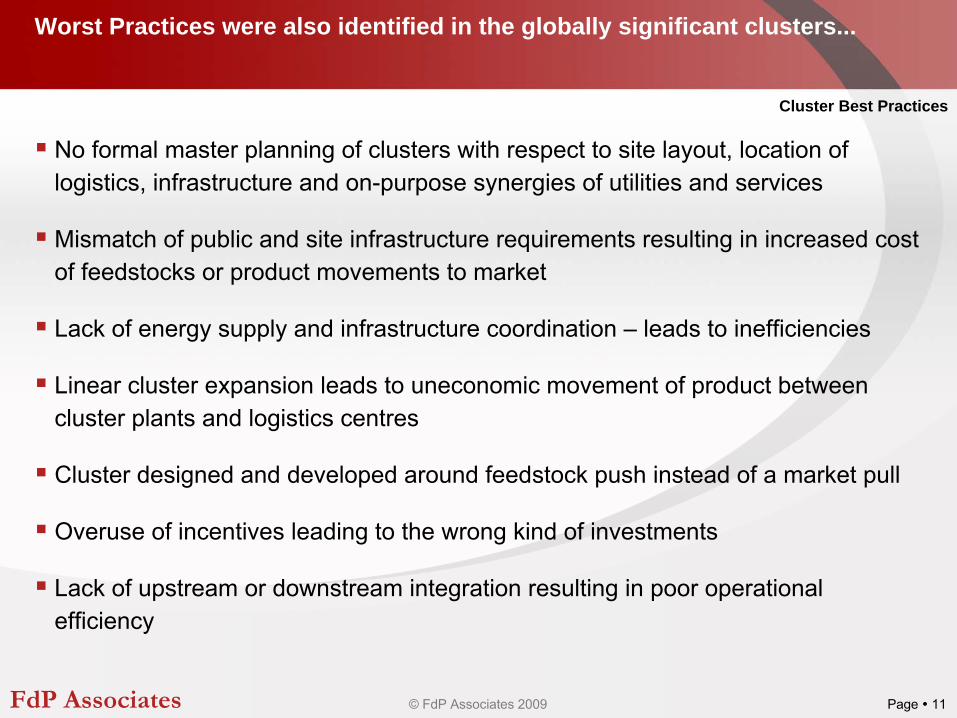
Worst Practices were also identified in the globally significant clusters...
No formal master planning of clusters with respect to site layout, location of logistics, infrastructure and on-purpose synergies of utilities and services
Mismatch of public and site infrastructure requirements resulting in increased cost of feedstocks or product movements to market
Lack of energy supply and infrastructure coordination – leads to inefficiencies
Linear cluster expansion leads to uneconomic movement of product between cluster plants and logistics centres
Cluster designed and developed around feedstock push instead of a market pull
Overuse of incentives leading to the wrong kind of investments
Lack of upstream or downstream integration resulting in poor operational efficiency
Cluster Best Practices
FdP Associates © FdP Associates 2009 Page 12
Agenda
Contents
Approach to Study
Cluster Best Practice
Feedstock Scenarios
1
2
3
Market Supply/Demand4
Cluster Configurations5
Logistics & Infrastructure6
Concept Site Plans7
Socio Economic Analysis8
Cost Benefit Analysis9
Observations & Conclusions10

FdP Associates © FdP Associates 2009 Page 13
Long-term oil & gas price forecasts will allow the Capital Region to take advantage of feedstocks based on Upgrading
Feedstock Scenarios
Production of the C2, C3, C4 and C6/7/8 value chains and derivatives will be highly competitiveNaphtha could be in oversupply in Alberta due to new refineries being required mainly for diesel production – leading to a significant opportunity
Stea
m c
rack
ing
from
SC
O
Highly attractive route to globally competitive methanol and ammonia and derivativesThe stranded nature and large volumes of the residues could lead to a global centre for C1-3 petrochemicalsA zero or negative value of residues will provide the basis for competing against other global advantaged locationsThe transport cost from Fort Mc Murray to the AIH needs to be optimised in order to sustain this advantageSy
ngas
bas
ed o
n pe
tcok
eO
ff-ga
s
Upg
radi
ng
Provides a key route to petrochemicalsImmediately availableAugmented by gasification and steam cracking in future

FdP Associates © FdP Associates 2009 Page 14
The growing stock-pile of Petcoke will be key to the development of a world scale chemical cluster
Inventory currently 57 million tonne
-
End 2008, source ERCB, July 2009
Production ~ 6.0-6.5 million tonne pa
Nominal third party sales
Prime producers: Syncrude, Suncor
Future producers to include existing expansions plus CNPL, Opti Nexen
Forecast production:
-
7 million tonne pa (Reference Case)
-
16 million tonne pa (Realistic Case)
-
Stock-pile to reach over 500 million tonne by 2040 without gasification
Feedstock Scenarios

FdP Associates © FdP Associates 2009 Page 15
Reference Case Concept: 10 million tpa gasification capacity commencing in 2016
In the Reference Case 10 million tpa gasification capacity is commissioned in 2016. No addition investment
Petcoke production is 7 million tpa. Gasification capacity operates at 85%
The accumulated petcoke stockpile reduces to zero post 2050.
Gasification continues based on ongoing production of 7 million tpa, e.g. 70% operating rate
Feedstock Scenarios
Study Period

FdP Associates © FdP Associates 2009 Page 16
Realistic Case Concept: 14 million tonne gasification capacity initial investment with further 50% increase from 2025
In the Realistic Case 14 million tpa gasification capacity is commissioned in 2016, 7 million tpa in 2025
Petcoke production is 16 million tpa. Gasification capacity operates at 85-90% (average 87.5%)
The accumulated petcoke stockpile reduces to zero post 2050.
Gasification continues based on ongoing production of 16 million tpa, e.g. 76% operating rate
Feedstock Scenarios
Study Period
Realistic CasePetcoke production and forecast stockpile reduction

FdP Associates © FdP Associates 2009 Page 17
The two Feedstock Scenarios can be summarised as follows:
Feedstock Scenarios
Attributes Reference Case Realistic Case
Scale Below world-scale c.a. 3 million tpa olefins World-scale c.a. 10 million tpa olefins
Integration Replacement of existing natural gas feedstock for ammonia and methanol imports for formaldehyde production
Feedstock replacement plus expansion of fertilizer value chain and feedstock for formaldehyde and acetic acid production
Energy 600MW 1200MW
Downstream Limited derivative capability Significant derivative capability
Pet coke Stockpile reduced by 2050 Stockpile reduced by 2052
Refining I major investment providing opportunity for world-scale steam cracker and derivatives
3 major investments allowing wide range of derivatives
Off-gases Ability to develop world-scale polypropylene Opportunity for 2 polypropylene plants plus additional C4 stream integration
Significant upside to the Realistic Case is envisaged with higher levels of Upgrading investments
The minimum world-scale petrochemical basis is regarded as 5-6 million tpa olefin equivalent
The Reference Case concept is feedstock limited in terms of available petcoke for gasification

FdP Associates © FdP Associates 2009 Page 18
Agenda
Contents
Approach to Study
Cluster Best Practice
Feedstock Scenarios
1
2
3
Market Supply/Demand4
Cluster Configurations5
Logistics & Infrastructure6
Concept Site Plans7
Socio Economic Analysis8
Cost Benefit Analysis9
Observations & Conclusions10
FdP Associates © FdP Associates 2009 Page 19
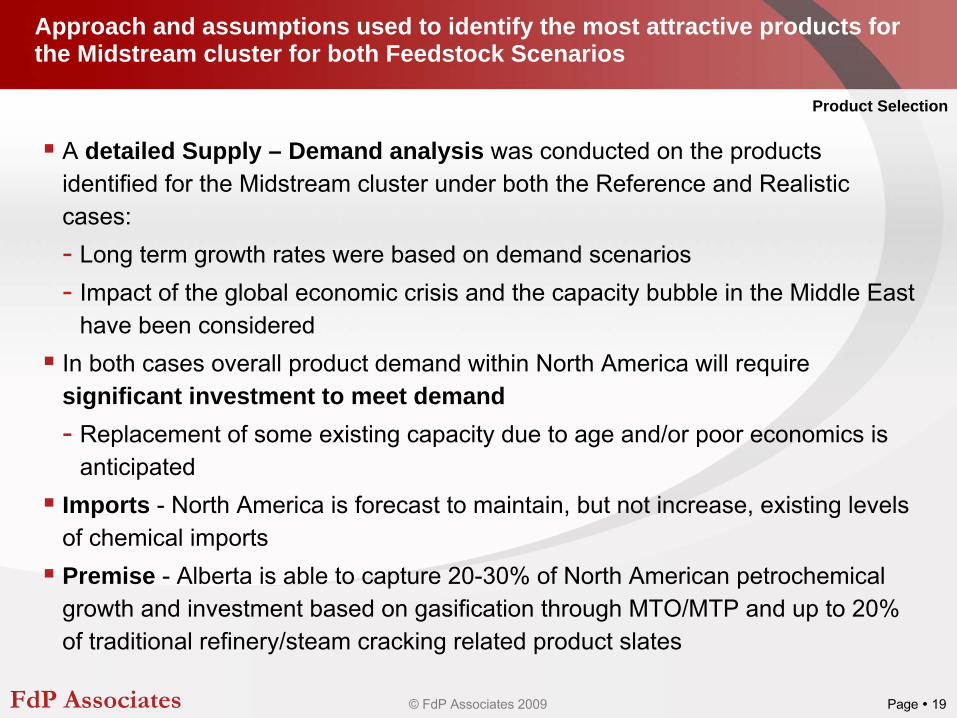
Approach and assumptions used to identify the most attractive products for the Midstream cluster for both Feedstock Scenarios
A detailed Supply – Demand analysis was conducted on the products identified for the Midstream cluster under both the Reference and Realistic cases:-
Long term growth rates were based on demand scenarios
-
Impact of the global economic crisis and the capacity bubble in the Middle East have been considered
In both cases overall product demand within North America will require significant investment to meet demand-
Replacement of some existing capacity due to age and/or poor economics is anticipated
Imports - North America is forecast to maintain, but not increase, existing levels of chemical imports Premise - Alberta is able to capture 20-30% of North American petrochemical growth and investment based on gasification through MTO/MTP and up to 20% of traditional refinery/steam cracking related product slates
Product Selection

FdP Associates © FdP Associates 2009 Page 20
Demand growth for commodity petrochemicals in North America is lower than the overall global demand yet the market is significant
Individual product demand in both the Reference and Realistic Cases have been derived from the projected commodity petrochemicals demand growth rates in North America using scenario analysis
Approach

FdP Associates © FdP Associates 2009 Page 21
Projected total number of world-scale plants required in North America to 2040 for the Reference Case
Product Selection
Products Value Chain Capacity kt 2010-2015 2015-2020 2020-2025 2025-2030 2030-2035 2035-2040
Methanol C1 1000 1 1 1 1
Methanol (MTO/MTP) C1 1500+ 2-3 2-3 3-4 3-4 3-4
Ammonia C1 1000 1 1 1 1 1
Urea C1 500 1
Polyethylenes (conventional) C2 500 1 2 3 3 2 2
Polyethylenes (non-conventional) C2 500 2 3 3 3 3
Ethylene Oxide/Glycol C2 500 1 1 1
Polypropylene (conventional) C3 400 2 2 2 2 2 2
Polypropylene (non-conventional) C3 400 2 2 3 3 3
Propylene Oxide C3 500 1 1 1
Propylene Glycol C3 200
Acrylic Acid C3 200 1 1 1 1 1 1
Acetic Acid C1 600 1
Maleic Anhydride C4 80
Benzene C6 300 1 1 1 1 1
Phenol C6 350 1 1 1 1 1
Cumene C7 300 1 1 1 1 1
Toluene C7 200 1 1 1
para Xylene C8 600 1 1 1 1
ortho Xylene C8 150 1 1
BPA C6 200 1 1 1 1
Each coloured box represents one plant built in Alberta Midstream Cluster. Capacity stated as typical world-scale 2009 basis
Post 2015 conventional feedstock (ethane/propane) will be limited and replaced by steam cracking (naphtha) and MTO/MTP

FdP Associates © FdP Associates 2009 Page 22
The projected higher growth will require earlier phasing and an increase in the number of plants in the Realistic Case
Product Selection
Products Value Chain Capacity kt 2010-2015 2015-2020 2020-2025 2025-2030 2030-2035 2035-2040
Methanol C1 1000+ 1 1 1 1 1
Methanol (MTO/MTP) C1 1500+ 2-3 3-4 3-4 4-5 4-5
Ammonia C1 1000 1 1 1 1 1
Urea C1 500 1 1
Polyethylenes (conventional) C2 500 1 2 3 3 3 3
Polyethylenes (non-conventional) C2 500 2 3 4 5 5
Ethylene Oxide/Glycol C2 500 1 1 1
Polypropylene (conventional) C3 400 2 2 3 3 3 3
Polypropylene (non-conventional) C3 400 2 3 4 5 5
Propylene Oxide C3 500 1 1 1 1
Propylene Glycol C3 200 1
Acrylic Acid C3 200 1 1 1 1 1 2
Acetic Acid C1 600 1 1 1
Maleic Anhydride C4 80 1
Benzene C6 300 1 1 1 1 1
Phenol C6 350 1 1 1 1 1
Cumene C6 300 1 1 1 1 1
Toluene C7 200 1 1 1
para Xylene C8 600 1 1 1 1
ortho Xylene C8 150 1 1
BPA C6 200 1 1 1 1 1 2
Each coloured box represents one plant built in Alberta Midstream Cluster. Capacity stated as typical world-scale 2009 basis
Note: Post 2015 conventional feedstock (ethane/propane) will be limited and replaced by steam cracking (naphtha) and MTO/MTP

FdP Associates © FdP Associates 2009 Page 23
Agenda
Contents
Approach to Study
Cluster Best Practice
Feedstock Scenarios
1
2
3
Market Supply/Demand4
Cluster Configurations5
Logistics & Infrastructure6
Concept Site Plans7
Socio Economic Analysis8
Cost Benefit Analysis9
Observations & Conclusions10

FdP Associates © FdP Associates 2009 Page 24
The Reference Case is feedstock constrained resulting in relatively limited investment in the Midstream Cluster
Cluster ConfigurationsConstruction and timing of investments - (not linear)
Gasification
UpstreamRefining
Polypropylene
Polyethylene
EO/EG
Toluene
o Xylene
p Xylene
Cumene
Phenol
Acetone
BPA
Power HydrogenSyngas (NH3)
20202015 20402018
PolypropyleneOff-gases
Methanol
Polypropylene
MTO/MTP
Legend
Product
Third partyFeedstocks
36 months construction assumed
FeedstockProcess
Steam Cracking

FdP Associates © FdP Associates 2009 Page 25
The significant feedstock availability enables world scale investment in 3 phases in the Realistic Case
Cluster ConfigurationsConstruction and timing of investments - (not linear)
UpstreamRefining
Legend
Product
Third partyFeedstocks
36 months construction assumed
FeedstockProcess
20202015 20402018 2025 2030 2035
Polypropylene
Methanol
PP/PO
MTO/MTP
Urea
Ammonia
UAN
AN
Acetic Acid
VAM
Acetic Acid
VAM
Polypropylene
Polyethylene (s)
PO/PG
Acrylic Acid
Toluene
o & p Xylene
Cumene
Phenol
Others
Acetone
PP, PO and Acrylic Acid may be based on propylene derived from off-gases,
MTP and steam crackingOthers include: Adipic Acid, Adiponitrile,
Aniline MDI and CaprolactamEthylene may be used as a replacement feedstock for Polyethylenes and EO/EG (and LAOs) post 2025 rather than new
builds
Gasification
Power HydrogenSyngas (NH3)
PolypropyleneOff-gases
Steam Cracking
Methanol
Polypropylene
MTO/MTP
Formaldehyde
Polypropylene
Polyethylene(s)
EO/EG
PO/PG (option)
Toluene
o & p Xylene
Cumene
Phenol
Acetone
BPA
Gasification
UpstreamRefining
UpstreamRefining
Polypropylene
Polyethylene (s)
EO/EG
Benzene
BDO
Maleic Anhydride
Cyclohexane
PA
BPA
Cumene
Others
PO/PG
Acrylic Acid
Steam Cracking
Steam Cracking
FdP Associates © FdP Associates 2009 Page 26
Agenda
Contents
Approach to Study
Cluster Best Practice
Feedstock Scenarios
1
2
3
Market Supply/Demand4
Cluster Configurations5
Logistics & Infrastructure6
Concept Site Plans7
Socio Economic Analysis8
Cost Benefit Analysis9
Observations & Conclusions10

FdP Associates © FdP Associates 2009 Page 27
Summary of Personnel, Land Use and Capex for the Reference Case Logistics systems
Logistics & Infrastructure
Logistics Personnel
requirements
Logistics Land Use requirements (ha)
Logistics Capex requirements
(USD$m) excluding railcars
Solids 100 6 30
Liquids Site 80 7 25
Rail Site (solids) Included in solids Off site 40
Liquids Central (AILC)
150 25 350
Petcoke 50 55 150
Rail Central (Marshalling)
Included in liquids central
65 12
Total 380 151 607

FdP Associates © FdP Associates 2009 Page 28
Summary of the Personnel, Land Use and Capex requirements for the Realistic Case logistics systems
Logistics & Infrastructure
Logistics Personnel
requirements
Logistics Land Use requirements (ha)
Logistics Capex requirements (USD$m)
excluding railcars
Solids 200 12 62
Fertilizers 100 5 50
Gasification Included in Solids Included in Solids 23
Liquids Site 160 15 75
Rail Site (solids)included in Rail
CentralIncluded in Rail
Central90
Liquids Central (AILC)
230 30 700
Petcoke 50 55 150
Rail Central (Marshalling)
Included in liquids central
103 22
Total 740 220 1172

FdP Associates © FdP Associates 2009 Page 29
Agenda
Contents
Approach to Study
Cluster Best Practice
Feedstock Scenarios
1
2
3
Market Supply/Demand4
Cluster Configurations5
Logistics & Infrastructure6
Concept Site Plans7
Socio Economic Analysis8
Cost Benefit Analysis9
Observations & Conclusions10

FdP Associates © FdP Associates 2009 Page 30
The Public and Site Specific Infrastructure have been defined independently of the location of the Upstream/Midstream location
Concept Site Plans
Utilities: electricity, steam, natural gas, condensate, waterInfrastructure: pipe bridges, pipelines, roads, railEnvironmental: waste water, storm water, solid effluent, flue gases, liquid effluent, CO2 capture, flaresIndustrial gases: oxygen, nitrogen, syngas, CO, H2
Land Use: plants, infrastructure, maintenance corridorsEmergency services: fire-brigade, medical
Site Specific(ISBL to the cluster)
Public (OSBL to the cluster)
Utilities: water, electricity, waste water, CO2 pipelinesInfrastructure: infrastructure corridors between clusters, pipe bridges, pipelines, roads, rail, marshalling yardsEnvironmental: waste water, storm water, CO2 captureLand Use: roads, rail, marshalling yards, utilitiesUpstream to Midstream to Downstream Cluster inter-linkages

FdP Associates © FdP Associates 2009 Page 31
Reference Case Concept Site Plan 2015-2020
Concept Site Plans

FdP Associates © FdP Associates 2009 Page 32
Realistic Case Key Plan Midstream Cluster 2015 - 2040
Concept Site Plans

FdP Associates © FdP Associates 2009 Page 33
Agenda
Contents
Approach to Study
Cluster Best Practice
Feedstock Scenarios
1
2
3
Market Supply/Demand4
Cluster Configurations5
Logistics & Infrastructure6
Concept Site Plans7
Socio Economic Analysis8
Cost Benefit Analysis9
Observations & Conclusions10

FdP Associates © FdP Associates 2009 Page 34
By 2040 under the Reference Case the Midstream Cluster could generate annual revenues of $ 4.7 billion and taxes of $350 million
Total investment is in period 2015-2020 with no additional growth envisaged
Cracker and derivatives provides 28% sales volumes but 69% revenues, 42% capex
Off gas availability (propylene) is utilised for polypropylene production
-
Incremental ethane/ethylene is used to supplement existing polyethylene and ethylene glycol facilities -
not as new investments
Impact on proposed CoE Cluster function of Cracker and derivatives investments
Proportion of syngas feedstock used to replace existing NG feedstock at established fertilizer production (Agrium) and for power requirements
Taxation includes income, corporation, land and property related taxes
Socio Economic Analysis
Sales Revenues Capex Jobs Land Use
Taxation Infrastructure
11.9 million
tonne pa
$4.7 billion pa
$11.4 billion
1125direct 886 ha
$353 million pa $1.2 billion
cumulative$8.5 billion cumulative

FdP Associates © FdP Associates 2009 Page 35
In the Realistic Case Revenues could reach $18.4 billion and taxes $1.15 billion per year
Majority of investment is in period 2015-2025 with additional growth envisaged
Cracker and derivatives provides 35% sales volumes but 65% revenues, 50% capex
Off gas availability (propylene) is utilised for polypropylene production
-
Incremental ethane/ethylene is used to supplement existing polyethylene and ethylene glycol facilities -
not as new investments but could be alternative cracker option
Major impact on proposed CoE Cluster function of Cracker and derivatives investments
Proportion of syngas feedstock used to replace existing NG feedstock at established fertilizer production (Agrium) plus new fertilizer investment and for power requirements
Taxation includes income, corporation, land and property related taxes
Socio Economic Analysis
Sales Revenues Capex Jobs Land Use
Taxation Infrastructure
33.4 million tonne pa
$18.4 billion pa
$35.4 billion
2353direct 2419 ha
$1.15 billion pa $2.3 billion
cumulative$18.9 billion cumulative

FdP Associates © FdP Associates 2009 Page 36
Agenda
Contents
Approach to Study
Cluster Best Practice
Feedstock Scenarios
1
2
3
Market Supply/Demand4
Cluster Configurations5
Logistics & Infrastructure6
Concept Site Plans7
Socio Economic Analysis8
Cost Benefit Analysis9
Observations & Conclusions10

FdP Associates © FdP Associates 2009 Page 37
The Cost Benefit is based on the cumulative revenue earned by Government against the investment in infrastructure to support the cluster
Cost Benefit Analysis
Investment and Revenues for the period 2015 -2040
Units Reference Case
Capex
for Infrastructure CAD $m 1,159
Tax from Land use and Infrastructure(Ʃ(tax
from land use, property tax, logistics and piperacks, services)
CAD $m 4,908
Corporation Tax CAD $m 3,252Personal Income Tax CAD $m 323Total Tax CAD $m 8,483Tax earned per CAD spent on Infrastructure (Capex) 7.32Assumes ROE of 1 for CAD:USD

FdP Associates © FdP Associates 2009 Page 38
The Cost Benefit is based on the cumulative revenue earned by Government against the investment in infrastructure to support the cluster
Cost Benefit Analysis
Investment and Revenues for the period 2015 -2040 Units Realistic Case
Capex for Infrastructure CAD $m 2,297
Tax from Land use and Infrastructure(Ʃ(tax from land use, property tax, logistics and piperacks, services)
CAD $m 9,872
Corporation Tax CAD $m 8,441Personal Income Tax CAD $m 547Total Tax CAD $m 18,861Tax earned per CAD spent on Infrastructure (Capex)
8.21Assumes ROE of 1 for CAD:USD

FdP Associates © FdP Associates 2009 Page 39
Agenda
Contents
Approach to Study
Cluster Best Practice
Feedstock Scenarios
1
2
3
Market Supply/Demand4
Cluster Configurations5
Logistics & Infrastructure6
Concept Site Plans7
Socio Economic Analysis8
Cost Benefit Analysis9
Observations & Conclusions10

FdP Associates © FdP Associates 2009 Page 40
Observations and Conclusions (1/3)
The Reference Case will enable only a modest Midstream cluster.
The Realistic Case provides for a significant cluster in global terms second only to Jubail Industrial City in scale
Upgrader offgases will not provide sufficient critical mass to support a stand-alone cluster
Petcoke provides a globally significant feedstock source which will elevate Alberta to one of the largest petrochemical based clusters worldwide with stranded feedstock economics (Realistic case)
A diversified gasification platform could provide energy, hydrogen, natural gas replacement for fertilizers and world-scale petrochemicals via MTO
Investment in refining will satisfy growing diesel demand and provide naphtha feedstock
Observations & Conclusions
FdP Associates © FdP Associates 2009 Page 41
Observations and Conclusions (2/3)
The North American chemical market provides a robust demand opportunity enabling a market share of ca. 30% of the incremental growth in demand to 2040 to be achieved
The cluster configurations for both the Cases are primarily driven by market demand in North America balanced against the feedstock supply.
The cluster configurations recognise that a single cluster producing ca 50 million tpa of final products cannot be viably organised into a single entity and the phasing will be required
The cluster configurations build in the principles of EID, making maximum use of integration and synergy opportunities within the cluster
Centralisation of logistics infrastructure, where it can easily be expanded with the growth of the cluster, leads to the most efficient operation
Observations & Conclusions

FdP Associates © FdP Associates 2009 Page 42
Observations and Conclusions (3/3)
Logistics services will be mostly outsourced in the cluster – preferably to more than one party for each activity
The petcoke logistics system presents some challenges, which will need to be addressed at an early stage by government
Rail is the primary transport mode for final products to market. Competitive movement of products is key to success
The socio-economic analysis, provides a realistic basis for further development of the Midstream Cluster.
Both the Reference and Realistic Cases provide the region with an attractive cost benefit opportunity (Reference Case limited)
Observations & Conclusions
FdP Associates © FdP Associates 2009 Page 43
If you require additional information about the contents of this
document please contact:
Name: Fred du PlessisTitle: PresidentPhone: +44 1865 784 080E-mail: [email protected]
FdP Associates Magdalen CentreOxford Science ParkOX4 4GAUnited KingdomPhone:
+44 1865 784 080Fax:
+44 870 460 1850