Alberta international trade review - archive.org
128
Alberta Economic Development Alberta International Trade Review - 2001 August 2002 Policy and Economic Analysis
Transcript of Alberta international trade review - archive.org

Alberta Economic Development
Alberta International
Trade Review - 2001
August 2002
Policy and Economic Analysis

Digitized by the Internet Archive
in 2014
https://archive.org/details/internationaltrade2001

Alberta
International
Trade Review2001


International Trade Review
Alberta International Trade Review 2001
Prepared by:
Alberta Economic DevelopmentPolicy and Economic Analysis Division
Telephone: (780) 427 - 6787
Telefax: (780) 427 - 0061
www.alberta-canada.com
August 2002

International Trade Review

International Trade Review
Table Of About the Data 1
Contents The Year in Review 2
Alberta Exports by Industry and Commodity 4Agriculture, Food and Beverages 6Mining 7
Manufacturing 8Forestry, Wood, Paper and Allied Products 1
1
Chemicals and Chemical Products 1
1
Computer and Electronic Products 12
Machinery 13
Refined Petroleum & Coal Products 14
Alberta Exports by Country and Region 15Alberta's Ten Largest Export Markets 15
Alberta Exports to Non-U. S. Regions 1
7
United States of America 18
Top US States 20Asia 21
Japan 22
China 23
South Korea 24Taiwan 24
Western Europe 25United Kingdom 26
Italy 27Belgium 27
Central America, Mexico and the Caribbean 28Mexico 29
Cuba 30
South America 31
Venezuela 32
Brazil 33
Middle East 34
Iran 35
Africa 36
Morocco 37
Algeria 38
Eastern Europe 39
Russia 40
Oceania 41
Australia 41

International Trade Review
Country Profiles 43
Algeria 45Argentina 46
Australia 47Austria 48Bangladesh 49Belgium 50Brazil 51
Chile 52
China, People's Republic 53
Colombia 54
Cuba 55Ecuador 56Egypt 57
Finland 58France 59
Germany 60
Ghana 61
Greece , 62
Guatemala 63
Hong Kong 64
India 65
Indonesia 66
Iran 67
Ireland 68
Israel 69
Italy 70
Japan 71
Kazakhstan 72
Korea, South 73Malaysia 74
Mexico 75
Morocco 76
Netherlands 77
New Zealand 78
Nigeria 79
Norway 80
Oman 81
Peru 82
Philippines 83
Russia 84
Saudi Arabia 85
Senegal 86
Singapore 87
South Africa 88
Spain 89
Sudan 90
Sweden 91
Switzerland 92
Taiwan 93

International Trade Review
Thailand 94
Tunisia 95United Arab Emirates 96
United Kingdom 97
United States 98
Venezuela 99
Yemen, Republic of 100
Appendices 101
Appendix A Standard Industrial Classification Codes (1 980) 1 03
Appendix B Country Export Summary, 1 994 - 1 998 1 04
Appendix C Country Summary by Industry 109
Appendix D US Exports by State 1 1
3
Appendix E Foreign Offices 114
Offices with Government of Alberta Representatives 114

International Trade Review
International Trade Review
About thG Data This publication provides a data source for Alberta's international trade, and is
intended to provide businesses with information on current export markets.
A profile is included for each country that imported over $10 million worth of
Alberta's goods in 2001 . Each profile lists the top 15 commodities Alberta exported
to that country and also compares them with Canadian exports. A summary of
export totals to all countries is included in Appendix B.
The trade commodity nomenclature used is the Harmonized Commodity Description
and Coding System (Harmonized System or HS), adopted by Statistics Canada in
1988.
Exports by geographic region, industry, and commodity are also provided in the
following sections. Industry Canada's regional groups are used. Industry groupings
are based on Statistics Canada's publication on concordance between export
commodity and industry classifications (see Appendix A). Whereas in previous
years the industry breakdowns were based on the Standard Industrial Classification
(SIC) system, in this issue the switch was made to the newer North American
Industry Classification System (NAICS). As a result, the industry estimates
presented in this issue of the International Trade Review are not fully comparable to
the estimates presented in previous issues.
For the purposes of this publication, six-digit HS codes are presented in the country
profile tables. For simplicity, some commodity descriptions accompanying these
codes have been revised from their standard format. Readers requiring the exact
content of a particular HS number are referred to the Customs Tariff Schedule of
Canada.
Statistics Canada is the main source of information for the publication. Estimates
for commercial and transportation service exports are based on special surveys
conducted by Statistics Canada. The informational captions appearing at the top
right corner of each country profile are from World Factbook 2002. The term "nes"
refers to "not elsewhere specified."
The term "exports" refers to "domestic exports," goods grown, extracted or
manufactured in Canada. The term includes goods of foreign origin, which have
been materially transformed in Canada and then re-exported.
Unfortunately, service exports cannot be included on a country specific basis since
these data are not presently available. However, these exports, including travel and
tourism, have been provided in the "Year in Review" section. Throughout the
remainder of this document, "exports" will refer strictly to merchandise exports.
For more information on Alberta's exports, contact:
Alberta Economic Development
Policy and Economic Analysis Division
4th Floor, Commerce Place
10155- 102 Street
Edmonton, Alberta, Canada T5J 4L6
Telephone: (780) 427-6787
Fax: (780)422-0061
Internet Address: http://www.alberta-canada.com
- 1-

International Trade Review
Alberta exported $62.3 billion worth of goods and services to more than 170
countries in 2001 . This total includes $56.9 billion in commodity exports and
$5.5 billion in service exports. Exports of goods and services increased by
2.1% in 2001, from $61.1 billion in 2000. Alberta was one of only three
provinces with higher exports in 2001 than in 2000. Canadian exports of goodsand services fell by 2.3% in 2001 , while global exports declined by
approximately 1%, as a result of the global economic slowdown and recessions
in a number of major economies, such as the US and Japan.
Commodity Exports
The value of commodity exports increased by 2.8% from 2000 to $56.9 billion in
2001 . Of the 175 countries Alberta exported to, the top markets were the United
States, Japan and China. The United States imported $50.6 billion worth of
goods, Japan $1 .3 billion and China $886 million.
The increase in Alberta's exports was due largely to higher prices for natural
gas and gas liquids, and to a lesser degree increased volumes of natural gas,
beef, oil and gas field equipment and petrochemicals.
Growth in Alberta exports was lower than in the previous year, partly as a result
of the global economic slowdown. On a global scale, the manufacturing sector
was in a recession, with production of Information Technology products downsharply. This negatively affected Alberta's exports of telecommunication
equipment, and also led to declines or lower growth for many other
manufacturing sectors. The events of September 1 1 further aggravated the
situation, and impacted world trade in both goods and services. After peaking in
2000 with growth of more than 12%, world trade volumes declined marginally in
2001.
Regionally, Alberta's major markets were the United States, Asia and WesternEurope. The United States accounted for 88.9% of total commodity exports,
Asia 6.0% and Western Europe with 1 .7%. Exports to the US, Africa, and
especially to Eastern Europe and Central America were higher than in 2000,
while exports to Asia, Western Europe, South America, the Middle East and
Oceania declined. Exports to the United States increased by 3.8% to $50.6
billion, but fell by 4.8% to $3.4 billion for Asia, and by 9.9% to $1 .0 billion for
Western Europe.
Commodity exports can be classified into three sectors: mining and energy,
primary agriculture, and manufacturing. The mining and energy sector
accounted for the majority of exports at $36.4 billion, followed by the
manufacturing sector at $16.7 billion and primary agriculture at $3.0 billion. In
2001,exports increased for mining and energy (up 6.8%) and primary
agriculture (up 1 1 .0%), but were lower for manufacturing (down 5.9%).
Service Exports
Service exports were estimated at $5.5 billion in 2001 , a decline of 4.4% from
2000. Included in this figure are $1 .3 billion in international travel and tourism
receipts and $4.2 billion in exports of commercial and transportation services.
Tourism exports declined sharply in the wake of September 1 1
.
The Year in
Review
-2-

International Trade Review
Unlike commodity exports, services cannot be included on a country specific
basis. Therefore, unless otherwise specified, the term "export" in the remainder
of this publication will refer strictly to commodities.
Market Influences
Some of the factors that influenced Alberta's 2001 trade include:
• weakest world economic growth since 1992, led by a recession in the USeconomylower economic growth in all regions
the first decline in world trade volumes since 1982
the events of September 1
1
continued weakness in Japanthe global high tech meltdown, affecting trade in telecommunication andcomputer equipment
the world-wide recession in the manufacturing industry
higher prices for natural gas and natural gas liquids
strong US demand for beef, electricity and petro-chemicals
weak prices for grains and oilseeds and for forest products
the US - Canada lumber dispute
a stronger US currency relative to the Canadian dollar
trend towards more local processing of Alberta beef cattle in the province

International Trade Review
Alberta
Exports byIndustry andCommodity
The value of Alberta's commodity exports in 2001 was $56.9 billion, an increase
of 2.8% over 2000. The increase is due largely to stronger gas and gas liquids
prices in the first part of 2001 , and increased export volumes of natural gas,
beef, oil and gas field equipment and petro-chemicals, especially to the U.S.
The growth rate in 2001 was the second lowest of the past ten years, and wasin large part the result of the global economic slowdown. The global
manufacturing sector, and the Information Technology (IT) products industry in
particular, were in a recession in 2001
.
Other ($0.8 billion)
Primary
Agriculture
($3.0 billion)
Chemicals
Food, Feed &Beverage
Electronic
Products
Paper & Allied
Products
Wood Products
Machinery
Ref. Petroleum
Other Mfg.
Alberta's exports are divided into three main sectors: mining, manufacturing andprimary agriculture. The mining sector accounted for $36.4 billion (64%) of
Alberta's commodity exports. This consisted primarily of natural gas and crude
petroleum at $21.6 billion and $12.6 billion, respectively. Mining exports were6.8% higher than in 2000, primarily a result of very high prices for natural gas
and gas liquids during the first part of 2001
.
The manufacturing sector accounted for $16.7 billion in exports, a decline of
5.9% from 2000. It was affected adversely by the recession in the global
manufacturing sector. Exports of computer and electronic products (mainly
telecom equipment) fell by 42%, refined petroleum products by 22% and of pulp
and paper by 16%. Strong performances were recorded by food, feed andbeverages (up 19%), machinery (up 40%) and transportation equipment (up
71%).'
Primary agricultural exports totaled $3.0 billion in 2001 , an increase of 11%.Exports of crops and livestock rose 3.4% and 35%, respectively. Major factors
for the increase in crops were higher exports of canola (up 14%) and durumwheat (up 12%), although exports of peas were down 30%. Grain exports rose
mostly as a result of increased prices, while exports of peas declined becauseof lower volumes. Live cattle and hogs exports were 39% and 30% higher,
respectively, mostly as a result of higher volumes.
-4-

International Trade Review
Alberta Exports by Industry, 1996 to 2001
Percent Percent
(b mil lions) Change Change
1996 1997 1998 1999 2000 2001 2000/01 1996/01
Primary Agriculture 3,303.6 3,146.9 2,829.9 2,381.4 2,703.8 3,000.8 11.0% -9.2%
Crops ' 2,461.9 2,397.9 2,011.5 1,797.6 2,052.8 2,122.2 3.4% -13.8%
Livestock 841.7 749.0 818.4 583.8 651 .0 878.6 35.0% 4.4%
Primary Forestry, Fishing & Trapping 6.7 4.8 9.4 20.6 29.0 8.6 -70.3% 29.3%
Mining & Energy 18,057.3 19,141.0 16,130.2 18,704.0 34 058 3 36 385 6 6.8% 101.5%
Crurip Oil R 14Q ? R 4R9 Q fi 714 9 7 R7Q 1/ ,D/ 57. 1 4 R7R R 10 fi1 9 9 .1 c 90/ DH.O /o
Natural fia^ & Natural fia^ I inuirte 9 740.8 r ^7n 1 1 n DQ7 n 1 R 4R4 D 99 QQQ 1575757. I
94 4% 1 4%I JJ.4 /o
Sulnhur 310.9 31 ) 8 238.9 263.5 9^ 7 -tt R%.JJ.O /o
Coal 4 JjO 3 "37Q 4O / 57.*+ T R%O.O /o -9Q 9%
Othpr MininnV—/ LI ICI IVIII III IU 1jj. i41 Q fi1 4 RQ R ^4 1OH. 1
"}Q R057.0 -9R 4%I O.O /o
ciecinciiy Cl Clu.u U.U 1 o U.o b.o tL\Jo. 1 n/a n/a
Manufacturing 9,812.6 10,709.0 11,434.9 12,797.5 17,704.3 16,666.0 -5.9% 69.8%
Chemicals 2,810.7 2,784.0 2,383.9 2,563.7 3,488.3 3,751.2 7.5% 33.5%
Computer & Electronic Products 1,258.6 1,288.9 1,588.5 2,044.9 4,530.3 2,611.6 -42.4% 107.5%
Electrical Equipment, Appl. & Comp. 68.7 78.2 108.8 135.4 186.7 248.3 33.0% 261 .4%
Fabricated Metal Products 189.8 219.1 272.0 275.0 322.1 344.0 6.8% 81.3%
Food, Feed, Beverages 1,373.1 1,686.6 1,849.7 2,099.9 2,532.1 3,001.8 1 8.6% 1 1 8.6%
Furniture & Allied Products 192.0 255.1 301.8 341 .1 410.1 350.0 -14.7% 82.3%
Machinery (excl. Electric/Transport) 557.5 611.0 942.9 648.6 908.4 1,267.5 39.5% 127.4%
Non-Metallic Mineral Products 66.9 85.2 98.6 135.8 163.8 148.5 -9.3% 122.0%
Paper Products & Wood Pulp 974.9 1 ,252.7 1 ,400.8 1 ,502.5 1 ,877.6 1 ,577A -16.0% 61 .8%
Plastics 94.1 138.8 180.5 217.0 245.7 243.7 -0.8% 158.8%
Prim^rv Mptal PrnHurt^[Mil ICI I y ivicicii r i uuulio 526.1 563.9 474.0 427.6 434.3 451 .0 3.9% -14.3%
Refined Petroleum & Coal Products 467.8 398.1 337.4 428.5 805.3 627.7 -22.1% 34.2%
Transportation Equipment 133.4 117.6 170.6 322.5 348.3 596.6 71.3% 347.4%
Wood Products 975.1 1,100.2 1,177.6 1,520.0 1,310.0 1,296.8 -1.0% 33.0%
Other Manufacturing 124.0 129.4 147.7 135.1 141.5 149.9 6.0% 20.9%
Other Exports 518.2 480.1 605.7 701.9 836.0 803.5 -3.9% 55.1%
Total Goods Exports 31,698.4 33,481.7 31,010.2 34,605.4 55,331.5 56,864.5 2.8% 79.4%
Travel & Tourism1
1,098.0 969.7 1,197.2 1,306.3 1,454.0 1,300.0 -10.6% 18.4%
Commercial & Transportation Services1
2,886.1 3,180.8 3,762.9 3,820.1 4,279.4 4,181.5 -2.3% 44.9%
Total Services Exports1
3,984.1 4,150.5 4,960.1 5,126.4 5,733.4 5,481.5 -4.4% 37.6%
TOTAL EXPORTS 35,682.5 37,632.1 35,942.9 39,731.1 61,064.8 62,346.0 2.1% 53.7%
1 Estimate.

International Trade Review
The combined export value of primary agriculture, and food and beverages (agri-
foods) was $6.0 billion in 2001 . Primary agricultural exports increased by 11%to $3.0 billion, and exports of food and beverages by 19% to $3.0 billion. Theleading agri-food exports were beef products at $1 .7 billion, wheat (including
durum wheat) at $1 .2 billion, and cattle at $71 3 million.
The increase in beef exports was a result of greater demand from the United
States and especially from Mexico, the increased slaughtering capacity in
Alberta, and higher prices. The value of beef exports increased by 20%, from
$1 .4 billion to $1 .7 billion. Pork exports rose 21 % to $220 million, as prices were
up sharply. Exports of vegetable fats and oils, mostly canola oil, cake and meal,
fell by 11% to $254 million, because of a very large decline in shipments to HongKong.
Although export volumes declined, stronger prices caused a 3% increase in the
value of wheat and durum wheat exports, compared to 2000. Wheat exports to
Iran, the top importer of Alberta wheat, Iraq and Algeria were sharply lower, but
wheat imports by the US, Japan, Mexico and the Philippines increased strongly.
Live cattle exports to the US rose 39%, mainly because of higher volumes.
Exports of canola and other oilseeds increased by 12% to $466 million, because
of higher prices and volumes, especially to China.
Alberta's Major Agricultural Exports(including Food & Beverage Manufacturing)
2000 2001 Percent
($ '000) ($ '000) Change
Beef products 1,429,063 1,721,031 20.4%
Wheat/durum 1,192,441 1 ,230,824 3.2%
Cattle, live (includes bison) 513,106 712,690 38.9%
Oil seeds (canola, mustard seed, flaxseed) 415,743 465,777 12.0%
Vegetable fats & oils (e.g. canola oil & cake) 285,624 254,047 -11.1%
Pork products 181,325 219,812 21 .2%
Other grains (barley, oats) 167,863 182,139 8.5%
Frozen foods (potatoes) 153,067 158,519 3.6%
Malt & flour milling 115,586 148,904 28.8%
Swine, live 92,402 123,670 33.8%
Raw hides & skins 85,296 120,810 41 .6%
Peas & beans 131,792 111,019 -15.8%
Forage products (hay, alfalfa) 75,884 80,422 6.0%
Total Above 4,839,192 5,529,663 14.3%
TOTAL AGRICULTURE, FOOD &BEVERAGES 5,235,883 6,002,638 14.6%
54% of agri-food exports went to the United States ($3.2 billion), mostly in the
form of beef products ($1.3 billion) and cattle ($713 million). Other major agri-
food markets were Japan, Mexico and China at $793 million, $414 million and
$297 million, respectively.
Agriculture,
Food andBeverages
- 6 -

International Trade Review
Mining exports in 2001 were valued at $36.4 billion compared to $34.1 billion the
year before. Major factors behind this 6.8% increase were a $4.5 billion increase
in the value of natural gas, as both prices and volumes increased, and to a lesser
degree a large increase in electricity exports.
The 26% increase in the value of gas exports occurred mostly because of higher
prices (up 18%), especially in the first part of 2001,although volumes shipped
also increased (up 7%). The 15% decrease in the value of crude oil exports
occurred as a result of a combination of lower prices (down 12%) and volumes(down 4%). Petroleum gas exports rose marginally as higher prices offset lower
volumes.
Exports of coal increased by 4% on the strength of higher prices. The major coal
markets were Japan ($128 million) and South Korea ($103 million). The US also
became a major importer of Alberta coal in 2001 , with shipments more than
doubling to $61 million. California's electricity crisis turned Alberta into anexporter of electricity in the first half of 2001
.
Alberta's Major Mining Exports
2000 2001 Percent
(S 000) (S 000) Change
Natural gas 17,135,916 21,638,241 26.3%
Crude petroleum 14,878,765 12,612,250 -15.2%
Petroleum gases, liquefied: 1,347,996 1.360,850 1 .0%
Propane, liquefied 793,771 1,141,379 43.8%
Butanes, liquefied 173,696 121,285 -30.2%
Other, liquefied 380,529 98, 186 -74.2%
Coal 379,432 393,203 3.6%
Electricity 6,286 203,651 n/a
Sulphur 255,745 137.523 -46.2%
Total Above 34,004,140 36,345,718 6.9%
TOTAL ALL MINING 34,058,284 36,385,566 6.8%
The majority of Alberta's mining exports went to the United States, consisting
mostly of crude petroleum, natural gas and propane. Nearly 99% was imported
by the United States, while the rest was imported primarily by Japan, South
Korea, Brazil and China.
Mining

International Trade Review
Manufacturing Because of the manufacturing sector's global recession and the high tech
meltdown, manufactured exports fell by 5.9% to $16.7 billion, mostly because of
lower volumes. Most of the decline was volume related. Exports of
telecommunication equipment fell by more than 40% between 2000 and 2001
.
Yet, because of strong growth in the years prior to 2001 , the telecom sector's
export value is still more than double the 1 996 value. Export volumes of refined
petroleum also declined. Lower prices caused the export values of wood pulp
and most chemicals to drop. Exports of lumber, oriented strand board (o.s.b.),
beef and oil and gas field equipment increased sharply.
This sector, which accounted for 29% of all commodity exports in 2001 , has seen
its exports rise 70% since 1996.
Of the 15 industries that comprise this sector, eight increased their export value
compared to 2000. Significant gains occurred in transportation equipment (up
71%), machinery (40%), electrical products (33%), and food, feed and beverages
(19%). Exports of computer and electronic products, mostly telecom equipment,
declined 42%. Other industries with significant declines include refined
petroleum products (down 22%), paper and pulp (16%) and furniture (15%).
Because of the more than 40% decline in the value of telecom equipment
exports, computer and electronic products dropped from being Alberta's largest
sub-sector in 2000 to third largest in 2001 with exports of $2.6 billion. Thechemical industry regained the top spot with exports of $3.8 billion, followed by
food, feed and beverages with $3.0 billion. The other sub-sectors with exports in
excess of $1 billion were paper and pulp ($1 .6 billion), wood products ($1 .3
billion) and machinery ($1.3 billion).
2000 2001 Percent
Manufacturing Industries ($ '000) ($ '000) Change
Chemicals 3,488.3 3,751.2 7.5%
Computer & Electronic Products 4,530.3 2,611.6 -42.4%
Electrical Equipment, Appl. & Comp. 186.7 248.3 33.0%
Fabricated Metal Products 322.1 344.0 6.8%
Food, Feed, Beverages 2,532.1 3,001.8 18.6%
Furniture & Allied Products 410.1 350.0 -14.7%
Machinery (excl. Electric/Transport) 908.4 1,267.5 39.5%
Non-Metallic Mineral Products 163.8 148.5 -9.3%
Paper Products & Wood Pulp 1,877.6 1,577.4 -16.0%
Plastics 245.7 243.7 -0.8%
Primary Metal Products 434.3 451.0 3.9%
Refined Petroleum & Coal Products 805.3 627.7 -22.1%
Transportation Equipment 348.3 596.6 71 .3%
Wood Products 1,310.0 1,296.8 -1.0%
Other Manufacturing 141.5 149.9 6.0%
TOTAL MANUFACTURING 17,704.3 16,666.0 -5.9%
The major manufactured commodity exports in 2001 were beef, wood pulp,
telecom transmission apparatus, polyethylene and lumber. Collectively, these
accounted for more than one third of all manufactured products.
- 8 -

International Trade Review
Alberta's Major Manufacturing Exports2000 2001 Percent
(S '000) (S '000) Change
Telephone apparatus 3, 904, jo4 i ,yio,o5i r/l AO-bu.y
i rdr ibrnission apparatus 1 ,0<lU,by 1 1 ,Uo<;,b<£D -4U.D /o
_ 1 s~\ r~\n /~\ r^Q C\Afi + /-»r>ir"\/"i o r~\ r"\ *~\ rolli cieprione swiicning apparaius 1 ICQ Q O 1 /i /1 7 00c44 1 , JJD CQ OO/-oy.j '0
i aiib for iciepnone systems/apparatus OCC 71 A. 07 AO/
LJtftzfl fJIUUUUlZ) 1 AOQ nfzi1 ,Ht?i), L/OJ 1 7Q 1 no
1
1 , / c 1 , UJ /OA ><0/£ U. H /o
_ RAnolocc hoof froch r\r ^KilloHdui icicob uct;i, iicbii or cniiioQ Q1Q yl 1 7 1 1 QA yl QA OR A°/CO. 1* /o
Dt?t?i, uone in, Tresn or cniueo <;4<;,uoo OC£5 AQA Q QO/y.y to
rrL/UU fJUIfJ / , O /<C, UU 1 \ ,OU/,HOH 01 Q°-c 1 .0 /o
OF 1 UFI lludl WOOO pUip i ,^yo,H i j 1 A/1Q A1 1 1 Q 0°
oerni-onernicdi wood puip J/U,DO*l OCA 01 00/-J I .J /o
oyrnrieiic resins onn C7fi7 ,CI C,OOD AO QO/hc. y /o
L) /-> |\/nth\/loaa"oiycinyiene D /U,hUJ QQO QQAoyj.oyu 00 0°/JJ.J /o
- Pnlvmpr^ nf pthvlpnp noc 00,00 1PRR fi%
Ornan/A /,/iom/A*o/oKSfyctl IILr isfl&fiiiUalS 1 .u 1 j, yjo 1 1fZR OC7/ , 1 OO,cu / / O.^c /o
one 790jy o. / ^0 AQO 07C:m3c,c/ 91 Q /i .y 10
- F-th\/lpnp nl\/r*nli_ i! i y itr
i 1 1: uiyi^*ji 7 ^%1 .0 10
L.UI 1 lUUI ctllU Ulflttf SaWliiUI fJlUUUCIS / CO, HOU U. J /o
LUI 1 lUcl RQ1 7"^RD3 I , / JD RRR QAR .A 40/
rieiineu peiroieurn prooucis fOH,£L£l 1C07 OQOoy/,jyj QO QO/
-il J. /o
- Pptrnlpi im nilQ p n HipcpI flip! anH fnpl nil ujo,d / <y 4RR ^Rfl -PR fi%co.u /o
reirO'Cneruicais OOU,o 1 1^1/1 1 07 QQ QO/-cc.c /o
- oiyrene C 1 C C ( QO I D,D IS 4R1 c;R7 1 A CO/- 1 U .O /o
reriitizers con CQA AQO QIChob, yjo QQ C P,
i cd P44 R«7 .01 qo/1 . j
A nhv/Almi ic qmmAniaMiiiiyoroub diiiiiioiiid 1 Q7 1 R1 1 RT DQP -7 1 °Lf . 1 /o
C" r~\n t r~\aara ri m/aaH rxmrit iftccnyuictficu wvuu fjiuuuisis ARK mi AAP AQAC7. L/ /O
- orienieu sirano Doara <jHc,<3etc OAC, 1 AF,J^fD, I 'tQ 1 p n°/
Wireless communication & radio/TV broadcast equip. oaq onv ICQ OQ7JOO,CO 1 /4 7 ^0/HI .H /o
_ Parte fnr trancmiccinnratio 1UI U dllbl l HbblUI I
pop opc riAO c;cq 47 1 %*T / . 1 /O
Oil and gas field machinery 1 77 nOQ1 / /,Uci) O-f O OAOJ ; J,Jfo 77 n°1 1 .U /o
- nans Tor Donng or sinking macmnery /'f.ilJOOA7 ODC/lU / . COO 1 7Q 9°/
1 / y. c 10
Vegetable fats and oilsope CO.4coo, OcH OCA DA7COH,UH / - 1 1 . 1 /o
- Canola cakG and meal 11/1 7/1
1
1 AR 400 7 QO/- 1 .c 10
r^onola nnn1 rriiie+arH cqqH nil- oanoid dnu rriusidru bt?t?u on QP P^R<3c,COO 'X 00/O.O/o
nor nrnW/zz-'/cr dfJUl fJlUUUUtO 1 OW, v7«_JL/ C^C ,\J/J yjo.
- Newsprint 1 Qc; odd O.Q QO/oo.y /0
Ljnice lurniiure pog czonC\JJ, 00\J -PI 1%C 1,1/0
- vvoooen ottics lurniiurc I H, C7UU 1 A1 7 -PR R%^-O.O /o
A/aa. rrn / ic mofa/c 237, /64 -0. 7°o
- iNlCrxclppt; 40c; pi q 4.0aC 1 3,tOO -? fi%^.0 /o
Paper products / ou, yju OAO H7Qctc,U/i) 00.0/0
Mauicnn nt- INcWbpNNl 1 , Jjj 1 PRR1 ?J,LOO ^R Q%OO . Sj /O
Pork products 1fl1 90c1 £5 / , OcO Q1 Q O-f Oc 1 i),o 1c Q1 QO/c I .e
- Pork, nes, fresh or chilledQC 07DDO, £1 to 1 AC 7>1 A OA AO/
Pumps and compressors mn Rao. Q1 Q Ofi 1C 1 C,CO 111/1 QO/
- Air or gas pumps or compressors on oaqju,juy RO OCQ00,000 1 1 A 70/1 1 U. / /o
- rumps Tor nquius ana pans inereoi 64,007 123,779 yo.*+ 10
Navigational, measuring and control instruments 160,031 212,099 32.5%- Surveying instruments and appliances, nes 15,190 35,884 136.2%- Gas or smoke analysis apparatus 26,556 34,609 30.3%
Offter industrial machinery 217,681 201,667 -7.4%
- Machinery and appliances with individual functions 75,163 81,997 9.1%
Total Above 14,452,559 12,878,199 -10.9%
TOTAL ALL MANUFACTURING 17,704,334 16,666,003 -5.9%
nes: not elsewhere specified
-9-

International Trade Review
Commodities with strong growth in 2001 include:
- boneless beef (up $261 million, or 28%)- polyethylene (up $223 million, or 33%)- parts for boring or sinking machinery (up $1 33 million, or 1 79%)- ethylene polymers (up $1 1 1 million, or 287%)- parts for wireless transmission (up $1 1 million, or 47%)- trucks with a GVW in excess of 20 tons (up $1 08 million, or 1 69%)All of these commodities were exported primarily to the United States. China
also was a large customer for Alberta's polyethylene and ethylene polymers, and
parts for boring or sinking machinery were shipped to a large number of other oil
and gas producing nations.
A total of $12.7 billion of manufactured commodities was imported by the United
States. This represents 76.3% of all manufacturing exports and a decline of $0.9
billion or 6.5% from 2000, mainly because of much lower exports of telecom
equipment and refined petroleum. The chemicals, food, feed and beverages,
transportation equipment and machinery industries had strong export growth.
The U.S.' largest three manufacturing sectors in 2001 were: chemicals ($3.0
billion), computer and electronic products ($2.3 billion), and food, feed and
beverages ($2.0 billion).
Other major markets were in Asia: Japan ($755 million), China ($581 million),
and South Korea ($322 million). Manufacturing exports to Japan were down 3%,as lower exports of wood pulp and cobalt more than offset increases for pork,
malt and alfalfa meal and pellets. Exports to China increased 17%, because of
large increases in exports of wood pulp and ethylene glycol. South Korean
imports of manufactured goods from Alberta were nearly 28% lower in 2001 than
in the previous year, because of large decreases in wood pulp, beef and styrene
imports. Taiwan is also a major market for Alberta's manufacturing sector, and
has increased its imports of telecom equipment substantially during the past
three years. Overall, food, feed and beverages, and paper and pulp were
Alberta's largest manufacturing export sectors to Asia.
Alberta's largest European Union markets for manufactured goods were: Italy
($146 million), the United Kingdom ($123 million), the Netherlands ($108 million),
and Germany ($101 million). For Italy, the U.K. and the Netherlands the largest
manufacturing import was nickel, and for Germany wood pulp.
Mexico's manufacturing imports from Alberta rose strongly by 59% to $307million, as a result of a surge in beef imports. Over the past two years, Mexico's
beef imports from Alberta have more than quadrupled to over $200 million.
Other countries that also have significantly higher imports of manufactured goods
include Russia and Norway (oil and gas field equipment), and Sweden (wood
pulp).
- 10 -

International Trade Review
Overall, forestry products totaled $2.9 billion in 2001 , a drop of 10.4% whencompared to 2000. Most of the decline came from a 22% decrease in woodpulp, as a result of lower prices. Shipments of lumber were largely unchanged(-0.4%) as higher volumes offset a decline in prices. Oriented strand board
(o.s.b.) exports fell, mainly because of lower prices, and newsprint shipmentsrose on the strength of higher prices.
Alberta's Major Forestry Exports(includes Wood, Paper and Allied Products)
2000 2001 Percent
($ 000) ($ 000) Change
Wood pulp 1,672,001 1 ,307,434 -21.8%
Lumber 691,736 688,945 -0.4%
Oriented strand board 392,342 345,146 -12.0%
Newsprint 140,593 195,288 38.9%
Fibreboard 45,263 56,901 25.7%
Builders' joinery and carpentry 52,533 44,596 -15.1%
Total Above 2,994,468 2,638,311 -11.9%
TOTAL ALL FORESTRY 3,216,585 2,882,760 -10.4%
The primary markets for wood pulp were the United States ($554 million), Japan
($207 million) and South Korea ($172 million). Pulp exports to these three
markets fell by 18%, 29% and 24%, respectively, as a result of lower prices.
O.s.b. was primarily imported by the United States, accounting for about 95% of
the total. Even though the US increased the volumes of o.s.b. imported, lower
prices caused a decline in the value of this commodity.
The value of lumber exports fell by 0.4% in 2001 , as a result of a 31 % decline in
lumber exports to Japan. The US, which accounts for more than 90% of Alberta
lumber exports, increased lumber imports by 3.2%, as volume increases morethan offset lower prices.
Major markets for forestry products were the United States ($2.1 billion), Japan
($272 million) and South Korea ($173 million).
Chemicals The value of chemical exports increased by 7.5% to $3.8 billion, as prices andespecially volumes increased. Volumes increased significantly for polyethylene,
acyclic ethers and ethylene polymers. Commodities with higher prices include
ethylene glycol, polyvinyl chloride, styrene and urea.
Although prices were lower in 2001 , the value of polyethylene, Alberta's largest
chemical export, increased by 33% to $893 million because of higher volumes.
The value of polyethylene exports to the United States rose 72% to $780 million
as a result of higher demand, especially in Connecticut. Exports to China fell
40% to $75 million.
Exports of acyclic ethers advanced 22% to $482 million, as volumes increased
by about 28%. All of theses exports were destined for the U.S.
Styrene exports declined by 10% in 2001 to $462 million, because of lower
volumes. Shipments to the U.S., the only market for Alberta styrene in 2001 , fell
by less than one percent. Styrene was exported to South Korea, Singapore andTaiwan in 2000, but no exports were reported for 2001
.
Forestry,
including
Wood, Paperand Allied
Products
- 11 -

International Trade Review
Alberta's Major Chemicals Exports2000 2001 Percent
(S '000) f« '000}1 W WWW / Chanae
r oiyeinyiene C7n Ant poo onn 00/
Moyciic einerb OQC 700 /1QO 07R 91 Q '
Olyi cl ic 4R1 RR7I U .Q /O
cinyiene giycoi 7( .O /o
1 IrpQ ?44 R87 -T1 9%O 1 /o
Ml 11 lyill UUo allMllUMIa 1Q71 O J,UJii -7 1%
rUiyillcio Ul cLI lylt;! Itr, tlfcJo OO.OO I9RR fi°/„
MltlTICIal Tiiameni LOW 1 t 1 ,^*f / C..O lo
Ethylene-vinyl acetate copolymers 114,231 104,863 -8.2%
Polyvinyl chloride 46,915 93,282 98.8%
Methanol 63,714 60,614 -4.9%
Total Above 2,948,851 3,255,179 10.4%
TOTAL ALL CHEMICALS 3,488,262 3,751,188 7.5%
Exports of ethylene glycol rose 8% to $436 million, as exports to China increased
by 26% to $209 million and to the US by 72% to $120 million. Exports of urea,
all of which is sent to the US, fell 32% to $245 million, as volumes dropped by
41%.
Major markets for chemicals were the United States ($3.0 billion), China ($404
million), South Korea ($73 million) and Taiwan ($45 million).
Because of the global high tech meltdown, Alberta's exports by the computer and
electronic products industry, mostly telecom equipment, fell by 42% in 2001 to
$2.6 billion, from $4.5 billion in 2000. Despite the sharp decline in 2001
,
Alberta's exports of computer and electronic equipment have more than doubled
since 1996.
Exports of telephone apparatus fell by more than one-half to $1 .9 billion,
because of lower US demand. Wireless communication equipment exports rose
47% to $368 million, as the US increased its imports by one-half. Exports of
navigational, measuring and control apparatus (e.g. surveying instruments and
gas or smoke analysis apparatus) rose 32% to $212 million, also because of
increased US demand.
The United States accounted for $2.3 billion or 87% of Alberta's computer and
electronic product exports, with more than half going to the state of New York.
Other major destinations include Taiwan with $58 million, the UK with $32 million
and Hong Kong with $31 million.
Computer andElectronic
Products
- 12 -

International Trade Review
Alberta's Major Computer & Electronic Product Exports2000 2001 Percent
(S '000) fS '000) Change
Telephone apparatus 3,904,364 1,916,851 -50.9%
Transmission apparatus 1,820,597 1,082,625 -40.5%
/ GiGpnone sgis "7i OOCZ/ 7 , obfD / 7 ,0/0 n AO:V.H /o
Parts 367.204 266,710 -27.4%
Switching apparatus 1,458,821 447,335 -69.3%
Wireless communication and radio/TV
broadcast equipment:
Parts for transmission, radar/radio and
249,807
232,825
368,287
342.569
47.4%
47.1%reception apparatus
Navigational, measuring and control
instruments160,031 212,099 32.5%
Surveying instruments/appliances & parts 18,587 43,979 136.6%
Magnetic and optical media 59,777 33,319 -44.3%
Computers and peripheral equipment 112,573 52,425 -53.4%
Total Above 4,486,552 2,582,981 -42.4%
TOTAL ALL COMPUTER & ELECTRONICPRODUCTS 4,530,342 2,611,608 -42.4%
Machinery In 2001,exports of machinery products grew strongly for the second year in a
row. Last year, they were 40% higher than in 2000 at $1 .3 billion, mostly as a
result of strong demand for oil and gas field equipment. Exports to the U.S.
increased by 29% to $752 million, mainly because of strong growth in exports of
air and gas compressors and pumps and of parts for boring and sinking
machinery. In 2001,exports of machinery to Russia rose strongly to $68 million,
while exports to Venezuela increased marginally to $43 million, both as a result
of higher sales of oil and gas field equipment.
Exports of oil and gas field machinery, mainly boring and sinking machinery and
parts thereof, increased 77% to $313 million, mostly as a result of strong demandgrowth in the US, Yemen, Venezuela and Mexico. Exports of pumps and
compressors, also used by the oil and gas sector, more than doubled to $212million, because of large gains in the US and China. Although exports to Russia
more than doubled, lower demand in the US and Venezuela resulted in exports
of other industrial machinery, much of which is also energy related, to drop by
7%.
The United States accounted for 59% of machinery exports, down from 64% in
2000, as most other major markets posted stronger growth. Besides Russia and
Venezuela, other markets also include China, Yemen, the United Kingdom,
Singapore, Norway, Mexico, the United Arab Emirates and Kazakhstan (each
importing more than $15 million).
- 13-

International Trade Review
Alberta's Major Machinerv Exports
($ '000)
^UU I
($ '000)
Kercenx
Change
Oil and gas field machinery 177,029 313,308 77.0%
Parts for borinq or sinkinq machinery 74,238 207,285 1 79.2%
Pumps and compressors 100,659 212,261 110.9%
Pumps for liquids & parts thereof 64,007 123,779 93.4%
Air or qas pumps or compressors 30,309 63,868 110.7%
Other industrial machinery 217,681 201 ,667 -7.4%
Machinery & appliances w. individual functions 75,163 81,997 9.1%
Parts for mach. & appl. w. individual functions 50,003 63, 131 26.3%
Engine, turbine and power transmission equipment 125,060 170,234 36.1%
Engines and motors & parts therof 95,566 130,461 36.5%
Material handling equipment 60,482 97,317 60.9%
Parts for lifting, loading and handling machinery 24,217 59,599 146.1%
Ventilation, heating, air-conditioning & commercial
refrigeration equipment
Air conditioning machines
63,887
27,141
92,975
36,508
45.5%
34.5%
Agricultural implements 46,327 56,350 21.6%
Machinery for preparing animal feed 11,156 72,675 73.7%
Other general purpose machinery
Machinery for treatment of materials by changeof temperature, nes
43,182
70,465
51,289
16,383
18.8%
56.6%
Total Above 834,307 1,195,402 43.3%
TOTAL ALL MACHINERY 908,355 1,267,499 39.5%
Refined
Petroleum &Coal Products
Exports of refined petroleum and coal products were valued at $628 million, a
decline of 22% from 2000. This decrease was the result of both lower prices andlower volumes.
Petroleum oils (such as diesel fuel and fuel oil) accounted for 75% of the
industry's total exports. The United States accounted for 99.9% of all refined
petroleum and coal product exports.
Alberta's Major Refined Petroleum & Coal Products2000 2001 Percent
($ 000) ($ '000) Change
Petroleum oils, e.g. diesel fuel and fuel oil 656,679 468,588 -28.6%
Ethylene, propylene, butylene and butadiene, liquefied 73,547 87,477 18.9%
Petroleum bitumen 42,005 37,804 -10.0%
Paper & paperboard coated with tar bitumen/asphalt 7,348 14,737 1 00.5%
Articles of asphalt, nes 3,960 1 1 ,524 191.0%
Total Above 783,539 562,970 -28.2%
TOTAL REFINED PETROLEUM & COAL PRODUCTS 805,276 627,674 -22.1%
- 14 -

International Trade Review
Making up 88.9% of Alberta's exports in 2001 , the United States (US) is
Alberta's largest export market. Exports worth $50.6 billion were shipped fromthe province to the US in 2001
,up 3.8% from the year prior. Fueling much of
this growth was higher natural gas sales, which benefited from higher prices
in 2001 , and more than offset the decline in oil exports.
Canadian exports to the U.S. dropped by 2.7% in 2001 , as shipments of
motor vehicles and parts - the country's largest export sector - declined along
with forestry, computer and telecom shipments. Alberta, Nova Scotia andNew Brunswick bucked the trend in 2001
,being the only provinces to register
positive export growth to the US. By outperforming the nation in exports for
the third year in a row in 2001 , Alberta improved its share of total Canadianexports by one percentage point to 15.6%.
Alberta's Ten Largest Export Markets
2000 %of 2001 % of % Change
(S'000's) Total (S'OOO's) Total 2000/01
United States 48,731,981 88.1% 50,565,744 88.9% 3.8%Japan 1,340,936 2.4% 1 ,283,842 2.3% -4.3%
China 771,422 1 .4% 886,476 1 .6% 14.9%
Mexico 356,051 0.6% 481,484 0.8% 35.2%Korea, South 567,391 1 .0% 462,226 0.8% -18.5%
Taiwan 235,541 0.4% 210,982 0.4% -10.4%
United Kingdom 198,325 0.4% 176,280 0.3% -11.1%
Italy 192,429 0.3% 174,934 0.3% -9.1%
Iran 203,311 0.4% 162,783 0.3% -19.9%
Belgium 153,204 0.3% 119,392 0.2% -22.1%
Total Above 52,750,590 95.3% 54,524,144 95.9% 3.4%
Total All Countries 55,331,452 1 00.0% 56,864,491 1 00.0% 2.8%
While the value of Alberta exports to the US grew in 2001 , the province's
shipments to the rest of the world declined by 4.6%, partly reversing last year's
gain of 19%. Lower exports of wood pulp and other products, such as computer
and telecom equipment, organic chemicals and plastics contributed mainly to
the decline, more than offsetting the increases in wheat, barley, beef and pork,
and oil and gas field equipment.
Most of Alberta's largest non-US markets reduced their imports of Alberta goods
in 2001,although there was strong export growth to NAFTA partner Mexico and
to China, one of the world's fastest growing economies.
• With Japan still mired in a recession, Alberta exports to the country
remained weak, falling 4.3% to $1.3 billion in 2001 . Nevertheless, Japan
remained Alberta's second largest market.
• Strong export growth to China continued in 2001,reaching 15% following a
near 40% upswing in 2000. With exports valued at $886 million, China wasAlberta's third largest market for the fourth straight year.
Alberta
Exports byCountry
- 15 -

International Trade Review
• On the strength of higher beef shipments, Mexico, another fast growing
market for Alberta goods, increased its imports by 35% to $481 million in
2001,pushing the country ahead of South Korea as Alberta's fourth largest
market.
• Following strong gains in 2000, South Korea reduced its Alberta imports by
19% to $462 million in 2001
.
• Taiwan imported $21 1 million worth of Alberta goods in 2001 , a 1 0% decline
from the year prior.
• The United Kingdom remained Alberta's seventh largest market in 2001
,
despite reducing its Alberta imports by 11% to $176 million.
• Nearly $175 million in Alberta exports were shipped to Italy in 2001 , 9% less
than in 2000.
• Exports to Iran dropped by 20% to $1 63 million in 2001 , led by lower
shipments of wheat.
• Although exports to Belgium fell by 22% to $1 1 9 million, the country
became one of Alberta's top ten markets for the first time since 1 996, mostly
because of a sharp reduction in exports to Hong Kong and Germany.
Among Alberta's top ten markets, Iran had the largest share of its Canadian
imports originating from Alberta in 2001
.
Alberta's Share of Canadian ExportsTop 10 Alberta Markets - 2001
Iran|
|33.8
S.Korea|
23.7
China|
1 22.6
Taiwan|
121.9
Mexico|
20.5
Japan|
|15.9 o/o
U.S.|
115.6
Italy|
11.3
Belgium|
I 6.5
U.K.| |
3.8
Overall
- 16-

International Trade Review
Alberta
Exports byNon-U.S.
Region
Alberta's export performance in 2001 varied considerably by region. Exportswere up in Eastern Europe and Central Europe and, to a lesser extent, in the
US and Africa. However, they were down in all other regions, most significantly
in Oceania and South America.
Asia, hit especially hard by the global economic slowdown, reduced its
Alberta imports by 4.8% to $3.4 billion in 2001 . Asia is Alberta's secondlargest regional market, accounting for 6.0% of the province's exports.
Western Europe was the destination for another 1 .7% or $988 million of
Alberta's exports in 2001 , a 9.9% decline from the previous year.
Central America, consisting primarily of Mexico, replaced South Americaas Alberta's fourth largest regional market in 2001 . Exports to the region
rose by 21% to $592 million - the largest increase of all regions.
Exports to South America were down by 1 7% to $435 million in 2001 , with
particularly large declines in Argentina and Chile.
The Middle East took in $426 million worth of Alberta goods in 2001 , a
level very similar to the previous year.
Exports to Africa also held fairly steady at $241 million in 2001
.
Eastern Europe continues to be one of Alberta's fastest growing regional
markets; exports to the region increased for the second straight year, by
18% to $132 million.
Lower export levels to Australia caused the value of Alberta's exports to
Oceania to fall 36% to $92.3 million.
Alberta's Exports by Region
(S'OOO's)
2000 %ofTotal
2001
(S'OOO's)
% of % Change
Total 2000/01
United States
Asia
Western Europe
Central America
South America
Middle East
Africa
Eastern Europe
Oceania
48,731,981
3,566,337
1 ,095,754
488,754
525,637
424,982
241,180
112,239
144,589
88.1%6.4%
2.0%
0.9%0.9%
0.8%0.4%
0.2%
0.3%
50,565,744
3,393,464
987,797
592,055
434,841
425,607
240,588
132,122
92,272
88.9% 3.8%
6.0% -4.8%
1 .7% -9.9%
1.0% 21.1%
0.8% -17.3%
0.7% 0.1%0.4% -0.2%
0.2% 17.7%
0.2% -36.2%
Total Exports 55,331,452 100.0% 56,864,491 100.0% 2.8%

International Trade Review
Asia accounts for the largest share of Alberta exports to
regions outside the US
W. Europe c . America15.7% 9 .4o/o
S. America
\ 6.9%
United States
88.9%I Other
11.1%
^\ Middle East
6.8%
Africa
3.8%
E. Europe
2.1%
Oceania
1.5%
United States Alberta was affected by lower demand south of the border in 2001 as the US
Of America economy entered a minor recession and reduced its total import volumes by
2.7%.
Overall, Alberta's exports to the United States climbed 3.8% to $50.6 billion in
2001 , a weakening from the very strong increase of 68% in 2000, but still
stronger than Alberta's export performance to the rest of the world. As a result,
a larger proportion (88.9%) of Alberta's exports went to the US last year, up
from 88.1% from the year prior. Since 1997 US bound exports have grown 88%compared to a 3.6% decline in non-US exports.
Through its rapid expansion into the US market, Alberta has been able to
increase its share of Canadian exports to the US. Driven largely by energy
sales, particularly natural gas, Alberta's market share of Canadian exports to the
US reached 15.6% in 2001, up from 14.6% in 2000 and from 11.8% in 1997.
Alberta's Share of Canadian Exports to the US
1997 1998 1999 2000 2001
- 18-

International Trade Review
Of all commodities shipped form Alberta, the US spends the most on natural
gas. About $21 .6 billion worth of natural gas flowed from Alberta to the US in
2001,up 27% from the year prior. Providing the largest boosts were higher
natural gas prices, rising 19% over the year and the opening of the Alliance
pipeline in December 2000, which contributed to about a 6% increase in
volumes. With the province benefiting from additional pipeline capacity and anupward trend in prices, natural gas has been the main driving force behind
Alberta's exports to the US over the last five years. In 1 998, natural gassurpassed crude oil as Alberta's top export to the US.
Lower prices and, to a lesser extent, lower volumes caused Alberta's crude oil
exports to fall by 15% in 2001,partly reversing a strong, but primarily price
driven increase of 94% in 2000. Crude oil exports to the US have grown by
nearly 50% over the last five years, a sizable increase, but lower than the 175%growth in natural gas shipments.
Alberta's Exports to the U.S.
Other
Crude Oil
Natural GasS Billions
25.326.9
26.1
11.710.6
10.6
8.5 6.77.7
in1997 1998 1999
48.7
16.7
14.9
2000
50.6
16.3
12.6
2001
Of Alberta's largest exports to the US, some of the commodities that grew
strongly in 2001 were:
• Propane, up 44% to $1 .1 billion because of stronger prices and volumes.
• Polyethylene became one of Alberta's largest exports to the US after
soaring 72% to $780 million in 2001
.
• Exports of electricity, while not one of Alberta's largest shipments to the
US, grew to $204 million from $6.3 million in 2000 as California
attempted to overcome electricity shortages stemming from its recent
deregulation of the industry.
• Exports of cattle increased 39% to $713 million, while boneless beef
exports grew 22% to $968 million.
At the same time, many of Alberta's top commodity exports to the US were
falling. Affected by the global slowdown in the technology sector, exports of
telecom equipment to the US plummeted 43% to $2.3 billion. The largest
component, radio-telephone transmission equipment, fell 39% to $1 .1 billion,
while telephone switching equipment sank 71% to $423 million. Forestry
exports, most notably chemical wood pulp and oriented strand board, were also
down in 2001 ,mainly because of lower prices.
- 19 -

International Trade Review
Top U.S. States In this section Alberta exports to major states in the U.S are discussed. Since
energy exports, such as crude oil and natural gas, cannot be allocated to the
state of final destination, they are not included in the state export totals.
Appendix D shows a breakdown of exports by state including energy
commodities.
Excluding energy exports, Alberta's five largest trading partners in 2001 were:
California. Exports to California were up by 1 .8% to $1 .8 billion in 2001
.
Strong gains were posted by organic chemical exports, mainly Methyl
Tertiary-Butyl Ether (MTBE), which rose 26% to $498 million, andelectricity, which reached $70 million, up from less than $1 ,000 in 2000.
However, this was offset by telecom equipment, which is typically a large
export to the state, but fell sharply from about $350 million to $80 million
in 2001 . Other major exports include beef, oriented strand board and
cattle.
Texas. The state imported $1 .3 billion worth of goods from Alberta,
down 2.3% from 2000. Styrene accounted for $318 million of the total,
making it the largest export to the region. Oil and gas field equipment,
telecom equipment, lumber and beef are other major shipments to the
state.
New York. Exports to New York fell 63% to $945 million, mainly
because of a sharp decline in telecom exports. In particular,
transmission equipment fell 57% to $367 million and switching
equipment 82% to $232 million. New York also imports large quantities
of furniture and beef from Alberta.
Washington. In 2001,exports to Washington fell 1 .4% to $851 million. A
decline in beef and cattle shipments offset the sharp increase in
electricity exports, most of which was destined to California. The top
exports to the region were cattle, beef, oriented stranded board andplastics.
Illinois increased its Alberta imports by 10% to $813 billion in 2001
,
driven mainly by higher shipments of organic chemicals, such as styrene
and ethylene glycol. Other exports to the state include furniture, plastics,
lumber and beef.
"In the Pacific
Northwest US,
Alberta exports of
petrochemicals,
transportation
equipment, industrial
equipment,
prefabricated
buildings and agri-
food continued to
show strength in
2001".
Wes SawatzkyAlberta Portland
Office
-20-

International Trade Review
Asia Alberta's second largest regional market suffered an economic slowdown in
2001 as Japan remained in recession and as several export-dependantcountries in East Asia were hit by lower external demand, particularly for !CTequipment from the US.
"Weak business
sentiment andslower re-exports to
China caused adramatic decline in
Alberta's 2001exports to HongKong, notably in
canola and artificial
filament tow."
"There is a trend for
more Alberta
manufactured andprocessed exports to
Hong Kong.
"
Josephine ChoiAlberta Hong KongOffice
Following a 14% increase in 2000, Alberta's exports to Asia dropped 4.8% to
$3.4 billion in 2001,mainly because of a decline in major exports such as
forestry products, which suffered from lower pulp prices, and coal. Over the last
five years, exports to the region have shrunk 8.4%.
Shipments to Japan fell 4.3% to $1 .3 billion - the lowest level since 1 993. In
addition, all the Newly Industrialized Countries (NIC's) - South Korea, HongKong, Taiwan and Singapore - reduced their imports of Alberta goods, with
declines ranging from 36% in Hong Kong to 2.4% in Taiwan. Many other large
Asian countries, including Indonesia, Malaysia and India, also imported less
from Alberta in 2001.
But not all Asian countries reduced their Alberta imports in 2001 . In the
Philippines and Thailand, Alberta exports grew by about one-quarter. In China,
where unlike most Asian countries economic growth was strong, imports from
Alberta advanced by 15% to $886 million. China has emerged as Alberta's
fastest growing market in Asia, with exports more than doubling over the last
five years. The country now ranks as the province's third largest trading partner.
Alberta Exports to
$ Thousands
Asia
1997 1998 1999 2000 2001
Japan 1,711,362 1 ,348,370 1,315,770 1,340,936 1 ,283,842
China 435,124 482,021 558,502 771,422 886,476
Korea, South 537,51
1
445,271 501,750 567,391 462,226
Taiwan 278,200 210,286 234,082 235,541 210,982
Hong Kong 105,157 90,254 104,743 156,600 100,493
Indonesia 212,343 155,101 109,721 118,481 92,817
Singapore 86,669 82,056 66,855 81,731 79,729
Philippines 64,072 32,218 42,399 54,337 68,195
Thailand 65,836 46,753 22,076 41,964 52,214
Malaysia 51,299 37,101 42,362 58,997 43,720
India 33,420 40,289 24,308 55,300 43,671
Bangladesh 25,224 46,127 56,177 43,951 41,002
Vietnam 7,590 6,676 5,454 4,329 9,188
Maldives 7,799 7,525 12,290 4,226 6,627
Pakistan 70,921 27,330 15,890 10,815 6,485
Sri Lanka 7,228 3,385 10,496 10,225 4,155
Korea, North 1,585 1,148 890 6,496 629
Macau 114 179 523
Brunei Darussalam 352 189 69 246 170
Myanmar 682 120
Nepal 135 3,040 2,290 2,685 83
Mongolia 33 1,864 151 80
Afghanistan 1,386 3 3 39
Laos 53 31 114
Cambodia 49 217
Total Asia 3,704,062 3,065,206 3,128,037 3,566,337 3,393,464
-21 -

International Trade Review
Alberta Exports to Asia, 2001
China
,26.1%
Korea. South
\ 13.6%
Taiwan
6.2%
Hong Kong3.0%
IndonesiaOther 2.7%10.5%
Total Exports: $3.4 billion
Japan
"Japan has declining
self-sufficiency in its
agricultural sector. ...
. . . the Alberta JapanOffice believes that
there will be strong
demand for agri-food
products from
Alberta"
'There is increasing
pressures for Japanto continue to openits markets to the
world, through
W.T.O. negotiations.
This presents a
good opportunity for
Alberta companies.
"
Brad Klak
Alberta JapanOffice
Japan is Alberta's largest market in Asia, accounting for 38% of the province's
exports to the region. Alberta's sales to Japan reached $1 .3 billion in 2001 , a4.3% decline from the year prior. This compares to a 1 1% drop in Canadianexports over the same period.
In recent years, exports to Japan have been stagnant or declining, in large part
because the country has been mired in a recession since the early 1990's.
Exports are only slightly above 1993 levels and are down by one-quarter over
the last five years. In 1 997, Japan accounted for 46% of Alberta exports to
Asia; in 2001 , its share dropped to 38%. Although Japan is still Alberta's
largest market in Asia, China has recently emerged as a serious challenger for
the top spot.
Share of Alberta's Exports to Asia- Japan and China
. Japan
46% - 44% *^-«-^_42%
38% 38%
China.
-— 22%
26%
- 18%16%
12%
1997 1998 1999 2000 2001
-22-

International Trade Review
Canola was Alberta's largest export to Japan, accounting for 14.8% of total
exports. Because of higher prices, which more than made up for lower
volumes, exports of this commodity grew by 5.4% to $190 million in 2001
.
Non-coniferous (hardwood) chemical wood pulp is Japan's second largest
import from Alberta, with shipments totaling $1 33 million in 2001 . Whilevolumes were unchanged, a steep drop in prices caused a 25% decline in
exports of this commodity in 2001
.
Other major exports to Japan include coal ($128 million), wheat ($107 million)
and malt ($71 million).
China
"In 2001, China
became a memberof the WTO World
Trade
Organization...
the world now awaits
the actual
implementation of
new tariffs and moretransparent trade
regulations".
David WongAlberta China
Office
Alberta exports to China expanded for the fourth straight year in 2001,reaching
$886 million, a 15% increase from 2000. China ranks as Alberta's third largest
overall export market, surpassing South Korea in 1997, and Canada's fourth
largest market, behind the U.S., Japan and the U.K. Canadian exports to China
were also strong in 2001,climbing 20% during the year, led by a jump in aircraft
shipments.
Over the past five years, Alberta has seen its exports to China more than double
(+104%), with stronger canola, ethylene glycol, sulphur and wood pulp
shipments leading the way.
Ethylene glycol worth $209 million accounted for almost a quarter (23%) of
Alberta's exports to China in 2001 . Up 26% from 2000 because of higher
volumes, this commodity has been Alberta's top export to China for the last two
years.
Canola accounts for another 15% of the province's exports to China. Valued at
$129 million, canola shipments were up 27% from the previous year, due to
higher volumes. This commodity, which was not exported in 1997, represents
the fastest growing Alberta export to China over the past five years.
Exports of artificial filament, used for cigarette filters, were down by 4.5% to $90million in 2001 , while barley exports rose by 86% to $70 million, driven up by
much stronger volumes and slightly higher prices. Other major exports to China
included polyethylene ($59 million), wheat ($47 million), sulphur ($ 41 million)
and semi-chemical wood pulp ($41 million).
- 23 -

International Trade Review
South Korea
"With the Koreaneconomy expecting
growth of about 5%,2002 promises to bevery encouraging
year for Alberta
exporters".
"Expansion plans for
Korea's
infrastructure will
provide opportunities
in the telecom,
transportation,
energy, health andenvironment
sectors".
Cliff Wulff
Alberta KoreaOffice
Taiwan
"With over 90% of
Taiwanese owning amobile phone,
wireless
communication is
one of Taiwan's
hottest economicsectors.
Opportunities also
exist in the
biotechnology andopto-electronics
sectors."
Li-an ChenAlberta TaiwanOffice
South Korea ranked as Alberta's fifth largest market in 2001 . This Asian Pacific
country saw its Alberta imports decline by 19% in 2001 to $462 million - the
lowest level since 1998. For Canada, where South Korea is the eighth largest
market, exports fell by 1 3%
Contributing to Alberta's 2001 decline was a price driven 21% drop in non-
coniferous (hardwood) chemical wood pulp exports, the top export to the region.
Other factors included a volume related 17% reduction in ethylene glycol
shipments and a 40% decrease in semi chemical wood pulp sales (lower
prices). Exports of these three commodities were valued at $128 million, $63million and $25 million, respectively.
Of Alberta's top exports to the South Korea, only the value of coal shipments
increased, by a substantial 30% to $103 million in 2001 , due to much higher
quantities shipped.
Alberta exports to South Korea have dropped 14% over the last five years,
largely because styrene and canola shipments fell to zero in 2001 after equaling
$68 million and $59 million, respectively, in 1997.
Based on 2001 figures, paper and pulp and mineral fuels, particularly coal,
make up about 60% of Alberta's exports to South Korea. Exports of ethylene
glycol, beef and wheat account for another 25%.
Taiwan makes up Alberta's sixth largest market. In 2001 exports to Taiwan fell
10% to $21 1 million because of much lower ethylene glycol and semi- chemical
wood pulp sales. At the same time, exports from Canada dropped 14% to $965million.
Over the last five years, Taiwan has seen its Alberta imports drop nearly one-
quarter (24%) as large declines in petrochemical shipments (e.g. ethylene
glycol) more than offset higher telecom equipment sales.
Major exports to Taiwan include petrochemicals, wood pulp, telecom equipment,
and hides and skins.
Ethylene glycol, valued at $34 million in 2001 , remains Alberta's top export to
Taiwan, although shipments of the commodity have dropped 64% over the last
five years and by 31% last year. Lower volumes are entirely responsible for
these declines, as prices increased over these periods.
Bovine hides and skins became the second largest export, with shipments
increasing 48% to $27 million. Exports of telephone sets, rising for the sixth
straight year by 30% to $26 million, comprised the third largest commodity,
followed by coniferous (softwood) chemical wood pulp at $18 million, up 1.8%from 2000.
- 24 -

International Trade Review
WesternEurope
"Despite recent
export declines,
Germany is still a
major market for
Alberta".
"The recent opening
of the Alberta
Government Office
in Munich during
TeamCanada has
dramatically
increased the
awareness of
Alberta in Germany".
Karin Teubert
Alberta GermanyOffice
Affected by lower exports, higher oil prices and weaker consumer demand,economic growth slowed across Western Europe in 2001 . Germany was the
first European country to enter a recession, followed by a number of smaller
countries such as Finland, Belgium and Denmark. While many other countries
experienced an economic slowdown, they managed to escape a recession.
Alberta exports to the region totaled $176 million in 2001 , a drop of 9.9% from
2000 levels. The latest decline follows a 13% increase in 2000, when Alberta
exports benefited from a jump in wood pulp and nickel exports. In 2001 , it wasthe reverse: falling prices and volumes brought down wood pulp shipments
while nickel exports suffered from lower prices.
Among the major Western European markets, only the Netherlands spent moreon Alberta goods in 2001 compared to 2000. Exports to the United Kingdom,
Alberta's largest market in the region, dropped 11%, while those to Italy,
Belgium, Germany and France slipped 9%, 22%, 29% and 11%, respectively.
Over the last five years, Alberta exports to Western Europe have fallen by a
modest 2.8%, due mainly to especially large declines in Germany and the
Netherlands. The extent of the drop was limited by stronger exports to the
United Kingdom, Italy, Belgium and especially to France, where exports nearly
doubled.
Alberta Exports to Western Europe$ Thousands
1997 1998 1999 2000 2001
United Kingdom 165,767 230,790 179,394 198,325 176,280
Italy 158,352 175,526 166,264 192.429 174,934
Belgium 111,589 1 1 1 ,880 112,930 153,204 119,392
Netherlands 184,098 163,685 135,958 110,768 114,633
Germany 173,848 164,021 138,610 155,467 111,176
France 56,635 67,697 74,153 114,168 101,321
Spain 39,418 36,610 53,020 50,923 39,086
Norway 13,000 21,007 11,807 13,291 35,155
Switzerland 39,033 40,029 26,296 31,322 23,776
Sweden 9,884 4,703 10,235 8,237 22,524
Ireland 1 1 ,778 9,224 8,634 8,962 15,566
Finland 1,912 4,670 3,813 14,531 14,654
Greece 2,934 6,013 8,377 7,156 12,885
Austria 31,355 29,868 29,951 23,913 10,643
Portugal 1,095 3,708 4,094 3,006 3,806
Denmark 9,526 5,569 5,672 6,372 3,757
Malta 1,064 1,598 773 1,262 2,899
Luxembourg 4,694 771 1,238 1,230 2,737
Greenland 27 281 100 1,592
Iceland 47 187 924 1,023 951
Faroe Islands 31
Andorra 6
Gibraltar
St. Pierre & Miquelon 59 60
Total Western Europe 1,016,114 1,077,557 972,425 1,095,754 987,797
-25-

International Trade Review
Alberta Exports to Western Europe, 2001
Total Exports: $987.8 Million
United Kingdom The u.K. is Alberta's largest market in Western Europe and seventh largest
overall. In 2001, the province shipped $176.3 million worth of goods to the U.K.,
9.2% less than in 2000 - mainly because of a reduction in telecom equipment
and wood pulp shipments. The U.K ranks as Canada's third largest market, with
exports totaling $4.7 billion in 2001 - down 13% from the previous year.
Influenced by a surge in nickel exports, the total value of shipments to the U.K.
from Alberta has risen by 6.3% over the last five years.
Alberta's top exports to the U.K. in 2001 include nickel ($33 million), wheat ($31
million), coal ($16 million) and engine and motor parts ($7.5 million). Together,
these commodities accounted for nearly half of the province's exports to the
U.K. Other major categories, based on broader product groupings, include
telecom equipment, machinery and wood pulp.
Nickel emerged as Alberta's largest export to the U.K in 2001,increasing 66%
because of higher volumes and replacing wheat in the top spot. Wheat exports
were slightly higher (+4.8%), as were exports of coal (+8.7%). But these gains
were more than offset by sharp reductions in semi chemical wood pulp andtelecom equipment sales, down 79% and 51% respectively.
-26-

International Trade Review
Italy In 2001, Alberta's exports to Italy dropped 9.1% to $175 million. Making up 18%of exports to the region, Italy is Alberta's eighth largest market. Canadianexports to the country fell by a slightly lower 7.6% during the same period.
Although Alberta usually exports proportionally less to Western Europe than the
rest of Canada does, Italy is an exception: in 2001 , 11% of Canadian exports to
this country originated from Alberta - the highest share of all major markets in
the region.
Despite 2001 's decline, Alberta exports to Italy are up 11% over the last five
years, a result of higher exports of turbo propellers and nickel.
Turbo propellers have recently become Alberta's second largest export to Italy.
Before 2000 no propellers were being sent to Italy from Alberta, but in 2001 , $28million worth of the commodity was sold, up from $6.7 million in 2000.
Nickel exports remained the highest valued shipment to Italy, despite declining
40% in 2001 , a result of much lower volumes. In that year, the commodity
accounted for 28% of Alberta exports to Italy. Up until 2001 , nickel was a fast
growing export to Italy, with sales growing for four straight years.
Other significant exports to Italy in 2001 include non-coniferous (hardwood)
chemical wood pulp at $27 million, and durum wheat, which nearly tripled in
value to $17 million from the previous year.
Belgium Alberta shipments to Belgium declined 22% in 2001 , but the country surpassed
Germany to become the province's third largest market in the region and tenth
largest overall. With shipments totaling $1 19 million in 2001, Belgium received
12% of the province's exports to Western Europe. Nationally, exports to Belgium
fell by 12%.
Driven primarily by stronger nickel and wood pulp shipments, Alberta exports to
Belgium have strengthened by 7% since 1997.
As with many other countries in the region, nickel is Alberta's top export to
Belgium. Valued at $26 million in 2001, nickel sales have nearly doubled over
the last five years, although they dropped 28% during 2001 because of lower
prices.
Lower prices dragged down non-coniferous (hardwood) chemical wood pulp
exports by 34% to $25 million in 2001 , but exports of this commodity have also
nearly doubled over the last five years.
Cobalt ($12 million), artificial filament tow ($8 million) and dried peas ($7 million)
were other major exports to the country in 2001
.
- 27 -

International Trade Review
The Central American region, which includes the Caribbean and NAFTA partner
Mexico, suffered severely from the US slowdown, as both exports andremittance payments to the region plunged. Following an extended period of
strong economic growth, Mexico entered a recession in 2001 , with output
declining 0.3%. Reduced tourism spending, particularly in the Caribbean, also
plagued the region in the latter part of the year.
Benefiting entirely from the continued strength in Mexico, Alberta exports to
Central America advanced 21% to $592 million in 2001 , the highest growth rate
of all regions.
Over the last five years exports to this region have climbed 76%, as very strong
export growth to Mexico more than made up for lower exports to the rest of the
region.
Mexico continued to increase its imports of Alberta goods in 2001,despite the
country's economic slowdown and its overall reduction in imports. Alberta
exports to the country climbed sharply to $481 .5 million, as the value of shipped
beef - Alberta's largest export to Mexico - continued to expand. In 2001
,
Mexico accounted for just over 80% of Alberta's exports to the region.
Alberta Exports to Central America, Mexico and the Caribbean$ Thousands
1997 A Ann1998 1999 2000 2001
Mexico 223,253 286,753 244,836 356,051 481,484
Cuba 66,620 83,996 49,326 55,383 57,916
Guatemala 12,625 25,019 28,901 39,850 24,232
Dominican Republic 3,084 1,503 5,046 6,100 7,912
Trinidad & Tobago 521 701 2,977 1,886 4,418
Jamaica 890 582 847 7,069 3,844
Costa Rica 12,137 7,745 8,620 1 1 ,205 2,124
Anguilla 489 2,121
Haiti 483 1,320 1,613 1,189 1,115
Nicaragua 724 1,152 551 486 1,097
Netherlands Antilles 882 175 12 301 988
El Salvador 3,613 2,680 502 1,453 949
Bermuda 319 314 143 695 932
Barbados 2,301 789 478 2,044 875
Panama 5,075 1,272 653 1,118 784
Bahamas 235 78 1,096 2,604 392
St. Lucia 12 246 2 59 187
Cayman Islands 166 90 139
Aruba 54 110
Belize 55 133 96
Grenada 46 444 37 80
St. Kitts & Nevis 25 2 72
Antigua & Barbuda 3,164 1,082 110 178 46
Virgin Islands (British) 99 38 24 39
Honduras 138 264 297 39
St. Vincent & the Grenadi 11 44 279 25
Turks & Caicos Islands 15 11 257 25
Dominica 113 12
Martinique 388
Central America, Mexico
and the Caribbean
337,167 416,049 346,281 488,754 592,055
-28-
Central
America,
Mexico and the
Caribbean
International Trade Review
Alberta Exports to Central America, 2001
Total Exports: $592.1 million
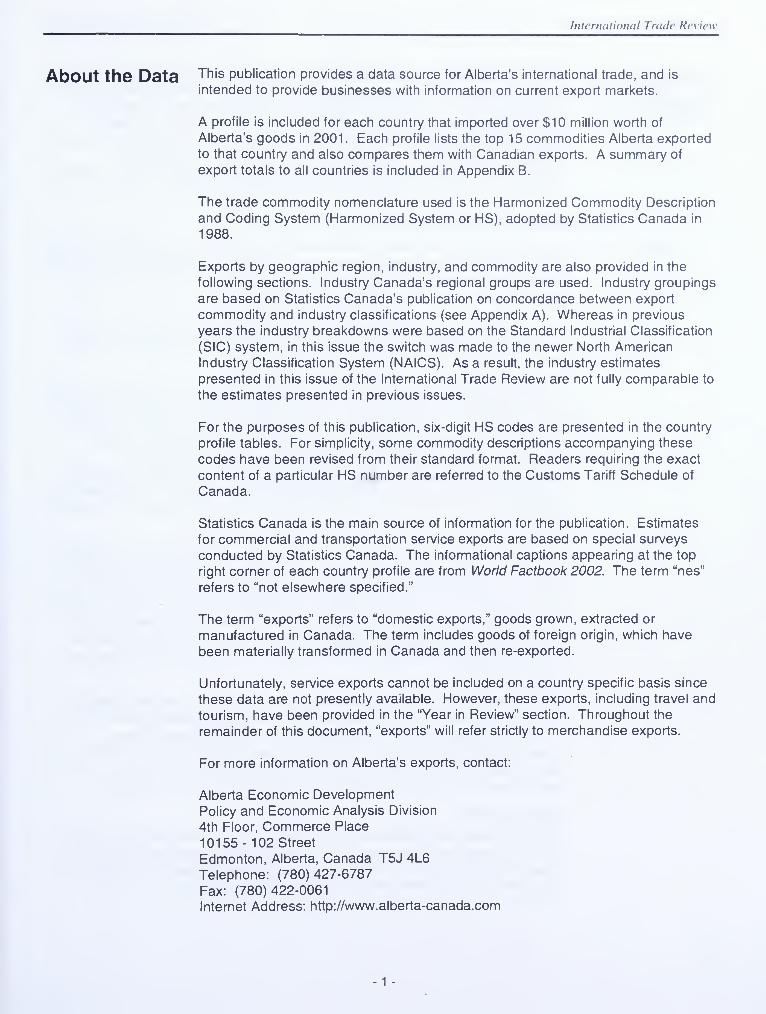
Mexico Mexico is Alberta's largest market in Central America, accounting for 81% of
exports to the region in 2001 . Along with China, it is the province's fastest
growing major markets. Exports reached $481 million, an increase of 36% from
2000, compared to a 21% rise in Canadian sales.
Exports have more than doubled (+116%) over the last five years and morethan tripled since 1994, when the North American Free Trade Agreement(NAFTA) gave Alberta better access to Mexican markets.
Beef, especially boneless beef, has been the key driver behind Alberta's strong
export performance to Mexico. Only five years ago, beef sales accounted for
just 2.4% of the province's exports to Mexico. Today, they amount to almost half
of the shipments to the country. Boneless beef exports alone shot up to $1 78million in 2001 , an 82% increase from the previous year and up substantially
from $0.4 million in 1997.
Canola and wheat are the second and third largest commodities sent to Mexico,
collectively accounting for 34% of Alberta exports. Higher prices pushed canola
exports up 10% to $84 million, while wheat shipments rose 22% to $81 million
because of both higher prices and quantities.
-29-

International Trade Review
Alberta's Exports to Mexico
Other $ Millions
Sulphur
Canola
1997 1998 1999 2000 2001
Cuba Cuba accounts for the second largest share of Alberta exports to the region, at
9.8% in 2001 . For the third straight year, exports to Cuba grew, by 4.6% to
$57.9 million, compared to a 13% climb in national exports. However, over the
last five years, provincial sales to the country have dropped by 13%, owing to
gradually declining sulphur and dried pea exports.
Major exports to Cuba include oil and gas field equipment, sulphur, wheat andpeas - together accounting for about two-thirds of the total in 2001
.
Oil and gas field equipment made up the largest component of exports to Cuba.
In particular, parts for boring or sinking machinery reached $4.4 million, up from
$1.3 million in 2000.
Sulphur exports, which suffered a 33% price related decline, totaled $12 million.
Wheat was largely unchanged at $8.5 million, while shipments of dried peasrebounded sharply, more than doubling to $4.5 million.
- 30 -

International Trade Review
South World trade with South America in 2001 was highly affected by instabilities in
America the re9'on 'most notaD ly in Argentina, where a forced currency devaluation
prompted an economic crisis. Other countries in the region experienced
slowdowns, including Chile, which felt some spillover affects from Argentina,
and Brazil, where a power shortage limited industrial production.
Of all regions, South America saw the largest decline in Alberta's exports in
2001,moving down one spot to become Alberta's fifth largest regional market.
Overall exports to the region were down 17% to $435 million in 2001,mainly
because of declines in three countries: In Argentina exports plummeted 72%,while those to Chile and Brazil dropped by 47% and 21%, respectively.
Despite 2001 's decline, Alberta exports to South America remained almost
unchanged (+1 .8%) over the last five years.
After increasing its Alberta imports for the fifth consecutive year, Venezuelabecame the province's top market in South America in 2001 . The country leads
with 27% of Alberta's regional exports, followed by Brazil (22%), Colombia
(15%) and Chile (14%).
Major exports to the region include oil and gas field equipment, sulphur, coal
and wheat.
Alberta Exports to South AmericaS Thousands
1997 1998 1999 2000 2001
Venezuela 50,297 52,787 59,643 110,591 116,870
Brazil 157,442 129,629 108,582 118,444 93,693
Colombia 57,477 53,167 32,077 44,057 64,937
Chile 54,531 32,561 76,699 115,719 61,586
Ecuador 6,990 37,108 22,527 29,016 37,301
Peru 48,854 30,872 27,479 36,221 33,549
Argentina 42,978 20,248 29,427 63,757 17,569
Bolivia 6,096 3,341 4,988 4,895 5,548
Suriname 68 66 1,321 27 2,690
Uruguay 1,643 473 1,032 2,835 974
Paraguay 181 139 114 73 92
Guyana 441 115 49 3 32
Total South America 426,998 360,504 363,938 525,637 434,841
-31 -

International Trade Review
Alberta Exports to South America, 2001
Brazil Colombia
Total Exports: $434.8 million
Venezuela Alberta's exports to Venezuela reached $1 1 7 million in 2001 , a 5.4% increase
from the year prior, compared to 12% growth in Canadian exports. Venezuela,
one of the few major South American countries to increase its Alberta imports,
surpassed Brazil to become Alberta's largest market in the region.
Robust growth in oil and gas field equipment exports coupled with strength in
wheat sales, has made Venezuela one of Alberta's fastest growing markets in
South America, with exports surging 132% over the last five years.
Just over half (52%) of Alberta exports to the country in 2001 consisted of
wheat, including durum. Wheat sales grew 14% to $39 million mainly becauseof higher prices, while durum wheat exports rose 21% to $21 million for the
same reason. Both these commodities have seen significant increases over the
last five years, particularly durum wheat, which has more than doubled in value
over this period.
Because Venezuela is a heavy producer of oil, equipment for the oil and gasfields, such as parts for boring or sinking machinery, pumps and compressorsand machines with individual functions, make up over one-quarter of Alberta's
exports to the country. Exports of these commodities have increased very
strongly over the last five years.
-32-

International Trade Review
Brazil Exports to Brazil dropped 21% to $94 million in 2001 because of substantially
lower shipments of sulphur and coal. Canadian exports fell less dramatically, by
9.7% during the same year. As a result of the 2001 decline, Brazil moved downone spot to become Alberta's second largest market in South America, with
22% of the region's imports.
Sulphur and coal together make up 55% of the province's exports to the
country. In 2001,sulphur exports fell 36% to $30 million mostly because of
lower volumes, while coal dropped 34% to $22 million for the same reason.
Over the last five years, sulphur shipments have been trending downwards,
while coal exports have been climbing.
In 2001 , oil and gas field and telecom equipment surfaced as major exports to
Brazil. In particular, parts for boring or sinking machinery, rose to $5.6 million in
2001,up sharply from almost nothing in 2000. Telecom equipment reached
over $9 million, an increase of about one-half from the previous year.
Alberta also sent $7.2 million in aircraft parts to Brazil in 2001 , a commodity not
imported in the previous year.
-33-

International Trade Review
Middle East The Middle Eastern economy slowed only marginally in 2001 , as strong crude
oil prices provided a major boost in the face of declining oil production,
weakening European markets and plunging tourism revenues.
In the Middle East overall exports were almost unchanged (+0.1%) from 2000 at
$426 million. Of this total, about one-half consisted of wheat shipments.
At the country level, exports to Egypt more than tripled to $53 million because of
a jump in wheat and coal shipments. In Sudan, exports surged more than six-
fold, lifted by much stronger laboratory equipment and wheat exports. As a
result, these countries became Alberta's second and fourth largest markets in
the region, respectively.
These gains were large enough to offset lower exports to Alberta's largest
market in the region - Iran. Mainly because of a steep drop in wheat prices, Iran
spent 20% less on Alberta goods in 2001 , but still accounted for 38% of the
province's exports to the region. Egypt was responsible for another 1 3% of the
Middle East's imports from Alberta in 2001, followed by the United Arab
Emirates at 1 1 % and Sudan at 8%.
Alberta Exports to the Middle East
$ Thousands
1997 1998 1999 2000 2001
Iran 208,263 83,299 116,511 203,311 162,783
Egypt 6,945 7,333 16,756 16,642 53,312
United Arab Emirates 49,631 69,366 35,423 56,717 46,988
Sudan 11,421 15,623 15,034 5,658 34,959
Saudi Arabia 86,150 1 5,470 10,677 35,094 29,379
Yemen 1,726 2,093 2,824 15,418 25,933
Israel 17,368 27,749 16,423 14,201 12,354
Oman 6,601 9,641 6,577 4,904 11,639
Qatar 7,140 7,270 3,706 5,237 8,288
Libya 30,029 16,999 15,981 8,031 7,151
Kuwait 1,278 21,180 4,338 3,065 5,687
Iraq 10,223 33,913 5,542
Bahrain 1,753 1,236 2,065 2,467 5,323
Turkey 37,879 15,608 13,754 1 1 ,282 4,822
Cyprus 1,438 4,844 2,644 3,070 4,774
Ethiopia 1,958 3,848 4,034 1,830 2,037
Lebanon 3,199 1,554 3,463 1,054 1,564
Syria 1,731 1,185 3,614 1,874 1,514
Somalia 951 1,111
Jordan 666 583 1,047 1,215 336
Eritrea 16 113
Total Middle East 476,126 304,896 285,095 424,982 425,607
-34-

International Trade Review
Alberta Exports to the Middle East, 2001
United Arab
Emirates
11.0%
Sudan8.2%
Saudi Arabia
6.9%
Yemen6.1%
Total Exports: $425.6 Million
Iran Iran remained Alberta's ninth largest overall market in 2001 , with exports valued
at $163 million. The province saw its Iranian sales drop 20%, mainly because of
lower quantities of wheat shipped. By comparison, Canada's exports fell by aneven larger rate of 27%. Of Alberta's top ten markets, Iran has the highest
proportion of its Canadian imports coming from Alberta, at 34% in 2001
.
Since 1997, a particularly strong year because of higher than normal shipments
of wheat, Alberta exports to Iran have fallen 22%.
Wheat (non-durum) - valued at $133 million in 2001 - accounted for 81% of
exports to Iran, down from 94% in 2000. Exports of the commodity have
dropped 28% in 2001 because of weaker volumes.
Other grains, although much less significant in value, were also exported to Iran
in 2001 . These included durum wheat, rising nearly three-fold to $7.6 million
during the year, and barley, up 14% to $4.8 million.
Oil and gas field equipment exports made up the last major component of
commodities sent to Iran. In particular, shipments of parts for boring or sinking
machinery reached $5.8 million, up strongly from $0.4 million in 2000.
- 35 -

International Trade Review
Africa Africa escaped the global slowdown almost unscathed in 2001 . The region
maintained normal growth levels as higher crude oil prices and strong
agricultural production made up for lower prices for such commodities as coffee,
cotton and cocoa.
After rebounding slightly in 2000, Alberta exports to Africa - the province's third
smallest regional market- were largely unchanged in 2001 at $241 million.
As in the Middle East, a large share (about two-thirds) of Alberta's shipments to
Africa comes in the form of wheat, divided in roughly equal amounts between
durum and non-durum.
Alberta Exports to Africa
$ Thousands1997 1998 1999 2000 2001
Morocco 96,215 68,892 59,986 52,663 57,700Algeria 104,942 99,969 78,373 84,266 56,847N igeria 17,401 1 2,820 5,504 17,91 1 28,665South Africa 39,897 54,976 46,626 40,876 28,423Tunisia 32,636 13,399 3,959 2,068 16,523
Ghana 9,639 10,738 6,555 12,228 14,691
Senegal 37 7,022 3,663 8,231 10,202
Cam eroon - 5,444 4,817 5,762 9,074
Togo 3,076 8,888 6,534 4,483 6,692
Mozam bique 1 ,503 3,438 1 ,678 747 2,704
Chad - - 184 - 2,680
Cote d'lvoire 597 1 ,671 639 2,870 1 ,714
Mauritius 1 ,495 1 ,673 357 578 950Kenya 7,155 2,174 4,802 2,595 841
Congo 353 54 1 5 1 58 769Tanzania 1 ,764 1 ,625 5,267 174 743Liberia 112 51 1 ,067 6 461
Angola - 2,374 175 642 292Equatorial G uinea - - - - 184G uinea 311 234 1 74 100Gabon 1 ,549 412 1 ,590 475 99
Mali 3,279 85 567 442 39Sierra Leone 995 102 1 12 15 38
Uganda 473 357 18 41 33Congo, Dem . Rep. of 1 1 - - 30
Burundi 13 _ _ _ 23
Botswana 52 1 ,350 318 739 23
Zam bia 89 127 508 473 19
Djibouti 26 757 10
N iger 31 1 10 8
Zim babwe 29 13 1 1 44 7
Bouvet Island 177 3
M adagascar 27 1
Nam ibia 1 ,303 1 ,428 1 ,1 03 1
Benin 8,741 199 106 25Rwanda 348 370 96 30Malawi 206 130 1 37 45Mauritania 86 875British Indian Ocean Terr 61
Sao Tome & Principe 24Seychelles 16 1 5
Swaziland 843 1 ,079 389Lesotho 72St. Helena 27Burkina Faso 9
W estern Sahara 14
Cape VerdeG uinea-BissauTotal Africa 333,617 300,608 237,173 241,180 240,588
- 36 -

International Trade Review
Largely because of a sharp decline in sulpher exports, Africa has reduced its
purchases of Alberta goods by 28% over the last five years.
A drop in durum wheat sales caused exports to Algeria to fall 33% to $57 million
in 2001,and allowed Morocco to become Alberta's largest market in the region
for the first time since 1 996, with exports totaling $58 million. Combined, thesetwo countries made up just under one-half of Alberta's exports to Africa.
Nigeria and South Africa were the third and fourth largest markets, each with
about a 12% share in the province's African exports.
Alberta Exports to Africa, 2001
Nigeria
15.7%
Total Exports: $240.6 Million
Morocco Morocco was the largest market in the region for Alberta goods in 2001 , with
exports reaching $58 million - a 9.6% increase from the previous year.
Nationally, sales to the country advanced 5.4%.
Over the last five years, exports to Morocco dropped 40%, as climbing wheat
sales could not make up for falling sulphur shipments.
Durum wheat makes up the majority of Alberta exports to Morocco. In 2001
,
56% or $32 million of the province's sales to the country was comprised of
durum wheat, up 13% from the year prior. Exports of this commodity has
steadily risen over the last five years and more than tripled over this period.
Almost all the remaining exports to Morocco involve wheat (non-durum) and
sulphur, valued at $16 million and $8 million, respectively. Sulphur declined for
the fifth straight year in 2001(by 16%) while non-durum wheat gained 38%.
- 37-

International Trade Review
Algeria Algeria took in 33% less in imports from Alberta in 2001 than it did in 2000, a
sharp decline that resulted from lower quantities of durum wheat shipped.
Canadian exports dropped by 40% over the same period.
At $56.8 million, exports to Algeria were valued at almost half their 1997 levels,
mainly because large amounts of non-durum wheat were exported five years
ago, but not in 2001
.
Similar to Morocco, Alberta's exports to Algeria depend almost entirely on
wheat. Three-quarters of the shipments to the country in 2001 were comprised
of durum wheat valued at $43 million. Because of a decline in volumes, exports
of the commodity plunged 43% in 2001,putting its value at 36% below 1997
levels.
Shipments of boring or sinking machinery for the oil and gas fields were valued
at $6.4 million, up strongly from $0.3 million the previous year.
- 38-

International Trade Review
Eastern Strong productivity gains and market reforms have helped trigger Eastern
EurODG Europe's strong economic performance in recent years. While the region's^ economic growth slowed slightly in 2001 because of weak western European
markets, consumer and investment spending continued to post sizeable gains.
The province's exports to Eastern Europe powered ahead for the secondstraight year, climbing 18% to $132 million in 2001. As a result of this growth,
Eastern Europe was removed from its position as Alberta's smallest regional
market for the first time since 1 993.
Eastern Europe has been Alberta's fastest growing regional market over the last
five years (exports have nearly doubled), thanks to a surge in equipment sales,
mostly oil and gas related.
Russia is the major market in the region and the major force behind Alberta's
recent expansion in the region. The country accounts for 68% of Alberta exports
followed by Kazakhstan with 15% and Poland at 6%.
Alberta Exports to Eastern Europe$ Thousands
1997 1998 1999 2000 2001
Russia 45,810 34,413 26,370 62,122 90,018
Kazakhstan 934 8,794 1,964 12,884 20,204
Poland 7,692 28,845 7,794 5,952 7,498
Croatia 223 251 6,343 141 3,168
Turkmenistan 138 159 119 290 2,955
Czech Republic 1,587 1,383 2,160 3,598 1,872
Latvia 22 26 484 1,084 1,483
Romania 86 722 156 6,390 1,212
Hungary 2,377 7,763 3,270 1,235 882
Kyrgyzstan 477 296 2,646 1,256 737
Azerbaijan 10 1,917 864 825 385
Slovakia 3,685 181 89 64 383
Lithuania 1,642 810 12,192 361
Ukraine 1,039 692 743 579 348
Slovenia 800 606 1,501 459 259
Uzbekistan 46 199 148
Estonia 236 643 55 108
Yugoslavia 418 171 437 22 26
Moldova 15 15 25
Macedonia 55 24
Bulgaria 9 19
Bosnia-Herzegovina 985 189 2,797 7
Belarus 163
Georgia 2 6 31 146
Albania 1,273 394 113
Armenia 13
Total Eastern Europe 66,728 89,981 56,433 112,239 132,122
-39-

International Trade Review
Alberta Exports to Eastern Europe, 2001
Kazakhstan
15.3%
Total Exports: $132.1 Million
Russia Alberta exports to Russia expanded 45% to $90 million in 2001,comparable to
the 43% increase in Canadian exports. Russia imported just over two-thirds
(68%) of all goods sent from Alberta to Eastern Europe.
Russia has doubled its imports of Alberta goods over the last five years, as a
result of its growing purchases of oil and gas field equipment.
Machinery - most of which is oil and gas field equipment - is the largest category
of shipments to the country. In 2001,strong gains were posted by the following
top commodities: machines with individual functions valued at $20 million (up
from $3.5 million), parts for machinery for the treatment of material involving a
change in temperature totaling $14 million (up from $1 million), and parts for
lifting and handling equipment reaching $9 million (not exported in 2000).
Accounting for another 10% of exports, purchases of special purpose vehicles
reached $9 million in 2001, the first significant amount since 1993.
Beef and pork ($4.2 million), telecom equipment ( about $3 million), andprefabricated buildings ($1 .5 million) were the next largest exports to Russia in
2001.
-40-

International Trade Review
Oceania Australia, New Zealand and other South Pacific countries makes up Oceania.The smallest market of all regions, Oceania imported $92 million worth of
Alberta goods in 2001 - a drop of 36% from $145 million in 2000. Thisrepresents the largest one-year decline over the last ten years and was broughton by a 47% plunge in exports to Australia.
Alberta relies almost solely on Australia and New Zealand for exports.
Combined, they make up 97% of all goods sent to the region. In 2001 , NewZealand increased its share of regional exports to 30%, while Australia's sharefell to two-thirds.
Because of declining sales to Australia, Alberta has seen its shipments to
Oceania shrink by 47% over the last five years.
Alberta Exports to Oceania$ Thousands
1 QQ7 1 QQfl 1 QQQ ZUUU
Australia 117,376 72,780 98,845 116,658 61,453
New Zealand 49,241 41,913 39,720 26,579 27,993
Antarctica 5,912 2,013 2,138
French Polynesia 988 361
Papua New Guinea 183 78 188 64 118
Guam 143 12 80 283 111
Tonga 29Christmas Island 20
New Caledonia 2 16
Kiribati 11
Cook Islands 10
Samoa (Western) 20 9
American Samoa 3
Fiji 1,960 368 15
Tokelau 99
U.S. Minor Outlying Is. 344
Niue 131
Vanuatu 30
Wallis & Futuna Islands 4
Nauru
Total Oceania 174,912 114,803 141,724 144,589 92,272
-41 -

International Trade Review
Alberta Exports to Oceania, 2001
Total Exports: $92.3 Million
Australia Despite a sharp reduction in 2001 exports, Australia remained Alberta's largest
market in Oceania, making up two-thirds of sales to the region. In 2001,exports
were down by 47% from the previous year - larger than the 16% decline in
national exports - and by the same rate over the last five years.
Fueling most of the 2001 decline, was urea (fertilizer) and sulphur, which both
dropped close to zero after being two of the largest exports in 2000. Telecomshipments also played a role, tumbling nearly 40% during the year.
In 2001,exports of telecom equipment - including parts for telephone line
systems, switching equipment and telephones - had a value of $24 million and
accounted for 40% of the exports. Oil and gas field equipment, primarily pumpsand compressors valued at $5 million, made up the next largest category of
exports.
Other top exports were plastics ($3.6 million), artificial filament tow for cigarette
filters ($3.5 million), and frozen meat ($1.5)
-42 -
Alberta
International
Trade Review2001
Country Profiles
-43-

International Trade Rev
44 -

International Trade Review
Algeria
Exports from Alberta
Capital
Official LanguagePopulation (Jul '01 est.)
Currency
DZD/USSGDP/Capita ('00 est.)
Imports (2000)
Major Suppliers
Algiers
Arabic (French, Berber Dialects)
31,736,053
Algerian Dinar (DZD)74.813 (Jan. 01) 75.260 (2000)
$ 5,500 (US)
$ 9.2 Billion (US) (Est.)
France, Italy, Germany, Spain, US
Canada Alberta AlbertaHS Code Commodity Description iUU 1
?nnn
100110 Durum wheat $198,612,045 $75,477,584 $42,659,744843143 Parts of boring or sinking machinery, whether or not self-propelled $6,355,042 $276,143 $6,355,042843010 Pile drivers and pile-extractors $2,653,133 $0 $2,653,133854449 Insulated electric conductors =<80 Volts, nes 3>1 ,325,037 $0 $1,325,037847989 Machines & mechanical appliances nes, having individual functions $2,782,487 $91,535 $954,612841290 Parts of hydraulic & pneumatic & other power engines and motors $606,082 $252,415 $606,082847990 Parts of machines & mechanical appliances nes having individual functions $536,964 $21,203 $536,964390690 Acrylic polymers, in primary forms, nes $387,084 $0 $387,084071339 Beans dried, shelled, whether or not skinned or split, nes $8,144,206 $533,732 $354,235853690 Electrical appliances for protection of electric circuitry not over 1000 Volts $357,073 $0 $280,311071320 Chickpeas, dried, shelled, whether or not skinned or split $5,935,369 $137,011 $148,553848180 Taps, cocks, valves and similar appliances, nes $107,382 $529,907 $107,382850440 Static converters, nes $95,647 $0 $95,647902680 Instruments for measuring/checking variables of liquid gases nes $81,531 $0 $81,531271000 Petroleum oils and oils obtained from bituminous minerals, other than crude $70,577 $143,371 $70,577
TOTAL (Commodities Listed Above) $228,049,659 $77,462,901 $56,615,934TOTAL (All Commodities) $290,890,722 $84,266,481 $56,847,024
Exports from CanadaCanada Canada
HS Code Commodity Description 2000 2001
100110 Durum wheat $351,408,190 5198,612,045
071340 Lentils dried, shelled, whether or not skinned or split $24,712,263 $16,526,829230400 Soybean oilcake and other solid residue, whether or not ground $3,912,513 $9,086,113
071339 Beans dried, shelled, whether or not skinned or split, nes $2,591,354 $8,144,206
480100 Newsprint, in rolls or sheets $4,063,495 $7,927,487
843143 Parts of boring or sinking machinery, whether or not self-propelled $276,143 $6,355,042
071320 Chickpeas, dried, shelled, whether or not skinned or split $8,984,597 $5,935,369
120100 Soya beans $4,050,624 $5,280,435
040210 Milk powder not exceeding 1 .5% fat $2,558,500 $3,867,681
252400 Asbestos $686,880 $3,193,040
TOTAL (Commodities Listed Above)
TOTAL (All Commodities)$403,244,559
$489,910,486
$264,928,247
$290,890,722
Export Performance1996$'000
1997$'000
1998$'000
2000$'000
2001
$'000
ALBERTACANADA
$104,942
$622,029
$99,969$576,459
$78,373
$476,564
$84,266
$489,910$56,847
$290,891
-45-

International Trade Review
A A. "
ArgentinaCapital Buenos Aires
Official Language Spanish
Population (Jul '00 est.) 37,384,816
Currency Argentine Peso (ARS)
ARS/USS 4> 1 -U ^Jdl 1 UUJ
GDP/Capita fOOest)ff h o nnn /i ic\3> io,yuu (Uo)
Imports (2000) $ 25.2 Billion (US)
Major Suppliers EU, US, Brazil
exports trom AlbertaCanada Alberta Alberta
HS Code Commodity Description 2001 2000 2001
851719 Line telephony electrical apparatus, nes $3,389,562 4)0,0 f O Co qoq ccn3>o,oo»,ooz
841480 Air or gas compressors, hoods $2,381,480 $1,286,751 $2,304,419
310221 Ammonium sulphate, in packages weighing more than 10 kg $1,534,503 $1,840,985 $1,534^503
250300 Sulphur of all kinds $996,018 $0 $996,018
901580 Surveying, hydrographic, oceanographic, meteorological orgeo inst nes $924,302 $111,326 $924,302
843143 Parts of boring or sinking machinery, whether or not self-propelled $1,271,454 $370,418 $843,609
851790 Parts of electrical apparatus for line telephone or line telegraphy $14,612,156l[7'ii OC
O
S>/o4,^boR41°Q0 Parte rtf hwrtrsii ilir* A nnpi imatir A nthor nruA/or pnninpc and mntnreOH 1 rdllo ui iiyuidUML* Cx \JI ICUI I tdUU Ot Ull ICI puwci trliyilltJo dllU IllUlUlo $397,700 $445,728
847989 Machines & mechanical appliances nes, having individual functions $2,192,897 $1,140,571 $384,434
841 391 Parts of pumps for liquid whether or not fitted with a measuring device $377,495 $3,860,709 $375,477
470500 Semi-chemical wood pulp $347,432 $389,682 $347,432
850300 Parts of electric motors, generators, generating sets and rotary converters $342,473 $427,156 $342,473
990100 Low value export transactions and confidential commodities $1,921,580 $255,435 $307,599
843139 Parts of lifting, handling, loading or unloading machinery, nes $324,603 <CQ1 0.-M»py I ,0 11
850131 DC motors & generators with output not over 750 watts $711,374 ffOC CQ7 <CQnn c;oo
TOTAL (Hfimmori ifrip*^ LiQtpri Ahnvri $31 773 057 $10,545,909 $13,532,367
$63,756,989 $17,569,200
ExDorts from CanadaCanada Canada
HS Code Commodity Description zUUU ZUU1
851 790 Parts of electrical apparatus for line telephone or line telegraphy $21,065,034 $14,612,156
84771 Injection-molding machinery for working rubber or plastic $3,538,1 1
1
$7,707,783
480100 Newsprint, in rolls or sheets $13,187,940 $6,581,483
851719 Line telephony electrical apparatus, nes $5,573 $3,389,562ft^1 7 £\C\ Annorati IC f/~ir warrior r*l trrant lino ewcrtomc: nr for rlinitol lino c\rctamc nocOJ I / JU Mppdl dlUo, IUI Udl llel-OUl 1 Gill III 1c byblclllb, Ui IUI Uiy ILdl IIHo byblcl 1 lb , Tlcb $3,486,996 $2,818,110
540410 Synthetic monofilament > 67 decimeters cross section < 1 mm $3,732,106 $2,785,283
071 340 Lentils dried, shelled, whether or not skinned or split $913^983 $2,768,125
390190 Polymers of ethylene nes, in primary forms $6,853,058 $2,524,088
852520 Transmission apparatus, for radio-telephony incorp. reception apparatus $13,434,220 $2,433,525
841480 Air or gas compressors, hoods $1,286,751 $2,381,480
TOTAL (Commodities Listed Above) $67,503,772 $48,001,595
TOTAL (All Commodities) $238,737,233 $126,592,330
Export Performance1997 1998 1999 2000 2001
$'000 $'000 $'000 $'000 $'000
ALBERTA $42,978 $20,248 $29,427 $63,757 $17,569
CANADA $353,557 $299,690 $198,985 $238,737 $126,592
-46-
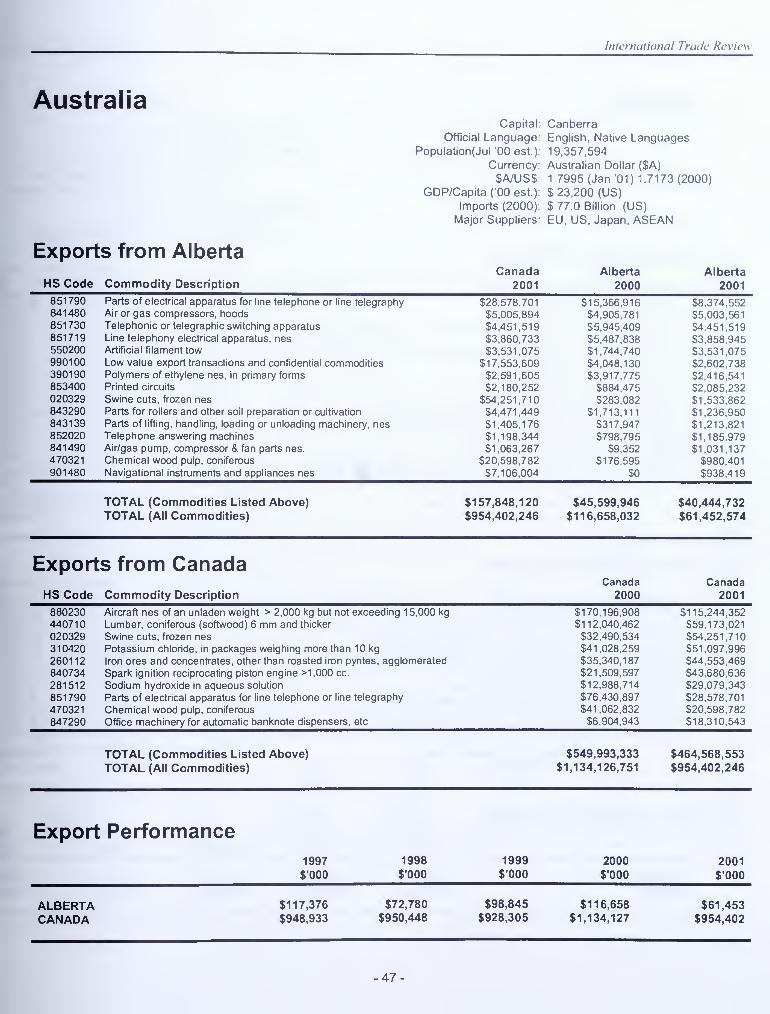
International Track' Review
AustraliaCapital
Official LanguagePopulationJul 00 est.)
Currency
$A/US$GDP/Capita ('00 est.)
Imports (2000)
Major Suppliers
Canberra
English, Native Languages
19,357,594
Australian Dollar ($A)
1.7995 (Jan '01) 1.7173 (2000)
$23,200 (US)
$77.0 Billion (US)
EU, US, Japan, ASEAN
Exports from AlbertaWell IdUd Ml Ucl Id Ml Utri la
HS Code Commodity Description 2001 2000 2001
851790 Parts of electrical apparatus for line telephone or line telegraphy $28,578,701 $15,366,916 $8,374,552841480 Air or gas compressors, hoods $5,005,894 $4,905,781 $5,003,561851730 Telephonic or telegraphic switching apparatus $4,451,519 $5,945,409 $4,451,519851719 Line telephony electrical apparatus, nes Cc; AQ.7 Q'lQ
550200 Artificial filament tow $3,531 ,075 $1 1744
(740 S3 531 075
990100 Low value export transactions and confidential commodities $17 553 609 $4 048 130 ?,? fifl? 738390190 Polymers of ethylene nes, in primary forms $2 591 605 S3 Q17 77«;VvJ.J I',' ' -J f,? 41 fi 541IU, iTt I
853400 Printed circuits $2,180,252 $884 475Sit \JW T , ~T f ^ $2 085 232020329 Swine cuts, frozen nes $54,251,710 $283 082 $1 533 862843290 Parts for rollers and other soil preparation or cultivation $4,471,449 $1,713,111 $1,236,950843139 Parts of lifting, handling, loading or unloading machinery, nes $1,405,176 $317,947 $1,213,821852020 Telephone answering machines $1,198,344 $798 795 $1 185 979841490 Air/gas pump, compressor & fan parts nes. $1 063 267 $9 35? $1 031 1 37J I ,UJ 1 , 1 J/
470321 Chemical wood pulp, coniferous $20,598,782 $176,595 $980,401901480 Navigational instruments and appliances nes $7,106,004 $0 $938,419
TOTAL (Commodities Listed Above) $157,848,120 $45,599,946 $40,444,732TOTAL (All Commodities) $954,402,246 $116,658,032 $61,452,574
Exports from CanadaCanada Canada
HS Code Commodity Description 2000 2001
880230 Aircraft nes of an unladen weight > 2,000 kg but not exceeding 15,000 kg $170,196,908 $115,244,352440710 Lumber, coniferous (softwood) 6 mm and thicker $112,040,462 $59,173,021
020329 Swine cuts, frozen nes $32,490,534 $54,251,710310420 Potassium chloride, in packages weighing more than 10 kg $41,028,259 $51,097,996
260112 Iron ores and concentrates, other than roasted iron pyrites, agglomerated $35,340,187 $44,553,469
840734 Spark ignition reciprocating piston engine >1,000 cc. $21,509,597 $43,680,636
281512 Sodium hydroxide in aqueous solution $12,988,714 $29,079,343
851790 Parts of electrical apparatus for line telephone or line telegraphy $76,430,897 $28,578,701
470321 Chemical wood pulp, coniferous $41,062,832 $20,598,782
847290 Office machinery for automatic banknote dispensers, etc $6,904,943 $18,310,543
TOTAL (Commodities Listed Above) $549,993,333 $464,568,553
TOTAL (All Commodities) $1,134,126,751 $954,402,246
Export Performance
1997 1998 1999 2000 2001$'000 $'000 $'000 $'000 $'000
ALBERTA $117,376 $72,780 $98,845 $116,658 $61,453
CANADA $948,933 $950,448 $928,305 $1,134,127 $954,402

International Trade Review
AustriaCanital-wa^JI Lai. Vienna
Official Lanniianp" GermanPnnt ilatinn I lul '00 p<it V 8,131,111
Currency: Austrian Schilling (ATS), Euro
LIU l Ul VJO«J>. 1.0659 (Jan 00) 1.0854 (2000)
1 Euro =13.7603 Austrian shillings
GDP/Capita ('99 est.): $ 25,000 (US)
Imports (2000): $65.6 Billion (US)
Major Suppliers: EU, US, Switzerland, Hungary
Exports from Albertavul laud Alberta Alberta
no UOQ6 LfOrnmouiiy uescnpuon zuu i 2000 2001
470321 Chemical wood pulp, coniferous $10,906,240 C3 7*3Q HOC5>J, / oo,yob
470500 Semi-chemical wood pulp $11,225,338 $3,539,397 $2,850,210
901580 Surveying, hydrographic, oceanographic, meteorological orgeo inst nes $926,192 $0 $926,192
732690 Articles, iron or steel, nes $1,010,035
847990 Parts of machines & mechanical appliances nes having individual functions $680,129 $0 $276,806
9021 30 Artificial parts of the body, nes $261 ,772 $371,162 $246^32880330 Airplane and helicopter parts, nes $4,81 1 ,246 $313,143 $241,117841381 Other pumps for liquids, nes $229,783 $277,926 $200,380
901910 Mechanotherapy appliances; massage app; psych, aptitude testing equip. $302,970 $50,514 $189,201
950699 Articles & equip for sports & outdoor games nes & swimming & paddling $2,599,008 $351,677 $181,078990100 Low value export transactions and confidential commodities $2,224,210 $23,455 $121,627
750400 Powders and flakes, nickel $101,017 $30,000 $101,017843143 Parts of boring or sinking machinery, whether or not self-propelled $1 10,471 $8,853 $76,763R ci44 (iQ Flprtriral rnnrinrtnrs nvpr RHV <1 flflf) V nnt fittpri with rnnnprtnr<; <S7'S 9R9 $0 $74,161
841290 Parts of hydraulic & pneumatic & other power engines and motors $81,784 $0 $36,163
TOTAL (Commodities Listed Above) $35,545,457 $8,732,620 $10,409,903TOTAL (All Commodities) $298,187,787 $23,912,515 $10,642,962
Exports from CanadaCanada Canada
no LrOuG vyornmocjiiy uescnpiion 2000 2001
880230 Airplanes/aircraft with leaden weight > 2000Kg, but <1 5,000 Kg $143,555,212 $70,846,900
870899 Motor vehicle parts nes $22,480,552 $38,236,126
820730 Tools for pressing, stamping or punching metal parts $2,606,682 $23,886,550
851 790 Parts of electrical apparatus for line telephone or line telegraphy $799,474 $13,419,102
470500 Semi-chemical wood pulp $13,196,280 $11,225,338
470321 Chemical wood pulp, coniferous $16,514,448 $10,906,240
870870 Wheels including parts and accessories for motor vehicles $743!846 $9!689!l67
9401 90 Parts of seats other than those of heading No 94.02 $16,683,762 $8,574,867
OH I 1 9u r dl Lo Ul 1 1 Icltjl III lt;o IUI WUI Ml iy IUUUcI Ul UldoUU, Ul IUI 11 Ic 1 1 Idl IU 1 dOlU 1 C Ul 11 Icbc |J 1 UU U Olb $8,228,523 $7,795,559
470329 Chemical wood pulp, non-coniferous $20,967,432 $7,426,045
TOTAL (Commodities Listed Above) $245,776,211 $202,005,894
TOTAL (All Commodities) $344,930,751 $298,187,787
Export Performance1997 1998 1999 2000 2001
$'000 $'000 $'000 $'000 $'000
ALBERTA $31,355 $29,868 $29,951 $23,913 $10,643CANADA $293,820 $259,881 $198,881 $344,931 $298,188
-48-
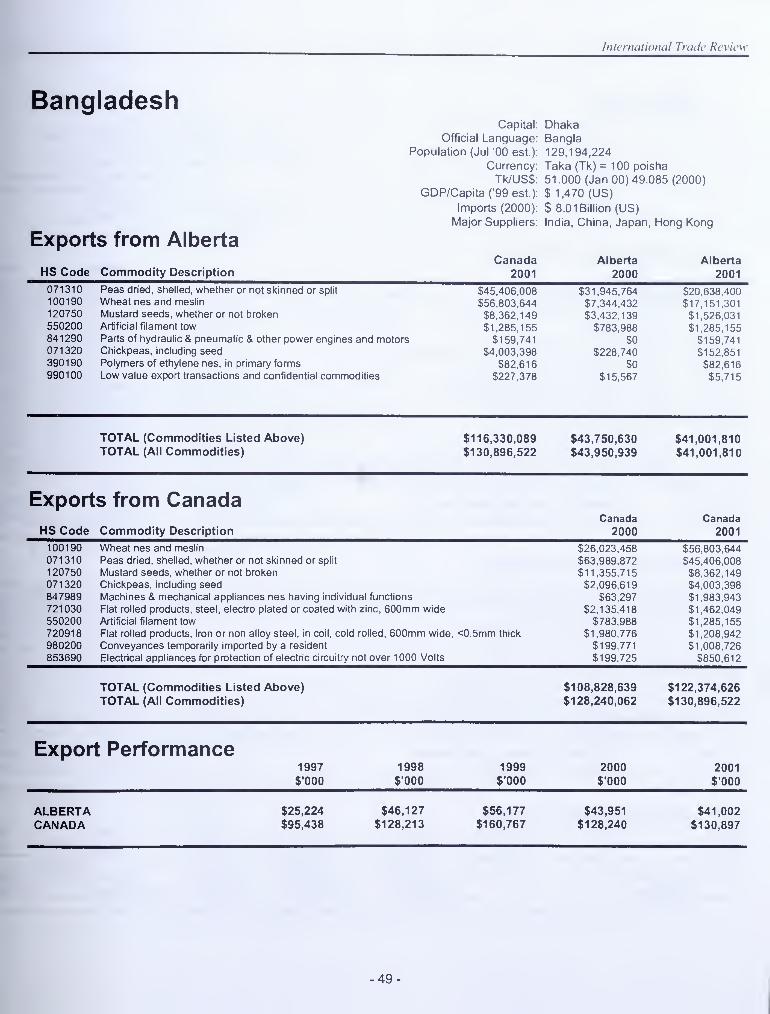
International Trade Review
BangladeshCapital: Dhaka
Official Language: Bangla
Population (Jul '00 est.): 129,194,224
Currency: Taka (Tk) = 100 poisha
Tk/US$: 51.000 (Jan 00)49.085 (2000)
GDP/Capita ('99 est.): $ 1,470 (US)
Imports (2000): $ 8.01 Billion (US)
Major Suppliers: India, China, Japan, Hong Kong
Exports from AlbertaCanada Alberta Alberta
HS Code Commodity Description 2001 2000 2001
071310 Peas dried, shelled, whether or not skinned or split $45,406,008 $31,945,764 $20,638,400100190 Wheat nes and meslin $56,803,644 $7,344,432 $17,151,301120750 Mustard seeds, whether or not broken $8,362,149 $3,432,139 $1,526,031550200 Artificial filament tow $1,285,155 $783,988 $1,285,155841290 Parts of hydraulic & pneumatic & other power engines and motors $159,741 $0 $159,741071320 Chickpeas, including seed $4,003,398 $228,740 $152,851390190 Polymers of ethylene nes, in primary forms $82,616 $0 $82,616990100 Low value export transactions and confidential commodities $227,378 $15,567 $5,715
TOTAL (Commodities Listed Above) $116,330,089 $43 750 630 $41 001 810TOTAL (All Commodities) $130,896,522 $43,950,939 $41,001,810
Exports from Canadaual laU
a
PanadaV/di laud
HS Code Commodity Description 2000 2001
100190 Wheat nes and meslin $26,023,458 $56,803,644071310 Peas dried, shelled, whether or not skinned or split $63,989,872 $45,406,008120750 Mustard seeds, whether or not broken $11,355,715 $8,362,149071320 Chickpeas, including seed $2,096,619 $4,003,398847989 Machines & mechanical appliances nes having individual functions $63,297 $1,983,943721030 Flat rolled products, steel, electro plated or coated with zinc, 600mm wide $2,135,418 $1,462,049550200 Artificial filament tow $783,988 $1,285,155
720918 Flat rolled products, iron or non alloy steel, in coil, cold rolled, 600mm wide, <0.5mm thick $1,980,776 $1,208,942
980200 Conveyances temporarily imported by a resident $199,771 $1,008,726
853690 Electrical appliances for protection of electric circuitry not over 1000 Volts $199,725 $850,612
TOTAL (Commodities Listed Above) $108,828,639 $122,374,626
TOTAL (All Commodities) $128,240,062 $130,896,522
Export Performance1997 1998 1999 2000 2001$'000 $'000 $'000 $'000 $'000
ALBERTA $25,224 $46,127 $56,177 $43,951 $41,002
CANADA $95,438 $128,213 $160,767 $128,240 $130,897
-49 -

International Trade Revie\
BelgiumCapital Brussels
Official Language Dutch, French, GermanPopulation (Jul '00 est.) 10,241,506
Currency Belgian Franc (BF] Euro
Euro/US$ 0.9867 (Jan 00) 0.9386 (2000)
1 Euro = 40.3399 Belgian Francs
$23,900 (US)
imports (zuin
)
$ 172.9 Billion (US)
Major Suppliers EU, US
Exports from AlbertaCanada Alberta Alberta
no uuuc oui 1 1 1
1
iuu i iy ucaLi i|jiiun 2001 2000 2001
750210 Nickel unwrought, not alloyed $507,523,957 $35,606,087 $25,819,890
470329 Chemical wood pulp, non-coniferous $43,622,296 $37,442,066 $24,597,557
810510 Cobalt $20,104,004 $4,634,553 $11,955,855
550200 Artificial filament tow $8,167,082 $367,111 $8,167,082
071310 Peas dried, shelled, whether or not skinned or split $29,809,981 $4,624,633 $6,886,699
100190 Wheat nes and meslin $15,493,081 $6,384,151 $5,459,184
841950 Heat exchange units, industrial type $4,267,092 $0 $4,227,686
120750 Mustard seeds, whether or not broken <C1 P 7P'5 Q1 A3> I O, / Do,y 1
4
3>4,4U0,O^: 1 %t>0,4Z I ,OOU
120400 Linseed, whether or not broken $121,432,306 $2 431 842 $3 396 151
2701 1 2 Bituminous coal $14,104,432 $9 290 574 $3 103 999
100110 Durum wheat $14 035 796 $526 623 $3,014,141
470321 Chemical wood pulp, coniferous $159,242,291 $7,397,406 $2,766,047
390190 Polymers of ethylene nes, in primary forms $8,398,027 $0 $2 680 271
990100 Low value export transactions and confidential commodities $32,165,624 $3,922,344 $2,625,749
150200 Fats, bovine, sheep or goat, raw or rendered $20,428,783 $0 $1,943,198
TOTAL (Commodities Listed Above) $1,015,558,666 $117,033,717 $110,064,889
TOTAL (All Commodities) $1 835 714 399 $153,203,889 $119,392,385
Exports from CanadaCanada Canada
HS Code Commodity Description 2000 2001
710210 Diamonds, unsorted $470,752,233 $507,523,957
470321 Chemical wood pulp, coniferous $288,863,687 $159,242,291
1 20400 Linseed, whether or not broken <£QA i AC C70Ij>o4, 140,0 / o (C101 A TO r
X(\c.
ip 1Z1 ,4OZ,OU0
750210 Nickel unwrought, not alloyed $135,499,918 $99,989,128
260800 Zinc ores and concentrates $70,196,618 $86,941,864
470329 Chemical wood pulp, non-coniferous $68,973,451 $43,622,296
71 1290 Waste and scrap of precious metal nes $27,771,339 $38,658,266
440710 Lumber, coniferous (softwood), 6 mm and thicker $65,797,373 $33,858,949
990100 Low value export transactions and confidential commodities $58,319,691 $32,165,624
071310 Peas dried, shelled, whether or not skinned or split $26,644,695 $29,809,981
TOTAL (Commodities Listed Above) $1,296,965,678 $1,153,244,662
TOTAL (All Commodities) $2,093,963,356 $1,835,714,399
Export Performance1997 1998 1999 2000 2001
$'000 $'000 $'000 $'000 $'000
ALBERTA $111,589 $111,880 $112,930 $153,204 $119,392
CANADA $1,463,414 $1,463,776 $1,838,074 $2,093,963 $1,835,714
- 50 -

International Trade Review
Brazil
Exports from Alberta
Capital
Official LanguagePopulation (Jul '00 est.)
Currency
R$/US$GDP/Capita ('99 est.)
Imports (2000)
Major Suppliers
Brasilia
Portuguese
172,860,370
Real (R$)
1.804 (Jan 00) 1.815 (2000)
$6,150 (US)
$48.8 Billion (US)
US, Argentina, Germany, Japan
Canada Alberta AlbertaHS Pnrlp wuiiiiiiuuiiy ucoui luuuii cUUl ZUUU
250300 Sulphur of all kinds $39,671,687 $46,846,790 $29,872,126270112 Bituminous coal $92,670,208 $33,046,993 $21,702,012880230 Airplanes/aircraft with leaden weight > 2000Kg, but <1 5,000 Kg. $7,177,625 $0 $7,177,625843143 Parts of boring or sinking machinery, whether or not self-propelled $7,247,997 $20,397 $5,629,032110710 Malt, not roasted $15,239,088 $7,200,527 $3,846,449850239 Generating sets, electric, nes $3,763,826 $0 $3,763,826100190 Wheat nes and meslin $7,175,742 $9,126,318 $3,278,979851790 Parts of electrical apparatus for line telephone or line telegraphy $30,412,688 $3,115,925 $3,055,034852990 Parts suitable for use with the appliances of headings 85.25 $2,678,664 $285,735 $2,040,107470500 Semi-chemical wood pulp $1,827,960 $597,428 $1,631,998841121 Turbo-propellers of a power not exceeding 1 100 KW $2,231,864 $0 $1,409,274251990 Magnesia, fused, dead-burned etc & magnesium oxide, pure or not $1,096,752 $216,977 $1,096,752470321 Chemical wood pulp, coniferous $6,186,554 $0 $1,010,236390190 Polymers of ethylene nes, in primary forms $2,104,581 $6,503,584 $1,006,410848180 Taps, cocks, valves and similar appliances, nes $1,170,753 $59,739 $972,318
TOTAL (Commodities Listed Above) $220,655,989 $107,020,413 $87,492,178TOTAL (All Commodities) $874,263,871 $118,444,176 $93,692,879
Exports from CanadaCanada Canada
HS Code Commodity Description 2000 2001
480100 Newsprint, in rolls or sheets $216,804,155 $197,734,433
310420 Potassium chloride, in packages weighing more than 10 kg $212,460,134 $165,521,643270112 Bituminous coal $70,072,855 $92,670,208
250300 Sulphur of all kinds $53,664,634 $39,671,687
851790 Parts of electrical apparatus for line telephone or line telegraphy coo ocn nnn con jno cooJ>OU,4 12,000
880520 Flight simulators and parts thereof $24,293,774 $27,041,343
110710 Malt, not roasted $22,754,773 $15,239,088
847710 Injection-molding machinery for working rubber or plastic $2,810,299 $14,639,599
990100 Low value export transactions and confidential commodities $14,852,082 $13,316,380
470200 Chemical wood pulp, dissolving grades $7,779,459 $11,834,936
TOTAL (Commodities Listed Above) $653,861,174 $608,082,005
TOTAL (All Commodities) $968,540,177 $874,263,871
Export Performance1997 1998 1999 2000 2001$'000 $'000 $'000 $'000 $'000
ALBERTA $157,442 $129,629 $108,582 $118,444 $93,693
CANADA $1,554,825 $1,255,375 $987,701 $968,540 $874,264
-51 -

International Trade Reviev
ChileCapital: Santiago
Official Language: Spanish
Population (Jul '00 est.): 15,153,797
Currency: Chilean Peso (Ch$)
Ch$/US$: 520.45 (Jan 00) 508.78 (2000)
GDP/Capita ('99 est.): $ 12,400(US)
Imports (2000): $ 13.9 Billion (US)
Major Suppliers: US, EU, Argentina, Brazil
Exports from AlbertaCanada Alberta Alberta
HS Code Commodity Description 2001 2000 2001
270112 Bituminous coal $31,143,857 $24,987,284 $21,824,650
851790 Parts of electrical apparatus for line telephone or line telegraphy $12,176,135 $35 355 612 $9 740 035
100110 Durum wheat $28,438,943 $4,463,187 $6,108,493
110710 Malt, not roasted $6,068,337 $0 $6,068,337
100190 Wheat nes and meslin $15,526,336 $12,761,005 $5,470,226
3901 10 Polyethylene having a specific gravity of less than 0.94 $3,931,957 $5,157,358 $3,671,243
390190 Polymers of ethylene nes, in primary forms $1,441,768 $1,736,645 $1,441,768
020622 Bovine livers, edible, frozen $1,431,154 $430,490 $1,399,663
841480 Air or gas compressors, hoods $977,106 $0 $977,106RA03^n Airnlano anH holipnntcsr nartc noc $0 $382,408
843149 Parts of cranes, work-trucks, shovels, and other construction equipment $2,106,938fl"}
o
a ore$324,255 $313,294
854690 Electrical insulators nes $813,058 $0 $288,036
841869 Refrigeration/freezing equipment, nes $701,061 $0 $281 ,064
940600 Prefabricated buildings $673,803 $0 $243,347
990100 Low value export transactions and confidential commodities $4,269,833 $134,925 $214,869
TOTAL (Commodities Listed Above) $110,124,809 $85,350,761 $58,424,539
TOTAL (All Commodities) $353,335,924 $115,719,392 $61,585,837
Exports from CanadaCanada Canada
HS Code Commodity Description 2000 2001
270112 Bituminous coal $34,911,058 $31,143,857
100110 Durum wheat $20,779,820 $28,438,943
310420 Potassium chloride, in packages weighing more than 10 kg !bio,ozy,ioo C A QCQ POQ
100190 Wheat nes and meslin $36,221,369 $15,526,336
48041 1 Paper, kraftliner, in rolls, unbleached, uncoated $20,181,328 $15,473,214
851 790 Parts of electrical apparatus for line telephone or line telegraphy $43,618,539 $12,176,135
480510 Paper, fluting (corrugating medium), in rolls, semi-chemical, uncoated $5,166,755 $9,609,988
721932 Flat rolled stainless steel >600mm with cold rolled plating under 3.75 mm thick $3,977,253 $6,393,470
850300 Parts of electric motors, generators, generating sets and rotary converters $0 $6,387,445
110710 Malt, not roasted $64,605 $6,068,337
TOTAL (Commodities Listed Above) $178,249,862 $149,571,353
TOTAL (All Commodities) $433,805,148 $353,335,924
Export Performance1997 1998 1999 2000 2001
$'000 $'000 $'000 $'000 $"000
ALBERTA $54,531 $32,561 $76,699 $115,719 $61,586
CANADA $379,291 $329,183 $351,901 $433,805 $353,336
-52-

International Trade Review
China, People's Republic ofCapital: Beijing
Official Language: Standard Chinese or Mandarin
Population (Jul '00 est.): 1,246,832,482
Currency: Yuan (Y)
Y/US$: 8.2793 (Jan. 00) 8.2783 (2000)
GDP/Capita ('99 est.): $ 3,800 (US)
Imports (1998): $ 165.8 Billion (US)
Major Suppliers: Japan, US, Taiwan, S. Korea
Exports from AlbertaCanada Alberta Alberta
MS Code Commodity Description 2001 2000 2001
290531 Ethylene glycol (ethanediol) $251,744,079 $165,479,997 $210,362,335120500 Canola or colza seeds $381,776,520 $102,356,747 $129,613,129550200 Artificial filament tow $90,251,943 $94,458,071 $90,251,943100300 Barley $159,477,349 $37,721,773 $66,294,734390110 Polyethylene having a specific gravity of less than 0.94 ICQ QOQ 7H1 oi £ J, oh t ,zy t
ffco cni cci3)00, OUT ,OCH
100190 Wheat nes and meslin $134,170,599 $37,076,281 $47,269,041250300 Sulphur of all kinds $49 771 "3Q8 $81 787 748||IU Iff Ul if "to $41 426 418470500 Semi-chemical wood pulp $1 12 248 914 $32 825 240 $40 689 042470329 Chemical wood pulp, non-coniferous $41 2Q^ 1 QR $604 668 $27 097 495390190 Polymers of ethylene nes, in primary forms $25 219 222 $2 519 776 $24 435 957410121 Bovine hides, whole, fresh or wet-salted $25 650 714 $24 040 584 $23 228 971
410122 Butts and bends, bovine animals, fresh or wet-salted $18,391,810 $0 $18,391 ,810
390120 Polyethylene having a specific gravity of 0.94 or more $16 603 361 $306 547 $16 363 544\i> 1 U,UUJ,^/tt
841381 Other pumps for liquids, nes $1^ 1Q1 9R4 $9 01 1 Q4^ Slfl 740 4?0
470321 Chemical wood pulp, coniferous $304,846,322 $11,920,541 $6,693,545
TOTAL (Commodities Listed Above) $1 684 567 394 $716 697 213 $809 360 045
TOTAL (All Commodities) $3,919,854,131 $771,421,707 $886,476,115
Exports from Canadavul IdUu V/dlluUd
HS Code Commodity Description 2000 2001
880230 Airplanes/aircraft with leaden weight > 2000Kg, but <1 5,000 Kg $103,750,345 $392,571,700
120500 Canola or colza seeds $301,492,625 $381,776,520
310420 Potassium chloride, in packages weighing more than 10 kg $413,890,911 $331,759,312
470321 Chemical wood pulp, coniferous $309,687,852 $304,846,322
290531 Ethylene glycol (ethanediol) $199,859,120 $251,744,079
100300 Barley $90,742,780 $159,477,349
852520 Transmission apparatus, for radio-telephony incorporating receivers $24,155,420 $153,498,655
284510 Heavy water (Deuterium oxide) $0 $151,609,979
100190 Wheat nes and meslin $105,237,448 $134,170,599
470500 Semi-chemical wood pulp $172,698,150 $112,248,914
TOTAL (Commodities Listed Above) $1,721,514,651 $2,373,703,429
TOTAL (All Commodities) $3,266,061,980 $3,919,854,131
Export Performance1997 1998 1999 2000 2001"000 $'000 $'000 $'000 $'000
ALBERTA $435,124 $482,021 $558,502 $771,422 $886,476
CANADA $2,355,275 $2,476,993 $2,519,116 $3,266,062 $3,919,854
-53-

International Trade Revie\
ColombiaCapital: Bogota
Official Language: Spanish
Population (Jul '00 est.): 39,685,655
Currency: Colombian Peso (Col$)
Col$/US$: 1,925.63 (Jan 00) 1,756.23(2000)
GDP/Capita ('99 est.): $ 6,200 (US)
Imports (2000): $ 10.0 Billion (US)
Major Suppliers: US, EU, Andean Comm., Japan
Exports from AlbertaCanada Alberta Alberta
HS Code Commodity Description 2001 2000 2001
100190 Wheat nes and meslin $130,694,133 $32,330,028 $47,903,521
843049 Boring or sinking machinery, not self-propelled nes $2,540,990 $0 $2,540,990
071332 Beans, small red (Adzuki) dried, shelled, whether or not skinned or split $2,802,803 $3,634,750 $2!o87!l97
981000 Arms, military stores or munitions of war to remain in country of export $1,204,061 $0 $1,204,061
100300 Barley $2,062,747 $15,198 $857,484
843143 Parts of boring or sinking machinery, whether or not self-propelled $828,830 $537,023 $828,830
844220 Machinery apparatus, equipment for typesetting or comparable process $616,600 $0 $616,600
903190 Parts & accessories for measuring or checking instruments, appliances etc $61 1 ,834 $0 $610,455
841290 Parts of hydraulic & pneumatic & other power engines and motors $529,382 boob , fbu CC)7 OOC
071310 Peas dried, shelled, whether or not skinned or split $14,402,813 <£ A A AO CO/I3)1 ,44o,Oo4 $ol /\bl b
903180 Measuring & checking instruments, appliances & machinery nes $548,290 (T A A A 0705>1 1 1 ,y to 3>491 ,o93
100110 Durum wheat $2,277,333 3>4o f ,OUu C 1 QQ flQCJ>4c5y,UoO
071320 Chickpeas, including seed $2,063,571 U>1 ,Uo1 ,4b/ c a n A OCA&4U4,zo4
841311 Pumps for dispensing fuel or lubricants, garage use $395,736 a>oyo, f ob
843149 Parts of cranes, work-trucks, shovels, and other construction equipment $494,589 <tOC CQQ (one oc7
TOTAL (Commodities Listed Above) $162,073,712 $40,184,042 $59,869,825
TOTAL (All Commodities) $340,266,009 $44,056,747 $64,937,066
Exports from CanadaCanada Canada
HS Code Commodity Description 2000 2001
100190 Wheat nes and meslin $91,768,015 $130,694,133
480100 Newsprint, in rolls or sheets $43,928,718 $37,712,111
071340 Lentils dried, shelled, whether or not skinned or split $22,465,491 $18,583,163
740312 Wire bars, copper, unwrought $5,907,900 $17,732,118
071310 Peas dried, shelled, whether or not skinned or split t14 nf!1 ARO
310420 Potassium chloride, in packages weighing more than 10 kg $13,235,200 $12,226,160
481091 Paper paperboard excluding kraft/graphic clay coated multi-ply in rolls or sheets $2,908,007 $7,737,633
480260 Paper, fine, wood containing, in rolls or sheets, uncoated, nes $19,173,077 $6,842,183
851790 Parts of electrical apparatus for line telephone or line telegraphy $1,374,961 $5,109,466
380830 Herbicides, anti-sprouting prod & plant growth regulators, packaged for retail or forms $1,803,309 $5,024,018
TOTAL (Commodities Listed Above) $216,626,130 $256,063,798
TOTAL (All Commodities) $298,004,075 $340,266,009
Export Performance1997 1998 1999 2000 2001
$'000 $'000 $'000 $'000 $'000
ALBERTA $57,477 $53,167 $32,077 $44,057 $64,937
CANADA $431,357 $436,628 $243,330 $298,004 $340,266
-54-

International Track' Review
Cuba
Exports from Alberta
Capital
Official LanguagePopulation (Jul '00 est.)
Currency
Cu$/US$GDP/Capita ('99 est.)
Imports (2000)
Major Suppliers
HavanaSpanish
11,141,997
Cuban Peso (Cu$)
1.000 (non-convertible)
$ 1,700 (US)
$ 3.2 Billion (US)
Spain, Venezuela, Mexico
Canada Alberta Albertano uuuc isornmouiiy uesenpuon o fin a2001 2000 .2001
250300 Sulphur of all kinds $12,392,472 $18,607,646 $12,376,259100190 Wheat nes and meslin $24,240,581 $8,559,988 $8,540,293071310 Peas dried, shelled, whether or not skinned or split
C ^ r\ i Ac c a~j$2,083,91
1
tt" A COO A C C$4, 539, 165
843143 Parts of boring or sinking machinery, whether or not self-propelled 1M O^fi fl17
382490 Chemical products, prepared & residual products of the industry $2,898,557 $647,058 $2,562,543020622 Bovine livers, edible, frozen $2,409,021 $241,049 $1,678,287020714 Chicken and capon cuts and edible offal, frozen $17,938,440 $1,072,128 $974,334810890 Titanium and articles thereof, nes $930,831 $4,513 $925,192732690 Articles, iron or steel, nes $1,061,667 $260,263 $700,393990100 Low value export transactions and confidential commodities $9,524,976 $629,324 $682,540847990 Parts of machines & mechanical appliances nes having individual functions $2,209,580 $1,448,099 $615,860841391 Parts of pumps for liquid whether or not fitted with a measuring device $688,933 $334,263 $572,078870590 Special purpose vehicles nes $624,472 $74,896 $561,972853710 Controls etc with electronic apparatus for electrical controls not over 1000 V $616,872 $355,353 $533,975843139 Parts of lifting, handling, loading or unloading machinery, nes $555,459 $419,790 $523,436
TOTAL (Commodities Listed Above) $102,677,445 $36,086,441 $40,143,144
TOTAL (All Commodities) $338,706,449 $55,383,334 $57,916,416
Exports from CanadaCanada Canada
HS Code Commodity Description 2000 2001
100190 Wheat nes and meslin $24,297,168 $24,240,581
071310 Peas dried, shelled, whether or not skinned or split $9,556,833 $20,105,517
020714 Chicken and capon cuts and edible offal, frozen $15,098,558 $17,938,440
250300 Sulphur of all kinds $18,607,646 $12,392,472
020329 Swine cuts, frozen nes 3>b, 542,646 C* a r\ aaa r\ a o$10,144,918
990100 Low value export transactions and confidential commodities $9,713,670 $9,524,976
840290 Super-heated water boilers & steam generator boiler parts $372,233 $9,068,968
870899 Motor vehicle parts nes $5,766,571 $8,485,462
840681 Turbines, steam and other vapor, over 40 mw nes $0 $8,305,000
040210 Milk powder not exceeding 1 .5% fat $9,933,427 $7,931,335
TOTAL (Commodities Listed Above) $99,888,752 $128,137,669
TOTAL (All Commodities) $299,368,519 $338,706,449
Export Performance1997 1998 1999 2000 2001$'000 $'000 $'000 $'000 $'000
ALBERTA $66,620 $83,996 $49,326 $55,383 $57,916
CANADA $323,364 $430,698 $353,718 $299,369 $338,706
-55-

International Trade Revie\
EcuadorCapital UUIIO
Official Language Spanish
Population (Jul '00 est.) 12,920,092
Currency Sucre (S )
9 /I 19$ 24,860.7 (Jan 00) 11,186.8 (2000)
GDP/Capita ('99 est.) $ 4,300 (US)
Imports (2000) $2.9 Billion (US)
Major Suppliers Colombia, Japan, Venezuela
Exports from AlbertaCanada Alberta Alberta
HS Code Commodity Description 2001 2000 2001
100190 Wheat nes and meslin $60,302,956 $17,238,568 $21,245,823
843143 Parts of boring or sinking machinery, whether or not self-propelled $8,438,609 $1 647 929 eg 274 242
847989 Machines & mechanical appliances nes having individual functions $3,467,049 $3,547,981 $3,442,049
980200 Conveyances temporarily imported by a resident $776,731 $0 $774,529847990 Parts of machines & mechanical appliances nes having individual functions $750,409 $909,328 $731,756
843850 Machinery for meat or poultry preparation $531,528 $0 $531,528
100110 Durum wheat $2,147,662 $418,776 $461,085848210 Bail bearings $364,860 $0 $364,860
902780 Physics or chemistry apparatus for measuring heat & viscosity nes $222,334 $136,406 $222,334
841290 Parts of hydraulic & pneumatic & other power engines and motors $200,802 $0 $200,802
990100 Low value export transactions and confidential commodities $1,471,754ffnci An A$252,4J4 (POO ooc
980600 Settler's personal and household effects $294,371 <ro a ccr\3)04,DOU (TOO 0~70$oU,Zf
Z
870590 Special purpose vehicles nes $80,000 $0 $80,000
901580 Surveying, hydrographic, oceanographic, meteorological or geophysical inst nes $60,108 $0 fl* C'O ^ no$60,108
853710 Controls etc with electronic apparatus for electrical controls not over 1000 V $81,155 $0 $55,547
TOTAL (Commodities Listed Above) $79,190,328 $24,186,072 $36,624,270
TOTAL (All Commodities) $133,301,901 $29,016,173 $37,301,009
Exports from CanadaCanada Canada
HS Code Commodity Description 2000 2001
100190 Wheat nes and meslin $48,206,687 $60,302,956
480411 Paper, kraftliner, in rolls, unbleached, uncoated $63,912 $10,387,103
310420 Potassium chloride, in packages weighing more than 10 kg $1,754,268 $9,627,713
843143 Parts of boring or sinking machinery, whether or not self-propelled $1,661,616 S8.438.609
480100 Newsprint, in rolls or sheets $4 064 279 $6 149 759
071340 Lentils dried, shelled, whether or not skinned or split $6,113,576 $4,977,636
847989 Machines & mechanical appliances nes having individual functions $3,674,682 $3,467,049
071310 Peas dried, shelled, whether or not skinned or split $1,797,999 $2,388,661
252400 Asbestos $3,331,289 $2,208,224
100110 Durum wheat $1,949,898 $2,147,662
TOTAL (Commodities Listed Above) $72,618,206 $110,095,372
TOTAL (All Commodities) $99,538,344 $133,301,901
Export Performance1997 1998 1999 2000 2001$'000 $'000 $•000 $'000 $'000
ALBERTA $6,990 $37,108 $22,527 $29,016 $37,301
CANADA $85,302 $203,171 $83,812 $99,538 $133,302
-56-

International Trade Review
Egypt
Exports from Alberta
Capital
Official LanguagePopulation (Jul '00 est.)
Currency
£E/US$GDP/Capita ('99 est.)
Imports (2000)
Major Suppliers
Cairo
Arabic
68,359,979
Egyptian Pound (£E)
3.405 (Jan 00) 3.405 (2000)
$ 3,000 (US)
$ 15.8 Billion (US)
EU, US, Japan
Canada A 11.,..*.Alberta Alberta
HS Code Commodity Description 2001 2000 2001
100190 Wheat nes and meslin $57,358,871 $2,228,421 $20,207,749270112 Bituminous coal $18,345,381 $7,392,695 $18,345,381847330 Parts and accessories of automatic data processing machines & units thereof $3,536,267 $495,975 $3,218,402550200 Artificial filament tow $2,154,837 $0 $2,154,837841290 Parts of hydraulic & pneumatic & other power engines and motors $1,892,962 $1,509,321 $1,890,749847149 Digital automatic data processing machinery & units, as systems $1,811,019 $86,404 $1,794,294
851719 Line telephony electrical apparatus, nes $836,769 $60,276 $836,769843143 Parts of boring or sinking machinery, whether or not self-propelled $943,663 $345,083 $826,566843041 Boring or sinking machinery nes, self-propelled $770,878 $189,493 $770,878902130 Artificial parts of the body, nes $472,248 $752,756 $472,248841121 Turbo-propellers of a power not exceeding 1 100 KW $465,363 $0 $465,363851790 Parts of electrical apparatus for line telephone or line telegraphy $607,412 $101,639 $448,163847990 Parts of machines & mechanical appliances nes, having individual functions $505,747 $84,345 $240,705903180 Measuring & checking instruments, appliances & machinery nes $304,499 $293,854 $220,938851730 Telephonic or telegraphic switching apparatus $188,556 $16,631 $188,556
TOTAL (Commodities Listed Above) $90,194,472 $13,556,893 $52,081,598
TOTAL (All Commodities) $187,158,552 $16,641,885 $53,311,678
Exports from CanadaCanada Canada
HS Code Commodity Description 2000 2001
100190 Wheat nes and meslin $10,908,837 $57,358,871
480100 Newsprint, in rolls or sheets $43,843,305 $26,325,637
270112 Bituminous coal $12,764,735 $18,345,381
071340 Lentils dried, shelled, whether or not skinned or split $12,257,255 $10,064,875
260112 Iron ores and concentrates, other than roasted iron pyrites, agglomerated $0 $6,494,830
390210 Polypropylene processed forms $312,559 $4,602,655
120400 Linseed, whether or not broken $8,249,806 $4,193,936
980200 Conveyances temporarily imported by a resident $1,003,113 $3,901,723
847330 Parts and accessories of automatic data processing machines & units thereof $623,410 $3,536,267
071320 Chickpeas, including seed $1,785,694 $2,659,329
TOTAL (Commodities Listed Above) $91,748,714 $137,483,504
TOTAL (All Commodities) $167,678,571 $187,158,552
Export Performance1997 1998 1999 2000 2001$'000 $'000 $'000 $'000 $'000
$6,945 $7,333 $16,756 $16,642 $53,312$175,824 $153,091 $183,776 $167,679 $187,159
ALBERTACANADA
-57-

International Trade Revie\
FinlandCapital Helsinki
Official Language Finnish, SwedishPopulation (Jul '00 est.) 5,167,486
Cli irrpnpv Markkaa (FMk) EuroPi ir/-i/l IQCturo/uovp 1 Euro = 5.94573 Markkaa (fixed)
(jUr/uapita ( yy est.) $ 21,000 (US)
Imports (1998) $30.7 Billion (US)
Major Suppliers EU, US, Russia, Japan
Exports from AlbertaCanada Alberta Alberta
HS Code Commodity Description 2001 2000 2001
470500 Semi-chemical wood pulp $9,102,469 $11,300,548 $8,180,509
843143 Parts of boring or sinking machinery, whether or not self-propelled $2,495,769 $0 $2,397,647
732690 Articles, iron or steel, nes $737,732 $1,000,400 $714,108
843041 Boring or sinking machinery nes, self-propelled $463,687 $0 $463,687854890 Electrical parts of machinery nes in chapter 85 $392,425 $0 $378,817
847989 Machines & mechanical appliances nes, having individual functions $2,509,552 $103,128 $338,319
847330 Parts and accessories of automatic data processing machines & units thereof $1,123,647 OJi / ,ouj
90271 Gas or smoke analysis apparatus $306,438 $0 $306,438
940600 Prefabricated buildings $314,238 $0 $251,178
320890 Paints & varnishes in non-aqueous medium nes $225,838 $0 $225,838
850131 DC motors & generators with output not over 750 watts $154,429 $0 $142,700
721250 Flat rolled iron or steel, non-alloyed, <600 mm, plated or coated nes $141,896 $0 $141,896
852691 Radio navigational aid apparatus $129,921 $151,583 $129,921
880330 Airplane and helicopter parts, nes $268,907 $0 $101,189
950699 Articles & equip for sports & outdoor games nes & swimming & paddling $1,315,193 $0 $72,148
TOTAL (Commodities Listed Above) $19,682,141
TOTAL (All Commodities) $223,069,308 $14,530,808 $14,653,830
Exports from CanadaCanada Canada
HS Code Commodity Description 9AAI1/uuu ZUU1
260800 Zinc ores and concentrates $65,901,523 $56,727,000
270112 Bituminous coal (ton C\KO RHT
87031 Passenger vehicle for snow, golf carts and similar vehicles $23,001,845 $19,742,528
470500 Semi-chemical wood pulp $18,997,865 $9,102,469
870899 Motor vehicle parts nes $7,592,030 $7,385,774
440799 Lumber, non-coniferous nes $6,966,031 $7,083,278
3901 1 Polyethylene having a specific gravity of less than 0.94 $2,577,240 $4,370,820
590700 Textiles/fabric coated, theatre cladding scenery, back-cloths $7,817,609 $3,814,022
841590 Parts nes for air conditioning machines $1,661,286 $3,062,190
030379 Fish nes, with bones, frozen $3,274,895 $2,890,017
TOTAL (Commodities Listed Above) $ 137,790,324 $134,230,981
TOTAL (All Commodities) $255,482,779 $223,069,308
Export Performance1997 1998 1999 2000 2001
$'000 $'000 $'000 $'000 $'000
ALBERTA $1,912 $4,670 $3,813 $14,531 $14,654
CANADA $225,682 $197,153 $212,846 $255,483 $223,069
-58-

International Trade Review
FranceCapital
Official LanguagePopulation (Jul '00 est.)
Currency
Euro/US$
GDP/Capita ('99 est.)
Imports (2000)
Major Suppliers
Paris
French
59,329,691
French Franc (F) Euro
0.9867 (Jan 00) 0.9386 (2000)
1 Euro = 6.55957 French Francs
$ 23,300 (US)
$ 280.8 Billion (US)
European Union, US
Exports from AlbertaCanada Alberta Alberta
HS Code Commodity Description 2001 2000 2001
470500 Semi-chemical wood pulp $44,069,782 $44,875,326 $25,904,693020500 Horse, ass, mule or hinny meat, fresh, chilled or frozen $27,839,892 $16,555,429 $22,224,720852990 Parts suitable for use with the appliances of headings 85.25 $26,431,596 $2,904,515 $11,112,893750210 Nickel unwrought, not alloyed $9,928,104 $17,617,329 $9,928,104470329 Chemical wood pulp, non-coniferous $17,202,680 $5,855,089 $8,872,642020130 Bovine cuts boneless, fresh or chilled $3,525,159 $1,180,832 $2,297,060732690 Articles, iron or steel, nes $3,004,560 $4,769,786 $2,277,192902130 Artificial parts of the body, nes $2,232,342 $3,267,442 $2,213,579843143 Parts of boring or sinking machinery, whether or not self-propelled $3,516,429 $301,235 $1,923,283853810 Boards, panels, consoles etc. for electronic apparatus over 1000 volts $2,103,578 $0 $1,642,945
280300 Carbon (carbon blacks and other forms of carbon, nes) $1,286,653 $2,295,238 $1 ,1 79,232100110 Durum wheat $5,146,617 $0 $1,105,246851790 Parts of electrical apparatus for line telephone or line telegraphy <RR 978 77^
903040 Other instruments, specially designed for telecommunication $2,898,596 $0 $879,704071339 Beans dried, shelled, whether or not skinned or split, nes $3,415,680 $263,985 $800,324
TOTAL (Commodities Listed Above) $158,880,441 $100,257,190 $93,297,471
TOTAL (All Commodities) $2,035,041,401 $114,167,585 $101,321,200
Exports from CanadaCanada Canada
HS Code Commodity Description 2000 2001
271000 Petroleum oils other than crude $389,486 $225,688,875
470321 Chemical wood pulp, coniferous $213,527,844 $151,789,045
284410 Natural uranium $96,779,401 $147,579,927
990100 Low value export transactions and confidential commodities $100,156,547 $125,694,567
480100 Newsprint, in rolls or sheets $60,389,564 $91,893,711
880230 Aircraft nes of an unladen weight > 2,000 kg but not exceeding 15,000 kg; $79,025,318 $91,351,829
760110 Aluminium unwrought, not alloyed $44,380,414 $51,864,486
841122 Turbo propellers of a power exceeding 1 ,100 Kw $6,149,222 $48,590,012
841191 Parts of turbo-jets or turbo-propellers $40,464,044 $44,314,241
470500 Semi-chemical wood pulp $75,420,454 $44,069,782
TOTAL (Commodities Listed Above) $716,682,294 $1,022,836,475
TOTAL (All Commodities) $1,801,110,379 $2,035,041,401
Export Performance1997 1998 1999 2000 2001$'000 $'000 $'000 $'000 $'000
ALBERTA $56,635 $67,697 $74,153 $114,168 $101,321
CANADA $1,607,711 $1,604,006 $1,775,267 $1,801,110 $2,035,041
-59-

International Trade Review
GermanyCapital: Berlin
Official Language: GermanPopulation (Jul '00 est.): 82,797,408
Currency: Deutsche Mark (DM) Euro
Euro/US$: 1 Euro = 1 .95583 deutsche marksGDP/Capita ('97 est.): $ 22,700 (US)
Imports (2000): $ 587.6 Billion (US)
Maior SuDDliers' EU, US, Japanhi 4 m All t
Exports from AlbertaCanada Alberta Alberta
HS Code Commodity Description 2001 ?onn£UUU £UU 1
470500 Semi-chemical wood pulp $50,825,794 coo f\o a i^nrt$33,084,699 COO OOO O "7O$22,229,279
470329 Chemical wood pulp, non-coniferous $111,553,402 $35,065,507 $20,941,757
470321 Chemical wood pulp, coniferous $234,757,966 $26,580,912 $20,260,439
2701 12 Bituminous coal $75,880,115'
$0 $6J23!430732690 Articles, iron or steel, nes $5,301,000 $14,860,628 $4,118,800
9021 30 Artificial parts of the body, nes $3,511,689 $7,648,513 $3,204,294
280300 Carbon (carbon blacks and other forms of carbon, nes) $3,888,631 $5,226,588 $3,197,756
293490 Heterocyclic compounds, nes $2,981,449 $3,777,364 $2,981,449
251990 Magnesia, fused, dead-burned etc & magnesium oxide, pure or not $2,690,605 $5,017,676 $2,690,605
841 121 Turbo-propellers of a power not exceeding 1 100 KW $18,137,339 $848,210 $2,059,882
851 790 Parts of electrical apparatus for line telephone or line telegraphy $6,053,783 (0 1 ,JO 1 ,£JJ
90271 Gas or smoke analysis apparatus $2,318,838 $179,883 $1,798,929
840991 Spark ignition internal combustion piston engine parts nes $7,136,060 $0 $1,682,560
847990 Parts of machines & mechanical appliances nes, having individual functions $4,983,890 $389,114 $1,235,890
040900 Honey, natural $1,929,610 $1,471,129 $1,104,077
TOTAL (Commodities Listed Above) $531,950,171 $125,208,528 $96,163,359
TOTAL (All Commodities) $2,691,199,517 $155,467,005 $111,176,318
Exports from CanadaCanada Canada
HS Code Commodity Description 2000 2001
880230 Aircraft nes of an unladen weight > 2,000 kg but not exceeding 15,000 kg $260,797,849 $253,107,176
470321 Chemical wood pulp, coniferous $387,022,417 $234,757,966
880240 Airplanes and other aircraft, of an unladen weight exceeding 15,000 kg $0 $200,529,714
2601 12 Iron ores and concentrates, other than roasted iron pyrites, agglomerated $124,950,509 $157,795,781
470329 Chemical wood pulp, non-coniferous $177,864,358 $111,553,402
990100 Low value export transactions and confidential commodities <K1 9^ T^R 9Rfi $101 RfiR 7AV
270112 Bituminous coal $34,451,578 $75,880,1 13480100 Newsprint, in rolls or sheets $58,867,690 $59,395,62C
841 1 99 Gas turbine parts nes $16,213,851 $52,081,322
470500 Semi-chemical wood pulp $95,211,839 $50,825,794
TOTAL (Commodities Listed Above) $1,280,718,377 $1,297,795,131
TOTAL (All Commodities) $3,009,643,222 $2,691,199,517
Export Performance1997 1998 1999 2000 2001
$'000 $'000 $'000 $'000 $'00C
ALBERTA $173,848 $164,021 $138,610 $155,467 $111,176
CANADA $2,625,332 $2,543,592 $2,254,007 $3,009,643 $2,691,200
-60-

International Trade Review
Ghana
Exports from Alberta
Capital
Official LanguagePopulation (Jul '00 est.)
Currency
C/USSGDP/Capita ('99 est.)
Imports (2000)
Major Suppliers
Accra
English
19,894,014
Cedi (C)
6,895.8 (Jan 01) 5,321.68 (2000)
$ 1,900 (US)
$ 2.25 Billion (US)
UK, Nigeria, US, Germany,
Canada Alberta Alberta
HS Code Commodity Description 2001 2000 2001
100190 Wheat nes and meslin $41,967,500 $11,960,047 $14,382,825842121 Water filtering or purifying machinery or apparatus $108,076 $0 $108,076630900 Worn clothing and other worn articles $7,767,139 $21,783 $71,339990100 Low value export transactions and confidential commodities $966,637 $40,646 $42,107842199 Parts for filtering or purifying machinery and apparatus for liquids or gases $18,756 $0 $18,756843143 Parts of boring or sinking machinery, whether or not self-propelled $507,421 $0 $17,318980600 Settler's personal and household effects $3,734,796 $26,919 $15,654851719 Line telephony electrical apparatus, nes $11,971 $2,336 $11,971851790 Parts of electrical apparatus for line telephone or line telegraphy $13,894 $3,753 $9,808851730 Telephonic or telegraphic switching apparatus $6,371 $3,492 $6,371
852020 Telephone answering machines $3,255 $438 $3,255851780 Electronic telephonic and telegraphic apparatus nes $988 $0 $988854470 Insulated optical fiber cables with individually shielded fibers $891 $0 $891
853669 Electrical plugs & sockets for voltages not over 1000 Volts $541 $189 $541852499 Recorded media for reproducing sound or image, nes $366 $1,719 $366
TOTAL (Commodities Listed Above) $55,108,602 $12,061,322 $14,690,266
TOTAL (All Commodities) $65,590,963 $12,228,036 $14,691,017
Exports from CanadaCanada Canada
HS Code Commodity Description onnnzfJOl
100190 Wheat nes and meslin $32,399,305 541,967,500
630900 Worn clothing and other worn articles $5,934,355 $7,767,139
980600 Settler's personal and household effects $1,711,733 $3,734,796
110430 Germ of cereals, whole, rolled, flaked or ground $0 $3,237,927
847410 Sorting machines for earth, stone, or mineral substances $129,429 $1,321,966
990100 Low value export transactions and confidential commodities $726,254 $966,637
843143 Parts of boring or sinking machinery, whether or not self-propelled $189,152 $507,421
842920 Graders and levelers, self-propelled. $130,000 $327,999
240120 Tobacco, unmanufactured, partly or wholly stemmed or stripped $0 $326,228
020714 Chicken and capon cuts and edible offal, frozen $84,351 $287,315
TOTAL (Commodities Listed Above) $41,304,579 $60,444,928
TOTAL (All Commodities) $56,074,032 $65,590,963
Export Performance
1997 1998 1999 2000 2001$'000 $'000 $'000 $'000 $'000
ALBERTACANADA
$9,639
$69,776
$10,738
$62,021
$6,555
$57,353
$12,228
$56,074$14,691
$65,591
-61 -

International Trade Revie\
GreeceCapital Athens
Official Language Greek, English, French
Population (Jul '00 est.) 10,623,835
Currency Drachma (GRD), Euro
Euro/US$ 1 Euro=340.75 drachmaeGDP/Capita ('00 est.) $ 17,200 (US)
Imports (2000) $ 33.9 Billion (US)
Major Suppliers Germany, Italy, UK, US
Exports from AlbertaCanada Alberta Alberta
HS Code Commodity Description 2001 2000 2001
100190 Wheat nes and meslin $23,386,785 $4,791,485 $8,239,631
071339 Beans dried, shelled, whether or not skinned or split, nes $4,282,492 $1,796,069 $3,259,150
843143 Parts of boring or sinking machinery, whether or not self-propelled $962,499 $7,097 $913,038990100 Low value export transactions and confidential commodities $2,128,320 $14,724 $80,168
230910 Dog and cat food, put up for retail sale $217,723 $41,196 $72,847
902130 Artificial parts of the body, nes $40,625 $11,891 $40,625
851750 Apparatus, for carrier-current line systems, or for digital line systems, nes $53,218 $785 $38,235
852520 Transmission apparatus, for radio-telephony incorporating receivers $34,866 $0 $34,866
847330 Parts and accessories of automatic data processing machines & units thereof $617,317 $0 $33,460
051110 Bovine semen $52,967 $0 $20,539
846592 Planer mill etc, machinery for working wood, cork, bone etc. $31,706 $14,053 $19,706
071320 Chickpeas, including seed $874,919 $0 $19,246
852510 Transmission apparatus for radio-telephony radio-broadcasting or television $24,170 $0 $15,776
848291 Balls, needles and rollers for bearings $13,276 $0 $13,276
847990 Parts of machines & mechanical appliances nes, having individual functions $0 $12,328
TOTAL (Commodities Listed Above) $33,148,224 <CC C77 Ortrt £40 OHO 004
TOTAL (All Commodities) $253,990,983 4>f , I 3D,U09
Exports from CanadaCanada Canada
HS Code Commodity Description 2000 2001
880230 Aircraft nes of an unladen weight > 2,000 kg but not exceeding 15,000 kg $26,943,400 $143,404,769
100190 Wheat nes and meslin $13,60o!o62 $23,386,785
480100 Newsprint, in rolls or sheets $15,063,588 $15,338,460
430110 Raw mink furskins, whole $6,175,554 $8,565,016
430219 Fur skins, nes, whole, tanned/dressed not assembled $5!325!868 $6,733,816
071340 Lentils dried, shelled, whether or not skinned or split $5,636,602 $5,327,162
071339 Beans dried, shelled, whether or not skinned or split, nes $2,468,804 $4,282,492
980600 Settler's personal and household effects $3,091,849 $4,240,844
470321 Chemical wood pulp, coniferous $11,768,400 $4,226,300
480421 Paper, sack kraft, in rolls, unbleached, uncoated $3,328,027 $2,231,651
TOTAL (Commodities Listed Above) $93,312,154 $217,737,295
TOTAL (All Commodities) $151,728,145 $253,990,983
Export Performance
1997 1998 1999 2000 2001
$'000 $'000 $'000 $'000 $'000
ALBERTA $2,934 $6,013 $8,377 $7,156 $12,885
CANADA $117,970 $150,312 $189,775 $151,728 $253,991
1
-62-

International Trade Review
GuatemalaCapital
Official LanguageGuatemalaSpanish, 2CH Amerindian languages
Population (Jul '01 est.) 12,974,361
Currency Quetzal (Q)
Q/USS 7.8020 (Jan 01) 7.7632 (2000)
GDP/Capita ('99 est.) $ 3,700 (US)
ImDorts f200CM $4.48 Billion (US)
IVIcaJUi OUfJJJIItJI o US, Mexico, Japan, El Salvador
Exports from AlbertaCanada Alberta Alberta
HS Code Commodity Description 9fimZUU Ionnn ZUU I
100190 Wheat nes and meslin $57,650,913 $20,427,900 $20,310,731100110 Durum wheat $6,857,752 $603,362 $1,472,896110312 Oat groats and meal $1 61 1 140 $807,909 $1,420,622071310 Peas dried, shelled, whether or not skinned or split $828,490 $0 $398,570110412 Oats, rolled or flaked grains $604,482 $183,107 $151,520390120 Polyethylene having a specific gravity of 0.94 or more $141,607 $62,985 $114,111390190 Polymers of ethylene nes, in primary forms $73,634 $25,011 $73,634020629 Bovine edible offal, frozen, nes $97,763 $0 $56,498020312 Meat, swine, hams, shoulders, bone in, fresh or chilled $51,872 $0 $51,872071332 Beans, small red (Adzuki) dried, shelled, whether or not skinned or split $112,247 $18,121 $37,722020210 Carcasses/half-carcasses of bovine animals, frozen $40,675 $0 $37,366230910 Dog and cat food, put up for retail sale $99,365 $206,369 $32,236990100 Low value export transactions and confidential commodities $514,740 $25,348 $27,667071331 Beans (vigna mungo hepper etc. ) dried, shelled $12,636 $0 $12,636020230 Bovine cuts boneless, frozen $24,775 $0 $12,306
TOTAL (Commodities Listed Above) $68,722,451 $22,360,112 $24,210,387TOTAL (All Commodities) $113,682,849 $39,850,488 $24,231,848
Exports from Canada
HS Code Commodity Description
Canada2000
Canada2001
1001903104201001104801001107104805108525201103122004101 50200
Wheat nes and meslin
Potassium chloride, in packages weighing more than 10 kg
Durum wheatNewsprint, in rolls or sheets
Malt, not roasted
Paper, fluting (corrugating medium), in rolls, semi-chemical, uncoated
Transmission apparatus, for radio-telephony incorporating receivers
Oat groats and mealPotatoes prepared or preserved other than by vinegar or acetic acid, frozen
Fats, bovine, sheep or goat, raw or rendered
$57,983,294
$8,499,616
$2,809,484
$7,485,278
$3,529,860
$1,199,698
$1,522,219
$849,410
$1,579,507
$0
$57,650,913
$9,771,656
$6,857,752
$6,825,355
$2,474,678
$1,861,243
$1,613,585
$1,611,140
$1,512,025
$1,233,973
TOTAL (Commodities Listed Above)TOTAL (All Commodities)
$85,458,366
$121,963,423
$91,412,320
$113,682,849
Export Performance
1997$'000
1998$'000
1999$'000
2000$'000
2001$'000
ALBERTACANADA
$12,625
$82,167
$25,019
$138,755$28,901
$165,492$39,850
$121,963
$24,232
$113,683
-63-

International Trade Revie1
Hong KongSpecial Administrative Region of the People's Republic of China
Official Language: Chinese (Cantonese) English
Population (Jul '00 est.): 7,116,302
Currency: Hong Kong Dollar (HKD)HKD/US$: 7.7990 (Jan 01) 7.7912 (2000)
GDP/Capita ('99 est.): $ 25,400 (US)
imports (zuuuj. $215 Billion (US)
Major Suppliers: China, Japan, US, Taiwan
Exoorts from AlbertaCanada Alberta Alberta
HS Code Commodity Description 2001 2000 2001
470329 Chemical wood pulp, non-coniferous $14,653,697 $0 $14,653,697
851 71 9 Line telephony electrical apparatus, nes $11,341,315 $13,193,249 $11,267,607
550200 Artificial filament tow $11,066,348 $17,689,111 $11,066,348
851 790 Parts of electrical apparatus for line telephone or line telegraphy $83,038,073 $9,611,162 $10,758,006H Mi/^I/qI rwirlno nrir\ K\ /H rAv rrJnrZOZD^tU INIL-Kcl OXIUcb caMU nyurOXIueS $10,426,195 $4,573,223
410121 Bovine hides, whole, fresh or wet-salted $5,382,576 $2,973,787 $3,324,990
020629 Bovine edible offal, frozen, nes $2,712,090 j>1 ,606,421tt*0 COO A O T3>2,632,487
ftS^7?n Oontrnl^ with plpptrir annaratu^ fnr plprtrnnir rnntrnl^ nx/pr 100.0 X/nlt*; $2 947 860 $13,190 $2,229,076
810510 Cobalt $2,219,153 $2,369,411 $2,219,153
110100 Wheat or meslin flour $4,011,940 $2,207,934 $2,112,880
050400 Guts, bladders and stomachs of animals excl. fish $2,153,752 $590,986 $1,971,026
3901 10 Polyethylene having a specific gravity of less than 0.94 $2,793,218 $8,537,392 $1,855,347
151490 Canola, rape, colza/mustard oil & their refined by-products $1,870,102 $26,894,982 $1,855,102
282590 Inorganic bases nes; metal oxides, hydroxides and peroxides, nes $1,655,642 $2,610,201 $1,655,642
050790 Tortoise-shell, whalebone nails, etc, powder, waste $1,545,866 $508,931 $1,476,079
TOTAL (Commodities Listed Above) $151,964,855 $99,232,952 »7i ccn fiR'l
TOTAL (All Commodities) $1,062,895,981 $156,599,961 $10(1 49? 71fl
Exports from CanadaCanada Canada
HS Code Commodity Description 2000 2001
750210 Nickel unwrought, not alloyed $88,106,159 $89,665,64£
851 790 Parts of electrical apparatus for line telephone or line telegraphy $49,922,996 coo noo r\~7i3)83,038,0 iz
4301 10 Raw mink furskins, whole $60,742,549 $75,015,707
121 120 Ginseng roots used primarily in pharmaceuticals, perfume, insecticide, fungicide or similar purp. $32,522,906 $51,940,84C
480100 Newsprint, in rolls or sheets $78,994,327 $49,535,872
750220 Unwrought nickel alloys $25,871,376 $38,075, 17C
030791 Mollusks nes, and aquatic invertebrates live, frozen or chilled $32,747,870 $29,081, 80S
852990 Parts suitable for use with the appliances of headings 85.25 $29,779,789 $27 821 57£
847330 Parts and accessories of automatic data processing machines & units thereof $137,466,373 $23,008, 32C
490700 Unused postage, check forms, banknotes, stock etc. $152 $21,197,902
TOTAL (Commodities Listed Above) $536,154,497 $488,380,919
TOTAL (All Commodities) $1,383,341,591 $1,062,895,981
Export Performance1997 1998 1999 2000 2001
$'000 $'000 $'000 $'000 $'000
ALBERTA $105,157 $90,254 $104,743 $156,600 $100,492
CANADA $1,663,369 $1,325,969 $967,052 $1,383,342 $1,062,896
-64-

International Trade Review
India
Exports from Alberta
Capital:
Official Language:
Population (Jul '01 est.)
Currency
Re/US$GDP/Capita ('99 est.)
Imports (2000)
Major Suppliers
New Delhi
Hindu, English, 14 other official
languages
1,029,991,145
Indian Rupee (Re)
46.540 (Jan 01 ) 44.942 (2000)
$2,200 (US)
$60.8 Billion (US)
US, Benelux, UK, S Arabia, Japan
Canada Alberta Alberta
HS Code Commodity Description 2001 2000 2001
071310 Peas dried, shelled, whether or not skinned or split $123,016,894 $30,473,857 $25,813,589550200 Artificial filament tow CO C17 014>0,D I 1
071340 Lentils dried, shelled, whether or not skinned or split Sim 7R7 ^fi S^l 414sj)JO t 1 *T
847990 Parts of machines & mechanical appliances nes, having individual functions $1,828,559 $412,622 $1,233,848732690 Articles, iron or steel, nes $1,157,094 $566 $1,087,568847989 Machines & mechanical appliances nes, having individual functions $1,841,545 $29,959 $987,158843143 Parts of boring or sinking machinery, whether or not self-propelled $926,009 $126,293 $866,892390190 Polymers of ethylene nes, in primary forms $1,249,796 $1,163,912 $794,318990100 Low value export transactions and confidential commodities $5,941,425 $533,262 $589,346842139 Filtering & purifying machinery & apparatus for gases nes $578,296 $0 $528,166851750 Apparatus, for carrier-current line systems, or for digital line systems, nes $605,052 $0 $494,004470329 Chemical wood pulp, non-coniferous $860,304 $0 $442,557853720 Controls with electric apparatus for electronic controls over 1000 Volts $435,212 $229,438 $435,212841229 Hydraulic power engines & motors excluding linear acting engines $441,575 $87,415 $430,871
902130 Artificial parts of the body, nes $401,213 $767,662 $401,213
TOTAL (Commodities Listed Above) $153,806,749 $35,699,432 $40,344,031
TOTAL (All Commodities) $611,482,104 $55,299,773 $43,670,577
Exports from CanadaCanada Canada
HS Code Commodity Description 2000 2001
071310 Peas dried, shelled, whether or not skinned or split $77,341,396 $123,016,894
480100 Newsprint, in rolls or sheets $87,4874,669 $79,447,372
900110 Optical fibers, optical fiber bundles and cables $4,304,420 $50,632,495
310420 Potassium chloride, in packages weighing more than 10 kg $52,632,707 $43,365,248
854470 Insulated optical fiber cables with individually shielded fibers $10^311 $41,144,365
071320 Chickpeas, including seed $26,173,036 $32,957,426
252400 Asbestos $33,117,052 $30,249,746
470500 Semi-chemical wood pulp $16,787,058 $27,351,970
470321 Chemical wood pulp, coniferous $38,157,744 $26,556,863
260300 Copper ores and concentrates $15,792,533 $16,754,470
TOTAL (Commodities Listed Above) $351,790,926 $471,476,849
TOTAL (All Commodities) $541,024,586 $611,482,104
Export Performance1997 1998 1999 2000 2001$'000 $'000 $'000 $'000 $'000
ALBERTA $33,420 $40,289 $24,308 $55,300 $43,671
CANADA $482,017 $414,429 $446,771 $541,025 $611,482
-65-

International Trade Reviev
IndonesiaCapital Jakarta
Official Language Bahasa Indonesia
Population (Jul '00 est.) 228,437,870
Currency Indonesian Rupiah (Rp)
Rp/US$ 10,000 (Jan 01) 8,421.8 (2000)
GDP/Capita ('97 est.) $ 2,900 (US)
Imports (1998) $40.4 Billion (US)
Major Suppliers Japan, US, Singapore, Germany
Exports from AlbertaCanada Alberta Alberta
HS Code Commodity Description 2001 2000 2001
100190 Wheat nes and meslin $132,438,893 $48,884,264 $46,658,974
470500 Semi-chemical wood pulp $59,821,975 $17,319,476 $9,632,902
470321 Chemical wood pulp, coniferous $51,082,966 $5,034,118 $4,261,247
390190 Polymers of ethylene nes, in primary forms $3,968,678 $525,723 $3,968,678
550200 Artificial filament tow $3,693,991 $2,606,758 $3,693,991
841480 Air or gas compressors, hoods $3,579,175 $0 $3,579,175
250300 Sulphur of all kinds $5,249,669 $5,222,523 $3,185,633
3901 10 Polyethylene having a specific gravity of less than 0.94 $1,817,460 $2 969 886 $1 81 7 4fi0if} 1 ,U 1 / ,*tuu
290531 Ethylene glycol (ethanediol) $1,796,498 $24,557,688 $1,796,498
847990 Parts of machines & mechanical appliances nes, having individual functions $1 ,571 ,532 $210,887 $1,487,029
847989 Machines & mechanical appliances nes, having individual functions $1,352,897 $309,742 $1,352,897
3901 20 Polyethylene having a specific gravity of 0.94 or more $1,329,375 $0 $1,329,375
843143 Parts of boring or sinking machinery, whether or not self-propelled $2,039,566 $1,879,599 $1,317,524
990100 Low value export transactions and confidential commodities $2,359,538 $1,151,975 $1,291,853
2301 10 Flours, meals & pellets of meat or meat offal unfit for human consumption $4,164,074 $871,378 $1,065,216
TOTAL (Commodities Listed Above) $276,266,287 & A A A C A A A A T$111,544,017 $86,438,452
TOTAL (All Commodities) $448,603,542 £4<io AOt\ ncn$118,480,950 04C CCC$92,816,566
Exports from CanadaCanada Canada
HS Code Commodity Description 2000 2001
100190 Wheat nes and meslin $138,752,833 $132,438,893
470500 Semi-chemical wood pulp $96,045,214 $59,821,975
470321 Chemical wood pulp, coniferous £212 429 763 $51 08? 966
310420 Potassium chloride, in packages weighing more than 10 kg $37,521,951 $33,523,947
470200 Chemical wood pulp, dissolving grades $21,219,645 $20,154,662
252400 Asbestos $11,422,389 $11,695,673
860210 Diesel electric locomotives $0 $10,816,178
480421 Paper, sack kraft, in rolls, unbleached, uncoated $6,878,212 $7,859,307
7901 12 Zinc not alloyed unwrought containing by weight less than 99.99% of zinc $8,772,247 $7,597,720
7901 1 1 Zinc not alloyed unwrought containing by weight 99.99% or more of zinc $5,200,622 $6,163,739
TOTAL (Commodities Listed Above) $538,242,876 $341,155,060
TOTAL (All Commodities) $664,548,128 $448,603,542
Export Performance1997 1998 1999 2000 2001
$'000 $'000 $'000 $'000 $'000
ALBERTA $212,343 $155,101 $109,721 $118,481 $92,817
CANADA $782,749 $541,805 $530,363 $664,548 $448,604
-66-

International Trade Review
Iran
Exports from Alberta
Capita!
Official LanguagePopulation (Jul '00 est.)
Currency
IR/US$
GDP/Capita ('99 est.)
Imports (2000)
Major Suppliers
Tehran
Persian, Turkic
65,619,636
Iranian Rial (IR)
1.754.71 (Jan 01) 1,764.43 (00)
$ 6,300 (US)
$ 15.0 Billion (US)
Germany, S. Korea, Italy, UAE
Canada Alberta Alberta
HS Code Commodity Description 2001 2000 2001
100190 Wheat nes and meslin $378,135,143 $185,923,873 $133,219,791100110 Durum wheat $32,291,936 $2,617,310 $6,936,193100300 Barley 5>D,U f \ ,\ fo
843143 Parts of boring or sinking machinery, whether or not self-propelled O I ,JOU, I I o o*+ ,JUU,UlJ
871640 Trailers and semi-trailers nes $2,466,529 $0 $2,466,529847990 Parts of machines & mechanical appliances nes, having individual functions $2,601,962 $196,089 $2,277,030841989 Machinery, plant or laboratory equip for treat of mat by a change of temp $2,120,777 $0 $2,120,777840991 Spark ignition internal combustion piston engine parts nes $836,990 $831,765 $836,990940600 Prefabricated buildings $827,500 $0 $827,500847989 Machines & mechanical appliances nes, having individual functions $2,306,643 $987,779 $802,685841950 Heat exchange units, industrial type $424,478 $0 $424,478340319 Lubricating preparations containing petroleum oil from bituminous sources $372,872 $0 $372,872848340 Gears; ball or roller screws; gear boxes etc. $324,909 $0 $296,366051110 Bovine semen $897,959 $42,024 $267,358903039 Instruments measuring voltage currents etc without recording device, $296,782 $0 $266,552
TOTAL (Commodities Listed Above) $443,633,722 $195,248,054 $160,692,922TOTAL (All Commodities) $481,236,297 $203,310,959 $162,782,692
Exports from Canadam t rl ^UdlldUd t-anaaa
HS Code Commodity Description 2000 2001
100190 Wheat nes and meslin $527,737,615 $378,135,143
100110 Durum wheat $12,184,839 $32,291,936
100300 Barley $10,206,524 $12,199,129
843143 Parts of boring or sinking machinery, whether or not self-propelled $615,231 $7,530,113
847420 Crushing/grinding machinery for earth stone mineral substances $3,487,419 $4,214,760
860791 Locomotive parts nes $1,331,626 $2,803,199
847990 Parts of machines & mechanical appliances nes, having individual functions $229,543 $2,601,962
871640 Trailers and semi-trailers nes $0 $2,466,529
847989 Machines & mechanical appliances nes, having individual functions $1,016,538 $2,306,643
841989 Machinery, plant or laboratory equip for treat of mat by a change of temp $12,500 $2,120,777
TOTAL (Commodities Listed Above) $556,821,835 $446,670,191
TOTAL (All Commodities) $664,067,414 $481,236,297
Export Performance
1997 1998 1999 2000 2001$'000 $'000 $'000 $'000 $'000
ALBERTACANADA
$208,263
$722,784
$83,299
$262,899
$116,511
$537,667
$203,311
$664,067
$162,783
$481,236
-67-

International Trade Review
IrelandCapital: Dublin
Official Language: English, Irish
Population (Jul '00 est.): 3,840,838
Currency: Irish Pound (IEP), Euro
Euro/US$: 1Euro =.7876 Irish PoundsGDP/Capita ('99 est.): $21,600
Imports (2000): $45.7 Billion (US)
Major Suppliers: EU, Germany, France, US, Japan
Exports from AlbertaCanada Alberta Alberta
HS Code Commodity Description 2001 2000 2001
851790 Parts of electrical apparatus for line telephone $41 ,520,940 $3,141,785 $6,101,094
851719 Line telephony electrical apparatus, nes $4,166,405 $481,678 $4,023,747
870590 Special purpose vehicles nes $700,000 $0 $700,000847170 Automatic data processing storage units nes $776,955 $150,197 $582,097847330 Parts and accessories of automatic data processing machines & units thereof $43,974,456 $2,114 $500,015901910 Mechano-therapy appliances; massage app; psych, aptitude testing equip $576,1 18 $0 $353,596852440 Magnetic tapes for reproducing other than sound/images $316,924850440 Static converters, nes $2,855,931 $10,376 $295,086990100 Low value export transactions and confidential commodities $3,419,120 $87,188 $186,433853120 Indicator panels incorporating LCDs or LED $216,218 $0 $176,305841290 Parts of hydraulic & pneumatic & other power engines and motors $1 74,031 $41,980 $174,031
880330 Airplane and helicopter parts, nes $7,726,232 $0 $159,784121490 Swedes, mangolds, fodder roots, hay, clover, forage $151,544 $10,184 $151,544852020 Telephone answering machines $140,789 $253,1 16 $140,789850490 Parts for electric transformers, static converters as indicated $230,836 $0 $135,206
TOTAL (Commodities Listed Above) $106,946,499 J0j,4ZB
TOTAL (All Commodities) $290,421 ,869 $8,961,933 $15,565,649
Exports from CanadaCanada Canada
HS Code Commodity Description 2000 2001
847330 Parts and accessories of automatic data processing machines & units thereof $25,499,672 $43,974,45£
851790 Parts of electrical apparatus for line telephone $47,467,500 $41,520,94C
847180 Other units for automatic data processing machines $22,714,286 $21,813,767
300630 Opacifying preparations for X-ray examinations etc $12^000^950 $18,274,22-;
470200 Chemical wood pulp, dissolving grades $14,748,743 $17,228,271
842199 Parts for filtering or purifying machinery and apparatus for liquids or gases $1,753,063 $12,596,38:
300490 Medicaments, measured doses, retail packages nes $1,805,891 $12,060, 00J
440920 Wood, tongued grooved or molded etc. - non-coniferous iP 1 J, f UO,^+3
880330 Airplane and helicopter parts, nes $2,689,166 $7,726,23:
230400 Soybean oilcake and other solid residue, whether or not ground $990,450 $6,312,94C
TOTAL (Commodities Listed Above) $143,378,170 $192,919,493
TOTAL (All Commodities) $305,422,569 $290,421,869
Export Performance
1997 1998 1999 2000 2001
$'000 $'000 $'000 $'000 $'00(
ALBERTA $11,778 $9,224 $8,634 $8,962 $15,566
CANADA $294,963 $400,699 $382,534 $305,423 $290,422
-68-

International Track' Review
IsraelCapital
Official LanguagePopulation (Jul '00 est.)
Currency
ILS/USSGDP/Capita ('99 est.)
Imports (2000)
Major Suppliers
Jerusalem (Israel proclaimed)
Hebrew5,938,083
New Israel Shekel (ILS)
4.081 (Jan 01 ) 4.0973 (2000)
$ 18,900 (US)
$ 35.1 Billion (US)
US, Benelux, Germany, UK
Exports from AlbertaCanada Alberta Alberta
HS Code Commodity Description 2001 2000 2001
250300 Sulphur of all kinds $6,764,548 $8,589,815 $6,764,548851790 Parts of electrical apparatus for line telephone or line telegraphy $7,155,635 $423,654 $2,273,001071339 Beans dried, shelled, whether or not skinned or split, nes $1,159,308 $398,205 $880,853841191 Parts of turbo-jets or turbo-propellers $4,642,483 $374,212 $426,440390110 Polyethylene having a specific gravity of less than 0.94 $833,928 $442,373 $411,411841869 Refrigeration/freezing equipment, nes $289,507 $0 $289,507280300 Carbon (carbon blacks and other forms of carbon, nes) $274,990 $187,993 $222,586902130 Artificial parts of the body, nes $218,144 $142,407 $218,144990100 Low value export transactions and confidential commodities $4,921,751 $37,183 $197,460841950 Heat exchange units, industrial type $151,291 $0 $151,291851610 Electric instant or stock water and immersion heaters $128,266 $0 $128,266690490 Ceramic flooring blocks support or filler tile etc. $102,644 $0 $102,644841899 Refrigerator, freezer, and heat pump parts nes $115,974 $0 $75,238691490 Ceramic articles, nes $36,145 $76,409 $36,145690912 Ceramic articles with hardness equivalent to 9 or more MOHS $35,024 $47,947 $35,024
TOTAL (Commodities Listed Above) $26,829,638 $10,720,198 $12,212,558TOTAL (All Commodities) $318,550,199 $14,200,842 $12,353,595
Exports from CanadaCanada Canada
HS Code Commodity Description 2000 2001
841112 Turbojets of a thrust exceeding 25 KN $59,832,324 $104,745,697480100 Newsprint, in rolls or sheets $24,364,789 $55,901,833847330 Parts and accessories of automatic data processing machines & units thereof $9,344,606 $10,279,955851790 Parts of electrical apparatus for line telephone or line telegraphy $9,967,494 $7,155,635250300 Sulphur of all kinds $8,589,815 $6,764,548990100 Low value export transactions and confidential commodities $4,325,812 $4,921,751
841191 Parts of turbo-jets or turbo-propellers $5,820,482 $4,642,483440799 Lumber, non-coniferous, nes $4,555,615 $3,893,261
980200 Conveyances temporarily imported by a resident $1,286,829 $3,535,951
901380 Optical devices, appliances, and instruments, nes $4,933,520 $3,237,155
TOTAL (Commodities Listed Above) $133,021,286 $205,078,269TOTAL (All Commodities) $290,242,922 $318,550,199
Export Performance1997 1998 1999 2000 2001$'000 $'000 $'000 $'000 $'000
ALBERTA $17,368 $27,749 $16,423 $14,201 $12,354CANADA $231,070 $214,045 $276,014 $290,243 $318,550
-69-

International Trade Review
ItalyCapital Rome
Official Language Italian, GermanPopulation (Jul '00 est.) 57,634,327
Currency Italian Lira (ITL) Euro
Euro/US$ 1Euro=1,936 Lira
GDP/Capita ('99 est.) $22,100 (US)
imports( i yyo ) $ 231.4 Billion (US)
Major Suppliers European Union, US.
Exports from AlbertaCanada Alberta Alberta
CnHp1 1 V/UUC Commodity Description 2001 2000 2001
750210 Nickel unwrought, not alloyed 549,048,610 $82,225,322 $49,048,610
841121 Turbo-propellers of a power not exceeding 1 100 KW $72,035,744 $6,678,976 $28,414,312
470329 Chemical wood pulp, non-coniferous $29,036,233 $32,659,197 $27,106,944
100110 Durum wheat <ER1 -1 QQ CIO4>0 1 , 1 C7U , O 1 O $6,449,087 $17,441,223
020500 Horse, ass, mule or hinny meat, fresh, chilled or frozen $13,537,510 $5,678,099 $12,627,254
470500 Semi-chemical wood pulp $38,598,104 $27,513,933 $11,409,056
100190 Wheat nes and meslin $28 836 938 $1? (TS7 340 $10 160 436
470321 Chemical wood pulp, coniferous $371,198,247 $4,358,221 $5,217,760
902130 Artificial parts of the body, nes $2,197,897 $431,523 52. 104.498
732690 Articles, iron or steel, nes $2,134,382 $725,771 $1,521,433
390120 Polyethylene having a specific gravity of 0.94 or more $4,413,220 $0 $1,411,064
843143 Parts of boring or sinking machinery, whether or not self-propelled $1,654,717 $156,086 $894,625
410121 Bovine hides, whole, fresh or wet-salted $6,556,394 $0 $718,380
280300 Carbon (carbon blacks and other forms of carbon, nes) $577,346 $975,494 $553,928
902730 Spectrometer, spectrophotometer, etc using optical radiations $1,441,631 $442,800 $467,250
TOTAL (Commodities Listed Above) $702,465,486 $1 80,351 ,849 $1 ba .uyb, ifo
TOTAL (All Commodities) $1 *»4Q RR9 741 $192,428,532 $174,933,611
Exports from CanadaCanada Canada
HS Code Commodity Description 2000 2001
470321 Chemical wood pulp, coniferous $478,659,267 5371,198.247
880230 Aircraft nes of an unladen weight > 2,000 kg but not exceeding 15,000 kg $54,676,868 $126,981,379
260112 Iron ores and concentrates, other than roasted iron pyrites, agglomerated $102,031,045 $83,015,281
100110 Durum wheat $30,028,042 $81,198,513
270112 Bituminous coal $61,993,370 $75,025,677
841121 Turbo-propellers of a power not exceeding 1 100 KW $40,215,149 $72,035,744
901380 Optical devices, appliances, and instruments nes $60,772,103 555,125,231
750210 Nickel unwrought, not alloyed $82,225,322 549,048,610
440710 Lumber, coniferous (softwood), 6 mm and thicker $61,459,155 542,858,570
470500 Semi-chemical wood pulp $71,780,017 538,598.104
TOTAL (Commodities Listed Above) $1,043,840,338 $995,085,356
TOTAL (All Commodities) $1,678,709,815 $1,549,862,741
Export Performance
1997 1998 1999 2000 2001
$'000 $'000 $'000 $'000 $'000
ALBERTA $158,352 $175,526 $166,264 $192,429 $174,934
CANADA $1,497,309 $1,496,648 $1,393,216 $1,678,710 $1,549,863
-70-

International Trade Review
JapanCapital
Official LanguagePopulation(Jul '00 est.)
Currency
¥/US$GDP/Capita ('99 est.)
Imports (2000)
Major Suppliers
TokyoJapanese
126,771,662
Yen (¥)
117.10 (Jan 01) 107.77 (2000)
$ 24,900 (US)
$ 355.0 Billion (US)
US, China, S. Korea, Taiwan
Exports from AlbertaCanada Alberta Alberta
HS Code Commodity Description 2001 2000 2001
120500 Canola or colza seeds $573,210,358 $180,699,158 $194,604,914470329 Chemical wood pulp, non-conifercus <T 1 70 ACCi QCC d on cno ac\q
o>1 oz,o/ 1 ,Ub9
270112 Bituminous coal »J)UZ.U,UZ.*+,0 1 £. fc17fl OQQ 1 9ft C 1 97 QG.A COQ
100190 Wheat nes and meslin $292,481,486 $89,829,545 $103,043,877110710 Malt, not roasted $115,047,427 $48,727,314 $71,677,961121490 Swedes, mangolds, fodder roots, hay, clover, forage $85,950,136 $63,395,982 $67,284,572020329 Swine cuts, frozen nes $315,300,318 $39,983,068 $55,757,083020319 Swine cuts boneless, fresh or chilled, nes $215,782,320 $38,368,980 $55,183,739470321 Chemical wood pulp, coniferous $353,915,622 $69,429,052 $52,736,921440710 Lumber, coniferous (softwood), 6 mm and thicker $1,397,593,853 $68,246,067 $47,272,462020230 Bovine cuts boneless, frozen $48,858,042 $30,165,835 $43,488,503020621 Bovine tongues, frozen $39,096,518 $28,209,127 $35,833,362020130 Bovine cuts boneless, fresh or chilled $41,767,807 $22,675,889 $30,689,187121410 Alfalfa meal and pellets $45,505,876 $8,993,802 $28,293,595810510 Cobalt $31,921,957 $49,138,346 $27,750,589
TOTAL (Commodities Listed Above) $4,355,526,157 $1,088,654,701 $1,074,439,452TOTAL (All Commodities) $8,067,077,214 $1,340,936,090 $1,283,842,072
Exports from CanadaCanada Canada
HS Code Commodity Description 2000 2001
440710 Lumber, coniferous (softwood), 6 mm and thicker $1,695,062,575 $1,397,593,853
270112 Bituminous coal $738,424,454 $626,624,572120500 Canola or colza seeds $532,250,835 $573,210,358470321 Chemical wood pulp, coniferous $658,468,656 $353,915,622020329 Swine cuts, frozen nes $235,860,310 $315,300,318100190 Wheat nes and meslin $254,979,805 $292,481,486260300 Copper ores and concentrates $336,350,427 $279,557,317020319 Swine cuts boneless, fresh or chilled, nes $176,829,645 $215,782,320760120 Aluminium unwrought, alloyed) $249,558,793 $201,615,304
470329 Chemical wood pulp, non-coniferous $267,875,905 $172,469,865
TOTAL (Commodities Listed Above) $5,145,661,405 $4,428,551,015TOTAL (All Commodities) $9,074,283,216 $8,067,077,214
Export Performance1997 1998 1999 2000 2001$'000 $'000 $'000 $'000 $'000
ALBERTA $1,711,362 $1,348,370 $1,315,770 $1,340,936 $1,283,842
CANADA $11,044,227 $8,538,325 $8,385,993 $9,074,283 $8,067,077
-71 -

International Trade Review
KazakhstanCapital Astana
Official Language Kazakh, Russian
Population (Jul '00 est.) 16,731,303
Currency Kazakhstani Tenge (KZT)
KZT/USS 145.09 (Jan 01) 142.13 (2000)
GDP/Capita ('99 est.) $ 5,000 (US)Imports (2000) $ 6.9 Billion (US)
Major Suppliers Russia, US, Uzbekistan,
Turkey, UK, Germany, S. Korea
Exports from AlbertaCanada Alberta Alberta
HS Code Commodity Description 2001 2000 2001
847990 Parts of machines & mechanical appliances having individual functions $4,948,314 $5,344,618 $3,814,888
843143 Parts of boring or sinking machinery, whether or not self-propelled $4,415,109 $1,516,589 $3,709,320
847490 Pts of sorting/screening/mixing/crush/grinding/washing/agglomerating mach etc $2,388,600 $0 $2,388,600
841391 Parts of pumps for liquid whether or not fitted with a measuring device $1,220,333 $10,391 $1,217,213
843139 Parts of lifting, handling, loading or unloading machinery, nes $1,147,878 Sibub, f 4o 3>1 ,1 39,497
841940 Distilling or rectifying plant $944,798 $0 $944,798
843041 Boring or sinking machinery nes, self-propelled $808,149 $0 $808,149
901580 Surveying, hydrographic, oceanographic, meteorological or geophysical inst nes $650,530 $459,263 $650,530
847989 Machines & mechanical appliances nes, having individual functions $622,967 $1,251,076 $612,725
853669 Electrical plugs & sockets for voltages not over 1 000 Volts $554,555 $0 $554,555842620 Tower cranes $458,843 $0 $458,843
90271 Gas or smoke analysis apparatus $406,456 $0 $406,456
870590 Special purpose vehicles nes $307,034 $0 $307,034
870190 Tractors, nes. $265,500 $0 $265,500
843131 Parts of elevators, (excluding constant action), hoists & escalators $218,190 $0 $218,190
TOTAL (Commodities Listed Above) $19,357,256 $9,188,680 $17,496,298
TOTAL (All Commodities) $35,614,922 $12,884,058 $20,204,176
Exports from CanadaCanada Canada
HS Code Commodity Description 2000 2001
890600 Vessels nes, including warships, lifeboats except rowboats $0 $7,882,277
847990 Parts of machines & mechanical appliances having individual functions $5,344,618 $4,948,314
843143 Parts of boring or sinking machinery, whether or not self-propelled $1,556,965 $4,415,109
847490 Pts of sorting/screening/mixing/crush/grinding/washing/agglomerating mach etc $0 S2. 388. 600
841391 Parts of pumps for liquid whether or not fitted with a measuring device $10,391 $1^220,333
843139 Parts of lifting, handling, loading or unloading machinery, nes $606,743 $1,147,878
903290 Parts for automatically regulating/controlling instruments and apparatus $0 $1,090,250
841940 Distilling or rectifying plant $0 $944,798
843041 Boring or sinking machinery nes, self-propelled $0 $808,149
854890 Electrical parts of machinery nes in chapter 85 $47,832 $698,629
TOTAL (Commodities Listed Above) $7,566,549 $25,544,337
TOTAL (All Commodities) $23,672,248 $35,614,922
Export Performance1997 1998 1999 2000 2001
$'000 $'000 $'000 $'000 $'000
ALBERTA $934 $8,794 $1,964 $12,884 $20,204
CANADA $6,550 $23,968 $5,896 $23,672 $35,615
-72-

International Trade Review
Korea, South
Exports from Alberta
Capital
Official LanguagePopulation (Jul 00 est.)
Currency
KRW/US$GDP/Capita ('99 est.)
Imports (2000)
Major Suppliers
Seoul
Korean
47,904,370
S. Korean Won (KRW)1,271.89 (Jan 01) 1,130.96(00)
$ 16,100 (US)
$ 160.5 Billion (US)
US, Japan, China, S. Arabia
Canada Alberta Alberta
HS Code Commodity Description 2001 2000 2001
470329 h ff*m i f^Ji I uuifwl niilr* nnn-rnniforni ic $ 1 P.9 1 nn Q1 13) I , I uu,y I I
Q1 9ft 911 90.
1
270112 Bituminous coal $305,854,446 $79,490,164 $103,413,655290531 Ethylene glycol (ethanediol) 5108,731,935 $75,618,114 $62,987,774470500 Semi-chemical wood pulp $84,445,407 $41,761,404 $24,879,949100190 Wheat nes and meslin $66,836,600 $21,529,950 $23,547,425470321 Chemical wood pulp, coniferous $153,625,651 $23,249,717 $19,020,721110710 Malt, not roasted $12,725,703 $4,891,140 $10,355,975020220 Bovine cuts bone in, frozen C1 1 77P. QCH
3>1 I , / ( d.odU C^.9 fZIA Q7Q3)o^,o»y»,o / y tin np.9 Qcn
121410 Alfalfa meal and pellets v> ( ,DO /<ci 1 -5ft nan3> i , i oo.uyu t7 1m Q91
3>' , I u l ,ov i
020230 Bovine cuts boneless, frozen CO C\AQ ft^9 (TOO -1 CO QOA3) / ,uy / ,o4o
121490 Swedes, marigolds, fodder roots, hay, clover, sainfoin, forage <M o 797 1 C9O I/,' / / . I JZ «M Qf^d 09^ 4)D,o / ytH f y
550200 Artificial filament tow 3>0,DOD,*+OO C^i P.1 ft Clfl3)0,0 1 o,0 1 U <CC CQC vlftO.3>0,uoO,*+Oo
410122 Butts and bends, bovine animals, fresh or wet-salted <Cc no 1 1 en3>o, , \ oy 3>U 3>o,yyo,^yo
851790 Parts of electrical apparatus for line telephone C59 9P.1 1 77 til A7Q 9^c. CM OA A 1Q/1
410121 Bovine hides, whole, fresh or wet-salted 3)o, 1 0D,4UU 3)0, / oo.^n z CM 114 7£ift3>4, \ ol , / Oo
TOTAL (Commodities Listed Above) $979,038,742 $497,365,675 $424,463,136TOTAL (All Commodities) $1,950,255,899 $567,390,690 $462,226,081
Exports from CanadaCanada Canada
HS Code Commodity Description 2000 2001
270112 Bituminous coal 3283,461,401 S305. 854,446
470321 Chemical wood pulp, coniferous $232,045,598 $153,625,651
470329 Chemical wood pulp, non-coniferous conn czca runj>1 Oii,b34,bbD
290531 Ethylene glycol (ethanediol) $111,025,371 $108,731,935
760110 Aluminium unwrought, not alloyed $87,970,897 $103,000,512
470500 Semi-chemical wood pulp $163,999,649 $84,445,407
310420 Potassium chloride, in packages weighing more than 10 kg $90,513,912 $77,069,217
100190 Wheat nes and meslin $43,540,251 $66,836,600
870840 Transmissions for motor vehicles $120,411,330 $57,482,696
260300 Copper ores and concentrates $42,737,500 $49,886,720
TOTAL (Commodities Listed Above) $1,376,359,919 $1,159,567,849
TOTAL (All Commodities) $2,247,433,969 $1,950,255,899
Export Performance1997 1998 1999 2000 2001$'000 $'000 $'000 $'000 $'000
ALBERTA $537,511 $445,271 $501,750 $567,391 $462,226
CANADA $2,985,498 $1,793,649 $1,947,660 $2,247,434 $1,950,256
-73-

Internationa / Trade Revie\
MalaysiaCapital: Kuala Lumpur
Official Language: Bahasa Melayu
Population (Jul 'OOest.): 22,229,040
Currency: Ringgit (MYR)MYR/USS: 3.800 (Jan 01) 3.8000 (2000)
GDP/Capita ('99 est.): $ 10,300 (US)
Imports (2000): $ 82.6 Billion (US)
Major Suppliers: Japan, US, Singapore, Taiwan
Exports from AlbertaCanada Alberta Alberta
HS Code Commodity Description 2001 2000 2001
100190 Wheat nes and meslin $35,666,446 $20,587,698 $12,565,836
550200 Artificial filament tow $5,189,616 $8,288,638 $5,189,616
3901 90 Polymers of ethylene nes, in primary forms $5,900,144 $1,183,183 $4,607,234
3901 10 Polyethylene having a specific gravity of less than 0.94 $3,821,701 $6,196,437 $3,710,914
470321 Chemical wood pulp, coniferous $2,916,494 $5,334,530 $2,916,494
290531 Ethylene glycol (ethanediol) $2,657,479 $9,667,140 $2,657,479
847990 Parts of machines & mechanical appliances nes, having individual functions $1,370,357 $327,914 $1,195,496
200410 Potatoes prepared or preserved other than by vinegar or acetic acid, frozen $2,439,177 JOJO.U / £.CI fl97 7KQ
050400 Guts, bladders and stomachs of animals excl. fish $919,230 $98,736 $919,230
843143 Parts of boring or sinking machinery, whether or not self-propelled $1,135,963 $62,843 $883,806
848180 Taps, cocks, valves and similar appliances, nes $1,261,992 $733,537 $853,675
990100 Low value export transactions and confidential commodities $3,102,794 $839,087 $817,716
843139 Parts of lifting, handling, loading or unloading machinery nes $689,309 $271,114 $653,486
880310 Propeller rotor and parts of gliders & aircraft powered or not $630,506 $0 $630,506
847989 Machines & mechanical appliances nes, having individual functions $640,336 $235,944 $429,186
TOTAL (Commodities Listed Above) $68,341,544 $54,684,873 $39,058,443
TOTAL (All Commodities) $312,808,505 $58,997,268 $43,719,776
Exports from CanadaCanada Canada
HS Code Commodity Description 2000 2001
310420 Potassium chloride, in packages weighing more than 10 kg $99,731,626 $80,013,232
100190 Wheat nes and meslin $58,436,708 $35,666,446
120100 Soya beans <tOC CQO D7Q <C97 91fi Oflt;
480100 Newsprint, in rolls or sheets $26,747,040 $19,192,221
2601 12 Iron ores and concentrates, other than roasted iron pyrites, agglomerated $4,147,268 $7,911,602
860210 Diesel electric locomotives $178,290 $6,629,155
390190 Polymers of ethylene nes, in primary forms $1,257,212 $5,900,144
550200 Artificial filament tow $8,288,638 $5,189,616
252400 Asbestos $8,345,321 $5,140,680
854230 Electronic monolithic integrated circuits, nes $8,488,745 $5,075,751
TOTAL (Commodities Listed Above) $241,154,727 $197,935,132
TOTAL (All Commodities) $390,433,982 $312,808,505
Export Performance1997 1998 1999 2000 2001
$'000 $'000 $'000 $'000 $'000
ALBERTA $51,299 $37,101 $42,362 $58,997 $43,720
CANADA $686,348 $474,153 $414,709 $390,434 $312,809
-74-

International Trade Review
Mexico
Exports from Alberta
Capital
Official LanguagePopulation (Jul '00 est.)
Currency
MXN/USSGDP/Capita ('99 est.)
Imports (2000)
Major Suppliers
Mexico City
Spanish
101,879,171
New Mexican Peso (MXN)9.771(Jan 01) 9.456 (2000)
$ 9,100 (US)
$ 176 Billion (US)
US, Japan, Germany, Canada
Canada Alberta Alberta
HS Code Commodity Description 2001 2000 2001
020130 Bovine cuts boneless, fresh or chilled $176,976,567 $97,045,806 $176,377,815120500 Canola or colza seeds $255,057,358 $76,811,505 $86,591,976100190 Wheat nes and meslin ?n7 ftifiOil^J, Jul ,o I u •Kfifi 4QA ^"^1 jiro,u/j, i ju020120 Bovine cuts, bone in, fresh or chilled $13,722,852 $7,840,1 1
1
$13,715,148020230 Bovine cuts boneless, frozen $11J2o!839 $5^838,292 $11,205,300040210 Milk powder not exceeding 1.5% fat $74,911,053 $4,734,169 $9,587,500470321 Chemical wood pulp, coniferous $20,339,521 $12,479,088 $9,166,240020629 Bovine edible offal, frozen nes $21,817,449 $7,980,123 $8,078,439020610 Bovine edible offal, fresh or chilled $7,816,081 $1,856,123 $7,485,301390190 Polymers of ethylene nes, in primary forms $8,002,910 $2,132,186 $7,470,431843143 Parts of boring or sinking machinery, whether or not self-propelled $7,468,362 $42,608 $7,446,673851790 Parts of electrical apparatus for line telephone or line telegraphy $21,073,039 $11,063,494 $5,871,749390110 Polyethylene having a specific gravity of less than 0.94 $7,110,958 $6,736,963 $5,744,224390120 Polyethylene having a specific gravity of 0.94 or more $4,751,426 $2,898,539 $4,652,092050400 Guts, bladders and stomachs of animals excl. fish $4,525,960 $2,894,478 $4,023,230
TOTAL (Commodities Listed Above) $858,602,191 $306,851,816 $436,091,254TOTAL (All Commodities) $2,352,495,787 $356,051,272 $481,484,257
Exports from CanadaCanada Canada
HS Code Commodity Description 2000 2001
120500 Canola or colza seeds $226,248,910 $255,057,358100190 Wheat nes and meslin $188,742,952 $223,307,816020130 Bovine cuts boneless, fresh or chilled $97,702,966 $176,976,567870324 Automobiles with reciprocating piston engine displacing > 3000 cc 3>1 T/:,oyD,U^1
ffl 17 701 "7 A A3)1 1 / ,ioi ,fii
870899 Motor vehicle parts nes $108,055,146 $116,731,408870840 Transmissions for motor vehicles $105,130,534 $105,193,796040210 Milk powder not exceeding 1 .5% fat $35,584,759 $74,911,053
880240 Airplanes and other aircraft, of an unladen weight exceeding 15,000 kg $0 $66,193,750
840734 Spark ignition reciprocating piston engine >1,000 cc. $0 $58,000,748
870870 Wheels including parts and accessories for motor vehicles $54,489,085 $46,259,466
TOTAL (Commodities Listed Above) $928,550,373 $1,240,413,673
TOTAL (All Commodities) $1,940,495,883 $2,352,495,787
Export Performance1997 1998 1999 2000 2001$'000 $'000 $'000 $'000 $'000
ALBERTA $223,253 $286,753 $244,836 $356,051 $481,484
CANADA $1,219,220 $1,402,303 $1,506,755 $1,940,496 $2,352,496
-75-

International Trade Review
MoroccoCapital: Rabat
Official Language: Arabic
Population (Jul 'OOest.): 30,122,350
Currency: Moroccan Dirham (MAD)MAD/USS: 10.590 (Jan 01) 10.626 (2000)
GDP/Capita ('97 est.): $ 3,500 (US)
Imports (1998): $ 12.2 Billion (US)
Major Suppliers: France, Spain, Italy, Germany, UK
Exports from AlbertaLfdlldlld Ml Ucl Id A 1 h»cir+oMl Ucl Id
HS Code Commodity Description 2001 2000 2001
100110 Durum wheat $160,020,938 $28,628,518 $32,795,315
100190 Wheat nes and meslin $50,482,399 $11,924,843 $16,448,342
250300 Sulphur of all kinds $10,430,222 $9,264,842 $7,789,056
071340 Lentils dried, shelled, whether or not skinned or split $10,426,540 $0 $255,657
851719 Line telephony electrical apparatus, nes $168,325 $271,727 $168,325
851790 Parts of electrical apparatus for line telephone or line telegraphy $66,398 $413,229 $66,398
851730 Telephonic or telegraphic switching apparatus $53,463 $99,393 $53,463
071310 Peas dried, shelled, whether or not skinned or split $1,283,856 $0 $36,119
853650 Electrical switches for voltage not exceeding 1000 Volts nes $28,784 $0 $28,784
841989 Machinery, plant or laboratory equip for treat of mat by a change of temp $95,854 $0 $23,740
852499 Recorded media for reproducing sound or image, nes $15,054 $31,062 $15,054
852020 Telephone answering machines $5,186 $22,831 $5,186
851750 Apparatus, for carrier-current line systems, or for digital line systems, nes $4,313 $19,101 $4,313
990100 Low value export transactions and confidential commodities $388,431 $0 $2,900
853669 Electrical plugs & sockets for voltages not over 1 000 Volts $31,396 $4,525 $2,695
TOTAL (Commodities Listed Above) $233,501,159 $50,680,071 $57,695,347
TOTAL (All Commodities) $255,552,888 $52,663,253 $57,699,940
Exports from Canada
HS Code Commodity Description
Canada2000
Canada2001
100110
100190250300071340480100040210841950841899071310540710
Durum wheat
Wheat nes and meslin
Sulphur of all kinds
Lentils dried, shelled, whether or not skinned or split
Newsprint, in rolls or sheets
Milk powder not exceeding 1 .5% fat
Heat exchange units, industrial type
Refrigerator, freezer, and heat pump parts nes
Peas dried, shelled, whether or not skinned or split
Woven fabric synthetic filaments, hi-tension nylon etc, and polyester
$141,735,872
$38,507,758
$13,673,090
$18,392,008
$1,281,358
$0
$57,371
$0
$2,126,340
$0
$160,020,938
$50,482,399
$10,430,222
$10,426,540
$4,787,819
$2,875,504
$1,553,691
$1,406,854
$1,283,856
$1,206,176
TOTAL (Commodities Listed Above)TOTAL (All Commodities)
$215,773,797
$242,410,655
$244,473,999
$255,552,888
Export Performance
1997$'000
1998$'000
1999$'000
2000$'000
2001
$'000
ALBERTACANADA
$96,215
$199,849
$68,892
$191,070
$59,986
$176,356
$52,663
$242,41
1
$57,700
$255,553
-76-

International Trade Review
Netherlands
Exports from Alberta
Capital
Official LanguagePopulation (Jul '00 est.)
Currency
Euro/US$GDP/Capita ('99 est.)
Imports (1998)
Major Suppliers
AmsterdamDutch
15,981,472
Netherlands Guilder (NLG) Euro
1 Euro = 2.2037 Guilders
$ 24,400 (US)
$ 201.2 Billion (US)
EU, US, Central/Eastern Europe
Canada Alberta Alberta
HS Code Commodity Description 2001 2000 2001
750210 Nickel unwrought, not alloyed $72,284,502 $48,167,456 $70,266,684810510 Cobalt $22,937,655 $23,175,254 $20,509,750990100 Low value export transactions and confidential commodities $50,931,929 $6,546,346 $4,381,764
841121 Turbo-propellers of a power not exceeding 1 100 KW $4,118,205 $0 $4,118,205
470500 Semi-chemical wood pulp $10,944,363 $3,436,757 $2,274,072
732690 Articles, iron or steel, nes $2,598,437 $373,945 $1,503,723
843143 Parts of boring or sinking machinery, whether or not self-propelled $3,098,934 $216,197 $1,370,543
120400 Linseed, whether or not broken $37,353,646 $410,709 $1,079,520
843041 Boring or sinking machinery nes, self-propelled $815,448 $1,874,502 $815,448902130 Artificial parts of the body, nes $931,409 $1,045,232 $757,488100190 Wheat nes and meslin $1,748,680 $2,023,564 $617,954
843049 Boring or sinking machinery, not self-propelled nes $559,716 $515,410 $559,716
750400 Powders and flakes, nickel $550,836 $3,471,094 $519,062550200 Artificial filament tow $401,004 $0 $401,004
440710 Lumber, coniferous (softwood) 6 mm and thicker $22,893,713 $1,381,869 $396,797
TOTAL (Commodities Listed Above) $232,168,477 $92,638,335 $109,571,730
TOTAL (All Commodities) $1,541,052,468 $110,768,336 $114,633,426
Exports from CanadaCanada Canada
HS Code Commodity Description 2000 2001
760110 Aluminum unwrought, not alloyed $243,790,021 $283,026,620
270112 Bituminous coal $44,447,255 $113,049,727
750210 Nickel unwrought, not alloyed $48,167,456 $72,284,502
990100 Low value export transactions and confidential commodities $45,465,615 $50,931,929
260112 Iron ores and concentrates, other than roasted iron pyrites, agglomerated $51,594,541 $48,790,984
480100 Newsprint, in rolls or sheets $19,309,473 $48,735,473
300490 Medicaments, measured doses, retail packages nes $31,717,213 $40,416,538
470321 Chemical wood pulp, coniferous $67,394,529 $40,269,774
120400 Linseed, whether or not broken $14,240,284 $37,353,646
854219 Monolithic integrated circuits digital, nes $11,077,686 $36,185,920
TOTAL (Commodities Listed Above) $577,204,073 $771,045,113
TOTAL (All Commodities) $1,379,988,925 $1,541,052,468
Export Performance1997 1998 1999 2000 2001$'000 $'000 $'000 $'000 $'000
ALBERTA $184,098 $163,685 $135,958 $110,768 $114,633
CANADA $1,637,130 $1,779,279 $1,467,340 $1,379,989 $1,541,052
-77-

International Trade Revie
New ZealandCapital: Wellington
Official Language: English, Maori
Population (Jul '00 est.): 3,864,129
Currency: New Zealand Dollar (NZD)NZD/USS: 2.2502 (Jan 01) 2.1863 (2000)
GDP/Capita ('99 est.): $ 17,700 (US)
Imports (1998): $ 14.3 Billion (US)
Major Suppliers: Australia, US, Japan, UK
exports irom MiuenaCanada Alberta Alberta
HS Code Commodity Description 2001 2000 2001
310221 Ammonium sulphate, in packages weighing more than 10 kg $6,473,420 $5,990,341 $6,473,420
100190 Wheat nes and meslin $11,295,628 $2,388,007 $3,979,465
250300 Sulphur of all kinds $5,499,669 $7,605,942 $3,882,819
841480 Air or gas compressors, hoods $3,419,747 $0 $3,409,747
843049 Boring or sinking machinery, not self-propelled nes $2,060,395 $0 $2,060,395
841 121 Turbo-propellers of a power not exceeding 1 100 KW $1,135,165 $1,074,227 $1,135,165
990100 Low value export transactions and confidential commodities $6,092,810 $376,956 $750,318
851790 Parts of electrical apparatus for line telephone or line telegraphy $4,147,462 3)oUD,4oB CCOI QAO
392010 Film and sheet etc, non-cellular etc, of polymers of ethylene $576 027 $588 150
3901 10 Polyethylene having a specific gravity of less than 0.94 $628,548
151790 Edible fats and oil mixtures & preparations nes $620,442 $185 785 $558 ?5?
851719 Line telephony electrical apparatus, nes $328,189 "KQ.fi 67?O ZJ \J , U 1 i- $11fi ?7?vPO I \J . il / <J
391732 Tubes, pipes and hoses nes, plastic, not reinforced etc, w/o fittings $315,956 $199 756vJJ I ZJ ZJ , / JU $315 956
851 730 Telephonic or telegraphic switching apparatus $360,762 $57 380 \D i- ZD ZJ , UU
730890 Structures and parts of structures of iron or steel, nes $472,638 $0 $231 ,377
1 U 1 ML \\s Ul 1 1 1 1 IUU 1 llco LlolCU MUUVcf
$4"} R?fi R71 $19,259,892 $25,204,926
total (All Commodities) C04<1 AH a con $26,578,932 $27,992,836
Exports from CanadaCanada Canada
f"!nHp ftnmmnrlitv DpQprintion 2000 2001
310420 Potassium chloride, in packages weighing more than 10 kg $32,340,346 $35,914,026
020329 Swine cuts, frozen nes $19,292,448 $16,801,805
880520 Flight simulators and parts thereof coo nnn oi4,ooy,zBi
100190 Wheat nes and meslin $6,777,583 $11,295,626
440710 Lumber, coniferous (softwood) 6 mm and thicker $19,014,325 $11.1 14.53C
890392 Motorboats other than outboard motorboats $420,778 $8,139,031
310221 Ammonium sulphate, in packages weighing more than 10 kg $5,990,341 $6,473,42C
990100 Low value export transactions and confidential commodities $5,970,649 $6,092,810
844330 Flexographic printing machinery $0 $5,610,600
^oUoUU bulphur of all kinds $8,655,356 $5,499,669
TOTAL (Commodities Listed Above) $98,490,826 $121,510,804
TOTAL (All Commodities) $187,044,626 $211,014,580
Export Performance1997 1998 1999 2000 2001
$'000 $'000 $'000 $'000 $'000
ALBERTA $49,241 $41,913 $39,720 $26,579 $27,993
CANADA $294,215 $206,104 $203,140 $187,045 $211,015
-78-

International Trade Review
Nigeria
Exports from Alberta
Capital
Official LanguagePopulation (Jul '00 est.)
Currency
NGN/USSGDP/Capita ('99 est.)
Imports (1998)
Major Suppliers
Abuja
English
123,337,822
1 Naira (NGN)110.005 (Jan. 01) 101.697 (2000)
$ 950 (US)
$ 10.7 Billion (US)
UK, Germany, US, France, China
Canada Alberta Alberta
HS Code Commodity Description 2001 2000 2001
100190 Wheat nes and meslin $66,407,099 $12,639,064 $23,396,220847989 Machines & mechanical appliances nes, having individual functions $1,096,450 $811,458 $1,065,794843143 Parts of boring or sinking machinery, whether or not self-propelled $1,019,532 $92,124 $1,013,049841290 Parts of hydraulic & pneumatic & other power engines and motors $773,934 $112,052 $773,934853710 Controls etc with electronic apparatus for electrical controls not over 1000 V $497,667 $0 $497,667843049 Boring or sinking machinery, not self-propelled nes $377,583 $0 $374,583841229 Hydraulic power engines & motors excluding linear acting engines $272,959 $615,000 $272,959990100 Low value export transactions and confidential commodities $753,085 $74,156 $239,865851790 Parts of electrical apparatus for line telephone or line telegraphy $1,842,568 $2,749 $206,836
847990 Parts of machines & mechanical appliances nes, having individual functions $267,698 $20,000 $176,609
852520 Transmission apparatus, for radio-telephony incorporating receivers $7,442,644 $14,177 $164,557842139 Filtering & purifying machinery & apparatus for gases nes $131,297 $0 $131,297870899 Motor vehicle parts, nes $404,233 $0 $80,000902300 Instruments, apparatus & models for demonstration use, and part thereof $30,436 $0 $30,436
621133 Men's or boy's outer garments from manmade fibers, not knit $26,311 $0 $26,311
TOTAL (Commodities Listed Above) $81,343,496 $14,380,780 $28,453,117
TOTAL (All Commodities) $103,856,958 $17,911,497 $28,665,138
Exports from CanadaCanada Canada
HS Code Commodity Description 2000 2001
100190 Wheat nes and meslin $35,874,855 $66,407,099
852520 Transmission apparatus, for radio-telephony incorporating receivers $348,858 $7,442,644
392690 Articles of plastics, nes $232,454 $4,975,727
852990 Parts suitable for use with the appliances of headings 85.25 $21,496 $1,875,542
851790 Parts of electrical apparatus for line telephone or line telegraphy $5,916,305 $1,842,568
940600 Prefabricated buildings $434,733 $1,771,749
980600 Settler's personal and household effects $572,550 $1,199,841
030374 Mackerel except fillets, livers and roe, frozen $0 $1,105,409
847989 Machines & mechanical appliances nes, having individual functions $811,458 $1,096,450
441890 Builders joinery and carpentry of wood nes $0 $1,060,982
TOTAL (Commodities Listed Above) $44,212,709 $88,778,011
TOTAL (All Commodities) $58,801,519 $103,856,958
Export Performance1997 1998 1999 2000 2001$'000 $'000 $'000 $'000 $'000
ALBERTA $17,401 $12,820 $5,504 $17,911 $28,665
CANADA $103,826 $54,454 $28,861 $58,802 $103,857
- 79-

International Trade Review
NorwayCapital Oslo
Official Language Norwegian
Population (Jul '00 est.) 4,503,440
Currency Norwegian Krone (NOK)NOK/USS 8.7784 (Jan 01) I3.8018 (2000)
GDP/Capita ('99 est.) $ 27,700 (US)
Imports (2000) $35.2 Billion (US)
Major Suppliers EU, US, Japan
Exports from AlbertaCanada Alberta Alberta
HS Code Commodity Description 2001 2000 2001
841290 Parts of hydraulic & pneumatic & other power engines and motors $10,935,177 $974,707 $10,935,177
901580 Surveying, hydrographic, oceanographic, meteorological or geophysical instr. $6,300,309 $2,012,022 $5,168,063
901590 Parts and accessories for surveying instruments & equipment $4,043,244 $158,032 $4,012,968
847990 Parts of machines & mechanical appliances nes, having individual functions $3,328,782 $1,527,841 $3,159,928843143 Parts of boring or sinking machinery, whether or not self-propelled $3,535,675 $61,601 $3,151,523
847989 Machines & mechanical appliances nes, having individual functions $3,618,275 $447,770 $1,398,602848180 Taps, cocks, valves and similar appliances, nes $1,614,261 $2,519,069 $1,364,1373901 10 Polyethylene having a specific gravity of less than 0.94 $824,026 (TQOyt HOC
843139 Parts of lifting, handling, loading or unloading machinery $2,197,821 $337,641 $809,364732690 Articles, iron or steel, nes $553,406 $0 $544,476902130 Artificial parts of the body, nes $554,299 $991,508 $544,299848140 Safety or release valves $385,386 $94,765 $355,475990100 Low value export transactions and confidential commodities $6,723,656 $216,335 $323,924846791 Parts of chainsaws, nes $263,952 $15,453 $259,064980600 Settler's personal and household effects $787,920 $330,000 $245,150
TOTAL (Commodities Listed Above) $45,656,189 911,1 i o,soyTOTAL (All Commodities) $924,978,802 $1 J,291 ,410 tOC A C A OCA$35,154,861
Exports from CanadaCanada Canada
HS Code Commodity Description 2000 2001
750110 Nickel mattes $572,077,894 $632,274,906
810510 Cobalt waste, scrap and powder $62,379,959 $49,377,255
880230 Aircraft nes of an unladen weight > 2,000 kg but not exceeding 15,000 kg $0 $35,542,924
7401 10 Copper mattes $11 4?n 474 tn? cii4 ^iq
260800 Zinc ores and concentrates $21,429,187 $26,703,961
160520 Shrimps and prawns, prepared or preserved $7,677,328 $16,225,826
841290 Parts of hydraulic & pneumatic & other power engines and motors $974,707 $10,935,177
440799 Lumber, non-coniferous, nes $12,356,779 $8,172,943
901480 Navigational instruments and appliances nes $2,069,066 $7,830,257291512 Salts of formic acid 1 ,0^0, o^**
TOTAL (Commodities Listed Above) $717,719,018 $826,447,108TOTAL (All Commodities) $830,310,506 $924,978,802
Export Performance
1997 1998 1999 2000 2001
$'000 $'000 $'000 $'000 $•000
ALBERTA $13,000 $21,007 $11,807 $13,291 $35,155CANADA $760,183 $848,606 $716,560 $830,311 $924,979
-80-

International Trade Review
OmanCapital Muscat
Population (Jul '00 est.) 2,622,198
Currency Omani rial (OMR)OMR/USS 0.3845 (fixed rate since 1986)
GDP/Capita ('99 est.) $7,700 USImports (2000) $4.5 Billion (US)
Major Suppliers UAE, Japan, UK, Italy, Germany
Exports from Albertaudi l a vj
d
Miuerid MioerraHS Code Commodity Description ZUU 1 2000 2001
843143 Parts of boring or sinking machinery, whether or not self-propelled $4,208,188 $1,238,070 $4,208,188841391 Parts of pumps for liquid whether or not fitted with a measuring device $1,053,869 i ,uoo,ooy842511 Pulley tackle & hoist, for raising vehicles, powered & mounted O.'.J 1 ,OU f $0 $922,440848140 Safety or release valves $749,961 $130,600 $741,192843049 Boring or sinking machinery, not self-propelled nes $717,584 $83,910 $717,584848180 Taps, cocks, valves and similar appliances, nes $551,387 $83,332 $490,720847989 Machines & mechanical appliances nes, having individual functions $448,977 $579,307 $448,977852990 Parts suitable for use with the appliances of headings 85.25 $548,548 $0 $442,629843149 Parts of cranes, work-trucks, shovels, and other construction equipment $335,036 $160,052 $311,597847990 Parts of machines & mechanical appliances nes, having individual functions $288,041 $750,636 $218,946902710 Gas or smoke analysis apparatus $212,523 $26,498 $212,523848130 Check valves $163,412 $128,309 $157,023730890 Structures and parts of structures of iron or steel, nes $441,011 $0 $152,138981000 Arms, military stores or munitions of war to remain in country of export $142,804 $0 $142,804382490 Chemical products, prepared & residual products of the industry $142,558 $0 $142,558
TOTAL (Commodities Listed Above) $10,935,706 $3,210,018 $10,363,188TOTAL (All Commodities) $17,770,960 $4,904,142 $11,638,813
Exports from CanadaCanada Canada
HS Code Commodity Description 2000 2001
843143 Parts of boring or sinking machinery, whether or not self-propelled $1,238,070 $4,208,188841391 Parts of pumps for liquid whether or not fitted with a measuring device $29,304 $1,053,869842511 Pulley tackle & hoist, for raising vehicles, powered & mounted $0 $931,807848140 Safety or release valves $135,043 $749,961903289 Automatic regulating or controlling instruments and apparatus, nes $238 $743,787843049 Boring or sinking machinery, not self-propelled nes $83,910 $717,584880400 Parachutes, including dirigible parachutes $0 $665,424391732 Tubes, pipes and hoses nes, plastic, not reinforced etc, w/o fittings $0 $640,250848180 Taps, cocks, valves and similar appliances, nes $140,602 $551,387852990 Parts suitable for use with the appliances of headings 85.25 $26,635 $548,548
TOTAL (Commodities Listed Above) $1,653,802 $10,810,805TOTAL (All Commodities) $9,902,042 $17,770,960
Export Performance
1997 1998 1999 2000 2001$'000 $'000 $'000 $'000 $'000
ALBERTA $6,601 $9,641 $6,577 $4,904 $11,639CANADA $14,536 $14,343 $11,431 $9,902 $17,771
-81 -

International Trade Revie
PeruCapital: Lima
Official Language: Spanish, QuechuaPopulation (Jul '00 est.): 27,4838,864
Currency: Nuevo Sol (PEN)PEN/USS: 3.523 (Jan 01) 3.490 (2000)
GDP/Capita ('99 est.): $4,550 (US)
Imports (1998): $ 7.4 Billion (US)
Major Suppliers: US, EU, Andean Community
Exports from AlbertaCanada Alberta Alberta
HS Code Commodity Description 2001 2000 2001
100190 Wheat nes and meslin $55,594,092 $27,546,273 $19, 587, 38c
100110 Durum wheat $38,822,805 $3,764,616 $8,336,97e
020622 Bovine livers, edible, frozen $3,285,413 $1,501,534 $3,041, 87E
071310 Peas dried, shelled, whether or not skinned or split $5,100,631 $6,661 $985,57J392010 Film and sheet etc, non-cellular etc, of polymers of ethylene $593,451 $50,736 $185,586
382490 Chemical products, prepared & residual products of the industry $673,089 $0 $159. 10E
110312 Oat groats and meal $148,561 $1,074,398 $148,561
851790 Parts of electrical apparatus for line telephone or line telegraphy $242,848 <C9Q1 £1Q3>^y i ,0 i
»
a) i jy ,ouc
852990 Parts suitable for use with the appliances of headings 85.25 $0 $1 14 576
990100 Low value export transactions and confidential commodities $1,299,575 $130,994 $85 06'
841480 Air or gas compressors, hoods $77,510 $0 $77,51C
850440 Static converters, nes $91,517 $18,741 $59,646
020629 Bovine edible offal, frozen, nes $187,117 $175 369 $57,747
852440 Magnetic tapes for reproducing other than sound/images $53,905 $28,268 $53,905
853810 Boards, panels, consoles etc. for electronic apparatus over 1000 volts $36,505 $11 330 $36 50 c
TOTAL (Commodities Listed Above) 4> !UU,JJH,3DJ $34,600,539 $33,069,522
TOTAL (All Commodities) $183,339,849 $36,220,865 $33,549,19J
Exports from CanadaCanada Canada
HS Code Commodity Description 2000 2001
100190 Wheat nes and meslin $78,185,894 $55,594,09:
100110 Durum wheat $1 7 5?7 Q41
260300 Copper ores and concentrates $8,985,448 $7,012, 50J
440310 Wood in the rough, treated, painted etc. with preservatives $0 $5,511,60:
071340 Lentils dried, shelled, whether or not skinned or split $6,287,232 $5,190,85:
847710 Injection-molding machinery for working rubber or plastic $590,467 $5,124,63/
071310 Peas dried, shelled, whether or not skinned or split $2,877,537 $5,100,63'
847490 Pts of sorting/screening/mixing/crush/grinding/washing/agglomerating mach etc $3,836,789 $3,516,797
150200 Fats, bovine, sheep or goat, raw or rendered $0 $3,385,02{
842951 Front end shovel loaders $7,034,306 $3,324,115
TOTAL (Commodities Listed Above) $125,325,614 $132,583,072
TOTAL (All Commodities) $193,385,006 $183,339,849
Export Performance
1997 1998 1999 2000 2001
$'000 $'000 $'000 $'000 $'00C
ALBERTA $48,854 $30,872 $27,479 $36,221 $33,54J
CANADA $309,305 $186,197 $165,151 $193,385 $183,34(
-82-

International Trade Review
PhilippinesCapital Manila
Official Language Filipino and English
Kopuiation (Jul uu est.) 82,841,518
Currency Philippine peso (PHP)
PHP/USS 50.969 (Jan 01) 44.192(2000)
GDP/Capita ('97 est.) $ 3,800 (US)ImnnrtQ 1 1 QQft^ $ 35.0 Billion (US)
Major Suppliers US, Japan, S. Korea, Singapore
Taiwan
Exports from AlbertaCanada Alberta Alberta
HS Code Commodity Description 2001 2000 2001
100190 Wheat nes and meslin $164,020,611 ffnrt nofl "37C ffC"7 70C ICQ3)0/
,loo, 1 bo
470321 Chemical wood pulp, coniferous $5,662,738 $1,710,122 $2,493,084
853720 Controls with electric apparatus for electronic controls over 1000 Volts $1 ,436,640 $0 $1,436,640
071310 Peas dried, shelled, whether or not skinned or split $4,869,753 $321,884 $1,115,879
550200 Artificial filament tow $692,266 $663,393 $692,266
151490 Canola, rape, colza/mustard oil & their fractions, refined $571,249 $744,405 $499,439
990100 Low value export transactions and confidential commodities $2,962,865 $143,003 $450,797
390190 Polymers of ethylene nes, in primary forms $438,212 $654,616 $438,212
200410 Potatoes prepared or preserved other than by vinegar or acids $6,354,533 $124,375 $304,610
020329 Swine cuts, frozen, nes $2,327,827 $390,279 $270,798
020714 Chicken and capon cuts and edible offal, frozen $2,064,448 $288,652 $261,585
390120 Polyethylene having a specific gravity of 0.94 or more $244,914 $0 $244,914
470329 Chemical wood pulp, non-coniferous $188,853 $0 $188,853
392590 Builders' ware of plastics, nes $151,870 $176,440 $151,870
040210 Milk powder not exceeding 1 .5% fat $142,500 $0 $142,500
TOTAL (Commodities Listed Above) $192,129,279 $45,147,545 $66,477,610
TOTAL (All Commodities) $340,533,603 $54,336,981 $68,194,893
Exports from CanadaCanada Canada
HS Code Commodity Description 2000 2001
100190 Wheat nes and meslin $113,340,111 $164,020,611
260300 Copper ores and concentrates $37,255,037 $15,444,167
440710 Lumber, coniferous (softwood) 6 mm and thicker $14,459,119 $12,144,803
310420 Potassium chloride, in packages weighing more than 10 kg $9,331,372 $10,010,340
854213 Metal oxide semiconductors, mono digital integrated $4,639,190 $8,016,333
220290 Non-alcoholic beverages, nes $0 $6,765,782
200410 Potatoes prepared or preserved other than by vinegar or acids $6,307,432 $6,354,533
470321 Chemical wood pulp, coniferous $5,903,638 $5,662,738
071310 Peas dried, shelled, whether or not skinned or split $1,270,012 $4,869,753
980600 Settler's personal and household effects $4,824,412 $4,264,776
TOTAL (Commodities Listed Above) $197,330,323 $237,553,836
TOTAL (All Commodities) $371,770,505 $340,533,603
Export Performance1997 1998 1999 2000 2001$'000 $'000 $'000 $'000 $'000
ALBERTA $64,072 $32,218 $42,399 $54,337 $68,195
CANADA $417,812 $252,876 $287,960 $371,771 $340,534
-83-

Internationa / Trade Review
RussiaCapital: Moscow
Official Language: Russian
Population (Jul '00 est.): 145,470,197
Currency: Russian Ruble (RUR)RUR/US$: 28.3592 (Jan 01) 28.1292 (2000)
GDP/Capita ('99 est.): $ 7,700 (US)
Imports (2000): $ 44.2 Billion (US)
Major Suppliers: Germany, Belarus, Ukraine, US
Exports from AlbertaCanada Alberta Alberta
HS Code Commodity Description 2001 2000 2001
847989 Machines & mechanical appliances nes, having individual functions $23,808,255 $3,524,563 $19,960,374
841990 Parts of machinery, plant and equipment of heading No 84.19 $13,767,295 $1,003,089 $13,767,295
843139 Parts of lifting, handling, loading or unloading machinery $13,367,771 $5,313,199 $13,332,902
870590 Special purpose vehicles nes $9,198,420 $0 $9,198,420
843143 Parts of boring or sinking machinery, whether or not self-propelled $19,298,857 $10,614,120 $7,975,797
842129 Filtering or purifying machinery & apparatus for liquids $4,303,318 $0 $1,300,455
020622 Bovine livers, edible, frozen $2,843,881 $961,708 $2,268,699
847990 Parts of machines & mechanical appliances nes, having individual functions $3,186,088 $1,473,675 $1,788,046
872520 Mobile drilling derricks $1,720,912 $0 $172o!912843149 Parts of cranes, work-trucks, shovels, and other construction equipment $1 ,754,896 $767,417 $1,688,136
940600 Prefabricated buildings $2,474,290 $3,554,044 $1,534,193
841 290 Parts of hydraulic & pneumatic & other power engines and motors $1,395,358 $596,023 $1,395,358
851719 Line telephony electrical apparatus, nes $1,454,827 $1,362,341 $1,270,502
382440 Prepared additives for cements, mortar or concrete $l!077!912 $377,284 $1,036,313
020649 Swine, edible offal, frozen $14,850,707 $0 $845,952
TOTAL (Commodities Listed Above) $114,502,787 $29,547,463 $82,083,354
TOTAL (All Commodities) $278,791,389 $62 121 936 $90 017 852
Exports from Canada
Canada CanadaHS Code Commodity Description 2000 2001
847989 Machines & mechanical appliances nes, having individual functions $4,119,807 $23,808,255
020329 Swine cuts, frozen nes $8,115,840 $21,786,646
843143 Parts of boring or sinking machinery, whether or not self-propelled CIO CC1 CCQ
392520 Doors, windows and their frames and thresholds for doors, of plastic $20,958,022 $18,459,647
240120 Tobacco, unmanufactured, partly or wholly stemmed or stripped $19,050,076 $18,284,045
020649 Swine, edible offal, frozen $2,194,997 $14,850,707
841990 Parts of machinery, plant and equipment of heading No 84.19 $1,003,089 $13,767,295
843139 Parts of lifting, handling, loading or unloading machinery $5,324,030 $13,367,771
870590 Special purpose vehicles nes $75,568 $9,198,420
392690 Articles of plastics, nes $1,804,744 $6,157,408
TOTAL (Commodities Listed Above) $75,197,732 $158,979,051
TOTAL (All Commodities) $195,177,538 $278,791,389
Export Performance1997 1998 1999 2000 2001
$'000 $'000 $'000 $'000 $'000
ALBERTA $45,810 $34,413 $26,370 $62,122 $90,018
CANADA $361,277 $276,588 $171,531 $195,178 $278,791
-84-

International Trade Review
Saudi Arabia
Exports from Alberta
Capital
Official LanguagePopulation (Jul '00 est.)
Currency
SAR/US$GDP/Capita ('99 est.)
Imports (2000)
Major Suppliers
Riyadh
Arabic
22,757,092
Saudi Riyal (SAR)
3.745 (Fixed rate since 1986)
$ 10,500 (US)
$ 30.1 Billion (US)
US, Japan, Germany, Italy
Canada Alberta Alberta
HS Code Commodity Description 2001 2000 2001
100300 Barley $23,931,533 $18,012,259 $9, 948,338841290 Parts of hydraulic & pneumatic & other power engines and motors $5,499,796 $254,847 $5,498,772
851719 Line telephony electrical apparatus, nes $2,025,638 $1,723,189 $2,025,638851790 Parts of electrical apparatus for line telephone or line telegraphy $2,270,454 $6,868,101 $1,917,764
853720 Controls with electric apparatus for electronic controls over 1000 Volts $1,813,163 $0 $1,813,163
851730 Telephonic or telegraphic switching apparatus $1,499,519 $1,206,073 $1,499,519
200410 Potatoes prepared or preserved other than by vinegar or acids $1,526,598 $481,563 $1,477,714
847330 Parts and accessories of automatic data processing machines $1,356,525 $19,925 $734,321847989 Machines & mechanical appliances nes, having individual functions $825,116 $103,704 $489,856
902710 Gas or smoke analysis apparatus $408,308 $252,001 $382,611
392010 Film and sheet etc, non-cellular etc, of polymers of ethylene $546,397 $503,939 $328,484850440 Static converters, nes $368,982 $297,595 $287,173
981000 Arms, military stores or munitions of war to remain in country of export $286,394 $0 $286,394
852020 Telephone answering machines $254,349 $268,162 $254,349
980600 Settler's personal and household effects $1,784,373 $76,740 $246,904
TOTAL (Commodities Listed Above) $44,397,145 $30,069,098 $27,191,000
TOTAL (All Commodities) $315,432,511 $35,094,124 $29,379,444
Exports from CanadaCanada Canada
HS Code Commodity Description 2000 2001
880240 Airplanes and other aircraft, of an unladen weight exceeding 15,000 kg $47,955,600 $60,976,000
990100 Low value export transactions and confidential commodities (TO ACT f\A~T CO/1 CT A 7iC
100300 Barley $43,329,947 $23,931,533
480100 Newsprint, in rolls or sheets $8,601,192 $16,357,020
870324 Automobiles with reciprocating piston engine displacing > 3000 cc $14J83!939 $13,361,375
480510 Paper, fluting (corrugating medium), in rolls, semi-chemical, uncoated $13,575,257 $12,792,839
871000 Tanks and other armoured fighting vehicles, motorized, and parts thereof $8,846,131 $11,759,257
440710 Lumber, coniferous (softwood) 6 mm and thicker $11,416,501 $11,061,781
852510 Transmission apparatus for radio-telephony radio-broadcasting or television $11,468,336 $8,023,842
852990 Parts suitable for use with the appliances of headings 85.25 $6,009,033 $6,805,069
TOTAL (Commodities Listed Above) $167,852,983 $189,643,432
TOTAL (All Commodities) $319,891,963 $315,432,511
Export Performance
1997 1998 1999 2000 2001$'000 $'000 $'000 $'000 $'000
ALBERTA $86,150 $15,470 $10,677 $35,094 $29,379
CANADA $543,233 $304,135 $291,725 $319,892 $315,433
-85-

International Trade Revie^
* f\ m"\ ^\ « 1oGnegaiCapital Dakar
Official Lannnanp French (official)
PoDulation (Julv 2001 est ^^ yj i cj kiwi • \uui y i_ ww i w o l . i 10,284,929
Currency Communaute Financiere Africaine
franc (XOF)
XOF/USS 699.21 (Jan 01), 711.98 (2000)
GDP/Capita ('OOest.) $ 1,600 (US)
Imports (2000) $ 1.3 Billion (US)
Major Suppliers France, Nigeria, Italy, Thailand
Exports from AlbertaCanada Alberta Alberta
HS Code Commodity Description 2001 2000 2001
250300 Sulphur of all kinds $9,543,353 $7,397,890 $9,543,353
100190 Wheat nes and meslin $1,836,460 S547 628 $647 09"?
843143 Parts of boring or sinking machinery, whether or not self-propelled $14,614 $0 $11,614
TOTAL (Commodities Listed Above) $1 1 ,476,643 $8,230,720 $10,202,060
TOTAL (All Commodities) $41 ,693,1 59 $8 230 720 $10 202 060
Exports from CanadaCanada Canada
2000 2001
880230 Aircraft nes of an unladen weight > 2,000 kg but not exceeding 15,000 kg $0 $23,895,422
250300 Sulphur of all kinds j> / ,oy / ,oyu
100190 Wheat nes and meslin $1,554,285 $1,836,460
841090 Parts, including regulators, for hydraulic turbines and water wheels $5,604,846 $936,960
252400 Asbestos $822,780 $760,095
853690 Electrical appliances for protection of electric circuitry not over 1 000 Volts $1,445,246 $579,980
851780 Electronic telephonic and telegraphic apparatus nes $0 $556,858
980600 Settler's personal and household effects $340,925 $378,354
852520 Transmission apparatus, for radio-telephony incorporating receivers $906,193 $259,876
852510 Transmission apparatus for radio-telephony radio-broadcasting or television $113,481 $238,324
TOTAL (Commodities Listed Above) $18,185,646 $38,985,682
TOTAL (All Commodities) $30,348,399 $41,693,159
Export Performance
1997 1998 1999 2000 2001
$'000 $'000 $'000 $'000 $'000
ALBERTA $37 $7,022 $3,663 $8,231 $10,202
CANADA $18,436 $23,311 $23,936 $30,348 $41,693
-86-

International Trade Review
SingaporeCapital Singapore
Official Language Chinese, Malay, Tamil and English
ropuiauon (jui uu esij 4,300,419
Currency Singapore Dollar (SGD)SGD$/US$ 1.765 (Jan 01) 1.724 (2000)
nnP/Panita fQ7 pet \ $ 26,500 (US)
imports \ i yyoj $ 127.0 Billion (US)
Major Suppliers US, Japan, Malaysia, Thailand
Exports from AlbertaCanada Alberta Alberta
HS Code Commodity Description 2001 onnnZUUU zUUl
750210 Nickel unwrought, not alloyed $33,124,847 $9,871,31
1
$15,144,620810510 Cobalt $8,972,571 $14,878,641 $8,972,571843143 Parts of boring or sinking machinery, whether or not self-propelled $8,054,406 $1,867,211 $7,163,857851790 Parts of electrical apparatus for line telephone or line telegraphy $9,254,704 $7,117,585 $5,547,455842619 Overhead traveling transportation gantry/bridge/mobile lift form nes $3,834,594 $0 $3,834,594848180 Taps, cocks, valves and similar appliances, nes $5,247,176 $2,342,149 $3,737,345851719 Line telephony electrical apparatus, nes $3,475,295 $5,295,448 $3,457,521843139 Parts of lifting, handling, loading or unloading machinery, nes $2,835,213 $79,784 $2,765,820390190 Polymers of ethylene nes, in primary forms $2,502,105 $1,187,918 $2,219,972841121 Turbo-propellers of a power not exceeding 1 100 KW $3,134,736 $0 $1,903,783841290 Parts of hydraulic & pneumatic & other power engines and motors $1,805,852 $2,541,336 $1,746,616851730 Telephonic or telegraphic switching apparatus $1,620,124 $824,286 $1,587,274
200410 Potatoes prepared or preserved other than by vinegar or acetic acid, frozen $2,301 ,282 $916,501 $1,486,936151410 Rapeseed/colza/mustard oil & fractions, crude $4,831,280 $0 $1,259,822852440 Magnetic tapes for reproducing other than sound/images $1,062,812 $631,472 $1,062,812
TOTAL (Commodities Listed Above) $92,056,997 $47,553,642 $61,890,998TOTAL (All Commodities) $350,919,679 $81,730,702 $79,728,806
Exports from Canada
HS Code Commodity Description
Canada2000
Canada2001
750210
841191847290854213120100990100480100880212851790810510
Nickel unwrought, not alloyed
Parts of turbo-jets or turbo-propellers
Office machinery for automatic banknote dispensers, etc
Metal oxide semiconductors, mono digital integrated
SoybeansLow value export transactions and confidential commodities
Newsprint, in rolls or sheets
Helicopters of an unladen weight exceeding 2000 Kg.
Parts of electrical apparatus for line telephone or line telegraphy
Cobalt
$30,794,729
$14,517,522
$4,595,459
$2,194,878
$5,248,576
$9,743,126
$13,697,834
$3,525,335
$10,927,975
$14,878,641
$33,124,847
$15,272,551
$14,340,022
$13,622,431
$12,081,122
$11,799,030
$10,765,430
$9,649,280
$9,254,704
$8,972,571
TOTAL (Commodities Listed Above)TOTAL (All Commodities)
$110,124,075
$327,158,408
$138,881,988
$350,919,679
Export Performance1997$'000
1998$'000
1999$'000
2000$'000
2001$'000
ALBERTACANADA
$86,669
$514,927$82,056
$376,302$66,855
$349,761
$81,731
$327,158$79,729
$350,920
-87-

Internationa / Trade Revie
South AfricaCapital Pretoria
Official Language Afrikaans, English and 9 others
Population (Jul '00 est.) 43,586,097
Currency Rand (ZAR)
ZAR/USS 7.60 (Mar 01) 6.93983 (2000)
GDP/CaDita f99 est ) $8,500 (US)Imnnr+Q lOnOCWin ipui lb (ZUUUJ $ 27.6 Billion (US)
Major Suppliers Germany, US, UK, Japan,
Exports from AlbertaCanada Alberta Alberts
HS Code Commodity Description 2001 2000 2001
250300 Sulphur of all kinds $15,714,782 $18,281,497 $9,069,825
110710 Malt, not roasted $12,819,912 $2,661,569 $8,230,915
100300 Barley $11,749,844 $2,144,839 $4,884,41C
220830 Whiskies $1,588,660 $820,816 $1,588,66C
730429 Casing & tubing for oil & gas drilling, iron or steel $465,321 $0 $465,321
841290 Parts of hydraulic & pneumatic & other power engines and motors $352,730 $151,288 $347,834
843143 Parts of boring or sinking machinery, whether or not self-propelled $2,549,848 $187,205 $344,324
270300 Peat, including agglomerated JrfOD, 1 HO $16,517 $263,884
220720 Ethyl alcohol and other spirits denatured, any strength $255,892'
$0 $255,892
990100 Low value export transactions and confidential commodities $4,443,617 $147,022 $245,482
847150 Digital processing units, nes $277,175 $29,540 $230,096
902130 Artificial parts of the body, nes $226,554 $155,317 $212,658
902710 Gas or smoke analysis apparatus $269,168 $220,839 $192,611
851790 Parts of electrical apparatus for line telephone or line telegraphy $118,803 $187,427
980600 Settler's personal and household effects $1 947 2*3*;O I , 1 , £. O $11,000 $161,000
TOTAL (Commodities Listed Above) $53,226,014 $24,94b,Zo2 toe con iifl
TOTAL (All Commodities) $187,887,016 C/in 07c C<tA<p4U,0 1 3,314 too Ani fifii
Exports from CanadaCanada Canada
HS Code Commodity Description 2000 2001
870410 Dumpers designed for off-highway use $2,570,260 $16,382,505
250300 Sulphur of all kinds $22,411,121 $15,714,782
110710 Malt, not roasted 1 ,00 1 ,y \ h $1 9 ft1 Q Q1y
100300 Barley $5,159,583 $11,749,844
842951 Front end shovel loaders $4,653,192 $7,233,051
071310 Peas dried, shelled, whether or not skinned or split $2,968,173 $5,768,665
990100 Low value export transactions and confidential commodities $5,473,506 $4,443,617
470321 Chemical wood pulp, coniferous CO QAA Oil
591132 Textile fabrics used in paper-making or similar machines, weighing >650 kg/m $8,302,634 $3,440,519
847710 Injection-molding machinery for working rubber or plastic $1,410,597 $3,318,236
TOTAL (Commodities Listed Above) $74,134,185 $84,815,408
TOTAL (All Commodities) $235,948,510 $187,887,016
Export Performance1997 1998 1999 2000 2001
$'000 $'000 $'000 $'000 $'000
ALBERTA $39,897 $54,976 $46,626 $40,876 $28,423
CANADA $361,012 $310,104 $238,451 $235,949 $187,887
-88-

International Trade Review
Spain
Exports from Alberta
Capital:
Official Language:
Population (Jul '00 est.)
Currency
ESP/USS
GDP/Capita ('99 est.)
Imports (2000)
Major Suppliers
Madrid
Castilian Spanish (official) 74%,Catalan 17%Galician 7%, Basque 2%40,037,995
Peseta (ESP) Euro
1 .0659 (Jan 01 ) 1 .0854 (2000)
1 Euro = 166.386 pesetas
$ 18,000 (US)
$ 153.9 Billion (US)
EU, US, OPEC, Japan
Canada Alberta Alberta
HS Code Commodity Description 2001 2000 2001
100190 Wheat nes and meslin $40,491,499 $10,819,290 $14,265,476270112 Bituminous coal $7,600,795 $8,013,647 $7,600,795902130 Artificial parts of the body, nes $5,073,989 $1,735,985 $5,073,989390190 Polymers of ethylene nes, in primary forms $1,704,975 $0 $1,704,975280300 Carbon (carbon blacks and other forms of carbon, nes) $1,625,311 $2,782,404 $1,493,172071310 Peas dried, shelled, whether or not skinned or split $55,289,070 $12,006,013 $1,450,062750210 Nickel unwrought, not alloyed $998,323 $2,913,351 $998,323902710 Gas or smoke analysis apparatus $885,388 $247,856 $832,129071339 Beans dried, shelled, whether or not skinned or split, nes $4,066,893 $476,817 $543,156470500 Semi-chemical wood pulp $7,844,286 $2,307,018 $529,007732690 Articles, iron or steel, nes $661,136 $4,765,018 $490,005990100 Low value export transactions and confidential commodities $12,827,671 $953,892 $428,772391732 Tubes, pipes and hoses nes, plastic, not reinforced etc, w/o fittings $435,492 $105,000 $322,010390120 Polyethylene having a specific gravity of 0.94 or more $315,223 $0 $315,223071320 Chickpeas, dried, shelled, whether or not skinned or split $3,275,424 $233,110 $297,618
TOTAL (Commodities Listed Above) $143,095,475 $47,359,401 $36,344,712TOTAL (All Commodities) $818,122,384 $50,923,497 $39,086,226
Exports from Canada
HS Code Commodity Description
Canada2000
Canada2001
880230880240470321071310260800100190480100381512841122990100
Aircraft nes of an unladen weight > 2,000 kg but not exceeding 15,000 kg
Airplanes and other aircraft, of an unladen weight exceeding 1 5,000 kg
Chemical wood pulp, coniferous
Peas dried, shelled, whether or not skinned or split
Zinc ores and concentrates
Wheat nes and meslin
Newsprint, in rolls or sheets
Supported catalysts with precious metals/precious metal compoundsTurbo propellers of a power exceeding 1,100 KwLow value export transactions and confidential commodities
$53,150,817
$0$63,871,784
$85,782,221
$35,452,608
$30,708,418
$29,517,361
$9,531,038
$5,257,391
$14,563,770
$187,223,562
$60,976,904
$55,721,201
$55,289,070
$53,142,289
$40,491,499
$33,653,052
$20,189,790
$15,240,846
$12,827,671
TOTAL (Commodities Listed Above)TOTAL (All Commodities)
$327,835,408
$645,580,837
$534,755,884
$818,122,384
Export Performance
1997$'000
1998$'000
1999$'000
2000$'000
2001$'000
ALBERTACANADA
$39,418
$588,152
$36,610
$564,047$53,020
$609,446$50,923
$645,581
$39,086
$818,122
-89-

International Trade Revie\
Sudanud|JI Lai Khartoum
WIMUIdl L_al lyUayc Arabic (Official) NubianPnni ilatinn / hi! '01 pet \r UfJUIaUUil \ JUI U I Col.
j36,080,373
fi irrpnf^uuui i o i o
y
Sudanese Dinar (SDD)SDD/US$ 257.44 (Jul 01), 257.12 (2000)
GDP/Capita ('99 est.) $1,000 (US)
Imports (2000) $1.2 Billion (US)
Major Suppliers China, Saudi Arabia, UK, France
Exports from AlbertavdlldUd Alberta Alberta
HS Code Commodity Description 2001 2000 2001
100190 Wheat nes and meslin $41,088,848 $2,245,757 $14,475,932
841990 Parts of machinery, plant and equipment of heading No 84.19 $5,465,572 $517 $5,465,572
850434 Transformers > 500 KVA, nes $2,667,908 $73,870 $2,667,908
870190 Tractors, nes. $2,349,323 $0 $2,349,323
841 940 Distilling or rectifying plant $1 ,552,023 $0 $1,552,023
843143 Parts of boring or sinking machinery, whether or not self-propelled $1,401,895 $967,737 $1,289,793
841950 Heat exchange units, industrial type $1,170,030 $0 $1,170,030
847989 Machines & mechanical appliances nes, having individual functions $999,637 $576,191 $984,160
871640 Trailers and semi-trailers nes $918,566
847990 Parts of machines & mechanical appliances nes, having individual functions $881,351 C9Q7 Q7n
901580 Surveying, hydrographic, oceanographic, meteorological or geophysical instr. $549,776 Ic/q 77C
841480 Air or gas compressors, hoods $444,815 vt)UQiAAA ft 1 £
850440 Static converters, nes $432,048 4>U
84'31'^Q Parte nf liftinn hanrilinn Inariinn or nnlnariinn marhinprv np^ *£99fi 4 ci9 •4> I U9, I J/ $99fi 4^9«PZ.Z.U ,4 yj£.
841381 Other pumps for liquids, nes $206,512 q>U <C9fifi 94>ZUO,D I z
TOTAL (Commodities Listed Above) $60,354,756 $4,330,579 $33,548,297
TOTAL (All Commodities) $65,394,377 $5,658,142 $34,959,135
Exports from CanadaCanada Canada
no LrOue oommoany Description 2000 2001
100190 Wheat nes and meslin $6,374,248 $41,088,848
841990 Parts of machinery, plant and equipment of heading No 84.19 $51
7
$5,465,572
850434 Transformers > 500 KVA, nes $73,870 $2,667,908
870190 Tractors, nes. $0 $2,349,323
841940 Distilling or rectifying plant $0 $1 ,552,023
843143 Parts of boring or sinking machinery, whether or not self-propelled $1,035,161 $1,401,895
841950 Heat exchange units, industrial type $0 $1,170,030
847989 Machines & mechanical appliances nes, having individual functions $750,118 $999,637871R40 Trailpps anri ^pmi-trailpr^; np*s\j I I \j r \j i i qiici j ! iu Odin uancio uco $0 $918,566
847990 Parts of machines & mechanical appliances nes, having individual functions $318,998 $881,351
TOTAL (Commodities Listed Above) $8,552,912 $58,495,153
TOTAL (All Commodities) $20,652,486 $65,394,377
Export Performance
1997 1998 1999 2000 2001
$'000 $'000 $'000 $'000 $'000
ALBERTA $11,421 $15,623 $15,034 $5,658 $34,959
CANADA $26,675 $38,291 $29,067 $20,652 $65,394
-90-

International Trade Review
Sweden
Exports from Alberta
Capital
Official LanguagePopulation (Jul '00 est.)
Currency
SEK/USSGDP/Capita ('99 est.)
Imports (2000)
Major Suppliers
Stockholm
Swedish
8,875,053
Swedish Krona (SEK)
9.4669 (Jan 2001), 9.1622 (2000)
$22,200 (US)
$ 80.0 Billion (US)
EU, Norway, US
Canada Alberta Alberta
HS Code Commodity Description 2001 2000 2001
470500 Semi-chemical wood pulp $21,715,993 $0 $18,780,221
902130 Artificial parts of the body, nes $576,116 $861,195 $576,116750400 Powders and flakes, nickel $467,357 $0 $467,357852520 Transmission apparatus, for radio-telephony incorp. reception apparatus $455,042 $145,308 $455,042880330 Airplane and helicopter parts, nes $587,363 $129,150 $428,040
990100 Low value export transactions and confidential commodities $4,764,441 $122,509 $191,799220830 Whiskies $3,449,840 $364,623 $183,684940600 Prefabricated buildings $360,268 $22,500 $170,125902710 Gas or smoke analysis apparatus $150,352 $137,805 $136,343847330 Parts and accessories of automatic data processing machines $4,120,908 $19,881 $100,000280300 Carbon (carbon blacks and other forms of carbon, nes) $96,232 $0 $96,232051110 Bovine semen $181,375 $9,500 $94,050
071339 Beans dried, shelled, whether or not skinned or split, nes $165,744 $0 $83,024847160 Automatic data processing input or output units, storage or not nes $2,193,345 $0 $70,000
847989 Machines & mechanical appliances nes, having individual functions $4,089,898 $0 $53,678
TOTAL (Commodities Listed Above) $43,374,214 $1,812,471 $21,885,711
TOTAL (All Commodities) $294,714,967 $8,236,675 $22,523,614
Exports from CanadaCanada Canada
HS Code Commodity Description 2000 2001
260800 Zinc ores and concentrates $69,482,341 $51,910,229
470500 Semi-chemical wood pulp $3,859,211 $21,715,933
880520 Flight simulators and parts thereof $648,639 $18,439,063
260700 Lead ores and concentrates $17,223,991 $16,596,980
440799 Lumber, non-coniferous, nes $11,207,699 $15,092,347
820240 Chainsaw blades (lengths other than cut to size) and parts, base metals $10,459,978 $11,431,515
841191 Parts of turbo-jets or turbo-propellers $12,479,325 $8,641,318
870431 Gas powered trucks with a GVW not exceeding five tonnes $2,816,899 $6,111,816
491199 Printed matter nes $4,654,027 $5,610,117
440130 Sawdust and wood waste and scrap $6,248,605 $5,181,475
TOTAL (Commodities Listed Above) $139,080,715 $160,730,793TOTAL (All Commodities) $326,954,234 $294,714,967
Export Performance
1997 1998 1999 2000 2001$'000 $'000 $'000 $'000 $'000
ALBERTA $9,884 $4,703 $10,235 $8,237 $22,524
CANADA $374,782 $339,777 $369,889 $326,954 $294,715
-91 -

International Trade Revie
SwitzerlandCapital Bern
Official Language German, French, Italian
Population (Jul '00 est.) 7,283,274
Currency Swiss Franc (CHF)
CHF/US$ 1.6303 (Jan 01) 1.6888 (2000)
GDP/Capita ('99 est.) $ 28,600 (US)
Imports (2000) $ 91.6 Billion (US)
IVIdJUl OUpfJIIcrio EU, US, Japan
Exports from AlbertaCanada Alhprtar\IUCi La Alhort-
HS Code Commodity Description 2001 onnnZUUU zUU
020500 Horse, ass, mule or hinny meat, fresh, chilled or frozen $16,461,295 $9,009,742 $11,068.59;
841 121 Turbo-propellers of a power not exceeding 1 100 KW $57,183,286 $967,087 $2,935,45f
100190 Wheat nes and meslin $4,819,953 R9 w? fin? CI fiQft 79-
100110 Durum wheat $7,543,795 $974,891 $1,620,39'
750210 Nickel unwrought, not alloyed $1,411,547 $0 $1,248,571
9021 30 Artificial parts of the body, nes $1,182,248 $2,173,663 $1,172,65!
470500 Semi-chemical wood pulp $3,002,872 $10,844,679 $688,49*
852520 Transmission apparatus, for radio-telephony incorp. reception apparatus $1,065,388 $30,153 $407,99'
020130 Bovine, cuts boneless, fresh or chilled $371,628 $660,139 $371,62!
901480 Navigational instruments and appliances nes $317,202 $0 $300,15!
491 199 Printed matter nes $441,748
851750 Apparatus, for carrier-current line systems, or for digital line systems, nes $521,345 $0 £189 15'
847990 Parts of machines & mechanical appliances nes, having individual functions $846,656 $0 $188,31
'
852990 Parts suitable for use with the appliances of headings 85.25 $1,550,110 $1 1 9 43? $177 65!
851 790 Parts of electrical apparatus for line telephone or line telegraphy $304,452 $0 <C1 fiO(
TOTAL (Commodities Listed Above) $97,023,525 $27,082,388 $22,417,631
TOTAL (All Commodities) $314,061,608 $31,321,564 $23,776,041
Exports from CanadaCanada Canad;
HS Code Commodity Description 2000 200
841 121 Turbo-propellers of a power not exceeding 1 100 KW $50,192,052 $57,183,28
710812 Gold, non-monetary, unwrought, nes $44,866,563 $35,230,36
020500 Horse, ass, mule or hinny meat, fresh, chilled or frozen $13,419,013 $16,461,29
470321 Chemical wood pulp, coniferous $22,058,952 $11,553,86
470329 Chemical wood pulp, non-coniferous $24,737,201 $10,156.14
990100 Low value export transactions and confidential commodities $8 496 012 $7 733 95
100110 Durum wheat $4,541,685 $7,543,79
880520 Flight simulators and parts thereof $24,242,063 $6,141,08
330499 Beauty & skincare preparation, nes $2,808,921 $6,025,34
100190 Wheat nes and meslin $6,534,769 $4,819,95
TOTAL (Commodities Listed Above) $201,896,872 $162,849,08!
TOTAL (All Commodities) $495,992,669 $314,061,601
Export Performance
1997 1998 1999 2000 200$'000 $'000 $'000 $'000 $•00
ALBERTA $39,033 $40,029 $26,296 $31,322 $23,77
CANADA $414,452 $903,098 $464,250 $495,993 $314,06
- 92 -

International Trade Review
Taiwan
Exports from Alberta
Capital
Official LanguagePopulation (Jul '00 est.)
Currency
TWD$/US$GDP/Capita ('99 est.)
Imports (2000)
Major Suppliers
Taipei
Mandarin Chinese
22,370,461
New Taiwan Dollar (TWD)33.082 (2001) 31.395 (2000)
$ 17,400 (US)
$ 140.1 Billion (US)
Japan, US, Europe
Canada Alberta AlbertaHS Code Commodity Description 2001 2000 2001
290531 Ethylene glycol (ethanediol) $55,382,781 $48,481,813 $33,688,557410121 Bovine hides, whole, fresh or wet-salted $40,439,946 $18,133,980 $26,891,032851719 Line telephony electrical apparatus, nes $26,214,863 $20,134,240 $26,188,561470321 Chemical wood pulp, coniferous $69,893,576 $17,786,491 $18,110,401851790 Parts of electrical apparatus for line telephone or line telegraphy $27,534,966 $9,430,436 $17,032,338470500 Semi-chemical wood pulp $37,412,527 $31,235,077 $11,534,783020220 Bovine cuts bone in, frozen $10,360,285 $5,778,760 $8,863,870851730 Telephonic or telegraphic switching apparatus $6,564,789 $5,149,229 $6,531,309270112 Bituminous coal $61,906,539 $6,351,225 $5,466,623390190 Polymers of ethylene nes, in primary forms $5,626,438 $2,000,935 $5,450,040230110 Flours, meals & pellets of meat or meat offal unfit for human consumption $5,630,733 $3,761,110 $3,851,771750210 Nickel unwrought, not alloyed $57,032,452 $435,650 $3,606,632470329 Chemical wood pulp, non-coniferous $3,022,262 $4,257,919 $3,022,262390110 Polyethylene having a specific gravity of less than 0.94 $2,805,801 $7,831,894 $2,757,521280300 Carbon (carbon blacks and other forms of carbon, nes) $2,852,859 $1,753,373 $2,647,896
TOTAL (Commodities Listed Above) $412,680,817 $182,522,162 $175,643,596TOTAL (All Commodities) $965,293,727 $235,541,291 $210,982,400
Exports from CanadaCanada Canada
HS Code Commodity Description 2000 2001
470321 Chemical wood pulp, coniferous $91,442,082 $69,893,576270112 Bituminous coal $65,858,461 $61,906,539750210 Nickel unwrought, not alloyed $51,799,852 $57,032,452290531 Ethylene glycol (ethanediol) $68,180,994 $55,382,781470200 Chemical wood pulp, dissolving grades $29,038,853 $46,285,114310420 Potassium chloride, in packages weighing more than 10 kg $35,210,832 $46,035,560410121 Bovine hides, whole, fresh or wet-salted $31,147,223 $40,439,946470500 Semi-chemical wood pulp $76,176,765 $37,412,527440710 Lumber, coniferous (softwood) 6 mm and thicker $45,231,816 $33,607,092260112 Iron ores and concentrates, other than roasted iron pyrites, agglomerated $10,819,774 $31,410,748
TOTAL (Commodities Listed Above) $504,906,652 $479,406,335TOTAL (All Commodities) $1,116,994,973 $965,293,727
Export Performance1997 1998 1999 2000 2001$'000 $'000 $'000 $'000 $'000
ALBERTA $278,200 $210,286 $234,082 $235,541 $210,982CANADA $1,575,737 $1,126,997 $1,087,456 1,116,995 $965,294
-93-

International Trade Review
ThailandIII Wl 1 1 W4 I I \A
Capital: BangkokOfficial Language: Thai
Population (Jul '00 est.): 61,797,751
Currency: Baht (THB)THB/US$: 37.349 (Jan 00) 37.844 (2000)
ijUr/uapita ( yy est.). $ 6,700 (US)
Imports (2000): $ 61.8 Billion (US)
Major Suppliers: Japan, US, Singapore, China,
Malaysia
Exoorts from AlbertaCanada Alberta Alberta
HS Code Commodity Description 2001 2000 2001
100190 Wheat nes and meslin $52,613,968 $11,067,673 $19,090,180
410122 Butts and bends, bovine animals, fresh or wet-salted $7,325,469
290531 Ethylene glycol (ethanediol) $4,351,584 $8,671,063 $4,351,584
470321 Chemical wood pulp, coniferous $51,157,535 $6,189,175 $3,325,791
050690 Powders and waste of bones and horn-cores, nes $2,904,751 $308,719 $2,904,751
410121 Bovine hides, whole, fresh or wet-salted $2,966,597 $4,691,456 $2,644,136
852510 Transmission apparatus for radio-telephony radio-broadcasting ortelevision $11,200,131 $0 $2,058,969
550200 Artificial filament tow $1,914,921 $1,734,067 $1,914,921
843143 Parts of boring or sinking machinery, whether or not self-propelled $1,316,945 $358,436 $1,203,274
390110 Polyethylene having a specific gravity of less than 0.94 $1,424,707 $2,049,921 $1,006,138
990100 Low value export transactions and confidential commodities $4,000,217 $1,454,593 $952,572
847989 Machines & mechanical appliances nes, having individual functions $1,015,940 $78,626 $814,387
390190 Polymers of ethylene nes, in primary forms $484,460 $433,704 $433,464
230110 Flours, meals & pellets of meat or meat offal unfit for human consumption $730,783 $0 $413,759
280300 Carbon (carbon blacks and other forms of carbon, nes) $411,162 $351,297 $411,162
TOTAL (Commodities Listed Above) $143,819,170 $37,388,730 $48,850,557
TOTAL (All Commodities) $372,61 1 ,322 $41,963,720 $52,213,721
Exoorts from CanadaCanada Canada
HS Code Commodity Description 2000 2001
100190 Wheat nes and meslin $31,414,980 $52,613,968
470321 Chemical wood pulp, coniferous $86,679,448 $51,157,535
310420 Potassium chloride, in packages weighing more than 10 kg $29,626,197 $33,875,473
290315 Ethylene dichloride $13,587,657 $17,469,774
252400 Asbestos $23,268,715 $16,575,493
030614 Shrimps and crabs, including in the shell, frozen $5,449,629 $12,006,958
852510 Transmission apparatus for radio-telephony radio-broadcasting or television $453,545 $11,200,131
750210 Nickel unwrought, not alloyed $11,388,631 $11,182,708
030614 Crabs, including in the shell, frozen $17,110,341 $11,058,598
040210 Milk powder not exceeding 1 .5% fat $724,447 $7,608,841
TOTAL (Commodities Listed Above) $291,703,590 $224,749,479
TOTAL (All Commodities) $352,108,836 $372,611,322
Exnort Pprforman^pL_SVIJVSI 11 Vl 1 Wl IIIQIIwC
4QQ7 4QQQ A QQQlyy* nyyo iyyy 2000 2001
$'000 $'000 $'000 $'000 $'000
ALBERTA $65,836 $46,753 $22,076 $41,964 $52,214
CANADA $446,738 $299,589 $292,502 $352,109 $372,611
-94-

International Trade Review
Tunisia
Exports from Alberta
Capital
Official LanguagePopulation (Jul '00 est.)
Currency
TND/USSGDP/Capita ('99 est.)
Imports (2000)
Major Suppliers
Tunis
Arabic, French
9,705,102
Tunisian Dinar (TND)
1.3753 (Jan 2001), 1.4667 (2000)
$ 6,500 (US)
$ 8.4 Billion (US)
France, Germany, Italy, Belgium
Canada Alberta Alberta
HS Code Commodity Description 2001 2000 2001
100110 Durum wheat $41,173,617 $0 $8,843,970
843143 Parts of boring or sinking machinery, whether or not self-propelled $3,395,287 $19,917 $3,247,569
841480 Air or gas compressors, hoods $1,108,450 $0 $1,108,450
842199 Parts for filtering or purifying machinery and apparatus for liquids or gases $839,061 $0 $839,061
847990 Parts of machines & mechanical appliances nes, having individual functions $RfiQ 4fiQ $95 19"? $668 825
847989 Machines & mechanical appliances nes, having individual functions $958,108 $20,780 $574,065
842139 Filtering & purifying machinery & apparatus for gases nes. $217,797 $0 $217,797
841990 Parts of machinery, plant and equipment of heading No 84.19 $208,665 $456,167 $208,665
841989 Machinery, plant or laboratory equipment for treatment of material by A temp $186,355 $0 $186,355
841360 Rotary positive displacement pumps nes. $179,865 $0 $179,865
940290 Medical, dental, surgical, veterinarian furniture and parts nes $100,000 $0 $100,000
848180 Taps, cocks, valves and similar appliances, nes $78,348 $82,658 $78,348
843149 Parts of cranes, work-trucks, shovels, and other construction machinery $193,245 $48,162 $55,283
100190 Wheat nes and meslin $153,581 $0 $54,127
990100 Low value export transactions and confidential commodities $456,671 $19,748 $47,413
TOTAL (Commodities Listed Above) $50,138,519 $742,625 $16,409,793
TOTAL (All Commodities) $62,336,976 $2,067,800 $16,523,331
Exports from Canadauanaua
HS Code Commodity Description 2000 2001
100110 Durum wheat $0 $41,173,617
843143 Parts of boring or sinking machinery, whether or not self-propelled $104,062 $3,395,287
480100 Newsprint, in rolls or sheets $0 $1,695,335
841480 Air or gas compressors, hoods $0 $1,108,450
842920 Graders and levelers, self-propelled. $772,402 $993,751
630900 Worn clothing and other worn articles. $609,110 $981,980
847989 Machines & mechanical appliances nes, having individual functions $139,456 $958,108
382490 Chemical products, prepared & residual products of the industry $11,066 $895,334
847990 Parts of machines & mechanical appliances nes, having individual functions $163,381 $889,469
842199 Parts for filtering or purifying machinery and apparatus for liquids or gases $0 $839,061
TOTAL (Commodities Listed Above) $1,799,477 $52,930,392
TOTAL (All Commodities) $13,910,275 $62,336,976
Export Performance1997 1998 1999 2000 2001$'000 $'000 $'000 $'000 $'000
ALBERTA $32,636 $13,399 $3,959 $2,068 $16,523
CANADA $84,783 $37,867 $70,944 $13,910 $62,337
-95-

International Trade Revie
United Arab EmiratesCapital: Abu Dhabi
Official Language: Arabic
Population (Jul '00 est.): 2,407,460
Currency: Emirati Dirham (AED)AED/US$: 3.6725(Fixed)
GDP/Capita ('99 est.): $ 22,800 (US)
Imports (2000): $ 34.0 Billion (US)
Major Suppliers: US, Japan, UK, Italy, Germany
Exports from AlbertaCanada Alberta Albert.
HS Code Commodity Description 2001 onnn2000 2001
100190 Wheat nes and meslin $42,792,736 $24,141,153 $15,076,04(
841290 Parts of hydraulic & pneumatic & other power engines and motors $7,262,341 $4,429,689 $7,262,34'
843143 Parts of boring or sinking machinery, whether or not self-propelled $3,254,980 $1,905,156 $3,237,63'
851719 Line telephony electrical apparatus, nes $2,984,216 $1,859,203 $2,953,56;
847989 Machines & mechanical appliances nes, having individual functions $7,247,249 fl* <\ acc cno C"o A *5 r\ ~7C r$^,4,30,76*
901580 Surveying, hydrographic, oceanographic, meteorological or geophysical instr. $1 ,602,041 Ci coo CM c$ i ,ooo,y 1
1
851790 Parts of electrical apparatus for line telephone or line telegraphy $1,933,829 $579,590 $1,569,44/
851730 Telephonic or telegraphic switching apparatus $1,249,649 $321,611 $1,234,645
903289 Automatic regulating or controlling instruments and apparatus, nes $1,508,643 $1,496,783 $1 ,183,86;
852990 Parts suitable for use with the appliances of headings 85.25 $1,470,198 $13,307 $1,180,515
902710 Gas or smoke analysis apparatus $853,475 $1,549,315 $816,801
847990 Parts of machines & mechanical appliances nes, having individual functions $3,814,748 $2,144,501 $743,996
843041 Boring or sinking machinery, self-propelled $11,384,745 $947,632 $732,00$
852520 Transmission apparatus, for radio-telephony incorp. reception apparatus $1,466,016 $0 $685,817
846595 Drill mortising machinery for working wood, cork, bone, etc. $625,242 $58,700 $625,24;
TOTAL (Commodities Listed Above) $89,450,108 $40,912,333 $41,316,602
TOTAL (All Commodities) $192,700,678 $56,717,159 $46,988,245
Exports from CanadaCanada Canadc
HS Code Commodity Description 2000 2001
100190 Wheat nes and meslin $53,438,230 $42,792,73(
843041 Boring or sinking machinery, self-propelled nes $960,409 $11,384,74J
710812 Gold, non-monetary, unwrought, nes $0 $9,364,21S
841290 Parts of hydraulic & pneumatic & other power engines and motors $4,430,607 $7,262,34'
847989 Machines & mechanical appliances nes, having individual functionsit* a r\r~ f-i a r\
$1 ,953,160 $7,247,245
440799 Lumber, non-coniferous, nes $3,629,837 $4,015,265
847990 Parts of machines & mechanical appliances nes, having individual functions $2,676,053 $3,814,74*
990100 Low value export transactions and confidential commodities $3,680,674 $3,735,56(
870324 Automobiles with reciprocating piston engine displacing > 3000 cc $1,875,672 $3,430,94*
843143 Parts of boring or sinking machinery, whether or not self-propelled $1,905,156 $3,254, 98(
TOTAL (Commodities Listed Above) $74,549,798 $96,302,791TOTAL (All Commodities) $213,053,649 $192,700,678
Export Performance1997 1998 1999 2000 2001
$'000 $'000 $'000 $'000 $'00C
ALBERTA $49,631 $69,366 $35,423 $56,717 $46,98£
CANADA $254,083 $284,110 $162,754 $213,054 $192,701
-96-

International Trade Review
United Kingdom
Exports from Alberta
Capital
Official LanguagePopulation (Jul '00 est.)
Currency
GBP£/US$GDP/Capita ('99 est.)
Imports (2000)
Major Suppliers
LondonEnglish
59,647,790
British Pound (GBP£)0.6764(Jan 01 ) 0.6596(2000)
$22,800 (US)
$ 324.0 Billion (US)
EU, US, Japan
Canada Alberta Alberta
HS Code Commodity Description 2001 2000 2001
750210 Nickel unwrought, not alloyed $36,580,861 $20,128,313 $33,361,336100190 Wheat nes and meslin $76,259,889 $29,614,249 $27,627,014270112 Bituminous coal $71,761,150 $14,382,246 $15,632,293841290 Parts of hydraulic & pneumatic & other power engines and motors, nes $8,201,257 $4,906,499 $7,479,092851790 Parts of electrical apparatus for line telephone or line telegraphy $187,234,944 <C1 O ARQ A^O
470500 Semi-chemical wood pulp $14,606,192 S?2 977 4fi9 C4 QOfi ?QA
902710 Gas or smoke analysis apparatus $4,876,450 $1 598 880 $4 460 859990100 Low value export transactions and confidential commodities $62,908,943 S3 347 Q38 $4 453 979843139 Parts of lifting, handling, loading or unloading machinery, nes $5,487,878 $1 272 107 S4 267 888
843143 Parts of boring or sinking machinery, whether or not self-propelled $5,160,101 $1 ^7Q fiQ^i •S3 877 Q18
851730 Telephonic or telegraphic switching apparatus $5,561,790 S3 890 3^8
902130 Artificial parts of the body, nes $3,229,694 $4 368 289750400 Powders and flakes, nickel $3,214,352 S9 fi?Q 871 V\ 912 SR9
901580 Surveying, hydrographic, oceanographic, meteorological or geophysical instr. $8,444,321 *K1 ^94 7fi4 *m 907 071
848180 Taps, cocks, valves and similar appliances, nes $20,164,906 $1,084,927 $2,475,998
TOTAL (Commodities Listed Above) $513,692,728 $125 790 002 $128 230 698TOTAL (All Commodities) $4,700,309,127 $198,325,276 $176,279,781
Exports from CanadaCanada Canada
HS Code Commodity Description 7nnn
847330 Parts and accessories of automatic data processing machines $279,925,643 $347,553,274750120 Nickel oxide sinters and other intermediate products of nickel metallurgy $387,512,423 $284,774,998480100 Newsprint, in rolls or sheets $194,896,395 $250,516,797880240 Aircraft nes of an unladen weight > 15,000 kg $87,846,135 $234,757,101261690 Precious metal ores and concentrates, nes $174,639,712 $205,893,741710210 Diamonds, unsorted $182,747,107 $187,621,773851790 Parts of electrical apparatus for line telephone or line telegraphy $596,934,432 $187,234,944710812 Gold, non-monetary, unwrought, nes $781,337 $174,543,462470321 Chemical wood pulp, coniferous $219,669,702 $160,402,177880230 Aircraft nes of an unladen weight > 2,000 kg but not exceeding 15,000 kg $227,332,273 $157,625,907
TOTAL (Commodities Listed Above) $2,352,285,159 $2,190,924,174TOTAL (All Commodities) $5,398,645,094 $4,700,309,127
Export Performance
1997 1998 1999 2000 2001$'000 $'000 $'000 $'000 $'000
ALBERTACANADA
$165,767
$3,641,208
$230,790
$4,156,321
$179,394
$4,484,217
$198,325
$5,398,645
$176,280
$4,700,309
-97-

International Trade Review
United StatesCapital: Washington D.C.
Official Language: English
Population (Jul '00 est.): 278,058,881
Currency: United States Dollar (US$)
Cdn$/US$: 1.5032 (Jan 01) 1.4851 (2000)
GDP/Capita ('98 est.): $ 36,200 (US)
Imports (2000): $ 1.223 Trillion (US)Mainr SiinnliprQ'i v i ciJ ui oupfjnci o. Canada, Japan, Mexico, China
Exports from AlbertaAlberta Alberta
HS Code Commodity Description 2000 2001
271121 Natural gas in gaseous state $25,510,061,249 $17,135,916,417 $21,638,240,574
270900 Petroleum oils and oils obtained from bituminous minerals, crude $16,116,213,264 $14,878,764,823 $12,612,249,677
271112 Propane, liquefied $1,828,340,068 $793,771,431 $1,141,379,241
852520 Transmission apparatus, for radio-telephony incorp. reception apparatus $1,320,693,978 $1,767,396,454 $1,076,452,033
020130 Bovine, cuts boneless, fresh or chilled $1,232,481,950 $793,521,896 $968,046,537
010290 Bovine, live, except pure-bred breeding $1,646,324,918 $51 1 ,/o4,1 97 $712,557,838
440710 Lumber, coniferous (softwood) thickness > 6mm $9,176,933,911 $£1 ^ 9^7 l"IR7
990100 Low value export transactions and confidential commodities $6,033,108,470 $556,886,589 $561,845,440
390120 Polyethylene having a specific gravity of 0.94 or more $1,236,545,986 $107,626,076 $506,329,956
290919 Acyclic ethers excluding diethyl ethers, nes $508,818,270 $395,727,939 $482,274,678
470321 Chemical wood pulp, coniferousIT**"* AAA A Ci A *"*» /"""I
$2,414,484,263 $554,672,262 $468,451,110
271000 Petroleum oils other than crude *J1R 7 R7A 74ft $655,148,109 $467,383,280
290250 Styrene $79^ 749 $464,516,267 $461,567,140
851730 Telephonic or telegraphic switching apparatus tpOZo, / OO.OUO $1,433,272,389 $423,122,808
441011 Waferboard, including oriented strand board <M £99 ftftQ *59n $371,516,504 $330,082,841
TOTAL (Commodities Listed Above) $76,214,049,731 $41,033,738,420 $42,480,882,657
TOTAL (All Commodities) $325,034,269,887 $48,731,980,592 $50,565,744,347
Exports from CanadaCanada Canada
HS Code Commodity Description 2000 2001
870324 Automobiles with reciprocating piston engine displacing > 3000 cc <C/t 1 770 99Q RQ'Z <£Af. 9-lf) QA/1 QA7
271121 Natural gas in gaseous state $20,554,121,017 $25,510,061,249
270900 Petroleum oils and oils obtained from bituminous minerals, crude $19,307,352,043 $16,116,213,264
870431 Gas powered trucks with a GVW not exceeding five tonnes $12,415,971,252 $12,360,033,660
440710 Lumber, coniferous (softwood) thickness > 6mm $9,214,819,701 $9,176,933,91
1
870323 Automobiles with reciprocating piston engine displacing > 1500 cc to 3000 cc $8,546,398,161 $7,044,190,135
271000 Petroleum oils other than crude $5,504,483,512 $6,317,674,748
990100 Low value export transactions and confidential commodities $6,111,804,496 $6,033,108,470
480100 Newsprint, in rolls or sheets $5,619,727,797 $5,516,152,185
870899 Motor vehicle parts, nes $5,274,850,053 $5,290,901,532
TOTAL (Commodities Listed Above) $134,319,751,625 $133,576,234,101
TOTAL (All Commodities) $334,145,754,835 $325,034,269,887
Export Performance1997 1998 1999 2000 2001
$'000 $'000 $'000 $'000 $'000
ALBERTA $26,946,019 $25,280,548 $29,074,340 $48,731,981 $50,565,744
CANADA $228,077,903 $251,097,183 $286,561,256 $334,145,755 $325,034,270
-98-

International Trade Review
Venezuela
Exports from Alberta
Capital
Official LanguagePopulation (Jul '00 est.)
Currency
VEB/USSGDP/Capita ('99 est.)
Imports (1998)
Major Suppliers
Caracas
Spanish
23,916,810
Bolivar (VEB)
699.700 (Jan 01)679.960 (2000)
$ 6,200 (US)
$ 14.7 Billion (US)
US, Japan, Columbia, Italy
Canada Alberta Alberta|_|C P«Hdno uoue ZUU I
9nnnzuuu 9nmZUU I
100190 Wheat nes and meslin $111,493,867 $34,472,833 $39,282,831
100110 Durum wheat $97,059,643 $17,084,082 $20,844,303
847990 Parts of machines & mechanical appliances nes, having individual functions Co ceo ono C19 OOP 07C CP HQO fifln
841391 Parts of pumps for liquid whether or not fitted with a measuring device $7 TITS Q74 <J , J , £- U -3 $7 SOft ftS44> /,JUU,U <_^t
843143 Parts of boring or sinking machinery, whether or not self-propelled $11,938,132 $3,879,058 $6,460,390841290 Parts of hydraulic & pneumatic & other power engines and motors $5,423,704 $3,383,787 $5,423,704
843049 Boring or sinking machinery, not self-propelled nes $4,314,011 $1,663,717 $4,314,011
847989 Machines & mechanical appliances nes, having individual functions $3,056,261 $5,300,583 $2,376,688843041 Boring or sinking machinery, self-propelled nes $17,548,106 $434,019 $2,279,336
843141 Buckets, shovels, grabs & grips for derricks etc. $2,263,845 $0 $2,263,845841381 Other pumps for liquids, nes $4,031,647 $1,512,117 $1,391,038
110312 Oat groats and meal $1,305,609 $986,720 $1,289,329
732690 Articles of iron or steel, nes $1,194,162 $1,662,337 $1,178,221
841490 Air/gas pump, compressor & fan parts nes. $1,004,311 $0 $1,004,311
200410 Potatoes prepared or preserved other than by vinegar or acetic acid, frozen $6,544,875 $130,117 $923,227
TOTAL (Commodities Listed Above) $283,446,955 $88,641,934 $104,632,768TOTAL (All Commodities) $558,916,448 $110,590,807 $116,869,589
Exports from CanadaCanada Canada
HS Code Commodity Description 1AAA2000 2001
100190 Wheat nes and meslin $97,840,919 $111 ,493,867
100110 Durum wheat $79,548,908 $97,059,643480100 Newsprint, in rolls or sheets $46,103,846 $67,299,791
870829 Parts and accessories of bodies nes for motor vehicles $18,456,593 $63,182,193843041 Boring or sinking machinery, self-propelled nes $434,019 $17,548,106843143 Parts of boring or sinking machinery, whether or not self-propelled $3,904,662 $11,938,132470321 Chemical wood pulp, coniferous $15,599,218 $11,697,645841199 Gas turbine parts nes $1,084,582 $10,910,371
847990 Parts of machines & mechanical appliances nes, having individual functions $12,306,635 $8,562,808851790 Parts of electrical apparatus for line telephone or line telegraphy $8,162,612 $8,323,360
TOTAL (Commodities Listed Above) $283,441,494 $408,015,916TOTAL (All Commodities) $500,894,675 $558,916,448
Export Performance1997 1998 1999 2000 2001$'000 $'000 $'000 $'000 $'000
ALBERTA $50,297 $52,787 $59,643 $110,591 $116,870CANADA $508,209 $434,684 $401,413 $500,895 $558,916
-99-

International Trade RevieM
Yoman Doni ihlir' ofT t?iiit?i i, r\t?puuiiu uiCapital: Sanaa
Official Language: Arabic
Population (Jul '00 est.): 18,078,035
Currency: Yemeni Rial (YER)YER/US$: 164.590 (Jan 01 )
160.683(2000)
GDP/Capita ('99 est.): $ 820 (US)
Imports (2000): $ 2.7 Billion (US)
Major Suppliers: Saudi Arabia, UAE, US, France, Italy,
L.A|JUI IO II U III MIUCI luCanada Alberta Alberta
HS Code Commodity Description 2001 2000 2001
ft4*314'} Parte nf hnrinn nr cinkinn manhinpn/ whpthpr or nnt ^plf-nrnnpllpn" ^IQ fi41 $342,835 $19,535,64184*3041 Rnrinn nr cinkinn marhinprv <?plf-nrnnplipd np^ £2 230 S15OtJUM 1 DUIMIU UI olllrMliy llla^l UNCI y , oUM piU^JCIIUU 1 ICO iyL,^Uu, J 1 $3,473,637 $2,292,244
100190 Wheat nps and meslin S3 964 671 $0 $1,396,809
847990 Parts nf marhinps & mprhanical aDDliances nes havina individual functions £664 014 $823,361 $664,014RTO'ilO Mnhilp rranps $535 150U / UJ 1 U IVIUUIIC UI dl ICO , 1 \J\J $1,679,109 $535,150R70ftQQ Parte anH appp^^nrip^ nf mntnr vphinlp^ np^ *R4fifiO / \jo c/ j rdl Lo d I iu dbuCooui ICo u I 1 1 iului vci nuico i ico iirtuu,tu^ icq non C/ict; one
841370 Centrifuaal DumDS nes $463 531(J~T 1 ^1 \J \ 'C 1 III IIUUQI uUII IUO 1 l&O N* V> . *J $2,008 $350,266ft41QQ0 Parts nf marhinprv nlant anH pnninmpnt nf hppdinn Nn 84 1Q T1916 QfiftQ4 I zj j\J rdl la UI lllalrllllldy, plain dliu GlfUipilldtl ui I icauii i^ mu . I 41^. iu,%/uu $0 $216,968847Q8Q. Marhinps & mprhaniral annlianrps nps havinn individual functions $231 609u*t / JUD IVIaLflllllco cx 1 1 ICUI Iai 1 i\sQ 1 yj yji la 1 toco lico, liavili^ |[ iui viuuai 1 ui ii^viui 10 41^- o 1 ,uuj $2,388,083 $207,421
990100 Low value export transactions and confidsntial commodities $165,269 $79,380 $81,733
842121 Water filtering or purifying machinery or apparatus $53,913 $0 $53,913
848340 Gears; ball or roller screws; gear boxes etc. $92,746 $3,817 $38,336
870590 Special purpose vehicles nes $37,879 $282,902 $37,879
901580 Surveying, hydrographic, oceanographic, meteorological or geophysical instr. $28,200 $7,532 $28,200
9021 30 Artificial parts of the body, nes $21 ,828 $0 $21,828
TOTAL (Commodities Listed Above) $28,808,139 $9,085,684 $25,926,307
TOTAL (All Commodities) $34,858,453 $15,418,002 $25,932,890
FynnrtQ from f!anflHaCanada Canada
HS Code Commodity Description 2000 2001
ft43143 Parte nf hnrinn nr cinkinn manhinprv whpthpr nr nnt ^plf-nrnnpllpriLrtJ 1 *tU 1 a 1 lo UI UUIIIIU UI Oil 1 Mi IU II laul III ICI y, W 1 IC LI ICI UI IIUL OCII [Jl U|JCIICU $18,240,348 $19,535,6411finiQn Whpat np<i anH mp^liniuu \ vvncai i ico di iu 1 1 icoiii i $0 $3,964,67184*3041 Rnrinn nr Qinkinn maphinprv ^plf-nrnnpllpH np<?utvju^ i Lj\ji iiiu ui oiiirviiiu 1 1 iaui in ici y i
ocn ui uucucu i ico $3,486,055 $2,330,5154ft0^10 Panpr flutinn ^rnrrunatinn mpriium^ in rnll^ ^pmi-nhprniral iinrnatpfi" i—f \ \j i opci , 1 1 u li 1 1 y ^uui i uyd l 1 1 j y iiicuiuiiiy, 1 1 1 i xj\ io , oc 1 1 1 1 umcii nua i , ui iuua icu $491,292 $1,597,9224fi0411 Panpr kraftlinpr in mil*; unhlpaphpH imnnatpriiuui i i r dpci
,rviaiLiiiici, hi iuiio, ui luicd^i icu, ui luua icu $461,550 $871,274
490700 Unused postage, check forms, banknotes, stock etc.
847990 Parts of machines & mechanical appliances nes, having individual functions $823,361 $664,014
841 1 99 Gas turbine parts nes $0 $606,756
870510 Mobile cranes $1,679,108 $535,150
870899 Parts and accessories of motor vehicles nes $3,024 $466,205
TOTAL (Commodities Listed Above) $7,309,597 $31,312,702
TOTAL (All Commodities) $18,240,348 $34,858,453
Export Performance1997 1998 1999 2000 2001
$'000 $'000 $'000 $'000 $'000
ALBERTA $1,726 $2,093 $2,824 $15,418 $25,933CANADA $9,813 $5,952 $24,360 $18,240 $34,822
- 100-

Alberta
International
Trade Review2001
Appendices
- 101 -

International Trade Revie\
- 102 -

International Trade Review
Appendix A North American Industrial Classification System (NAICS)
Codes included in Industry Groupings
NAICSAED Export Industry Groupings Code NAICS Industries
Agriculture
Livestock 112 Animal Production
1152 Support Activities for Animal Production
Crops 111 Crop Production
Primary Forestry, Fishing and Trapping
113 Forestry & Logging
114 Fishing, Hunting and Trapping
Mining & EnergyCrude Oil 211 Oil & Gas Extraction
Natural Gas & Natural Gas Liquids 211 Oil & Gas Extraction
Sulphur 211 Oil & Gas Extraction
Coal 21211 Coal Mining
Other Mining 212 Mining (except Oil & Gas)
Electricity 22111 Electric Power Generation
Manufacturing
Food, Feed & Beverages 311 Food Manufacturing
312 Beverage & Tobacco Product Manufacturing
Plastics 326 Plastics & Rubber Products Manufacturing
Wood Products 321 Wood Product Manufacturing
Furniture & Allied Products 337 Furniture & Related Product Manufacturing
Paper Products & Wood Pulp 322 Paper Manufacturing
Primary Metal Products 331 Primary Metal Manufacturing
Fabricated Metal Products 332 Fabricated Metal Product Manufacturing
Machinery 333 Machinery Manufacturing
Transportation Equipment 336 Transportation Equipment Manufacturing
Computer & Electronic Products 334 Computer/Electronic Product Manufacturing
Electrical Equipment, Appliances & 335 Electrical Equipment, Appliance &Components Component Manufacturing
Non-Metallic Mineral Products 327 Non-Metallic Mineral Product Manufacturing
Refined Petroleum & Coal Products 324 Petroleum & Coal Products Manufacturing
Chemicals 325 Chemical Manufacturing
Other Manufacturing 313 Textile Mills
314 Textile Product Mills
315 Clothinq Manufacturing
316 Leather & Allied Product Manufacturing
323 Printinq & Related Support Activities
339 Miscellaneous Manufacturinq2Other Exports 41511 New/Used Automob./Light Truck Wholesaler
41512 Truck, Truck Tractor & Bus Wholesaler
418 Recyclable Material Wholesaler-Distributors
45331 Used Merchandise Stores
45399 All Other Miscellaneous Store Retailers
51113 Book Publishers
51121 Software Publishers
71151 Independent Artists, Writers & Performers
81292 Photo Finishing Services
Note: Exports not manufactured in Alberta, e.g. medium/large aircraft, were re-allocated to Other Exports
- 103-

International Trade Review
Appendix B: Commodity Export Summary by Country, 1996 - 2001
ALBERTA CANADAPanic KanK
1997 1998 1999 2000 2001 of 1997 1998 1999 2000 2001 of/—v 1 IMTDV1>UUN 1 KT $'000 S'000 $'000 $'000 $'000 175 $'000 $'000 $'000 $'000 $'000 219
Afahanistan 1,386 3 3 39 144 5,238 81 791 160 156 195
AlhaniarAIUdl Md 1,273 394 113 n/a 1,204 3,403 2,254 2,323 2,481 150
A Irion aMiytJi id 104,942 99,969 78,373 84,266 56,847 26 622,029 576,459 476,564 489,910 290,891 35
American Samoa 3 172 3 658 932 990 171
Angola o 2,374 175 642 292 121 11,601 9,328 6,625 6,886 4,500 127
Anguilla HOJ n o 2,121 86 867 1 ,007 UJ 1 144
Antarcticanu u Z. I jo o,yo i u o nil U O 1 A A 1 EiA
\ 04
Antigua-Barbuda 3,164 1,082 110 178 46 142 8,805 7,712 1 1,055 10,213 10,382 106
Argentina 42,978 20,248 29,427 63,757 17,569 47 353,557 299,690 198,985 238,737 126,592 50
Armenia 13 n/a 2,379 1 ,091 1,735 1,873 1,763 160
Aruba 54 110 132 3,487 8,096 5,783 2,747 147
Australia 117,376 72,780 98,845 11 6,658 61,453 23 948,933 950,448 928,305 1,134,127 954,402 14
Austria 31,355 29,868 29,951 23,913 10,643 55 293,820 259,881 198,881 344,931 298,188 33
Azerbaijan 10 1,917 864 825 385 115 1,714 10,180 2,060 3,700 2,890 141
Bahamas 235 78 1,096 2,604 392 1 14 20,773 23,793 24,768 27,046 27,414 80
Bahrain 1,753 1,236 2,065 2,467 5,323 69 10,677 9,178 12,552 13,846 13,113 100
Bangladesh 25,224 46,127 56,177 43,951 41,002 32 95,438 128,213 160,767 128,240 130,897 49
Barbados 2,301 789 478 2,044 875 105 34,864 34,305 38,056 32,129 29,109 78
Belarus 163 n/a 1,211 1,295 1,102 1,849 2,776 146
Belgium 111,589 111,880 112,930 153,204 119,392 10 1 ,463,414 1,463,776 1,838,074 2,093,963 1,835,714 9
Belize 55 133 96 136 9,684 3,698 2,850 2,473 3,496 135
Benin 8,741 199 106 25 n/a 11,372 1,898 2,253 2,786 7,328 117
Bermuda 319 314 143 695 932 103 36,477 37,526 40,144 32,108 34,669 73
Bhutan UnU U U U n/a U U
riU U DOi yo
Bolivia 6,096 3,341 4,988 4,895 5,548 67 30,81
7
16,216 14,718 15,909 10,640 105
Bosnia'Herzeg. 985 189 2,797 7 170 4,217 3,371 1,673 6.825 1,298 167
Botswana 52 1,350 318 739 23 159 34,712 12,695 2,672 21,806 1,840 157
Bouvet Island 177 3 173 177 366 36 3 41 207
Rr Indian O Tpr1_JI . 1 1 IU to II W 1 CI 61 n/a 184 25 37 5 219
Rr Virnin InlandsI—i I. v 1 1 y ii i loiai iuo 99 38 24 39 143 3,393 2,529 28,631 60,005 2,230 152
Brazil 157,442 129,629 108,582 118,444 93,693 16 1,554,825 1,255,375 987,701 968,540 874,264 16
Brunei352 189 69 246 170 125 2,914 2,350 2,978 677 857 173
DarussalamBulgaria 9 19 161 8,843 7,590 14,343 8,181 20,537 86
Burkina Faso 9 n/a 1,401 2,406 2,813 3,066 5,345 124
Burundi 13 23 158 64 108 174 1,076 492 182
Cote-d'lvoire 597 1,671 639 2,870 1,714 89 7,496 12,021 11,715 1 1,817 16,300 92
Cambodia 49 217 n/a 1,934 666 2,210 8,997 1,330 165
Cameroon 5,444 4,817 5,762 9,074 58 3,723 17,588 13,017 16,414 30,099 76
Cape Verde n/a 710 354 13 110 57 202
Cayman Islands 166 90 139 127 13,459 1 1,396 7,388 7,344 63,858 61
Central Afr. Rep. n/a 261 17 489 3 276 187
Chad 184 2,680 83 275 121 381 291 3,053 140
Chile 54,531 32,561 76,699 115,719 61,586 22 379,291 329,183 351,901 433,805 353,336 24
China, P. Rep. 435,124 482,021 558,502 771,422 886,476 3 2,355,275 2,476,993 2,519,116 3,266,062 3,919,854 4
Cocos Islands n/a 42 35 2 218
Colombia 57,477 53,167 32,077 44,057 64,937 21 431,357 436,626 243,330 298,004 340,266 27
Comoros n/a 83 27 33 49 207 191
Congo 353 54 15 158 769 108 3,445 4,123 4,036 4,010 8,144 113
Congo, Dem. Rep. 11 30 151 7,683 6,919 5,732 4,712 5,047 126
Cook Islands 10 166 36 30 197 2 12 214
Costa Rica 12,137 7,745 8,620 11,205 2,124 85 73,151 47,600 67,773 84,789 60,456 63
Croatia 223 251 6,343 141 3,168 77 11,093 12,409 51,973 41,814 11,952 102
Cuba 66,620 83,996 49,326 55,383 57,916 24 323,364 430,698 353,718 299,369 338,706 28
Cyprus 1,438 4,844 2,644 3,070 4,774 71 15,324 24,400 21,972 13,426 14,993 96
Czech Republic 1,587 1,383 2,160 3,598 1,872 88 67,528 60,611 73,950 62,819 48,137 66
Denmark 9,526 5,569 5,672 6,372 3,757 76 172.393 157,917 257,883 705,438 523,774 20
- 104-

International Trade Review
ALBERTA CANADARank Rank
1 QQ7 1 QQRy y o 1 QQQi yyy zuuu ZUU 1 OT A QQ7 1 QQRi yyo 1 QQQ
i yyy zuuu ZUU I OT
COUNTRY $'000 $'000 $'000 $'000 $'000 175 $'000 $'000 $'000 $'000 $'000 219
Djibouti zu u 7R7f J/ nu 1 n 1 R7I o / 701 IRQJOJ 9 7RQZ, l JJ RA04 9R1ZOO 1 RR
1 OO
Dominica o o 113 o 12 164 1 788 2,905 5,440 4,403 2,671 148
Dominican Rep. 3,084 1,503 5,046 6,100 7,912 67 81 ,658 92,941 106,357 79,459 98,880 55
Ecuador 6,990 37,108 22,527 29,016 37,301 34 85,302 203,171 83,812 99,538 133,302 48
Egypt 6,945 7,333 16,756 16,642 53,312 27 175,824 153,091 183,776 167,679 187,159 44
El Salvador 3,613 2,680 502 1,453 949 102 21,033 33,249 13,491 21,676 22,151 85
Equatorial Guinea o o o o 184 124 o 112 147 2,887 142
Eritrea 16 o o 113 130 307 91 1,207 414 184
Estonia 236 643 o 55 108 133 6,698 5,559 4,107 5,698 6,272 121
Ethiopia 1 ,958 3,848 4,034 1 ,830 2,037 87 10,478 47,538 13,985 10,300 8,660 109
Falkland Islands o nu nu nu nu 97R nu ru JU zz 91
1
Z I I
Faroe Islands o u u nu "}1J 11 Rn1 JU o 74 1 62 9R7zu / 79/ z 1 QQ
i j j
Fiji 1 QQQ o 368 15 o n/a 12,225 2,643 3,894 2,667 2,801 145
Finland 1 g-)2 4 670 3,813 14 5^11 H, JJ 1 14 654 51 225 682 197,153 212 846 9RR 4RT 99? nfiQ 4n*+U
French Polynesia o o o QQR 361 1 1
7
2,864 1 242 12 123 Q 1R7J,JO / Q 9n4 1 nRI UO
France RR R1R 67 697 74 1 R1 114 1 68 mi "391I \J 1 , OZ 1 14 1 607 711 1 Rn4 nnfi 1 77R 9R71,11 J.iU ( 1 Rm 1 1 n
1 ,OU 1 , 1 1 u 9 n^R ni4Z,UJJ,U 1 H 7
French Guiana nu nu nu u n n/
a
ORJO RIoo 9RQzoy RROO RROO 1 QRI jj
French S. Terr. nu nu nu nu n n/a 11j inu 1 7 i4n 9nRzuo 1 on
i yu
Gabon 1 R4QI ,J4J 419•I I Z 1 Ron
I , JJU A7R1 / j yy 1 TRI OJ Q 4R9y ,4oz 4 nR44,UJ4 fi QRT0,JJJ R 9R1J,ZOO 1 QRRo,yoo 1 19
1 OZ
Gambia nu u nu u nu n/a 91
R
Z I J Qn7jU / 9R4Z04 1 RTI JJ R1RJOO 1 7R
I / O
Georgia 2 5 31 146 o n/a 19,500 14.197 9,721 5 605 7 352 1 1 R1 1
J
Germany 171 DAR1 f 0,040 ira n9i
I 04,UZ I I 00,0 I U 1 RR 4R7I JJ,tO / 111 1 7R 1 t
I O 9 R9R 1T9 9 RAT RQ9z,j4o,jyz 9 9R4 nn7Z,ZJ4,UU /q nnQ rato,uuy ,040 9 rqi 9nnz,oy i ,zuu cJ
Ghana 9 639 m 7iRI U . / JO u.JJJ 19 99R 14 RQ1 Rnou RQ 77R R9 n91UZ . U ^ I
R7j / ,
J
jj RR n74JO,U / 4 RR RQ1Oj,jj IRQjj
Gibraltar nu nu u nu n n/a 91RZJJ 9QZJ 1 RQI jj ZOO 9nRZUO 1 Q9
i yz
Greece 9 Q14Z,J04 r nnD,U I O R 1770,0 / / * , I JO 1 9 RR^I Z .000 R9OZ 117 Q7n 1 Rn T1 9
I OU. O I z 1 RQ 77RI Oj, / fj 1R1 79R
I j I , / ZO ZJJ,JJ I1Qoy
Greenland 97Z 1 u 9R1ZO I1 nnI uu 1 RQ9 on r 1 RnO, I JU 4 R99H,OZZ R TQRo,jjJ R 71 70, / u R 91Ro,zoJ 111
Grenada AR40 AAA444 u O /Rnou 1 AH
I 4U 1 1 RRO, I oo A 7AR4, / 40 a Rm4,OUO 0,004 Q 1 ORJ, I ZD 1 10\ oy
Guadeloupe n/a 4,027 n/a
Guam 143 12 80 283 1 1
1
131 3,590 2,535 2,277 1,339 1,411 164
Guatemala 12,625 25,019 28,901 39,850 24,232 43 82,167 138,755 165,492 121,963 1 13,683 52
Guinea 311 234 174 100 134 8,198 13,824 5,161 5,330 6,480 120
Guinea-Bissau n/a 352 180 19 162 67 200
Guyana 441 115 49 3 32 149 10,039 9,703 14,148 7,670 8,068 114
Haiti 483 1,320 1,613 1,189 1,115 95 26,123 24,139 36,492 24,999 26,372 82
Heard &McDonald Islands
n/a 14 3 217
High Seas u nu nu nu n/a nu nu 171 R7 AR40 OHRZUO
Honduras nu 1 1RI OO 9RA 9Q7Zj i jj 14R
I 4J ir mR1 D.JUO 1 7 QR9
i / ,yoz 1 ft ftfiQ 1 A QHA 1>1 AA~71 4,44 /
Q7y 1
Hong Kong 1 n** 1 c.7I UO, I O I
Qfl 9RAyu,zj4 1 HA 7A1I U4, / 40 1 ^r Rnn mn 4Q^
I UU,1*jj 1 RI j 1 RRT IRQ
1 ,OOj,jOj 1 T9R QRQi ,ozj,yoy QR7 0^9 1 ^ft^ IAD 1 HRO flOR
t ,uoz,oyo 11 z
Hungary 9 177 7 7P1/ ,
/ DO 1 97PI0,Z / U 1 9TRI /jj RR9ooz 1 n4
l U4 RR QR1oo,yo IQA m Ry4 ,u i o 00,00 1
Q7 797Ol J £.(00 9>i
n
oo,z4U CDOO
Iceland A7 1 87 Q9AyZ4 1 09^ Q^ljj ImnI uu 1 o 1 97
I O, \ Z.I 14 4RR14,400 90 onft 1 70nI D, / *C\J
111 non , i uy 1 U4
India AC\ 9RQ4u,zoy OA mflz4,ouo cc onnJJ,jUU R71 ^ 1O I4R9 01 740Z,U I / A 1 A A9Q4 I 4,4zy AA& 771 RA 1 HOR R 1 -1 A QOOil ,4oz -1 Q
1
Indonesia 919 1A1£. \ ft,OHO 1 rr 1m 1 flQ 791
i uy , / z i1 1R 4R1 Q9 R1 7yz,o i i
1 7 7R9 74Q/ oz, 1 4y RA1 RnRj4 I ,OUj con ocojoU.ODo DD^,D40 44o,OU4 OOZZ
Iran 90ft DCI RO. 9QQoo,zyy 1 1 r R1
1
I I O,J I I9m t 1
1
1R9 7R"3I OZ, I oo Qy 799 7RA1 ZZ, I 04 9R9 RQQzoz,oyy ^^7 RC-7 DD4,UD /
A Q 1 9*3R40 I ,zo0 01zl
Iraq U u 1 n 991I U.ZZO oo. y i o R R49J,J4Z RROO 1 91A
1 ,Z04 i n^A0,UJ4 n ini00, I U I
7ft no,o. O.UoO •1 001 ZZ
Ireland 1 1 77ftI I , f f O Q 99Ay,zz4 R R1A0,004 R QR9 1 ^ RRR
I J,JUU 4QHJ 9Q4 QR? Ann rqq4UU,Ojj OOzi, oO*t one /19Q 9QH /199 *3ROO
Israel 1 7 ^.fiftI f ,OOo 97 7AQz / , / 4y 1 R A91
I 0,4ZO 14 9ml*+,ZU I1 9 ^"vl R"3oo 9^1 n7nZO I ,u / u 914 n4RZ I 4 ,U4J 97R 014 9QH 9^1*5 01 0,DOU OOzy
Italy 1 c,ft ^.^9 1 7R R9P1 f J, JZO 1 RR 9RA 1 Q9 49Q 1 74 Q^4 QO 1 4Q7 inQ
i ,4y i ,juj 1 4QR R4RI ,4y0,040 1 °,cn 91 r 1 R7R 71 H
1 ,04y,ooo •1 n
Jamaica oyu RROooz RA704 1 7 nRQ ^ RAA 74I 4 oo,yy4 QA Q71y4,y/ iQ9 9Q7 OH AAA ceDO
Japan i , / n ,jd^ 1 O.AR o.7n 1 i 1 r 77n! ,0 I J, / (U 1 ^4n Q*^R
i ,o*tu,yoo 1 9R? RA9I ,ZOO,04Z o 1 1 ,044,227 Q COQ 09c
O,JOO,OZJ R ^ft^ QQ^0,000,yyj Q H7/1 9ft^ ft nK7 n77 Z
Jordan 666 583 1,047 1,215 336 120 14,005 21,368 19,081 19,301 31 ,513 74
Kazakhstan 934 8,794 1,964 12,884 20,204 46 6,550 23,968 5,896 23,672 35,615 70
Kenya 7,155 2,174 4,802 2,595 841 106 37,569 23,529 42,870 20,539 26,501 81
Kiribati 11 165 11 82 159 194
Korea, North 1,585 1,148 890 6,496 629 111 8,525 5,375 2,881 22,803 4,481 128
Korea, South 537,511 445,271 501,750 567,931 462,226 5 2,985,498 1,793,649 1,947,660 2,247,434 1,950,256 8
Kuwait 1,278 21,180 4,338 3,065 5,687 66 52,225 63,852 35,797 38,654 53,267 65
Kyrgyzstan 477 296 2,646 1,256 737 110 11,566 2,935 4,826 1,746 1,123 168
- 105-

International Trade Review
ALBERTA CANADARank Rank
1997 1998 1999 2000 2001 of 1997 1998 1999 2000 2001 of
COUNTRY $'000 $'000 $'000 $'000 $'000 175 $'000 $'000 $'000 $'000 $'000 219
Laos 53 31 114 n/a 258 2,617 51 411 35 209
Latvia 22 26 484 1,084 1,483 93 10,171 13,145 10,050 8,812 9,238 107
LcDdflOn 3,199 1,554 3,463 1,054 1,564 91 58,547 41,702 42,470 31,885 28,434 79
72 n/a 150 209 41 125 42 206
LIUtM Id 112 51 1,067 6 461 113 1,635 2,828 5,803 1,186 1,861 156
Libya 30,029 16,999 15,981 8,031 7,151 62 218,965 114,703 50,643 20,824 19,753 87
LllllUdllld 1,642 810 12,192 361 118 5,291 8,194 4,063 19,699 4,415 1301 i i v£*rY", hell imLUXciTiuuury 4,694 771 1,238 1,230 2,737 80 99,454 135,956 80,988 106,451 84,558 57
IVIdUaU 114 179 523 112 3,609 4,149 3,582 3,030 1,798 158ft Af^/^t^ri/^tn]^ividocaonid 55 24 157 1,535 1,026 1,572 1,581 1,301 166
IVIdUdydbOdl 27 1 174 712 2,245 436 1,147 1,002 169
Malawi 206 130 137 45 n/a 9,095 4,427 4,872 3,089 6,863 119
ft ^ o 1 o \/oi *3IVIdldyold 51,299 37,101 42,362 58,997 43,720 30 686,348 474,153 414,709 390,434 312,809 32
ft^alHiwocIVIdlUIVeo 7,799 7,525 12,290 4,226 6,627 64 8,247 7,856 12,596 4,461 7,293 118
MaliIvldll 3,279 85 567 442 39 146 12,062 9,314 10,950 7,972 4,001 131
MaltaIVIdlld 1,064 1,598 773 1,262 2,899 79 9,030 7,618 7,219 7,198 12,649 101
ft A o r+inm I iqIVIdlliniLjUc 388 n/a 2,654 n/a
Mai iritaniaIVIdUl lldllld 86 875 n/a 610 362 798 2,833 1,710 162
Mai 1 ritii i qIVIdUl IMUo 1,495 1,673 357 578 950 101 5,627 4,800 1,597 2,905 2,628 149
IVIcaIuU 223,253 286,753 244,836 356,051 481,484 4 1,219,220 1,402,303 1,506,755 1,940,496 2,352,496 6ft.^/~vlHn\/aIVIUIUUVd 15 15 25 156 807 578 363 290 993 170
ft^r\n rml iaIVIUI lUUIId 33 1,864 151 80 139 296 2,034 470 521 179
IVIUI ! Lot:! 1 dl n/a 149 81 83 282 214 189
IVIUI uuuu 96,215 68,892 59,986 52,663 57,700 25 199,849 191,070 176,356 242,411 255,553 38
ft^ i"i"7amh in I toIVIUZ-dlMUiyUfc; 1,503 3,438 1,678 747 2,704 81 22,537 16,731 17,156 11,904 19,142 88hA v/a nm a rivi ydi 11 1 Idi 682 120 128 3,480 969 87 146 431 183M am i K i aINdl 1 MUld 1,303 1,428 1,103 1 175 590 5,115 5,071 3,461 806 174
Mai in iIMdUl u n/a 739 59 21 67 56 204
N ©pa 1 135 3,040 2,290 2,685 83 138 4,679 5,162 3,831 4,022 1,769 159
Moth AntillocINGLII. nl lllllco 882 175 12 301 988 98 36,387 18,806 14,334 16,572 8,178 112MothorlanHcinch id idi iuo 184,098 163,685 135,958 110,768 114,633 12 1,637,130 1,779,279 1,467,340 1,379,989 1,541,052 11
Mqui f^aloHrtniaNew wdicuuiiid 2 16 163 1,293 1,819 6,795 1,359 1,734 161
Maui 7oalanH 49,241 41,913 39,720 26,579 27,993 41 294,215 206,104 203,140 187,045 211,015 41
Mif*arani iaINIUdl dy Ud 724 1,152 551 486 1,097 97 10,835 12,242 11,308 13,240 11,876 103
NiQer 311 10 8 169 8,768 1,691 1,254 1,787 705 176
MinoriaiNiytrl Id 17,401 12,820 5,504 17,911 28,665 39 103,826 54,454 28,861 58,802 103,857 54
NiuG 131 n/a 69 131 23 56 203Mnrfnlle lelanHINUI IUIFV loidliu n/a 625 92 326 185M /™\r\A/a\/inui way 13,000 21,007 11,807 13,291 35,155 35 760,183 848,606 716,560 830,311 924,979 15
Oman ^Miicr^aHWllldll ^IVIUOUdlj 6,601 9,641 6,577 4,904 11,639 54 14,536 14,343 11,431 9,902 17,771 90
PaHctan 70,921 27,330 15,890 10,815 6,485 65 139,818 87,546 80,302 80,336 71,695 58
Panaman dl idi l Id 5,075 1,272 653 1,118 784 107 38,312 47,633 46,654 53,861 36,205 69
Pani ia M O 183 78 188 64 118 129 23,323 22,438 2,017 2,277 2,195 153
Param ia\/di dy udy 181 139 114 73 92 137 10,144 12,952 7,064 6,124 5,580 123
Peru 48,854 30,872 27,479 36,221 33,549 37 309,305 186,197 165,151 193,385 183,340 45Ph i 1 i nntnocII 1 1 1 IUUII ICO 64,072 32,218 42,399 54,337 68,195 20 417,812 252,876 287,960 371,771 340,534 26Pitr^airn IcIanHrllUdllll loldllU n/a 243 45 169 178 193
PnlanHi Uldl IU 7,692 28,845 7,794 5,952 7,498 61 141,651 184,857 145,135 143,645 121,846 51
Pnrt I in a 1rUI luydl 1,095 3,708 4,094 3,006 3,806 75 105,420 125,568 109,620 100,250 104,325 53
Qatar 7,140 7,270 3,706 5,237 8,288 59 16,162 16,383 10,932 22,672 25,244 83
Reunion n/a 873 n/a
Romania 86 722 156 6,390 1,212 94 64,313 53,771 32,953 53,708 31,043 75
Russia 45,810 34,413 26,370 62,122 90,018 18 361,277 276,588 171,531 195,178 278,791 37
Rwanda 348 370 96 30 n/a 4,783 1,400 2,234 1,017 1,575 163
Saint Lucia 12 246 2 59 187 123 7,992 9,998 8,935 7,923 7,339 116
Sao Tome Prn. 24 n/a 54 30 5 58 22 212
- 106-

International Trade Review
ALBERTA CANADARank Rank
1QQ7199/ 1QQR 1QQQ nf 1QQ7I 99 r 1QQR 1 QQQ 9nnniUUU nf
COUNTRY $'000 $'000 $'000 $'000 $'000 175 $'000 $'000 $'000 $'000 $'000 219
Saudi Arabia 86,150 15,470 10,677 35,094 29,379 38 543,233 304,135 291,725 319,892 315,433 30
Senegal 37 7,022 3,663 8,231 10,202 56 18,436 23,311 23,936 30,348 41,693 67
Seychelles 16 15 n/a 368 543 48 656 861 172
Sierra Leone 995 102 112 15 38 147 2,002 2,146 1,367 831 1,976 155
Singapore 86,669 82,056 66,855 81,731 79,729 19 514,927 376,302 349,761 327,158 350,920 25
Slovakia 3,685 181 89 64 383 116 35,509 17,228 9,135 8,097 8,482 110
Slovenia 800 606 1,501 459 259 122 29,288 88,576 46,540 61,131 35,440 71
Solomon Islands n/a 164 111 342 128 107 197
Somalia 951 9 1,111 96 1,125 33 172 1,172 3,135 138
South Africa 39,897 54,976 46,626 40,876 28,423 40 361,012 310,104 238,451 235,949 187,887 43
Spain 39,418 36,610 53,020 50,923 39,086 33 588,152 564,047 609,446 645,581 818,122 17
Sri Lanka 7,228 3,385 10,496 10,225 4,155 73 53,878 34,807 51,163 47,520 30,056 77
St. Pierre-Miq. 59 60 n/a 44,843 26,714 30,644 19,280 17,159 91
St. Kitts-Nevis 25 2 72 141 1,911 5,590 9,500 9,623 16,147 93
St. Vincent Gren. 11 44 279 25 154 4,060 3,613 4,529 4,626 3,928 133
St. Helena 27 n/a 17 75 20 40 208
Sudan 11,421 15,623 15,034 5,658 34,959 36 26,675 38,291 29,067 20,652 65,394 60
Surinam 68 66 1,321 27 2,690 82 5,871 4,104 4,942 5,113 5,195 125
Swaziland 843 1,079 389 n/a 79 2,849 3,717 1,302 751 175
Sweden 9,884 4,703 10,235 8,237 22,524 45 374,782 339,777 369,889 326,954 294,715 34
Switzerland 39,033 40,029 26,296 31,322 23,776 44 414,452 903,098 464,250 495,993 314,062 31
Syria 1,731 1,185 3,614 1,874 1,514 92 24,057 26,417 20,726 11,959 15,936 94
Taiwan 278,200 210,286 234,082 235,541 210,982 6 1,575,737 1,126,997 1,087,456 1,116,995 965,294 13
Tajikistan n/a 60 20 88 337 501 181
Tanzania 1,764 1,625 5,267 174 743 109 16,517 19,780 30,067 23,186 13,343 99
Thailand 65,836 46,753 22,076 41,964 52,214 28 446,738 299,589 292,502 352.109 372,611 23
Togo 3,076 8,888 6,534 4,483 6,692 63 7,660 21,924 16,304 11,010 22,655 84
Tokelau 99 n/a 1,474 n/a
Tonga 29 152 37 46 408 79 666 177
Trinidad-Tobago 521 701 2,977 1,886 4,418 72 81,737 99,414 133,160 81,649 150,634 47
Tunisia 32,636 13,399 3,959 2,068 16,523 48 84,783 37,867 70,944 13,910 62,337 62
Turkey 37,879 15,608 13,754 1 1 ,282 4,822 70 329,801 212,076 197,442 246,762 168,689 46Turkmenistan 138 159 119 290 2,955 780 241 1,138 527 805 3,217 136
Turks Caicos Is. 15 11 257 25 155 537 1,301 2,184 2,325 2,337 151
U.S. Outlying Is. 344 n/a 93 445 1,082 546 511 180
Uganda 473 357 18 41 33 148 8,931 7,579 5,359 3,495 3,204 137
Ukraine 1,039 692 743 579 348 119 23,035 20,456 23,626 21,072 15,109 95
United Arab46,988 254,083
Emirates49,631 69,366 35,423 56,717 29 284,110 162,754 213,054 192,701 42
united Kingdom 165,767 230,790 179,394 198,325 176,280 7 3,641,208 4,156,321 4,484,217 5,398,645 4,700,309 3
United btates 26,946,019 25,280,548 29,074,340 48,731,981 50,565,744 1 228,077,903 251,097,183 286,561,256 334,145,755 325,034,270 1
Uruguay 1,643 473 1,032 2,835 974 99 23,225 23,399 35,712 24,295 19,100 89
Uzbekistan 46 199 148 126 8,469 4,544 1,933 2,054 13,842 98
Vanuatu 30 n/a 136 72 444 12 25 210
Venezuela 50,297 52,787 59,643 110,591 116,870 11 508,209 434,684 401,413 500.895 558,916 19
Vietnam 7,590 6,676 5,454 4,329 9,188 57 50,528 53,806 46,694 50,624 56,844 64
Wallis rutuna Is. 4 n/a 4 12 4 216
Western Sahara 14 n/a 238 19 14 20 7 215
\A/octorn Qamnavvcoici 1 1 OdiiiUd 20 9 168 111 33 815 570 254 188
Yemen 1,726 2,093 2,824 15,418 25,933 42 9,813 5,952 24,360 18,240 34,822 72
Yugoslavia 418 171 437 22 26 153 17,146 8,505 7,256 2,187 3,522 134
Zambia 89 127 508 473 19 162 6,063 5,777 10,050 5,358 4,421 129
Zimbabwe 29 13 11 44 7 171 13,160 8,820 5,383 4,843 2,829 143
TOTAL 33,481,745 31,010,153 34,605,446 55,331,452 56,864,491 280,033,595 297,509,218 331,433,928 385,363,738 373,554,232
- 107-

International Trade Review

International Trade Review
Appendix C: Alberta International Exports by Industry
(Countries Importing Over $50 million from Alberta in 2001)
($ '000)
ALGERIA AUSTRALIA BELGIUM BRAZIL CHILE
SECTOR 2000 2001 2000 2001 2000 2001 2000 2001 2000 2001
Primary Agriculture 76,458 43,163 2,876 255 19,700 24,141 9,869 3,540 17,411 11,736
Total Energy 15,051 847 9,348 3,104 80,219 51,612 27,833 21,843
Oil, Gas & Sulphur 15,040 755 46,847 29,872 2,845
Other Energy 10 92 9,348 3,104 33,372 21,740 24,987 21,843
Manufacturing 7,747 13,636 93,119 56,644 120,132 89,436 27,868 31,093 70,157 27,663
Chemicals 388 27,055 6,659 28,751 11,755 9,890 1,408 13,927 5,429
Computer & Elec/prod 170 117 40,583 26,360 48 205 7,298 5,525 49,031 10,283
Electrical/Electronic 1,091 443 896 899 3 42 43 545 181 615
Fabricated Metals 939 127 2,436 2,195 90 4,443 82 1,617 297 238
Food, Feed & Beverage 652 2,132 3,674 3,701 7,396 3,874 M4 "7 ccn
Furniture & Allied 208 49 51 49 77
Machinery 4,265 11,161 14,852 14,352 30 1 ,216 1 ,269 12,296 4,097 2,454
Non-Metallic Minerals 4 1,486 4 217 1,097 6
Panpr & Allied 1,495 984 45,821 29,043 599 2,642 o o
Plastics 1 4 1,248 941 132 8 1,328 187
Primary Metals 1,325 7 3 40,241 38,142 507 148
Refined Petroleum 143 71 42 12 44 48
Transportation 4 1,018 1,458 22 26 1,502 408 390Wood 1,129 152 311 377 83 37 243
Other Manufacturing 1,039 260 889 750 1,035 37 10 12
Other Exports 62 49 5,612 3,706 4,024 2,712 489 7,448 319 343
TOTAL EXPORTS 84,266 56,847 116,658 61,453 153,204 119,392 118,444 93,693 115,719 61,586
($ '000)
CHINA, P. REP COLOMBIA CUBA EGYPT FRANCE
SECTOR 2000 2001 2000 2001 2000 2001 2000 2001 2000 2001
Primary Agriculture 183,536
—1
249,703 40,200 52,633 10,644 13,079 2,505 20,329 3,571 2,180
Total Energy 81,788 41,426 28 18,608 12,388 7,393 18,345
Oil, Gas & Sulphur 81,788 41,426 18,608 12,376
Other Energy 28 12 7,393 18,345
Manufacturing 495,065 580,770 3,795 10,679 25,040 31,592 6,593 14,448 110,074 98,327
Chemicals 388,059 403,899 904 2,743 3,717 • 2,163 2,691 2,025
Computer & Elec/prod 10,246 9,565 1,254 1,974 569 1,413 1,197 7,074 4,282 14,422
Electrical/Electronic 1,503 426 22 129 1,219 2,109 268 144 43 2,315
Fabricated Metals 5,027 4,392 56 278 3,245 4,135 80 123 5,057 2,501
Food, Feed & Beverage 28,896 47,378 265 691 1,565 3,015 97 34 18,519 25,389
Furniture & Allied 36 1,112 15 14 563 298 454
Machinery 12,666 32,153 1,412 6,520 12,652 10,347 3,547 3,817 2,276 3,834
Non-Metallic Minerals 99 25 2 74 744 23
Paper & Allied 45,350 74,569 20 50,730 34,777
Plastics 676 497 11 2 963 669 61 106 139 47
Primary Metals 1,194 5,255 18 760 2,791 18,021 10,078
Refined Petroleum 34 56 259
Transportation 615 159 908 1,461 513 4,677 110
Wood 555 1,033 60 50 417 19
Other Manufacturing 144 274 754 120 221 480 761 475 3,339 2,352
Other Exports 11,033 14,577 62 1,597 1,092 859 151 189 523 814
TOTAL EXPORTS 771,422 886,476 44,057 64,937 55,383 57,916 16,642 53,312 114,168 101,321
- 109 -

International Trade Review
($ 'OOP)
SECTORGERMANY
2000 2001
HONG KONG2000 2001
INDONESIA2000 2001
IRANI
2000 2001
ITAI V1 1 Ml- T
2000 2001
Primary Agriculture 2,159 1,710 102 121 50,964 47,575 i yt.ooo 1 J,ooo 9ft
Total Energy 17 6,745 46 5,223 3,186 11
Oil, Gas & Sulphur U U D.ZZ J o.loo
Other Energy 1
7
6 745 o 46 o o 11
Manufacturing 151,660 101,283 153,768 96,405 61,037 40,539 10,475 17,288 171,169 146,232
Chemicals 9,139 6,486 42,664 20,512 30,920 13,180 525 517 2,912 2,835
Computer & Elec/prod 17,289 6,152 35,824 31,492 273 1,101 166 554 1,413 1,700
Electrical/Electronic 101 256 956 3,924 88 226 16 246 427
Fabricated Metals 7,889 4,860 375 436 346 757 549 781 1,006 1,735
Food, Feed & Beverage 573 1,057 63,308 17,124 1,420 2,298 5,259 6,219 13,660
Furniture & Allied 179 163 729 907 225 19
Machinery 3,015 6,908 1,240 2,442 3,419 8,892 3,649 11,755 1,316 2,172
Non-Metallic Minerals 5,022 2,692 57 153 1,341 70
Paper & Allied 94,731 63,431 14,654 24,332 14,064 1 64,531 43,734
Plastics 448 164 599 750 16 4 245 195 547 101
Primary Metals 41 1 814 2 410 2,259 155 12 3 82,290 49,142
Refined Petroleum 10 755 44 2
Transportation 4,293 3,274 631 23 21 2 nu ^o,*f / f
Wood 705 234 43 31 828
Other Manufacturing 8,224 3,791 3,677 1,807 46 3 4 1,631 2,161
Other Exports 1,630 1,438 2,730 3,921 1,257 1,517 58 38 1,571 316
TOTAL EXPORTS 155,467 111,176 156,100 100,493 118,481 92,817 203,311 162,783 192,429 174,934
($ '000)
JAPAN KOREA, SOUTH MEXICO MOROCCO
SECTOR 2000 2001 2000 2001 2000 2001 2000 2001
Primary Agriculture 383,390 398,534 33,944 32,474 146,262 169,469 41,667 49,537
Total Energy 171,197 128,164 79,647 103,452 14,000 9,265 7,789
Oil, Gas & Sulphur 14,000 9,265 7,789
Other Energy 171,197 128,164 79,647 103,452
Manufacturing 778,102 754,931 446,655 321,884 193,303 306,920 1,731 371
Chemicals 23,535 20,969 108,250 72,682 12,075 17,944
Computer & Elec/prod 8,510 10,117 9,183 10,093 17,501 10,147 1,084 314
Electrical/Electronic 582 675 330 357 317 810 11 34
Fabricated Metals 787 440 144 190 3,904 3,242 28
Food, Feed & Beverage 275,874 394,685 89,016 54,222 140,963 244,697 241
Furniture & Allied 2,331 620 42 108 3 108
Machinery 8,812 10,145 1,005 1,037 4,017 17,712 183 24
Non-Metallic Minerals 135 47 688 818 6 18
Paper & Allied 290,229 207,352 227,399 172,112 12,581 9,194
Plastics 657 825 518 530 130 53
Primary Metals 61,147 33,490 2,000 6,258 48 493
Refined Petroleum 73 91 4 49
Transportation 225 2,208 4,730 2,216 161 362 119
Wood 92,103 64,448 2,254 1,176 331 1,886
Other Manufacturing 13,100 8,820 1,094 80 1,217 253 66
Other Exports 8,247 2,213 7,145 4,416 2,486 5,096 1 3
TOTAL EXPORTS 1,340,936 1,283,842 567,391 462,226 356,051 481,484 52,663 57,700
- 110-

International Trade Review
NETHERLANDS PHILIPPINES RUSSIA SINGAPORE
SECTOR 2000 2001 2000 2001 2000 2001 2000 2001
Primary Agriculture 0,4Z /? -inn CO QIC cqg399 KmUU I
Total Enprnv 4,688
Oil, Gas & Sulphur 4,688
Other Energy
Manufacturing 96,673 107,881 9,016 8,771 t> l,Olbon co-1 80,179 77,717
Chemicals 7.274 949 2,142 1,438 oy i
1 A~7&1,4 ft) 19,844 5,010
Computer & Elec/prod 1,953 1,199 978 553 A Q714,0/ 1Q 7fl 10, /U1 18,027 14,538
Electrical/Electronic 816 105 218 1,463 1 DU i /y 1,855 1,800
Fabricated Metals 627 1,718 46 36 1 dA *3 4oy 3,347 6,306
Food, Feed & Beverage 151 299 2,401 2,149 1 ,JoU 1,877 3,819
Furniture & Allied 104 306 113 41r\U U 401 621
Machinery 3,765 4,179 244 156 A O QQ14o,aol D/,oiy 9,126 18,854
Non-Metallic Minerals 4 13 1 6 cD 100 115
Paper & Allied 3,439 2,287 2,500 2,682 U U
Plastics 191 74 215 152 168 55 41 151
Priman/ MptalQi n 1 1 la i y iviciaio 74,864 91,323 39 45 10 24,761 24,141
RpfinpH Pptrolpumr\ci i mcu r cu uicui 1
1
u A u u o o 1ftI
nu
Transportation 1,029 4,192 11 39 4,863 9,900 447 2,191
Wood 1,384 397 38 47 3,554 1,534 174
Other Manufacturing 1,073 4,652 72 339 27 160 172
Other Exports 8,669 4,652 378 508 806 496 952 1,411
TOTAL EXPORTS 110,768 114,633 54,337 68,195 62,122 90,018 81,731 79,729
TAIWAN THAILAND UNITED KINGDOM VENEZUELA
SECTOR 2000 2001 2000 2001 2000 2001 2000 2001
Primary Agriculture 5,205 1,379 11,906 19,509 32,761 30,905 52,430 61,173
Total Energy 6,351 5,500 8 14,382 15,706 90
Oil, Gas & Sulphur
Other Energy 6,351 5,500 8 14,382 15,706 90
Manufacturing 222,273 202,398 28,480 31,715 142,582 123,307 57,658 55,035
Chemicals 73,632 45,368 13,629 8,192 3,129 2,662 154 26
Computer & Elec/prod 43,308 57,798 341 2,221 55,144 31,982 2,225 2,247
Electrical/Electronic 541 653 339 2,178 2,860 1,873 2,271
Fabricated Metals 162 133 744 158 2,638 3,901 3,838 1,827
Food, Feed & Beverage 44,838 58,969 5,258 13,841 1,377 678 2,358 3,820
Furniture & Allied 586 83 2,941 4,159 337 39
Machinery 1,557 339 1,542 3,524 17,777 23,399 42,664 43,486
Non-Metallic Minerals 39 56 1,050 891 192 13
Paper & Allied 53,956 33,611 6,189 3,326 22,979 5,678 7
Plastics 40 16 11 132 2,062 1,983 238 1
Primary Metals 2,311 4,775 121 128 22,860 37,429 531 483
Refined Petroleum 11 35 29
Transportation 11 171 1,706 1,476 709 517
Wood 935 407 234 935 2,442 263
Other Manufacturing 367 168 306 22 6,443 5,264 97 5
Other Exports 1,712 1,704 1,570 989 8,629 6,372 412 662
TOTAL EXPORTS 235,541 210,982 41,964 52,214 198,325 176,280 110,591 116,870
- 111 -

International Trade Review
Alberta International Exports by Industry
UNITED STATES ($ '000) WORLD ($ '000)
SECTOR 2000 2001 2000 2001
Primary Agriculture 929,213 1,194,609 2,703,830 3,000,803
Crops 290,711 323,393 2,052,788 2,122,215
Livestock 638,502 871,216 651,042 878,587
Primary Forestry, Fishing & Trapping 28,721 8,601 28,997 8,623
Total Energy Exports 33,459,805 35,926,966 34,058,284 36,385,566
Gas & Natural Gas Liquids 18,483,953 22,999,125 18,483,953 22,999,125
Oil 14,878,765 12,612,250 14,878,765 12,612,250
Electricity 6,286 203,651 6,286 203,651
Coal 23,730 61,427 379,432 393,203
Other Mining 52,146 38,651 54,102 39,815
Sulphur 14,925 11,863 255,745 137,523
Manufacturing 13,612,498 12,726,742 17,704,334 16,666,003
Chemicals 2,586,471 3,039,887 3,488,262 3,751,188
Computer & Electronic Products 4,108,307 2,263,876 4,530,342 2,611,608
Electrical Equipment, App. & Comp. 152,216 209,871 186,659 248,301
Fabricated Metal Products 250,812 276,772 322,105 344,025
Food Feed & Beverage 1,792,086 2,049,355 2,532,053 3,001,835
Furniture & Related Products 395,791 339,310 410,127 349,990
Machinery 582,819 752,301 908,355 1 ,267,499
Non-Metallic Mineral Products 151,734 140,966 163,811 148,542
Paper Products & Wood Pulp 878,349 823,729 1,877,622 1,577,377
Petroleum & Coal Products 803,715 626,386 805,276 627,674
Plastics & Rubber Products 228,442 232,386 245,708 243,653
Primary Metal Products 92,992 132,587 434,271 451,027
Transportation Equipment 305,469 513,356 348,308 596,608
Wood Products 1,201,351 1,221,007 1,309,966 1,296,760
Other Manufacturing 81,944 104,954 141,470 149,916
Other Exports 701,743 708,826 836,007 803,496
TOTAL EXPORTS48,731,981 50,565,744 55,331,452 56,864,491
- 112-

International Trade Review
Appendix D: Alberta Exports by U.S. State
State"( $ 000's
)% Change
A QQQi yyy onnn 9finiZUU I
2001/2000
Illinois 2,yi /,buy C Q.01 HOCb,oo i ,uyb 41.2%
Washington O C\~7 4 HOC C- O 1 A C07b,oi4,b2/ / ,o4y , / O 1 24.3%
New York a 1 in cza o4, M U,b4o 7 DO -1 fiQ7i ,02 i ,by /
G. COT 1 79 -16.4%
Tennessee 1 ££C QQ7 O 1A7 OC7o,1U/,ob/ O, 140,DOO 1 .3%
Minnesota n qa n n7o2,y4y,u i 2 C /l /I O 7Q7b,44o, 10 1 0,U40,Z0U -44.1%
Michigan i ,zt>y,u4oo no CQC2,i2o,byb 9 coc qcq 19.1%
Ohio •1 MO/1 DQ11 ,U24,oo1 O 070 CQ72,2/ 2,bO/ o no-i 7coZ,UZ4, / Do -10.9%
California 1 AQ A 7nc1 ,4o4, / UD 1 770 CCD
i , / /2,bb9 1 QOQ ACQ 3.2%
Texas 1 , Jl 1 ,bJ1 1 C7Q QOO -1.3%
Iowa ~TAC noc/4b, (Job•1 yi i n c-oci ,41 y,b2b 1 /t 1 /I /ico
1 ,414,4DZ -0.4%
Wisconsin bb 1 ,
1
11 070 y17C9/2,4/b 1 1QQ 1 OQi ,i oJ, i zy 21.7%
Kansas lob, loo ooi22 1 ,121 1 1 OC CO /I 409.1%
Montana 1 I/O 70Qi ,142. (
1 OOC ylQ£i ,22b,4yb \ ,U4 / , 1 D4 -14.6%
Pennsylvania bUo, / ob i o>i n o vi c1 ,24(J,.}4b
ncn nci -22.6%
Wyoming 070 no /Io/o,9o4 7oo nno/ 2o,yy2 yzu.oyo 26.3%
North Dakota 2b2, i J/ CCC CC7bbb, bb/ 0.5%
Oregon A AC cnc44b,byb bbU.Uob -15.7%
Utah 301 ,718 OOO n vi o328,942 /ICO /IOC4oo,4z0 39.4%
Connecticut oo oon/do,ooy 4 nc -i o -i10b, 121 >1 1 Q QDn41 o.yoU 298.6%
Colorado On7 C7 AoU/ ,b/4 ocn cin2bU,b19 4lD,DD/ 59.9%
Florida IOC OC11 ob,2b1 294,U4b ool ,UUU 29.6%
Vermont OrtO OOO203,288 OO A CiA O284,942 OOO /IOC 13.5%
New Jersey 2bb, /00 onn oneo00,29b 6.8%
Massachusetts cc coobb.boj O vl C C O jl24b,b84 Oil ,U44 26.6%
Georqia (U.S.)ono cnn20o,b90 OOO OCC232,obb zyo,yu^ 28.6%
Idaho ooc c7n23b, b/9 o vi c nn vi24b,994 o <t n 7i/i^1U, A 14 -14.3%
North Carolina"1 vi O OOO142,338 159,567 i CiA AAA1y4,414 21.8%
Indiana 143,034 149,481\ oo ono1 oo,zUo 25.9%
Missouri ,304,02b 500,773 I OO OOO -63.3%
Virginia 1 /,992 340,QUI lob,41 / -51.1%
Louisiana OC CO Aob,b24 96,108 141 ,bUo 47.3%
Kentucky 90,738 129,217 1 35,004 4.5%
Arizona 131 ,014 148,433 4 O A OOO -9.7%
Nebraska b9,4o1 70 C7C/o,b/b 11/, I OD 49.9%
South Dakota b4,bo1 77,467 104,61
7
35.1%
Alaska 50,733 68,085 103,488 52.0%
South Carolina 47,768 67,169 99,214 47.7%
Oklahoma 67,485 92,870 94,923 2.2%
Nevada 63,734 111 ,293 82,243 -26.1%
Maryland 50,081 50,005 78,490 57.0%
Alabama 54,309 102,692 77,239 -24.8%
Maine 21 ,399 61 ,467 56,681 -7.8%
Arkansas 35,1 18 41 ,813 47,618 13.9%
West Virginia 21 ,626 20,736 46,457 124.0%
New Hampshire 26,552 38,304 OOO32,029 -16.4%
New Mexico 40,354 32,088 23,572 -26.5%
Mississippi 18,866 30,967 22,298 -28.0%
Puerto Rico (U.S.) 7,997 18,379 17,525 -4 7%Delaware 7 A OO/,420 C QOO i o noo
1 J,y2j 101.1%
District of Columbia 4,780 5,113 10,814 1 1 1 .5%
Hawaii 6,268 10,732 7,831 -27.0%
Rhode Island 11,132 4,105 3,968 -3.3%
Virgin Islands (U.S.) 50 642 55 -91.5%
U.S. Minor Outlying Is. 344 N/a
Unknown State 479,291 556,887 563,950 1 .3%
TOTALS 29,074,684 48,731,981 50,565,744 3.8%
Exports to individual states can be seriously over or under-stated because energy exports, such as crude oil or natural gas cannot
be allocated to the state of final destination. For example, exports to Washington are overstated and California exports are understated.
- 113-

International Trade Review
Appendix E
International Offices
Hong Kong Alberta Government Office
Room 1004
Admiralty Centre, Tower Two18 Harcourt RoadCentral, Hong Kong
Tel: 852-2528-4729
Fax: 852-2529-8115
E-mail: qov.ab(a)alberta.orq.hk
Web Site: www.alberta.org.hk/
Seoul Alberta Government Office
c/o Canadian Embassy10th Floor, Kolon Building
45, Mukyo-dong, Chung-KuSeoul 100-170
Republic of Korea
Tel: 011-82-2-3455-6000
Fax:011-82-2-7734-8966
E-mail: cliff.wulff(a)dfait-rnaeci.qc.ca
Web Site: www.albertakorea.com
Tokyo Alberta Government Office
Place Canada, 3rd Floor
3-37 Akasaka 7-chomeMinato-ku, Tokyo 107-0052
Japan
Tel: (813)3475-1171Fax: (813)3470-3939E-mail: ajo(a)altanet.or.ip
Web Site: www.altanet.or.jp
Beijing Alberta China Office
Canadian Embassy19 Dongzhimenwai Dajle
Chaoyang District, Beijing 100600People's Republic of China
Tel: 86-10-6532-3536 Ext. 3610Fax: 86-10-6532-1304
E-mail: [email protected]
Web Site: www.albertachina.com
Munich Alberta Government Office
C/o Canadian Consulate
Tal 29
D-80331
Munich, Germany
Tel: (011-49-89)2199 5740Fax: (011-49-89)2199 5757E-mail: karin.teubert(5)dfait-maeci.qc.ca
Web Site:
www.alberta-canada.com/qermany
Mexico City Alberta Government Office
c/o Canadian EmbassyCalle Schiller No. 529Colonia Polanco
Del. Miguel Hidalgo
11560 Mexico, D.F.
Tel: (52)555-387-9302Fax: (52) 555-724-7913
E-mail: lorena.patterson(a)dfait-maeci.qc.ca
Web Site: www.alberta-canada.com
- 114-

International Trade Review
Offices with Government of Alberta Representatives
Harbin Alberta Government Office Tel: 011-86-451-363-8929
294 Fendou Road Fax: 011-86-451-363-8929
Harbin, China 150001 E-mail: liuhm(S)public.hr.hl.cn
Beijing Alberta Petroleum Centre
#20 Xue Yuan RoadHaiDian District
Beijing 100083
People's Republic of China
Tel: 86-10-6209-8522
Fax: 86-10-6209-8529
E-mail: [email protected] Site: www.albertachina.com
Taiwan Canadian Trade Office
13th Floor, 365 Fu Hing North RoadTaipei, 104 Taiwan
Tel: 011-886-2-715-3637
Fax: 011-886-2-715-1717
E-mail: lian.chen(5)dfail-maeci.gc.ca
Portland Alberta Trade Office
One World Trade Center
121 S.W. Salmon Street, Suite 1100
Portland Oregon, 97204 USA
Tel: 503-471-1316
Fax: 503-471-1317
E-mail: wes.sawatzky(S)gov.ab.ca
- 115-


National Library of CanadaBibliotheque nationale du Canada
9
UhlM ,/fcena
AlDerta Auvantage ECONOMIC I: DEVELOPMENT
Policy & Economic Analysis
Alberta Economic Development
4th floor, Commerce Place
10155- 102 Street
Edmonton AB Canada T5J 4L6
Telephone: 780.427-6787
Fax: 780.422-0061
Website: www.alberta-canada.com
You can access the International Trade Review
and the following related department publications on
the web at www.alberta-canada.com/statpub :
Alberta's International Exports
Facts on Alberta
Monthly Economic Review
Inventory of Major Alberta Projects
Inventory of Regional Alberta Projects
Alberta Business Outlook
Global Economic Outlook
© 2002 Government of Alberta
ISBN 0-7785-2347-0
ISSN 0844-6318
Printed in Canada