Alaska’s 10-year Oil Production Outlook And Potential ... · Alaska’s 10-year Oil Production...
29
Alaska’s 10-year Oil Production Outlook And Potential Future Developments Report Pascal Umekwe Division of Oil and Gas, DNR 05/19/2017
Transcript of Alaska’s 10-year Oil Production Outlook And Potential ... · Alaska’s 10-year Oil Production...

Alaska’s 10-year Oil
Production Outlook And
Potential Future
Developments Report
Pascal Umekwe
Division of Oil and Gas, DNR
05/19/2017
Overview
Introduction and Background
Fall 2016 Forecast
Past and Current Forecast Methods
Review of Production Tranches
Potential Future Production
Projects within the DOG’s Public Report
New Discovery Announcements
Summary
2

The Place of Oil and Gas in Alaska’s Economy3
Revenue Sources Book, 2016

DOR Fall 2016 Forecast4
Source: Fall 2016 Revenue Sources Book

Motivation for Change in Forecast
Methodology5
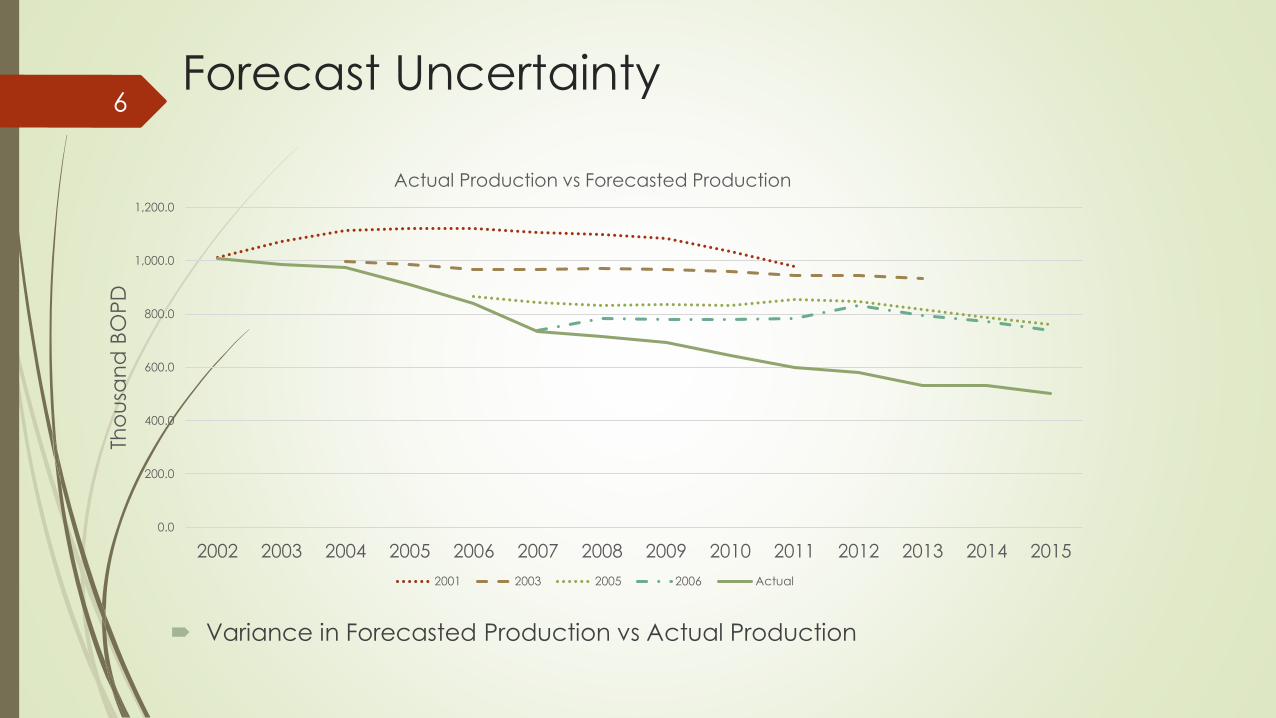
Forecast Uncertainty
Variance in Forecasted Production vs Actual Production
6
0.0
200.0
400.0
600.0
800.0
1,000.0
1,200.0
2002 2003 2004 2005 2006 2007 2008 2009 2010 2011 2012 2013 2014 2015
Tho
usa
nd
BO
PD
Actual Production vs Forecasted Production
2001 2003 2005 2006 Actual

Forecast-vs-actual variance increases into the
future7
1.2%
5.8%
12.2%
19.2%
26.8%
37.8%
46.8%
54.3%
60.9%65.0%
0.0%
10.0%
20.0%
30.0%
40.0%
50.0%
60.0%
70.0%
1 Year 2 Years 3 Years 4 Years 5 Years 6 Years 7 Years 8 Years 9 Years 10 Years
Average ANS variance by years out (2001-2014)
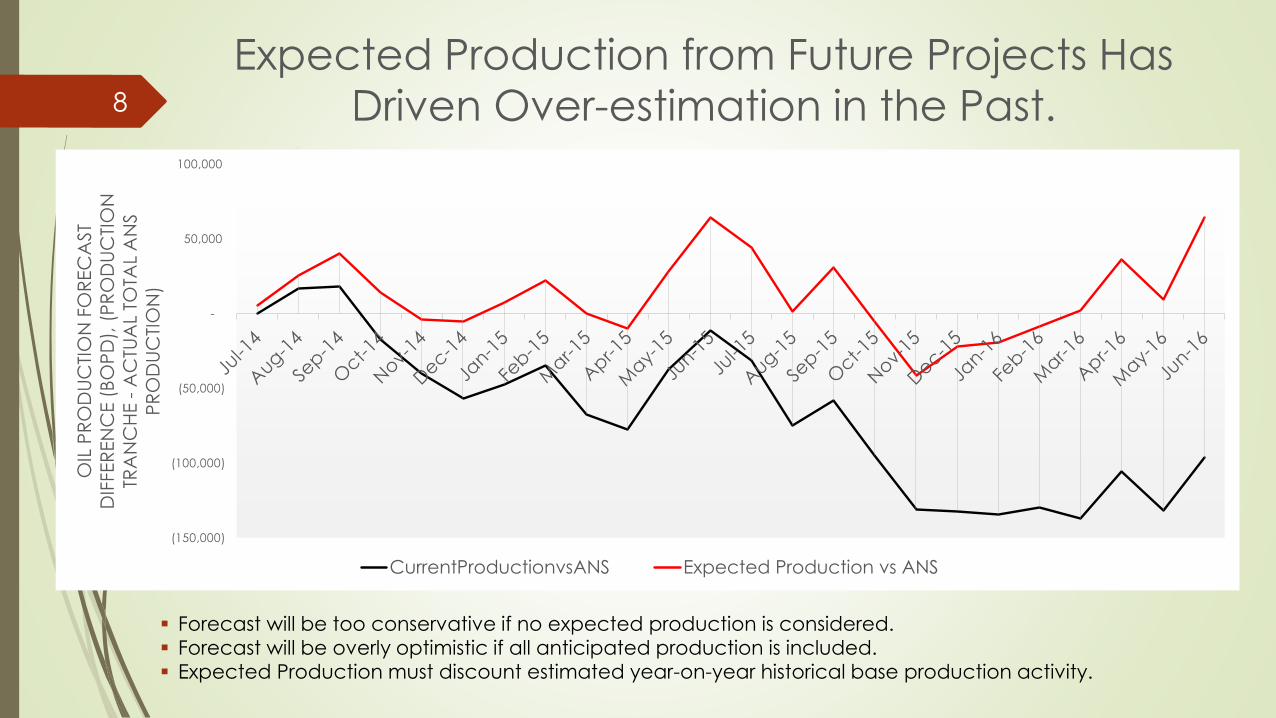
Expected Production from Future Projects Has
Driven Over-estimation in the Past.8
▪ Forecast will be too conservative if no expected production is considered.
▪ Forecast will be overly optimistic if all anticipated production is included.
▪ Expected Production must discount estimated year-on-year historical base production activity.
(150,000)
(100,000)
(50,000)
-
50,000
100,000
OIL
PR
OD
UC
TIO
N F
OR
EC
AST
DIF
FER
EN
CE (
BO
PD
), (
PR
OD
UC
TIO
N
TRA
NC
HE -
AC
TUA
L TO
TAL
AN
S
PR
OD
UC
TIO
N)
CurrentProductionvsANS Expected Production vs ANS

Reasons For Differences in Forecast vs Actual
Production
Previously, a ten-year window was used for projects in the under development
(UD) and under evaluation (UE) portions of the forecast.
Leading to more uncertainty in the forecast
This resulted in more projects (expected production) being included that didn’t go
into production within the expected time frame.
For example: Mustang, Liberty, OCS production
All expected production was added to the forecast as UD and UE.
No price dependency, or risk of occurrence applied until recently
Historical drilling activity was not properly accounted for.
9

Reducing Outlook Time to Improve
Accuracy of the Forecast.
It is more challenging looking far
out.
Typically operators wouldn’t
have a set plan and will be
open to changes in market
conditions that do affect their
plans.
Including projects with first oil
farther out reduces the
accuracy of the forecast.
10
0%
10%
20%
30%
40%
50%
60%
70%
80%
2001 2002 2003 2004 2005
Va
ria
nc
e f
or
diffe
ren
t o
utlo
ok
tim
es
Forecast year
Forecast Errors in Years 1-10
1 Year
3 Years
5 Years
7 Years
10 Years
* 2001 to 2005 allows for analysis of 10yr prediction vs actual

Differences Between Forecast Methods
Previously (1990-2015) 2016 - Present
Forecast Level Pool Level, Well – by–Well
Forecast
Pool Level forecast
Uncertainty Handling Deterministic Probabilistic
Risking Unrisked CP not risked.
First UD/UE risking in 2013 Fall
forecast
Probabilistic technical and
Non-technical risk
Oil Price dependency None Dependence on oil price
UD Production 10 year outlook 1 year outlook
UE Production 10 year outlook 5 year outlook
11

Current Production Forecasting
Method12

Production Categories
Official Production
Forecast
Currently Producing
Under Development
(1yr)
Under Evaluation (2-
5yrs)
Excluded Projects (5+yrs)
13
Potential
Future
Development
Category

Production Category:
Currently Producing (CP) Tranche.
Characteristics:
All currently producing pools in ANS and Cook Inlet
Examples: Legacy fields and other fields in production
Decline Curve Analysis forecast at pool level acknowledges some level of ‘background’
or ongoing development activity, facility maintenance, well intervention and turn-around
events.
14
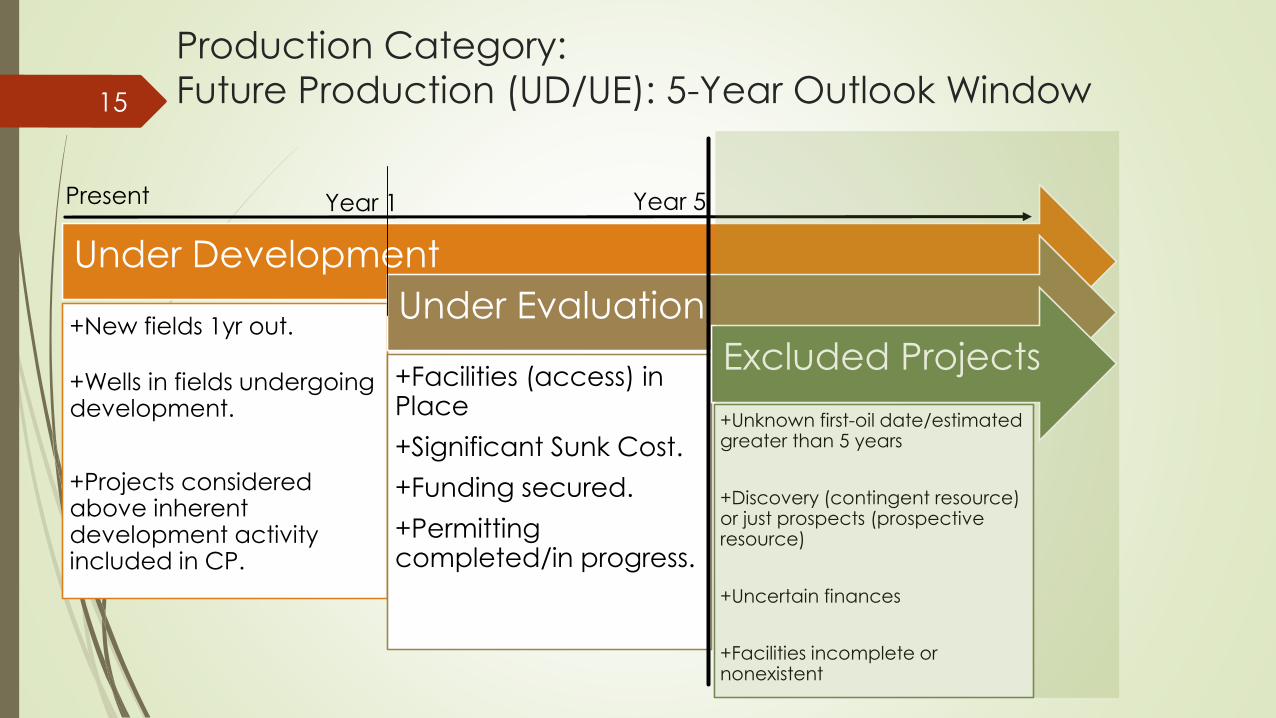
Production Category:
Future Production (UD/UE): 5-Year Outlook Window
Under Development
+New fields 1yr out.
+Wells in fields undergoing development.
+Projects considered above inherent development activity included in CP.
Under Evaluation
+Facilities (access) in Place
+Significant Sunk Cost.
+Funding secured.
+Permitting completed/in progress.
Excluded Projects
+Unknown first-oil date/estimated greater than 5 years
+Discovery (contingent resource) or just prospects (prospective resource)
+Uncertain finances
+Facilities incomplete or nonexistent
15
Year 1 Year 5Present

First Oil Estimated in 2018-2021
- Projects in Blue Have Been Postponed -
Project Reservoir Formation Peak Rate Est, BOPD
(From Public Sources)
Add’l CD5 wells, Colville River Unit Alpine sands, Kuparuk Fm n/a
Greater Mooses Tooth 1 Alpine sands (Lookout) 30,000
Greater Mooses Tooth 2 Alpine sands (Spark-Rendezvous) 25,000 – 30,000
Nuna Project, Oooguruk Unit
(postponed)
Torok Fm (same horizon as Moraine) 20,000 – 25,000
Nuiqsut Expansion, Oooguruk Unit
(postponed)
Nuiqsut sand n/a
Mustang Project, S Miluveach Unit
(postponed)
Kuparuk Fm 12,000 – 15,000
Add’l wells, Nikaitchuq Unit (postponed) Schrader Bluff Fm n/a
Moose Pad, Milne Point Unit Schrader Bluff Fm 10,000
Moraine Project, Kuparuk Unit Torok Fm (same horizon as Nuna) n/a
1H NEWS, Kuparuk Unit (potentially
postponed)
Schrader Bluff Fm (West Sak sands) 8,000
Decker, P., (2017b)
16

How Probabilistic DCA Works
▪ Decline Curve Analysis (DCA) develops trends based on historical production data to forecast future production. It incorporates an understanding of reservoir and operational performance of producing fields/wells.
▪ Probabilistic DCA includes uncertainty analysis to produce a range of future production rather than a single deterministic forecast profile.
▪ Software used:
▪ Schlumberger’s Oil Field Manager (OFM) alongside a probabilistic suite.
▪ Uncertainty analysis in excel used @Risk by Palisade
17

Statewide Production Forecast Range18
100,000
200,000
300,000
400,000
500,000
600,000
700,000
800,000
900,000
1,000,000
1,100,000
20
04
20
05
20
06
20
07
20
08
20
09
20
10
20
11
20
12
20
13
20
14
20
15
20
16
20
17
20
18
20
19
20
20
20
21
20
22
20
23
20
24
20
25
20
26
Ba
rre
ls o
f O
il P
er
Da
y
Oil+NGL_Ave BOPD Forecast P10 Forecast Mean Forecast P90
Mean Future Decline Rate: 4%
Historical Decline Rate: ~5%

Fall 2016 Forecast: Production Tranches 19
-
100,000
200,000
300,000
400,000
500,000
600,000
7/1
/20
16
10/1
/20
16
1/1
/20
17
4/1
/20
17
7/1
/20
17
10/1
/20
17
1/1
/20
18
4/1
/20
18
7/1
/20
18
10/1
/20
18
1/1
/20
19
4/1
/20
19
7/1
/20
19
10/1
/20
19
1/1
/20
20
4/1
/20
20
7/1
/20
20
10/1
/20
20
1/1
/20
21
4/1
/20
21
7/1
/20
21
10/1
/20
21
1/1
/20
22
4/1
/20
22
7/1
/20
22
10/1
/20
22
1/1
/20
23
4/1
/20
23
7/1
/20
23
10/1
/20
23
1/1
/20
24
4/1
/20
24
7/1
/20
24
10/1
/20
24
1/1
/20
25
4/1
/20
25
7/1
/20
25
10/1
/20
25
1/1
/20
26
4/1
/20
26
BO
PD
Total AK Production
CP UD UE
The biggest share of production forecast (CP) still requires wellwork and facility
upgrades, optimization from operators and the servicing industry.
Currently Producing Tranche:
Over 90% of Total Production

Longer Term Outlook20

Potential Future Development Projects
Projects discussed in report:
Fiord West Project
Placer Project
Pikka Project
Tofkat Kuparuk C Project
Liberty Project
Point Thomson Major Gas
Sales Project
Smith Bay Project
Ugnu Project
21
Why undertake a task to develop ‘speculative’ profiles?
▪ Not to provide a technical or economic project-by-project assessment.
▪ To contribute to the framing of conversations in the public space while acknowledging the technological and commercial challenges faced by these projects.
How were profiles developed?
▪ Type curves from analogous reservoir rocks and potential well performances.
▪ Using public presentations, reports and statements from project operators.

First Oil Potentially 2022 or Later
- Some Projects May Not Occur -22
Project Reservoir Formation Peak Rate Est, BOPD
(From Public
Sources)
Fiord West Project Kuparuk Fm and Nechelik
sand
n/a
Placer Project Kuparuk Fm n/a
Pikka Nanushuk Project Nanushuk Fm & Alpine sands Up to 120,000
Tofkat Kuparuk C Project Kuparuk Fm n/a
Willow Project Nanushuk Fm 40,000 – 100,000
Liberty Project Kekiktuk Fm 60,000
PTU Major Gas Sales
Project
Thomson sands Up to 70,000
Smith Bay Project Torok Fm Up to 200,000 (?)
Ugnu Prince Creek Fm (Ugnu sands) n/a
Decker, P. (2017b)

Potential Impact on Long term North Slope
Production 23
• North Slope profile showing possible impact of potential future projects.
• Production profiles are unrisked and actual timing remains uncertain.
• Projects could help prolong the operational life of TAPS.
24
4/12/2017
1/22/2017
10/9/2016
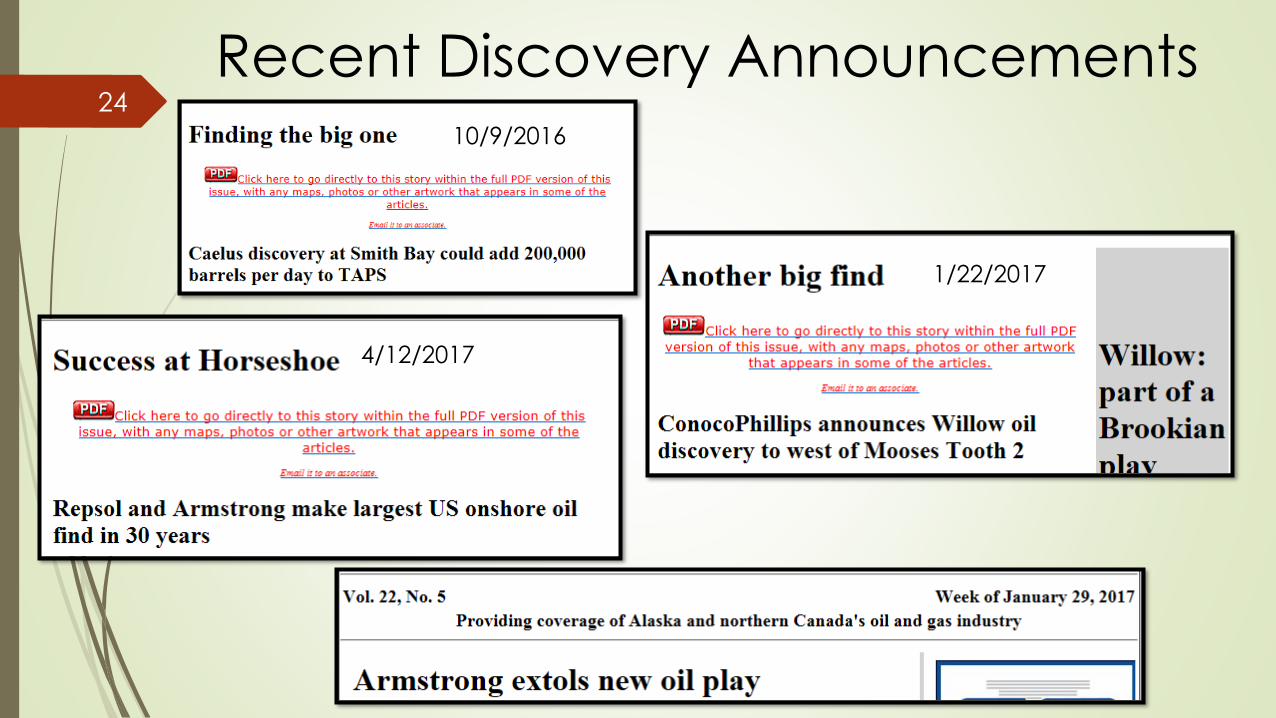
Recent Discovery Announcements
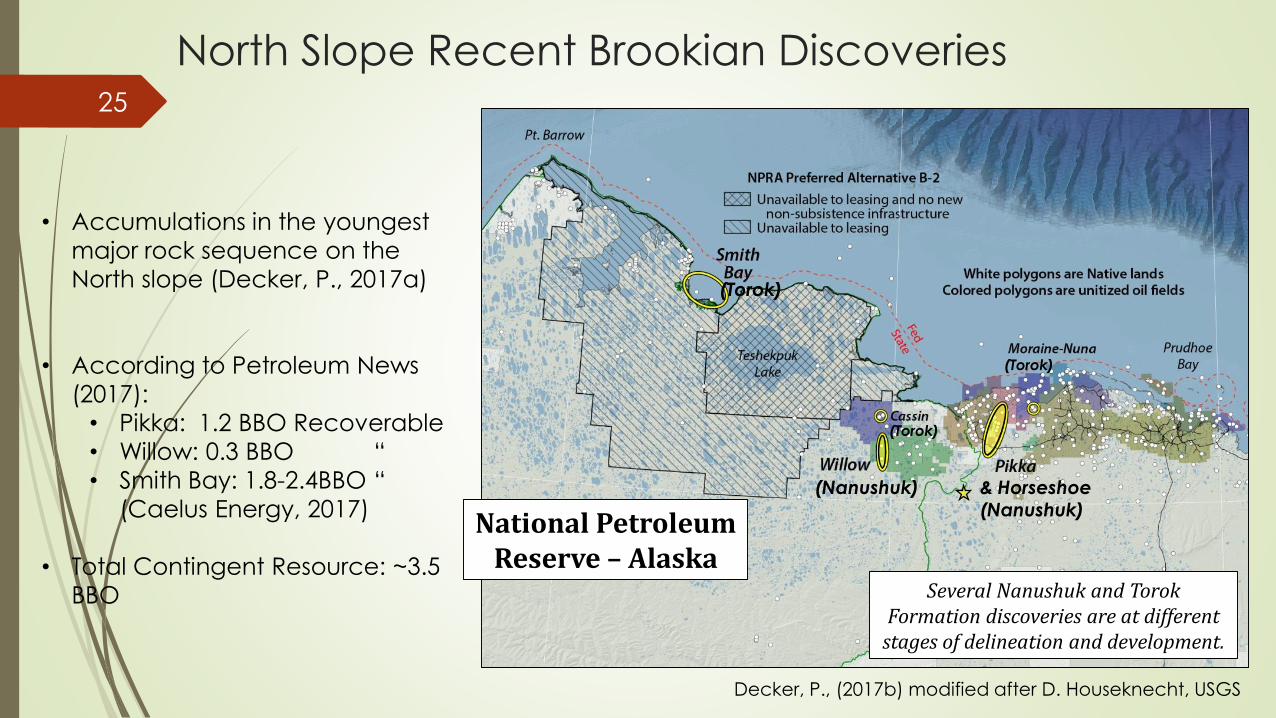
North Slope Recent Brookian Discoveries25
• Accumulations in the youngest
major rock sequence on the
North slope (Decker, P., 2017a)
• According to Petroleum News
(2017):
• Pikka: 1.2 BBO Recoverable
• Willow: 0.3 BBO “
• Smith Bay: 1.8-2.4BBO “
(Caelus Energy, 2017)
• Total Contingent Resource: ~3.5
BBO
Decker, P., (2017b) modified after D. Houseknecht, USGS
National Petroleum Reserve – Alaska
(Torok)
(Torok)
(Nanushuk) & Horseshoe (Nanushuk)
(Torok)
Several Nanushuk and Torok Formation discoveries are at different
stages of delineation and development.

Summary
Official state production forecast applies standard accepted engineering
and production risk assessment techniques in determining future production.
Recent new discoveries show that there is still a strong future for oil
production in Alaska.
Maintaining base production and bringing on new production is impossible
without Alaska’s Oil and gas support companies.
Oil prices play a vital role in what resources are ultimately produced.
26

References
DOG (2017) Alaska’s 10-year Oil Production Outlook and Potential Future Developments. Retrieved 5/2017 from http://dog.dnr.alaska.gov/ResourceEvaluation/Documents/20170209-ForecastAndScenariosReport.pdf
Caelus Energy (2017) Caelus Activity Update HRC 2/1/2017. Retrieved 4/2017 from http://www.akleg.gov/basis/get_documents.asp?session=30&docid=646
Decker, P. (2017a) Nanushuk Formation Brookian Topset Play, Alaska North Slope. North American Prospect Expo 2017. Feb 2017. Retrieved 4/2017 from http://dog.dnr.alaska.gov/ResourceEvaluation/Documents/NanushukDiscoveries_AAPG.pdf
Decker, P. (2017b) North Slope Development Outlook Presentation to Senate Finance Committee, 4/25/2017. Retrieved from http://www.akleg.gov/basis/get_documents.asp?session=30&docid=17166
Petroleum News Reports
http://www.petroleumnews.com/pnads/688589178.shtml
http://www.petroleumnews.com/pnads/84786909.shtml
http://www.petroleumnews.com/pnads/13033674.shtml
http://www.petroleumnews.com/pnads/245705826.shtml
http://www.petroleumnews.com/pnads/748220773.shtml
27

Back Up28

29
North Slope Exploration and Development: A snap shot of activity and operator
footprint on the North Slope of Alaska.