Alan Robinson
17
1 2014 AITPM Conference 2014 The Use of Automatic Number Plate Recognition (ANPR) Data for Transport Model Development
-
Upload
jumpingjaq -
Category
Business
-
view
120 -
download
2
description
AITPM presentation
Transcript of Alan Robinson

1
2014
AITPM Conference 2014
The Use of Automatic Number Plate Recognition (ANPR) Data for Transport Model Development
2
2014
The Use of Automatic Number Plate Recognition (ANPR) in Transport Model Development
Contents• The Gauteng Freeway Improvement Project (GFIP) Overview• A review of the ANPR data• Methodology for comparing ANPR data to model OD matrices• Validation of a 2015 forecast from the 2006 GFIP Base Year
model• Conclusions and the way forward

3
2014
The GFIP Project
• A SANRAL Project (State run)• Commenced planning in 2006• Comprises:
– ±185km of Urban Freeway– 42 Open Road Toll Gantries– Sections with >150 000vpd
• Construction substantially complete in 2010 for FIFA 2010
• Tolling ready January 2011• Tolling commenced 3 Dec 2013

4
2014
The GFIP Traffic Model
• Developed using SATURN• Based on provincial model• Comprises:
– ±900 traffic zones– ± 22 000 road links– 6 user classes– 5 time periods
• Calibrated to:– Land use data (trip generation factor)– HHS trip distribution (avg. trip length)– Journey time data from F/W and
alternative routes– >600 automatic/manual traffic counts
PRETORIA
JOHANNESBURG

5
2014
ANPR Data• Data collected from 4 weeks 24/7
during February 2014, • Raw data comprised 63 751 618
records• Number plates replaced by unique
vehicle ID• Vehicle classes:
– A1 – motorcycle– A2 – light vehicle <2.5m high– B – small heavy >2.5m high < 12m long– C – large heavy > 2.5m high > 12m long
Vehicle ID Date TimeVehicle Class
Gantry
1266349 01.02.2014 01:02:39 A2 1030
761345 01.02.2014 01:05:15 B 1031
28924 01.02.2014 01:08:48 A2 1017
2209241 01.02.2014 01:12:23 A2 1043
2128320 01.02.2014 01:19:26 A2 1006
14116 01.02.2014 01:09:36 C 1028
1740973 01.02.2014 01:21:15 A2 1025
1650914 01.02.2014 01:10:13 A2 1012
Sample data courtesy SANRAL/ETC Central Operations Centre
Raw ANPR/ORT data
6
2014
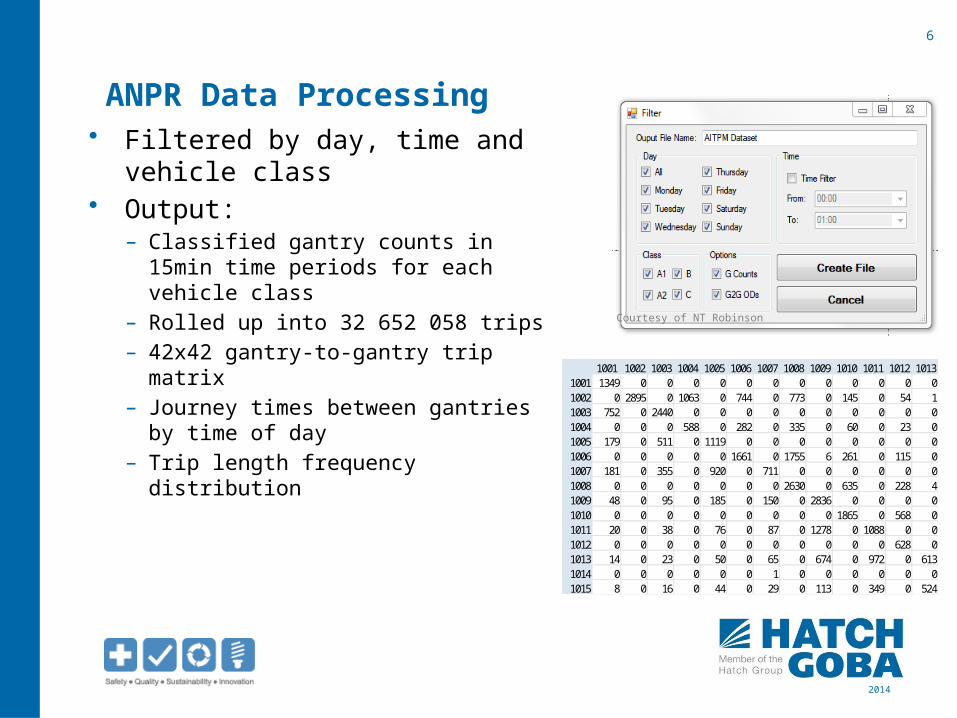
ANPR Data Processing• Filtered by day, time and vehicle
class• Output:
– Classified gantry counts in 15min time periods for each vehicle class
– Rolled up into 32 652 058 trips– 42x42 gantry-to-gantry trip matrix – Journey times between gantries by time of
day– Trip length frequency distribution
1001 1349 0 0 0 0 0 0 0 0 0 0 0 01002 0 2895 0 1063 0 744 0 773 0 145 0 54 11003 752 0 2440 0 0 0 0 0 0 0 0 0 01004 0 0 0 588 0 282 0 335 0 60 0 23 01005 179 0 511 0 1119 0 0 0 0 0 0 0 01006 0 0 0 0 0 1661 0 1755 6 261 0 115 01007 181 0 355 0 920 0 711 0 0 0 0 0 01008 0 0 0 0 0 0 0 2630 0 635 0 228 41009 48 0 95 0 185 0 150 0 2836 0 0 0 01010 0 0 0 0 0 0 0 0 0 1865 0 568 01011 20 0 38 0 76 0 87 0 1278 0 1088 0 01012 0 0 0 0 0 0 0 0 0 0 0 628 01013 14 0 23 0 50 0 65 0 674 0 972 0 6131014 0 0 0 0 0 0 1 0 0 0 0 0 01015 8 0 16 0 44 0 29 0 113 0 349 0 524
1010 1011 1012 10131006 1007 1008 10091001 1002 1003 1004 1005
Courtesy of NT Robinson

7
2014
ANPR Data Outputs
• Detailed Traffic Counts per Gantry

8
2014
ANPR Data• Gantry to Gantry counts (“OD”),
ToFrom
1001 1002 1003 1004 1005 1006 1007 1008 1009 1010 1011 1012 1013 1014 1015 1016 1017 1018 1019 1020 1021 1022 1023 1024 1025 1028 1029 1030 1031 1032 1037 1038 1039 1040 1041 1042 1045 Total
1001 21 207 21 207
1002 23 350 11 788 5 130 7 699 1 774 989 1 329 682 656 452 2 543 321 12 6 52 3 2 983 9 448 6 66 226
1003 9 970 22 351 32 321
1004 9 979 2 737 3 131 700 399 84 147 368 293 241 95 3 2 20 1 4 18 204
1005 2 616 4 513 11 632 18 761
1006 11 566 13 855 1 2 393 1 461 579 2 923 1 568 1 676 2 1 208 772 18 8 155 5 1 2 12 36 207
1007 4 361 7 096 15 391 16 308 43 156
1008 24 362 5 973 3 343 3 922 4 1 000 3 707 4 843 1 2 014 890 34 14 250 8 2 2 125 47 497
1009 913 1 713 2 323 2 400 33 509 40 858
1010 30 976 12 853 1 506 1 554 1 8 3 78 27 2 47 008
1011 613 826 1 178 1 436 15 957 12 236 32 246
1012 13 350 4 194 6 168 3 1 31 133 1 184 433 3 25 500
1013 334 498 776 867 6 216 7 196 8 673 24 560
1014 2 1 1 2 8 054 11 670 7 4 484 641 2 451 2 345 67 25 729
1015 188 108 490 394 940 2 158 3 697 8 267 16 242
1016 1 2 1 11 410 6 9 491 508 1 400 1 379 3 60 15 270
1017 369 319 731 382 967 1 981 3 048 6 051 22 678 37 70 2 175 647 2 076 2 910 12 9 36 310 44 808
1018 279 326 840 940 9 165 11 550
1019 12 2 3 10 19 114 21 918 4 424 1 582 131 480 13 18 10 1 804 49 521
1020 288 403 962 1 221 13 758 8 394 25 026
1021 29 1 1 4 10 75 17 534 4 461 1 777 714 900 30 30 17 712 26 295
1022 487 222 865 796 4 384 2 911 23 309 403 158 305 3 009 36 849
1023 6 9 103 552 13 526 8 598 1 295 2 394 26 483
1024 456 168 770 823 6 37 619 1 809 3 619 1 945 5 874 16 123 3 435 2 687 214 95 167 716 39 563
1025 6 057 6 057
1028 14 11 39 21 103 1 096 2 761 5 524 30 360 39 929
1029 38 11 42 36 134 132 2 209 1 409 6 286 5 223 44 19 38 247 15 868
1030 1 5 4 8 21 317 1 233 2 728 3 500 7 873 15 690
1031 403 142 536 457 1 679 981 6 167 506 10 380 271 107 110 834 22 573
1032 43 35 192 542 4 7 77 748 12 610 6 107 9 093 2 542 2 811 2 469 42 063 79 343
1037 1 020 505 507 148 75 40 35 69 12 26 15 2 6 653 3 020 7 432 19 559
1038 1 128 7 420 8 548
1039 1 059 2 317 1 275 4 651
1040 2 547 6 777 9 324
1041 12 907 12 907
1042 4 584 13 389 3 995 7 352 29 320
1045 809 1 815 617 737 9 741 13 719
Total 50 204 23 350 38 748 22 787 36 775 19 938 26 634 49 554 57 731 41 964 25 043 32 470 20 228 15 708 25 770 33 589 22 678 45 403 25 482 20 554 46 728 40 753 35 536 16 123 26 496 42 313 13 505 17 282 22 714 42 063 6 653 25 930 6 327 8 550 36 564 8 776 17 652 1 048 575

9
2014
Uses of the Data in Traffic Model Development
• Traffic counts at gantry locations can be used for model calibration or validation
• Journey times along freeway sections for the validation of the model’s vdfs. Require single point volume/speed data for vdf calibration.
• From one gantry to another gantry is only part of the trip and obtaining a TLFD directly from the data is not an option.
• Gantry-to-gantry trips are not from the model network’s origins or destinations.
ANPR data is comprehensive and accurate, we must relate this data to the model’s OD trip matrices

10
2014
Relating OD Information
• Select Link through all gantries
• Select Link through each gantry
• Combination highlights cell groups only related to gantry combinations– A: only through A– AB: through A and B only– ABC: through A and B and C only– Etc.
2 4 6 8 10 121
143 5 7 9 11 13
A B C
FG
All 1 2 3 4 5 6 7 8 9 10 11 12 13 141 x x x x x x x x x x x2 x x x x x x x x x x x3 x x x x x x x x x x x4 x x x x x x x5 x x x x x x x6 x x x x x x x x x x x x7 x x x x x x x x x x x x8 x x x x x x x x9 x x x x x x x x
10 x x x x x x x x x x x x11 x x x x x x x x x x x x12 x x x x x x x x x13 x x x x x x x x x14 x x x x x x x x x
A 1 2 3 4 5 6 7 8 9 10 11 12 13 141 A A A A A A A A A A A2 A A A A A A A A A A A3 A A A A A A A A A A A456789
1011121314
B 1 2 3 4 5 6 7 8 9 10 11 12 13 141 B B B B B B B2 B B B B B B B3 B B B B B B B4 B B B B B B B5 B B B B B B B6 B B B B B B B7 B B B B B B B89
1011121314
C 1 2 3 4 5 6 7 8 9 10 11 12 13 141 C C C2 C C C3 C C C4 C C C5 C C C6 C C C7 C C C8 C C C9 C C C
10 C C C11 C C C121314
1 2 3 4 5 6 7 8 9 10 11 12 13 14123456789
10 F F F F F F F F F11 F F F F F F F F F12 F F F F F F F F F13 F F F F F F F F F14 F F F F F F F F F
G 1 2 3 4 5 6 7 8 9 10 11 12 13 14123456 G G G G G7 G G G G G8 G G G G G9 G G G G G
10 G G G G G11 G G G G G12 G G G G G13 G G G G G14 G G G G G
ALL 1 2 3 4 5 6 7 8 9 10 11 12 13 141 A A A A AB AB AB AB ABC ABC ABC2 A A A A AB AB AB AB ABC ABC ABC3 A A A A AB AB AB AB ABC ABC ABC4 B B B B BC BC BC5 B B B B BC BC BC6 G G G G G B B B B BC BC BC7 G G G G G B B B B BC BC BC8 G G G G G C C C9 G G G G G C C C
10 FG FG FG FG FG F F F F C C C11 FG FG FG FG FG F F F F C C C12 FG FG FG FG FG F F F F13 FG FG FG FG FG F F F F14 FG FG FG FG FG F F F F
We can isolate model matrix cells that correspond to ANPR gantry-to-gantry counts

11
2014
The Workings
• = Select link matrix through all gantry locations • = Select link matrix through all gantry locations • = Select link matrix through all gantry locations • = Trips from Gantry(a) to Gantry(b) only
12
2014
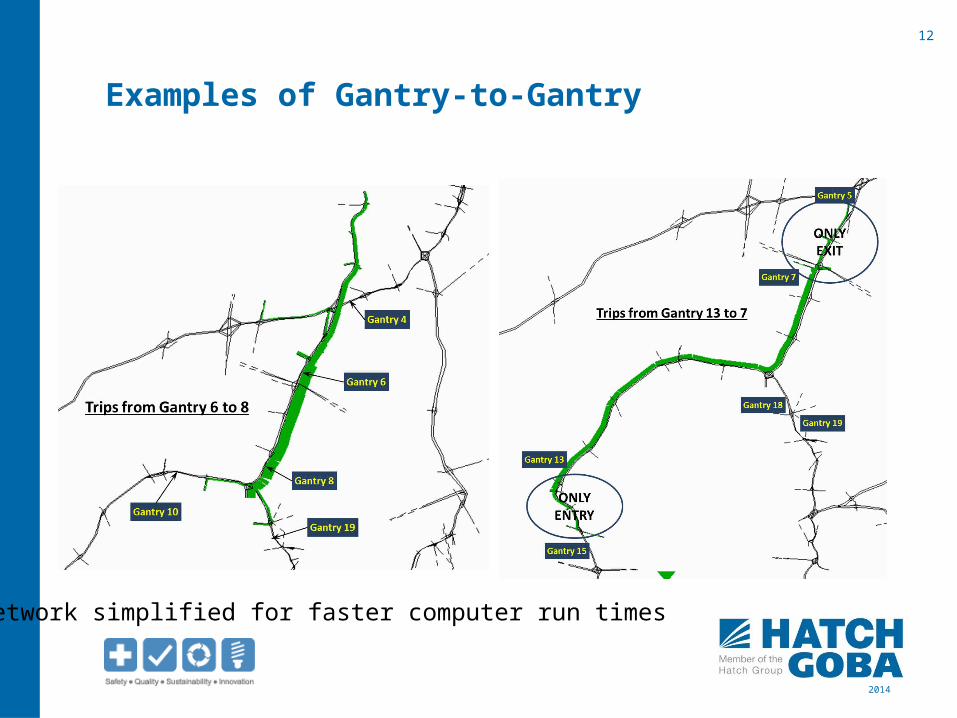
Examples of Gantry-to-Gantry
Network simplified for faster computer run times
13
2014
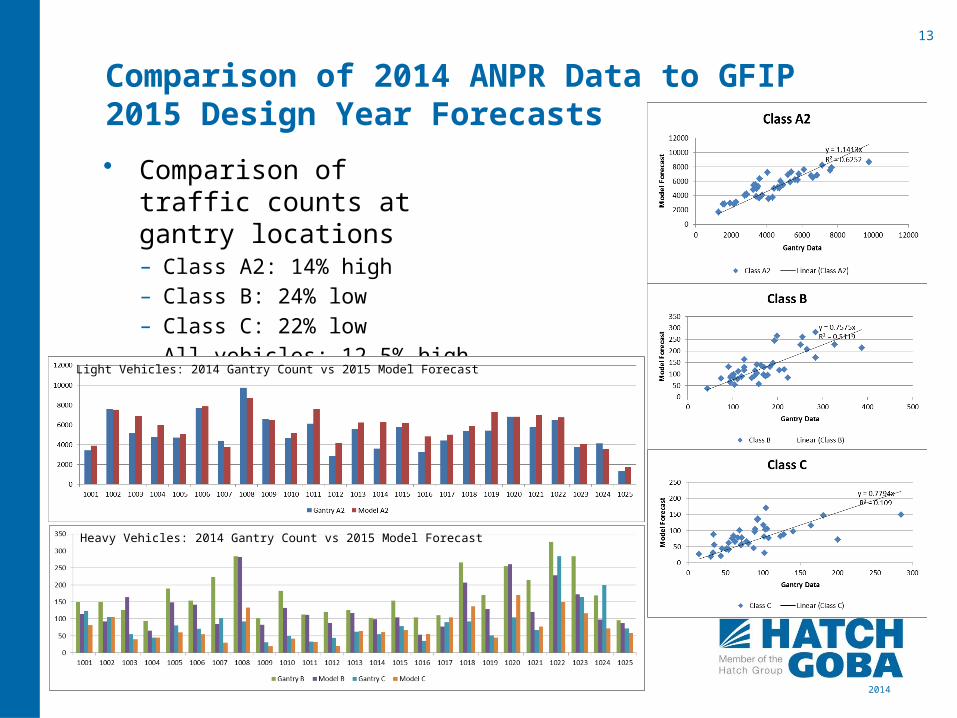
Comparison of 2014 ANPR Data to GFIP 2015 Design Year Forecasts
• Comparison of traffic counts at gantry locations– Class A2: 14% high– Class B: 24% low– Class C: 22% low– All vehicles: 12.5% high
Light Vehicles: 2014 Gantry Count vs 2015 Model Forecast
Heavy Vehicles: 2014 Gantry Count vs 2015 Model Forecast
14
2014
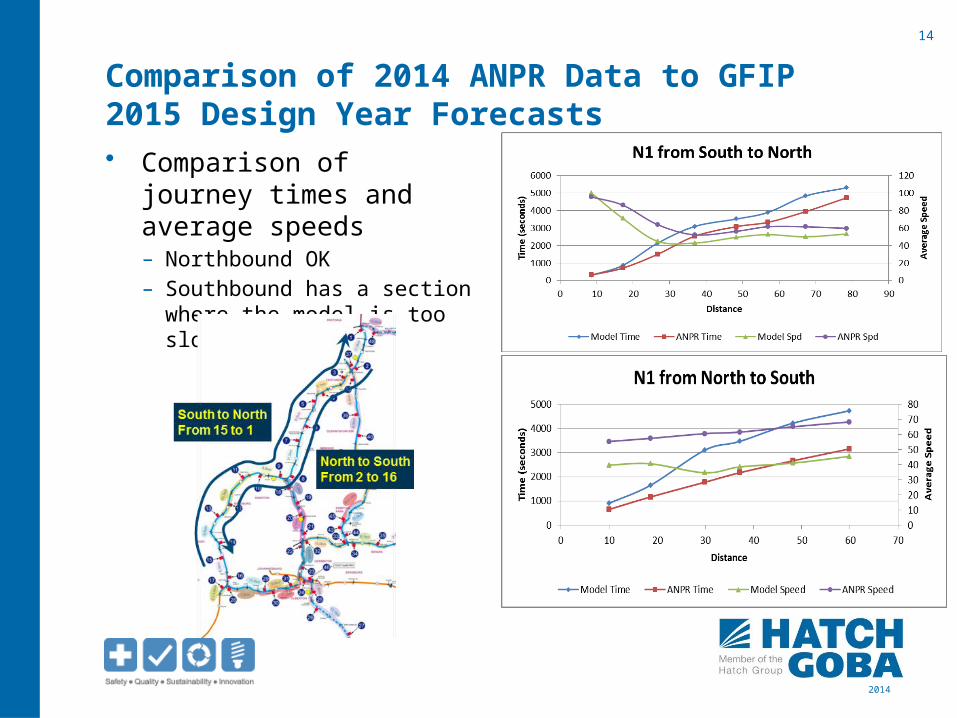
Comparison of 2014 ANPR Data to GFIP 2015 Design Year Forecasts• Comparison of journey
times and average speeds– Northbound OK– Southbound has a section
where the model is too slow

15
2014
Comparison of Gantry-to-Gantry Trips to Model’s OD Matrix SectorsComparison of Class A2 morning peak hour between:ANPR gantry-to-gantry counts and GFIP 2015 Model Forecasts

16
2014
Conclusions• ANPR data from toll gantries is comprehensive 98.9% sample
of classified traffic movements on a freeway system.• There are limitations associated to this data because it is
freeway focussed and does not relate to the complete trip.• At this point in time, we can use the data to validate various
aspects of a model.• We have devised a methodology to identify the cells in a
model’s OD matrix that corresponds to the ANPR gantry-to-gantry trip data.
• We have used this methodology to compare February 2014 data to the 2015 forecast derived from the 2006 GFIP traffic model
• Now that we are able to isolate OD matrix cells that correspond to ANPR data, we are working on the functionality to calibrate and OD matrix using this data.

17
2014
For more information, please visit www.hatch.ca