Alam, Sadaf Parametric Energy simulation in concept design ...
9
This is an electronic reprint of the original article. This reprint may differ from the original in pagination and typographic detail. Powered by TCPDF (www.tcpdf.org) This material is protected by copyright and other intellectual property rights, and duplication or sale of all or part of any of the repository collections is not permitted, except that material may be duplicated by you for your research use or educational purposes in electronic or print form. You must obtain permission for any other use. Electronic or print copies may not be offered, whether for sale or otherwise to anyone who is not an authorised user. Alam, Sadaf Parametric Energy simulation in concept design phase Published in: IOP Conference Series: Earth and Environmental Science DOI: 10.1088/1755-1315/238/1/012083 Published: 04/03/2019 Document Version Publisher's PDF, also known as Version of record Published under the following license: CC BY Please cite the original version: Alam, S. (2019). Parametric Energy simulation in concept design phase: A dynamic simulation case study. IOP Conference Series: Earth and Environmental Science, 238(1), [012083]. https://doi.org/10.1088/1755- 1315/238/1/012083
Transcript of Alam, Sadaf Parametric Energy simulation in concept design ...

This is an electronic reprint of the original article.This reprint may differ from the original in pagination and typographic detail.
Powered by TCPDF (www.tcpdf.org)
This material is protected by copyright and other intellectual property rights, and duplication or sale of all or part of any of the repository collections is not permitted, except that material may be duplicated by you for your research use or educational purposes in electronic or print form. You must obtain permission for any other use. Electronic or print copies may not be offered, whether for sale or otherwise to anyone who is not an authorised user.
Alam, SadafParametric Energy simulation in concept design phase
Published in:IOP Conference Series: Earth and Environmental Science
DOI:10.1088/1755-1315/238/1/012083
Published: 04/03/2019
Document VersionPublisher's PDF, also known as Version of record
Published under the following license:CC BY
Please cite the original version:Alam, S. (2019). Parametric Energy simulation in concept design phase: A dynamic simulation case study. IOPConference Series: Earth and Environmental Science, 238(1), [012083]. https://doi.org/10.1088/1755-1315/238/1/012083

IOP Conference Series: Earth and Environmental Science
PAPER • OPEN ACCESSParametric Energy simulation in concept design phase: A dynamicsimulation case studyTo cite this article: Sadaf Alam 2019 IOP Conf. Ser.: Earth Environ. Sci. 238 012083 View the article online for updates and enhancements.
This content was downloaded from IP address 130.233.216.72 on 16/04/2019 at 08:47

Content from this work may be used under the terms of the Creative Commons Attribution 3.0 licence. Any further distributionof this work must maintain attribution to the author(s) and the title of the work, journal citation and DOI.
Published under licence by IOP Publishing Ltd
ASIM 2018
IOP Conf. Series: Earth and Environmental Science 238 (2019) 012083
IOP Publishing
doi:10.1088/1755-1315/238/1/012083
1
Parametric Energy simulation in concept design phase: A
dynamic simulation case study
Sadaf Alam12
1 Department of Mechanical Engineering, School of Engineering, Aalto University,
Espoo, Finland 2 College of Engineering and Informatics, National University of Ireland Galway,
Galway, Ireland.
Email: [email protected]
Abstract. This paper presents a framework for the development of early-design guidance to
inform architects and policy-makers using parametric whole-building energy simulation. The
emphasis of the study was to identify and assess the benefit of energy efficiency alternatives
primarily focused on the building’s thermal envelope. The energy efficiency alternatives
included performance adjustments to the external glazing, wall, roof, floor properties. The
Result indicated the glazing selection should look to achieve the highest thermal resistance (R-
value) and best solar control (lowest shading co-efficient value) within budget. Ideally a solar
control low-e IGU system could be installed. Solar control glazing also reduced the required
development cooling capacity by ~17%.
1. Introduction
Emissions from burning fossil fuels are the primary cause of the rapid growth in atmospheric carbon
dioxide (CO2) [1] and natural gas and oil that are primarily used for heating and cooling as well as
electricity generation in buildings play an important role in CO2 emissions (U.S. Congress Office,
1992). Energy usage in buildings is responsible for approximately 33% of the total of final energy
consumption and an important source of energy-related CO2 emissions worldwide [2]. In OECD
countries, buildings cause about 30% of nationalCO2 emissions from the consumption of fossil fuels
[3]. One of the ways of improving energy sustainability is increasing energy efficiency in existing
buildings. However, investment costs for installing and/or replacing technologies with more efficient
ones can be seen by the building owners an obstacle to achieve improvements in energy consumption.
Consequently, this change affects both future CO2 emissions and future energy expenditures.
Therefore, the initial investment decision for the new technologies should be given by taking future
energy expenditure savings and reductions in CO2 emissions into account. This study is motivated by
the need to use an analytical approach to select the right energy efficiency measures for improving
energy efficiency in existing buildings with both environmental and financial considerations.
Designing energy efficient buildings with good indoor environment involves elements of expertise
deriving from multiple disciplines such as architects, civil, mechanical and electrical engineers. With
current emphasis on sustainability, including building energy and indoor environment, design
requirements from the involved disciplines have become more important in the early design stages [4].
Therefore, building performance simulations (BPSs) are increasingly used to design buildings in early
concept phase.
ASIM 2018
IOP Conf. Series: Earth and Environmental Science 238 (2019) 012083
IOP Publishing
doi:10.1088/1755-1315/238/1/012083
2
Studies have reported that energy savings of up to 30% can be achieved through retrofit options in
existing office and commercial buildings without compromising the indoor comfort [5] [6]. The
greatest potential for optimizing the energy efficiency of buildings is in the early design stages [7] [8]
[9] [10]
Early concept design study has been done in this paper. The emphasis of the study was to identify
and assess the benefit of energy efficiency alternatives primarily focused on the building’s thermal
envelope. Specialized building performance modelling software (IES-VE 2015) provided a platform
for the energy modelling process.
The proposed building geometry was translated into IES-VE to create a 3-dimesional model, other
modelling inputs into IES-VE included;
• lighting, equipment & occupancy gains,
• operating profiles,
• plant efficiencies,
• thermal performance of constructions A “Baseline” energy model was defined to an equivalent New Zealand Building Code (NZBC) H1
model and the baseline annual energy use calculated. Proposed energy efficiency alternatives were
assessed based on comparative performance to this baseline model.
The energy efficiency alternatives included performance adjustments to the external glazing, wall,
roof, floor properties.
2. Building and site information
The development included office Pods spread over three levels, a Gym and Café with a gross floor
area of approximately 5600 m2. Basement car parking provisions are also provided.
2.1. Building geometry
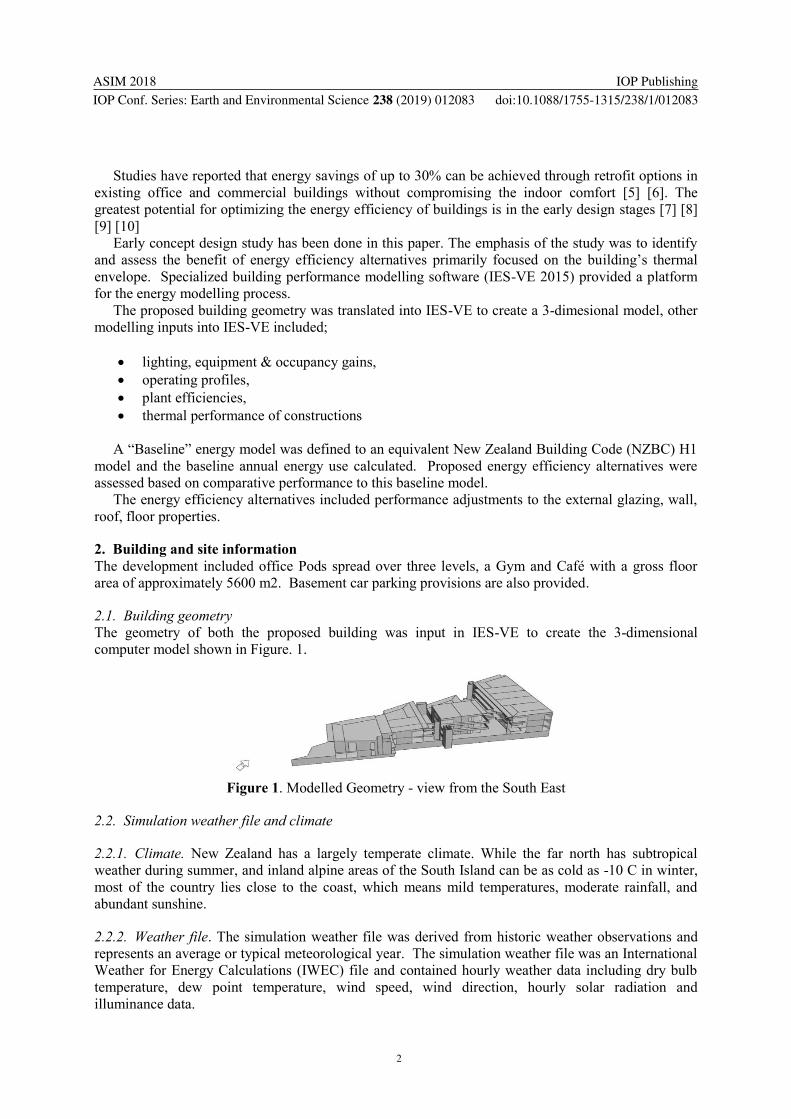
The geometry of both the proposed building was input in IES-VE to create the 3-dimensional
computer model shown in Figure. 1.
Figure 1. Modelled Geometry - view from the South East
2.2. Simulation weather file and climate
2.2.1. Climate. New Zealand has a largely temperate climate. While the far north has subtropical
weather during summer, and inland alpine areas of the South Island can be as cold as -10 C in winter,
most of the country lies close to the coast, which means mild temperatures, moderate rainfall, and
abundant sunshine.
2.2.2. Weather file. The simulation weather file was derived from historic weather observations and
represents an average or typical meteorological year. The simulation weather file was an International
Weather for Energy Calculations (IWEC) file and contained hourly weather data including dry bulb
temperature, dew point temperature, wind speed, wind direction, hourly solar radiation and
illuminance data.
ASIM 2018
IOP Conf. Series: Earth and Environmental Science 238 (2019) 012083
IOP Publishing
doi:10.1088/1755-1315/238/1/012083
3
3. Baseline energy model
The baseline thermal envelope performance figures Table 1 and Table 2 are based on the climate zone
one requirements as defined by the NZBC H1 clause.
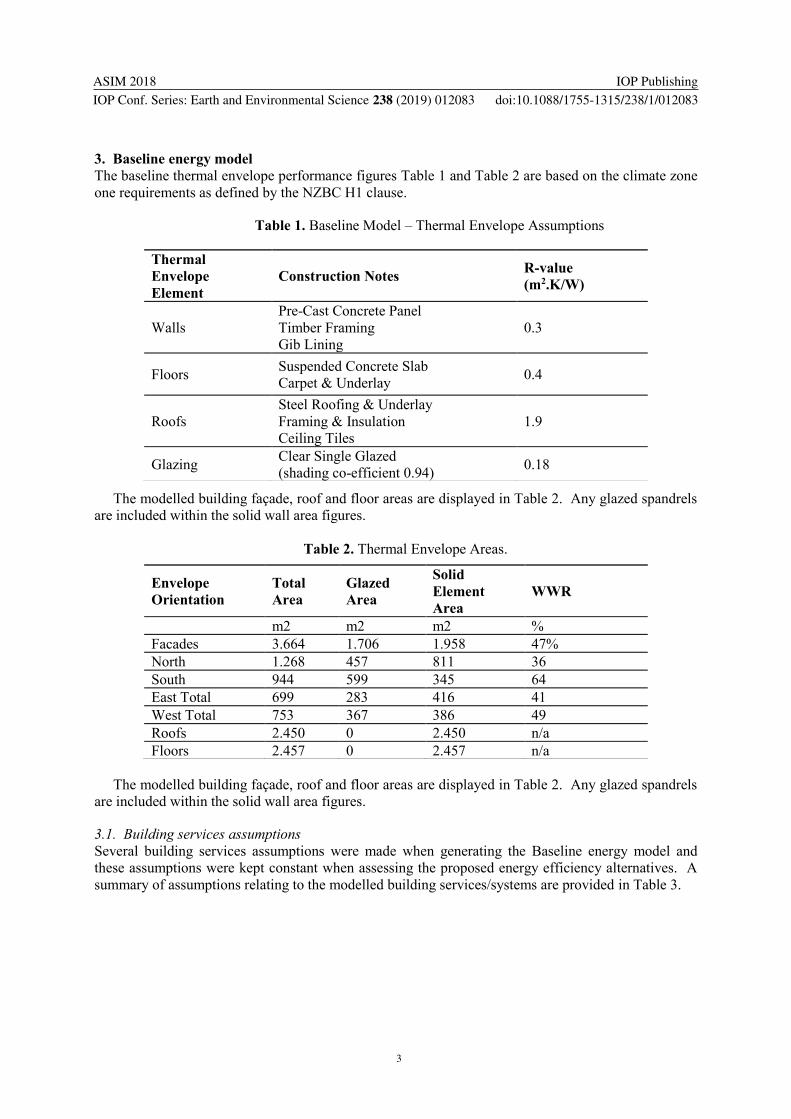
Table 1. Baseline Model – Thermal Envelope Assumptions
The modelled building façade, roof and floor areas are displayed in Table 2. Any glazed spandrels
are included within the solid wall area figures.
Table 2. Thermal Envelope Areas.
The modelled building façade, roof and floor areas are displayed in Table 2. Any glazed spandrels
are included within the solid wall area figures.
3.1. Building services assumptions
Several building services assumptions were made when generating the Baseline energy model and
these assumptions were kept constant when assessing the proposed energy efficiency alternatives. A
summary of assumptions relating to the modelled building services/systems are provided in Table 3.
Thermal
Envelope
Element
Construction Notes R-value
(m2.K/W)
Walls
Pre-Cast Concrete Panel
Timber Framing
Gib Lining
0.3
Floors Suspended Concrete Slab
Carpet & Underlay 0.4
Roofs
Steel Roofing & Underlay
Framing & Insulation
Ceiling Tiles
1.9
Glazing Clear Single Glazed
(shading co-efficient 0.94) 0.18
Envelope
Orientation
Total
Area
Glazed
Area
Solid
Element
Area
WWR
m2 m2 m2 %
Facades 3.664 1.706 1.958 47%
North 1.268 457 811 36
South 944 599 345 64
East Total 699 283 416 41
West Total 753 367 386 49
Roofs 2.450 0 2.450 n/a
Floors 2.457 0 2.457 n/a

ASIM 2018
IOP Conf. Series: Earth and Environmental Science 238 (2019) 012083
IOP Publishing
doi:10.1088/1755-1315/238/1/012083
4
Table 3. Building Services Assumptions
Building Service Performance
Temperature
Set-Points
Heating 21°C
Cooling 22°C
Heating Source Electric heat pump with an average COP of 3
Cooling Source Electric heat pump with an average Energy Efficiency
Rating of 2.5
Outdoor Air
Ventilation
Constant Volume System
1.5l/s/m2 outdoor air to office areas
Specific Fan Power (SFP) 1.8 W/l/s
Toilet & General Extract
Fans
0.5l/s/m2 total extract air flow rate
SFP 0.6 W/l/s,
FCU Fans Supply Air Flow Rate based of a Delta T 10°C
SFP 0.9 W/l/s
Operating Profiles
Adapted ASHRAE office profiles with plant operating
for one late night per week refer to Error! Reference
source not found. for details.
Occupancy 10m2/person
Lighting Power Density
Office – 8W/m2
Circulation – 10 W/m2
Toilets – 10 W/m2
Equipment Gains Office – 12W/m2
Domestic Hot Water
Standard WELLS 2-Star flow rate fitting installed,
DHW/Cold Water Ration 50%
System Efficiency 80%
Fuel Costs Electricity – 20c/kWh
Given the large number of small business pods and that each pod had a separate title it was very
likely small dedicated HVAC systems would be installed for each pod. Baseline Model 1A reflects
this assumption where each pod was modelled with an efficient heat pump system providing both
space heating and cooling.
Given the efficient space heating & cooling system of Baseline Model 1A, achieving the energy
savings target was more difficult when compared to a more traditional chilled water system with
electric heating elements.
3.2. Annual energy use (Baseline1A)
The SIM 01a baseline model was calculated to have an annual energy consumption of 140 KWh/m2
across the Gross Floor Area (GFA). The annual energy consumption by end use for the baseline
model is displayed in Figure. 2 with percentages.

ASIM 2018
IOP Conf. Series: Earth and Environmental Science 238 (2019) 012083
IOP Publishing
doi:10.1088/1755-1315/238/1/012083
5
Figure 2. Baseline 1A Model – Energy End Use (% of total annual energy use)
The energy end use categories which are directly influenced by the performance of the building
thermal envelope (space heating systems, space cooling systems and indoor FCU fans) accounts for
approximately 43% (61.0 KWhm2/yr) of the baseline annual energy use. The remaining energy end
use categories account for 57% of annual energy use and are not directly influenced by the
performance of the thermal envelope.
3.3. Energy efficiency alternatives
An indicative square meter cost for each energy efficiency alternative was obtained from product
suppliers, the glazing and opaque construction alternatives are displayed in Table 4 and 5 respectively.
The indicative per square meter costs were multiplied by the relevant construction areas and a total
cost was estimated for each energy efficiency alternative.
Table 4. Thermal Envelope - Glazing Variations
Space …
Space Cooling
18%
Indoor …
Central Supply …Plumbin…
L…
Lighting22%
Office Equipment
20%
Modelled Glass Glass description Glazing performance
R value
m2.K/W SC
Glass 1 Clear Single Glazed (NZBC) 0.18 0.94
Glass 2 Clear IGU 0.35 0.80
Glass 3 Solar Control IGU 0.34 0.33
Glass 4 Solar Control & Low-e IGU 0.51 0.30
ASIM 2018
IOP Conf. Series: Earth and Environmental Science 238 (2019) 012083
IOP Publishing
doi:10.1088/1755-1315/238/1/012083
6
Table 5. Thermal Envelope – Opaque Construction Variations & Costs Modelled constructions and insulation
products R-values
Construction
references
Wall Variations
NZBCWall Construction 0.30 Wall (NZBC)
90mm Pink® Batts® R1.8 Wall 2.00 Wall Type 1
Roof Variations
NZBC Roof Construction 2.10 Roof (NZBC)
140mm Pink® Batts® Classic R2.6 2.92 Roof Type 1
180mm Pink® Batts® Classic R3.6 3.48 Roof Type 2
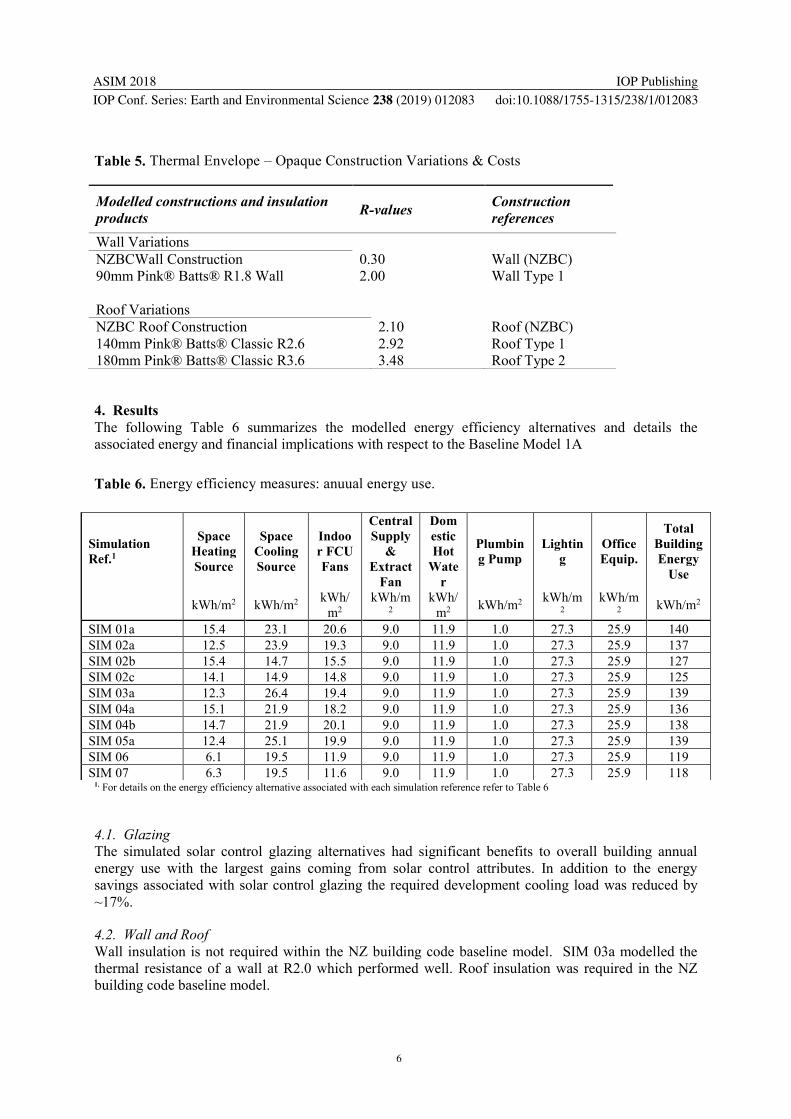
4. Results
The following Table 6 summarizes the modelled energy efficiency alternatives and details the
associated energy and financial implications with respect to the Baseline Model 1A
Table 6. Energy efficiency measures: anuual energy use.
1. For details on the energy efficiency alternative associated with each simulation reference refer to Table 6
4.1. Glazing
The simulated solar control glazing alternatives had significant benefits to overall building annual
energy use with the largest gains coming from solar control attributes. In addition to the energy
savings associated with solar control glazing the required development cooling load was reduced by
~17%.
4.2. Wall and Roof
Wall insulation is not required within the NZ building code baseline model. SIM 03a modelled the
thermal resistance of a wall at R2.0 which performed well. Roof insulation was required in the NZ
building code baseline model.
Simulation Ref.1 Space Heating Source
Space Cooling Source Indoor FCU Fans
Central Supply & Extract Fan
Domestic Hot Water Plumbing Pump Lighting Office Equip.
Total Building Energy Use kWh/m2 kWh/m2 kWh/m2 kWh/m2 kWh/m2 kWh/m2 kWh/m2 kWh/m2 kWh/m2 SIM 01a 15.4 23.1 20.6 9.0 11.9 1.0 27.3 25.9 140 SIM 02a 12.5 23.9 19.3 9.0 11.9 1.0 27.3 25.9 137 SIM 02b 15.4 14.7 15.5 9.0 11.9 1.0 27.3 25.9 127 SIM 02c 14.1 14.9 14.8 9.0 11.9 1.0 27.3 25.9 125 SIM 03a 12.3 26.4 19.4 9.0 11.9 1.0 27.3 25.9 139 SIM 04a 15.1 21.9 18.2 9.0 11.9 1.0 27.3 25.9 136 SIM 04b 14.7 21.9 20.1 9.0 11.9 1.0 27.3 25.9 138 SIM 05a 12.4 25.1 19.9 9.0 11.9 1.0 27.3 25.9 139 SIM 06 6.1 19.5 11.9 9.0 11.9 1.0 27.3 25.9 119 SIM 07 6.3 19.5 11.6 9.0 11.9 1.0 27.3 25.9 118
ASIM 2018
IOP Conf. Series: Earth and Environmental Science 238 (2019) 012083
IOP Publishing
doi:10.1088/1755-1315/238/1/012083
7
4.3. Combination of energy efficiency measures
The modelled SIM 05 which was a combination of the below energy efficiency alternatives provided
energy saving of approximately 21.0 kWh/m2/yr
• SIM02c - Solar control low-e IGU,
• SIM3a - R2.0 wall insulation
• SIM04b- High performance roof insulation R3.5 (R3.6 batts 200mm deep)
The required development heating and cooling capacity for SIM 05 were both reduced by 34% and
28% respectively when compared to the Baseline Model 1A requirements.
5. Conclusion
The glazing selection should look to achieve the highest thermal resistance (R-value) and best solar
control (lowest shading co-efficient value) within budget. Ideally a solar control low-e IGU system
could be installed. The developed models in this paper provide an opportunity for MEP designers,
owners, and facility managers to estimate energy consumption of the commercial office buildings at
the earliest phase of the construction projects. It enables them to select energy consumption measures
according to the goal of the project for saving energy.
References
[1] Canadel l JG,Quere CL, Raupach MR, Field CB ,Buitenhuis ET, Ciais P,etal.
2007. Contributions to accelerating atmospheric CO2 growth from economic activity, carbon
intensity, and efficiency of natural sinks: Proc Natl Acad Sci; 10 (47):18866–70.
[2] U.S. Congress Office of Technology AssessmentBuilding energy efficiency. 1992.
Technical Report OTA-E-518, U.S.Congress Office of Technology Assessment, U.S.
Government Printing Office, Washington, DC.
[3] Urge-Vorsatz D, Harvey LDD, Mirasgedis S,Levine MD. MitigatingCO2 emissions
from energy use in the world's buildings Build Res Inf 2007; 35 (4):379–98.
[4] IEA (2013), Transition to Sustainable Buildings:Strategies and Opportunities to 2050,
IEA,Paris. http://dx.doi.org/10.1787/9789264202955en.
[5] Cheung, F.K.T. et al., 2012. Early stage multi-level cost estimation for schematic BIM models.
Automation in Construction, 27, pp.67–77. Available at:
http://dx.doi.org/10.1016/j.autcon.2012.05.008.
[6] Chung, W., Hui, Y. V. & Lam, Y.M., 2006. Benchmarking the energy efficiency of commercial
buildings. Applied Energy, 83(1), pp.1–14.
[7] Ferreira, M., Almeida, M. & Rodrigues, A., 2016. Cost-optimal energy efficiency levels are the
first step in achieving cost effective renovation in residential buildings with a nearly-zero energy
target. Energy and Buildings, 133(November 2014), pp.724–737. Available at:
http://dx.doi.org/10.1016/j.enbuild.2016.10.017. [8] Negendahl, K., 2015. Building performance simulation in the early design stage: An introduction to integrated dynamic models. Automation in Construction, 54, pp.39–53. Available at: http://dx.doi.org/10.1016/j.autcon.2015.03.002. [9] Poirazis, H., Blomsterberg, Å. & Wall, M., 2008. Energy simulations for glazed office buildings in Sweden. Energy and Buildings, 40(7), pp.1161–1170. [10] Zangheri, P. et al., 2017. Identification of cost-optimal and NZEB refurbishment levels for
representative climates and building typologies across Europe. Energy Efficiency, pp.1–33. 6. Acknowledgment
I would like to express my gratitude to the SEEC pvt lt and GreenTree pvt ltd. for providing me the
opportunity to work on this project.


![Sadaf [autosaved]](https://static.fdocuments.in/doc/165x107/5565ab27d8b42a4c6f8b48a2/sadaf-autosaved.jpg)