Al-Barrak
24
BUSINESS OPPORUNITIES IN SAUDI POWER SECTOR US-Saudi BUSINESS OPPORTUNITIES FORUM CHICAGO April 28-29, 2010 Ali Albarrak President &C E O Saudi Electricity Company
-
Upload
mohamad5357 -
Category
Documents
-
view
216 -
download
0
Transcript of Al-Barrak

7/29/2019 Al-Barrak
http://slidepdf.com/reader/full/al-barrak 1/24
BUSINESS OPPORUNITIES
IN SAUDI POWER SECTOR
US-SaudiBUSINESS OPPORTUNITIES FORUM
CHICAGO April 28-29, 2010
Ali Albarrak
President &C E O
Saudi Electricity Company

7/29/2019 Al-Barrak
http://slidepdf.com/reader/full/al-barrak 2/24
Electricity Industry in Saudi Arabia Starts as 100%private ownership and operation.
Late 70`S consolidated into four major power co
(SCECO).
The government involved as major shareholder .
Mid 2000 All operating entities merged in one company
Saudi Electricity Company (SEC).

7/29/2019 Al-Barrak
http://slidepdf.com/reader/full/al-barrak 3/24
Incorporated from 10 operating utilities in 2000.
Largest electric entity in the region in terms of capacity ,market capital and shareholder’s equity.
Owns 85% generation and 100% transmission ,distribution and retail .
Total assets over 50 billion US$.
Annual revenues 6 Billion US$ .
Annual growth 6%.
74% directly owned by the Government.
SAUDI ELECTRICITY COMPANY

7/29/2019 Al-Barrak
http://slidepdf.com/reader/full/al-barrak 4/24
Scope of Operations

7/29/2019 Al-Barrak
http://slidepdf.com/reader/full/al-barrak 5/24
High growth in demand ( 7- 8%).
Operate in a very supportive environment .
High credit rating (AA~ ).
Invest in productive assets.
Reliable and secured fuel supply.
government support.
SEC credit strength
7/29/2019 Al-Barrak
http://slidepdf.com/reader/full/al-barrak 6/24
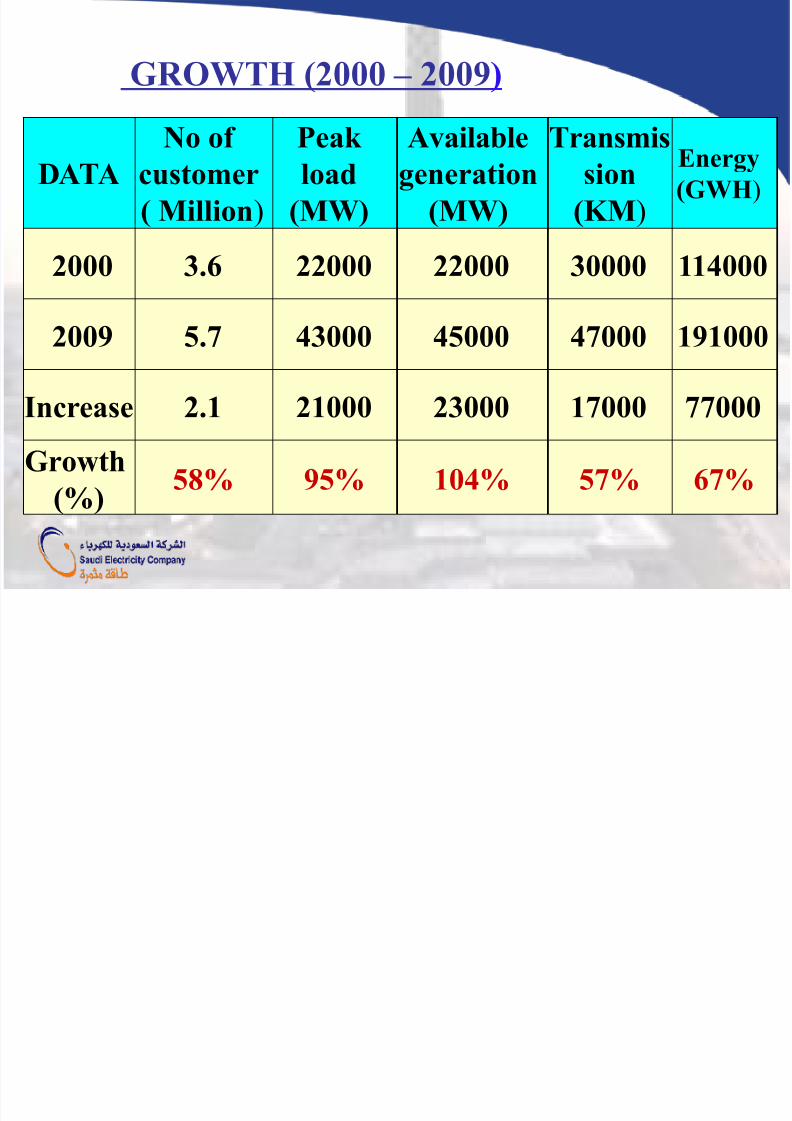
DATANo of
customer
( Million)
Peak load
(MW)
Availablegeneration
(MW)
Transmission
(KM)
Energy
(GWH)
2000 3.6 22000 22000 30000 114000
2009 5.7 43000 45000 47000 191000
Increase 2.1 21000 23000 17000 77000
Growth
(%)58% 95% 104% 57% 67%
)2009 – 2000GROWTH (

7/29/2019 Al-Barrak
http://slidepdf.com/reader/full/al-barrak 7/24
ACTIVITIES No of ProjectsCOST
( billion $)
GENERATION 174 17.3
TRANSMISSION 291 9.3
DISTRIBUTION 176 2.1
TOTALS 641 28.7
projects Under Execution

7/29/2019 Al-Barrak
http://slidepdf.com/reader/full/al-barrak 8/24
Load forecast (gwatts)68.4
65.3
62.6
59.957.4
54.952.5
50.1
46.944
41
38.1
35.2
32.5
30.5
28.227
24.423.7
10
16
22
28
34
40
46
52
58
64
70
2 0 0 1
2 0 0 2
2 0 0 3
2 0 0 4
2 0 0 5
2 0 0 6
2 0 0 7
2 0 0 8
2 0 0 9
2 0 1 0
2 0 1 1
2 0 1 2
2 0 1 3
2 0 1 4
2 0 1 5
2 0 1 6
2 0 1 7
2 0 1 8
2 0 1 9
Series1
1.5
6.0%
2.6
7.8%
2.8
6.0%
2.7
4.5%
7/29/2019 Al-Barrak
http://slidepdf.com/reader/full/al-barrak 9/24
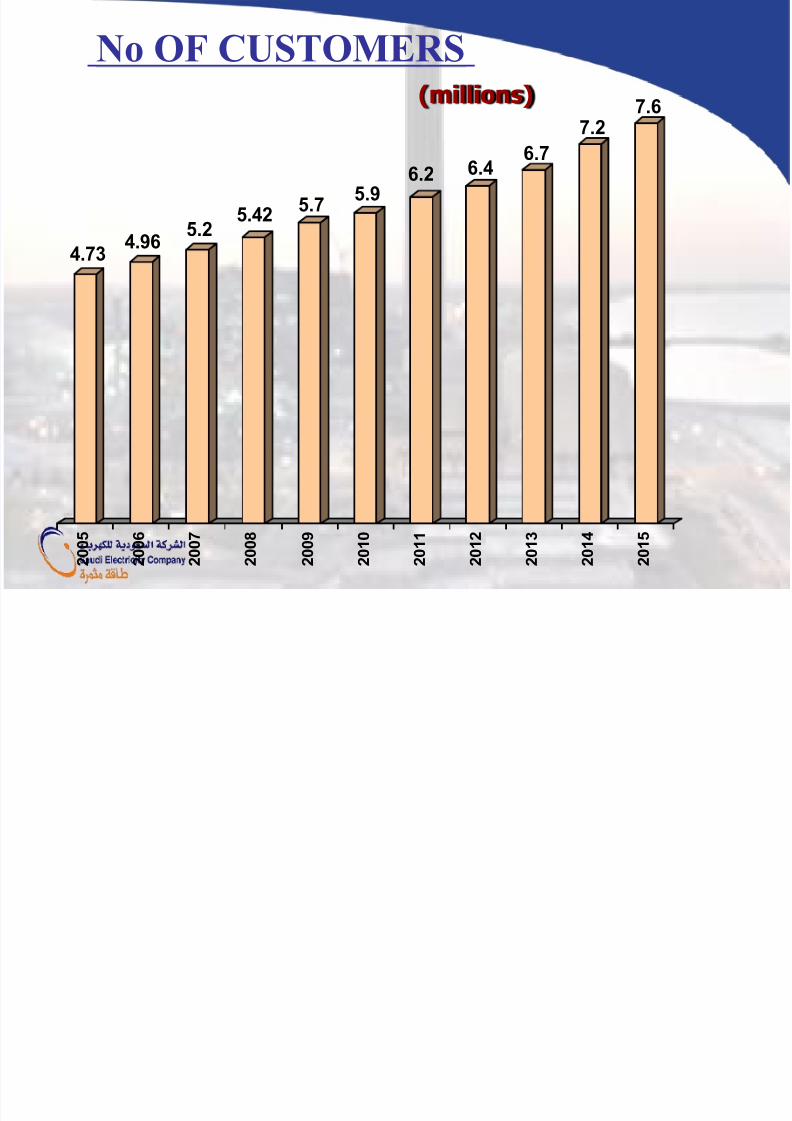
4.734.96
5.25.42
5.75.9
6.2 6.46.7
7.2
7.6
2 0
0 5
2 0
0 6
2 0
0 7
2 0
0 8
2 0
0 9
2 0
1 0
2 0
1 1
2 0
1 2
2 0
1 3
2 0
1 4
2 0
1 5
No OF CUSTOMERS(millions)

7/29/2019 Al-Barrak
http://slidepdf.com/reader/full/al-barrak 10/24
Generation Capacity
generation capacity installed should meet the expected7% increase in peak demand and a reserve margin.
90
74
59
41
0
10000
20000
30000
40000
50000
60000
70000
80000
90000
100000
2006e 2007e 2008e 2009e 2010e 2011e 2012e 2013e 2014e 2015e 2016e 2017e 2018e 2019e 2020e 2021e 2022e 2023e
SEC Installed & new capacity IWPP Installed capacity IPP Installed capacity SWCC Installed capacity Peak Load total capacity
Generation capacity (GW)
7/29/2019 Al-Barrak
http://slidepdf.com/reader/full/al-barrak 11/24
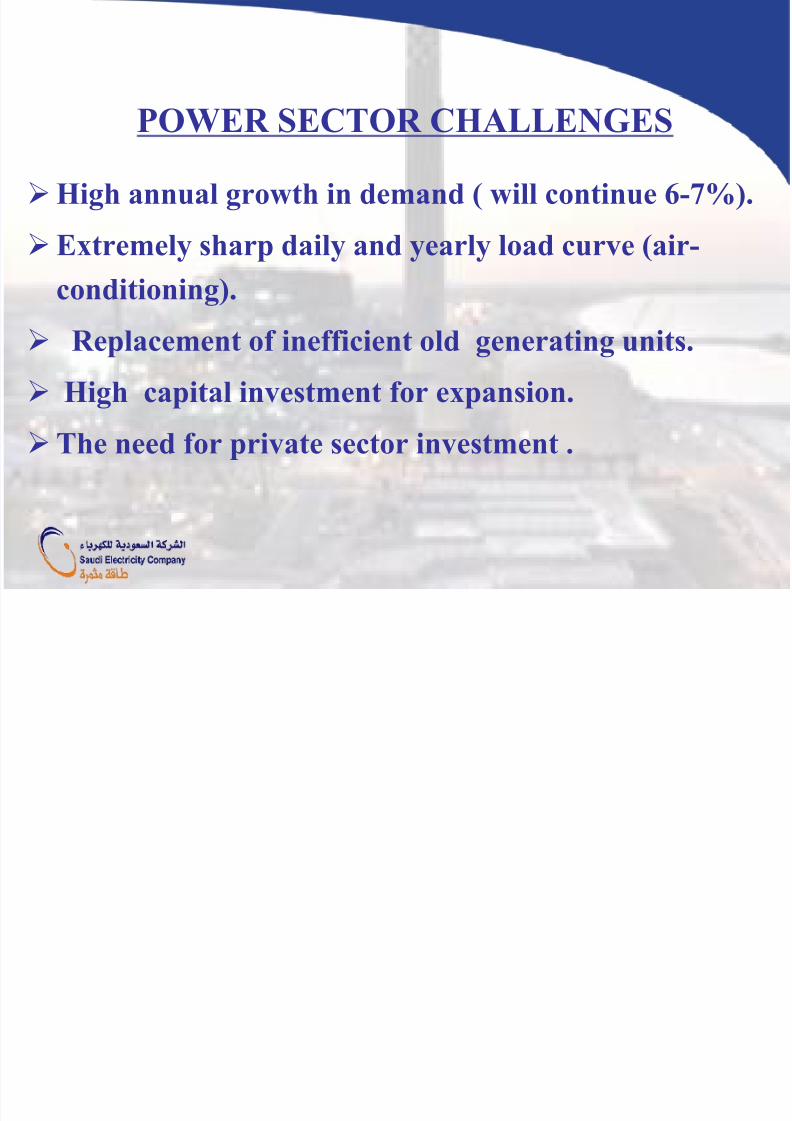
POWER SECTOR CHALLENGES
High annual growth in demand ( will continue 6-7%).
Extremely sharp daily and yearly load curve (air-
conditioning).
Replacement of inefficient old generating units.
High capital investment for expansion.
The need for private sector investment .

7/29/2019 Al-Barrak
http://slidepdf.com/reader/full/al-barrak 12/24
HOW TO MEET THE CHALLENGES ?
More investment in power generation,T&D .
Encourage the developers for more IPP.
Introduce the smart grid transmission system.
Promote energy conservation and load
management.
Invest in renewable energy.
7/29/2019 Al-Barrak
http://slidepdf.com/reader/full/al-barrak 13/24
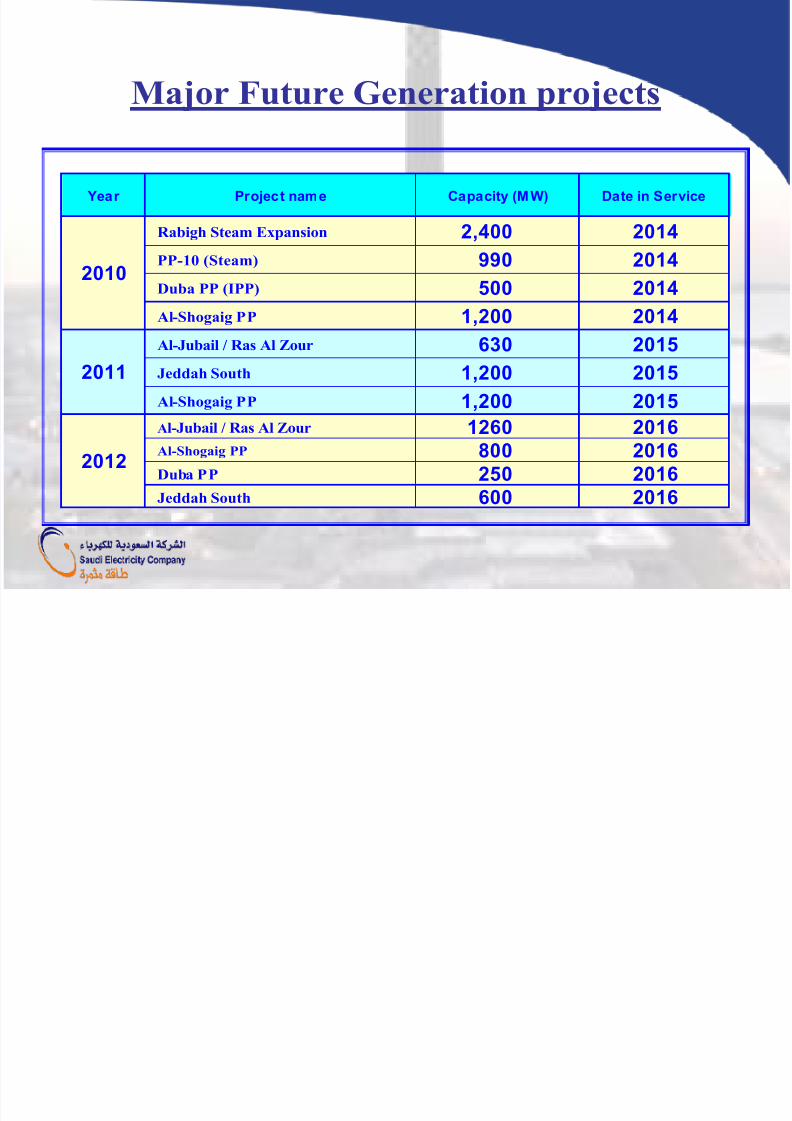
Year Project name Capacity (MW) Date in Service
Rabigh Steam Expansion 2,400 2014
PP-10 (Steam) 990 2014
Duba PP (IPP) 500 2014
Al-Shogaig PP 1,200 2014
Al-Jubail / Ras Al Zour 630 2015
Jeddah South 1,200 2015
Al-Shogaig PP 1,200 2015
Al-Jubail / Ras Al Zour 1260 2016Al-Shogaig PP 800 2016Duba PP 250 2016Jeddah South 600 2016
Major Future Generation projects
2010
2011
2012

7/29/2019 Al-Barrak
http://slidepdf.com/reader/full/al-barrak 14/24
Year Project Capacity (MW) Date in Service
Al-Jubail / Ras Al Zour 630 2017Al-Ogair / Salwa PP 630 2017Jeddah South 600 2016Al-Ogair / Salwa PP 1260 2017Jeddah South 600 2018Al-Ogair / Salwa PP 630 2018Al-Shogaig PP 400 2017Al-Ogair / Salwa PP 1,260 2019Al-Shogaig PP 400 2018
2016 Al-Jubail / Ras Al Zour 1,260 2020
total capacity: 25000 MW capital Cost : 50 Bln US$
Major Future Generation projects
2013
2014
2015

7/29/2019 Al-Barrak
http://slidepdf.com/reader/full/al-barrak 15/24
IPP PROGRAM IN SEC
SEC will Continue to encourage private investors
to invest in Future Generation projects .
30 – 40 % of Future generation will be IPP(BOO).
SEC partnership will be 10%-50% in the equity.
Long term power purchase agreements (20years)
With reasonable return on investment .

7/29/2019 Al-Barrak
http://slidepdf.com/reader/full/al-barrak 16/24
WHY IPP?
Providing Financial Option for Highly Capital
Intensive Generation Projects .
Helping To Re-Direct Available Funds To T&D
(Monopoly Activities)
Reallocation Expenditure From CAPEX To OPEX.
Avoiding Mismatch Between Medium TermFinancing and Long Life PP Projects.

7/29/2019 Al-Barrak
http://slidepdf.com/reader/full/al-barrak 17/24
SUCCESSFUL IPP ROJECTS
Two IPP Projects in process:
1. Rabigh Power Plant (closed financialyJuly last yea)• 1200 MW / HFO
• IPCOD APRIL 2012
• Investment US$ 2.4 billions
2. Riyadh Power Plant 11 (financial close next month)• 1800 MW / GAS
•
IPCOD APRIL 2013• INVESTMENT US 1.5 billions.

7/29/2019 Al-Barrak
http://slidepdf.com/reader/full/al-barrak 18/24
18
IPP FUTURE OPPORTUNITIES
NAME OF IPP
PROJECT
CAPACITY
(GW)
PRIVATE
SECTOR SHARE %
PROJECT
COMPLETION
QURAYYAH 2 80 2014
DHEBA 1.6 80 2015
SHUQAIQ 1.6 80 2015
ALOGAIR 2.4 80 2016
JEDDAH
SOUTH2.4 80 2017
RAS ALZOUR 2.4 80 2019
(INVESTMENTS OF $20B) TO BUILD 12 GW

7/29/2019 Al-Barrak
http://slidepdf.com/reader/full/al-barrak 19/24
2018SAUDI NATIONAL GRID by

7/29/2019 Al-Barrak
http://slidepdf.com/reader/full/al-barrak 20/24
Year Project Length KM Date in Serv ice
HAIL-ALJOUF-380KV 300 2014
ASIR_NAJRAN 380KV 400 2014GAISOUMAH -ALFADLI 380 KV 250 2014
BISHA_DAWASIR 380KV 500 2015
5th 380 KV LINE TO CENTRAK 400 2015
MADINAH-HAIL 360 2015
RIYADH-JEDDAH DC line 800 2016TABUK-TABARGAL 600 2016WEAST _SAUTH 2ND LINE 500 2016
Future 380KV transmission lines projects
2010
2011
2012

7/29/2019 Al-Barrak
http://slidepdf.com/reader/full/al-barrak 21/24
Year Project Circuit Length KM
Tabuk-Tabarjal 300Umluj-Wadjh 250South-West 2nd line 500Jouf-Tabarjal 150
2015 Al-grayat- Tabarjal 200
2016 Madinah-Tabuk DCLine 800
total capital cost 24 billion $.
Future 380KV transmission line
2013
2014

7/29/2019 Al-Barrak
http://slidepdf.com/reader/full/al-barrak 22/24
BUSINESS OPPORTUNITIES
Material and Equipment supply.
As an EPC contractor .
Local manufacturing .Participate in IPP projects .
Opportunity in consultation and
engineering.
Invest in future energy retail.
7/29/2019 Al-Barrak
http://slidepdf.com/reader/full/al-barrak 23/24
The growth of electrical energy demand in SaudiArabia will continue 6-7%.
Power projects needs 80-90 billion US$ as capitalinvestments for the next 10 years .
Private investors have the opportunity to take 30-40% of the generation projects as a BOO projects.
US companies have the opportunity to take part
both in EPC and IPP.There are oportunities in Consultation ,
Engineering and Services in power sector.
Conclusion

7/29/2019 Al-Barrak
http://slidepdf.com/reader/full/al-barrak 24/24


![BESPOKE MANUFACTURE & INDUSTRIAL PROTOTYPES · gold. Bespoke natural wood Wall lamp Design : Nacho Timón [2017] AL BARRAK LUXURY VILLA QATAR [2016] Design : Minimal Custom Studio.](https://static.fdocuments.in/doc/165x107/6034235af417a72a4e0a3d0a/bespoke-manufacture-industrial-gold-bespoke-natural-wood-wall-lamp-design.jpg)