Akuntansi Biaya - Mercu Buana UniversitySim+... · Modul ke:02 Fakultas Program ... Break-even and...
17
Modul ke: Fakultas Program Studi Akuntansi Biaya Cost Behavior Analysis Suryadharma Sim, SE, M. Ak 02 Ekonomi dan Bisnis S1 Manajemen
Transcript of Akuntansi Biaya - Mercu Buana UniversitySim+... · Modul ke:02 Fakultas Program ... Break-even and...

Modul ke:
Fakultas
Program Studi
Akuntansi Biaya Cost Behavior Analysis
Suryadharma Sim, SE, M. Ak
02 Ekonomi dan
Bisnis
S1 Manajemen
Cost Behavior Analysis
Classifying Costs
Success in planning and controlling cost depends on a thorough
understanding of the relationship between the incurrence of cost
and business activity. Careful study and analysis of the effect of
business activities on costs generally will result in the
classification of each type of expenditure as a fixed, variable, or
semi variable cost.

Cost Behavior Analysis
Fixed Cost
A fixed cost is defined as one that does not change in total as business activity
increases or decreases. Although some kinds of costs have the appearance of being
fixed, all costs are variable in the long run. If all business activity decreases to zero
and there is no prospect for an increase, a firm will liquidate and avoid all costs. If
activity is expected to increase beyond the capacity of current facilities, fixed costs
must be increased to handle the expected increase in volume. For example, factory
overhead includes items such as supervision, depreciation, rent, property insurance,
and property taxes-all generally considered fixed costs. If management expects
demand for the company’s products to increase beyond present capacity, it may
acquire additional plant, equipment, indirect labor, and possibly supervisors to
produce the level of output necessary to meet demand. Such additions increase the
level of expenditure for each of these items of factory overhead.

Cost Behavior Analysis
Total Fixed Cost $30,000 $30,000 $30,000
÷ Units Produced 5,000 10,000 15,000
Fixed Cost per Unit $6.00 $3.00 $2.00
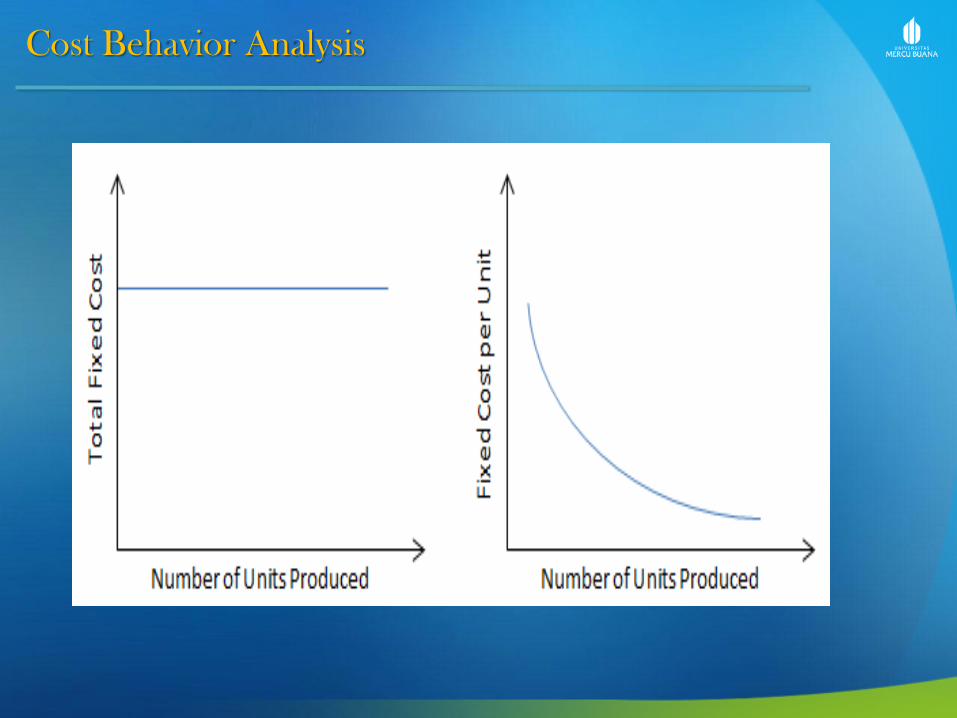
Fixed costs are those which do not change with the level of activity
within the relevant range. These costs will incur even if no units are
produced. For example rent expense, straight-line depreciation
expense, etc.
Fixed cost per unit decreases with increase in production. Following
example explains this fact:
Cost Behavior Analysis

Cost Behavior Analysis
Variable Cost
A variable cost is defined as one that increases in total proportionately with an
increase in activity and decreases proportionately with a decrease in activity.
Variable costs include the cost of direct materials, direct labor, some supplies,
some indirect labor, small tools, rework, and normal spoilage. Variable costs
usually can be directly identified with the activity that causes the cost.
In practice, the relationship between a business activity and the related
variable cost usually is treated as if it were linear; that is, total variable cost is
assumed to increase by a constant amount for each unit increase in activity.

Cost Behavior Analysis
Total Variable Cost $10,000 $20,000 $30,000
÷ Units Produced 5,000 10,000 15,000
Variable Cost per Unit $2.00 $2.00 $2.00
Variable costs change in direct proportion to the level of
production. This means that total variable cost increase when
more units are produced and decreases when less units are
produced. Although variable in total, these costs are constant
per unit. For example explains this fact:

Cost Behavior Analysis

Cost Behavior Analysis
Semivariable Cost
A semivariable cost is defined as one that displays both fixed and variable
characteristics. Examples include the cost of electricity, water, gas, fuel oil,
coal, some supplies, maintenance, some indirect labor, employee group-term
life insurance, pension cost, payroll taxes, and travel and entertainment.
Mixed costs or semi-variable costs have properties of both fixed and variable
costs due to presence of both variable and fixed components in them. An
example of mixed cost is telephone expense because it usually consists of a
fixed component such as line rent and fixed subscription charges as well as
variable cost charged per minute cost. Another example of mixed cost is
delivery cost which has a fixed component of depreciation cost of trucks and a
variable component of fuel expense.
Cost Behavior Analysis
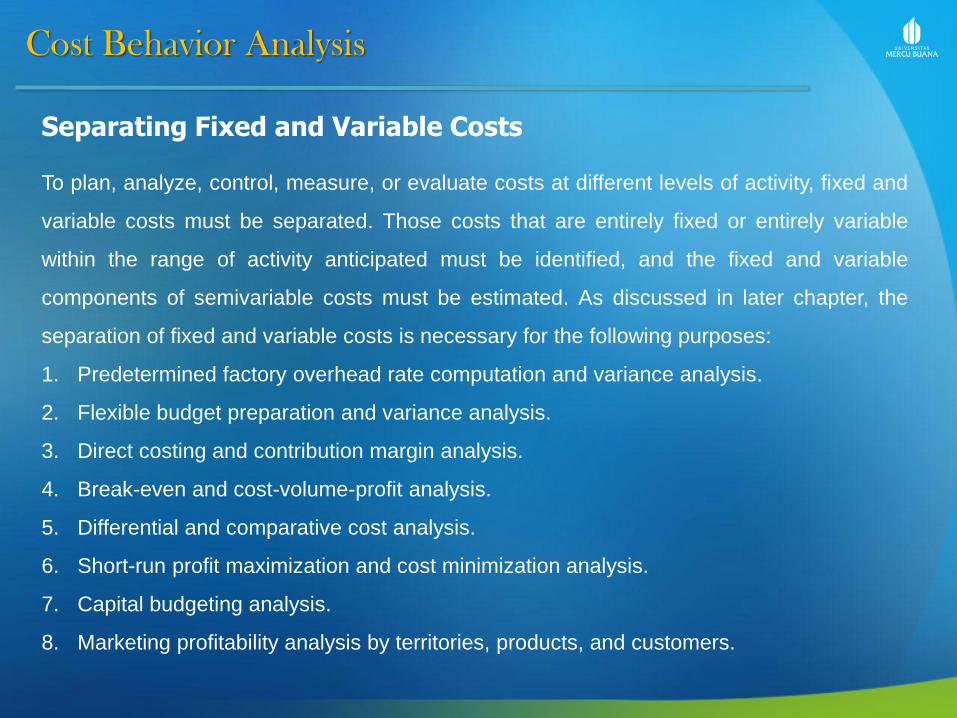
Separating Fixed and Variable Costs
To plan, analyze, control, measure, or evaluate costs at different levels of activity, fixed and
variable costs must be separated. Those costs that are entirely fixed or entirely variable
within the range of activity anticipated must be identified, and the fixed and variable
components of semivariable costs must be estimated. As discussed in later chapter, the
separation of fixed and variable costs is necessary for the following purposes:
1. Predetermined factory overhead rate computation and variance analysis.
2. Flexible budget preparation and variance analysis.
3. Direct costing and contribution margin analysis.
4. Break-even and cost-volume-profit analysis.
5. Differential and comparative cost analysis.
6. Short-run profit maximization and cost minimization analysis.
7. Capital budgeting analysis.
8. Marketing profitability analysis by territories, products, and customers.

Cost Behavior Analysis
In practice, managerial judgment often is used to classify costs as fixed or variable.
In such cases, classification is based on the personal experience of management.
Although such an approach is expedient, it often results in unreliable estimates of
cost. The behavior of a particular type of cost is not always readily apparent from
casual observation. Furthermore, managers often attempt to simplify the process
by classifying each cost as either entirely fixed or entirely variable, thereby ignoring
the fact that some costs are semivariable. Generally, more reliable classifications
and cost estimates are obtained by using one of the following computational
methods, all of which are illustrated in this section: (1) the high and low points
method, (2) the scattergraph method, or (3) the method of least squares. These
methods are used not only to estimates the fixed and variable components of
semivariable costs, but also to determine whether a cost is entirely fixed or entirely
variable within the relevant the relevant range of activity.
Cost Behavior Analysis
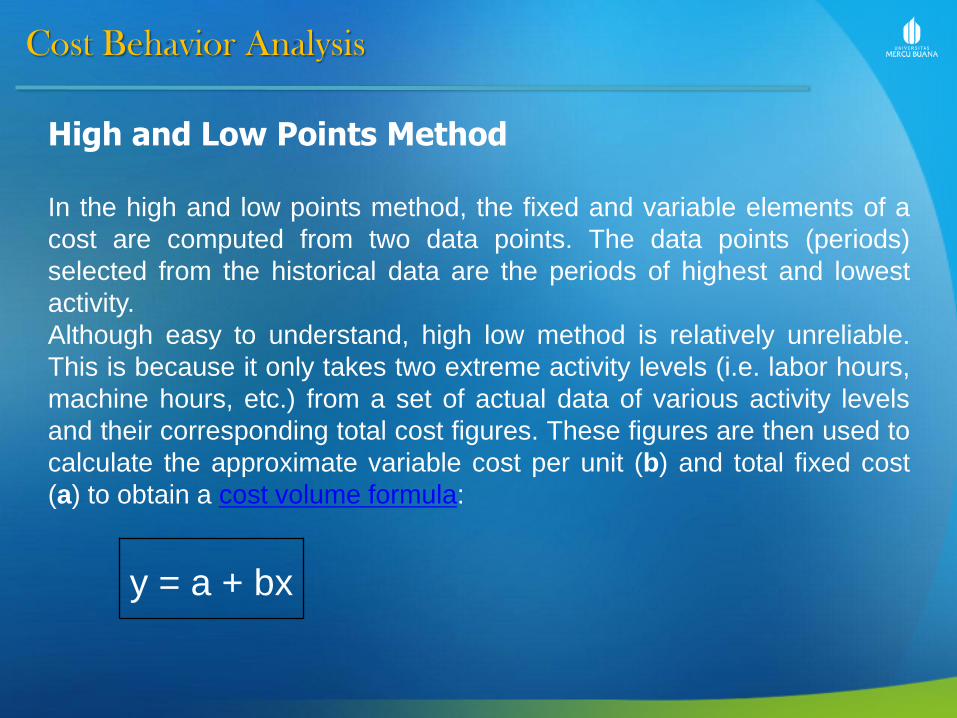
y = a + bx
High and Low Points Method In the high and low points method, the fixed and variable elements of a
cost are computed from two data points. The data points (periods)
selected from the historical data are the periods of highest and lowest
activity.
Although easy to understand, high low method is relatively unreliable.
This is because it only takes two extreme activity levels (i.e. labor hours,
machine hours, etc.) from a set of actual data of various activity levels
and their corresponding total cost figures. These figures are then used to
calculate the approximate variable cost per unit (b) and total fixed cost
(a) to obtain a cost volume formula:

Cost Behavior Analysis
Variable Cost per Unit = y2 − y1
x2 − x1
High-Low Method Formulas
Variable Cost per Unit
Variable cost per unit (b) is calculated using the following formula:
Where,
y2 is the total cost at highest level of activity;
y1 is the total cost at lowest level of activity;
x2 are the number of units/labor hours etc. at highest level of activity; and
x1 are the number of units/labor hours etc. at lowest level of activity
The variable cost per unit is equal to the slope of the cost volume line (i.e. change in total
cost ÷ change in number of units produced).
Total Fixed Cost = y2 − bx2 = y1 − bx1
Total Fixed Cost
Total fixed cost (a) is calculated by subtracting total variable cost from total cost, thus:

Cost Behavior Analysis
Scatter Graph Method
Scatter graph method is a graphical technique of separating fixed and
variable components of mixed cost by plotting activity level along x-axis and
corresponding total cost (mixed cost) along y-axis. A regression line is then
drawn on the graph by visual inspection. The line thus drawn is used to
estimate the total fixed cost and variable cost per unit. The point where the
line intercepts y-axis is the estimated fixed cost and the slope of the line is the
average variable cost per unit. Since the visual inspection does not involve
any mathematical testing therefore this method should be applied with great
care.

Cost Behavior Analysis
Method of Least-Squares
A mixed cost can be split into variable and mixed components by a statistical
technique called simple linear regression analysis. This technique mathematically
calculates the y-intercept and the slope of a straight line that ideally fits through a set
of points on a graph. In least-squares method, the ideal fitting of the regression line is
achieved by minimizing the sum of squares of the distances between the line and all
the points on the graph.
Formulas
In cost behavior analysis, the cost volume formula "y = a + bx", is equivalent to
regression line. Its y-intercept (a) and slope (b) represent the total fixed cost and
variable cost per unit respectively, can be calculated by solved following simultaneous
linear equations of least-squares regression analysis:

Cost Behavior Analysis
By solving the above equations for total fixed cost (a) and
variable cost per unit (b), we obtain:

Terima Kasih Suryadharma Sim, SE, M. Ak