Akkermans et al. (2009) - Fresh and Healthy?
29
Fresh and healthy? Well-being, health and performance of young employees with intermediate education Jos Akkermans and Veerle Brenninkmeijer Utrecht University, Utrecht, The Netherlands Roland W.B. Blonk Utrecht University, Utrecht, The Netherlands and TNO Quality of Life, Hoofddorp, The Netherlands, and Lando L.J. Koppes TNO Work and Employment, Hoofddorp, The Netherlands Abstract Purpose – The purpose of this paper is to gain more insight into the well-being, health and performance of young intermediate educated employees. First, employees with low education (9 years or less), intermediate education (10-14 years of education), and high education (15 years or more) are compared on a number of factors related to well-being, health, and performance at work. Second, determinants of well-being, health and performance are examined for the intermediate educated group, based on the Job Demands-Resources model. Design/methodology/approach – Data from The Netherlands Working Conditions Survey 2007 are used: the largest working conditions survey in The Netherlands. ANOVAs with post hoc Bonferroni corrections and linear regression analyses are used for the analyses. Findings – Young intermediate educated employees differ from high educated employees with regard to job demands, job resources and health. They report less demands, but these demands still have an effect on well-being and performance. They also report less resources, while these resources are important predictors of their health and performance: both directly and indirectly via job satisfaction and emotional exhaustion. Limitations/implications – Cross-sectional data are used and the theoretical model is tested using regression analyses. In a follow-up study, longitudinal data and structural equation modelling will be used. Originality/value – The study adds to the limited knowledge on young employees with intermediate education and gives insight into the processes that are important for their well-being, health, and performance. The study shows that this group deserves the attention of both researchers and professionals. Keywords Young adults, Employees, Education, Personal health, Performance management, The Netherlands Paper type Research paper Introduction During the last decades, the labour markets have changed into dynamic, constantly changing environments in which flexibility with regard to work and career is essential. As a result, individuals nowadays have so-called “boundaryless careers”, in which they have to actively seek opportunities and take initiatives to develop their own careers (Arthur et al., 2005; Eby et al., 2003; Clarke, 2009). This may be difficult for specific The current issue and full text archive of this journal is available at www.emeraldinsight.com/1362-0436.htm Well-being, health and performance 671 Received 7 July 2009 Revised 3 September 2009 Accepted 3 September 2009 Career Development International Vol. 14 No. 7, 2009 pp. 671-699 q Emerald Group Publishing Limited 1362-0436 DOI 10.1108/13620430911005717
-
Upload
jos-akkermans -
Category
Science
-
view
26 -
download
0
Transcript of Akkermans et al. (2009) - Fresh and Healthy?

Fresh and healthy?Well-being, health and performance of young
employees with intermediate education
Jos Akkermans and Veerle BrenninkmeijerUtrecht University, Utrecht, The Netherlands
Roland W.B. BlonkUtrecht University, Utrecht, The Netherlands and
TNO Quality of Life, Hoofddorp, The Netherlands, and
Lando L.J. KoppesTNO Work and Employment, Hoofddorp, The Netherlands
Abstract
Purpose – The purpose of this paper is to gain more insight into the well-being, health andperformance of young intermediate educated employees. First, employees with low education (9 yearsor less), intermediate education (10-14 years of education), and high education (15 years or more) arecompared on a number of factors related to well-being, health, and performance at work. Second,determinants of well-being, health and performance are examined for the intermediate educated group,based on the Job Demands-Resources model.
Design/methodology/approach – Data from The Netherlands Working Conditions Survey 2007are used: the largest working conditions survey in The Netherlands. ANOVAs with post hocBonferroni corrections and linear regression analyses are used for the analyses.
Findings – Young intermediate educated employees differ from high educated employees withregard to job demands, job resources and health. They report less demands, but these demands stillhave an effect on well-being and performance. They also report less resources, while these resourcesare important predictors of their health and performance: both directly and indirectly via jobsatisfaction and emotional exhaustion.
Limitations/implications – Cross-sectional data are used and the theoretical model is tested usingregression analyses. In a follow-up study, longitudinal data and structural equation modelling will beused.
Originality/value – The study adds to the limited knowledge on young employees withintermediate education and gives insight into the processes that are important for their well-being,health, and performance. The study shows that this group deserves the attention of both researchersand professionals.
Keywords Young adults, Employees, Education, Personal health, Performance management,The Netherlands
Paper type Research paper
IntroductionDuring the last decades, the labour markets have changed into dynamic, constantlychanging environments in which flexibility with regard to work and career is essential.As a result, individuals nowadays have so-called “boundaryless careers”, in which theyhave to actively seek opportunities and take initiatives to develop their own careers(Arthur et al., 2005; Eby et al., 2003; Clarke, 2009). This may be difficult for specific
The current issue and full text archive of this journal is available at
www.emeraldinsight.com/1362-0436.htm
Well-being,health and
performance
671
Received 7 July 2009Revised 3 September 2009
Accepted 3 September 2009
Career Development InternationalVol. 14 No. 7, 2009
pp. 671-699q Emerald Group Publishing Limited
1362-0436DOI 10.1108/13620430911005717

groups, in particular for young starting employees. Young employees that have justfinished their education have to make many important career decisions during the firstfew years of their employment, decisions that are likely to have major consequences intheir lives (Savickas, 1998). It is of critical importance to gain a better understanding ofthe well-being and performance at work of young starting employees. Surprisingly, avery small amount of research is available on this group. Research on careerdevelopment has mainly focussed on aging employees (e.g. Shacklock et al., 2009;Scholarios et al., 2008; Van der Heijden et al., 2009; Van Der Heijden et al., 2008).Furthermore, the few studies that did focus on young employees, were mostly aimed athigher educated employees (i.e. employees that have had a total of 15 years ofeducation or more). Hence, it can be concluded that the large group of employees thathas completed an intermediate education (i.e. employees that have had a total of 10-14years of education) has largely been ignored so far (Raad voor Werk en Inkomen, 2006).
With the previous statements in mind, it is clear that a lack of knowledge existswith respect to the challenges and problems that young employees with intermediateeducation face while entering the labour market. Additionally, little is known about thewell-being, health, and performance of young employees with intermediate education.Since this is a relatively large group on the labour market, it would be of greatimportance to researchers, employers, and HR managers to gain more knowledgeabout this group. With this knowledge, negative outcomes such as sickness absenceand absence at work might be prevented. Moreover, positive outcomes such assatisfaction and motivation at work might be fostered. This study is specificallydesigned to gain more knowledge about these important issues. First, youngintermediate educated employees (18-25 years) are compared with their lower- andhigher educated counterparts on a number of relevant factors regarding the demandsand resources in their jobs, as well as their well-being, health and performance. Thegroup with intermediate education consists of employees who have completed either ahigher general secondary education, a pre-university education, or an intermediatevocational education. They have had a total of ten-14 years of total education. Incontrast, a low education is considered to be nine years of education or less, havingcompleted no education, elementary education, or lower general secondary education.A high education is considered to be 15 years of education or more, having completed ahigher vocational education or university education. Second, the determinants ofwell-being, health and performance among young employees with intermediateeducation will be examined, using the Job Demands-Resources (JD-R) model(Demerouti et al., 2001) as a theoretical basis.
Well-being, health and performance of young employeesThe school-to-work transition can be considered as a long and challenging process.Seeking a suitable job may be a stressor for young workers (Koivisto et al., 2007). Themotivation to actively seek a job may also be reduced because young workers oftenface relatively low wages. This seems to be especially the case in The USA, the UK andThe Netherlands, compared to countries like Germany and France (Ryan, 2001). Oncethey have found a job, young workers face many new challenges and tasks: they haveless leisure time, more responsibilities, have to arrange their time in a new way, andhave to be more flexible (Ryan, 2001). All these new tasks and responsibilities, as wellas the socialization process in their work, can potentially lead to insecurity and stress
CDI14,7
672
(Goodwin and O’Connor, 2007; Koivisto et al., 2007). Furthermore, many youngworkers only manage to obtain temporary employment, which could potentially lead toadditional uncertainty and reduced well-being (Ryan, 2001; Smulders, 2005). In linewith these findings, it has been found that younger employees are less engaged in theirwork (Schaufeli and Bakker, 2004; Smulders, 2005). To conclude, it is clear that youngemployees who have just entered the labour market, or will be entering the labourmarket, face important transitions and challenges that deserve the attention ofresearchers.
It might be particularly important to investigate the intermediate educated group ofyoung employees. Approximately 40 per cent of the Dutch labour market isintermediate educated, thereby making this the largest educational group on the labourmarket in The Netherlands (Van Eijs, 2003; Schouten, 2009). Additionally, in 2006approximately 6.5 per cent of the intermediate educated employees on the Dutch labourmarket was unemployed, which was less than low educated employees, but more thathigh educated employees (Raad voor Werk en Inkomen, 2006). Moreover, employmentopportunities have decreased for young employees, especially for those who have a lowor intermediate education (Ryan, 2001). Sickness absence among employees withintermediate education has also been reported as relatively high, caused by factors likea high physical workload, work circumstances that are less favourable compared withhigher educated employees, and fewer chances for promotions (Van Cruchten, 1997;Smulders, 2005). Also, the difference in chances on the labour market between lowerand higher educated employees on the Dutch labour market seem to be increasing(Raad voor Werk en Inkomen, 2009). At the same time, both research and the mediafocus on the highest educated employees (i.e. high potentials) and the lowest educatedemployees (i.e. explicit risk groups), while the intermediate group is largely ignored(Raad voor Werk en Inkomen, 2006). Clearly, more knowledge is needed with regard toyoung, intermediate educated young employees.
In this study, we will examine to what extent three educational groups of youngemployees differ with regard to a number of factors related to stressors and resourcesas work, as well as well-being and performance. Furthermore, we will examine whichfactors are associated with the well-being, health and performance at work foremployees with intermediate education, in comparison with the other two educationalgroups.
Determinants of well-being of intermediate educated young employeesA theoretical model that is often used to predict well-being at work and has receivedsignificant empirical support is the JD-R model (Demerouti et al., 2001). The basisassumption of this model is that occupation-specific risk factors at work can beclassified in two general categories: job demands and job resources. The JD-R model isan overarching model that can be applied to various occupational settings, irrespectiveof the specific demands and resources involved in a particular job setting.
Job demands refer to those physical, psychological, social, or organizational aspectsof the job that require sustained physical and/or psychological (cognitive andemotional) effort or skills and are therefore associated with certain physical and/orpsychological costs (Bakker and Demerouti, 2007). Examples of job demands are a highworkload and conflict at work. Job demands are not necessarily negative in themselves,
Well-being,health and
performance
673

but may turn into stressors when meeting these demands requires high effort fromwhich an employee cannot adequately recover (Meijman and Mulder, 1998).
Job resources are those physical, psychological, social, or organizational aspects ofthe job that are either functional in achieving work goals, reducing job demands, orstimulating personal growth, learning, and development (Bakker and Demerouti,2007). Examples of job resources are autonomy and feedback. Job resources areimportant in their own right, but also help to deal with job demands. Furthermore,resources may be located at different levels: the organization at large (e.g. careeropportunities), the interpersonal and social relations level (e.g. social support of thesupervisor and/or colleagues), the organization of work (e.g. role clarity), and the tasklevel (e.g. autonomy).
Two different psychological processes underlie the JD-R model: the exhaustionprocess and the motivation process. In the exhaustion process (or strain process), jobdemands lead to a state of exhaustion (i.e. burnout) and subsequently to organizationaloutcomes, such as health problems (Demerouti et al., 2001; Bakker and Demerouti,2007). This means that exhaustion mediates the relationship between job demands andorganizational outcomes. The exhaustion process, including the mediating role ofemotional exhaustion, has been found in multiple studies (e.g. Lewig et al., 2007;Hakanen et al., 2006). In the motivation process, job resources lead to a higher level ofmotivation (e.g. work engagement) and subsequently to organizational outcomes, suchas higher performance (Schaufeli and Bakker, 2004; Bakker and Demerouti, 2007;Bakker and Demerouti, 2008). In this process, work engagement mediates therelationship between job resources and organizational outcomes, which has beensupported by multiple studies as well (e.g. Schaufeli and Bakker, 2004; Hakanen et al.,2008). In addition to these main effects, it is assumed that an interaction exists betweenjob demands and job resources. Job resources can buffer the effect of certain jobdemands (Van Der Doef and Maes, 1999; Johnson and Hall, 1988). The assumptions ofthe JD-R model have gained widespread empirical support (e.g. Hakanen et al., 2006;Xanthopoulou et al., 2007).
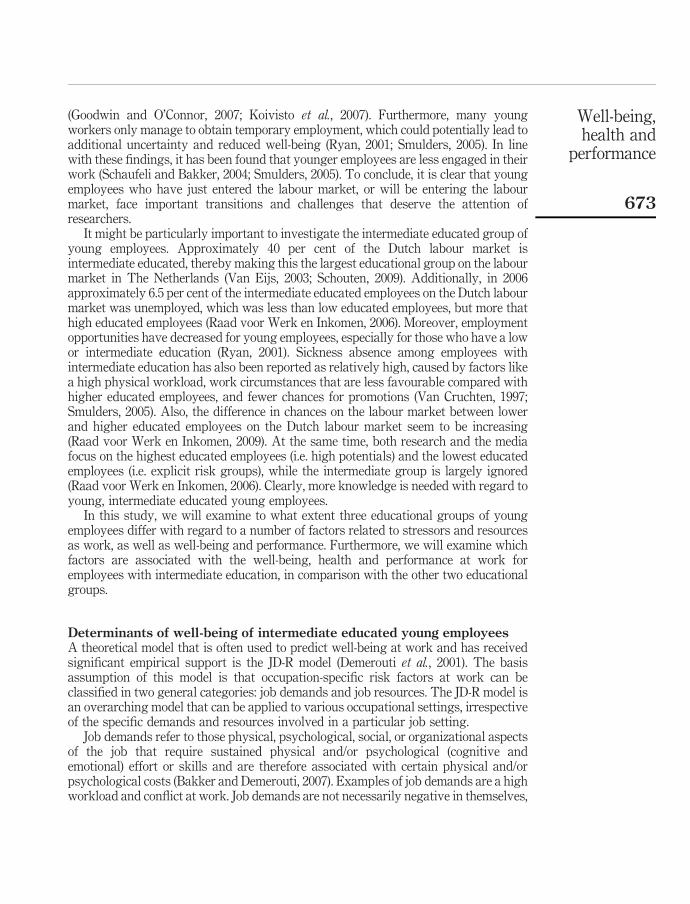
The exhaustion process and motivation process both lead to certain organizationaloutcomes. Important organizational outcomes that have often been the subject ofstudies using the JD-R model are health (problems) and performance (Demerouti et al.,2001; Bakker and Demerouti, 2007). Both general health and performance have beenshown to be related to working conditions (Schreuder et al., 2008; Halbesleben andWheeler, 2008; Williams and Anderson, 1991). Therefore, these two variables will beused in this study. General health will be measured by the subjective health experienceof employees. Performance will be measured by the perceived in-role performance,which refers to the degree to which an employee fulfils the specific tasks that are partof the job (Goodman and Svyantek, 1999). A graphical representation of the researchmodel of the current study is shown in Figure 1.
The exhaustion process: burnout and job demandsBurnout is considered as the central variable in the exhaustion process described bythe JD-R model and is traditionally defined as a syndrome of exhaustion, cynicismtowards work and reduced personal efficacy (Maslach et al., 1996; Schaufeli andEnzmann, 1998), which is an almost universally accepted definition (Schaufeli et al.,2009). Emotional exhaustion is a form of strain that refers to feelings of being
CDI14,7
674
overextended and exhausted by the emotional demands of one’s work (Demerouti et al.,2001). Emotional exhaustion is the component of burnout that is most often used as ameasure of burnout (Wright and Bonett, 1997; Schaufeli et al., 2009). Moreover,emotional exhaustion is the strongest correlate with job demands and job resources(Lee and Ashforth, 1996). Therefore, emotional exhaustion is considered as the centralvariable in the exhaustion process in the current study.
Three types of job demands are used in this study:
(1) workload;
(2) emotional demands; and
(3) cognitive demands.
This selection is supported by previous research (e.g. Hackman and Oldham, 1980; Leeand Ashforth, 1996). The variables that are used have been used in previous studiesregarding the JD-R model (e.g. Xanthopoulou et al., 2007; Schaufeli and Bakker, 2004).These demands are expected to directly influence emotional exhaustion. They are alsoexpected to indirectly influence general health and performance via emotionalexhaustion.
The motivation process: job satisfaction and job resourcesJob satisfaction is a construct that has been used often in occupational behaviourresearch and can be defined as the degree to which an employee appreciates his or herjob (Spector, 1997). Although job satisfaction is most often used as an outcomevariable, it has also been argued that it predicts performance and health (Gustainieneand Endriulaitiene, 2009). Job satisfaction is a positive measure of well-being and it cantherefore be considered part of the motivational process of well-being at work in theJD-R model.
Figure 1.The JD-R model as used in
the current study
Well-being,health and
performance
675

Four job resources were used in this study as part of the motivational process: jobautonomy, task variation, social support provided by the supervisor and social supportprovided by colleagues. These variables have often been used in research concerningwell-being and the JD-R model (e.g. Bakker and Demerouti, 2007; Xanthopoulou et al.,2007; Karasek, 1979; Hackman and Oldham, 1976). These resources are expected todirectly influence job satisfaction. They are also expected to indirectly influencegeneral health and performance through job satisfaction.
In sum, the following hypotheses are formulated with regard to the determinants ofwell-being of intermediate educated young employees:
H.1. Job demands (workload, emotional demands, and cognitive demands) arepositively related to emotional exhaustion.
H2. Job resources (autonomy, task variation, social support from supervisor, andsocial support from colleagues) are positively related to job satisfaction.
H3. Emotional exhaustion is negatively related to general health and in-roleperformance.
H4. Job satisfaction is positively related to general health and in-roleperformance.
As mentioned above, we also expect to find evidence for an exhaustion process, asdescribed in the JD-R model. In this process, job demands lead to a state of exhaustion,which subsequently lead to reduced organizational outcomes (Demerouti et al., 2001;Bakker and Demerouti, 2007; Lewig et al., 2007; Hakanen et al., 2006). Hence, emotionalexhaustion would mediate the relationship between the job demands and the outcomevariables.
H5a. Emotional exhaustion mediates the relationship between job demands andgeneral health.
H5b. Emotional exhaustion mediates the relationship between job demands andin-role performance.
In a similar way, we expect to find a motivation process, in which job resources lead toan increased satisfaction with work, which subsequently leads to improvedorganizational outcomes (Schaufeli and Bakker, 2004; Bakker and Demerouti, 2007;Hakanen et al., 2008). In this process, job satisfaction is expected to mediate therelationship between the job resources and the outcome variables.
H6a. Job satisfaction mediates the relationship between job resources and generalhealth.
H6b. Job satisfaction mediates the relationship between job resources and in-roleperformance.
Finally, additional analyses will be performed to check whether there are anycross-relationships present between job demands and job satisfaction, and between jobresources and emotional exhaustion, for the current target group. In this way, we canexplore whether earlier findings regarding the buffering effect of resources in the JD-R
CDI14,7
676

model can be replicated for the group of young employees with intermediate education(Van Der Doef and Maes, 1999; Johnson and Hall, 1988).
MethodDesignData were derived from The Netherlands Working Conditions Survey (NWCS) thatwas carried out in 2007 (Van den Bossche et al., 2008). The NWCS is the largest surveyon working conditions available in The Netherlands, and serves as a nationalbenchmark for sector-level monitoring. The NWCS constitutes a representative sampleof the Dutch workforce in the age of 15-64 years, but excludes self-employedindividuals. A total of 80,000 individuals were sampled from the Dutch workingpopulation database of Statistics Netherlands. This database includes each of thealmost seven million employees in The Netherlands. Sampling was random, except fora 50 per cent over-sampling of employees aged younger than 23 years and employeeswith a non-western background, because the response rate in these two groups wasknown to be relatively low.
The individuals in the sample received a written questionnaire by mail at theirhome address in the first week of November 2007. The questionnaires wereaccompanied by an answering envelope and an information leaflet in which thepurpose of the study was explained and participation was asked. After three to sixweeks, reminders were sent to the majority of those who had not yet responded. Thequestionnaire could be filled out with a pencil, or could be filled out via internet using apersonal code that was printed on the questionnaire. As a compensation forparticipation, gift vouchers of 25 euro were raffled among respondents, resulting in achance of one in ten to obtain a gift voucher. Instead of having a chance to gain a giftvoucher, the participants could choose to donate 2.50 euro to one of the four charitiesthat were mentioned on the questionnaire. The individuals in the sample were givennine weeks to fill out and return the questionnaire.
ParticipantsA total of 22,759 employees participated in the NWCS 2007. In order to be able tospecifically aim this study at young employees, a sub-sample was used for theANOVAs in this study (n ¼ 2535; 50.4 per cent female) to compare the differencesbetween three educational groups. This sub sample consisted of the age group of18-25 and contained the low educated (n ¼ 460), the intermediate educated (n ¼ 1.477)and the high educated (n ¼ 598) participants of this age group.
The sub-sample of intermediate educated employees (n ¼ 1.477; 52 per cent female)was selected for use in the main regression analyses in this study. This sub-samplewas in the age range of 18-25 years and had a total of ten-14 years of education. Amajority of the participants (65.9 per cent) had completed an intermediate vocationaleducation. Most of them had one paid job (89 per cent) and a little less than half of therespondents (48.4 per cent) had permanent employment. Trade (24.9 per cent) andhealth and social work (17.5 per cent) were the best represented branches in thissample.
Non-response analyses were performed to see whether the distribution of a numberof background variables (e.g. gender and age) was equal to the total sample populationfrom the Dutch working population database of Statistics Netherlands. A number of
Well-being,health and
performance
677
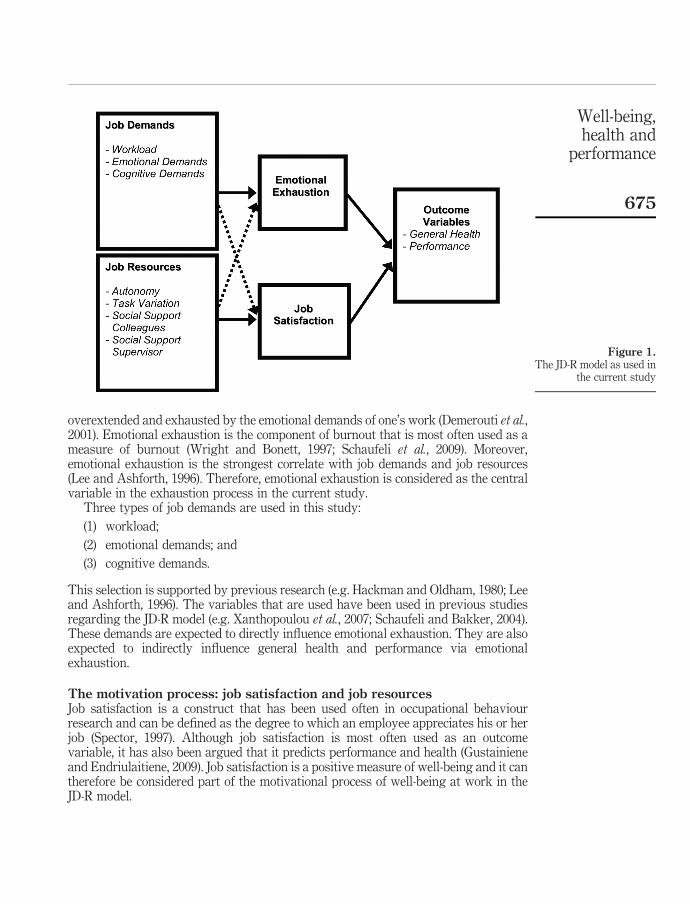
minor differences were found, but did not pose a problem since the weighing of thesevariables ensured that the data were representative for the Dutch labour market.Further details about the characteristics of the participants can be found in Table I.
MeasuresWorkload. The first type of job demand is workload, which was assessed with afour-item scale, based on the Job Content Questionnaire (Karasek, 1985, 1998). Exampleitems for this scale were: “Do you have to work very fast?” and “Is your work hectic?”.The items were measured on a four-point scale ranging from “never” to “always”. Thealpha for this scale was 0.82 in this study.
Emotional demands. The second type of job demands are emotional demands,which were measured with three items that were based on the CopenhagenPsychosocial Questionnaire (Kristensen and Borg, 2000). Example items were: “Is yourwork emotionally demanding?” and “Are you emotionally attached to your work?”.The items were measured on a four-point scale, ranging from “never” to “always”.Coefficient alpha was 0.78.
Cognitive demands. The third type of job demands are cognitive demands, whichwere measured with three items that were based on Houtman et al. (1995). Exampleitems were: “Does your work require you to think intensively” and “Does your workrequire you to focus a lot?”. The items were measured on a four-point scale rangingfrom “never” to “always”. Coefficient alpha was 0.79.
Percentage
Gender Male 52.6Female 47.4
Education Intermediate vocational 65.9Higher general secondary 34.1
Working hours ,20 37.420-32 19.8.32 42.8
Occupational area Agriculture 2.4Manufacturing 8.2Building and construction 4.9Trade 24.9Hotels and restaurants 9.3Transport 5.4Financial Acitivities 2.0Business Activities 13.4Public Administration 4.3Education 2.3Health and social work 17.5Culture and other services 5.3
Number of paid jobs 1 89.0.1 11.0
Terms of employment Permanent 48.4Fixed Term 51.4Other 0.2
Note: Total n = 1,477
Table I.Characteristics ofemployees aged 18-25years with intermediateeducation
CDI14,7
678
Autonomy. Autonomy was the first type of job resource in this study and this wasmeasured using a four-item scale that was based on the Job Content Questionnaire(Karasek, 1985; Karasek et al., 1998). Example items were: “Can you decide for yourselfhow to perform your job?” and “Can you decide the order of doing your tasks?”. Theitems were measured on a three-point scale ranging from “yes, most of the time” to“never”. Coefficient alpha was 0.74.
Task variation. The second type of job resource in this study was task variation,which was measured with a three-item scale, based on the Job Content Questionnaire(Karasek, 1985; Karasek et al., 1998). An example item of this scale was “Does yourwork require creativity?”. The items were measured on a four-point scale, ranging from“never” to “always”. The coefficient alpha was 0.77.
Social support. The third and fourth types of job resources were social support bythe supervisor and social support by colleagues. These were both assessed with fouritems that were based on the Job Content Questionnaire (Karasek, 1985; Karasek et al.,1998) and were translated in Dutch by Houtman et al. (1995). Example items were: “Mysupervisor takes the well-being of the employees into account” and “My colleaguesshow a personal interest in me”. The items were measured on four-point scales,ranging from “completely disagree” tot “completely agree”. The original scale alsocontained a “not applicable” category, which was not used for the analyses in thisstudy since this category was never chosen by the participants. The alphas of thescales were 0.87, and 0.85, respectively.
Emotional exhaustion. Emotional exhaustion was measured with five items thatwere based on the Utrecht Burnout Scale (UBOS, Schaufeli and Van Dierendonck,2000). An example item was: “I feel emotionally exhausted because of my work”. Theitems were measured on a seven-point scale, ranging from “never” to “every day”. Thecoefficient alpha for this scale was 0.82.
Job satisfaction. Job satisfaction was measured using two items that were created forthe NWCS. An example item was: “All in all, how satisfied are you with your work?”.The items were measured on a five-point scale, ranging from “very unsatisfied” to“very satisfied”. The alpha for this scale was 0.80.
General health. General health (i.e. subjective health experience) was measured withone item: “In general, how do you rate your health?”. This item was derived from theIntegrated System of Social Surveys (POLS) (Statistics Netherlands, 2003).
In-role performance. In role performance was measured using three items that weredeveloped for the current questionnaire and were inspired by the criteria of Goodmanand Svyantek (1999). An example item was: “I perform well at work”. The items weremeasured on a five-point scale, ranging from “completely agree” to “completelydisagree”. The coefficient alpha was 0.85.
AnalysesRespondents who reported that they were not an employee, but for example worked asa freelancer or were self-employed, were excluded from the analyses, as were thosewith missing data on gender, age, or educational level. The responses were weighed forgender, age, professional group, ethnic origin, geographic region and educational level,to let the sample distribution correspond to the distribution of these factors of all Dutchemployees. The respondents were given a weight that either increased or decreased
Well-being,health and
performance
679

their value, to make sure that the data used represented the distribution in the actuallabour market.
To test for differences between the three educational groups, one-way ANOVAswere performed. Post hoc tests with a Bonferroni correction (alpha ¼ 0.05) wereperformed to see which aspects differed significantly between the educational groups.Linear regression analyses were performed to test the hypotheses of this study andwere performed on the sub-sample of young intermediate educated employees.
Mediation analyses were conducted in accordance with the approach suggested byBaron and Kenny (1986). According to Baron and Kenny (1986), a series of conditionsshould be met to establish mediation. First, the independent variable must affect themediator variable. Second, the independent variable must affect the dependentvariable. Third, the mediator variable must affect the dependent variable. Finally, theeffect of the independent variable on the dependent variable should be smaller in thethird condition than it was in the second condition. Sobel tests were used to test for thesignificance of possible (partial) mediation effects.
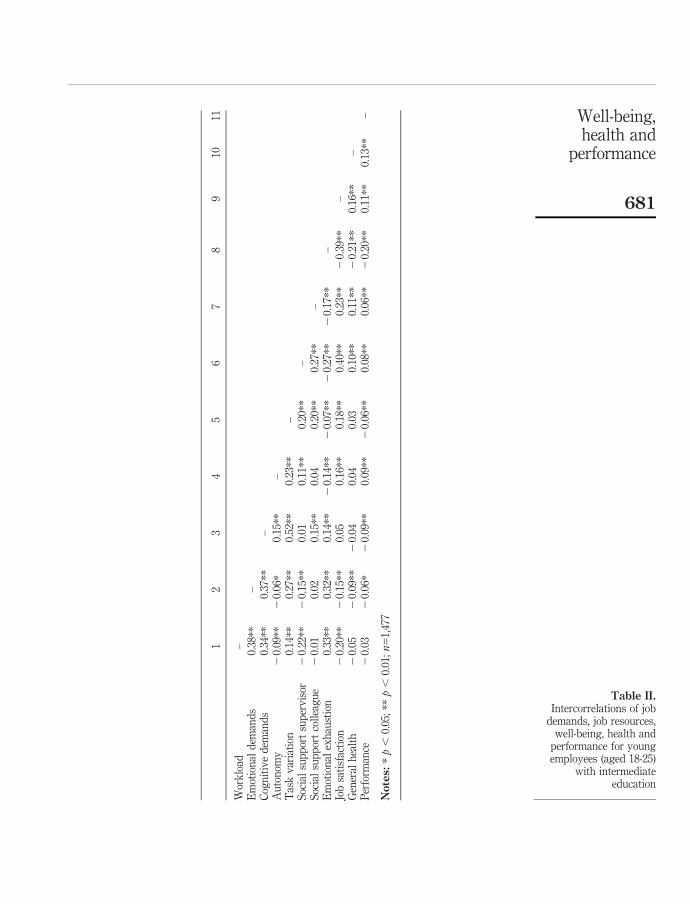
ResultsIntercorrelations between variables are presented in Table II.
Description of the target groupTo investigate possible differences between the three educational groups, ANOVAswere performed with post-hoc comparisons (n ¼ 2,535). Comparisons were madebetween employees with low education (nine years or less education), intermediateeducation (ten-14 years of education), and high education (15 years or more education).An overview of these results are presented in Table III.
Job demandsWith regard to workload, the omnibus ANOVA was significant (F(2) ¼ 5.21, p , 0.01).The post hoc test showed that there was a significant difference between intermediateand higher education, with intermediate educated employees experiencingsignificantly less workload (M ¼ 2.16 vs M ¼ 2.25, p , 0.05). There was nodifference between intermediate educated employees and lower educated employees.Similar results were found for cognitive demands. There were overall differencesbetween the groups (F(2) ¼ 19.48, p , 0.01) and intermediate educated employeesexperienced significantly less cognitive demands compared with higher educatedemployees (M ¼ 2.74 vs M ¼ 3.02, p , 0.05). Differences were also found foremotional demands (F(2) ¼ 48.85, p , 0.01). Intermediate educated employeesexperienced more emotional demands than lower educated employees (M ¼ 1.49 vsM ¼ 1.42, p , 0.05), but less than higher educated employees (M ¼ 1.49 vs M ¼ 1.76,p , 0.05).
Job resourcesA significant difference was found between the three educational groups with regard toautonomy (F(2) ¼ 29.06, p , 0.01). The post hoc test showed that employees withintermediate education experience more autonomy than employees with lowereducation (M ¼ 2.35 vs M ¼ 2.25, p , 0.05), but less autonomy than higher educatedemployees (M ¼ 2.35 vs M ¼ 2.47, p , 0.05). Differences were also found with regard
CDI14,7
680
12
34
56
78
910
11
Wor
klo
ad–
Em
otio
nal
dem
and
s0.
38**
–C
ogn
itiv
ed
eman
ds
0.34
**0.
37**
–A
uto
nom
y2
0.09
**2
0.06
*0.
15**
–T
ask
var
iati
on0.
14**
0.27
**0.
52**
0.23
**–
Soc
ial
sup
por
tsu
per
vis
or2
0.22
**2
0.15
**0.
010.
11**
0.20
**–
Soc
ial
sup
por
tco
llea
gu
e2
0.01
0.02
0.15
**0.
040.
20**
0.27
**–
Em
otio
nal
exh
aust
ion
0.33
**0.
32**
0.14
**2
0.14
**2
0.07
**2
0.27
**2
0.17
**–
Job
sati
sfac
tion
20.
20**
20.
15**
0.05
0.16
**0.
18**
0.40
**0.
23**
20.
39**
–G
ener
alh
ealt
h2
0.05
20.
09**
20.
040.
040.
030.
10**
0.11
**2
0.21
**0.
16**
–P
erfo
rman
ce2
0.03
20.
06*
20.
09**
0.09
**2
0.06
**0.
08**
0.06
**2
0.20
**0.
11**
0.13
**–
Notes:
*p,
0.05
;**
p,
0.01
;n
=1,
477
Table II.Intercorrelations of job
demands, job resources,well-being, health and
performance for youngemployees (aged 18-25)
with intermediateeducation
Well-being,health and
performance
681

to task variation (F(2) ¼ 22.86, p , 0.01). Intermediate educated employeesexperienced significantly less task variation than higher educated employees(M ¼ 2.55 vs M ¼ 2.86, p , 0.05). A similar result was found for social supportfrom colleagues (F(2) ¼ 7.05, p ,0.01). Intermediate educated employees experiencedsignificantly less social support from their colleagues than higher educated employees(M ¼ 3.34 vs M ¼ 3.42, p ,0.05). The omnibus ANOVA did not reach full significancefor social support from the supervisor (F(2) ¼ 2.88, p ¼ 0.06). Because the ANOVAwas marginally significant, a post hoc test was still performed. The results show thatthere was no difference between intermediate and higher educated employees. Thedifference between lower educated and higher educated employees was significanthowever (M ¼ 2.95 vs M ¼ 3.06, p , 0.05)
Well-being, health and performanceWith regard to general health, there were significant differences between the threeeducational groups (F(2) ¼ 4.10, p , 0.05). Intermediate educated employees reporteda slightly lower degree of general health than higher educated employees (M ¼ 3.56 vsM ¼ 3.68, p ¼ 0.051). Finally, the omnibus ANOVA for performance was significant(F(2) ¼ 4.45, p , 0.05). Intermediate educated employees did not differ from lower orhigher educated employees. There was, however, a difference between lower andhigher education (M ¼ 4.42 vs M ¼ 4.35, p , 0.05): lower educated employeesperceived their performance as higher compared with higher educated employees. Nodifferences were found between the three groups with regard to emotional exhaustion(F(2) ¼ 1.75, p ¼ 0.17) and job satisfaction (F(2) ¼ 1.10, p ¼ 0.17).
In sum, the intermediate educated group and the higher educated group differ interms of the job demands and the job resources they experience. Intermediate educatedemployees experience less job demands, but also less job resources. The intermediateeducated employees also feel less healthy compared with the higher educated group.The intermediate group and the lower group showed very few differences.
Low Intermediate HighM SD M SD M SD
Job demandsWorkload 2.13 0.60 2.16 0,58 2.25b 0.54Emotional demands 1.42a 0.56 1.49 0.53 1.76b 0.60Cognitive demands 2.76 0.76 2.74 0.72 3.02b 0.69Job resourcesAutonomy 2.25a 0.49 2.35 0.47 2.47b 0.47Task variation 2.55 0.82 2.55 0.77 2.86b 0.72Social support supervisor 2.95 0.72 2.98 0.64 3.06 0.61Social support colleague 3.30 0.53 3,34 0,50 3.42b 0.47Well-being, health, and performanceEmotional exhaustion 1.85 1.10 1.78 1.00 1.86 0.95Job satisfaction 3.77 0.87 3.80 0.74 3.86 0.74General health 3.53 0.87 3.56 0.85 3.68b 0.80Performance 4.46 0.63 4.42 0.57 4.35 0.50
Notes: a and b indicate significant differences in comparison to the intermediate level measured with apost hoc Bonferroni test at p , 0.05
Table III.Differences betweenintermediate educatedemployees, lowereducated employees andhigher educatedemployees
CDI14,7
682

Determinants of emotional exhaustion and job satisfactionThe analyses regarding the determinants of well-being and performance wereperformed with a specific focus on the subgroup of young intermediate educatedemployees (n ¼ 1.477). Comparisons with the low educated (n ¼ 460) and higheducated (n ¼ 598) employees were also made. As the current study focuses mainly onemployees with intermediate education, no further attention is paid to thesecomparisons here. The interested reader is referred to the Appendix for the tables withthe comparisons between the three educational groups (Tables AI–AVIII).
Job demandsThe regression analyses for the main effects of job demands on emotional exhaustionand job satisfaction are presented in Table IV. Workload and emotional demands werepositively associated with emotional exhaustion (b ¼ 0.25, p , 0.01 and b ¼ 0.24,p , 0.01, respectively). Cognitive demands showed no relationship with emotionalexhaustion. These results partially supported H1, which stated that job demands arepositively related to emotional exhaustion.
The cross-relationships between the job demands and job satisfaction were alsotested. Workload (b ¼ 20.20, p , 0.01) and emotional demands (b ¼ 20.13,p , 0.01) both had a negative relationship with job satisfaction. Cognitive demandswere positively related to job satisfaction (b ¼ 0.18, p , 0.01).
Job resourcesThe regression analyses for the main effects of job resources on emotional exhaustionand job satisfaction are presented in Table V. Autonomy and task variation werepositively associated with job satisfaction (b ¼ 0.10, p , 0.01 and b ¼ 0.06, p , 0.01,respectively). Social support from the supervisor and from colleagues were alsopositively related to job satisfaction (b ¼ 0.34, p , 0.01 and b ¼ 0.12, p , 0.01,respectively). These results fully supported H2, which stated that job resources arepositively related to job satisfaction.
The cross-relationships between job resources and emotional exhaustion were alsotested. Autonomy (b ¼ 20.14, p , 0.01), social support of the supervisor (b ¼ 20.22,p , 0.01) and social support of the colleagues (b ¼ 20.08, p , 0.01) were negativelyassociated with emotional exhaustion. Task variation was not associated withemotional exhaustion.
Emotional exhaustion Job satisfactionb DR 2 b DR 2
Step 1 0.01* 0.00Gender 20.00 20.03Age 0.09* 20.05Step 2 0.15* 0.07*Workload 0.25* 20.20*Emotional demands 0.25* 20.13*Cognitive demands 20.05 0.18*
Note: * p , 0.01
Table IV.Gender and age adjustedregression coefficients of
the associations of jobdemands with emotional
exhaustion and jobsatisfaction
Well-being,health and
performance
683

Determinants of general health and performanceJob demandsThe regression analyses for the associations between job demands and the outcomevariables general health and performance are presented in Table VI (step 2). Contraryto the expectations, none of the job demand variables had a significant association withgeneral health. However, without the use of gender as a control variable there was asignificant and negative relationship between emotional demands and general health(b ¼ 20.08, p , 0.05). Furthermore, only cognitive demands had a significant andnegative relationship with performance (b ¼ 20.07, p , 0.05).
Job resourcesThe results of the regression analyses for the associations of job resources with theoutcome variables are presented in Table VII (step 2). Social support of the supervisorand social support of the colleagues were positively related to general health (b ¼ 0.08,p , 0.05 and b ¼ 0.09, p , 0.01, respectively). Autonomy (b ¼ 0.05, p ¼ 0.13) andtask variation (b ¼ 20.02, p ¼ 0.58) were not significantly associated with general
Emotional exhaustion Job satisfactionb DR 2 b DR 2
Step 1 0.01* 0.00Gender 0.02 20.03Age 0.07* 20.05Step 2 0.09** 0.19**Autonomy 20.14** 0.11**Task variation 20.01 0.07*Social support supervisor 20.22** 0.33**Social support colleague 20.08** 0.12**
Note: * p , 0.05; ** p , 0.01
Table V.Gender and age adjustedregression coefficients ofthe associations of jobresources with emotionalexhaustion and jobsatisfaction
General health Performanceb DR 2 b DR 2
Step 1 0.02** 0.00Gender 20.13** 0.03Age 20.07** 0.01Step 2 0.00 0.01*Workload 20.02 0.02Emotional demands 20.04 20.05Cognitive demands 20.02 20.07*Step 3 0.03** 0.04**Workload 0.03 0.07*Emotional demands 0.01 0.01Cognitive demands 20.03 20.08**Emotional exhaustion 20.21** 20.22**
Note: * p , 0.05; ** p , 0.01
Table VI.Gender and age adjustedregression coefficients ofthe associations of jobdemands and emotionalexhaustion with generalhealth and performance
CDI14,7
684

health. Autonomy (b ¼ 0.11, p , 0.01) and social support of the colleagues (b ¼ 0.06,p , 0.05) were positively related to performance.
Contrary to the expectations, task variation was negatively related to performance(b ¼ 20.12, p , 0.01). Social support of the supervisor was positively related toperformance, as expected, but this relationship was only marginally significant(b ¼ 0.05, p ¼ 0.09).
Testing the exhaustion processRegression analyses were performed to check the associations of emotional exhaustionwith general health and performance. Emotional exhaustion had a significant negativerelationship with general health (b ¼ 20.21, p , 0.01) and performance (b ¼ 20.20,p , 0.01), thereby fully supporting H3.
As stated in H5a and H5b, it was expected that emotional exhaustion wouldmediate the relationship between job demands (workload, emotional demands, andcognitive demands) and the outcome variables (general health and in-roleperformance). As presented in Table VI (step 3), emotional exhaustion was added inthe third step of the regression analysis and showed a significant negative relationshipwith general health (b ¼ 20.21, p , 0.01). However, mediation by emotionalexhaustion was not further tested since none of the job demands showed asignificant relationship with general health. As stated above, emotional demands didhave a significant and negative association with general health if gender was not usedas a control variable. Mediation was tested for this association since it was no longersignificant when emotional exhaustion was added. The indirect association ofemotional demands with general health was significant (Sobel statistic t ¼ 26.73,p , 0.01). However, this mediation effect only existed when not controlling for gender.Therefore, H5a was not supported by these results.
Emotional exhaustion also showed a negative relationship with performance(b ¼ 20.22, p , 0.01). However, as the associations of the job demands did notdecrease with the addition of emotional exhaustion, it was concluded that emotional
General health Performanceb DR 2 b DR 2
Step 1 0.02 * * 0.00Gender 20.11 * * 0.03Age 20.06 * 20.01Step 2 0.02 * * 0.03 * *
Autonomy 0.05 0.11 * *
Task variation 20.02 20.12 * *
Social support supervisor 0.08 * 0.05Social support colleague 0.09 * * 0.06 *
Step 3 0.01 * * 0.01 * *
Autonomy 0.03 0.10 * *
Task variation 20.03 20.12 * *
Social support supervisor 0.04 0.03Social support colleague 0.08 * 0.05Job satisfaction 0.12 * * 0.08 *
Note: * p , 0.05; ** p , 0.01
Table VII.Gender and age adjustedregression coefficients of
the associations of jobresources and job
satisfaction with generalhealth and performance
Well-being,health and
performance
685
exhaustion did not mediate the relationship between job demands and performance.These results did not support H5b.
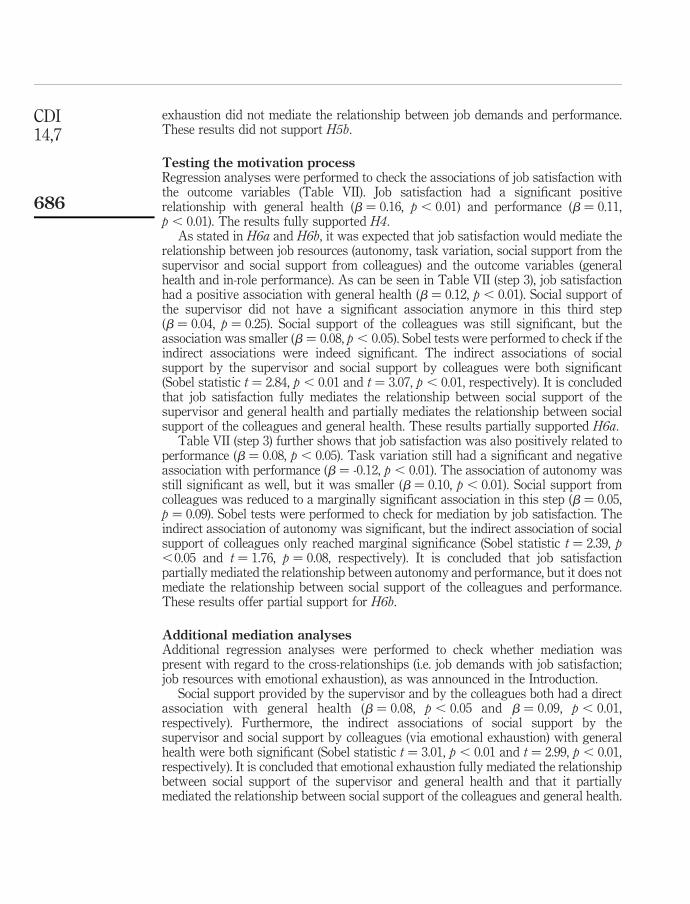
Testing the motivation processRegression analyses were performed to check the associations of job satisfaction withthe outcome variables (Table VII). Job satisfaction had a significant positiverelationship with general health (b ¼ 0.16, p , 0.01) and performance (b ¼ 0.11,p , 0.01). The results fully supported H4.
As stated in H6a and H6b, it was expected that job satisfaction would mediate therelationship between job resources (autonomy, task variation, social support from thesupervisor and social support from colleagues) and the outcome variables (generalhealth and in-role performance). As can be seen in Table VII (step 3), job satisfactionhad a positive association with general health (b ¼ 0.12, p , 0.01). Social support ofthe supervisor did not have a significant association anymore in this third step(b ¼ 0.04, p ¼ 0.25). Social support of the colleagues was still significant, but theassociation was smaller (b ¼ 0.08, p , 0.05). Sobel tests were performed to check if theindirect associations were indeed significant. The indirect associations of socialsupport by the supervisor and social support by colleagues were both significant(Sobel statistic t ¼ 2.84, p , 0.01 and t ¼ 3.07, p , 0.01, respectively). It is concludedthat job satisfaction fully mediates the relationship between social support of thesupervisor and general health and partially mediates the relationship between socialsupport of the colleagues and general health. These results partially supported H6a.
Table VII (step 3) further shows that job satisfaction was also positively related toperformance (b ¼ 0.08, p , 0.05). Task variation still had a significant and negativeassociation with performance (b ¼ -0.12, p , 0.01). The association of autonomy wasstill significant as well, but it was smaller (b ¼ 0.10, p , 0.01). Social support fromcolleagues was reduced to a marginally significant association in this step (b ¼ 0.05,p ¼ 0.09). Sobel tests were performed to check for mediation by job satisfaction. Theindirect association of autonomy was significant, but the indirect association of socialsupport of colleagues only reached marginal significance (Sobel statistic t ¼ 2.39, p,0.05 and t ¼ 1.76, p ¼ 0.08, respectively). It is concluded that job satisfactionpartially mediated the relationship between autonomy and performance, but it does notmediate the relationship between social support of the colleagues and performance.These results offer partial support for H6b.
Additional mediation analysesAdditional regression analyses were performed to check whether mediation waspresent with regard to the cross-relationships (i.e. job demands with job satisfaction;job resources with emotional exhaustion), as was announced in the Introduction.
Social support provided by the supervisor and by the colleagues both had a directassociation with general health (b ¼ 0.08, p , 0.05 and b ¼ 0.09, p , 0.01,respectively). Furthermore, the indirect associations of social support by thesupervisor and social support by colleagues (via emotional exhaustion) with generalhealth were both significant (Sobel statistic t ¼ 3.01, p , 0.01 and t ¼ 2.99, p , 0.01,respectively). It is concluded that emotional exhaustion fully mediated the relationshipbetween social support of the supervisor and general health and that it partiallymediated the relationship between social support of the colleagues and general health.
CDI14,7
686
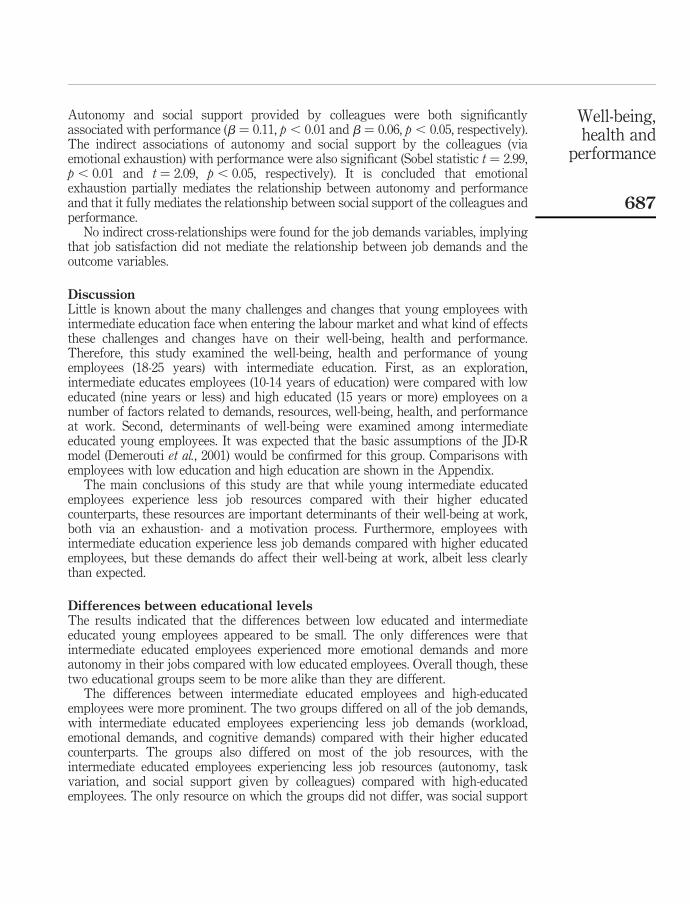
Autonomy and social support provided by colleagues were both significantlyassociated with performance (b ¼ 0.11, p , 0.01 and b ¼ 0.06, p , 0.05, respectively).The indirect associations of autonomy and social support by the colleagues (viaemotional exhaustion) with performance were also significant (Sobel statistic t ¼ 2.99,p , 0.01 and t ¼ 2.09, p , 0.05, respectively). It is concluded that emotionalexhaustion partially mediates the relationship between autonomy and performanceand that it fully mediates the relationship between social support of the colleagues andperformance.
No indirect cross-relationships were found for the job demands variables, implyingthat job satisfaction did not mediate the relationship between job demands and theoutcome variables.
DiscussionLittle is known about the many challenges and changes that young employees withintermediate education face when entering the labour market and what kind of effectsthese challenges and changes have on their well-being, health and performance.Therefore, this study examined the well-being, health and performance of youngemployees (18-25 years) with intermediate education. First, as an exploration,intermediate educates employees (10-14 years of education) were compared with loweducated (nine years or less) and high educated (15 years or more) employees on anumber of factors related to demands, resources, well-being, health, and performanceat work. Second, determinants of well-being were examined among intermediateeducated young employees. It was expected that the basic assumptions of the JD-Rmodel (Demerouti et al., 2001) would be confirmed for this group. Comparisons withemployees with low education and high education are shown in the Appendix.
The main conclusions of this study are that while young intermediate educatedemployees experience less job resources compared with their higher educatedcounterparts, these resources are important determinants of their well-being at work,both via an exhaustion- and a motivation process. Furthermore, employees withintermediate education experience less job demands compared with higher educatedemployees, but these demands do affect their well-being at work, albeit less clearlythan expected.
Differences between educational levelsThe results indicated that the differences between low educated and intermediateeducated young employees appeared to be small. The only differences were thatintermediate educated employees experienced more emotional demands and moreautonomy in their jobs compared with low educated employees. Overall though, thesetwo educational groups seem to be more alike than they are different.
The differences between intermediate educated employees and high-educatedemployees were more prominent. The two groups differed on all of the job demands,with intermediate educated employees experiencing less job demands (workload,emotional demands, and cognitive demands) compared with their higher educatedcounterparts. The groups also differed on most of the job resources, with theintermediate educated employees experiencing less job resources (autonomy, taskvariation, and social support given by colleagues) compared with high-educatedemployees. The only resource on which the groups did not differ, was social support
Well-being,health and
performance
687

provided by the supervisor. This difference was marginally significant. Theintermediate educated employees did not differ from high-educated employees withregard to emotional exhaustion, job satisfaction and performance. Employees withintermediate education did experience a somewhat poorer health compared with thehigher educated employees.
Taken together, these results give a comprehensive overview of the similarities anddifferences between the three educational groups of young employees. The mainconclusion is that intermediate educated employees are quite similar to low educatedemployees with respect to job demands, job resources, well-being, health andperformance. Compared with high-educated employees however, they experience lessjob demands, less job resources and a poorer health.
Determinants of emotional exhaustion and job satisfactionIn line with the expectations, workload and emotional demands were associated withemotional exhaustion among young employees with intermediate education.Employees experiencing a higher level of workload and emotional demands weremore likely to be emotionally exhausted. These findings are in line with theassumption that job demands lead to emotional exhaustion (Demerouti et al., 2001).Cognitive demands, however, were not related to emotional exhaustion. Surprisingly,cognitive demands did have a significant and positive relationship with jobsatisfaction. This means that young intermediate educated employees are moresatisfied about their jobs if their work is cognitively demanding. This finding is incontrast with earlier findings regarding the exhaustion- and motivation processpresented in the JD-R model (Demerouti et al., 2001; Bakker and Demerouti, 2007). Apossible explanation could be that high cognitive demands are an indication of theopportunity to learn and develop at work for these young workers. As such, cognitivedemands may be perceived as a positive aspect of one’s work.
As expected, all of the job resources were related to job satisfaction. Youngintermediate educated employees were more satisfied with their jobs when theyexperienced more autonomy, more variation in their tasks, and more social supportprovided by the supervisor and colleagues. These findings support the assumptions ofthe motivation process of the JD-R model (Schaufeli and Bakker, 2004; Bakker andDemerouti, 2007).
Determinants of health and performanceJob demands generally appeared to be hardly associated with general health andperformance. We assume that this might reflect a qualitatively different process foryoung intermediate educated employees, compared with the higher educated and/orolder groups that have been the target populations of most research so far. Apparently,job demands are of relatively little importance with regard to health and performanceof young intermediate educated employees. It should be noted that this groupexperienced less job demands compared with higher educated employees. This mightreflect a relatively high resistance to job demands for young employees, which could inturn mean that these young workers are better able to cope with demanding workconditions.
One additional comment that should be made here is that emotional demandsactually seemed to have a strong association with health, but this association
CDI14,7
688

disappeared when corrected for gender. It would seems that women, compared to men,are more sensitive to emotional demands and therefore, it might be interesting to focuson gender differences in future research.
Another interesting and unexpected finding was that task variation had a negativerelationship with in-role performance. This means that the more variation a jobrequires and the more creativity is necessary to perform a job, the worse individualsperform. Given that task variation was framed as a job resource in this study, this wasan unexpected finding. Apparently, for young intermediate educated employees thatare starting their careers, too much variation and creativity in their jobs may have acounterproductive effect. These young employees already face many new tasks andresponsibilities and may therefore be negatively affected by additional variation intheir jobs. This supports the statements of Goodwin and O’Connor (2007), who claimthat young employees may be overwhelmed by the large amount of new tasks andresponsibilities. Task variation then, may be unsuitable to use as a job resource foryoung employees with intermediate education, and could even function as a jobdemand for this group.
An important finding was that, overall, the young intermediate educatedemployees value the social support provided by their colleagues more than the socialsupport provided by the supervisor. Social support by the colleagues was moreprominently related to the subjective health experience and to the in-roleperformance. This finding is interesting, because it is usually found that thesupervisor has a stronger impact on various outcome variables (e.g. Ouweneel et al.,2009; Tannenbaum, 1997). For young intermediate educated employees, it wouldseem that they value the support of their peers more than the support of theirsupervisor. This is a finding that may characterize a unique aspect of a young targetgroup. Because our target group consists, at least partially, of adolescent employees,a parallel might be found with research on the influence of peers on adolescents.Research has indicated that adolescents are particularly susceptible for peer influence(Maxwell, 2002). This can occur both in a negative way (e.g. peers may sometimesincrease risk behaviour) and a positive way (e.g. peers can act as a buffer againstnegative outside influences). A similar process may occur on the work floor, with theyoung employees being more susceptible to support from their colleagues, comparedwith support from their supervisor. This issue should be taken into account in futureresearch.
The exhaustion process and motivation processEmotional exhaustion was related to both the health of young intermediate educatedemployees and to their performance. Employees who reported a higher level ofemotional exhaustion, felt less healthy and perceived their performance as worse.These findings are in line with earlier studies which found that emotional exhaustionwas negatively related to health and performance (Demerouti et al., 2001; Bakker andDemerouti, 2007).
Contrary to the expectations, however, emotional exhaustion did not mediate therelationship between job demands and general health, nor did it mediate therelationship between job demands and performance. None of the job demands (task,emotional, and cognitive demands) were related to general health, so emotionalexhaustion could not mediate these relationships. In the case of performance, only the
Well-being,health and
performance
689

cognitive demands showed a significant association, but this did not decrease with theaddition of emotional exhaustion. These are surprising findings that contradict thebasic assumptions of the JD-R model (Demerouti et al., 2001).
Job satisfaction was related to health and to performance of young intermediateeducated employees. Employees that were more satisfied with their jobs, felt healthierand perceived their performance as better. These findings are in line with earlierfindings regarding job satisfaction (Schreuder et al., 2008; Halbesleben and Wheeler,2008; Williams and Anderson, 1991) and the motivation process described in the JD-Rmodel (Schaufeli and Bakker, 2004).
In line with the expectations, job satisfaction mediated the relationship betweensocial support and health of young intermediate educated employees. A higher level ofperceived support provided by the supervisor was associated with a higher level of jobsatisfaction, and subsequently with a higher level of perceived health. The same wasfound for social support given by colleagues. However, the association of socialsupport given by colleagues was only partially mediated: it also had a uniqueassociation with general health. This may again illustrate the relative importance ofpeers for young workers, as noted above. Job satisfaction did not mediate theassociations of autonomy and task variation with general health. These resultspartially confirm the assumptions regarding the motivation process of the JD-R model(Schaufeli and Bakker, 2004). It should be noted however, that mixed results have beenfound before: not all of the job resources were consistently mediated in previous studies(e.g. Mauno et al., 2007; Hakanen et al., 2008).
With regard to in-role performance, job satisfaction appeared to be a mediator in therelationship between autonomy and performance. This means that a higher level ofperceived autonomy was associated with higher levels of job satisfaction, whichsubsequently affected performance. Furthermore, an indication was found that jobsatisfaction mediates the relationship between social support given by colleagues andperformance, but this mediation was only marginally significant. No mediation wasfound for task variation and social support given by the supervisor. Again, theseresults partially confirm the assumptions regarding the motivation process of the JD-Rmodel (Schaufeli and Bakker, 2004; Bakker and Demerouti, 2007). The results alsosupport the adequacy of using job satisfaction as the central variable in the motivationprocess, since it mediated multiple relationships between the job resources and theoutcome variables.
Cross-relationshipsWhile job resources played an important role in the motivation process amongyoung intermediate educated employees, the job resources also proved to berelevant for the exhaustion process. A higher level of social support (both by thesupervisor and the colleagues) was related to a lower level of emotional exhaustion,which was subsequently associated with a higher level of health. In addition, ahigher level of autonomy and social support given by colleagues was related to alower level of emotional exhaustion, which was subsequently associated with ahigher level of performance. It seems that job resources have a buffering effect onthe exhaustion process, thereby supporting earlier findings in this area regardingthe buffer hypothesis (Bakker and Demerouti, 2007). It should be noted, however,that the job demands in themselves had little effect on health and performance in
CDI14,7
690

the first place. Hence, job resources, compared with job demands, may be moreimportant determinants of well-being, health and performance of young intermediateeducated employees.
Importance of investigating separate groupsThe determinants of well-being, health and performance were also examined for thelow educated and high educated groups. Because this study focuses mainly ondeterminants of well-being for employees with intermediate education, we did notelaborate on the other two groups here. However, as can be seen in the Appendix, itseems clear that the determinants differ in various ways between the three educationalgroups. These differences illustrate the importance of distinguishing betweeneducational levels, since the well-being, health and performance of each educationalgroup is determined by distinct processes. It also underlines the uniqueness of theintermediate educated group and supports, in this way, the value of focussing on thisoften neglected group.
Limitations and suggestions for future researchDespite the large sample size and nationally representative nature of the sample, alimitation of this study was its cross-sectional nature. Cross-sectional designs onlyshow a measure of one specific point in time and are therefore not very well suited totest for causal relationships and mediation effects: the cross-sectional design limits theinterpretation of indirect relationships (Taris and Kompier, 2006). Therefore,longitudinal data are needed to confirm the findings of this study. Follow-upassessments of the sample used for this manuscript will be available in the near future(Netherlands Working Conditions Cohort Study (NWCCS)) and longitudinal analyseswill be performed to verify the present findings.
A second limitation was the use of regression analyses to test the assumptions ofthe JD-R model, especially the mediation effects. Structural equation modelling shouldbe more suitable for this purpose and has often been used in other in JD-R relatedstudies (e.g. Xanthopoulou et al., 2007). This was not done in the current study becausethe variables in the dataset were weighed to represent the Dutch labour market andstructural equation modelling requires the user to undo the weights. The weights wereespecially important for the comparisons between the educational groups and weretherefore sustained to be able to make a representative comparison with the entireDutch labour market. In the follow-up study, using the NWCCS data, the central aimwill be the testing of the theoretical model, making the weights far less important.Therefore, structural equation modelling will be used in the follow-up study to furtherverify the assumptions of the JD-R model for the young intermediate educatedemployees.
Another possible limitation was the use of job satisfaction as the central mediatorvariable in the JD-R model. Although it is applicable and the results were in line withour expectations, it is more common to use work engagement as the central variable ofthe motivation process (Schaufeli and Bakker, 2004; Bakker and Demerouti, 2008).Work engagement is assumed to be the positive counterpart of burnout and can bedefined as a positive, fulfilling, work-related state of mind that is characterized byvigour, dedication, and absorption (Schaufeli et al., 2002) and it is related toperformance in a positive way (Bakker et al., 2008a, b). Work engagement is a more
Well-being,health and
performance
691

active motivational aspect of well-being and might be better suitable as the centralvariable of the motivation process. In the NWCCS study, work engagement isavailable, and will therefore be used as the central variable in the motivation process.
Self-report measures were used in this study to measure health and performance.These measures are valuable in their own right, but have an intrinsic subjective aspect.Therefore, it would be interesting to combine these with more objective measures ofhealth and performance as outcome variables. For instance, in some professionsobjective sales performances could be used as an objective measure for performance(Bakker et al., 2008a, b), whereas medical databases could be used as indicators of moreobjective health criteria.
The amount of explained variance in the current study seemed to be modest for anumber of variables. A possible explanation is that a limited number of variables wasused in each regression analysis, most notably that the job demands and the jobresources were analyzed separately. Moreover, the job demands and job resources thatwere included in this study are not the only possible work characteristics to be used inJD-R related research. Other demands (e.g. conflict at work) and resources (e.g.feedback) have been studied in previous research and might add to the explainedvariance in this study. Future studies should explore the influence of other jobdemands and job resources as well, to replicate and expand the current findings.
Finally, this study made use of the NWCS 2007, which gives an overview of theworking conditions in the Dutch labour market. This could possibly posegeneralization problems to the working conditions of the labour markets in othercountries. Therefore, generalizations of the current findings to employees outside of theDutch labour market should be made with caution.
Practical implicationsEmployers and HR managers should be aware that job resources are of greatimportance to young intermediate educated employees. At this point, it appears thatthis group experiences less resources compared with higher educated employees, but atthe same time these resources are important predictors for their health andperformance. The balance between demands and resources at work should bemonitored for this group and close attention should be paid to the provision ofsufficient resources in their jobs, such as autonomy at work and social supportprovided both by the supervisor and the colleagues.
This study showed that the support that is provided by colleagues might beespecially important for young employees. Therefore, it is important for employers andHR managers that attempts are made to optimize the social ties between colleagues, forinstance by organizing informal activities. Another possibility would be to assign acolleague to be a mentor to young employees that have recently started a job in theircompany. This form of support could help the young employees get through theirsocialization process after they have just started a new job.
Another practical implication of this study is that young employees withintermediate education perform less well when they experience more variation in theirtasks. This means that employers should carefully watch the job requirements ofemployees that are just starting a new job and should monitor whether new employeesare able to adjust to their job. New employees should not have too many different tasksand responsibilities.
CDI14,7
692

Theoretical implicationsThis study has provided insight into the working conditions, well-being, health andperformance of young employees with intermediate education. We have provided anoverview of the similarities and differences between three educational groups of youngemployees. Low and intermediate educated young employees are more similar thanthey are different, but higher educated employees differ from intermediate educatedemployees on most of the working condition and well-being indicators. Furthermore,this study has added to the theoretical knowledge of the JD-R model by showing thatseveral assumptions are also applicable to a young intermediate educated group ofemployees. The study has also shown that some processes are apparently different forthis specific group, most notably with respect to the (important) role of job resources.We hope that these results will serve as an impetus for future research among youngemployees with intermediate education.
References
Arthur, M.B., Khapova, S.N. and Wilderom, C.P.M. (2005), “Career success in a boundarylesscareer world”, Journal of Organizational Behavior, Vol. 26 No. 2, pp. 177-202.
Bakker, A.B. and Demerouti, E. (2007), “The job demands-resources model: state of the art”,Journal of Managerial Psychology, Vol. 22 No. 3, pp. 309-28.
Bakker, A.B. and Demerouti, E. (2008), “Towards a model of work engagement”, CareerDevelopment International, Vol. 13 No. 3, pp. 209-23.
Bakker, A.B., Van Emmerik, H. and Van Riet, P. (2008), “How job demands, resources, andburnout predict objective performance: a constructive replication”, Anxiety, Stress andCoping, Vol. 21 No. 3, pp. 309-24.
Bakker, A.B., Schaufeli, W.B., Leiter, M.P. and Taris, T.W. (2008), “Work engagement: anemerging concept in occupational health psychology”, Work and Stress, Vol. 22 No. 3,pp. 187-200.
Baron, R.M. and Kenny, D.A. (1986), “The moderator-mediator variable distinction in socialpsychological research. Conceptual, strategic, and statistical considerations”, Journal ofPersonality and Social Psychology, Vol. 51 No. 6, pp. 1173-82.
Clarke, M. (2009), “Plodders, pragmatists, visionaries and opportunists: career patterns andemployability”, Career Development International, Vol. 14 No. 1, pp. 8-28.
Demerouti, E., Nachreiner, F., Bakker, A.B. and Schaufeli, W.B. (2001), “The jobdemands-resources model of burnout”, Journal of Applied Psychology, Vol. 86 No. 3,pp. 499-512.
Eby, L.T., Butts, M. and Lockwood, A. (2003), “Predictors of success in the era of theboundaryless career”, Journal of Organizational Behavior, Vol. 24 No. 6, pp. 689-708.
Goodman, S.A. and Svyantek, D.J. (1999), “Person-organization fit and contextual performance:do shared values matter”, Journal of Vocational Behavior, Vol. 55 No. 2, pp. 254-75.
Goodwin, J. and O’Connor, H. (2007), “Continuity and change in the experiences of transition fromschool to work”, International Journal of Lifelong Education, Vol. 26 No. 5, pp. 555-72.
Gustainiene, L. and Endriulaitiene, A. (2009), “Job satisfaction and subjective health among salesmanagers”, Baltic Journal of Management, Vol. 4 No. 1, pp. 51-65.
Hackman, J.R. and Oldham, G.R. (1980), Work Redesign, Addison-Wesley, Reading, MA.
Hackman, J.R. and Oldham, G.R. (1976), “Motivation through the design of work: test of atheory”, Organizational Behavior and Human Performance, Vol. 16 No. 2, pp. 250-79.
Well-being,health and
performance
693

Hakanen, J.J., Bakker, A.B. and Schaufeli, W.B. (2006), “Burnout and work engagement amongteachers”, Journal of School Psychology, Vol. 43 No. 6, pp. 495-513.
Hakanen, J.J., Schaufeli, W.B. and Ahola, K. (2008), “The job demands-resources model: athree-year cross-lagged study of burnout, depression, commitment, and workengagement”, Work and Stress, Vol. 22 No. 3, pp. 224-41.
Halbesleben, J.R.B. and Wheeler, A.R. (2008), “The relative roles of engagement andembeddedness in predicting job performance and intention to leave”, Work and Stress,Vol. 22 No. 3, pp. 242-56.
Houtman, I.L.D., Goudswaard, A., Dhondt, S., Van der Grinten, M., Hildebrandt, V. and Kompier,M. (1995), Evaluatie van de monitorstudie naar stress en lichamelijke belasting, VUGA, DenHaag.
Johnson, J.V. and Hall, E.M. (1988), “Job strain, work place social support, and cardiovasculardisease: a cross-sectional study of random sample of the Swedish Working Population”,American Journal of Public Health, Vol. 78 No. 10, pp. 1336-42.
Karasek, R.A. (1979), “Job demands, job decision latitude, and mental strain: implications for jobredesign”, Administrative Science Quarterly, Vol. 24 No. 2, pp. 285-308.
Karasek, R.A. (1985), Job Content Questionnaire and User’s Guide, Department of WorkEnvironment, University of Massachusetts, Lowell, MA.
Karasek, R., Brisson, C., Kawakami, N., Houtman, I., Bongers, P. and Amick, B. (1998), “The JobContent Questionnaire (JCQ): an instrument for internationally comparative assessmentsof psychosocial job characteristics”, Journal of Occupational Health Psychology, Vol. 3 No. 4,pp. 322-55.
Koivisto, P., Vuori, J. and Nykyri, E. (2007), “Effects of the school-to-work group method amongyoung people”, Journal of Vocational Behavior, Vol. 70 No. 2, pp. 277-96.
Kristensen, T. and Borg, V. (2000), Copenhagen Psychosocial Questionnaire (COPSOQ), NationalInstitute of Occupational Health, Copenhagen.
Lee, R.T. and Ashforth, B.E. (1996), “A meta-analytic examination of the correlates of the threedimensions of job burnout”, Journal of Applied Psychology, Vol. 81 No. 2, pp. 123-33.
Lewig, K.A., Xanthopoulou, D., Bakker, A.B., Dollard, M.F. and Metzer, J.C. (2007), “Burnout andconnectedness among Australian volunteers: a test of the job demands-resources model”,Journal of Vocational Behavior, Vol. 71 No. 3, pp. 429-45.
Maslach, C., Jackson, S.E. and Leiter, M.P. (1996), The Maslach Burnout Inventory, 3rd ed.,Consulting Psychology Press, Palo Alto, CA.
Mauno, S., Kinnunen, U. and Ruokolainen, M. (2007), “Job demands and resources as antecedentsof work engagement: a longitudinal study”, Journal of Vocational Behavior, Vol. 70 No. 1,pp. 149-71.
Maxwell, K.A. (2002), “Friends: The role of peer influence across adolescent risk behaviors”,Journal of Youth and Adolescence, Vol. 31 No. 4, pp. 267-77.
Meijman, T.F. and Mulder, G. (1998), “Psychological aspects of workload”, in Drenth, P.J.,Thierry, H. and De Wolff, C.J. (Eds), Handbook of Work and Organizational Psychology,2nd ed., Erlbaum, Hove, pp. 5-33.
Ouweneel, A.P., Taris, T.W., Van Zolingen, S.J. and Schreurs, P.J. (2009), “How taskcharacteristics and social support relate to managerial learning: empirical evidence fromDutch home care”, The Journal of psychology, Vol. 143 No. 1, pp. 28-44.
Raad voor Werk en Inkomen (2006), Arbeidsmarktanalyse 2006, Raad voor Werk en Inkomen.
Raad voor Werk en Inkomen (2009), Arbeidsmarktanalyse 2009, Raad voor Werk en Inkomen.
Ryan, P. (2001), “The school-to-work transition: a cross-national perspective”, Journal ofEconomic Literature, Vol. 39 No. 1, pp. 34-92.
CDI14,7
694

Savickas, M.L. (1998), “The transition from school to work: a developmental perspective”, CareerDevelopment Quarterly, Vol. 47 No. 4, pp. 326-36.
Schaufeli, W.B. and Bakker, A.B. (2004), “Job demands, job resources, and their relationship withburnout and engagement: a multi-sample study”, Journal of Organizational Behavior,Vol. 25 No. 3, pp. 293-315.
Schaufeli, W. and Enzmann, D. (1998), “The burnout companion to study and practice: a criticalanalysis”, CRC.
Schaufeli, W.B. and Van Dierendonck, D. (2000), Handleiding van de Utrechtse Burnout Schaal(ubos), Swets and Zeitlinger, Lisse.
Schaufeli, W.B., Leiter, M.P. and Maslach, C. (2009), “Burnout: 35 years of research and practice”,Career Development International, Vol. 14 No. 3, pp. 204-20.
Schaufeli, W.B., Salanova, M., Gonzalez-Roma, V. and Bakker, A.B. (2002), “The measurement ofengagement and burnout: a two sample confirmatory factor analytic approach”, Journal ofHappiness Studies, Vol. 3 No. 1, pp. 71-92.
Scholarios, D., Van der Heijden, B., Van der Schoot, E., Bozionelos, N., Epitropaki, O.,Jedrzejowicz, P., Knauth, P., Marzec, I., Mikkelsen, A. and Van der Heijde, C. (2008),“Employability and the psychological contract in European ICT sector SMEs”,International Journal of Human Resource Management, Vol. 19 No. 6, pp. 1035-55.
Schouten, W. (2009), “Wat is er aan de hand aan de onderkant?” (Homepage of RWI, online),available: www.profielconferenties.nl/l/nl/library/download/1605 (accessed 6 November2009).
Schreuder, K.J., Roelen, C.A.M., Koopmans, P.C. and Groothoff, J.W. (2008), “Job demands andhealth complaints in white and blue collar workers”, Work, Vol. 31 No. 4, pp. 425-32.
Shacklock, K., Brunetto, Y. and Nelson, S. (2009), “The different variables that affect older males’and females’ intentions to continue working”, Asia Pacific Journal of Human Resources,Vol. 47 No. 1, pp. 79-101.
Smulders, P.G.W. (2005), “Jongere en oudere werknemers: hun werk, werktijden, ongevallen enverzuim”, TNO, Hoofddorp.
Spector, P.E. (1997), Job Satisfaction. Application, Assesment, Causes and Consequences, 1st ed.,Sage Publications, London.
Statistics Netherlands (2003), Integrated System of Social Surveys (POLS) 2003, StatisticsNetherlands, Heerlen.
Tannenbaum, S.I. (1997), “Enhancing continuous learning: diagnostic findings from multiplecompanes”, Human Resource Management, Vol. 36 No. 4, pp. 437-52.
Taris, T.W. and Kompier, M.A.J. (2006), “Games researchers play – Extreme-groups analysis andmediation analysis in longitudinal occupational health research”, Scandinavian Journal ofWork, Environment and Health, Vol. 32 No. 6, pp. 463-72.
Van Cruchten, J.M.J. (1997), “Ziekteverzuim; uitkomsten van de Enquete beroepsbevolking,1992-1995”, Sociaal-economisch maandstatistiek, April.
Van den Bossche, S.N.J., Koppes, L.L.J., Granzier, J.J.M., De Vroome, E.M.M. and Smulders,P.G.W. (2008), Nationale Enquete Arbeidsomstandigheden 2007: Methodologie en globaleresultaten, PlantijnCasparie, Almere.
Van Der Doef, M. and Maes, S. (1999), “The Job Demand-Control(-Support) model andpsychological well-being: a review of 20 years of empirical research”, Work and Stress,Vol. 13 No. 2, pp. 87-114.
van Der Heijden, B.I.J.M., Schalk, R. and Van Veldhoven, M.J.P.M. (2008), “Ageing and careers:European research on long-term career development and early retirement”, CareerDevelopment International, Vol. 13 No. 2, pp. 85-94.
Well-being,health and
performance
695

van der Heijden, B.I.J.M., de Lange, A.H., Demerouti, E. and Van der Heijde, C.M. (2009), “Ageeffects on the employability-career success relationship”, Journal of Vocational Behavior,Vol. 74 No. 2, pp. 156-64.
van Eijs, P. (2003), De arbeidsmarkt voor MBO-schoolverlaters: nu en straks, April 2003 ed.,Faculteit der Economische Wetenschappen en Bendrijfskunde, Universiteit Maastricht,Maastricht.
Williams, L.J. and Anderson, S.E. (1991), “Job satisfaction and organizational commitment aspredictors of organizational citizenship and in-role behaviors”, Journal of Management,Vol. 17, pp. 601-17.
Wright, T.A. and Bonett, D.G. (1997), “The contribution of burnout to work performance”,Journal of Organizational Behavior, Vol. 18 No. 5, pp. 491-9.
Xanthopoulou, D., Bakker, A.B., Dollard, M.F., Demerouti, E., Schaufeli, W.B., Taris, T.W. andSchreurs, P.J.G. (2007), “When do job demands particularly predict burnout? Themoderating role of job resources”, Journal of Managerial Psychology, Vol. 22 No. 8,pp. 766-86.
AppendixIn Tables AI-AVIII, B is represented in stead of b, since comparisons are made between groups.
Job satisfactionLow Intermediate High
B DR 2 B DR 2 B DR 2
Step 1 0.02* 0.00 0.01Gender 20.15* 20.04 20.11Age 20.05* 20.02 0.02Step 2 0.08* 0.07* 0.06*Workload 20.29* 20.26* 20.15Emotional demands 20.28* 20.19* 20.24*Cognitive demands 0.10* 0.18* 0.20*
Note: * p , 0.01
Table AII.Gender and age adjustedregression coefficients ofthe associations of jobdemands with jobsatisfaction
Emotional exhaustionLow Intermediate High
B DR 2 B DR 2 B DR 2
Step 1 0.01* 0.01* 0.00Gender 0.11 20.01 0.07Age 0.06* 0.04* 0.03Step 2 0.20* 0.15* 0.20*Workload 0.55* 0.43* 0.43*Emotional demands 0.50* 0.46* 0.50*Cognitive demands 20.03 20.06 20.03
Note: * p , 0.01
Table AI.Gender and age adjustedregression coefficients ofthe associations of jobdemands with emotionalexhaustion
CDI14,7
696

Emotional exhaustionLow Intermediate High
B DR 2 B DR 2 B DR 2
Step 1 0.02** 0.01* 0.00Gender 0.19* 0.03 0.06Age 0.06** 0.04* 0.01Step 2 0.11** 0.09** 0.06**Autonomy 0.13 20.29** 0.03Task variation 20.10* 20.01 0.08Social support supervisor 20.30** 20.35** 20.33**Social support colleague 20.39** 20.16** 20.13
Note: * p , 0.05; ** p , 0.01
Table AIII.Gender and age adjustedregression coefficients of
the associations of jobresources with emotional
exhaustion
Job satisfactionLow Intermediate High
B DR 2 B DR 2 B DR 2
Step 1 0.02** 0.00 0.01Gender 20.24** 20.05 20.10Age 20.03* 20.02 0.02Step 2 0.16** 0.19** 0.19**Autonomy 0.14* 0.18** 0.00Task variation 0.11** 0.07* 0.13*Social support supervisor 0.28** 0.39** 0.41**Social support colleague 0.31** 0.18** 0.14
Note: * p , 0.05; ** p , 0.01
Table AIV.Gender and age adjustedregression coefficients of
the associations of jobresources with job
satisfaction
General healthLow Intermediate High
B DR 2 B DR 2 B DR 2
Step 1 0.02** 0.02** 0.01Gender 20.27** 20.22** 20.17Age 20.01 20.03 20.03Step 2 0.02** 0.00 0.01Workload 20.15** 20.03 20.10Emotional demands 20.11* 20.06 20.11Cognitive demands 0.07 20.02 0.09Step 3 0.05** 0.03** 0.03**Workload 20.04 0.05 20.03Emotional demands 20.01 0.02 20.04Cognitive demands 0.07 20.03 0.08Emotional exhaustion 20.20** 20.18** 20.15**
Notes: * p , 0.05; ** p , 0.01; emotional exhaustion fully mediated the relationship betweenworkload and general health (sobel statistic t=6.46, p , 0.01), and between emotional demands andgeneral health (sobel statistic t=2.89, p , 0.01) for the low educated group
Table AV.Gender and age adjustedregression coefficients of
the associations of jobdemands and emotionalexhaustion with general
health
Well-being,health and
performance
697
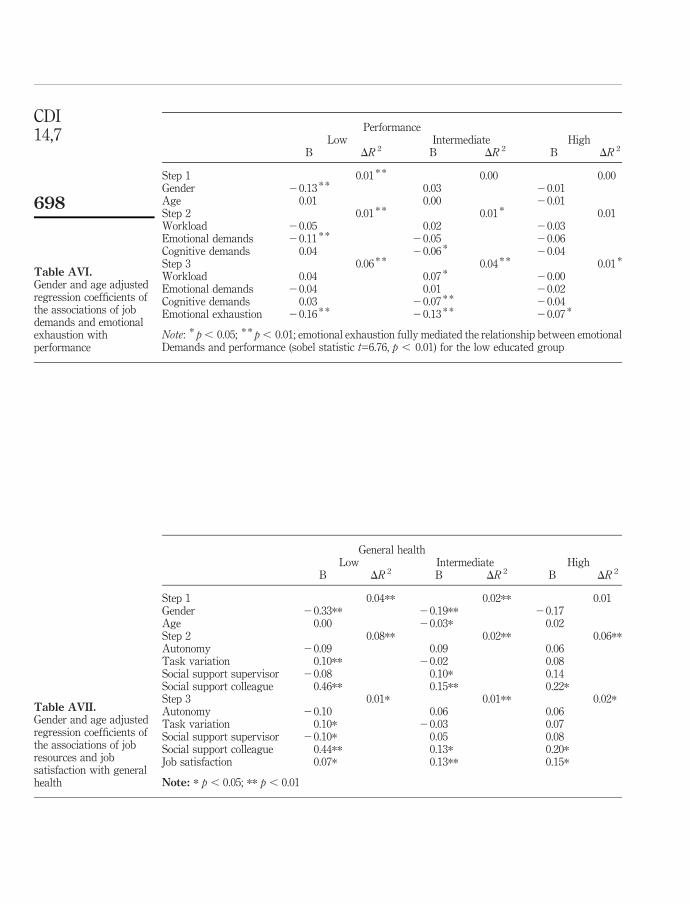
PerformanceLow Intermediate High
B DR 2 B DR 2 B DR 2
Step 1 0.01 * * 0.00 0.00Gender 20.13 * * 0.03 20.01Age 0.01 0.00 20.01Step 2 0.01 * * 0.01 * 0.01Workload 20.05 0.02 20.03Emotional demands 20.11 * * 20.05 20.06Cognitive demands 0.04 20.06 * 20.04Step 3 0.06 * * 0.04 * * 0.01 *
Workload 0.04 0.07 * 20.00Emotional demands 20.04 0.01 20.02Cognitive demands 0.03 20.07 * * 20.04Emotional exhaustion 20.16 * * 20.13 * * 20.07 *
Note: * p , 0.05; * * p , 0.01; emotional exhaustion fully mediated the relationship between emotionalDemands and performance (sobel statistic t=6.76, p , 0.01) for the low educated group
Table AVI.Gender and age adjustedregression coefficients ofthe associations of jobdemands and emotionalexhaustion withperformance
General healthLow Intermediate High
B DR 2 B DR 2 B DR 2
Step 1 0.04** 0.02** 0.01Gender 20.33** 20.19** 20.17Age 0.00 20.03* 0.02Step 2 0.08** 0.02** 0.06**Autonomy 20.09 0.09 0.06Task variation 0.10** 20.02 0.08Social support supervisor 20.08 0.10* 0.14Social support colleague 0.46** 0.15** 0.22*Step 3 0.01* 0.01** 0.02*Autonomy 20.10 0.06 0.06Task variation 0.10* 20.03 0.07Social support supervisor 20.10* 0.05 0.08Social support colleague 0.44** 0.13* 0.20*Job satisfaction 0.07* 0.13** 0.15*
Note: * p , 0.05; ** p , 0.01
Table AVII.Gender and age adjustedregression coefficients ofthe associations of jobresources and jobsatisfaction with generalhealth
CDI14,7
698

About the authorsJos Akkermans is a Work and Organizational Psychologist who graduated at Utrecht University,The Netherlands. He is working on this PhD study that focuses on young employees withintermediate education (i.e. 10-14 years of education). The aims of the study are to give moreinsight into the well-being and performance of this specific group, and to develop theCareerSkills group intervention that will stimulate the career development of this group. Jos isworking in cooperation with the Netherlands Association for Applied Scientific Research (TNO).Career Competencies and Employability will have a central role in this study. Jos Akkermans isthe corresponding author and can be contacted at: [email protected]
Veerle Brenninkmeijer is working as an Assistant Professor at Utrecht University, Departmentof Social and Organizational Psychology, The Netherlands. She conducts research in the broadfield of work and organizational psychology, covering issues like well-being and performance inthe work situation, career development of young professionals, and reintegration of employeeswith mental health complaints. In her former job, Veerle Brenninkmeijer worked as aresearcher/consultant for the Netherlands Association for Applied Scientific Research (TNO). Inthis job she focused on long-term sickness absence, reintegration and activation of theunemployed. She wrote her PhD. thesis at the University of Groningen on Social Comparison andBurnout.
Roland W.B. Blonk is educated in Clinical Psychology at the University of Amsterdam, TheNetherlands and received his PhD on Treatment Outcome Studies. Currently he is employed atTNO Work and Employment, one of the largest applied research centres in Europe. He holds aspecial chair at the University of Utrecht on two research topics “Work related psychologicalcomplaints and return to work” and “Social inclusion and employability”. Besides TeamManager at TNO he is program manager of two large research programs on these issues.
Lando L.J. Koppes is educated in Human Movement Sciences and Epidemiology. He receivedhis PhD at the Vrije Universiteit in Amsterdam on a thesis about Alcohol Consumption. He iscurrently employed at TNO Work and Employment, doing research in the fields of work,employment and health. Lando L.J. Koppes is Principal Investigator of the Netherlands WorkingConditions Survey, the survey that is used for this manuscript.
PerformanceLow Intermediate High
B DR 2 B DR 2 B DR 2
Step 1 0.01 0.00 0.00Gender 20.09* 0.04 20.04Age 0.01 20.00 0.07Step 2 0.05** 0.03** 0.03Autonomy 0.06 0.14** 0.05Task variation 0.00 20.09** 20.12**Social support supervisor 20.04 0.05 0.07Social support colleague 0.28** 0.07* 0.00Step 3 0.01** 0.01** 0.00Autonomy 0.04 0.13** 0.05Task variation 20.00 20.09** 20.12**Social support supervisor 20.06 0.02 0.07Social support colleague 0.25** 0.06 20.00Job satisfaction 0.08** 0.06* 0.01
Note: * p , 0.05; ** p , 0.01
Table AVIII.Gender and age adjustedregression coefficients of
the associations of jobresources and jobsatisfaction with
performance
Well-being,health and
performance
699
To purchase reprints of this article please e-mail: [email protected] visit our web site for further details: www.emeraldinsight.com/reprints