Aker ASA Capital Markets Day 2013 · Aker Solutions ... low WACC › High revenue visibility ›...
54
Aker ASA Capital Markets Day 2013 14 November 2013
Transcript of Aker ASA Capital Markets Day 2013 · Aker Solutions ... low WACC › High revenue visibility ›...

Aker ASA Capital Markets Day 2013
14 November 2013

08:00 Registration
PART 1:
08:15 Aker 3Q13 results Øyvind Eriksen, CEO Trond Brandsrud, CFO
PART 2:
08:30 Status & strategic direction Øyvind Eriksen 09:00 Q&A
PART 3:
09:10 Investment perspectives on Aker’s energy portfolio:
Aker Solutions, Q&A Ed Ross, Investment Director Kvaerner, Q&A Michael Buffet, Investment Director Det norske, Q&A Trond Brandsrud
10:10 Break
PART 4:
10:30 Aker’s unlisted assets:
Aker BioMarine, Q&A Fredrik Nygaard, CFO, Aker BioMarine Fornebuporten, Q&A Torstein Storækre, Managing Director Converto, Q&A Frank O. Reite, Partner at Converto
PART 5:
11:40 Aker’s financial strategy Trond Brandsrud12:00 Q&A
Aker ASA Capital Markets Day 2013
Internet access:1. Log on to “ks-guest”2. Open your internet browser3. Register as new user and follow the instructions4. Write “ksa” in the field called “Secret”5. A username and password will be sent to your mobile

Proud ownership
Status and strategic directionØyvind Eriksen | President and CEO, Aker ASA
Development since CMD 2012
Capital Markets Day 2013 | Status & Strategic DirectionAker ASA
Objective Realisation
Active ownership
Dividend policy
Financial strength
Ocean Yield IPO, AKBM delisted
3.7% of NAV paid out, nominal increase
Upstream cash flow increased by over 80%
NAV growth 1. Aker Solutions execution challenges2. Kvaerner loss of contracts3. Det norske value unchanged4. AKBM value not fully reflected in NAV
2
Reveal underlying values
AKBM’s divestment of Epax
2

2013 YTD financial performance
Capital Markets Day 2013 | Status & Strategic Direction 3Aker ASA
22.9
21.8
(2.2)
(0.5)
(0.1)0.3
0.6
0.9
0.7 (0.9)
14
16
18
20
22
24
31.12.12 AKSO KVAER DETNOR AKBM OCY Funds Receiveddividend
Paid dividend 30.9.13
NOK billion
2008
Portfolio transformation over past 5 years
Capital Markets Day 2013 | Status & Strategic Direction 4Aker ASA
2013
3

Positioned in attractive industry segments
Capital Markets Day 2013 | Status & Strategic Direction 5Aker ASA
Oil and gas Maritime assetsSeafood and
Marine BioTech
Deepwater and subsea U.S. Jones Act Krill
A strong balance sheet
Capital Markets Day 2013 | Status & Strategic Direction 6Aker ASA
0
5
10
15
20
25
30
Gross assets Debt
Non-interest bearing liabilites ex. dividend
Interest bearing liabilities
Other assets
Receivables
Cash
Industrial holdings
BNOK 5 in cash
NOK 22 billionin unleveraged assets
BNOK
4

A liquid portfolio of investments
Capital Markets Day 2013 | Status & Strategic Direction 7Aker ASA
NOK 14 billion
A portfolio of both listed and unlisted assets
Capital Markets Day 2013 | Status & Strategic Direction 8Aker ASA
Unlisted
listed unlisted
5

0
100
200
300
400
500
600
700
800
900
2009 2010 2011 2012 2013
Aker Kvaerner Holding Ocean Yield Other
137191175
461
~850
Aker’s dividend income 2009 – 2013
Capital Markets Day 2013 | Status & Strategic Direction 9Aker ASA
Dividend income
2012 2013 2016 2020
Aker Solutions
Kvaerner
Det norske
Ocean Yield
Aker BioMarine
Havfisk
NOK million
Value contributors to Aker over past 5 years
Capital Markets Day 2013 | Status & Strategic Direction 10Aker ASA
18.5
22.2
5.0
3.21.0 (0.8) 0.3
0.6 (0.5)(1.8)
(3.3)
14
16
18
20
22
24
26
28
30
01.01.09 AKSO DETNOR OCY AKD Other Industrial Funds Admin andinterest
Write down andother
Paid dividend 31.10.13OtherInvestments(incl. Funds)
NOK billion
6
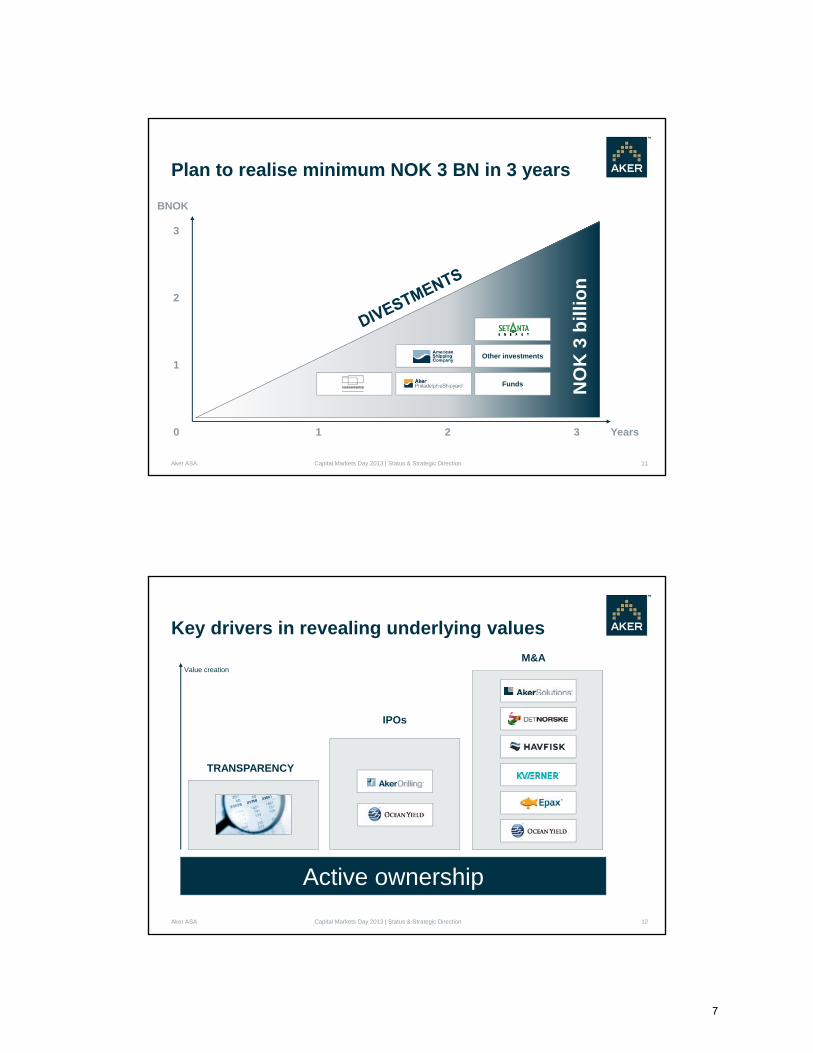
Plan to realise minimum NOK 3 BN in 3 years
Capital Markets Day 2013 | Status & Strategic Direction 11Aker ASA
Funds
Other investments
1 2 30 Years
BNOK
1
2
3
NO
K 3
bill
ion
Key drivers in revealing underlying values
Capital Markets Day 2013 | Status & Strategic Direction 12Aker ASA
Active ownership
TRANSPARENCY
IPOs
M&AValue creation
7

How Aker operates
Board of Directors
Aker ASA Capital Markets Day 2013 | Status & Strategic Direction
OPERATING COMPANY
Aker’s Board representative(s)
DEFINE AND FOLLOW UP AKER’S VALUE CREATION PLAN
Investment DirectorFinance Committee Investment Team
Management
13
Industry Insights Analytical Capacity Feedback on Mgmt Proposals
Capital Discipline Cost control and operational improvements Focus on cost of equity IR strategy
Aker asa shareholder
Aker Solutions
Capital Markets Day 2013 | Status & Strategic DirectionAker ASA
Opportunities
Challenges
› Subsea factory - high systemintegration
› Strong presence on the NCS
› Execution challenges› Asset-intensive units
14
Ownership agenda› Subsea leadership
› High ROCE
› Promote operational excellence
› Streamline portfolio around growingoffshore regions and segments
Strong presence in growth regions
8

Opportunities
Challenges
Ownership agenda
Det norske
Capital Markets Day 2013 | Status & Strategic DirectionAker ASA
› Ownership stake in Johan Sverdrup› Building operatorship experience
15
› Financing requirements
› Young organisation whosecapabilities need to be enhanced
› Secure financing for Johan Sverdrup and participate without dilution
› Highgrade portfolio
› Grow through focused exploration
› Introduce annual dividend followingJohan Sverdrup production start
Opportunities
Challenges
Ownership agenda
Ocean Yield
Capital Markets Day 2013 | Status & Strategic DirectionAker ASA
› Cost-efficient operation, low WACC› High revenue visibility› Solid demand for ship leasing
› Portfolio insufficiently diversified› Risk of growing competition
16
› Maintain high dividend yield
› Grow and diversify portfolio through regular acquisitions
› Ensure optimal capital structure
9

Opportunities
Challenges
Ownership agenda
Aker BioMarine
Capital Markets Day 2013 | Status & Strategic DirectionAker ASA
› High margin business › Strong global growth in krill oil
17
› Legal disputes over patents› Risk of increased competition
› Expand krill oil production capacity
› Expand market for krill derivedproducts
› Generate upstream cash flow for Aker
› Gradually realise remainingpharmaceutical assets
Kvaerner
Capital Markets Day 2013 | Status & Strategic DirectionAker ASA 18
Ownership agenda
› Restructure and focus the business model
› Maintain operational excellence
› Focus on NCS and Concrete
› Optimise portfolio of quotas & trawlers
› Enhance profitability
› Generate upstream cash flow to Aker
Ownership agenda
Havfisk
10

Conclusion
Capital Markets Day 2013 | Status & Strategic DirectionAker ASA
Active and committed ownership
Prioritise resources to main portfolio value drivers
Focus on cost of equity and capital discipline
19
Actively pursue value-enhancing M&A opportunities
11

Proud ownership
Aker SolutionsEdward Ross | Investment Director, Aker ASA
Aker Solutions is the cornerstone of Aker ASA
2
431 700 741
1 053 1 082
2009 2010 2011 2012 2013
Aker Solutions’ dividend 2009 – 2013
% of Aker ASA gross asset value
23%
Aker ASA Capital Markets Day | Aker Solutions
(30.09.13)
NOK million
0
20
40
60
80
100
120
140
Aker Solutions has delivered a 30% average return p.a. , including dividend
NOK since April 2009
2010 2011 2012 2013
12

20
40
60
80
100
120
30. des. 2011 29. feb. 2012 30. apr. 2012 30. jun. 2012 31. aug. 2012 31. okt. 2012 31. des. 2012 28. feb. 2013 30. apr. 2013 30. jun. 2013 31. aug. 2013 31. okt. 2013
AKSO
FMC
NOV
CAM
Developments since Aker’s 2012 CMD
Record order intake for Subsea, but Engineering loses key contracts
Aker ASA Capital Markets Day | Aker Solutions 3
Challenges Disposal of MLS and start-up of Skandi Aker
Operational PortfolioBacklog
Placeholder Placeholder Placeholder
Share price development of AKSO and benchmarks (NOK, rebased to AKSO) – 1 Jan. 2012 to 8 Nov. 2013
20132012
Industrial conglomerate to subsea champion
Capital Markets Day | Aker Solutions 4Aker ASA
Future2002
Barriers to entry
Growth
Returns
Predictability
Lower
Higher
2010 Sale of P&C to JacobsReduce risk, exit Downstream EPC
2002 Merger of
2011 Sale of Marine Contractors to EzraReduce capital intensity
2011 Demerger of KvaernerReduce risk, exit EPC
Today 8 business areas
The future Subsea ChampionHigh growth and returns
2013 Sale of MLS to CargotecReduce Risk
13

7 055
Aker Solutions’positioning in industry trends
15 699
12 515
2004 2005 2006 2007 2008 2009 2010 2011 2012 2013e 2014e 2015e 2016e 2017e 2018e
+22%
10 460
5 723
8 3196 295
5 2333 7673 272
1 294
19 184
9 588
6 1854 145
Subsea Market size by product group
Sources: Quest, Rystad, Pareto, Morgan Stanley, AKSO
MUSD
Engineering12- 15%
Drilling Technology8-10% ~ 12-17 UDW units year
MMO3-5%
Umbilicals and Process 10% +Industry
growth rates2012-2017
Subsea production umbilicals installed
Subsea manifoldsTree control packagesSubsea trees & control pods
Outlook for Aker Solutions’ business areas
Platforms/FPSO Subsea Drill Tech
ProductsSUB, PRS, UMB
Cost PlusEngineering
Lump sumIntegration &Maintenance
Target ROCE: 18%-22%Growth: 15%+
Target ROCE: 15%-20%Growth: 8%-10%
The FutureSubsea Factory
AKSO Exposure Growth and Return Outlook8 Barriers to entry
4
6
4
7
8
9
7
Aker ASA Capital Markets Day | Aker Solutions 6
7
7
14

How to ensure that AKSO captures value
Capital Markets Day | Aker Solutions 7Aker ASA
Focus investments
on businesses with high growth and high barriers to entry
Focus investments
on businesses with high growth and high barriers to entry
Cost control
especially SG&A and group purchasing
Cost control
especially SG&A and group purchasing
Upgrade financial control function
to improve information collectionand analysis
Upgrade financial control function
to improve information collectionand analysis
9.6x8.8x
8.3x7.9x 7.6x 7.5x 7.3x 7.0x
SUB UMB ENG MMO PRS DRT OMA WIS
8
Aker Solutions trades at a discount to peers…
SUB: FMC Technologies and Cameron. UMB: Oceaneering, Technip. ENG: Wood Group, WorleyParsons, Petrofac, Amec. DRT: National Oilwell Varco. MMO: Wood Group, Amec, Petrofac. WIS: Schlumberger, Baker Hughes, Weatherford, Halliburton. OMA: Helix, PRS: CB&I, KBR, Fluor, Jacobs Eng.Consensus analyst 2014 EBITDA by business area applied. Source: Bloomberg, research reports.
EV/EBITDA 2014 Peer group trading multiples by business area (consensus)
~30% discount to peer
group
Peer group multiples
suggest NOK ~130-135
~40-50% upside from
current share price
Aker ASA Capital Markets Day | Aker Solutions
15
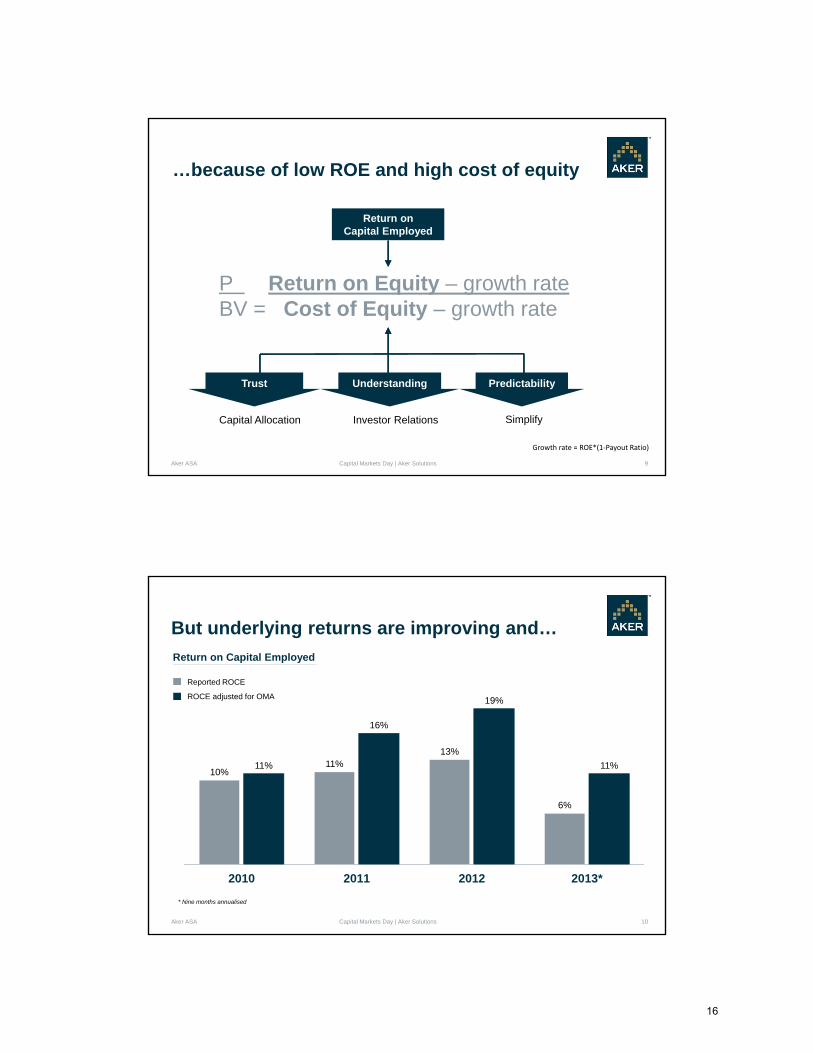
…because of low ROE and high cost of equity
9
P Return on Equity – growth rateBV = Cost of Equity – growth rate
Return onCapital Employed
Capital Allocation Investor Relations Simplify
PredictabilityTrust Understanding
Aker ASA Capital Markets Day | Aker Solutions
Growth rate = ROE*(1‐Payout Ratio)
But underlying returns are improving and…
10
10%11%
13%
6%
11%
16%
19%
11%
2010 2011 2012 2013*
* Nine months annualised
Return on Capital Employed
Aker ASA Capital Markets Day | Aker Solutions
Reported ROCE
ROCE adjusted for OMA
16

…higher capital discipline will increase returns
11
The cost of equity should be the referencepoint for all capital allocation decisions
Mgmt Incentive Structures based on ROCE and Total Return to Shareholders
Cost ofEquity
Capex
DivestInvest
ShareholderReturn
Aker ASA Capital Markets Day | Aker Solutions
Engineering, Subsea etc. and MMO
Lower earnings volatility will reduce cost of equity and help build trust in the market
12
2010 2011 2012 20132009
Brazil Trees
Drilling Technologies
Rig Building Shut down / spun offH6
Rigs
Offshore EPC spun out into Kvaerner , last legacy project Ecofisk Zulu
Onshore EPC spun out into Kvaerner
EcofiskZulu
Longview
Vessel Ownership: slated for disposal AOFS
Aker ASA Capital Markets Day | Aker Solutions
Mooring and Loading SystemsBarriers toentry
Growth
Returns
Lower
Higher
17

Conclusion
13
Aker Solutions is well positioned in attractive markets
But needs to focus on:
› Operational improvement
› Capital discipline
› Improving predictability
› Building trust and understanding in the
financial markets
Aker ASA Capital Markets Day | Aker Solutions
18

Proud ownership
KvaernerMichael Buffet | Investment Director, Aker ASA
4
8
12
16
20
jul. 11 okt. 11 jan. 12 apr. 12 jul. 12 okt. 12 jan. 13 apr. 13 jul. 13Kvaerner
OSEBX
Brent Spot
2013 was a difficult year for Kvaerner
Capital Markets Day | Kvaerner 2
CMD 2012
CMD 2013
Analysts' average target price
Business model challenged
Market turned bearish since last CMD› Share price NOK 16 to NOK 10› Target price NOK 19 to NOK 12› Target margins 6-7% to 4-5%
Significant risks perceived› Not winning new projects› Execution of new projects under
– New partnerships– Tighter contractual terms
› Legacy projects
Aker ASA
Listing
normalised
Share price NOK
19

Market opportunities
Attractive EPC markets...
› North Sea› Arctic
...served by core activities› Topsides / jackets (North Sea)› Concrete (Arctic)
Kvaerner has a stable base to leverage from
Capital Markets Day | Kvaerner 3Aker ASA
Financials
Higher predictability
Historically high backlog
NOK 2.66 in dividends, 8% annual return
Backlog BNOKEBITDA MNOK
0
5
10
15
20
25
30
35
3Q11 4Q11 1Q12 2Q12 3Q12 4Q12 1Q13 2Q13 3Q130
50
100
150
200
250
300
3Q11 4Q11 1Q12 2Q12 3Q12 4Q12 1Q13 2Q13 3Q13
Backlog Consensus
Kvaerner creates value for clients
Capital Markets Day | Kvaerner 4
Unique track record
High value for money› Efficient delivery cycle with limited risk
World class assets & partners› Local yards that can offer high value services› Cost competitive partners in EU and China› Collaboration with AKSO Engineering
Arctic enabler› Year-round operations in icy waters (Concrete)
Aker ASA
Still a proven alternative to low cost yards
20

And offers upside potential for investors
Capital Markets Day | Kvaerner 5
Exposure to attractive market› High entry barriers› Competition not proven yet
High return on investment› High yield, predictable dividend: a priority
Arctic upside potential
Aker ASA
Significant upside potential
Restructuring the business to unlock value
Capital Markets Day | Kvaerner 6
Focus
Increaseflexibility
Internalimprovements
Partnerships
Divest non core assets
Stop no-margin projects
Cost: meet client needs› low-cost overseas
partnerships› productivity in Norway
Activity: offer whatcompetitors can't› EPC services› Alternatives to EPC
What to do...
Own productivity
Structural, not marginal
Close collaboration withclients
Aker ASA
Enablers...
21

How Aker supports value creation in Kvaerner
Capital Markets Day | Kvaerner 7Aker ASA
Market
Company
Stakeholders
Expectations
Operations
Decision-making
Partnerships
Clients
› Focus on value creation drivers
› Monitor execution closely, through relevant KPIs
› Control sizeable M&A and investment activities
› Ensure risks are assessed and mitigated
› Use Aker's access to clients to convey key messages
22

Proud ownership
Det norske oljeselskapTrond Brandsrud | CFO Aker ASA
Det norske – a key industrial holding for Aker
Capital Markets Day | Det norske 2Aker ASA
Det norske is a significant part of Aker’s NAV… …and will be an important upstream cash contributor once Johan Sverdrup is in production
Det norske production profile % of Aker ASA gross asset value
21%
2013 2020
Illustrative based on Wood Mackenzie
2013 2020
23

Merger with Det norske
Det norske has been a first-rate investment
Capital Markets Day | Det norske 3Aker ASA
Share price
TimeDec 2009
Dec 2011
Nov 2013
Sverdrup discovery
Today
Market capNOK 12 bn
Value generation to Aker ASA in the period of NOK 2.5 bn
Dec 2007
AKX IPO
Johan Sverdrup is Det norske’s main assetRobust economics and significant funding potential
3 588
3 581
2 419
2 299
1 659
1 572
1 145
927
923
Statfjord
Ekofisk
Johan Sverdrup
Oseberg
Gullfaks
Troll
Snorre
Heidrun
Valhall
Draugen
26
23
21
Subsea
Fixed platforms
Floaters
Johan Sverdrup
Capital Markets Day | Det norske 4Aker ASA
■ Large volumes at low cost, robust economics
■ Well appraised, low subsurface risk
■ Bankable, with significant funding potential
■ Source of dividend once onstream
Norway’s biggest oil fields Development costs on the NCS
Cost benchmarks Include 20 assets PDO approved between2011 and 2013 on the NCS, Johan Sverdrup illustrative
Johan Sverdrup resource estimate indicatecombined range from Statoil/Lundin 2011-2012
?
?
Million barrels of oil Capex / boe – arithmetic average
24

The Ivar Aasen projectAn opportunity to grow into a fully integrated E&P company on the NCS
5
■ License partners: - Det norske 35% - operator- Statoil 50%- Bayerngas 15%
■ Resources 148 mboe (115 mbbl oil). CapexNOK 27.4 bn (nominal)
■ Will be unitised with PL457 by July 2014
Discovery PDO submission
TargetFirst oil
End 20162008 20122010
Appraisal HanzPhase 2
2019
Ivar Aasen - key facts
Hanz
Ivar AasenEdvard Grieg
A coordinated development with Edvard Grieg
■ Building competence as an operator
■ Positions the company for attractive acreageawards in future licensing rounds
■ Project execution according to plan, but tooearly to conclude that main risks are reduced
Capital Markets Day | Det norskeAker ASA
Project milestones
Aker ASA’s view
Aker continues to view NCS as attractiveDet norske should focus on its home market
6
Exploration potential
19 billion barrels of oil equivalentsundiscovered
43% of resources on NCS produced
Recent success in Barents Sea with play openers Wisting/Gotha
Source: NPD
Opportunities in APA and ordinary rounds
Opening Barents Sea South East
Expected opening of Lofoten/ Vesterålen, although area closed for next four years
Stable framework and fiscal regime, although recent tax change was unexpected
Cash back on exploration costs and incentives such as APA rounds
5,3 4,96,0
1,90,6
Undiscovered resourcesBillion boe
Exploration potential Access to acreage Stable framework
Aker ASA Capital Markets Day | Det norske
25

Focused and value-driven explorationDet norske entering a new phase with focus on capital allocation
7Aker ASA
Det norske is built on exploration success… …and should continue to explore, based on a focused and value-driven strategy.
Capital Markets Day | Det norske
Discovered:2010On-stream: 2012
Discovered: 2009On-stream: 2013
Discovered: 2008On-stream: 2016
Discovered: 2011On-stream: 2018
Atla 2012
Jette 2013
Ivar Aasen 2016
Johan Sverdrup 2018
103 94 87 98 95
4844
2732 33
146133
113122 122
Bank 1 Bank 2 Bank 3 Bank 4 Averageof 15banks
Det norske trades at a discount to NAVAker see significant upside in Det norske’s share price
8Aker ASA
Target price
140 130 110 120 117
Equity analyst NAV – NOK / share
Source: DETNOR equity analyst reports
…in line with the rest of the small cap E&Ps
1,2
0,9
0,8
0,7 0,7 0,7
0,6
0,4
0,3 0,3
1
En
dev
ao
ur
Ihta
ca
Lu
nd
in
Far
oe
En
qu
est
Ste
rlin
g
Pre
mie
r
Det
no
rske
Ex
cit
e
No
rec
o
Price / NAV – Public North Sea exposed E&Ps
Average
J.Sverdrup OtherExploration
Share price
Capital Markets Day | Det norske
Det norske is trading at a discount to NAV…
Source: Credit Suisse
Net debt
26
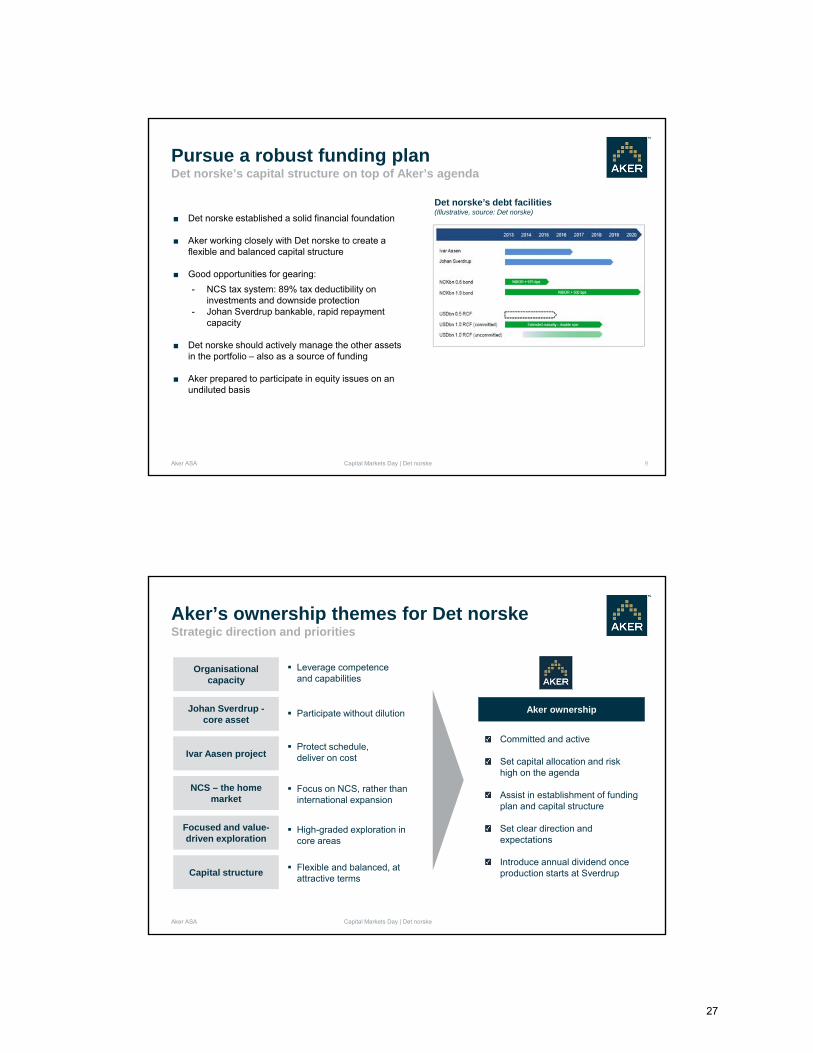
Pursue a robust funding plan Det norske’s capital structure on top of Aker’s agenda
9Aker ASA
■ Det norske established a solid financial foundation
■ Aker working closely with Det norske to create a flexible and balanced capital structure
■ Good opportunities for gearing:
- NCS tax system: 89% tax deductibility on investments and downside protection
- Johan Sverdrup bankable, rapid repayment capacity
■ Det norske should actively manage the other assets in the portfolio – also as a source of funding
■ Aker prepared to participate in equity issues on an undiluted basis
Capital Markets Day | Det norske
Det norske’s debt facilities(Illustrative, source: Det norske)
Aker’s ownership themes for Det norskeStrategic direction and priorities
10Aker ASA
Aker ownership
Committed and active
Set capital allocation and risk high on the agenda
Assist in establishment of fundingplan and capital structure
Set clear direction and expectations
Introduce annual dividend onceproduction starts at Sverdrup
Johan Sverdrup -core asset
Ivar Aasen project
NCS – the home market
Capital structure
Organisationalcapacity
Focused and value-driven exploration
Leverage competenceand capabilities
Participate without dilution
Protect schedule, deliver on cost
Focus on NCS, rather thaninternational expansion
High-graded exploration in core areas
Flexible and balanced, at attractive terms
Capital Markets Day | Det norske
27

Proud • Determined • Diverse • Sustainable
Aker BioMarineFredrik Nygaard | CFO, Aker BioMarine Proud • Determined • Diverse • Sustainable
© Aker BioMarine | 2
The Aker BioMarine Group comprises the core krill business and three pharmaceutical ventures
* Lindsay Goldberg is a NYC‐based PE company with >USD 10 billion under management
Opportunistic pharmaceutical ventures NutraCore krill business
AKBM
50% 50%100% Trygg PharmaGroup
• Supplements• Intermediates• API
Aker ASA
100%
• Separate team pursuing pharmaopportunities based on krill
• Indirect ownership in a specialisedpharmacompany that develops products with abuse deterrent features and benefits
• Submitted NDA for its lead drug candidate, which targets the market for patients with hypertriglyceridemia in the U.S.
Lindsay Goldberg
28

© Aker BioMarine | 3
Aker BioMarine develops and sells krill‐based products
Dietary supplement
High value feed ingredient
• Documented as a more efficient form of omega‐3
• Naturally free from pollution and heavy metals
• Product traceability
• Documented growth, health and quality performance benefits
• High quality feed ingredient for aquaculture and specialty pet diets
• Integrated marine biotechnology company focused on krill‐based products
• Headquartered in Oslo with operations in the Antarctica, Uruguay and Spain
• Two modern krill factory trawlers and a transport vessel
• MSC1) certified and sustainable harvesting operations
1) Marine Stewardship Council – leading, global non‐profit certification organization responsible for eco‐labeling of sustainable marine products
© Aker BioMarine | 4
Small company with integrated global product supply chain
Sales offices
Production facilities
Onboard processing and quality control
Eco‐Harvesting™ Storage and transport to shore
Superba™ Krill oil extraction and encapsulation
R&D, Sale and distribution
Logistics and research facilities
New onshore production facility in Houston on stream in 2014
New onshore production facility in Houston on stream in 2014
29

© Aker BioMarine | 5
From “Rebuilding” in 2008 to “Cash flow generation” in 2014…
• Fully invested to produce up to 2 000 MT Superba™1
• New krill product launches and applications
• Optimise assets and reduce costs
• Opportunistic approach towards krill pharmathrough Aker BioPharma
Profitablegrowth
21 Break‐evenEBITDA
3 4
2008/09
Cash flow generation and
dividends
2011‐ 2013
5
2010 2014/15 ‐
1) Onshore production capacity of up to 2,000 MT annually once Houston factory is completed2) Excluding krill pharma e.g share of Trygg Pharma Group and Aker BioPharma earnings from 2013
EBITDA performance2
2008 – 2014E, USD million
‐27
‐21
36
11
2013F 2014E2012
~25
2011201020092008
Strategic and financials ambitions2008 ‐ 2015
USDm
© Aker BioMarine | 6
…driven by two key performance drivers
0
50
177
232
363
2011201020092008 2013F
~515
2012
Average prices1)USD/KGMT
Volume
1) Blend of bulk oil and capsules
2013F2012201120102009
2013F
10,539
~13,000
20122011
10,092
2010
10,830
2009
7,066
2009 2010 2012 2013F2011
Average pricesUSD/MTMT
Volume
30
© Aker BioMarine | 7
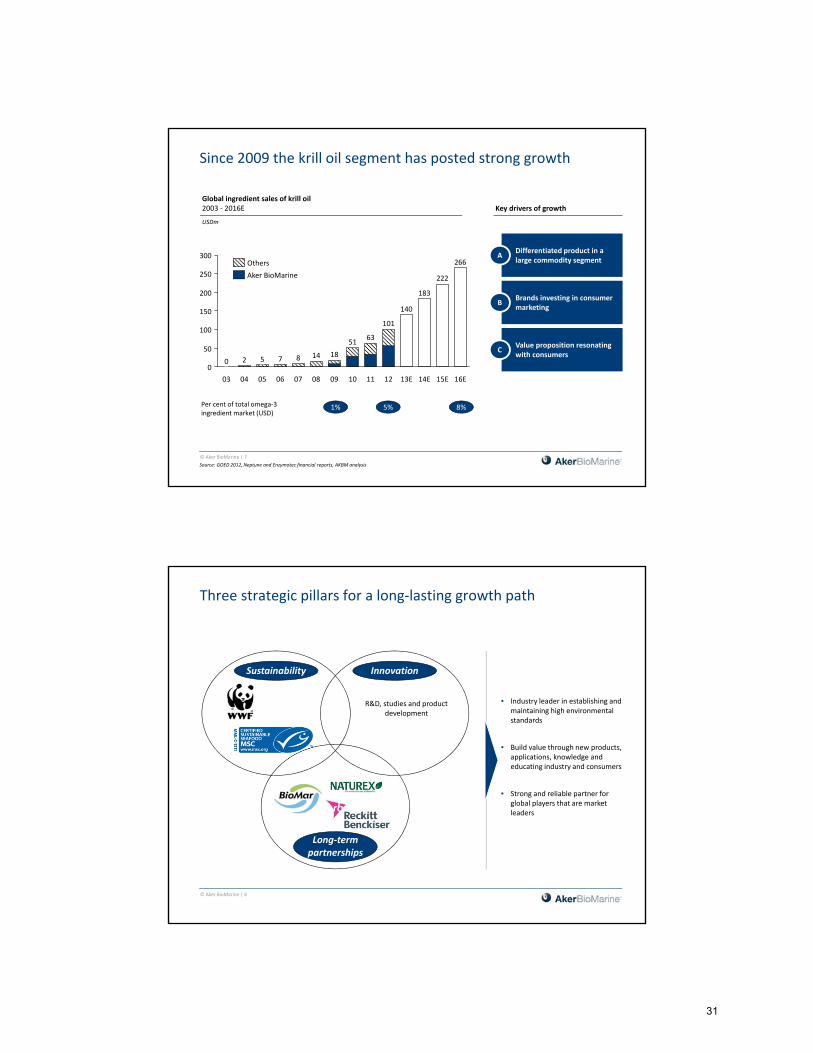
Since 2009 the krill oil segment has posted strong growth
87520
266
222
183
140
0
50
100
150
200
250
300
18
08
14
0706050403 16E15E14E13E12
101
11
63
10
51
09
1% 5% 8%Per cent of total omega‐3 ingredient market (USD)
Key drivers of growth
• Differentiated product in a large commodity segment
A
• Brands investing in consumer marketing
B
• Value proposition resonating with consumers
C
Global ingredient sales of krill oil2003 ‐ 2016E
Source: GOED 2012, Neptune and Enzymotec financial reports, AKBM analysis
USDm
Aker BioMarine
Others
© Aker BioMarine | 8
Three strategic pillars for a long‐lasting growth path
Sustainability Innovation
Long‐termpartnerships
• Industry leader in establishing and maintaining high environmental standards
• Build value through new products, applications, knowledge and educating industry and consumers
• Strong and reliable partner for global players that are market leaders
R&D, studies and product development
31

© Aker BioMarine | 9
EBITDA
Superba gross profit
Qrill & raw material value
Fixed costs
Onshore costs
Offshore costs
Illustration of AKBM business drivers and profit model
• Optimise vessel operations, offshore logistics and warehouses
• “Be smart” regarding SG&A and R&D related costs, but global expansion comes at a price
• Qrill™ and raw material production dependent on krill fisheries
• Focus on vessel “up time” and sustainable harvesting
• Pursue global market growth opportunities
• Reduce COGS with new factory
• New product launches
ILLUSTRATIVE
1) Excluding krill pharma i.e. Aker BioPharma
Substantial upside if we deliver on our plan…Profit model and key priorities
USDm
45‐50
70‐75
~25
3 year target…
EBITDA Krill(USDM)
100 Normalised krill harvesting of 150,000 MT
Superba™ sales doubled without material price erosion
Average Qrill™ prices +25% from mix of new products
Further reduce Superba™ production costs
“Be smart” on costs
Does not include…
• Krill powder and krill‐based gummy products, still in early stages
© Aker BioMarine | 10
Key takeaways
Market leader within krill‐based products and well positioned in growing global market for omega‐3 products
Fully invested to produce and sell up to 2 000 MT Superba™ Krill Oil once Houston plant completed mid‐2014
Unique operational set‐up, Antarctic experience and high initial investments create competitive advantage
Strong balance sheet and focus on cash generation from 2014 and onwards
Potential for krill oil business to attract fish oil industry’s attention as segment grows
Key risks relate to intellectual property disputes, upholding operational excellence in harsh environments and
ability to differentiate in the market through R&D and innovation
Additional upside potential through Trygg Pharma Group and Aker BioPharma pharmaceutical ventures
Strong outlook for krill business, with some uncertainties given industry is still in its infancy
32

Fornebuporten HoldingTorstein Storækre | Managing Director, FPH
Overview
› Part of Aker’s Financial Investments portfolio
› Office developments:
› Fornebuporten (Oslo)› Aberdeen International Business Park
› Residential developments:
› Fornebuporten Bolig
› Fornebuporten is a developer, not a long-term holder of real estate
› Fornebuporten will opportunistically dispose assets prior to or upon building completion
› Meets Aker’s ROE requirements
Fornebuporten offices
Aker ASA Capital Markets Day | Fornebuporten 2
33

Aker ASA
Overview – Group structure
▪ Fornebuporten – 67,000 SQM
▪ Widerøeveien 5 – 10,000 SQM
▪ JV with Profier
▪ Planned for 46,600 SQM
▪ 15,750 SQM commenced
Fornebuporten Holding AS
AIBPFornebuporten Offices Fornebuporten Residential
▪ Planned for 100,000 SQM
Capital Markets Day | Fornebuporten 3
Fornebuporten
Aker ASA
Location
4
34

Aker ASA
Fornebuporten
Fornebuporten Commercial development
Aker ASA
› Currently ~ 67,000 SQM under development
› Construction on track with forecast completion:
› Building B in June 2015 › Building A in June 2016
› 2/3 of area let out at competitive market prices:
› Aker Solutions (12-year lease) › Kværner (12-year lease)› NorgesGruppen, incl. two shops (20-year lease)› Eurest (Compass Group)
› Advanced discussions with other tenants
› Project cost in line with budget (NOK 2.5 billion all-in)
› External bank financing secured
› WØV 5 building rent ~ NOK 14 million
Capital Markets Day | Fornebuporten 6
35

Market development Commercial
Rent
› Oslo market remains strong and rental prices are increasing
› Current market prices in the Lysaker / Fornebuporten area at NOK 2,200 -2,500 per SQM
Investment market
› Strong appetite for real estate leading to lower yield
› Fornebu yield in vicinity of 6%Source: Akershus Eiendom
Office rents 1986-2013
Aker ASA Capital Markets Day | Fornebuporten 7
Fornebuporten Commercial
Time
Regulation and planning
Marketing and sales
Construction
Aker Divestment[1]
(partly or fully)
Acquisition of land
2011 2015 2016
Building B
complete
Building A
complete
2012 2013 2014
Aker Solutions
Kværner
NorgesGruppen
Eurest
Operating
Fornebuporten’s value chain Non-Fornebuporten value chain Progress [1] Divestment with repayment of investment and profit
Aker ASA Capital Markets Day | Fornebuporten 8
36
Market development Residential
Source: Akershus Eiendom
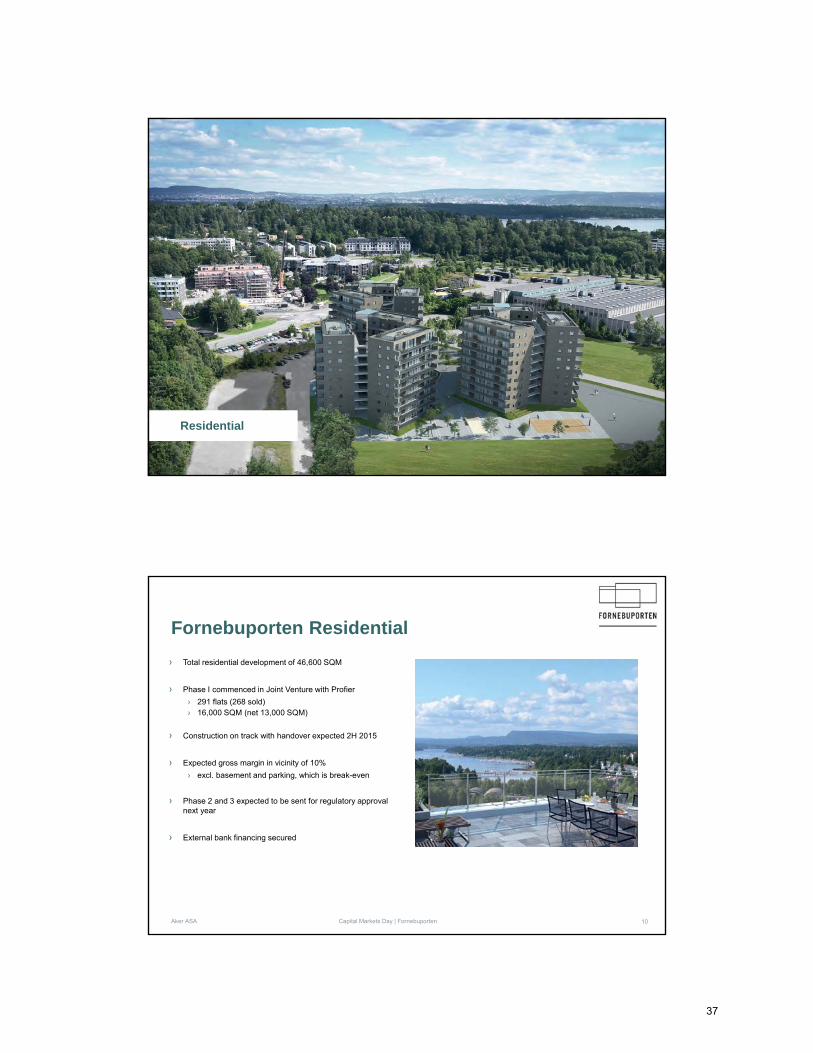
Residential
Fornebuporten Residential
Aker ASA
› Total residential development of 46,600 SQM
› Phase I commenced in Joint Venture with Profier
› 291 flats (268 sold)› 16,000 SQM (net 13,000 SQM)
› Construction on track with handover expected 2H 2015
› Expected gross margin in vicinity of 10%
› excl. basement and parking, which is break-even
› Phase 2 and 3 expected to be sent for regulatory approval next year
› External bank financing secured
Capital Markets Day | Fornebuporten 10
37

Market development Residential
› Residential market currently sluggish
› Prices modestly down
› Few new projects commenced
› Long term fundamentals remains strong› Urbanisation› Favourable demographics › Good economic outlook› Low interest rates
Larger Oslo area new build housing starts vs. population growth 1925-2011
New build housing starts
Demographic development
Source: Aftenposten
Aker ASA Capital Markets Day | Fornebuporten 11
Fornebuporten Residential
Time
Regulation and planning
Marketing and sales
Construction
Acquisition of land
2011 2015 2016
Handover
2012 2013 2014
268 of 291 flats sold
Fornebuporten’s value chain Progress
Aker ASA Capital Markets Day | Fornebuporten 12
38

Future drivers
Aker ASA
› Metroline from Oslo to Fornebu a political priority
› Government plans part private funding of the metroline through release of building concessions
› Size of undeveloped land at Fornebuporten similar to that of existing development
› 10,000 SQM already approved by regulatory authorities, subject to metroline in place
Footprint larger than current office development
MM
Nasjonalteatret FornebuportenVækerøSkøyenMajorstuen Lysaker
12min
Capital Markets Day | Fornebuporten 13
Future drivers
Aker ASA
Aberdeen International Business Park
39

Premier location next to airport
Aker ASA Capital Markets Day | Fornebuporten 15
Aberdeen International Business Park
Aker ASA
› Land acquired 1Q 2013 for ~GBP 17 million (incl. infrastructure)
› Three buildings (30,000 SQM) under construction
› The current building concession is 46,000 SQM › Planned development 100,000 SQM
› Advanced discussions with tenants for lease
› Development of CAT A[1] (not CAT B[2])› Forecast cost GBP 65M million for CAT A
[1] A category A fit out includes e.g. entrance hall, staircases, suspended ceilings and the extension of the Mechanical and electrical above the ceilings.
[2] A Category B fit out includes e.g. suspended ceiling upgrades, special area fit out (auditoria, kitchens, restaurants, gym, meeting rooms, canteen etc.), reception desk etc.
Capital Markets Day | Fornebuporten 16
40
Market development Aberdeen
Source: Akershus Eiendom
Rent:
› Aberdeen market remains strong - limited grade A office vacancy
› Rental prices increasing – market rates GBP 23 - 28 per SQF depending on quality and location.
Investment market:
› Strong appetite for real estate
› Aberdeen yield in vicinity of 6.5% according to CBRE
Prime Rents and Yields
Aker ASA Capital Markets Day | Fornebuporten 17
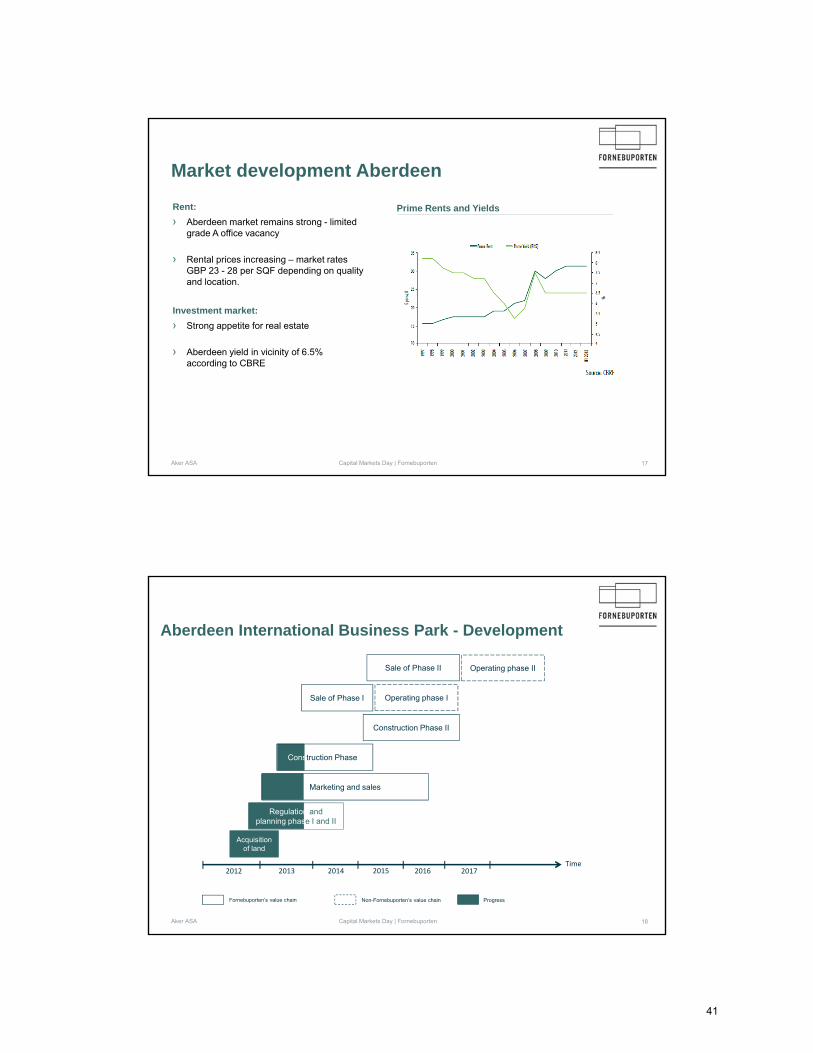
Regulation and planning phase I and II
Aberdeen International Business Park - Development
Time
Marketing and sales
Construction Phase I
Acquisition of land
2012 2016 20172013 2014 2015
Construction Phase II
Sale of Phase I
Sale of Phase II
Fornebuporten’s value chain Non-Fornebuporten’s value chain Progress
Operating phase I
Operating phase II
Aker ASA Capital Markets Day | Fornebuporten 18
41
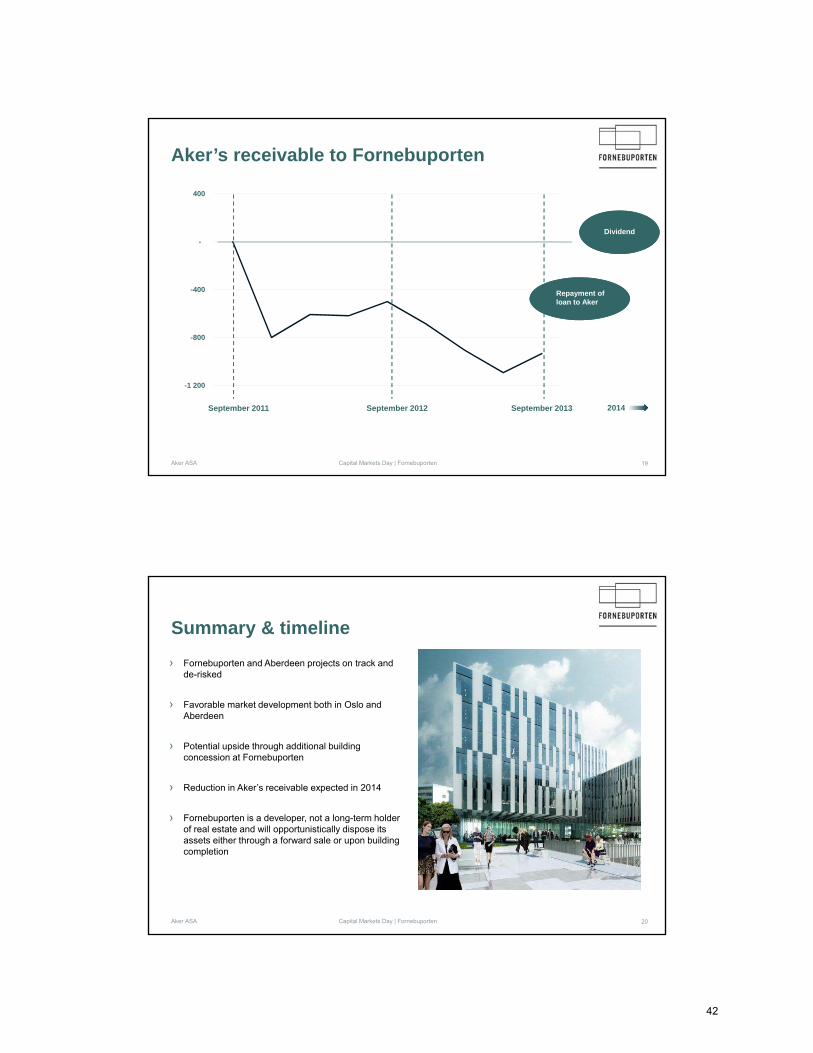
-1 200
-800
-400
-
400
Aker ASA
Aker’s receivable to Fornebuporten
September 2011 September 2012 2014
Dividend
Repayment of loan to Aker
September 2013
Capital Markets Day | Fornebuporten 19
Summary & timeline
Aker ASA
› Fornebuporten and Aberdeen projects on track and de-risked
› Favorable market development both in Oslo and Aberdeen
› Potential upside through additional building concession at Fornebuporten
› Reduction in Aker’s receivable expected in 2014
› Fornebuporten is a developer, not a long-term holder of real estate and will opportunistically dispose its assets either through a forward sale or upon building completion
Capital Markets Day | Fornebuporten 20
42

Proud ownership
Converto Capital FundFrank O. Reite | Managing Partner, Converto Capital
About Converto Capital Fund
Owned 99.8% by Aker
Closed-end investment fund
established in 2009
7-year investment horizon
Originally 11 portfolio companies within
seafood, oil service and U.S. Jones Act
(Bond)
Selected realisations (per 3Q13)
2
NOK 1.3bn realised (cost 0.8bn)
Key facts

Current portfolio (per 3Q13)
Value of investments (% of total fund value)
Total fund value ~ NOK 1.8bn
27%
29%
44%
Tight oil production forecasts and current fleet indicate significant upside potential in U.S. Jones Act market
U.S. Shale Crude Production Forecast
Tight oil production doubled in less than two years
Significant future increases predicted
Total recoverable reserves estimated to be as much as
120 billion bbls
U.S. imports of crude trending down
Existing pipeline and rail infrastructure not able to meet
transportation needs
Fleet utilisation currently at 100%
25% of fleet used to transport crude
Ageing of the fleet; newbuild capacity constrained
Substantial fuel savings on new product tankers
Jones Act Fleet
4
0
1 000
2 000
3 000
4 000
5 000
0
5 000
10 000
15 000
20 000
25 000
2000 2005 2012
2000 to 2012 36%
1,0
00
bb
ls/ d
ay
1,0
00
bb
ls

AKPS - Well positioned in promising Jones Act market
2009
2013
Empty order book beyond OSG vessels
Insignificant equity value
Closing down yard considered
Government support of USD 42 million secured
New orders of more than USD 1.4 billion and backlog
secured until mid-2018
Partnership with Crowley
New contract with Matson
5
Converto’s view Long term visibility and steady cash flow
through fully-funded newbuilding program
Upside through Crowley partnership
AMSC - Exciting upside in profit sharing agreement
Legal dispute with OSG
Difficult financial situation
No short/medium term outlook for profit sharing
Low market value
OSG settlement agreement negotiated
Balance sheet restructured
Prolonged bareboat charter agreements
Strong outlook going forward
6
Converto’s view Predictable cash flow through bareboat hire
and upside through profit sharing
agreement
OSG Chapter 11 situation monitored
closely and related risk considered low
2009
2013

Ocean Harvest - Focus on preserving quota values
7
Converto’s view Case remains highly challenging
Focus on preserving quota values in one of
the world’s few remaining open ITQ quota
regimes
2009
2013
Weak historical profitability
High external debt and need for
refinancing
Need for asset upgrade
Challenging biological situation
Continued weak profitability and operational
challenges
Divestment of Faroe Island business and subsequent
debt reduction
New business plan
Country risk
NWS - Potential profitability uplift if capacity adjusted
8
Converto’s view Unique raw material access
Significant overcapacity
2009
2013
Integrated processing and harvesting
company lacking focus
Focus on bulk products
High fixed costs
Inflated balance sheet values and
inefficient capital allocation
Focused processing and sales company
Significant asset divestments
Fixed-cost savings realised
New sales & marketing-focused organisation
New branded value-added products in Scandinavian
market

Bokn - 3-way split unlocked substantial value potential
2009
2013
Value of investment not clear
Passive ownership
Conglomerate lacking focus
9
Converto’s view Entrenched position in the strong NCS
market
Attractive acquisition candidates
Delisting from OSE
Three-way split to unlock value Stream – Supplier of products, solutions and services
Align – Production- and safety critical equipment
Naxys – Subsea technology
Naxys successfully divested to GE in 2012
Remaining portfolio has significant underlying value
[1]
[1]
10
Main Activity Consideration
U.S. Jones Act shipyard
Owner of ten U.S. Jones Act product tankers
Supplier to the oil and gas industry
Seafood harvesting in Argentina
Supplier to the oil and gas industry
Processing and sales of seafood
Solid order backlog in an attractive market
Upside through profit sharing agreement
Attractive acquisition candidate
Challenging situation in Argentina
Eureka Pumps the main value driver
Unique raw material access
[1] Owned through Bokn Invest. CCF holds 39.9% in Bokn Invest, which in turn holds >95% in Stream /Align

Proud ownership
Financial OverviewTrond Brandsrud | CFO, Aker ASA
Overview
Aker’s Financial Investments
2
-
1 000
2 000
3 000
4 000
5 000
6 000
7 000
8 000
9 000
10 000
CashBNOK 4.8
ReceivablesBNOK 1.7
Equity inv. 0.1
FundsBNOK 2.5
Largest assets
Converto 1814OAM 375Norron 314
Fornebu 993Setanta 302Navigator 120
Aker ASA Capital Markets Day 2013 | Financial Overview
MNOK The value of Aker’s financial investments
has grown over the past year, for the right reasons:
› Underlying values have increased › Cash holding has increased
No new investments made
The roadmap remains the same:
1. Focus2. Develop3. Exit/realise
924342265
500-
199
3Q13 3Q12
Other 0.3
Financial Investment portfolio, current (3Q13) composition
NAV value (MNOK)

Aker's financial objectives
Capital Markets Day 2013 | Financial Overview 3Aker ASA 3
Returns
Balance Sheet
Secure competitive total returns to shareholders, year on year
Maintain a solid balance sheet, protecting the company from adverse portfolio changes and market effects
Cash
Keep a solid cash buffer to have financial flexibility for: opportunities downward market trends
DividendsSustain increasing dividends, without funding from divestments or new debt as of 2018
CAPACITY
LIQUIDITY
SOLIDITY
4
Aker ASA Capital Markets Day 2013 | Financial Overview
Aker’s liquidity sources and uses
DIVIDENDS RECEIVED
FINANCE INCOME
DIVESTMENTS –FINANCIAL INV.
DIVESTMENTS / M&A – IND. HOLDINGS
DIVIDEND PAYMENTS
FINANCE COSTS
OPERATINGCOSTS
INVESTMENTS –IND. HOLDINGS
RE
CC
UR
ING
NO
N-R
EC
CU
RIN
G
DEBT REPAYMENTNEW DEBT
Sources
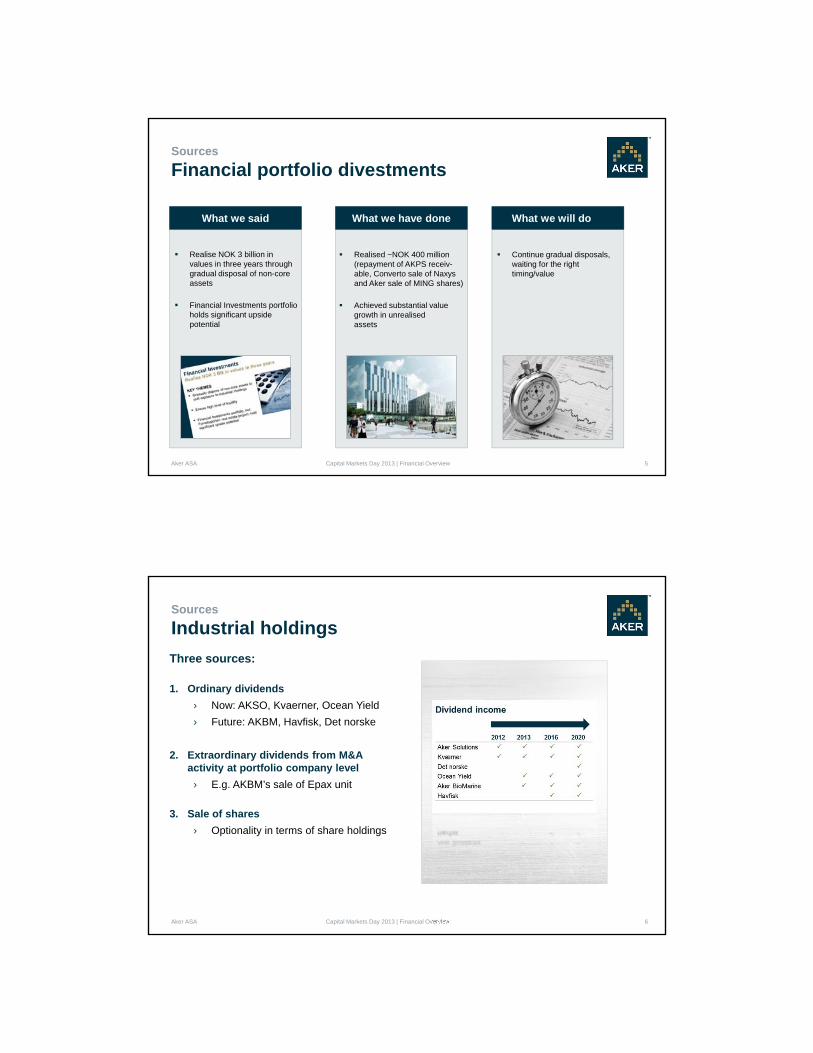
Financial portfolio divestments
Capital Markets Day 2013 | Financial Overview 5Aker ASA
Realise NOK 3 billion in values in three years through gradual disposal of non-core assets
Financial Investments portfolio holds significant upside potential
Realised ~NOK 400 million (repayment of AKPS receiv-able, Converto sale of Naxysand Aker sale of MING shares)
Achieved substantial value growth in unrealisedassets
Continue gradual disposals,waiting for the right timing/value
What we said What we have done • What we will do
Sources
Industrial holdings
Capital Markets Day 2013 | Financial Overview 6Aker ASA
Three sources:
1. Ordinary dividends
› Now: AKSO, Kvaerner, Ocean Yield
› Future: AKBM, Havfisk, Det norske
2. Extraordinary dividends from M&A activity at portfolio company level
› E.g. AKBM’s sale of Epax unit
3. Sale of shares
› Optionality in terms of share holdings

Sources
Aker’s debt profile
Capital Markets Day 2013 | Financial Overview 7Aker ASA
Financial Covenants Limit Status per
30.09.2013i Total debt/equity2 < 80% 42%
ii Group loans to NAV < 50% 10 %or Group loans/loan guarantees < NOK 10 bn NOK 2.1 bn
Average debt maturity close to 5.1 years
MNOK
AKER07
0
200
400
600
800
1000
1200
1400
2013 2014 2015 2016 2017 2018 2019 2020 2021 2022
Bank debtBond
AKER06
AKER05
AKER08
BANK DEBT
AKER11
AKER10
AKER09
AKER07
0
1 000
2 000
3 000
4 000
5 000
6 000
7 000
Cash
Interest-bearing receivables
Debt
Net interest bearing receivables NOK 1.0 billion
MNOK
Net interest bearing items Debt overview & financial covenants
2 Covenant applies to Aker ASA (parent only). Reference is made to loan agreements for details.
1 Aker ASA has exercised call option on AKER06. The bond issue will be repaid with settlement date 28 November 2013, at 104% of par value
1
Sources
Aker’s debt strategy
Capital Markets Day 2013 | Financial OverviewAker ASA 8
Long-term funding profile – efficient yield curve
Minimum cash > debt and loan guarantees due next 3 years
Flexibility to optimise timing of refinancing and capture market opportunities
Regular and open dialogue with bond and bank markets
Equity ratio (based on NAV) to reflect risk profile of portfolio; normally 80% or above
Gearing capacity: financial covenants with significant headroom
Invest only equity in Industrial Holdings. Portfolio companies to be financed independently from Aker
100
150
200
250
300
350
400
450
500
550
600
1 2 3 4 5 6 7 8 9 10
2011
2012
2013
Aker’s indicative yield curve development
Ind
ica
tive
sp
rea
ds
IllustrativeIllustrative
Key guidelines

Uses
Investments and dividends
Capital Markets Day 2013 | Financial Overview 9Aker ASA 9
Det norske will require additional equity to develop Johan Sverdrup
No other Industrial Holding companies require additional funding according to current business plans. However, potential to increase current exposure through share purchases
Dividend policy: 2-4% of NAV
Current cash and cash sources are sufficient to uphold dividend policy and increase investments in Industrial Holdings
Conclusion
Capital Markets Day 2013 | Financial Overview 10Aker ASA
Solid balance sheet and strong equity position
Financial flexibility through significant cash holding and other sources of liquidity
Sustainable and increasing dividend with competitive yield
Continue divestments and focus portfolio
Leverage Aker’s position in debt market to further reduce cost of capital

▪ This Document includes and is based, inter alia, on forward-looking information and statements that are subject to risks and uncertainties that could cause actual results to differ. These statements and this Document are based on current expectations, estimates and projections about global economic conditions, the economic conditions of the regions and industries that are major markets for Aker ASA and Aker ASA’s (including subsidiaries and affiliates) lines of business. These expectations, estimates and projections are generally identifiable by statements containing words such as ”expects”, ”believes”, ”estimates” or similar expressions. Important factors that could cause actual results to differ materially from those expectations include, among others, economic and market conditions in the geographic areas and industries that are or will be major markets for Aker's businesses, oil prices, market acceptance of new products and services, changes in governmental regulations, interest rates, fluctuations in currency exchange rates and such other factors as may be discussed from time to time in the Document. Although Aker ASA believes that its expectations and the Document are based upon reasonable assumptions, it can give no assurance that those expectations will be achieved or that the actual results will be as set out in the Document. Aker ASA is making no representation or warranty, expressed or implied, as to the accuracy, reliability or completeness of the Document, and neither Aker ASA nor any of its directors, officers or employees will have any liability to you or any other persons resulting from your use.
▪ The Aker group consists of many legally independent entities, constituting their own separate identities. Aker is used as the common brand or trade mark for most of this entities. In this document we may sometimes use ”Aker", "Group, "we" or "us" when we refer to Aker companies in general or where no useful purpose is served by identifying any particular Aker company.
Disclaimer
Capital Markets DayAker ASA
53