Ajax Community Greenhouse Gas Emissions Inventory · Ajax Community Greenhouse Gas Emissions...
22
Ajax Community Greenhouse Gas Emissions Inventory February 2010 Prepared by: 1709 Highway #7 Brougham, ON L0H 1A0 www.sustain-ability.ca
Transcript of Ajax Community Greenhouse Gas Emissions Inventory · Ajax Community Greenhouse Gas Emissions...

Ajax
Community
Greenhouse Gas Emissions
Inventory
February 2010
Prepared by:
1709 Highway #7
Brougham, ON
L0H 1A0
www.sustain-ability.ca

Town of Ajax: Community GHG Emissions Inventory and Trends
© 2010 Durham Sustain Ability Page 2
Contents
1.0 Introduction ................................................................................................................... 3
1.1 Background ............................................................................................................... 3
1.2 Climate Change – Local Actions within a Global Context....................................... 3
1.3 Methodology ............................................................................................................. 4
2.0 Community Inventory, Trends and Forecast ................................................................ 6
2.1 Background ............................................................................................................... 6
2.2 Community Summary ............................................................................................... 6
2.3 Inventory Baseline Year - 2005 ................................................................................ 9
2.4 Trends By Sector..................................................................................................... 13
3.0 Recommendations ....................................................................................................... 21
Appendix A Glossary

Town of Ajax: Community GHG Emissions Inventory and Trends
© 2010 Durham Sustain Ability Page 3
1.0 Introduction
1.1 Background
In 2008, the Region of Durham initiated a multi-stakeholder advisory committee called
the Durham Region Roundtable on Climate Change (“the Roundtable”) to address
climate change challenges in the Region both through mitigation and adaptation. In May
2009, Durham Sustain Ability (DSA) was retained to provide a community baseline
greenhouse gas (GHG) emissions inventory for the Region as a whole, which was
completed in October 2009.
The Town of Ajax has been able to leverage this initiative by retaining DSA to unpack
the regional data and provide a community baseline GHG emissions inventory
specifically for Ajax.
1.2 Climate Change – Local Actions within a Global Context
Greenhouse gas concentrations in the atmosphere (the most common of which include
carbon dioxide CO2, methane CH4, and nitrous oxide N2O) have been increasing
significantly over the past 150 years contributing to tangible global climate change
effects. This is mainly caused by human activity: primarily by the burning of fossil fuels
as well methane from landfills, and the removal of carbon sinks through deforestation and
agricultural practices.
An excellent summary paper outlining the current climate change science, GHG emission
reduction targets and current/proposed strategies to meet those targets on the
international, national and provincial/state levels along with comments and conclusions
was endorsed by Durham Regional Council in September 2009. The document is Report
No. 2009-J-37 and can be found at http://www.durhamclimatechange.ca.
Climate change is a global issue requiring local action, mainly in the areas of responsible
energy consumption and shifting to renewable energy sources. In Canada, the Federation
of Canadian Municipalities (FCM) and the International Council for Local Environmental
Initiatives (ICLEI) have developed a framework for reducing greenhouse gas (GHG)
emissions for municipalities called Partners for Climate Protection (PCP). Currently, 194
Canadian municipalities have registered in the PCP program.
The PCP program consists of five milestones:
1. Conduct a baseline GHG emission inventory analysis for municipal operations
and the community.
2. Establish GHG reduction targets for municipal operations and the community.
3. Develop a local action plan outlining actions that reduce GHG emissions and
energy consumption for municipal operations and the community at large.
Town of Ajax: Community GHG Emissions Inventory and Trends
© 2010 Durham Sustain Ability Page 4
4. Establish a program to implement adopted actions that will reduce GHG
emissions as outlined in the local action plan.
5. Establish a monitoring and reporting system to verify GHG reduction
achievements. Revise the action plan periodically to reflect new ideas and
strategies.
Milestone 1 will be deemed complete with the submission of this community report to the
PCP secretariat along with the Ajax corporate inventory that will be developed by staff.
1.3 Methodology
Establishing a community GHG emissions inventory involves gathering data on fuel,
energy and waste from all sectors comprising the community at large. Energy
consumption data in the residential, industrial, commercial and institutional (IC&I), and
transportation sectors are gathered along with waste generation and disposal information.
Early in the process, the major Durham energy providers of electricity and natural gas
were gathered at a summit meeting in which they endorsed the program and participation
in the energy data gathering as the start of a longer-term partnership. They were willing
to become partners in subsequent stages of the program including participation in
working teams addressing Milestone 3 local action plan work.
The following energy providers supplied the energy data specifically for Ajax:
Residential, IC&I sector electricity usage and prices – Veridian
Residential, IC&I sector natural gas usage and prices – Enbridge
Transportation sector data was gathered from existing survey information for Ajax
residents based on annual average daily trips and kilometers driven.
Durham Region provided waste generation and disposal data.
Once energy consumption and waste generation data were collected, appropriate
emission coefficients were applied for each source of energy and waste to landfill to
calculate the resulting GHG emissions. Annual emissions are expressed in absolute terms
and are not corrected for weather or population growth, however emissions are also
expressed on a per capita basis for trend analysis.
Town of Ajax: Community GHG Emissions Inventory and Trends
© 2010 Durham Sustain Ability Page 5
The equivalent carbon dioxide coefficient (eCO2) for electricity is based on the annual
average amount of fossil fuel (coal, natural gas, oil) used at Ontario’s electricity power
plants. Other sources such as hydropower, nuclear and renewable energy do not directly
produce eCO2 emissions. As Ontario’s electrical generation mix changes from year to
year so does the eCO2 electricity coefficient.
This means that the GHG emissions associated with electricity consumption in Ajax can
vary year to year, even if there is no significant change in energy usage. In fact when a
municipality reduces its energy consumption, its GHG emissions may actually increase if
the provincial fossil fuel mix significantly increases.
All municipalities participating in the PCP program use this GHG calculation
methodology (PCP Protocol) in Canada and throughout the world.

Town of Ajax: Community GHG Emissions Inventory and Trends
© 2010 Durham Sustain Ability Page 6
2.0 Community Inventory, Trends and Forecast
2.1 Background
The community baseline year of 2005 was selected to coincide with a number of
proposed cap-and-trade programs (e.g. U.S.Western Climate Initiative of which Ontario
is a member) use 2005 as the baseline year.
Canada currently uses 2006 as a baseline (although this may change in order to
harmonize with the US which is proposing to use 2005 for its cap-and-trade program). In
order to potentially harmonize with these programs and to provide trend data, it was
decided that inventories would be established for the years 2005, 2006, 2007 and 2008. A
business-as-usual (BAU) forecast for the year 2020 will also be provided based on
population and household forecasts and the absence of any further efforts to reduce GHG
emissions.
2.2 Community Summary
Ajax’s population has grown by 16.7% from 89,015 in 2005 to 103,855 in 2008. The
population is forecasted to substantially grow by 47.3% from the baseline year to 131,125
by 2020.
Table 1 summarizes the annual energy consumption, energy cost and GHG emissions on
an absolute and per capita basis.
Table 1: Summary of Energy Consumption, Energy Cost and GHG Emissions
2005 2006 2007 2008 BAU 2020
Energy Use
(GJ)
8,728,952 8,497,736 9,052,404 8,935,756
11,282,086
Per Capita
Energy
(GJ/capita) 98.1 90.6 90.6 86.0 86.0
Energy Costs
($'000) $178,147 $179,273 $183,590 $196,961 $248,678
Per Capita
Energy Costs
($/capita) $2,001 $1,911 $1,838 $1,896 $1,896
GHG Emissions
(t eCO2) 521,250 489,760 543,348 538,836 680,322
Per Capita GHG
Emissions
(t eCO2/capita) 5.86 5.22 5.44 5.19 5.19

Town of Ajax: Community GHG Emissions Inventory and Trends
© 2010 Durham Sustain Ability Page 7
From 2005 to 2008, GHG emissions have increased by 3.4% on an absolute basis and
have declined by 11.4% on a per capita basis. Energy consumption has risen by 2.4% on
an absolute basis and dropped by 9.6% on a per capita basis. During this time, total
energy costs have gone up by 10.6% due to increasing energy prices as well the small
increase in energy consumption.
In figure A, the business-as-usual (BAU) forecast for 2020 assumes no further efforts to
reduce energy consumption such that the per capita GHG emissions remain the same as
2008. This results in a GHG emissions increase of 159,073 tonnes (t) or 30.5% from the
2005 baseline level due to the significant growth in population.
The per capita GHG emissions provide additional trend analysis as it removes population
as a variable. From 2005 to 2008, the per capita GHG emissions have been reduced from
5.9 t/capita to 5.2 t/capita.
Figure A: Absolute and Per Capita GHG Emissions with BAU Forecast

Town of Ajax: Community GHG Emissions Inventory and Trends
© 2010 Durham Sustain Ability Page 8
Figure B shows the close relationship between GHG emissions (blue bars) and energy
consumption (red line). The energy consumption provides further refinement as it
removes the effect of annual changes in the provincial electricity eCO2 emission
coefficient. From 2005 to 2008, energy consumption has risen by 2.4%, whereas GHG
emissions have increased by 3.4%. The 1% difference is mainly the result of a slight
increase in the provincial electricity eCO2 coefficient between 2005 and 2007 (the latest
published year).
Figure B: GHG Emissions and Energy Consumption

Town of Ajax: Community GHG Emissions Inventory and Trends
© 2010 Durham Sustain Ability Page 9
2.3 Inventory Baseline Year - 2005
In the baseline year of 2005, the community generated 0.52 million t of GHG emissions
from energy consumption and waste disposal corresponding to 5.9 t per person.
The residential sector is the largest consumer of energy and emitter of GHG emissions
followed the institutional, commercial and industrial (IC&I) sector and vehicle
transportation. In 2005, the community produced an estimated 66,728 t of residential and
commercial waste of which 28% was diverted from landfill. The landfill waste produced
23,168 t of GHG emissions, corresponding to 4% of the total community emissions.
Table 2 provides a percentage breakdown of energy consumption and GHG emissions by
sector.
Table 2: Percentage Energy Use and GHG Emissions by Sector
Sector Energy Use (%) GHG emissions (%)
Residential 44% 39%
IC&I 34% 31%
Vehicle Transportation 22% 26%
Community Waste - 4%
Figures C and D provide a breakdown of energy consumption and GHG emissions by
sector, respectively.
Figure C: 2005 Energy Consumption By Sector

Town of Ajax: Community GHG Emissions Inventory and Trends
© 2010 Durham Sustain Ability Page 10
Figure D: 2005 GHG Emissions By Sector
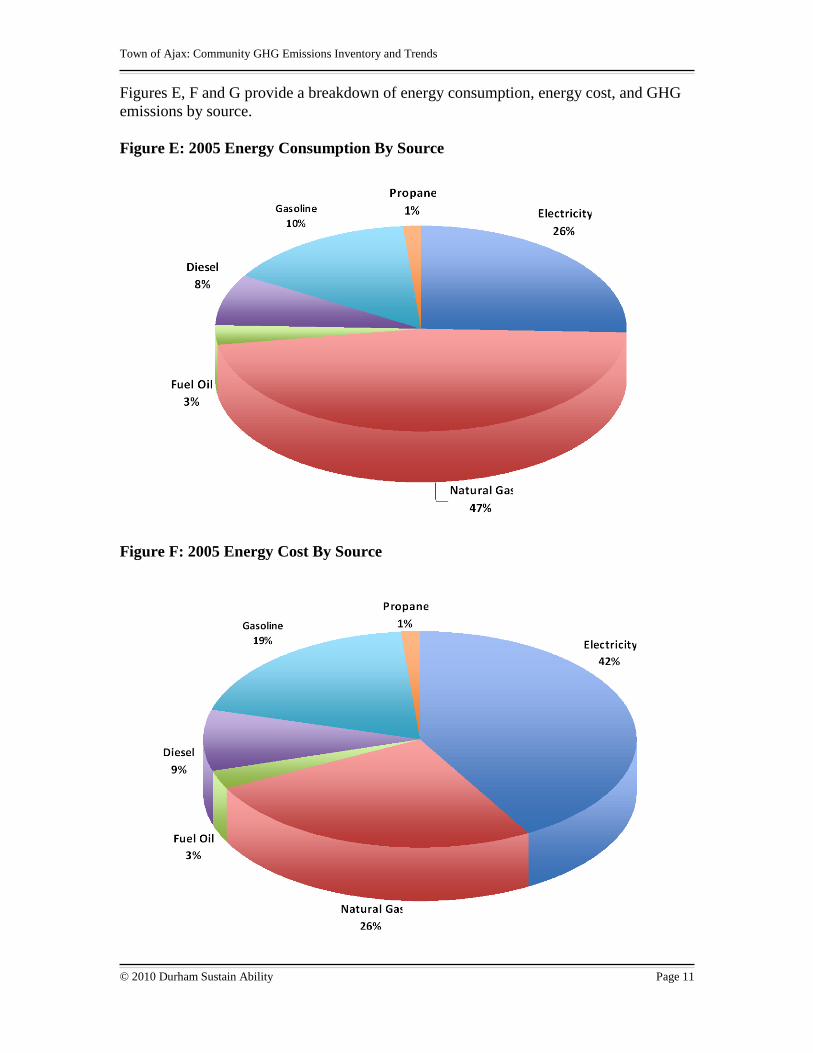
Table 3 provides a percentage breakdown of energy consumption, energy cost and GHG
emissions by source. Electricity represents the largest source of energy consumption and
GHG emissions followed by natural gas. Almost half of all energy usage (48%) is from
natural gas, however it represents only one quarter (26%) of the total energy costs.
Electricity cost is much more significant at 42%; and therefore, a much greater economic
driver for energy conservation.
Table 3: Percentage Energy Use, Energy Cost and GHG Emissions by Source
Source Energy Use
(%)
Energy Cost
(%)
GHG emissions
(%)
Natural Gas 47% 26% 40%
Electricity 26% 42% 25%
Gasoline 10% 19% 17%
Diesel 8% 9% 10%
Fuel Oil 3% 3% 3%
Propane 1% 1% 2%
Community Waste - - 4%
Town of Ajax: Community GHG Emissions Inventory and Trends
© 2010 Durham Sustain Ability Page 11
Figures E, F and G provide a breakdown of energy consumption, energy cost, and GHG
emissions by source.
Figure E: 2005 Energy Consumption By Source
Figure F: 2005 Energy Cost By Source

Town of Ajax: Community GHG Emissions Inventory and Trends
© 2010 Durham Sustain Ability Page 12
Figure G: 2005 GHG Emissions by Source
Town of Ajax: Community GHG Emissions Inventory and Trends
© 2010 Durham Sustain Ability Page 13
2.4 GHG Emissions Trends and Forecast By Sector
2.4.1 Summary
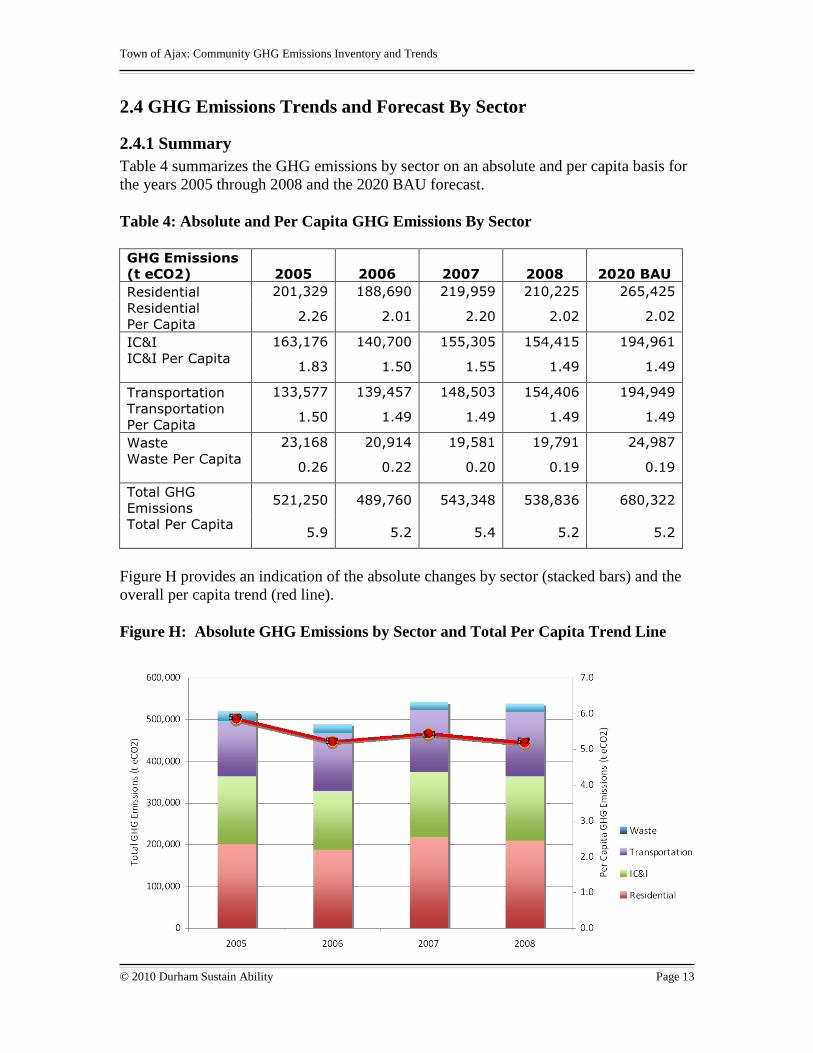
Table 4 summarizes the GHG emissions by sector on an absolute and per capita basis for
the years 2005 through 2008 and the 2020 BAU forecast.
Table 4: Absolute and Per Capita GHG Emissions By Sector
GHG Emissions
(t eCO2) 2005 2006 2007 2008 2020 BAU
Residential 201,329 188,690 219,959 210,225 265,425
Residential
Per Capita 2.26 2.01 2.20 2.02 2.02
IC&I 163,176 140,700 155,305 154,415 194,961
IC&I Per Capita
1.83 1.50 1.55 1.49 1.49
Transportation 133,577 139,457 148,503 154,406 194,949
Transportation
Per Capita 1.50 1.49 1.49 1.49 1.49
Waste 23,168 20,914 19,581 19,791 24,987
Waste Per Capita
0.26 0.22 0.20 0.19 0.19
Total GHG
Emissions 521,250 489,760 543,348 538,836 680,322
Total Per Capita
5.9 5.2 5.4 5.2 5.2
Figure H provides an indication of the absolute changes by sector (stacked bars) and the
overall per capita trend (red line).
Figure H: Absolute GHG Emissions by Sector and Total Per Capita Trend Line

Town of Ajax: Community GHG Emissions Inventory and Trends
© 2010 Durham Sustain Ability Page 14
The residential sector increased GHG emissions by 4.4% on an absolute basis while
reducing emissions by 10.5% on a per capita basis over the four years. The IC&I sector
reduced both absolute and per capita emissions by 5.4% and 18.9%, respectively.
Improved waste diversion rates reduced absolute and per capita emissions from landfill
waste by 14.6% and 26.8%, respectively. GHG emissions from transportation vehicles
increased by 15.6% on an absolute basis and were reduced slightly by 0.9% on a per
capita basis.
Figure I provides a per capita break down of each sector.
Figure I: Per Capita GHG Emissions by Sector

Town of Ajax: Community GHG Emissions Inventory and Trends
© 2010 Durham Sustain Ability Page 15
2.4.2 Residential
For purposes of this analysis the residential sector is comprised of single-family and
semi-detached homes. Condominiums and apartments are generally on single meters and
as such are regarded by the electricity local distribution companies (LDC’s) as
commercial accounts and cannot be readily segregated from other IC&I customers.
The residential sector accounted for 39% of total community GHG emissions in 2005 and
has remained at 39% through 2008. Table 5 shows the residential energy consumption,
energy cost and GHG emissions on an absolute and per capita basis.
From 2005 to 2008, the population grew by 16.7% and the number of households
increased by 17.3%. Despite the significant increase in population and households,
energy consumption and GHG emissions have only risen by 3% and 4%, respectively.
The difference between the two measures is attributable to the slight increase in the
provincial electricity eCO2 coefficient from 2005 to 2007. The eCO2 coefficient for the
year 2007 has also been used for 2008, as it’s currently the last published figure.
Changes in annual weather will also effect annual energy consumption and GHG
emissions. Drops in per capita energy consumption from 2005 to 2006 and from 2007 to
2008 may be partially due to relatively warmer winters in 2006 and 2008 versus 2005 and
2007, respectively.
Table 5: Residential Energy Consumption, Energy Cost and GHG Emissions
Residential 2005 2006 2007 2008 BAU 2020
Energy Use
(GJ) 3,808,895 3,722,303 4,114,183 3,921,691 4,951,439
Per Capita Energy
(GJ/capita) 42.8 39.7 41.2 37.8 37.8
Energy Costs
($'000) $67,831 $69,799 $71,841 $71,565 $90,356
Per Capita Energy
Costs ($/capita) $762 $744 $719 $689 $689
GHG Emissions
(t eCO2) 201,329 188,690 219,959 210,225 265,425
Per Capita
Emissions
(t eCO2/capita)
2.26 2.01 2.20 2.02 2.02
Figure J shows the residential GHG emission trends. The bars illustrate the trend on an
absolute basis and the red line provides the trend on a per capita basis. The residential
GHG emissions are forecasted to rise by over 64,000 t or 32% from 2005 to 2020 if no
action is taken.

Town of Ajax: Community GHG Emissions Inventory and Trends
© 2010 Durham Sustain Ability Page 16
Figure J: Residential GHG Emission Trends
2.4.3 Institutional, Commercial and Industrial (IC&I)
The IC&I sector comprises of institutions (government, schools, hospitals, churches,
museums, and other public buildings), office buildings, retail establishments, and
industrial facilities. It also includes apartments and condominiums for this analysis for
reasons discussed in residential section 2.4.2.
In 2005, the IC&I sector generated 31% of community GHG emissions and by 2008 its
proportional share declined to 29%. Table 6 shows the IC&I energy consumption, energy
cost and GHG emissions on an absolute and per capita basis.
From 2005 to 2008, total energy consumption and GHG emissions declined by 7% and
5%, respectively. As in the residential sector, the difference between the two measures
can mainly be attributed to the change in the provincial electricity eCO2 coefficient from
2005 to 2007.
Table 6: IC&I Energy Consumption, Energy Cost and GHG Emissions
IC&I 2005 2006 2007 2008 BAU 2020
Energy Use
(GJ) 2,980,353 2,750,355 2,781,773 2,771,907 3,499,747
Per Capita Energy
(GJ/capita) 33.5 29.3 27.8 26.7 26.7
Energy Costs
($'000) $61,788 $56,160 $53,184 $54,490 $68,798
Per Capita Energy
Costs ($/capita) $694 $599 $532 $525 $525
GHG Emissions
(t eCO2) 163,176 140,700 155,305 154,415 194,961
Per Capita GHG
Emissions
(t eCO2/capita)
1.83 1.50 1.55 1.49 1.49
Town of Ajax: Community GHG Emissions Inventory and Trends
© 2010 Durham Sustain Ability Page 17
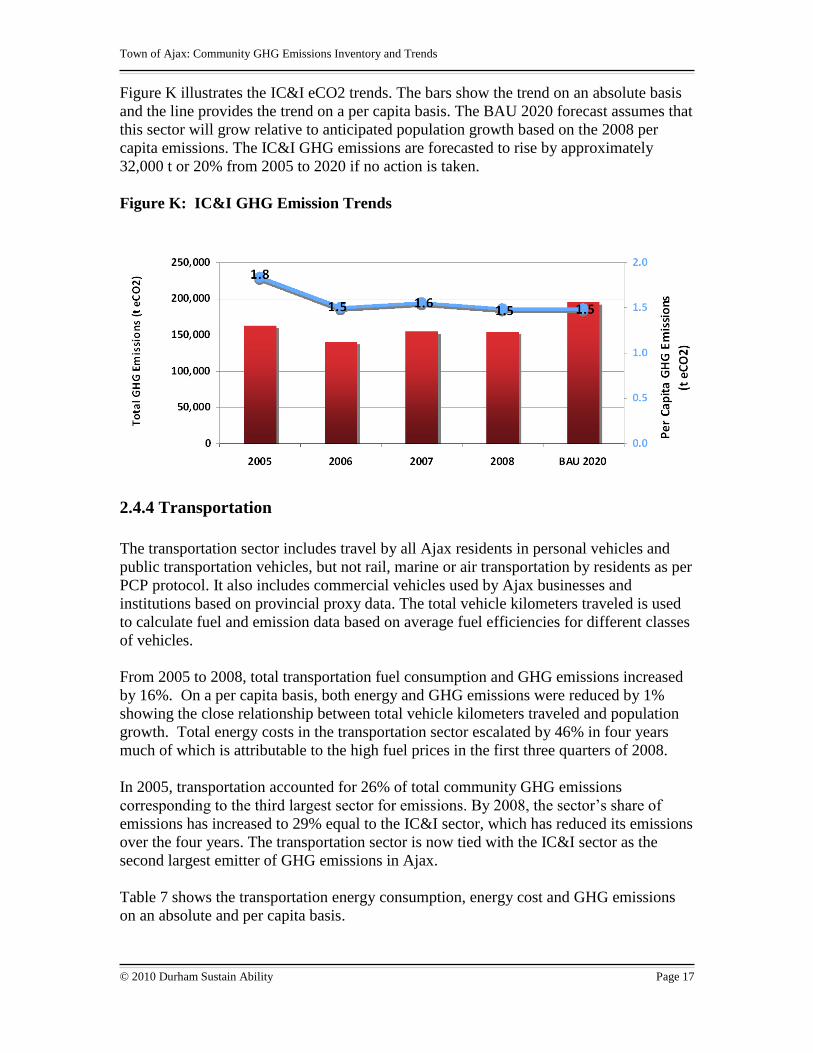
Figure K illustrates the IC&I eCO2 trends. The bars show the trend on an absolute basis
and the line provides the trend on a per capita basis. The BAU 2020 forecast assumes that
this sector will grow relative to anticipated population growth based on the 2008 per
capita emissions. The IC&I GHG emissions are forecasted to rise by approximately
32,000 t or 20% from 2005 to 2020 if no action is taken.
Figure K: IC&I GHG Emission Trends
2.4.4 Transportation
The transportation sector includes travel by all Ajax residents in personal vehicles and
public transportation vehicles, but not rail, marine or air transportation by residents as per
PCP protocol. It also includes commercial vehicles used by Ajax businesses and
institutions based on provincial proxy data. The total vehicle kilometers traveled is used
to calculate fuel and emission data based on average fuel efficiencies for different classes
of vehicles.
From 2005 to 2008, total transportation fuel consumption and GHG emissions increased
by 16%. On a per capita basis, both energy and GHG emissions were reduced by 1%
showing the close relationship between total vehicle kilometers traveled and population
growth. Total energy costs in the transportation sector escalated by 46% in four years
much of which is attributable to the high fuel prices in the first three quarters of 2008.
In 2005, transportation accounted for 26% of total community GHG emissions
corresponding to the third largest sector for emissions. By 2008, the sector’s share of
emissions has increased to 29% equal to the IC&I sector, which has reduced its emissions
over the four years. The transportation sector is now tied with the IC&I sector as the
second largest emitter of GHG emissions in Ajax.
Table 7 shows the transportation energy consumption, energy cost and GHG emissions
on an absolute and per capita basis.

Town of Ajax: Community GHG Emissions Inventory and Trends
© 2010 Durham Sustain Ability Page 18
Table 7: Transportation Energy Consumption, Energy Cost and eCO2 Emissions
Transportation 2005 2006 2007 2008 BAU 2020
Energy Use
(GJ) 1,939,704 2,025,078 2,156,449 2,242,159 2,830,899
Per Capita Energy
(GJ/capita) 21.8 21.6 21.6 21.6 21.6
Energy Costs
($'000) $48,528 $53,314 $58,565 $70,906 $89,524
Per Capita Energy
Costs ($/capita) $545 $568 $586 $683 $683
GHG Emissions
(t eCO2) 133,577 139,457 148,503 154,406 194,949
Per Capita GHG
Emissions
(t eCO2/capita)
1.50 1.49 1.49 1.49 1.49
Figure L shows the transportation GHG emission trends. The bars show the trend on an
absolute basis and the red line provides the trend on a per capita basis. It is assumed that
this sector will grow relative to anticipated population growth as demonstrated by the
current trend. The transportation GHG emissions are forecasted to increase by over
61,000 t from 2005 to 2020, corresponding to a 46% rise if no action is implemented.
Figure L: Transportation GHG Emission Trends
Town of Ajax: Community GHG Emissions Inventory and Trends
© 2010 Durham Sustain Ability Page 19
2.4.5 Waste
The community waste sector includes all waste collected by Durham Region from
residents, institutions and businesses. It also includes waste collected by private
companies from institutions and businesses, with the exception of industrial waste and
construction and demolition waste. Very little of the organic portion of this waste ends up
in municipal landfills and industrial landfill conditions do not foster decay. As little data
is available on private collection, provincial proxy data was used to add to Durham
Region records.
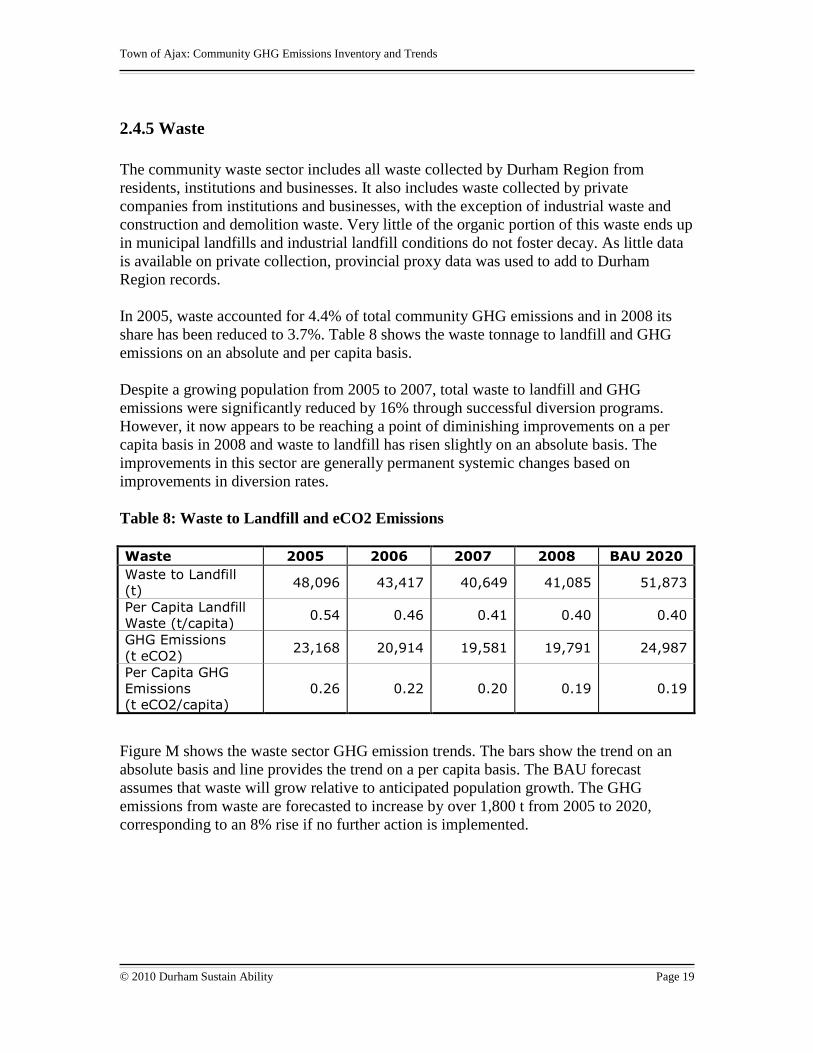
In 2005, waste accounted for 4.4% of total community GHG emissions and in 2008 its
share has been reduced to 3.7%. Table 8 shows the waste tonnage to landfill and GHG
emissions on an absolute and per capita basis.
Despite a growing population from 2005 to 2007, total waste to landfill and GHG
emissions were significantly reduced by 16% through successful diversion programs.
However, it now appears to be reaching a point of diminishing improvements on a per
capita basis in 2008 and waste to landfill has risen slightly on an absolute basis. The
improvements in this sector are generally permanent systemic changes based on
improvements in diversion rates.
Table 8: Waste to Landfill and eCO2 Emissions
Waste 2005 2006 2007 2008 BAU 2020
Waste to Landfill
(t) 48,096 43,417 40,649 41,085 51,873
Per Capita Landfill
Waste (t/capita) 0.54 0.46 0.41 0.40 0.40
GHG Emissions
(t eCO2) 23,168 20,914 19,581 19,791 24,987
Per Capita GHG
Emissions
(t eCO2/capita)
0.26 0.22 0.20 0.19 0.19
Figure M shows the waste sector GHG emission trends. The bars show the trend on an
absolute basis and line provides the trend on a per capita basis. The BAU forecast
assumes that waste will grow relative to anticipated population growth. The GHG
emissions from waste are forecasted to increase by over 1,800 t from 2005 to 2020,
corresponding to an 8% rise if no further action is implemented.

Town of Ajax: Community GHG Emissions Inventory and Trends
© 2010 Durham Sustain Ability Page 20
Figure M: Waste GHG Emission Trends

Town of Ajax: Community GHG Emissions Inventory and Trends
© 2010 Durham Sustain Ability Page 21
3.0 Recommendations
This report recommends that the Town of Ajax:
i) Receives the Ajax Community Greenhouse Gas Emissions Inventory Report
for information.
ii) Become a member of the Partners for Climate Protection (PCP) program.
iii) Complete the Town of Ajax’s corporate energy and GHG emissions inventory
and submit it along with this Ajax Community Greenhouse Gas Emissions
Inventory Report to the PCP secretariat for Milestone 1 approval.
iv) Review future sustainability planning requirements and determine whether the
PCP program and milestone framework contributes to meeting future
sustainability needs of Ajax in conjunction with the development of an
Integrated Community Sustainability Plan (ICSP).

Town of Ajax: Community GHG Emissions Inventory and Trends
© 2010 Durham Sustain Ability Page 22
Appendix A – Glossary
Units
GJ Gigajoule 1 billion joules
J Joule
A unit of energy equal to the work done when a current of
one ampere passes through a resistance of one ohm for
one second. A common metric unit of energy frequently
used for all sources of energy such as electrical energy
(kWh), natural gas energy (m3) and other fuels.
kWh Kilowatt hour
A measure of electrical energy equivalent to a power
consumption of 1,000 watts for one hour.
t Tonne Metric tonne, equivalent to 1,000 kilograms or 2,200
pounds
Acronyms
BAU Business as Usual
The absence of any emissions reduction measures.
eC02 Equivalent
carbon dioxide
A common unit that allows varying strengths of GHG
emissions (such as CO2 and CH4) to be expressed in like
terms.
FCM Federation of
Canadian
Municipalities
The national association of municipal governments
GHG Greenhouse gas
Any gas that absorbs infrared radiation in the atmosphere.
The three main greenhouse gases are carbon dioxide
(CO2), methane (CH4), nitrous oxide (N2O).
ICLEI International
Council for Local
Environmental
Initiatives
The international association for local governments
implementing sustainable development. initiatives.
PCP Partners for
Climate
Protection
A program implemented by FCM and ICLEI to assist
local governments to reduce GHG emissions.