A'IWMPHERIC RICROYAVE REFRACT1 VITY Am · 2013-08-31 · A'IWMPHERIC RICROYAVE REFRACT1 VITY Am...
99
A'IWMPHERIC RICROYAVE REFRACT1VITY Am REFRACTiaN Eunyoung Yu and 0.0. Hodge (NASA--1 643 39) ATBOSPliEPIC IICROUAVR 181-23739 REP2 ACT1 UIII Ali D REPP AeIOP Interim Beport ,Ohio State DP~?., Colubus.) $9 p iic AOS/~F AO 1 CSCL 04~ Uaclas G3/46 15002 Technical Report 712759-1 December 1980 Contract NASW-3393 National Aeronautics and Space dministration Headquarters Washington, D.C. 20546 https://ntrs.nasa.gov/search.jsp?R=19810015204 2020-04-01T20:26:56+00:00Z
Transcript of A'IWMPHERIC RICROYAVE REFRACT1 VITY Am · 2013-08-31 · A'IWMPHERIC RICROYAVE REFRACT1 VITY Am...

A'IWMPHERIC RICROYAVE REFRACT1 VITY Am REFRACTiaN
Eunyoung Yu and 0.0. Hodge
(NASA--1 643 39) ATBOSPliEPIC I I C R O U A V R 181-23739 REP2 ACT1 UIII Ali D R E P P A e I O P I n t e r i m Beport ,Ohio State DP~?., C o l u b u s . ) $9 p iic A O S / ~ F AO 1 C S C L 0 4 ~ Uaclas G3/46 15002
Technical Report 712759-1
December 1980
Contract NASW-3393
National Aeronautics and Space dministration Headquarters Washington, D.C. 20546
https://ntrs.nasa.gov/search.jsp?R=19810015204 2020-04-01T20:26:56+00:00Z

T A U OF CONTENTS
LIST O f TABLES
LIST OF FIGURES
I INTRODUCTION
A. Overview 0 . Atmcsphere
1 . Temperature 2. Pressure 3. Water Vapor
C. R e f r a c t i v i t y
I I METEOROLOGICAL DATA
I I I STATISTICS OF TEMPERATURE, PaESSURE, AND WATER VAPOR CONTENT
A. Temperature B. Pressure C. Water Vapor Content
I V ATWSPHERIC REFRACTIVITY VARIATION
A. Calculat icn 1. Frequency Independent Re f rac t i v i t y 2. Line Shape Factors
B. S t a t i s t i c s 1. The Frequency Independent Re f rac t i v i t y 2. ~ r e q u e n c ~ Dependent R e f r a c t i v i t y
V ATMOSPHERIC REFRACTION
A. Refract ive Icdex P ro f i l e 0 . Bending Angle C. E levat ion Angle E r ro r

D. Range E r r o r
V I SUMMARY
REFERENCES
APPENDIX A: CODING AND F O R M T O F YETEOROLOGICAL DATA
Page
82
86
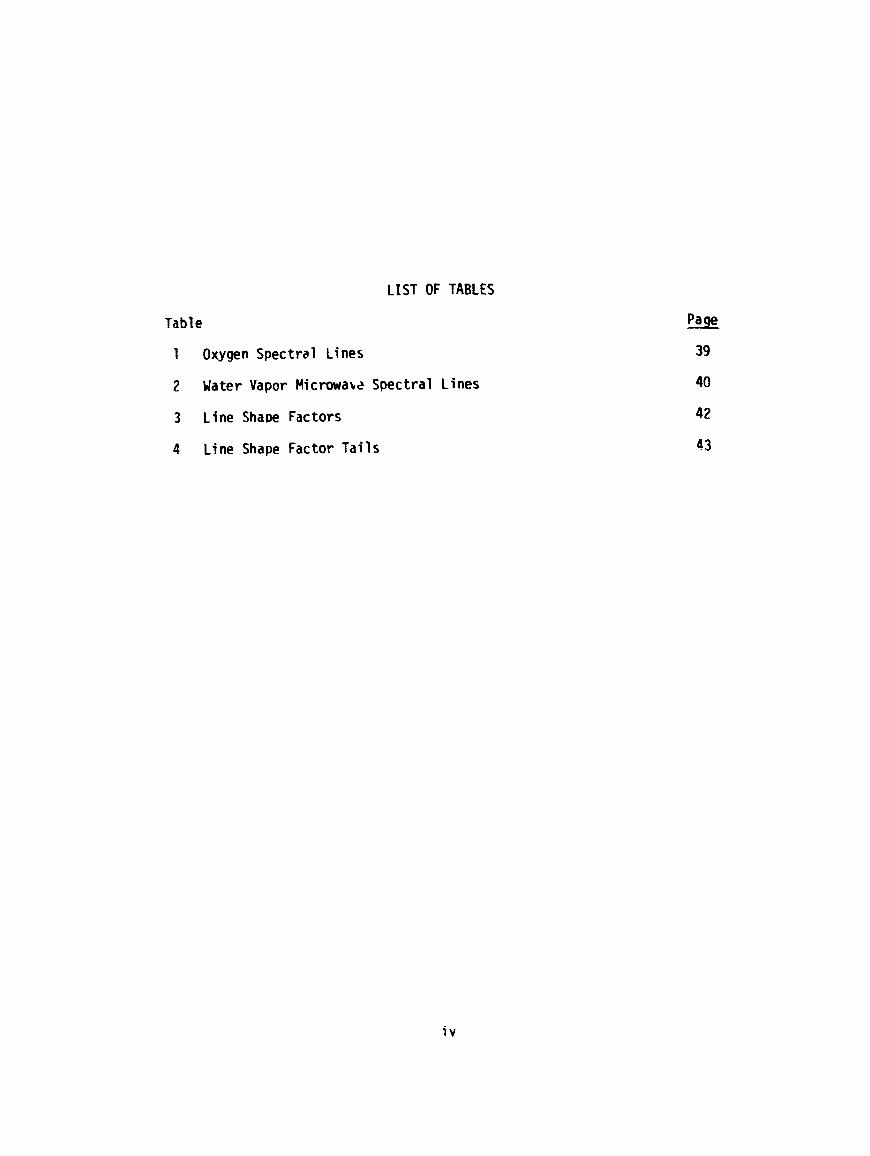
LIST OF TABLES
Table
1 Oxygen Spectral Lines
2 Water Vapor Mictowaw Spectral Lines
3 Line Shape Factors
4 Line Shape Factor T a i l s
Page
39

LIST 9F FIGURES
Figure Page
Character is t ics o f U .S. Standard Atmosphere, 1962, compared t o those of A R E Fbdel Atmospheres, 1956 and 1959.
Probabi 1 i t y density func t ion of temperature for the per iod 1949-1958; AT = 2C°F].
Probirbi 1 i t y density funct ion of temperature for the per iod 1967-1976; A T = 21°F].
Average d iurna l v a r i a t i o n of temperature for the per iod 1949- 1958.
Average d iurnal v a r i a t i o n of temperature f o r the per iod 1967-1976.
Dai ly maxivum, average, minimum, and extreme tenperaturn by months f o r the per iod 1949-1958.
Dai ly maxicum, average, minimuri, and extrene temperature bv months f o r the per iod 1907-1976.
Probab i l i t y densi ty funct ion o f pressure f o r the per iod 1949-1958; r, P = 1.43 [mbar].
Probab'l i t y density fanct ion o f pre5sure f o r the per iod 1967-1970; A p = 1.43 [mbar!.
Average d iurnal va r ia t i on o f pressure for the per iod 1949- 1558.
Average d iurnal va r ia t i on of pressure fo r the per iod 1967- 1976.
Da i ly maxirum, average, minimum, and extreme pressure by months f o r the per iod 1949-1958.
Da i ly maximum, average, mini mu^, and extreme pressure by months for the per iod 1967-1976.
Probabil i t y density funct ion o f r e l a t i v e humid! t y f o r the per iod 1949-158; = I[:].

Probab i l i t y density func t ion of r e l a t i v e humidity for the per iod 1967-1976; A V = 1 [%I. Average d iurna l v a r i a t i o n of r e l a t i v e humidity f o r the per iod 1949- 1958.
Average d iurna l v a r i a t i o n of r e l a t i v e h m i d i t y f o r the per iod 1967-1976,
Da i ly maximum, average, minimum, and extreme r e l a t i v e hu- m i d i t y f o r the per iod 1949-1958.
Da i ly maxinum, average, minimum, and extreme re1 a t i v e hu- m i d i t y f c r the per iod 1967-1976.
P robab i l i t y density func t ion o f H20 pressure f o r the per- i o d 1949-1958; I ! e = 0.71 [bar].
Probabil i ty densi ty func t ion of ri2C presswe for the per- i o d 1967-1976; b e = 0.71 [ d a r ] .
Average d iurnal v a r i a t i c n cf H20 pressure for the per iod 1949-1 958.
Average d iurnal v a r i a t i o n of H20 pressure for the period 1967-1976.
Da i l y maxinum, average, minimum, and extreme H20 pressure by months f o r the per iod 1949-1958.
Dai ly maxirrum, average, minimum, and extreme H20 pressure by months f o r the per iod 1967-1976.
Compariscn o f the dispersior! 1 ine shape factors; & = 0.065, I = 0.06. 10
Y - Comparison of the e x t i n c t i o n 1 ine shape factors; - - 0.065, I = 0.06. fo
Probab i l i t y density func t ion o f No for the per iod 1949- 1958; b N = 2.45 [ppm].
P robab i l i t y density funct ion o f K, for the per iod 1967- 1976; A N = 2.45 [ppm].
Average d iurnal v a r i a t i ~ n o f N, for the per iod 1949-1958.
Average d iurnal va r ia t i on o f No f o r the period 1967-1975.
Page
25
26

Paqe
Da i ly maximum, average, minimum, and extreme No by months f o r the per iod 1949- 1958. 53
Dai ly maximum, average, minimum, and extreme No by months f o r the per iod 1967-1976. 54
Average d iu rna l var ia t ions o f temperature, pressure, water vapor pressure, and N, fo r the per iod 1949-1958. 55
Dai:y averages of temperature, pressure, water vapor pres- sure and No by months for the per iod 1949-1958. 56
Average dev ia t ion of the rea l p a r t of r e f r a c t i v i t y from No. 57
.qverage imaginary p a r t o f r e f r a c t i v i t y . 59
Average attenuat ion. 60
P robab i l i t y densi ty funct ion of N" a t 20 GHz; M u = 1.6 X 10⁻³ [ppm]. 61
Average d iu rna l v a r i a t i o n o f N" a t 20 GHz. 62
Da i ly maximum, average, minimum, and extreme N" a t 20 GHz by months. 6 3
ProbaOil i t y densi ty funct ion of N" a t 30 GHz; 34"' 5 x 1 0 - ~ [ppm] . 64
Average d iu rna l v a r i a t i o n o f N" a t 30 GHz. 65
Da i ly maxi~um, average, minimum, and extreme 4" a t 30 GHz by months. 66
Geometry o f the re f rac t i on o f rad io waves. 70
Bending angle versus r e f r a c t i v i t y f o r various i n i t i a l e le- vat ion angles; H = 70 kin. 76
Bending angle versus r e f r a c t i v i t y f o r various i n i t i a l e l?- va t ion angles; H = 35,785 km. 77
Geometry for e leva t ion angle e r r o r . 18
Elevat ion angle e r r o r verstis r e f r a c t i v i t y f o r various i n i - t i a l e leva t ion angles; H = 70km. 80
Elevat ion angle e r r o r versus r e f r a c t i v i t y f o r various i n i - t i a l e leva t ion angles; H = 35,785km. 81

Page
51 Range e r r o r versus r e f r a c t i v i t y f o r various i n i t i a l eleva- t i o n angles; ti = 70km. 84
52 Range e r r o r versus r e f r a c t i v i t y f o r various i n i t i a l eleva- t i o n angles; H = 35,785km. 85

CHAPTER I
INTRODUCTION
Chapter One presents the background and overview of t h i s study. A
b r i e f review of the lower atmosyherc and i t s e l e c t r i c a l parameter, the
complex microwave r e f r a c t i v i t y , w i 11 be given.
A. Overview
As the use o f tne electromagnetic spectrum has ex~anded beyond ten
GHz, a number of t heo re t i ca l and experimental studies on the e f f e c t o f
the atmosphere on propagating waves have been performed, and the atmos-
phere has been found t o have a strong inf luence i n t h i s po r t i ov o f the
spectrum. I n t h i s h igh frequency region, the r e f r a c t i v e index o f the a t -
mosphere can no longer be regarded as a frequency independent quant i ty
i n discussions o f i t s in f luence on rad io wave propagation. Microwave s ig-
nal s t rave l 1 i ng along atmospheric paths undergo at tenuat ion and re f rac-
t i o n due t o a b s o r p t i o ~ by atmospheric gases and va r ia t i ons i n the re f rac-
t i v e index, respect ive ly . After Van Vlecks's pioneering work on micro-
wave absorption theory (1) ; several models were introduced t o develop
the microwave r e f r a c t i v i t y of the c lea r sky. Based on these works, the
microwave r e f r a c t i v i t y i s h igh l y dependent on temperature, pressure, and

and water vapor content which, i n turn, are random funct ions o f t ime and
space.
The design o f r e l i a b l e earth-space and t e r r e s t r i a l comnunication
1 inks requi res estimates of the de termin is t i c and random changes of
these a tmspher ic e f f e c t s on rad io wave propagatior~.
Using the extensive meteorological data base ava i lab le from the Na-
t i o n a l Weather Service, the d iu rna l and seasonal v a r i a b i l i t y o f the sur-
face mfcrowave r e f r a c t i v i t y has been determined a t Columbus, Ohio. The
r e s u l t s o f t h i s e f f o r t make i t possib le t o est imate the v a r i a b i l i t y of
the absorpt ion due t o atmospheric gases and the r e f r a c t i m effects fo r
a standard atmosphere.
I n the fo l lowing, a standard exponent ia l ly tapered atmosphere i s
assumed and the e f f e c t s of turbulence are ignored.
B. Atmosphere
The atmosphere t h a t surrourds the ear th i s a mechmical mixture of
vany gases. Although the atmsphere i s composed o f a number o f gases,
f f v e o f them - ni trogen, oxygen, argon, carbon dioxide, and water vapor - make up 99.997 percent of i t by volume below 90 km.
A complete descr ip t ion o f the physical s ta te o f the atmosphere a t
any moment requires the measurement o f dozens o f quant i t ies . The znaly-
s i s of weather i s usua l ly centered on several var iab le cha rac te r i s t i cs
of the atmosphere near the ear th 's surface: temperature, pressure, humid-
i ty, cloud, ~ r e c i p i t a t j on , and winds. Among these cha rac te r i s t i cs temp-
erature, pressure, and humid1 t y are major fac tors i n the determl na t ion
of the r e f r a c t i v e index. Figure 1 shows the v e r t i c a l d i s t r i b u t i o n s of

Figure ;. Charac te r is t ics of U .S . Standard Atmosphere, 1962, compared t o those of ARDC Model Atnlospheres, 1956 and 1959. (The 1956 Model agrees w i t h the 1954 "U.S. Extension t o the ICAO Stand- a rd Atmosphere". ) The names shown for atmospheric she1 1 s and boundaries a r e those adopted by the World Meteorological Organizat ion.

temperature, pressure, and densi ty fo r the U.S. Standard Atmosphere.
1 . Temperature
Temperature i s a measure o f k i n e t i c energy of the molecules pre-
sent i n the a i r . Temperature varies widely from place t o place over
the ear th 's surface as we l l as through t ime a t a given place. There
are two major per iod ic changes i n temperature: the annual and the d i -
urnal.
As shown t n Figure 1, the temperature normally decreases w i t h
height i n the troposphere. An approximate formula which describes the
temperature-height dependence i n the troposphere i s ( 2 ) :
Where T = temperature a t z
z = height above mean sec !eve1 [kmf
2. Pressure
The pressure sxerted a t any l eve l i s due almost e n t i r e l y t o the
weight o f the a i r pressing down from above; Chis force r e s u l t s =ram
g rav i ta t i ona l a t t rac t i on . As would be expected, the pressure changes
r a p i d l y i n the v e r t i c a l d i rec t i on . The r a t e of i t s change i s greatest
near the surface and decreases a t a decreasing r a t e w i t h hefght. The
pressure-height depmdence can be approximated by an exponential 1 aw ( 3 ) :
P = Po exp [-z/H] [mbarl (1-1 -2)
Where, P = t o t a l pressure a t a l t i t u d e , z, Po = sea l e v e l pressure averaged over the ear th ; 1,013 [mbar]

H = scale height 7 [kml
z = he igh t above mean sea l eve l [km]
Var iat ions o f pressure i n the hor izonta l are much smaller than
those i n the v e r t i c a l . Near sea l eve l , the change o f pressure w i t h diq-
t a m e r a r e l y exceeds 3 mb per 100 km and usua l ly much less than h a l f o f
t h i s r a t e (4 ) . Only i n the presence of severe storms o r except ional lv
we1 i developed masses o f co ld a i r does the pressure vary more than three
percent from the average. Even though the va r ia t i on i n the hor izonta l
i s r e l a t i v e l y smal:, t h i s small change i n pressure may change the d i rec-
t i o n and velocf t y o f the wind atld can subsequently lead t o temperature
and moisture changes.
Pressure a lso changes w i th t ime a t a s inp le place. Some o f these
changes are of an i r r e g u l a r nature, caused by occasional invasions o f
a i r having a d i f f e r e n t mean density. But there i s a lso a q u i t e regular
d iurnal osci 1 l a t i o n of the pressure.
3. Water Vapor
The concentrat ion o f water vapor i n the atmosphere varies from
p r a c t i c a l l y zero t o as much as four percent by weight. The v e r t i c a l
p r o f i l e o f the averaged densi ty o f water vapor, w, can be approximately
described by an exp i e n t i a l law ( 2 ) i n a humid atmosphere,
% = 20 exp [-0.12z] [gm/m3] (1 -1.3)
while, f o r a standard atmosphere,
Z D w = 5 - 7 r sm/m3 i (1 -1.4)
The parameter which i s i n comnon use f o r the representat ion o f the
water vapor ccntent o f the atmosphere i s the r e l a t i v e +umidity. The

de f i n i t i on o f r e l a t i ve htmidity, V, i s :
where e i s the pa r t i a l pressure due t o water vapor and es i s the satura-
t i o n pressure. Star t ing with the l a t en t heat of vaporization, an ex-
pression f o r the saturat ion pre;sure my be derived wi th the following
' 1 es = 6.11 exp L(6.830 - 5.14 T) (& - [ear!
where T i s temperature [Ok].
C. Re f rac t i v i t y
The ~ t h ~ t i c a l formulation f o r the e l i c t r i c f i e l d of a urt i fcm
plane wave ~ropagat ing i n a !-direct ion can be wr i t ten: - - E = E, exo [ - j k l ] (1-2.1)
khere k 1s the complex wave n d e r . ~m *xwell I S equations,
where rr i s the cmplex r e l a t i v e permf t t i v i t y . The complex index of re-
f rac t ion of the atmspherv i s then give!: by:
where the p r i r e and double prime denote rea l and inaginary parts, re-
spectlvety. Usually the complex microwave re f rac t i v i t y , N, i r used f o r
convenience i n pract ical accl i ca :ion:,
N = (i - 1) l o 6 = R e - j N " [~pn]
There i s another prop~gat ion parameter .in comnor; use: that i s the propa - qa:'on carstant:
6
'; = j k = & E +jS

wher-e, aE i s the specific attenuation of the electr ic f ie ld and 6 i s the
~ h s e constant. From equations (1-2.2). (1-2.4) and (I-2.5),
wt?re f i s i n [Qlzj. The speci f ic power attenuation, ap. can be defin-
ed as:
CHAPTER I 1
METEOROLOGICAL DATA
The weather data used i n t h i s repor t was measured by the National
k a t h e r Service a t Cclurrtus, Ohio, from 1948 t o 1976. Temperature.
pressure, rela t i ve humidity , wind, and several o ther meteorological
s tates were observed every hour dur ing the 1949-1958 period, and every
three hours dur ing the 1965-1976 period.
The Cata are stored c8 two nine-track tapes. The record format
consists cf f i xed blockc each composed of four equal length l o g i c a l re-
card;. Each l o g i c a l tape record contains s i x observations and i s 495
bytes long. These records consis t of f i f t een bytes of i d e n t i f i c a t i o n
followed by s i x observations of e igh ty bytes each. Records always be-
q i n w i t h the Local Standard T i m e hour o f BBLST, 06LST, lZLST, o r 18LST.
Space i s alkays ,-etained on tape for twenty-four observations/dav. When
no observatfon i s avai lab le, the hour i s ind ica ted (two bytes) and a l l
o ther f i e l d s are coded blank.
For mre deta i l e d in format ion about the format and codins, the
reader i s re fe r red t o Appendix A.

CHAPTER I 1 I
STAT1 STICS OF TEWERATURE, PRESSURE, AND WATER V4POR CONTENT
Columbus, Ohio ( l o ) , i s located i n the area o f changeable wezther.
A i r masses from cent ra l and northwest Canada f requent ly invade t h i s re-
gion. The t rop i ca l Gulf a i r masses c f ten reach cent ra l Ohio during the sum-
mer and, t o o much less extent, i n the f a l l and winter. There are a lso
cccasional weather changes brought about by cool outbresks from the Hud-
son Bay region of Canada, espec ia l l y during the spr ing months. A t i n -
frequent i n t e r v a l s the general c i r c u l a t i o n w i l l b r i n g showers o r snows
t o Columbus from the A t lan t i c . A1 thouqh Columbus does not nave a "wet"
o r "dry" season as c ~ ~ c h , the month o f Cctober has a higher frequency of
l i g h t r a i n f a l l than any other month and comes c losest t o provid ing a nor-
mal dry period.
I n t h i s chapter, the s t a t i s t i c s o f tmperature. pressure, and water
vapor content are obtained fo r two ten-year periods: 1949 through 1958,
and 1967 throuqh 1976. Note t h a t the weather data were observed every
hour during the 1949-1958 period, and every three hours during the 1967-
1976 period.
For each weather variable, the p robab i l i t y density, the averase d i -
urnal v a r i a t i o n on a monthly basis and the d a i l y maximum, average, min i -
mum, and extremes by months are c lo t ted . The maxima and minima a;e the
averages o f each year 's highest and lowest values. The extremes are the

extreme values observed dur ing the period specified.
A. Temperature
Since the t ransient periods between s m m r and winter are re la t ive-
l y short and the two seasons are d is t inc t fve, the p robab i l i t y density
functions o f temperature have a bimodal frequency curve w i th tm, maxima
a t about 31°F and 70°F (see Fioures 2 and 3). The diurnal var iat ions of
temperature duri-,g s u m r are greater than those of winter (see Figures
4 and 5). But the f luctuat ion during winter i s a l i t t l e greater than
tha t during s u m r (see Figures 6 and 7). IR a l l cases, +he temperature
reaches i t s minimum value near loca l sunrise and i t s maximum a t about
3:30 p.m. loca l time.
0 . Pressure
The probabi l i ty density function has the shave of Gaussian d i s t r i b -
u t ion (Figure: 8 and 9), and has a peak a t 987.14 [a] i n both periods.
This value i: s l i g h t l y higher than the value o f 978 [nb] predicted by
Equation (1-1.2) f o r ths observing s ta t ion height o f 247 Em] above mean
sea leve l . For the 1949-1958 period, the average i s 987.2 [mb], the highest i s
1615.62 [I&], and the lowest i s 949.24 [mt] . Fgr the period 1967-1976,
the average i s 987.5 [dl, the highest i s 101 3.25 [mb], and the lowest
i s 953.65 [mbj.
Figures 10 and 11 show tha t the diurndl va r ia t ion of pressure i s
qu i te small. But i t i s in terest ing t o note tha t there !s a qu i te regu-
l a r d ~ u r n a l osc i l l a t i on o f the pressure that causes, on the average, two
mixima ( a t about 10:OO a.m. and 10:00 p.m.) and two minima ( a t about

PERIOD : 1 / t /U9-12/31/58
Figure 2. Probabi l f ty density function 3f temperature f o r the period 1949-1958; s T = 2['f!.

PERIOD : 1 / 1 167-12/31/76
TEHPERRTURE (F) t m ~ m ~ l ~ 1 ~ ~ l w m m s l w m ~ ~ I ~ m m 1 ~ 8 B ~ m ~ 1 ~ 1 1 ~ 1 1
-30 -20 -10 0 10 20 30 VO TEMPERATURE ( C l
Figute 3 . P r o b a b i l i t y densi ty f unc t i on o f temperature f o r the per iod 1967-1276; 3 J = 2C°F].

JFIN MAY -.--- SEP - - - . - FEB - - - JUN - - - - - . - OCT -.--- WfiR - - - - - - Jw ---- NoV - a - - -
RPR - - - . - - - - - - ---- DEC - - - - - - - PERIlrir : 1 / l 149-12/31./58
0
.
.
' 0 ' C
I L . . . . m . 1 . 1 . r . W l I I 1 1 1
0 5 10 1s 20 HOUR
Figure 4. Average diurnal variation of temperature for the period 1949-1958.

JRr4 HAY - - - - - Sfp - - - - - FEB - - - JUN - - - - - - - OCT - - - - - nAR - - - - - - JUL - - - - - . - - - fiPR - - - - - - . - - . RUG - - - - - OEC - . - - - - - .
PERIOD : 1 / I /67-12/31/76
0 -0
. #!' ---- L
// ./-.--1: ' 0 -a
M
U w
W Pt 03 :-+ a
- - . - _ . * Pt W e x W
' OC- - - - - .__ . . - - L
L . L
' 0 -- I
0 3 10 15 20 HOUR
Figure 5. " wage d iu rna l v a r i a t i o n o f temperature f o r the pe r i od . 77-1976.

EXTREME H I nnx I nun WERCIGE HlNIMUH E x T a n E LO
Figure 6. Dai ly maxirnu~, average, minlmum, and extreme temperature by months f o r the psr iod 1949-1958.

EXTREME H I + + + ncrx 1 nun FIVERRGE N I N I ~ U ~ - EXTREME LO X X X
PERIOD : 1 /l 167-12/31/76
Figure 7 . D a i l y maximum, average, minimum, and extreme temperature by months for the per iod 1967-1976.

Figure 8. Probability density function o f pressure for the period 1949-1958; A p = 1.43 [mbar].

PERIOD : 1 / 1 167-12/3i/76
PRESSURE [MBAR)
Figure 9. Pmbabil i t y dens i ty func t ion o f pressure f o r the per iod 1967-1976; h p = 1.43 [mbar].

JON nny -.-.- SEQ - . - . - FEB - - - Jup a * - - - - - 0CT - - - - - MAR - - - - - - JUL ---- NOV - a * - -
APR ..-......- RUG ---- OEC - . . - - - - - PERIOD : 1 / 1 /U9-12/31/58
F igu re 10. Average d i u r n a l v a r i a t i ~ n o f pressure f a r the p e r i o d 1949-1958.

JAW May - - - - - SEp - - - - - FEB - - - jun - - - - - - - 0 ~ 1 - - - - - )rfiR - - - - - - JUL - - - - - - - - - flQR - - - - - - - - - - RUG ---- O f t - - - - - - - -
f igu re 11. Average d!~;-na! va r ia t i on of pressure f o r t h ~ per icd 1967-1 976.
PERIOD : 1 1 1 167-12/3i/75 C)
. Y
A
a a
- S J - L -9: - ,- - - 0 --
cn a -----\,-- ,f- W a e
q
. b)
%
- 4 - 4 - 0 . - - /2/ - - - =-\-A/ - +:. &/' - - \ l - -
% _ - - - - /
I \\' 0 - ?c--J . I
.-/ ..\ / 4 / i
7:: - - -y --,
. . . . . . . . . . . . 1 . 1 1 . . a *
0 5 10 1s 20 HOUR
4:00 a.m. and 4 : O p.m.). The da i l y heating and coolincj cycle appears
t o be the dominant cause of the pressure variations. And, the pressure
during the spring season tends t o be lower than tha t during the autumn
season.
Even though the werage pressure does not vary m c h seasonally,
the degree of fluctuation of pressure i s dependent on the season (see
Figures 12 and 13). The f l ~ i t u a t i o n of pressure during winter i s much
greatcr than during c;mner.
C. Uater V~mr Content
The probabi 1 i t y derfsi t y functions of the re: a t i ve h m i d i t y (Figures
14 and 15) show a strong bias toward values o f high re i a t i ve humidity.
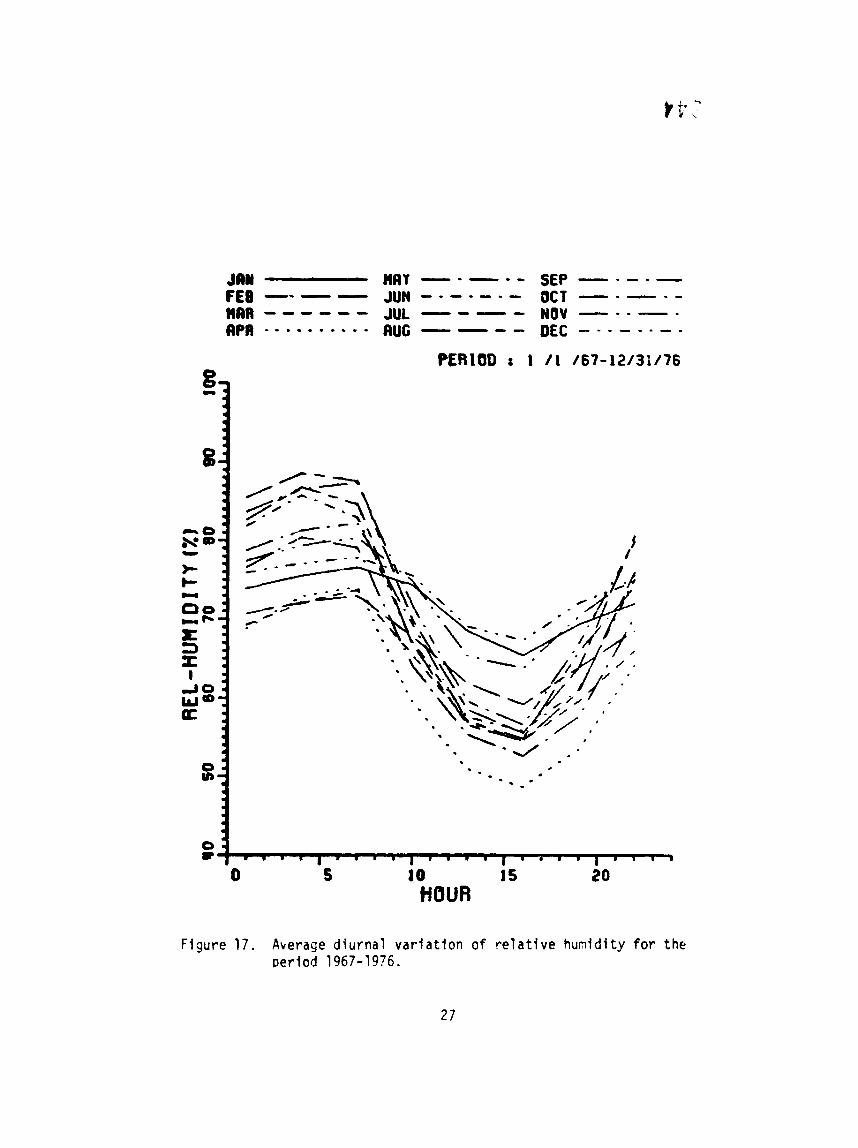
The diurnal var ia t ion i s s m l l during the winter season and large during
the r m r season (Fiailres 16 a ~ 3 17), but the m n t h l y averacje i s the
highest i n Jacuary and December ;Figures 15 and 19).
Since the water vaoor presxwe i s deoendent on temperature (Equa-
t i o n 1-1.3 and 1-1-41, the shape o f i t s density function (Figures 20 and
21) i s qui te d i f fe ren t frm that o f r e l a t i ve hunidity. The water vapor
pwssure doesn't vary diurnal ly, but the monthly average shows a strong
seasopal dependence (Figures 22, 23, 24, 25). The average i n July i s
about 22 [&I, and the average i n January i s about 5 [mb] .

ExrREnE HI ncrx I nun AVERAGE nlnxnun EXTRE~E LO
PERIOD : 1 11 149-12/31/58
MONTH
Figure 12. Dai i y maxirnuw, average, minimum, and extreme pressure b j months f o r the per iod 1949-1958.

EXTREME HI + + + n ~ x I HUN - FlVE RClGf C nl~xnm - EXTRE~E LO X X X
PERIOD : 1 / 1 /67-12/31/76
HONTH
Figure 13. D a i l y maxinum, average, minimum, and extreme pressure by months f o r the period 1967-1976.

PERIOD t 1 11 /V9-12/31/50
Figure 1 4 . Probabllttv densi ty f unc t i on of relative nirrniditv for the o e r i ~ d 19~9-!%?; L G - 
F<gure 15. Probabil i ty densf t y futlction o f r e l a t i v e humid1 t y f o r the per iod 1957-1975; ~v = I[:].
(b 0
0-
0
,
* . '-iu -0 cn -- z* W * 0
* . t - - 2 u ,
QD, a0 8 dm dC , e
. 0 0
d
t J
- '"" l.l..l..v.ll...,,.v.~....,... v 1 . 1 1 1 1 . a
0 10 20 30 PO 50 60 70 80"&";60 RELRTIVE HUHIDiTY I%)

3C1N - - - - - SEQ - - - - - FE8 - - - JON - - - - - - - ~ C T - . - . - MAR - - - - - - JUL - - - - NOV - - - - - APR . . . - - - - . - . RUG - - - - DEC - . - - - - - -
F i g u r e 16. Average d i u r n a l v a r i a t i o n o f r e l a t i v e h u m i d i t y f o r t h e perlod 1949-1958.
JCIH nay ---.- s ~ p - - - - - FE8 - - - JUN - - - - - - - OCT - - - - - man - - - - - - JUL - - - - NOV - - - - - npfi - - . -. . * . - - RUG - - - - DfC - - - - - . - .
PERIOD t 1 11 /67-12/31/76 g L
8
4 I
w
3 s I
J O hJa a
s * . -
0 ~ ~ ~ 1 . 1 ( . m 8 1 ) . . 1 1 1 W 8 . . I . ~ w d
0 5 10 15 20 HOUR
Figure 17. Average d iu rna l v a r i a t i o n o f r e l a t i v e humid i ty f o r t h e ~ e r i o d 1967-19?6.

ExTREnF H I + + + nirx 1 nun - RVERAGE - nlnt~un - f XTREHE LO X X X
PERIOD : 1 / l /us-12/31/58
HONTH F i q u r e 18. D a i l y maximunl, averaqe, m i n i ~ u m , and extreme r e l a t i v e
hcmidi t v f o r t h e p e r i o d 1949-1958.

EXTREME H I + + + n ~ x I nun - AVERAGE - HlNIMUH - EXTREME LO X X X
PERIOD : 1 / 1 167-12/31/76
HONTH
Figure 19. D a i l y maximum, average, minimum, and extreme r e l a t i v e humid i ty f o r the per iod 1967-1576.

PERIOD : 1 / l /U9-12/31/58
Hz0 PRESSURE (MBRfll
i i g u r e 20. Probabi i i t y dens! t y func t ion o f K . fl pres5ht-e f o r the L
ger iod 1333-1958; A e = 0.71 [mbar].

PERIOD t 1 / 1 167-12/31/76
ti20 PRESSURE (MBARI
Flgirre 2 1 . P r o b a b i l i t y dens i ty func t lon of ti20 pressure for the
per iod 1967-1976; Ae = 0.71 [mbar].

JFlN - - - - - SEP - - - - - FEU - - - JUN - . - - - - - OCT - . - - - HflR - - - - - - JUL - - - - NOW -..-. APR - . . - - a - . - - RUG ---- DEC - - . - - - - .
m 1 m m m m m r m m . m r m m - 3 1
0 5 10 15 20 HOUR
Fiqure 22. Average diurnal variation of !!2F pressure f o r t he period 1949-1958.

JRN HAY - . - * - SEp - - - . - FEB - - - JUN - - - . - . - OCT -.-.- HRR - - - - - - JUL - - - - NoV -. - --. Rp,, . - - - . . . . - . RUG - - - - DEC - . . - . - - .
r gure 2 3 . Ave;?ge diurnal variation o f H23 pr rs .$J re f o r the pe r i od 15167-1976.
PERIOD : 1 / 1 167-12/31/76
tc- .I
.I
q
0 a-
- A
a a .I
m - s m --- W ae 3 - m m . kJJ 0 Ut-- e . Q nJ - I e:
.I
.
- - A,'/ - ----- 1 lL--d , . - - - - - - - - - - - _ - - -
0 - . - . c. - - - /---- -- - - - - - - - - -
1 - - - - , /
/--- ----- - - - - . - - - - - - - - -.
- -L ,
/ * - -
. . - - - - - - - - _ . . _ * _ . _ - - - - - _ _ _ . . . -
/-------- - - . - - - . . - . . - - - I - - - - - - - - - _ - - - - - - - - - _ - - . - - - - - - . - _ _ _ .
- . - - . . - - * - - - - m
O L - " I " T ' I m " l 0 5 10 15 20
HOUR

Figure 23. D a i l y ~ a x i n u , ? , average, ~ - ; n i ~ q v . and extrme P2@ prsssure 3y m n t h s f a r the period 1949-79%.

Fiaiire 2 5 . 32i l .v max:cum. average, ~ i n i r i - , and extreme H7C oressure for t h e period 1367-1°C.
L

CHAPTER I V
ATMOSPHERIC REFRACTIVITY VARIATION
Atmospheric gases having e l e c t r i c o r magnetic d ipo lc moments cause
absorpt ion and d ispers ion of electrcnragnetic waves. I n a tmospheric pro-
pagation, t b e atmospheric effects are represented by the complex r e f r a c t -
i v i t y , N, i n par ts per n i l l i a n [ppmj. Since the m l e c u l ~ r p o l a r i z a t i o n
depends upon remperature, pressure, and gas compos i t ion , the r e f r a c t i v -
i t y var ies w i t h the atmospheric s tate.
I n t h i s chapter we w i l l ca l cu la te the c lea r sky r e f r a c t i v i t y f c r
the mcteorolcgical sor.dit ions presented i n the preceding chapter and i t s
p r o b a b i l i t y d i s t r i b u t i o n and v a r i a t i o n f o r Colun$us, Ohio.
A. f a l c u l a t i o n
Over the 10-300 GHz frcquencv ranqe, the spectra o f the a**ospheric
qas molecules lead t o a c.mpl icated expression fo r N w i t h s e u ~ r a l i i n e
parameters. The Absorption L ine Parameter Compilation (ALPC) ( 5 ) , wkfch
i s the most cmp:ete account o f atmospheric absorpt ion i ines, 1 i s t s mor?
than !0,000 14nes fo r the seven molecules: H20. COZ. 03. N,O. L CO, CH4.
and 0,. Of these, s i a water vapor and t h i r t y - s i x oxvpen s p ~ c t r a l l i n e s
dominate the electrornaqnetic charac ter is t i cs o f c l ea r a i r i n the EHF
range.
Eased on h o u r a and Hodge's work ( 6 ) . the complex microwave r e f r a c t -
Cvf ty , N, can 3e expressed as the sum of the r e f r a c t i v i t f e s due to each
36

indiv idual absorption l ine,
where
No= 1Noi i s tke frequency independent rea l par t o f the re f r ac i l v - i
i t y of a i r C~pnl,
= the low frequency l i m i t c f the i - t h l i n e re f r ac t i v i t y i n
i = the i - t h l i n e strength In [KYz],
Fil = the dispersion l l n e shape fac tor o f the I - t h l i n e i n
[GHZ-'1. and
Fill = the ext inc t ion l i n e shape fac tor o f the i - t h l i n e i n
As w i l l be shown i n Section ( A - 1 ), the low frequency t a i l can be ap-
proximated as: S:
where foi i s the resonance frequency o f i - t h l l ne . Therefore, i f we
neglect the e f f ec t of absorption l ines other than the s ix water vapor
and t h i r t y - s i x oxyaen l ines, the c lear a i r r e f r a c t i v i t y i n the EHF range
can be obtained by
and
37

where "w t " stands for water vapor and "ox" stands for oxygen.
The oxygen spectral 1 ines and the water vapor spectral 1 ines wi th
t he i r l i n e paramters are i i s t e d i n Tables 1 and 2. From Equation
(1-2.8) the power attenuation w f l l be given by
where f i s i n [GHz].
1 . Frequency f ndependec t Refract i v i ty
The frequency independent r e f r a c t i v i t y can 52 obtained by sumning
the low frequency l i m i t s o f a l l o f absorption l i n e re f r ac t i v i t i e s , 1.e.
N o = : N o i i = a l l atsorpt ion l i ces (4-1.6) i
But t h i s i s not possible bec~use i t requlres a f u l l knowledge o f at 1 of
tSe absorption l ines. Based on experimental work, Bean and Outton (7 )
preseeted the i o l l e r i n g empirical equation f o r the frequency independent
r e f r a c t i v i t y of moist a i r :
where
Dd = dry a!r pressure [mb]
e = pa r t i a l pressure of water vapor [mb]
T = temperature ["k]
Ncte tha t t h i s frequency indeoendent r e f r a c t i v i t y i s purely rea l .
As shown i n the next section, the imaginery par t c f the r e f r a c t i v i t y i s

TABLE 1

Table 1 (contlnued)
Table 2
WATER VAPOR MICROWAVE SPECTRAL LINES (51
f ;&It) 5, kHz larbar d lo GHz/mbar T T
22.23508 0.0112 1 2.143 1 28.1 x I i I
68.052 0.0013 1 7 1 29.0 r i ~ - ~ I i 28.2
32 1 ,22564 0.0044 22.0 lo-4 '
i
325.1 5292 0.159 , 1.52 29.0 10-4 i 1 380.19737 1 .240 1.02 , 28.5 lo-4 I I L 1______1

proportional t o the operating frequency for law frequencies and i s gen-
e r a l l y neg l ig ib le f o r frequencies below 1 GHz.
2. Line Shape Factors
The frequency var ia t ion of the absorption and dispersion o f each o f
the spectral l i nes i s repres2nted by a 1 ine shape factor . Three c lass i -
ca l l i n e shapes ( the Lorentzian, the Van Vleck-Weisskopf, and the Gross)
are i n conmon use i n atmospheric r e f r a c t i v i t y studies, but the Gross
l i n e shape s e a t o fit the experimental resu l t s bet ter . The three l i n e
zhape factors and t h e i r t a i l s are l i s t e d i n Tables 3 and 4, respective-
l y - A t law a1 t i tudes (h < 35km), the e f f ec t o f pressure broadening
causes the absorption l f nes t o overlap. Based on Rosenkranz's work,
Liebe (5) used the fo l lowing l i n e shape factors f o r the ca lcu la t ion of
c lear a i r r e f r a c t i v i t y i n the pressure broadening region (h < 35km).
where f, i s the resonant frequency o f the 1 ine, f i s the operating fre-
quency, Y i s the l i n e width, and I i s an interference parameter. The
interference parameter i s neg l ig ib le i n the case o f water vapor while i t
i s a function of pressure and temperature f o r the oxygen molecule (5).
where


TABLE 4
LINE SHAPE FACTOR TAILS (6)

a = constant
Pd = dry a i r pressure [mb]
T = temperature [Ok]
If Y << fo and I i s small, the low and h i gh frequency t a i l s a re
For comparison, we p l o t t i le d ispers ion and e x t i n c t i o n 1 i n e shape f a c t o r s
o f t he four l i n e s i n Figures 26 and 27 f o r equal t u 3.065. The i n - 3
te r fe rence parameter i s s z t t o 0.06. As sbown i n F igure 20 and from
compar i s~n o f low and h i gh frequency t a i l s , L iebe 's d ispers ion i ins
shape f a c t o r seems t o be sh i f t e d downwar-c! b y 2 c I t should a1 so be no-
t i c e d t h a t Liebe e x t i n c t i o n l i n e shape factor , F", goes below zero i f
< I [see Equation (4-1.11);. Several oxygen absorp t ion l i n e s s a t i s f y f 0
t h i s c o n d i t i o n f o r usual atmospheric s t a tes . For thcse t ~ o reasons, the
Gross l i n e shape w i l l be used i n the f o l l ow ing r a t h e r than L iebe 's more
recent k-es u l t .
The l i n e w id th and l i n e s t reng th f o r oxygen can be c a l c u l a t e d us ing
the f o l lowing e n p i r i c a l formulzs ( 5 ) :
0.9 r = Y [Pd + 1.3e] (y)
where v O, S o , and d are constants f o r i n d i v i d u a l absorp t ion 1 ines (see
Table 1 ) .
44
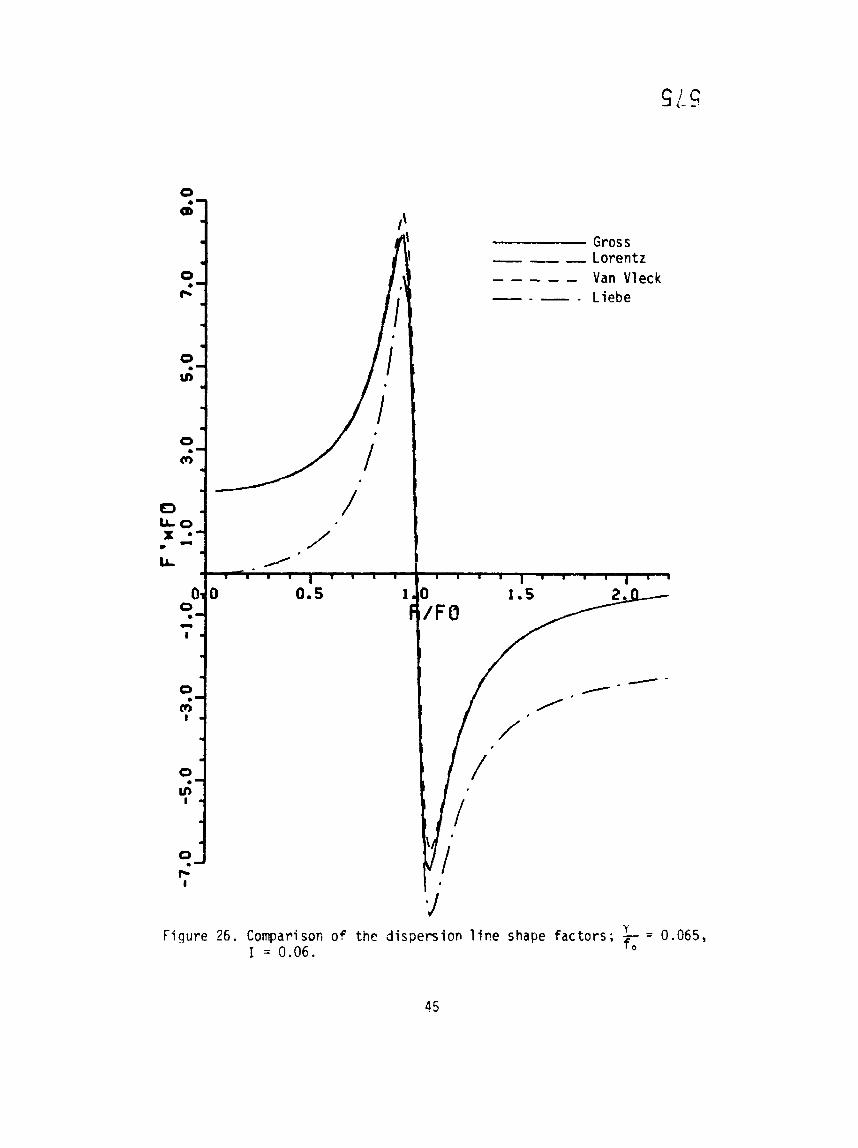
Gross - - - Lorentz - - - - - Van Vleck - - - - Liebe
- 0.065, F igu re 26. Comparison of the d ispers ion 1 i ne shape factors; - - 1 = 0.06. f 0

Gross - - - Lorentz - - - - - .Van Vleck - . - - Liebe
Figure 27. Comparison o f the e x t i n c t i c n l i n e shape f a c t o r s : = 0.365; I = 0.06.

For water vapor the l i n e w id th and l i n e s t r eng th have simi!ar form-
u las:
0.6 y = y, [Pd + 4.Bej (y)
B. S t a t i s t i c s
To examine the v a r i a t i o n o f t he atmospheric microwave r e f r a c t i v i t y
a t t he e a r t h ' s sur facc, the r e f r a c t i v i t y was ca l cu l a ted f o r eack meteor-
o l o g i c a l observat ion us ing the expressions developed i n Sect ion A and
t he p r o b a b i l i t y dens i t y fur ic t ions , d i u r n a l va r i a t i ons , and seasonal v a r i -
a t i ons were p l o t t e d . As was expected, the atmospheric r e f r a c t i v i t y var-
i e s d i u r n a l l y and seasonal ly.
1. The Frequency Independent R e f r a c t i v i t y
An approximate equat ion which y i e l d s valuer f o r No w i t h i n 0.02 per-
cen t o f those obta ined us ing Equation (4-1. ' ) i s ( 7 ) :
where P i s the te2tal pressure, i . e .
P = P d + e inbar!
Since pressure does no t vary s i g n i f 4 c a n t 1 y (F igbres 8 and 9) and tempera-
t u r e va r ies w i t h i n 253-313' [ O k ] (F igures 2 and 3) , the frequency i ~ d e -
pendent r e f r a c t i v i t y i s h i g h l y depel~dent on water vapor pressure. Thus,
the shape of the p robab i l i t v dens i t y f u n c t i o n o f No i s s i m i l a r t o t h a t
o f water vapor p ressme (F igu l es 28 and 29).

PERIOD : 1 / i /49-12/31/58
Figure 28. Probability density function of Y, for* the period 1949- 19'3; dN = 2.45 [ppm!.

PERIOD x I / I /67-i2/31/76
REFRACT I V I T T (?PHI
Figure 29. Probabi l i ty density funct'on o f Yo f3r the period 1967- 1976; ~ $ 1 = 2.45 i p v ] .

Even though the d iurna l va r ia t i on of water vapor pressure i s very
small (Figures 18 and 19). the normal temperature r i s e and pressure de-
crease i n the afternoon causes No t o decrease during t h a t per iod (Fig-
ures 30 and 31 \ .
I n the sumner, the aarerage d iurna l va r ia t i on i s about 13
[ppm]. The average monthly va r ia t i on i s about 40 [ppm] dur ing the
w in ter and 80 [vpn] during the sumner. The mximun and minimum o f
the frequency independent r e f r a c t i v i t y during 1949-1958 and 1967-1976,
are 385 [ppmJ and 275 [ppv], respect ive ly (Figures 32 and 33).
i l g u r e ~ 34 and 35 <how the d i u r ~ a l and seasonal va r ia t i oq pat terns
gf teeperature , pressuw , water vapor content, and frequency independ-
ent r e f r a c t i v i t y i n a composite d isplay for comparison purposes.
2 . Frequency Dependent R e f r a c t i v i t y
A t low frequencies, the r e f r a c t i v i t y i s simply the frequency inde-
pendent value which i s the sumat ion of the low frequency t a l l q o f a l l
of the absorption 1 ines. As the operat ing frequency increases, the e f -
fects of the ind iv idua l absor"tion l i n e s are observed; the r e f r a c t i v i t y
goes through dispersion var ia t ions as the operat ing frequency passes
through the resonance frequencies o f the absorption l i nes . We p l o t the
nean deviat ion o f the refract i v l t v f rom i t s f r e a o e ~ c y independ-
ent value i n Figure 36. The dispersion v.3riations a t 2 2 , 60: 118, 183,
325, and 380 GVz are shown. Of the water vapor absorption l i n e s , the
l i n e s a t 68 and 321 GHz are so weak tha t no s iun i f i can t d ispers ion i s i n -
troddced near those freqdencies. hote tha t the dispersion var ia t ions a t
the water vapor absorption 1 ines a r e very strong a u r i n ~ the humid sea-
sari -

J(IN - - - - - SEP w e - - -
FEB - - - JUN - - - - - - - OCT - - - - - )IRA - - - - - - JUL ---- NOV - - - - - Rf'R - - - - - - - - - - RUG ---- OfC - - - - - - - -
PERIOD : 1 / 1 /U9-12/31/58
Figure 30. Pverage diurnal v a r i a t i m o f N, for the p ~ r i o d 1949- 1958.

JAN flny - - - - - SEP - - - - - FE0 - - - JUN - - - . - . - OCT - - - - - WAR - - - - - - JUL - - - - NOV - - - - - RpR - - . - - - - - - - RUG - - - - OEC - - - - - - - -
PERIOD : 1 1 1 /67-12/31/76
HOUR
F i g u r e 31. A v e r a ~ e d i u r n a i v a r i a t i o n o f Y o f o r the p e r i o d 1967- 1976.

EXT REHE H I + + + n ~ x I nun - RVERFIGE - HlNIHUH - EXTREHE LO X X X
MONTH
Figure 32. Da i l y maxi~crn, average, n i n i n u ~ , 2nd extrerie No 5y months f o r the per iod 1949-1958.

EXTREME HI + + + n~lx I nun - AVERAGE - nINInun - EXTREME LO X X X
PERIOD : 1 / 1 167-12/31/76
=iqure 33. Da i l v m a x i ~ u m , average, r~~inimum, and extreme N, Sv ironths f o r ti-,, pe r i od 1967-1976.


F i ?ure 35. Daily average: of temperature, pressure, water v a p o r pres- ssre and N, by months for the ~ e r i o d 1949-195F.

PERIOD t 1967-1976 J A N : JUL r ---
F f G H Z 3 i Figure 36. Average dev ia t i on o f the r e a l p a r t o f r e f r a c t i v i t y from No.

The imaginary p a r t o f the r e f r a c t i v i t y i s shown as a funct ion o f
frequency i n Figure 37. Since the oxygen molecule's con t r i bu t i on t o the
imaginary p a r t o f r e f r a c t i v i t y does qot depend on water vapor pressure
(see Equation (4-1.14)) , i t s value i n the v i c i n i ty of the oxygen absorp-
t i o n 1 ines (60 and 11 8.75 GHz) i s no t a f fec ted much t ; the change o f the
atmospheric s ta te (see Figure 37). For c l a r i t y o f the lot on ly January
and .July have been shown i n these cases.
Since communications engineers are more i n te res ted i n at tenuat ion
than i n the r e f r a c t i v i t y , the at tenuat ion v a r i a t i o n has a l so been p l o t -
ted i n Figure 38. This may be used t o estimate the v a r i a t i o n o f attenu-
a t i o n f o r the c l e a r sky.
Because of cur ren t i n t e r e s t i n p w p a q a t i ~ n e f f e c t s a t twenty and
t h i r t y GFz, r e f r a c t i v i ty s t a t i s t i c s were derived f o r tqese frequencies
and are presented i n Figures 33 t h r ~ u g h ~ ? 4 . Although the most probable
values of spec i f i c at tenuat ion a t these frequencies are O.C5 and 0.03
dB/kr, respect ive ly , we note t h a t these values can exceed 0.2 and 0.1
dB/km, respect ively, dur ing the h u ~ i d sumner season. The excursion a t
20 GHz i s much l a rge r than a t 3C GHz due t o the s t r o n ~ influence of the
22 GHz water vapor absorption l i n e .

PER1 00 r 1967- 1976 JRN : JUL r - - -
F i gure 37. Average imaginary pa r t o f r e f r a c t i v i ty .

?3 PER1 80 t 1967- 1976 JAN t JUL t - - -
m
Ib-
Figure 39. Average a t tenua t ion .

PERIOD : t / 1 /U9-12/31/58 FREQUENCY : 20.0 GHZ
Figure 39. Probab i l i t y density f u n c t f ~ n o f N" a t 20 GHz; a"= 1.6 x 10⁻³ [ppm].

JAN - - - - - SEP - - - - - FEB - - - JUN - - - - - a - OCf - - - - - HnR - - - - - - JUL ----- N6V - - - - - C)PR . - - - - - - - - - RUG ---- DEC - - - - - - - a
HOUR
PERIOD : 1 / l /49-l2/3i/50 FREQUENCY : 20.0 C t i L
- 1- /-I -. 1-- /--
/-\ - --- - - - - - / - - --# - - - / -
- - 0 - - * - - - - - * - - /---
--\ --------1- ---/
m 0
F igu re 40. Average d 'srnal v a r i a t i c n o f N': a t PC Gt!z.
/- ------/--- 22- - - - - -
_ _ - - - - _ - - - - - - _ _ - - - - _ - - - - - - - - - - - _ - - 0
- - - - - - - - - - - - - . . - - - - _ - _ _ _ _ _ / - - - - - - - - _ - --
/ -7 - 0
u 0
c;
0 0
. O . + + a
tn - 0
' 0 0
d " m ' m ' m l m m ' m m m ' ~ ' m m ~ ~ ~ - 0 5 10 15 30
0

Figgre 41. Da i ly maximum, average, minimum, a ~ d ext-me Nw a t 20 SHz by months.

PERIOD : 1 /I 149-12/31/58 FREQUENCY : 30.0 GHZ
Ffqure 42. Probabf l i t y density functfon of N" a t 31) GHz; AN" =
5 loe4 [PPJ.

JAN )IAy - - - - - SEP - - - FEB - - - JUM - - - - - - - acr - - - WfiR - - - - - - JUL - - - - NOV - - - flPR . . - - - . - - - a RUG - - - - OEC - - - -
Ilr al 0 PER100 : 1 I 1 IY9-1213
Fiuure 43. Average d iu rna l v a r f a t i o n o f N" a t 30 GHz.
dt- #
. #
FRtOUENCY : 30.0 GHL
- 4- - --/--.
% - 7-
/ -- I-- 0 - =----.-. - - - - - -. \ 4.- - - -
n x a*--- e O- u d C Z
-> y.4-- - - - - - - - - / - - - Cs - . - - - / - - -
/-- - - - --------/- - - - - - - - - C-
. - - _ _ l _ _ _ _ _ - - - - - - - - - _ - * - - - - .
- - - - - _ _ _ _ _ - _ - - - - . ----c-----
C .
. 0 0
d ' m m l ' l l m q m m ' . l m l l ' l . . r 0 S 10 1s 20

EXTREME HI + + + MX I nulr - ClVERQGE - ~INIKLW - EXTREME LO X X X
PERIOD : 1 1 1 /V9-12/31/56 FREOUENCY r 30.0 GHZ
+ . . 0 w .
.
. r
0 0 0 0
c; I 1 I I I I I I I I I I .
j 2 3 4 5 6 7 8 9 1 0 1 1 1 2 0
Figure 44. Da i l y maxi nu^, average, minimum, and extreme N " a t 30 GHz by months.

CHAPTER V
ATMOSPHERIC REFRACTION
I n a standard atmosphere, pressure and water vapor decrease rap id ly
wi th height, whi le temperature decreases slowly w i th height fmm the
ground leve l t o the troposphere. It i s evident i n such an atmosphere
that the re f rac t i ve index of the atms$here decreases approximately i n
an exponential fashion w i th height; and, as a resu l t , waves t r ave l l i ng
i n the atmosphere are bent downward under normal atmospheric conditions.
The effects o f t h i s atmospheric re f rac t ion o f rad io wa\!es are usual ly
expressed i n terms o f the angle through which a radio ray turns as i t
passes through the atmosphere. To the radar engineer, i t i s important
t o e s t i m t e the elevation avgle e r ro r which i s a measure of the d i f f e r -
ence between the apparent e levat ion angle as indicated ty radar and the
t rue elevation angle. Usually the ca lcu la t ion o f the efCects of the a t -
mospheric re f rac t ion depends on the re f rac t i ve index p ro f f l e model used
and the numerical f ntegration technf qws.
I n t h i s chapter, we w i l l develop analy t ic exprejsions f o r the bend-
ing angle, elevation angle error , and range e r ro r i n an exponentially
tapered spherical atmosphere.
A. Refractive Index P r o f i l e
I n atmospheric refract ion studies, i t i s necessary t o have a knw-
ledge of the behdvior o f the re f rac t ive index as a function of posi t ion.
67

It i s comnon t o a s s w tha t the refract ive index o f the atmosphere i s
spher ical ly s tyat i f fed w i t h respect t o the surface of the earth. Neg-
l e c t i ng the e f f ec t o f horizontal var iat ions seems qu i te reason3bie i n
the tropospheric region because o f the r e l a t i v e l y slow horizontal change
o f re f rac t i ve i ndex i n contrast t o the r a ~ i d decrease w i th height under
normal conditions . -3
An examination o f long term c l i n a t i c data o f Ns and o f by. where
AN I s the decrease i n r e f r a c t i v i t y over the f i r s t ki?ometer i n the a t -
mosphere and NS i s the re f r ac t i v i t y a t the surface o f the earth, reveals
that a high cor re la t ion ex is ts between these two parameters. The empir-
i c a l l y derived re la t ionsh ip ( 7 j is ,
AN = 7.32 exp 10.005577 Ns] (5-1 .I )
This re la t ionsh ip between AN and Ns suggests tha t a model of the atmos-
pheric r e f r a c t i v i t y st ructure i n the f i r s t kilometer above the earth 's
surface my be obtained f r o m hS alone. A consideration of the standard
atmosphere (Figure 1 ) and Equation (4-1 - 7 ) indicates tha t the re f r ac t i v -
i t y generally decreases exponentially w i th height.
The exponential model specif ied by assdmins a s ingle exponential
d i s t r i bu t i on of K i s
N = Ns exp {-c ( r - r s ) l (5-1 -2)
where Ns = r e f r a c t i v i t y a t radius rs
Even though t h i s exponential model does not g i vea good representation o f

r e f r ac t i v i t y above 5km, i t i s widely used i n theoret ical studies be-
cause of the advantage of befng an e n t i r e function. furthermore, since
mast o f the re f rac t ion effects occur i n the lower port ion of the tropo-
sphere where the r e f r a c t i v i t y i s I d r ~ e s t , the accurJc.v of the model f o r
la rger heights i s of less importance.
AN AN - If we asslane - << 1 ( t yp ica l l y - - 39 = 0.!3), then C = - l n Ns Ns
f - ? ) ? . Hence, our s impl i f ied exwnent ia l model w i l l be
described as :
bi = NS exp [- ir-rs]
This exponential model and Equatior. (5-1 . l ) w i l l be used i n the follow-
ing section t o develop the bending angle.
B. Bendi nq Angle
If i: i s assumed tha t the re f rac t ive index i s a function only o f a
height, then the path cf a radio ray (Figure 45) w i l l obey Snell 's law
for polar coordinates :
n r cos ol = nr cos o = n r cos c2 1 1 2 2 (52 .1 )
The c lassical expression for the angular change, T, o r the bending o f a
ray t r ave l l i ng f r ca a po in t where the re f rac t ive fndex i s n, t o a second
point whew the refract ive index i s n2 i s given by (7)
dn '1,2 cot e ,
where e i s the loca l elevation angle. Tne d i f f e ren t i a l equation f o r T
w i l l be:

Figure 45. Geometry of the refract ion o f radic waves.

d T = - co t CI - dn n
Since n ranses f r o m about 1.0000 a t very high a1 t i t ude t o about 1.0003
a t the surface of the earth, Equation (2-2.1) can be approximated as
fl COS 81 = r cos 8
c r r 1 cos e = - cos el
r
Now, by using t r igonomtry,
rl COS el cot e =
Subst i tut ing Equation (5-2.5) i n t o Equation (5-2.3) yields,
r cos o d~ = - 1 . - 1 . d n d r
,,I- n d r
I and, since - 2 1, n -
cos "1
T = -rl cos Rl 1 (5-2.7)
dn If - the rate o f change o f the index of re f rac t ion w i th radius, dr '
i s known, the bending angle, r , may be calculated. I n Sect!cn A, we de-
veloped an exponential model f ~ r re f rac t i ve index structure:

AN N = N, exp 1- (r -rs 1 I 5
So, the der iva t ive of r e f r a c t i v e index i s
where
AN = 7.32 exp 10.005577 NS]
Ns = refractivity a t the surface o f ear th
rs = radius of the ear th
Combining Equation (5-2.9) w i t h Equation (5-2.8) gives
-6 AN T = r l AN ' 10 cos el exp [ K rs]
AN exp [ - - r 1 * C r
Le t us now change variables, h = r - rl, so t h a t h repre5ents tke height
above the s t a r t i n g point, rl . And l e t H = r2 - r , be the t o t a l increase
i n height when moving from po in t 1 t o po in t 2. The Equation (5-2.10)
w i l l be
AN (H
exp (- - h) N s
I dh
' 0 2 2 2 ( h , - r1 cos C,

Now we note that, even f o r e large H, the integrand i s forced t o zero by
the exponential i n the numerator. It i s apparent t ha t almost a l l o f the
re f rac t ion occurs w i t h i n the lcwest twenty km of the atmosphere. With AN
h = 19km, the numerator, exl? (--A), drops t o 0.1. So the second order N s
term i n the denominator o f the i ntegrand may be ignored:
A N r = AN . 1 0 ' ~ cos el exp [- - (rl - rs) 1 Ns
h 2 2 Intrcducing another change o f variables, 2- + s i n ol = x , gives:
'1
A N A N '1 2 r = rl A N cos el exp [- - (r l - rs 11 exp I $ T s i n Ns
2 t s i n e l
A N r~ 2 . exp [- T x I d(
A N rl And, w i th yet another change o f variables, X 2 = t2 , Equation
(5-2.13) reduces to:
A N r - 6 r.. N 1 2
T = 10 cos exp [- - Ns (rl-rs)] exp tR; s i n
exp ( - t 2 ) d t

2 Since the e r r o r func t ion i s def ined as a ( ) = erP (-I ) dx ,
we have
AN r1 = cos o1 exp [- ('1 -rs 11 exp [- Ns . Ns
2 { @ ( d W i ) - a ( q ~ s i n o $ J (5-2015) s i n
This i s the general expression f o r the bending angle i n a s ing le expo-
nen t i a l model def ined by Equation (5-1.3).
We can ca lcu la te the bending angle f o r var ious s i t ua t i ons by us ing
the fo l low ing r a t i o n a l approximation o f the e r r o r func t ion (6) :
where
/ E ( ~ ) ! - < 3 lo-'
al = 0.0705230784
a3 = 0.0092705272
a5 = C.0002765672
But for a la rge i n i t i a l e leva t ion angle, o l , the e r r o r fgnctions con- n " since1 becomes a very l a rge value. So i n t h i s verge t o 1 and - NS T
case, we ~ u s t use the asymptotic r e l a t i o n f o r the e r r o r func t ion (8) :
The c r i t e r i a f o r t h i s w i l l be:
s i n 01 >> 1

This condi t i o n corresponds t o o l >> 2.89' f o r -.leal values of AN, NS,
and r, . Then, the bending angle f o r h igh in i t * . : ' e leva t ion angle i s g i v- A
en by:
-6 AN T = NS 10 cos 81 exp [- - ( r l - r S ) ]
Ns -
AN exp [- - H] Ns , 01 >> 3O (5-2.18) ,,/-
Figures 46 and 4' show the bending angle versus r e f r a c t i v i t y f o r 70km
and 35,785km heights. The nominal height of a geosynchronous sate1 1 i t e
above the earth of radius rS = 6,378 km i s 35,785 km (9) . Since most
o f the r e f r a c t i o n occurs i n the region below twen i j km, there i s no no-
t i ceab le d i f fe rence between the? - two f igures.
C. E levat ion Angle Z r ro r
For earth-sate1 1 i t e commun~cation 1 inks, where narrow beam id th an-
tennas are often used, the e levat ion angle e r ro r , E , cannot be ignored.
To f i n d t h i s e r ro r , consider the geometry shown i n Fiqure 48. Sumning
a1 1 the angles about thc quadr i l a te ra l def ined by t\ : r a d i i and r:
and two l oca l tangents a t points a and @gib2s the re la t i onsh jp :
$ = T + 0 2 - 0 1
From the geJmetry shjwn i n Figure 48,
tan 13 = r ' cos e - r 2
r 2 sfn 4
Since E = 61 - B I subs t i t u t i ng Equation (5-3.1) i n Equation ( 5 - 3 . 2 j

Fi gut- 46. 4ending ansle vers#ts re4r&ctivi ty for various initial e1evat:o~ angles r H = 70 k ~ .

Figure 47. Gendfna angle versus r e f r a c t i v i + y for various i n l t i a l e levat ioq anales; H 35,755 kn.
7 7

Figure 48. &evetry for elevation angle error.

y ie lds :
tan E = tanel - tan6
l+'onel tan0
From Equation (5-2.1).
Div id ina &corninator and nmerator of the r i g h t hand side o f Equation
(5-3.3) by r,cosel gives:
- c ~ s r + s i n r t aw3 + - "2
tan E = "1
n,
Here, the bendin? angle, T, can be obtained from the exprcss io~s i n Sx-
t i o n A, and the anqle between the local ray tangent and the loca l hor i - -
rontal a t po in t @, zz, can be obtained using Equation (5-3.4) i f ue
know rl, r2, and ? . I n Figures 49 and 50, wo p l o t the eievation angle e r r c r f o r 70 and
35,785 [kmj, respectively. Comparison o f these f igures shows tha t the
elevat ion angle e r ro r increases w i th the hefghc of the end o f the ray
path.


Figure 50. Elevation angle error versus r e f r a c t i v i t y for varjous i n i t i a l e levat ion angles: H = 35,785km.

D. RangeError
W n a rzd lo signal t rave ls from po in t @ t o po in t @ (see Figure
48), the time delay i s longer than would be expected if the signal trav-
eled through a free space for tt o reasons. F i rs t , the path i s longer
due t o the ray bending. And, second, the ve loc i t y o f propagation i s low-
e r i n a refract ive medium. The true s lant distance, RtrUe, may be ob-
tained from the geometry o f Figure 48.
-1 '-1 Since 4 = T - el + cos ( - COSQ~) , we can calculate Rt rue if we know
f2
rl, r2, and a;. The bending angle, T, may be obtained from Equation
(5-2.15) o r (5-2.18). The apparent distance i s given by: r
R a = CT =J nds 1
where T l a the t i m e delay for the signal t r ave l l i ng from po in t @ t o
1 @and c i s the ve loc i ty of l i g h t i n f ree space. Since ds = - d r stne
and n = 1 + N x the above equation w i l l be:
Thus, the t o ta l apparent range error, cR = R a - Rtrue, i s given by:
The f i r s t term represents the length o f the curved r a j path. Since the
difference i n length between the s t ra igh t path and the curved ray path
does not represent a s i gn i f i can t port ion of th5 tot.al range e r ro r except

a t very small i n i t i a l e leva t i on angles, below abcut 3" (7) , the range
e r r o r fo r e leva t ian angles greater than about 3O m y be ~ i v e n by
2R 2 10- 6 f 2 N dr / sino
Substi t u t i n a Equation (5-1.3) i n t 9 Equation (5-4.5), and changing v a r i -
ables, r ; rl+h and r2 = r:+H, y ie lds :
AN AR = NN. 3 x ld6 exp 1- t; (rl-rsl~
Ncte t h a t the intearand i s s ian i f i can t on ly when h i s very srn21l. Neg-
h I e c t i n o the higher order terms i n - , and fron Esuat i o ? (5-2.12), the r !
range e r r o r can be re la ted t o the bending anj le , T, by
x T 52 = -- -
AN cose; (5-4.7)
The range er rors versus the surface r e f r a c t i v i t y are p l o t t e d i n Figures
51 artd 52 f 3 r Y = 70 kro, H = 35,785 km, resoecf i \~e?y . Tcsse may be used
f o r the f i r s t ordzr appsoxinat ion of the ranQe or ror . It should be em-
ohasized t y a t the diffetqence between the r t r a i q h t and :he curved path
contr ibutes near ly t h i r t y percent of the t o t a l range e r r o r a t zero e le -
va t ion angle ( 7 ) .

F i sure E l . R ~ n g e error i,erjus r e f r a c t i v i t y f?r v a r i ~ u s i n i t i a l e'ie- v a t i ~ . ~ angles; Y= 70km.
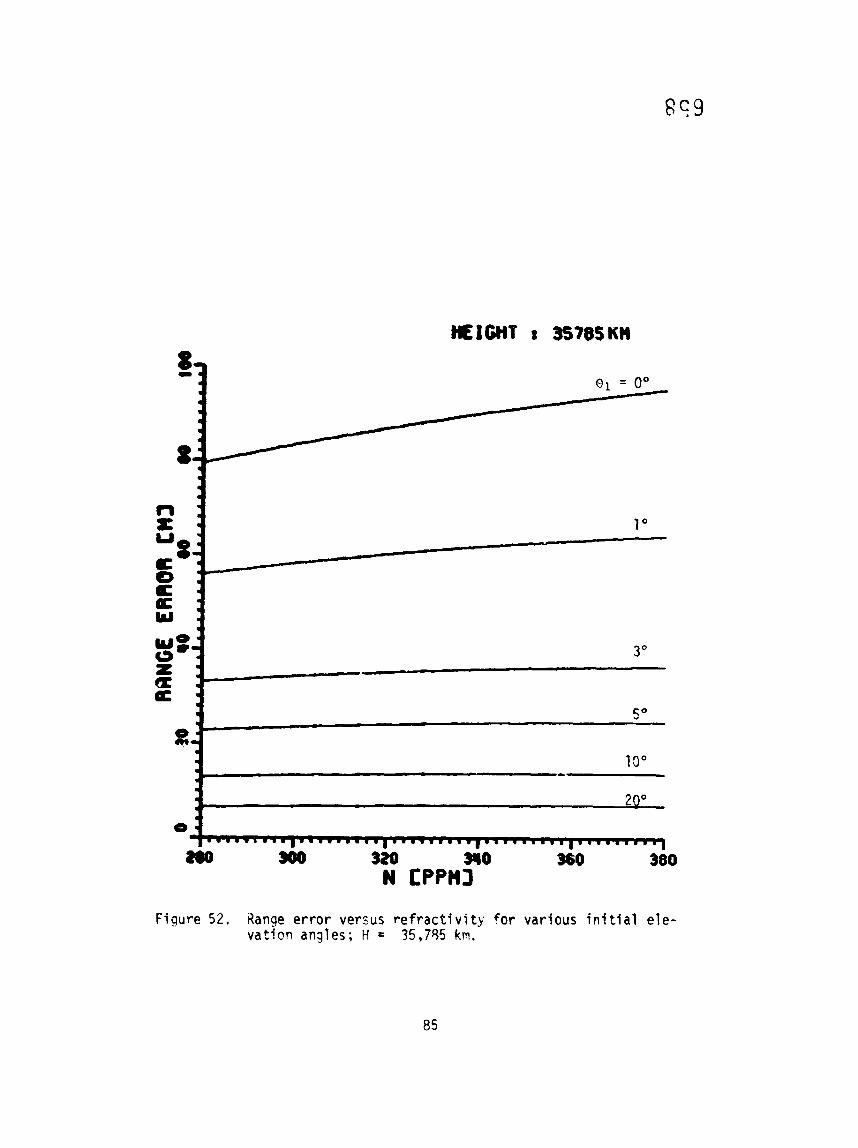
F i g u r e 5 2 , Range e r r o r versus r e f r a c t i v i t y f o r v a r i o u s i n ! t i a l e l e - v a t i o n angles; H = 35,755 km.

CHAPicR V I
SUMMARY
The atmosphere i s a most chanqeable propagation media; and i t s
e!ectrScal charac ter is t i c , microwave r e f r a c t i v i t y , i s dwendent on temp-
erature, pressure, and water vapor content. The s t a t i s t i c s of these
meteoroloaica~ quan t i t i es rt Columbus, Ohio, were generated using two
ten-yeat* per iod weather data bases from the aat ional Weather Service.
The microwave r e f r a c t i v i :y was calculated using these meteorologi-
c a l data bases and i t s var ia t ions were p l o t t e d and analyzed. I n the
ca l cu la t i on of the microwave r e f r a c t i v i t y f o r th2 EHF range, the GLoss
I i ne shape was used. The frequency independent r e f r a c t i v i t y var ies from
about 280 t o 33C [ppm] and the average seas~na l v a r i a t i o n i s about 35
[ppm]. The average seasonal v a r i a t i o n of at tenuat ion due t o the atmos-
pheric gases i s about 0.13 dE/km a t 20 GH7, and 0.05 dB/krn a t 30 GHz.
The maxi~um vs r ia t i ons cf these are C.2 and 0.1 db/km, respect ive ly .
3ased on a s ing le exponential mode1 f o r the atmospheric r e f r a c t i v -
i t y s t ructure, bending anale, ele.rat ion anqle e r ro r , and range e r r o r
were developed and p lo t ted . Post o f r e f r a c t i o n occurs i n the lower re -
q ion o f troposphere because the r e f r a c t i v i t y decays exponential l y w i t h
height. For small e leva t ion angles, below about 5O, the r e f r a c t i o n e f -
fec ts are very sens i t i ve t o the r e f r a c t i v i t y a t the ea r th1$ surface.

REFERENCES
J.H. Van Vleck, "The Absorption of Microwave by Oxygen ," Phys. Rev., Vol. 71, pp. 413-424, A p r i l 1947.
T.L. 01 iver , "Atmospheric Attenuat ion and Sky Noise Temperature i n the Microwave and mn Wave Spectrum," Report 2440-2, May 1968, The Ohio State bn i ve rs i t y ElectroScience Laboratory, Department o f E l e c t r i c a l En5ineering; prepared under Contract F33615-6?-C- 1663 f o r A i r Force Avtonics Laboratory.
W. I. Thomson, I I I, "Atmospheric Transmission Handbook," Nat. Aeron. and 3pace Adm., p. 27, Washington, D.C., 1971.
4. M i l l e r and J.C. Tho~son, "Elements o f FQteoroloay," C.E. M e r r i l l Publ'shing Company, pp. 30, Columbus, Ohio, 1971).
H.J. Liebe and G.G. Gimmestad, " C a l c u l a t i m of Clear A i r EHF Re- f rac t i v i t y , " Rad. Science, Vol. 13, p ~ . 245-251, A p r i l 1978.
A. I. Omoura and D.R. Hodge, Microwave Cispersion and Absorption due t o Atmospheric Gases," Technical Note No. 10, August 1979, The Ohio State Uni versf t y ElectroScience Laboratory, Department of E l e c t r i c a l Engineering, pp. 16- 17. 24-25.
B.R. Bean and E.J. D ~ t t o n , "Radio Meteorology ," Dover Publ icat ion, Chapter 1 , New York, 1968.
M. Pbramowi t z and I .A. Stegun, "Handbook of %thematical Functions: Dover Pub1 i ca t i ons , pp. 297-299, 1970.
H.T. b u g i l e r t y , " A Consolidated Model f o r UHF/C fF Telecommunication Links 3etween Earth and Synchronous Sate: 1 i tes ," U.S. Department of C o m r c e , pp. 66, August 1980.
National Cl imat ic Center, "Local C l imatologica: Data, Columbus, Ohio," U.S. Department o f Commerce, 1973.

APPENDIX A
CODING AND FORMAT OF METEOROLOGICAL DATA
Character Set
1 2 3 4 5 6 7 8 9 0 A (blank) - *
OCTAL - 0 1 0 2 03 0 4 05 06 07 10 11 12 20 4 0 5 4 60 61 62 63 64 65 66 6? 70 71 41 42 4 3 44 4 5 46 4 7 50 5 1 i 2 52 32

* CO through C9 I n hexadecimal represent p o s i t i v e dec i ra l numbers. ** DO through D9 i n hexadecimal r e p x s z n t negative decfmal numbers.
Record Format
TAPE FIELD NUMBER
TAPE POSITIONS ELEMENT
Tape deck number Sta t ion number Year Month Day
Hour Ce i l i ng he igh t and i n d i c z t o r Hori t on ta l v i s i b i 1 i t y and i n d i c a t o r Wind d i r e c t i o n - 16 points Wind speed Dry bulb ( a i r ) temperature Wet bulb temperature Dew p o i n t temperature Relat ive humidity an2 i nd i ca to r Sea l e v e l pressure Sta t ion pressure Skv condi ti on and i nd i ca to r Topal sky cover Total opaque sky cover Amount o f lowest cloud l aye r Type o f lowest cloud qr obscuring pheno-
w n a Height o f base of lowest cloud l a y e r o r
obsc l~r ing phenomenz Amourst o f second clotid l aye r Type o f cloud - second layer Height o f base o f second c load l aye r Summation amount of f i r s t twu cloud lay-
ers Amount o f t h i , d cloud l aye r Type o f c loud - t h i r d l aye r Height a f base of t h i r d c loud l aye r Summation amount o f f i r s t three cloud
1 ayers Amount o f f ou r th c loud l aye r Type o f c loud - four th l aye r Heiaht ol' base o f f ou r th cloud l s y e r Occurrence o f thunder: orm, tornado, o r
squal l Occurrence o f ra in , r a i n showers, o r
f reezing r a i n

TAPE FIELD WUBEP.
TAPE POSITIOWS
Uccurrence of ra in squalls, drizzle, o r freezi3g dr izz le
Occurrence of snaw, snaw pel lets, o r i ce crystals
Occurrence o f smm shawers, snaw s q w l l s o r snow grains
Occurrence of sleet, s leet shawers o r ha i l
Occurrence of fog, blowing dust, o r blar ing sand
Occurrence of smoke, haze, smke and haze, dust , b l cwi ng snow, b l awi ng spray
Uind direct ion - 36 points Blank Record mark
Second observation These obsewa ti ons Third observation follosr the same Fourth observ~t ion format as f ie lds Fifth observatim 1 101-139 (Tape Posi- S i xth observation ) t ions 016-095) .

T-
C
bL
L
Q
wo
o
>
L
00
3
C*
ld
- C
I P
FC
m
8 + g
r L
I
IC
Q)
*T
-
e b5
b
3
-1
C
, u
*n
u