AIRTIGHTNESS OF A BUILDING ENVELOPE
55
Marina Paramonova AIRTIGHTNESS OF A BUILDING ENVELOPE Bachelor’s thesis Degree Programme in Building Services Engineering 2019
Transcript of AIRTIGHTNESS OF A BUILDING ENVELOPE

Marina Paramonova
AIRTIGHTNESS OF A BUILDING ENVELOPE
Bachelor’s thesis Degree Programme in Building Services Engineering
2019

Author (authors) Degree Time
Marina Paramonova Bachelor of Building Service Engineering
December 2019
Title
Airtightness of a building envelope Supervisor
Anna Forsström Abstract
The main investigation object of this paper if the airtightness of a building envelope and its influence of energy efficiency, indoor air quality and thermal conditions inside the building.
First of all, the legislation regulations for the airtightness of buildings and the measuring methods were discovered. Secondly, the airtightness measurement took place at the end of the construction process in the daycare center in a city in Finland. When the building was commissioned, the indoor climate parameters were monitored to discover the influence of the airtightness of the building envelope and air leakages on indoor air quality and thermal comfort of occupants.
Finally, the results were analyzed. It was found out that the building envelope has high airtightness. It was discovered that there is no significant influence on thermal conditions inside the building. The temperature and relative humidity did not fluctuate much. However, it was discovered that the low air leakage rate leads to a reduction of fresh air income inside the building, which leads to the increase of indoor air pollutants and the decrease in indoor air quality. That means that the ventilation system should be adjusted if the predicted number of occupants increases.
The study showed that the improvement of airtightness leads to a reduction of the energy demand of the building. However, the reduction of fresh air income should be taken into account when the ventilation system is designed.
Keywords
airtightness of a building envelope, energy efficiency, indoor climate, air leakage rate
45 pages 10 pages of appendices
CONTENTS
1 INTRODUCTION ............................................................................................ 5
2 ENERGY PERFORMANCE OF BUILDINGS ................................................. 6
2.1 E-value ..................................................................................................... 7
2.2 Airtightness of a building envelope ........................................................... 8
2.2.1 Determination of airtightness of building envelope ............................. 9
2.3 Measurement of airtightness of a building envelope ............................... 12
2.3.1 Blower door test ................................................................................ 12
2.3.2 Detection of leakages by using thermal imaging camera .................. 17
2.4 Influence of airtightness of a building envelope ...................................... 20
2.4.1 Influence on energy efficiency .......................................................... 20
2.4.2 Influence on indoor climate ............................................................... 21
3 METHOD ...................................................................................................... 22
3.1 Description of the building ...................................................................... 22
3.2 Description of the sample room (room 391) ............................................ 24
3.3 Description of the measurements and measuring equipment ................. 25
3.3.1 Measuring airtightness ...................................................................... 25
3.3.2 Monitoring indoor air quality and thermal conditions ......................... 27
3.3.3 Measuring locations, times, and intervals ......................................... 28
4 RESULTS AND ANALYSIS OF RESULTS ................................................... 31
4.1 Airtightness of the building envelope ...................................................... 31
4.1.1 Results of the blower door test ......................................................... 32
4.1.2 Detection of air leakages by the thermal imaging camera ................ 34
4.2 Indoor climate ......................................................................................... 36
4.2.1 Temperature and relative humidity ................................................... 37
4.2.2 CO2 concentration ............................................................................. 38

5 DISCUSSION ............................................................................................... 40
REFERENCES .................................................................................................... 42
LIST OF FIGURES .............................................................................................. 44
LIST OF TABLES ................................................................................................ 45
APPENDICES
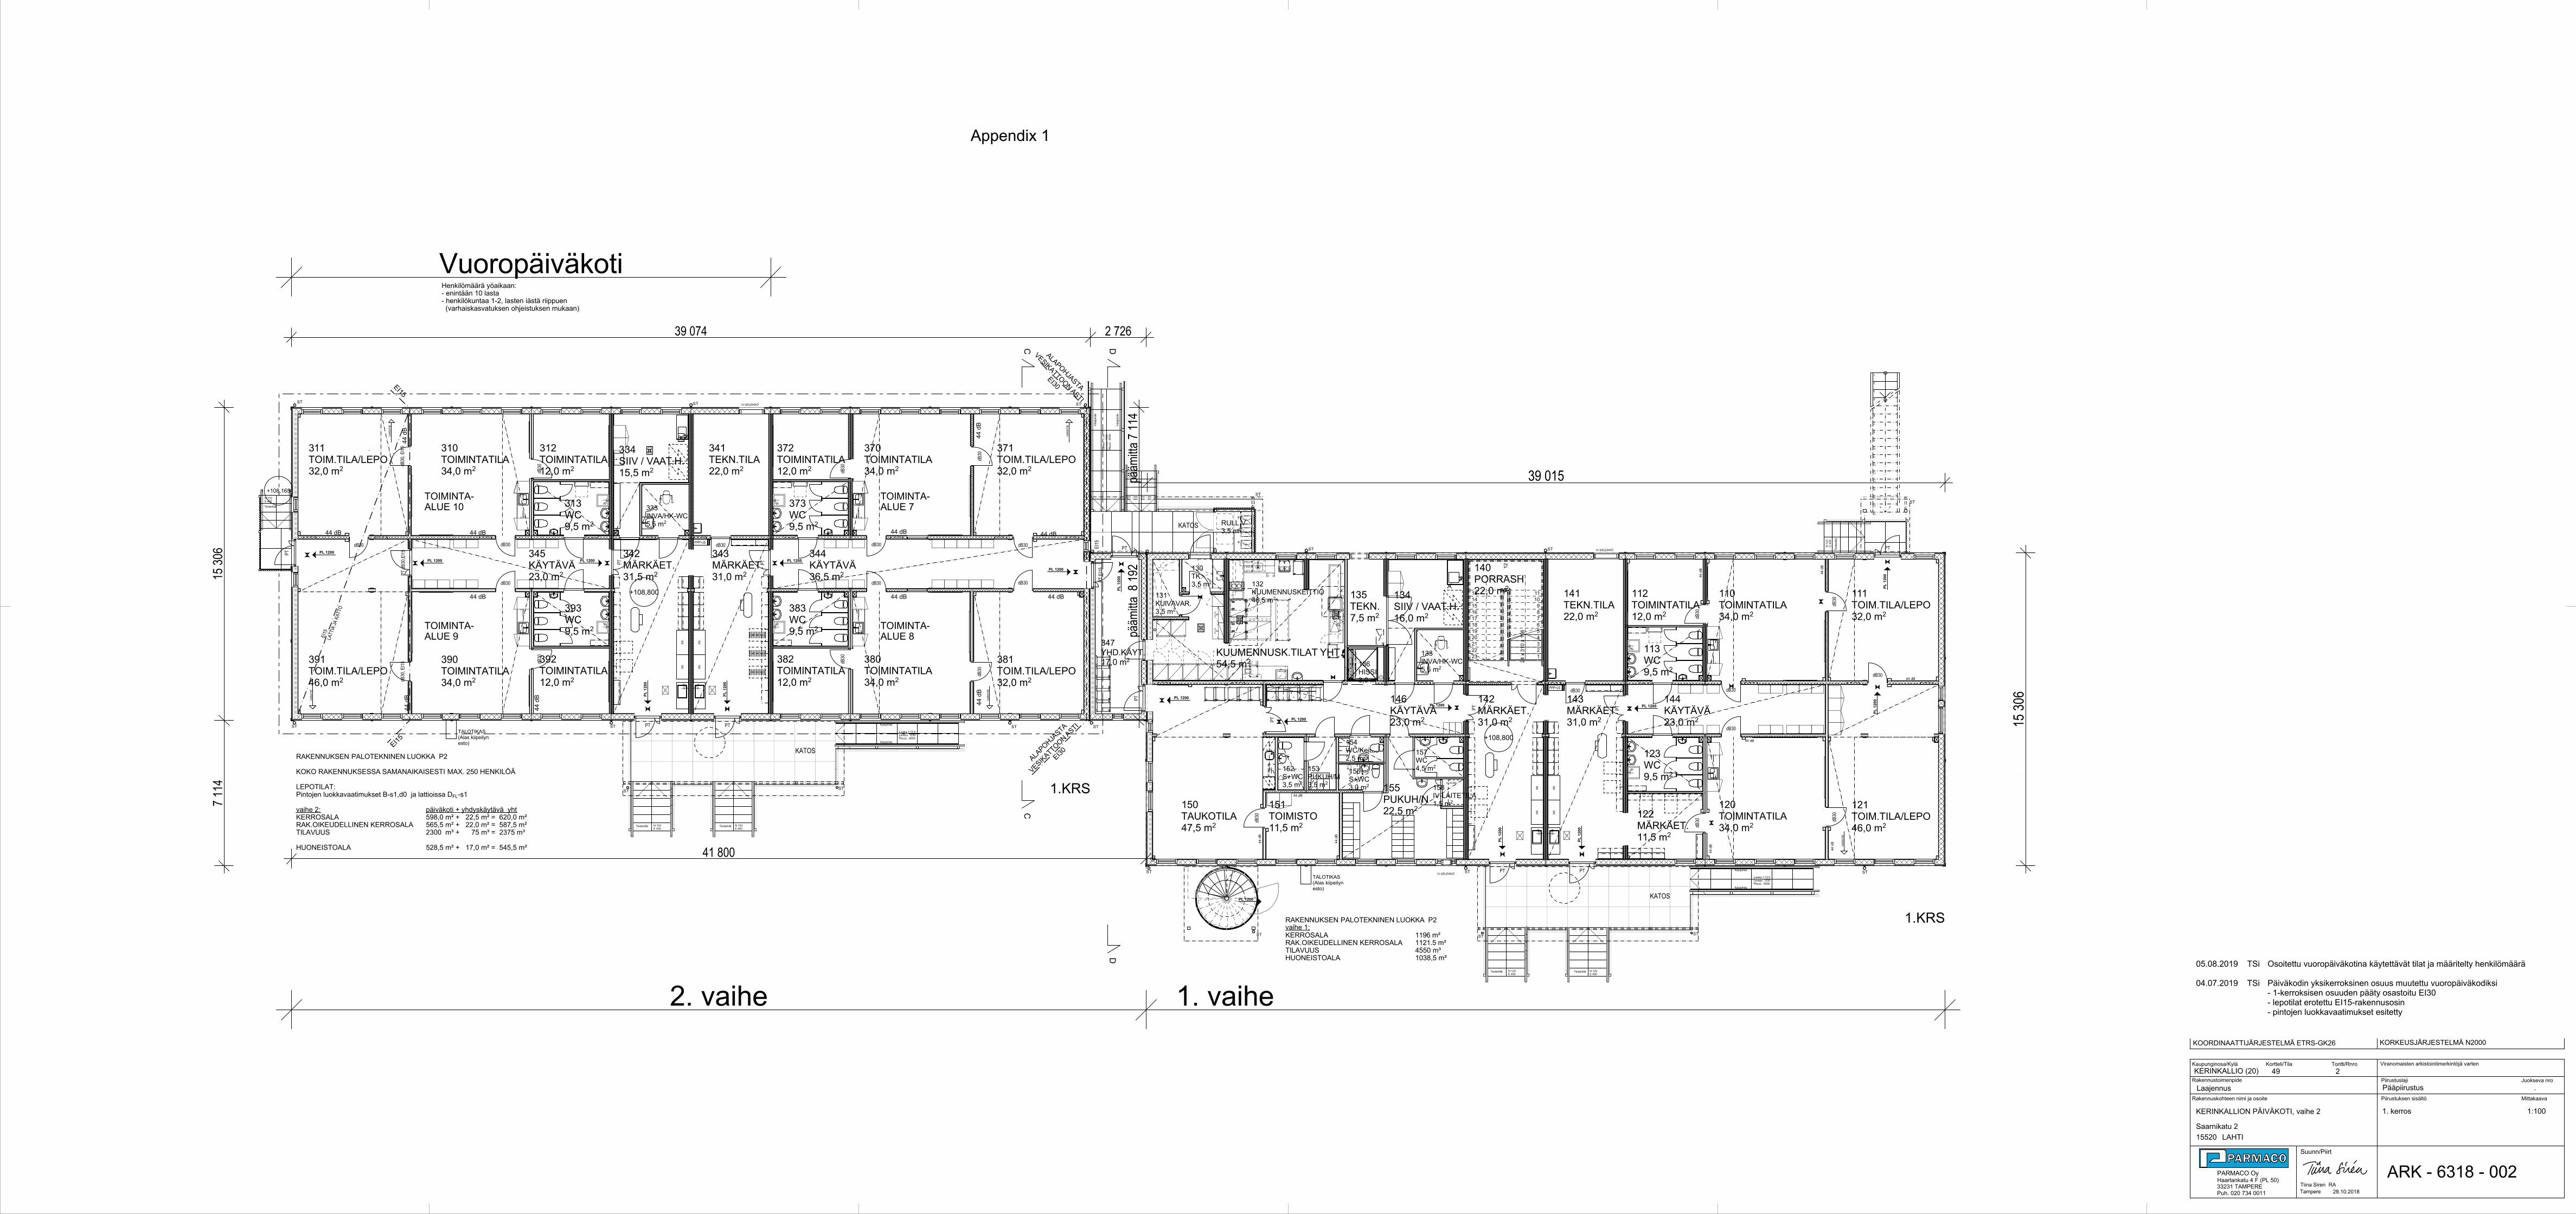
Appendix 1. Floor plan of the building
Appendix 2. Sections C-C, D-D and structures of the building
Appendix 3. The results of the blower door test
Appendix 4. Thermal imaging inspection
5
1 INTRODUCTION
Energy efficiency is one of the most important issues in the 21st century. Since
1970 the awareness that energy sources are not unlimited grew up /1, p. 5/. The
understanding of this fact makes people all over the world think about the reduction
of energy consumption and search for alternative sources of energy. In spite of this
fact, the world’s energy consumption grew by 2,9% in 2018. Scientists consider
this growth as the highest one since 2010. The growth of energy consumption
entails higher emissions of greenhouse gases. /2, p. 2./ Construction industry and
buildings take approximately 40% of the energy produced in European Union
countries and give off about 36% of total direct and indirect CO2 emissions. Almost
75% of all buildings in Europe are not energy efficient. Renovation of old buildings
and making new buildings energy efficient may significantly decrease energy
production for their erection, maintenance and improve global air quality. Moreover,
energy becomes more and more expensive. The reduction of energy consumption
of buildings will shorten their costs and make them more economically and socially
beneficial. /3./ According to existing legislation, all new and existing buildings must
meet energy efficiency requirements and should save as much energy as it is
possible.
One way of saving energy for heating and ventilation of a building is to make its
envelope more airtight. The airtightness of a building envelope shows how much
air infiltrates through the building envelope uncontrollably. Poor airtightness of the
building envelope may increase the amount of energy needed for heating of the
building. It also may cause thermal discomfort of residents and even moisture
damages in the building. The main object of this bachelor’s thesis is the airtightness
of a building envelope.
In this paper, the airtightness of a building envelope will be investigated. It will be
described how the airtightness of a building envelope is measured and estimated
according to the legislation requirements, how air leakages influence the energy
demand of the building and how heat loss for the leakage air may be determined.
It will also be found out if airtightness of a building envelope has a significant
6
influence on indoor air quality and thermal comfort. The measurement processes
and methods, as well as equipment, will be described in detail.
The main aim of this bachelor’s thesis is to estimate the amount of heat loss for the
air leakage for the investigated building, where airtightness of the building envelope
is measured. The second aim of this paper is to find out if the relatively high
airtightness of the building envelope improves or deteriorates indoor air quality and
thermal comfort of occupants.
The remainder of this paper is structured as follows: the first part is related to the
literature review and theoretical background. After that, the investigated building,
the equipment, and devices are described as well as the locations, times, intervals
and the process of the measurements. At the end of this paper, the results of
measurements and monitoring are presented. They are compared to the
requirements in the existing legislation. Finally, the recommendations on how to
improve indoor air quality are given.
2 ENERGY PERFORMANCE OF BUILDINGS
Energy performance of a building may be defined as the quantity of energy
necessary for building maintenance according to its standardized use including
building services such as heating, cooling, electricity, and domestic hot water
consumption. If a building consumes less energy, it has higher energy
performance. Standardized use of a building is determined according to the
category of a building and its daily and weekly occupancy. /4, p. 1-2./
The highest amount of energy that buildings consume goes to engineering systems
that provide the required indoor climate. They are heating, cooling, ventilation, and
air conditioning. The main purpose of modern buildings is not only to be a shelter
but also to ensure a safe and satisfactory indoor climate. The internal environment
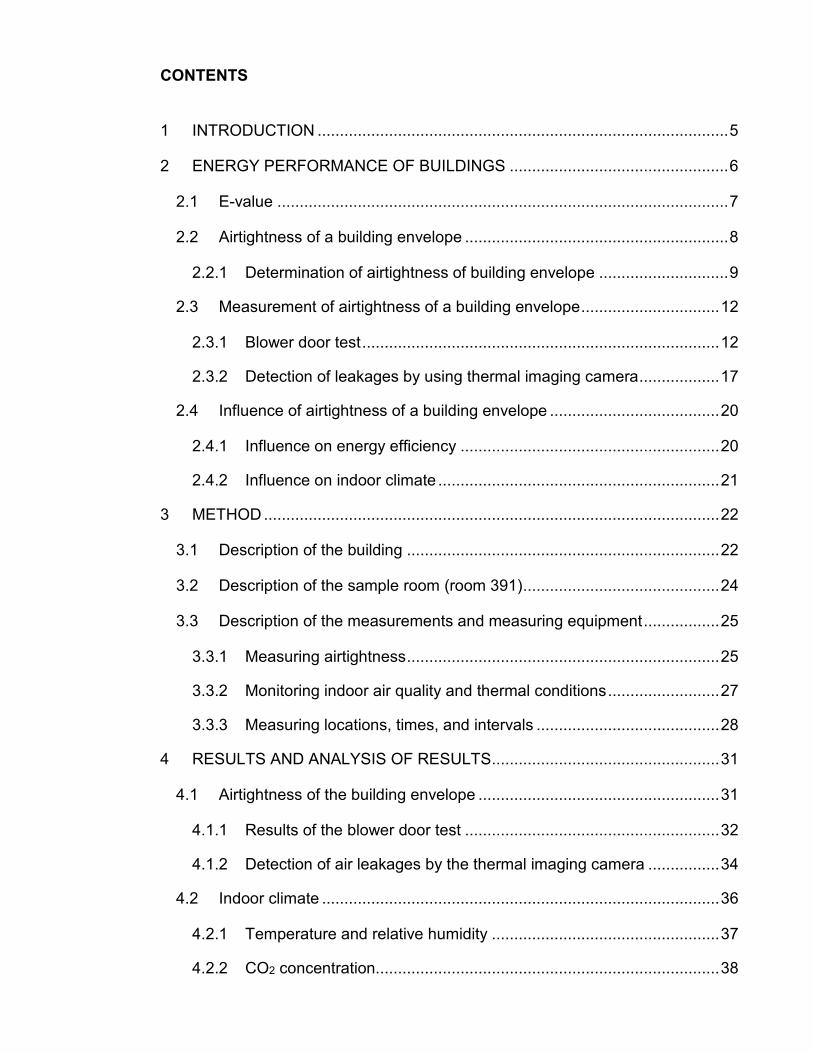
influences humans’ comfort, productivity, and health. Figure 1 presents the
distribution of the world’s energy consumption in general and in buildings. As it is
shown in the picture, a significant amount of energy consumed by buildings goes
7
to heating and cooling. That means that the influence of external conditions on
indoor climate should be reduced to save energy on the maintenance of buildings.
Figure 1. Energy consumption by sector /5/
2.1 E-value
The energy performance of a building is expressed by the calculated energy
performance reference value of a building or a building unit (E-value). The
calculation of this value is described in Decree of the Ministry of the Environment
on energy Performance Certificate of Buildings 1048/2017: «The E-value of a
building or of a building unit (kWhE/(m2year) is calculated by dividing the building’s
calculated consumption of delivered energy based on the standardized use of the
building, weighted by energy carrier factors, by the net heated surface area of the
building (Anet) in a year /4, p. 1-2/». Where building’s calculated consumption of
delivered energy shows the amount of energy used for its maintenance and
creation of the desired indoor climate. Energy carrier factors show the need for
delivered energy and are not used in calculations of energy that comes from
environmental energy in the surrounding areas of the building. Net heated area is
determined as the area of the heated part of the floor plate which is taken on the
basis of the internal surfaces of the external walls. /4, p. 1-2./

8
E-value is presented on the first page of the energy certificate and it defines the
energy performance class of the building. There are limitations of E-value for
different categories of buildings and for the determination of the energy class of
buildings. All the limitations according to categories are described in the Decree of
the Ministry of the Environment on energy Performance Certificate of Buildings
1048/2017. /4./
The choice of calculation zones for calculation of E-value depends on the building
purpose. If a building has single intended use it should be calculated as a single
calculation zone. A building may also be divided into several calculation zones if it
has different intended uses according to the exact purposes of the exact parts. /6,
p. 8./
According to legislation, the calculations of E-value should include the heat losses
calculations through the building envelope. These calculations are made on the
basis of the internal dimensions of the building envelope. Thermal bridges, air
leakage, the impact of the ground and crawl space should be taken into account
during heat loss calculations. /6, p. 8./
2.2 Airtightness of a building envelope
There are many technologies that help to make building more energy efficient and
achieve the desired indoor conditions at the same time. One of them is making the
building envelope more airtight. Airtightness of buildings shows how much outside
air comes inside the exact building and leaves it through leakages in the building
envelope. It is not only an indicator of the energy efficiency of the building but also
an indicator of building quality in general. Air leakages increase heat losses of the
building and influence structure’s toughness. They also usually cause unwanted
draughts, increase the concentration of indoor air pollutants, enchain supply
ventilation demand. Uncontrolled air leakage may become a reason of too high or
too low moisture content in the building and may lead to erosion of structure. /7./
These facts show the necessity of control of airtightness of buildings. According to
legislation, the amount of leakage air should be reduced to the required level.
Regulations regarding airtightness of buildings are different for different countries
9
but the strategy is to make structures more airtight and control air exchange
through ventilation.
2.2.1 Determination of airtightness of building envelope
Airtightness of a building envelope may be defined as the opportunity of the
building envelope to inward or outward air leakage through unintentional leakage
points or areas. It is a key issue in the reduction of energy consumption and making
a building a low energy one. Air leakage is an uncontrolled airflow through defect
points in the building envelope.
The calculation of the consumption of heat energy for leakage air of spaces of the
building is done according to the airtightness of the building or building unit. The
airtightness of the building is expressed by the air leakage rate figure for the
building envelope, q50, m3/(h·m2). It shows the average leakage airflow of the
building envelope per square unit of the envelope for one hour when there is a
pressure difference between outside and inside area of a building is 50 Pa. The
measurement ways of buildings’ airtightness and determination of air leakage rate
of the building envelope will be described below. /4, p. 9./ According to legislation,
if airtightness of a building is proven by an industrial building construction quality
assurance procedure or by measurements the resulting rate figures for building
envelope should be used in heat loss and E-value calculations. Otherwise, the
value of 4 m3/(h·m2) is taken into account as the air leakage rate figure for the
building envelope. /6, p. 8./
Before 2012, airtightness of buildings was described by the air leakage value of
the building with a 50 Pa pressure difference between inside and outside space of
a building, n50, 1/h. This value shows the number of air changes in a building per
hour under the created conditions. It is a good way to describe the airtightness of
a building envelope because it is very informative, and it is still used for this
purpose. There is a relation between the air leakage rate of the building envelope,
which is the modern way to describe the airtightness of the building, and the air
leakage value of the building. Equation 1 represents this relation /4, p. 9/.
10
𝑞𝑞50 =𝑛𝑛50
𝐴𝐴 𝑒𝑒𝑒𝑒𝑒𝑒𝑒𝑒𝑒𝑒𝑒𝑒𝑒𝑒𝑒𝑒 ∙ 𝑉𝑉 (1)
where q50 the air leakage rate of the
building envelope at a 50
Pa pressure difference [m3/(h m2)]
n50 the air leakage value of the
building with a 50 Pa
pressure difference [1/h]
Aenvelope the surface area of the building
envelope (including the lower floor) [m2]
V the air volume of the building [m3]
The surface area on the building envelope is determined according to internal
dimensions of the building /4, p. 9/.
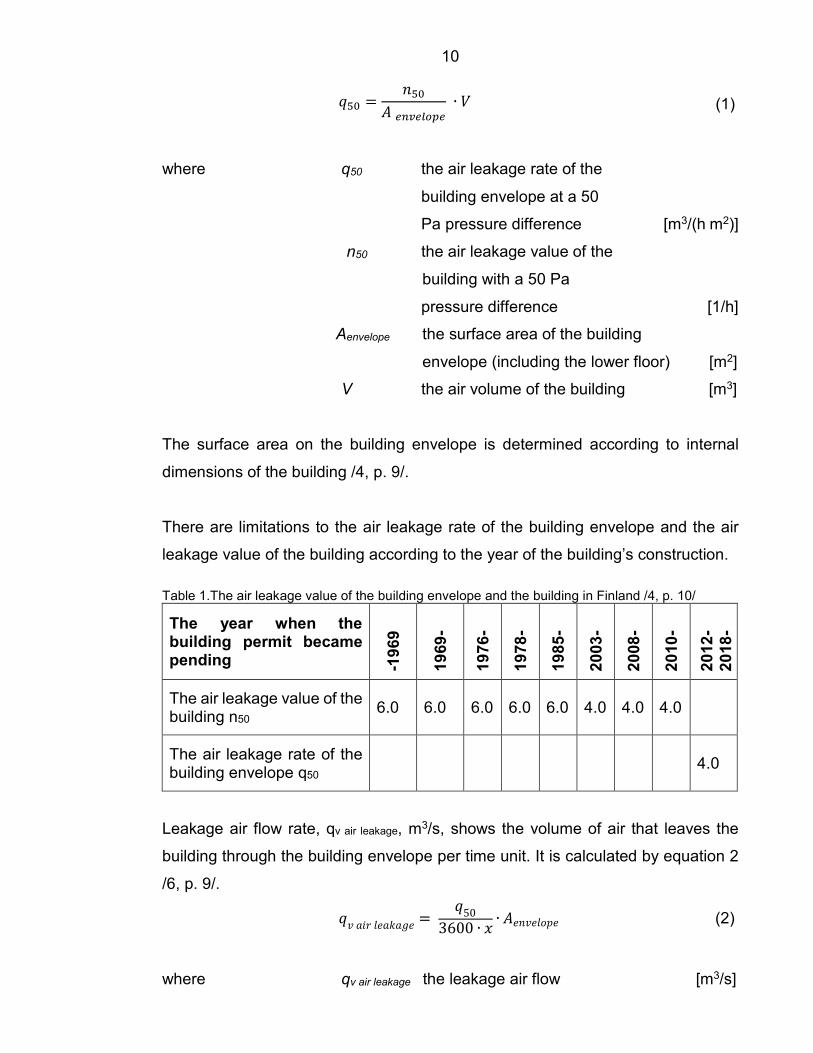
There are limitations to the air leakage rate of the building envelope and the air
leakage value of the building according to the year of the building’s construction. Table 1.The air leakage value of the building envelope and the building in Finland /4, p. 10/
The year when the building permit became pending -1
969
1969
-
1976
-
1978
-
1985
-
2003
-
2008
-
2010
-
2012
- 20
18-
The air leakage value of the building n50 6.0 6.0 6.0 6.0 6.0 4.0 4.0 4.0
The air leakage rate of the building envelope q50 4.0
Leakage air flow rate, qv air leakage, m3/s, shows the volume of air that leaves the
building through the building envelope per time unit. It is calculated by equation 2
/6, p. 9/.
𝑞𝑞𝑣𝑣 𝑎𝑎𝑎𝑎𝑎𝑎 𝑙𝑙𝑙𝑙𝑎𝑎𝑙𝑙𝑎𝑎𝑙𝑙𝑙𝑙 = 𝑞𝑞50
3600 ∙ 𝑥𝑥 ∙ 𝐴𝐴𝑙𝑙𝑛𝑛𝑣𝑣𝑙𝑙𝑙𝑙𝑒𝑒𝑒𝑒𝑙𝑙 (2)
where qv air leakage the leakage air flow [m3/s]

11
q50 the air leakage rate of the
building envelope at a 50 Pa
pressure difference [m3/(h m2)]
Aenvelope the surface area of the building
envelope (including the
lower floor) [m2]
x a factor which depends on the
number of storeys in the building
(for single-storey buildings is 35,
for two-storey buildings is 24, for
three-and four-storey buildings is
20 and for buildings taller than
these is 15) [-]
3600 a factor converting the air flow
from m3/h to m3/s [-]
The energy that is needed to heat air flowing in and out due to air leakages, Qair
leakage, W is calculated by equation 3 /8/.
𝑄𝑄𝑎𝑎𝑎𝑎𝑎𝑎 𝑒𝑒𝑒𝑒𝑎𝑎𝑙𝑙𝑎𝑎𝑙𝑙𝑒𝑒 = 𝑞𝑞𝑎𝑎 ∙ 𝐶𝐶𝑒𝑒 ∙ 𝑞𝑞𝑒𝑒 𝑎𝑎𝑎𝑎𝑎𝑎 𝑒𝑒𝑒𝑒𝑎𝑎𝑙𝑙𝑎𝑎𝑙𝑙𝑒𝑒 ∙ (𝑇𝑇𝑎𝑎𝑛𝑛𝑖𝑖 − 𝑇𝑇𝑒𝑒𝑜𝑜𝑜𝑜) (3)
where Qair leakage energy required to heat air leakage [W]
qi density of air, 1,2 [kg/m3]
Cp specific heat capacity of air, 1000 [J/kg,K]
qv air leakage the leakage air flow [m3/s]
Tind indoor air temperature [°C]
Tout outdoor air temperature [°C]
A building should be airtight enough to provide the correct function of a ventilation
system according to its design. For buildings in which the designed ventilation
system includes heat recovery, airtightness is a crucial factor in the energy
performance of the system. In addition, airtightness of a building envelope has a
huge influence on the indoor climate. /9, p. 3./ These facts are the main reasons
12
why the airtightness of buildings should be measured controlled and taken into
account.
2.3 Measurement of airtightness of a building envelope
The airtightness of building envelope should be measured because it is usually
difficult to detect gaps and cracks in the building fabric only by visual inspection in
normal conditions. As the airtightness of the building envelope has a significant
influence on energy efficiency, indoor air temperature and moisture content it is
required that the airtightness of the building envelope should be measured and
documented when a building is taken into use. In this case, a smaller value than
the reference air leakage value may be taken into account in heat loss calculations.
2.3.1 Blower door test
The blower door test is one of the most popular ways to measure how much air
infiltrates through the building envelope. It is presented by a huge powerful fan that
is installed into the frame of an exterior door or window. Before the start of the test,
all other exterior doors and windows should be closed and interior doors should be
opened to join all the rooms and spaces. The ventilation system should be also
turned off and all the drainage pipes should be closed by a water trap or with tape
if the building’s drainage system is not completed to avoid the air coming inside the
building through the ventilation and drainage systems. The volume and the area of
the building envelope should be calculated on the basis of the internal dimensions
of the building. When all the preparations have been made and all the equipment
installed, the test may be started.
The devices for the blower door test include not only a fan with variable speed but
also an adjustable frame and flexible airtight panel usually made from dense fabric
which perfectly fits every door frame. There is also a pressure meter to measure
the pressure difference between inside and outside areas of the building, computer
with the software to control the speed of the fan, analyze the results and make a
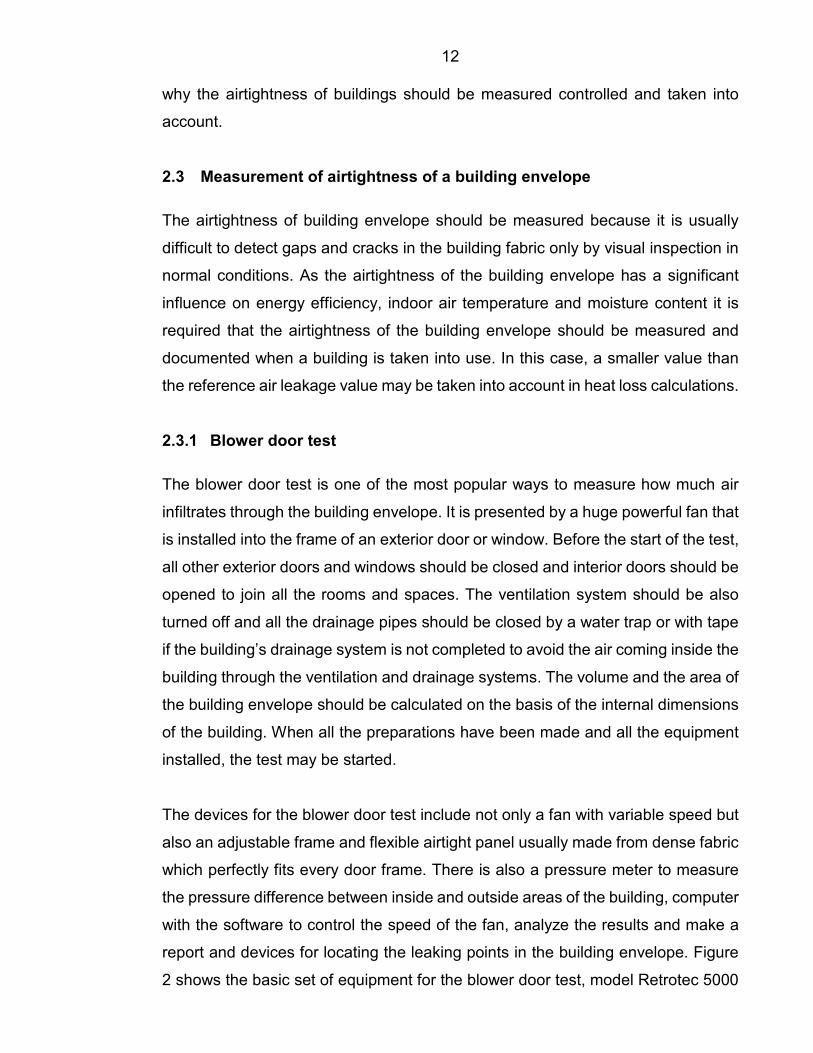
report and devices for locating the leaking points in the building envelope. Figure
2 shows the basic set of equipment for the blower door test, model Retrotec 5000
13
Blower Door System, all the parts are named. Such systems are usually used for
residential buildings or small commercial building. The number of fans may be
increased for testing larger buildings.
Figure 2. A basic set of the equipment for blower door test /10, p. 1/
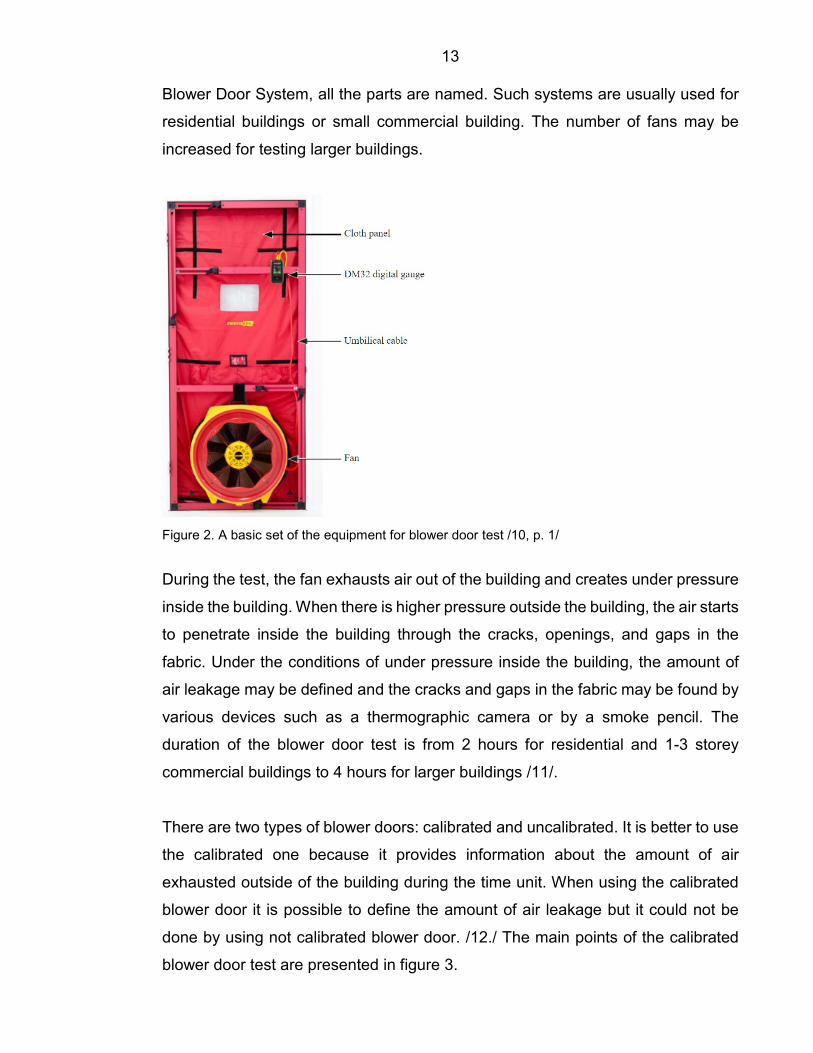
During the test, the fan exhausts air out of the building and creates under pressure
inside the building. When there is higher pressure outside the building, the air starts
to penetrate inside the building through the cracks, openings, and gaps in the
fabric. Under the conditions of under pressure inside the building, the amount of
air leakage may be defined and the cracks and gaps in the fabric may be found by
various devices such as a thermographic camera or by a smoke pencil. The
duration of the blower door test is from 2 hours for residential and 1-3 storey
commercial buildings to 4 hours for larger buildings /11/.
There are two types of blower doors: calibrated and uncalibrated. It is better to use
the calibrated one because it provides information about the amount of air
exhausted outside of the building during the time unit. When using the calibrated
blower door it is possible to define the amount of air leakage but it could not be
done by using not calibrated blower door. /12./ The main points of the calibrated
blower door test are presented in figure 3.
14
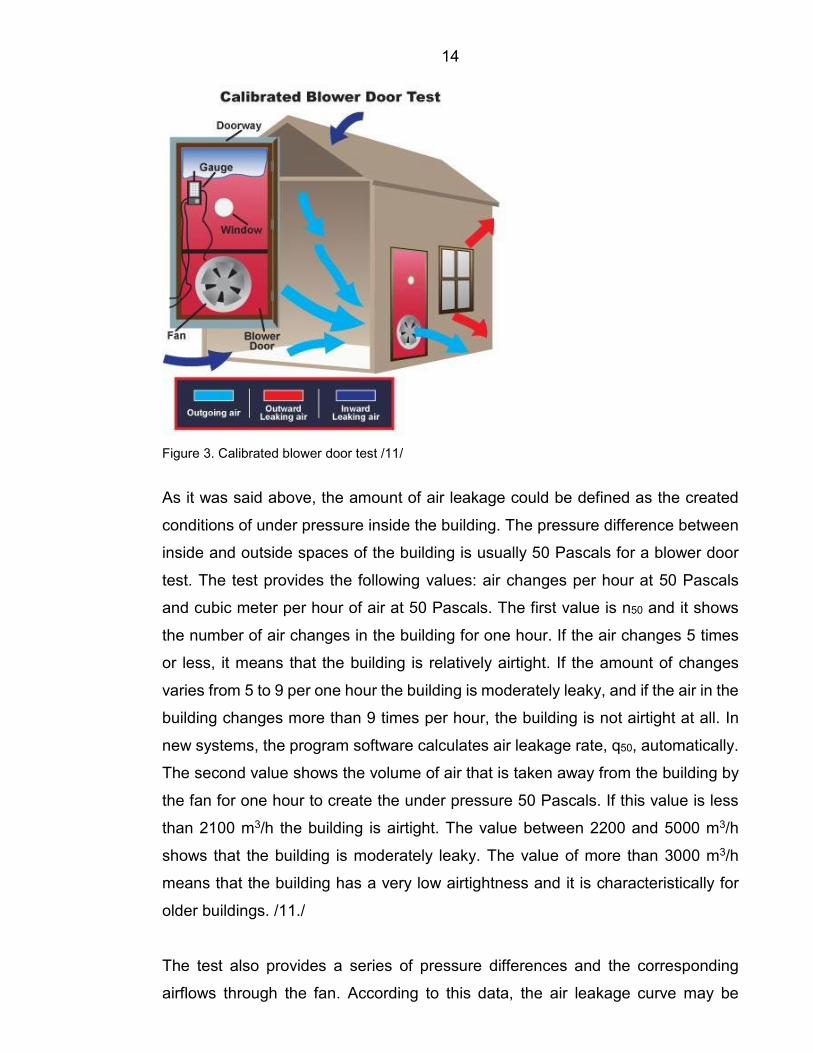
Figure 3. Calibrated blower door test /11/
As it was said above, the amount of air leakage could be defined as the created
conditions of under pressure inside the building. The pressure difference between
inside and outside spaces of the building is usually 50 Pascals for a blower door
test. The test provides the following values: air changes per hour at 50 Pascals
and cubic meter per hour of air at 50 Pascals. The first value is n50 and it shows
the number of air changes in the building for one hour. If the air changes 5 times
or less, it means that the building is relatively airtight. If the amount of changes
varies from 5 to 9 per one hour the building is moderately leaky, and if the air in the
building changes more than 9 times per hour, the building is not airtight at all. In
new systems, the program software calculates air leakage rate, q50, automatically.
The second value shows the volume of air that is taken away from the building by
the fan for one hour to create the under pressure 50 Pascals. If this value is less
than 2100 m3/h the building is airtight. The value between 2200 and 5000 m3/h
shows that the building is moderately leaky. The value of more than 3000 m3/h
means that the building has a very low airtightness and it is characteristically for
older buildings. /11./
The test also provides a series of pressure differences and the corresponding
airflows through the fan. According to this data, the air leakage curve may be
15
calculated by equation 4. It is also may be calculated automatically and provided
by the software. /13, p. 8./
𝑄𝑄 = 𝐶𝐶 ∙ ∆𝑃𝑃𝑒𝑒 (4)
where Q the airflow required to create a
pressure difference ∆p = 50 Pa [m3/h]
C flow coefficient [m3/(h·Pa)n]
∆P pressure difference between
outdoor and indoor air [Pa]
n exponent (depends on type of
air flow, varying from 0,5
(laminar) to 1,0 (turbulent)) [-]
When the blower door test is carried out, various corrections should be applied to
the result data that take into account temperature and density variations in the test
conditions. It is obvious that the amount of leakage air would be different in different
temperature and density of the air. The conditions are usually corrected to the
standard temperature of 20°C and a barometric pressure of 101325 Pa. the
following corrections should be carried out before analyzing the results of the
blower door test:
• correct the readings from the airflow measuring device for differences between actual test conditions and those for which the device was calibrated;
• correct the measured airflow rates for differences in temperature between air passing through the airflow measuring device and air passing through the building envelope;
• correct the airflow rates through the building envelope to standard temperature and barometric pressure conditions (STP).
These corrections are usually done by software before creating an air leakage
curve. However, if the measurement of airtightness of a building envelope is carried
out by using a ventilation system to depressurize or pressurize a building or
software is unable to apply these corrections they may be carried out by using
equations 5 – 7. /13, p. 11./

16
Correction for the difference between actual conditions in the airflow measuring
device and conditions when it was calibrated:
𝑄𝑄𝑚𝑚 = 𝑄𝑄𝑐𝑐 𝜌𝜌𝑐𝑐𝜌𝜌𝑚𝑚
(5)
where Qm the actual air volume flow rate
in the measuring device [m3/h]
Qc the air volume flow rate from
calibration of the measuring device [m3/h]
ρc the air density in the
measuring device [kg/m3]
ρm the air density from calibration
of the measuring device [kg/m3]
Correction for the indoor/outdoor temperature differences between air passing
through the airflow measuring device and air passing through the building
envelope:
𝑄𝑄𝑒𝑒𝑒𝑒𝑒𝑒 = 𝑄𝑄𝑚𝑚 𝑇𝑇𝑒𝑒 + 273𝑇𝑇𝑎𝑎 + 273
(6)
where Qenv the actual air volume flow rate
through the building envelope [m3/h]
Qm the actual air volume flow rate
in the measuring device [m3/h]
To the mean outdoor temperature during
the test [°C]
Ti the mean temperature in the
measurement device during
the test [°C]

17
Correction of the airflow rates through the envelope to standard temperature and
barometric pressure (STP), 20°C and 101325 Pa.
𝐶𝐶𝑠𝑠 = 𝐶𝐶𝑒𝑒𝑒𝑒𝑒𝑒 �
𝜌𝜌𝑒𝑒𝑒𝑒𝑒𝑒𝑒𝑒𝑠𝑠
�(1−𝑒𝑒)
(7)
where Cs the air leakage flow coefficient
at standard temperature and
pressure [m3/(h·Pa)n]
Cenv the air leakage flow
coefficient through the building
envelope during the test [m3/(h·Pa)n]
ρenv the density of air through
the building envelope
(equals the density of indoor air
for pressurization
tests or outdoor air for
depressurization tests) [kg/m3]
ρs the air density at STP (1.2) [kg/m3]
The corrected value of the air leakage flow coefficient, Cs, can then be used to
calculate Q50, the airflow rate at 50 Pa. This is then used to calculate the air leakage
index, air permeability, equivalent leakage area, etc. /13, p. 11./
2.3.2 Detection of leakages by using thermal imaging camera
When the under pressure is created inside the building by the blower door device
the cracks and gaps in the fabric of the building could be easily found by using a
smoke pencil or thermographic camera. Thermographic imaging is a perfect way
to detect building envelope defects such as missing insulation, delaminating
render, gaps, cracks and condensation problems /1, p. 15/.
18
It is known that every object that has a temperature above absolute zero emits
radiation in the infrared region. The infrared radiation is invisible for the human eye
but it can be felt by human skin as heat. Warmer objects emit more infrared
radiation. This fact is fundamental in understanding the principle of how a thermal
imaging camera works. Firstly, infrared energy comes from an object. Then it is
caught by the optics and transferred onto the infrared detector. After that, the
detector sends the information to the sensor electronics where the image is
processed. Finally, the electronics translate the data coming from the detector into
an image that is presented on the screen. /1, p. 9./ The results may be imported
and edited by software that is recommended by the manufacturer. The
thermographic camera may be used to scan HVAC installations as well as an entire
building. This device gives a total view of the situation. /1, p. 11./
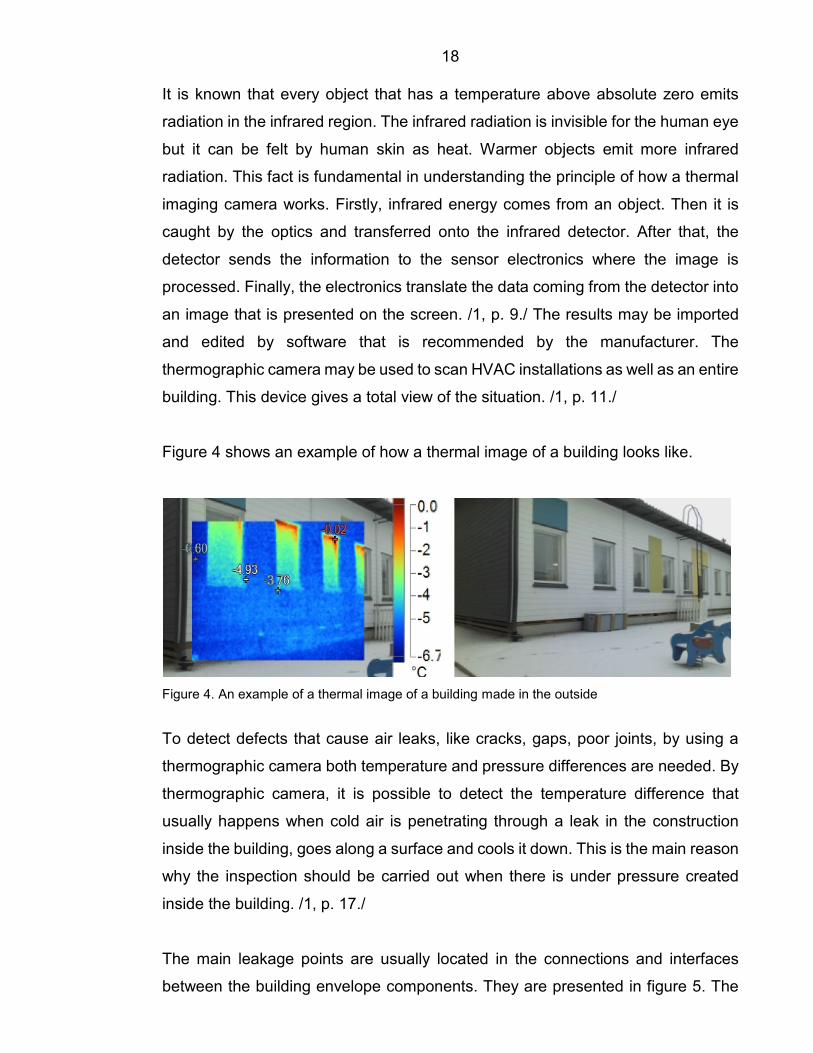
Figure 4 shows an example of how a thermal image of a building looks like.
Figure 4. An example of a thermal image of a building made in the outside
To detect defects that cause air leaks, like cracks, gaps, poor joints, by using a
thermographic camera both temperature and pressure differences are needed. By
thermographic camera, it is possible to detect the temperature difference that
usually happens when cold air is penetrating through a leak in the construction
inside the building, goes along a surface and cools it down. This is the main reason
why the inspection should be carried out when there is under pressure created
inside the building. /1, p. 17./
The main leakage points are usually located in the connections and interfaces
between the building envelope components. They are presented in figure 5. The
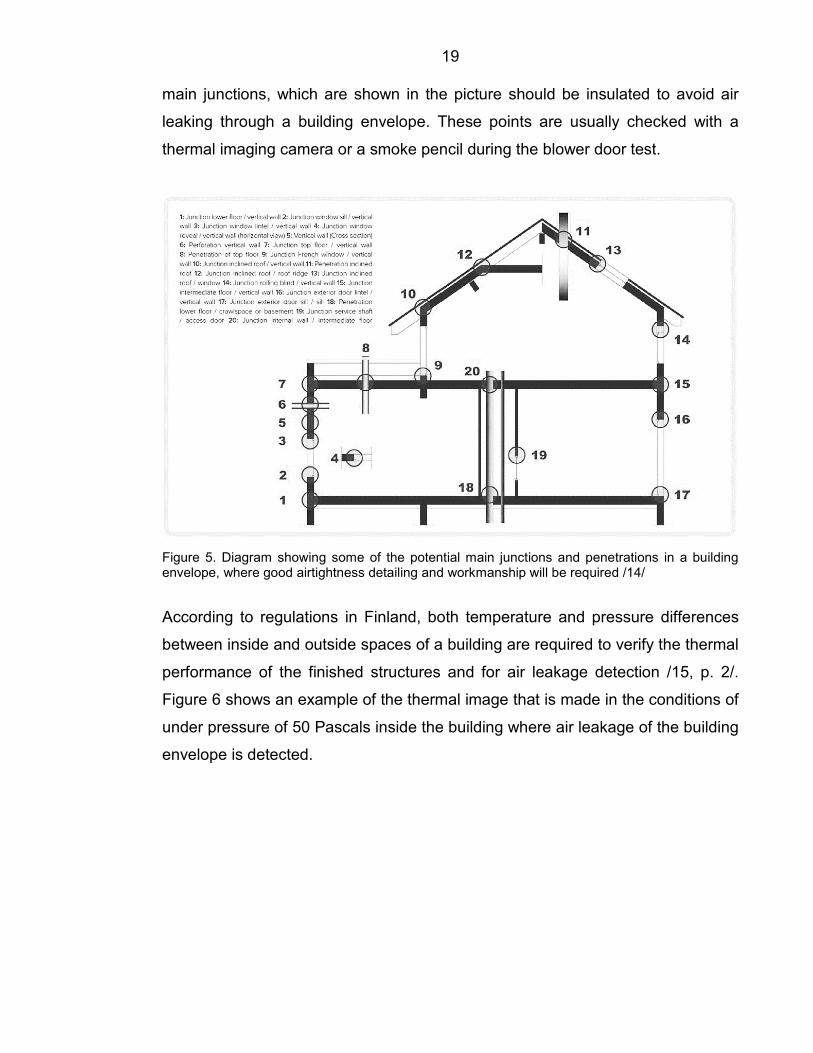
19
main junctions, which are shown in the picture should be insulated to avoid air
leaking through a building envelope. These points are usually checked with a
thermal imaging camera or a smoke pencil during the blower door test.
Figure 5. Diagram showing some of the potential main junctions and penetrations in a building envelope, where good airtightness detailing and workmanship will be required /14/
According to regulations in Finland, both temperature and pressure differences
between inside and outside spaces of a building are required to verify the thermal
performance of the finished structures and for air leakage detection /15, p. 2/.
Figure 6 shows an example of the thermal image that is made in the conditions of
under pressure of 50 Pascals inside the building where air leakage of the building
envelope is detected.

20
Figure 6. An example of a thermal image made in the created conditions of under pressure inside the building to detect air leakage
2.4 Influence of airtightness of a building envelope
2.4.1 Influence on energy efficiency
Uncontrolled air leakages through the building envelope have a huge influence on
the energy efficiency of the building. In fact, airtightness is a key point in the energy
efficiency of the building because leakage of air from inside of the building reduces
the efficiency of the thermal insulation, heat resistance of the structure, efficiency
of heat recovery system and increase losses for the ventilation. As a result, heating
and sometimes cooling demand of the building increases to compensate for the
additional heat losses. Higher consumption of energy means higher costs for
building maintenance.
Figure 7 represents the dependence of the annual specific heating demand and
specific thermal loss by ventilation from airtightness of the reference energy-
efficient building with a heat recovery system, which efficiency is 85%. The
reference building’s location in Central Europe, it is made from wooded mass
materials and contains two storeys. The net heated area is 150 m2, the area of the
building envelope is 420 m2 and the volume of the building is 440 m3. /16, p. 4./

21
Figure 7. Relationship between air change rate and annual specific heating demand and specific heat loss by ventilation /16/
It is obvious that the lower air change rate and air leakage rate the building has the
lower its heating demand. According to figure 7 specific heat loss for ventilation is
4 times more and the heating demand of the building is 1,25 times more if the
building has poor airtightness.
2.4.2 Influence on indoor climate
It is known that air leakages cause air infiltration through the building envelope.
However, uncontrolled infiltration is not a good method of air supply in the building
because it causes moisture penetration, draughts, and uncontrolled temperature
differences.
However, increased airtightness of the building leads to decreasing of air coming
inside the building. It may increase the number of indoor air pollutants. The
research shows that improved airtightness of the building from 1,3 to 0,6 ACH may
reduce incoming fresh air for 33% and reduce indoor air quality level. Figure 8
shows the changes that happen when the airtightness of the building envelope is
improved without adjusting ventilation. In the first case, the indoor air quality is
moderate and in the second case, the indoor air quality is considered to be poor.
The results are got from the simulations using SIREN software from French CSTB
official body (“Centre Scientifique et Technique du Batiment”) and indoor air quality
is level is estimated according to CO2 concentrations. /17, p. 6./

22
Figure 8. Incoming fresh air repartition with humidity-controlled ventilation /17, p. 7/
This means that when improvements of airtightness of the building are made the
ventilation system should be adjusted to provide a satisfactory indoor air quality.
That is why indoor air quality should be also monitored in the building to discover
if the supply airflow rate is enough in the existing conditions.
3 METHOD
3.1 Description of the building
As a case building a daycare center was chosen. A daycare center is a childcare
facility that is created to let parents leave their children for the working day for care,
supervision or learning. Sometimes daycare centers work 24 hours per 7 days and
give an opportunity for parents to leave their children for several days and nights.
The studied daycare center building is presented in figure 9. The building is located
in Lahti, the city of Finland in the South of the country. The city is situated in the II
climatic zone of Finland, where the designed outdoor air temperature is -29°C.

23
Figure 9. The investigated building of the daycare center The description of the studied daycare center is provided below.
Address: Kerinkallionkatu 6, 15520 Lahti.
The case building: the new part of the daycare center.
The number of storeys: 1.
Area of the building envelope on the base of internal dimensions of external walls:
1474,7 m2.
Net heated area: 564,6 m2.
The volume of the building: 1863,18 m3.
The year of construction: 2019.
The construction of external walls:
• Plasterboard EK 13 mm; • Plastic vapor barrier SFS 4225; • Vertical panel 48x248 mm + non-combustible stone wool 250 mm; • Gypsum sheathing board 9 mm; • Vertical supporting rails 30x100 mm; • Horizontal paneling 23x175 mm.
U-value of external the walls: 0,17 W/m2 ‧ K.
The construction of ceiling:
• Roofing profile sheet k300 25 x100 mm; • Trussed rafters R30 + blowing wool 120 mm + non-combustible mineral
wool 250 mm;

24
• Fire-resistant plasterboard 15 mm; • Wooden frame 42 x98 mm + mineral wool 100 mm; • Plastic vapor barrier SFS 4225; • Lathing k300 mm 23 x120 mm; • Acoustic insulation 13 mm.
U-value of ceiling: 0,09 W/m2 ‧ K.
The construction of base floor:
• Carpet; • Chipboard 22 mm; • Board 23 x100 /underfloor heating 23 mm; • Floor beams wooden k400 mm 45 x270 mm + non-combustible stone wool
270 mm • Fiber cement 9 mm • Protection board 19 x100 mm k400 mm 19 mm; • Pressurized wood.
U-value of base floor: 0,16 W/m2 ‧ K.
U-value of windows and doors: 1 W/m2 ‧ K.
Working hours: 24 hours per 7 days.
3.2 Description of the sample room (room 391)
As a sample room, a room where there are outer door and detected leakage points
was chosen because there is the highest amount of leakage airflow and it causes
the possibility of low temperatures and high moisture content. Children spend a lot
of time in the sample room, they play and sleep there. The number of children who
spent time in the room during the day when measurements took place is 11. The
age of the group of children who spent time in the sample room is from 3 to 5 years
old they were nursed by 2-3 adults during the day.
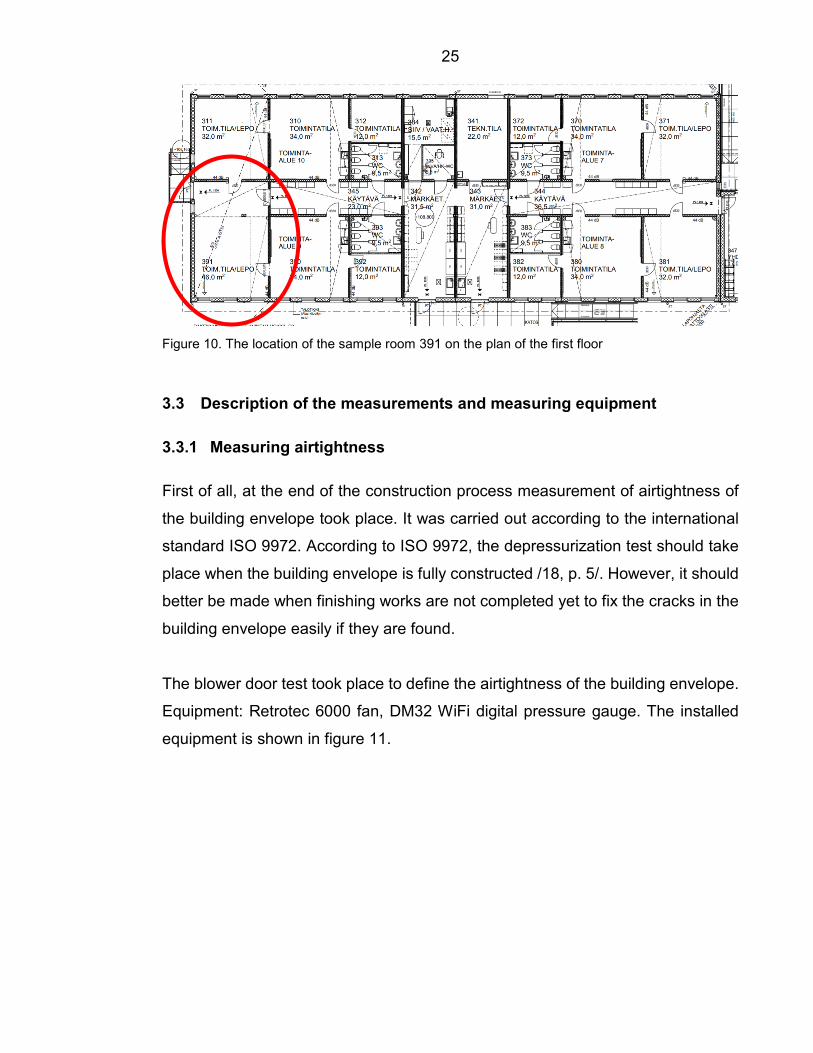
The location of the sample room 391 on the plan of the first floor is presented in
figure 10. The area of the room is 46 m2.
25
Figure 10. The location of the sample room 391 on the plan of the first floor
3.3 Description of the measurements and measuring equipment
3.3.1 Measuring airtightness
First of all, at the end of the construction process measurement of airtightness of
the building envelope took place. It was carried out according to the international
standard ISO 9972. According to ISO 9972, the depressurization test should take
place when the building envelope is fully constructed /18, p. 5/. However, it should
better be made when finishing works are not completed yet to fix the cracks in the
building envelope easily if they are found.
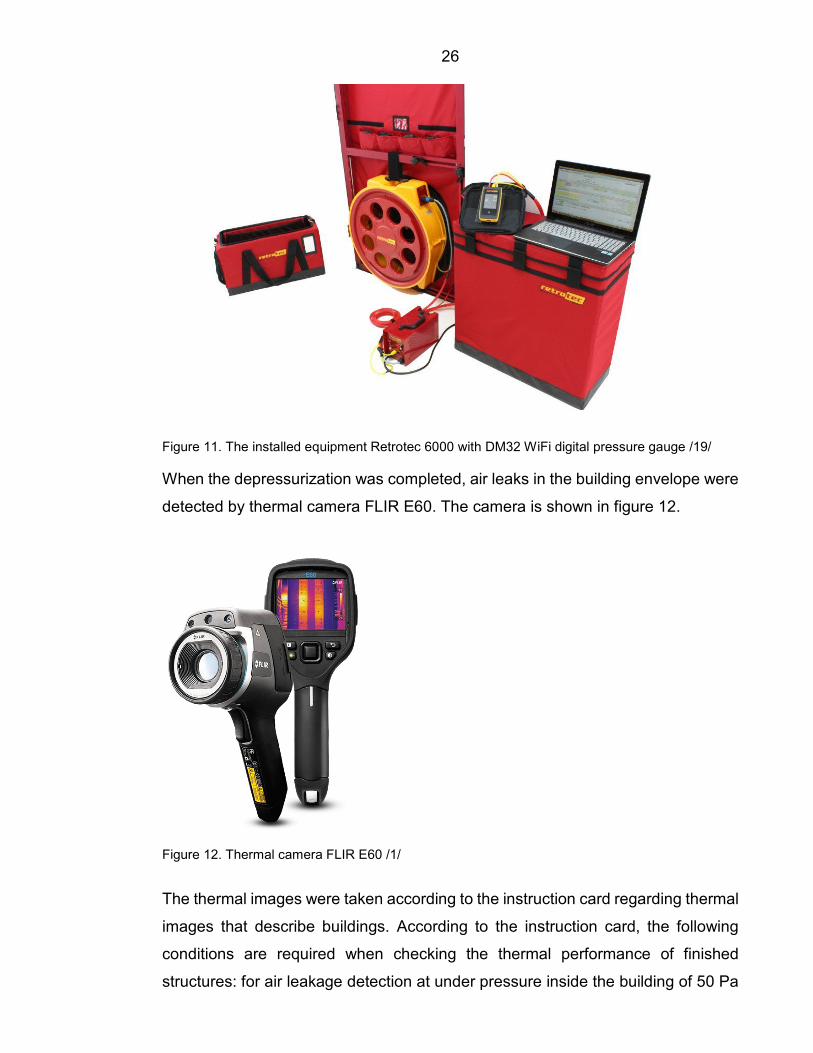
The blower door test took place to define the airtightness of the building envelope.
Equipment: Retrotec 6000 fan, DM32 WiFi digital pressure gauge. The installed
equipment is shown in figure 11.
26
Figure 11. The installed equipment Retrotec 6000 with DM32 WiFi digital pressure gauge /19/ When the depressurization was completed, air leaks in the building envelope were
detected by thermal camera FLIR E60. The camera is shown in figure 12.
Figure 12. Thermal camera FLIR E60 /1/
The thermal images were taken according to the instruction card regarding thermal
images that describe buildings. According to the instruction card, the following
conditions are required when checking the thermal performance of finished
structures: for air leakage detection at under pressure inside the building of 50 Pa
27
the temperature difference of at least 5°C is needed (the resolution of the thermal
imaging camera is not more than 0.1 degrees and a resolution of at least 19000
pixels).
In addition, weather changes in thermal imaging must also be taken into account
during the measuring process. Temperature fluctuations shall be recorded in the
measurement report and take into account when interpreting the results if the
outdoor temperature changes over 5°C and room temperature over 2°C during
measurements.
3.3.2 Monitoring indoor air quality and thermal conditions
When the building was commissioned, indoor air quality and thermal conditions
were monitored to check if the supply airflow rate is enough for the studied building
and to investigate if temperature and relative humidity meet the requirements.
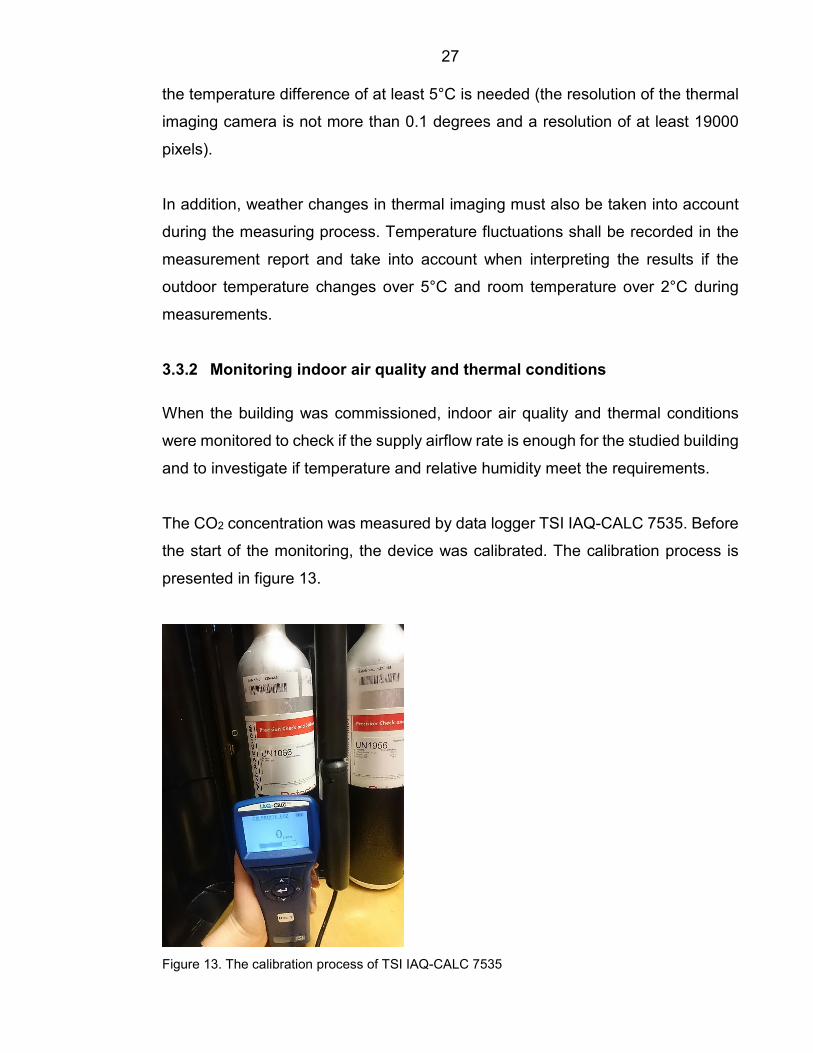
The CO2 concentration was measured by data logger TSI IAQ-CALC 7535. Before
the start of the monitoring, the device was calibrated. The calibration process is
presented in figure 13.
Figure 13. The calibration process of TSI IAQ-CALC 7535

28
The target values for CO2 concentrations are mentioned in the CLASSIFICATION
OF INDOOR ENVIRONMENT 2018 Target Values, Design Guidance, and Product
Requirements instructions.
Temperature and relative humidity were monitored by –ebro– EBI 20 data logger.
The device fulfills the guidelines according to international standard EN 12830. The
device is presented in figure 14.
Figure 14. –ebro– EBI 20
3.3.3 Measuring locations, times, and intervals
Airtightness measurement took place on 03.07.2019. Temperatures during the
measurement process:
• in the beginning: indoors 21,8°C, outdoors 14,6°C; • in the end: indoors 21,8°C, outdoors 14,6°C.
Other conditions: atmospheric pressure: 100,2 KPa, wind speed: 4 m/s moderate
breeze.
The blower door fan was installed on the main door. The location of the blower
door fan is shown in figure 15.

29
Figure 15. The location of blower door fan Thermal conditions monitoring took place on 08.11.2019. The weather conditions
during the monitoring day are presented in figure 16.
Figure 16. Weather in Lahti on 08.11.2019 /20/
The average outside CO2 concentration in front of the sample room 391 was 437
ppm.
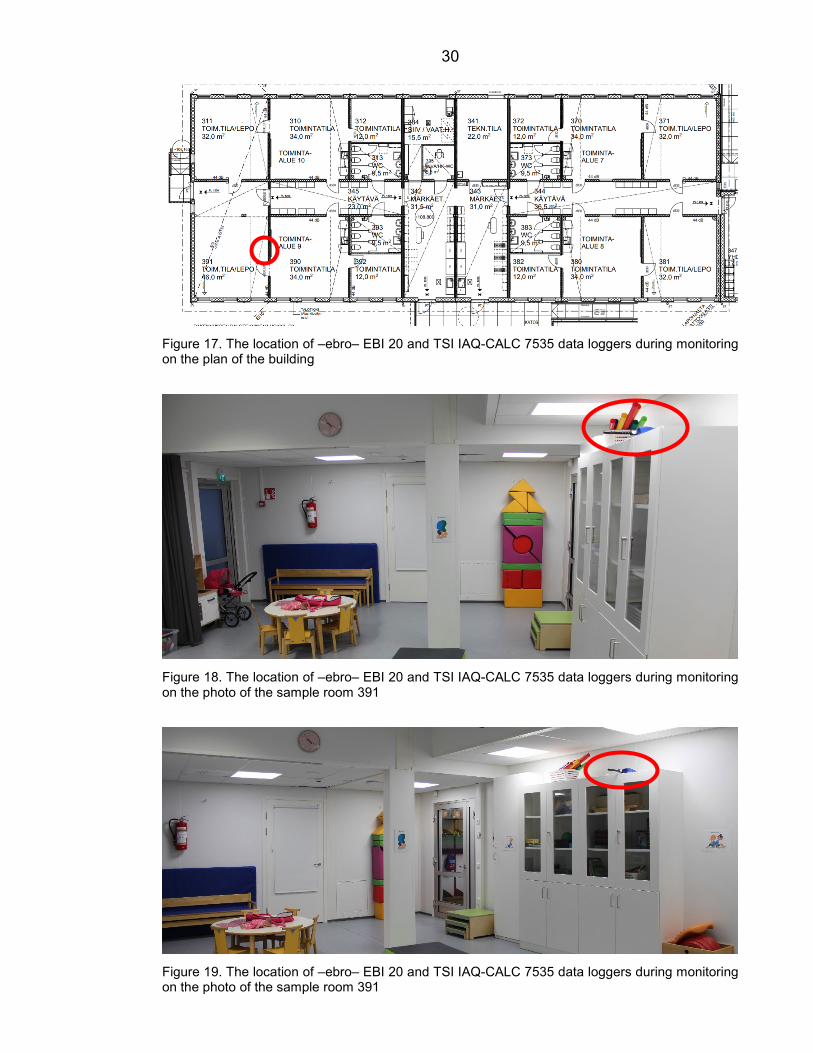
The place where the –ebro– EBI 20 and TSI IAQ-CALC 7535 data loggers were
installed is presented in figure 17. Figures 18 and 19 represent the photos that
were taken during the monitoring process in the sample room 391 where the
measurement devices location is shown.
30
Figure 17. The location of –ebro– EBI 20 and TSI IAQ-CALC 7535 data loggers during monitoring on the plan of the building
Figure 18. The location of –ebro– EBI 20 and TSI IAQ-CALC 7535 data loggers during monitoring on the photo of the sample room 391
Figure 19. The location of –ebro– EBI 20 and TSI IAQ-CALC 7535 data loggers during monitoring on the photo of the sample room 391
31
The choice of the location of the devices was influenced by the fact that children
spend a lot of time in the sample room 391 and they should have no possibility to
reach the instruments.
The monitoring took place from 9:00 to 16:00. The sample interval of 1 minute was
installed for both –ebro– EBI 20 and TSI IAQ-CALC 7535 data loggers when they
were programmed. The indoor climate in the sample room 391 was influenced by
the adjoining room 390 because the door between them was opened from time to
time not to prevent children from one group to move from one room to another. The
doors to the corridor were closed most of the time.
The approximate activity of the group of children and 3 adults during the monitoring
hours in the rooms 390 and 391:
• 9:00 – 9:50 children and nurses moved between rooms, children played in both rooms and had breakfast in room 390;
• 10:00 – 11:40 children left both rooms and went for a walk; • 11:40 – 12:00 children had lunch in room 390; • 12:00 – 13:40 children slept in room 390; • 13:40 – 14:30 children had afternoon snack in room 390, played and moved
between rooms 390 and 391; • 14:30 – 15:30 an activity took place in the sample room 391, it was occupied
by the whole group of children and 3 adults; • 15:30 – 16:00 everyone left the rooms.
The results will be presented in graphs and compared to the legislations and target
values.
4 RESULTS AND ANALYSIS OF RESULTS
4.1 Airtightness of the building envelope
The results of the airtightness measurement should be presented in two parts. In
the first part, there are results of the blower door test where the air leakage rate is
determined. In the second part, there are the results of the leakage point detection
in the building envelope.

32
4.1.1 Results of the blower door test
As a result of the blower door test leakage rate of the building envelope, q50 was
defined. For the case building the result is q50 = 0,796 m3/hm2 at a pressure
difference of 50 Pa. This value does not exceed the limit value for the air leakage
rate in Finland that is presented in table 1. That means that the building meets the
requirements regarding the airtightness of the envelope. The full results are shown
in table 2 and table 3. Table 2 shows that the number of air changes per hour is
0,63 and this value is close to the passive house requirements, the buildings that
have very high energy performance. Table 3 shows the series of the pressure
difference between inside and outside of the building and fan airflow rates that are
required to create the test pressure difference. The target test pressure is
highlighted by color.
Table 2. The combined results of the blower door test
Combined results Value Range Uncertainty
Airflow rate 50 Pa, V50 [m3/h] 1174,0 1146,5 1202,5 +/-2,4%
Air changes per hour N50 [1/h] 0,63 0,61 0,64 +/-3,2%
Air leakage rate q50 [m3/hm2] 0,796 0,771 0,821 +/-3,1%
Table 3. The series of test pressure and airflows of the fan
Test pressure
[Pa] -9,2 -16,2 -22,4 -28,0 -33,1 -40,0 -46,5 -51,1 -58,6 -63,7
Airflow, [m3/h] 323 492 624 768 875 1051 1108 1192 1284 1405
Corrected airflow
[m3/h] 317 483 613 754 859 1032 1088 1171 1261 1379
Error [%] 1,0% -1,9% -2,7% 0,7% 1,2% 5,6% -0,5% -0,2% -2,9% -0,1%
The air leakage curve is presented in figure 20. It is created by the Retrotec
software according to the data in table 3. It shows the airflow rate of the blower
door fan to create the test pressure difference.

33
Figure 20. Air leakage curve created by the Retrotec software
According to the air leakage rate, the class of the building may be defined.
According to the limitations for air leakage rate the studied daycare center has
class B. That means that the studied building has a high airtightness of the building
envelope that shows a good quality of the construction. Figure 21 shows the
determination of the class of the building according to the air leakage rate. It must
be mentioned that the energy class of a building depends not only on air leakage
rate but on many other things that have an impact on the energy demand of a
building.
Pressure difference, Pa
Airfl
ow o
f the
fan,
m3 /h
Under pressurization
34
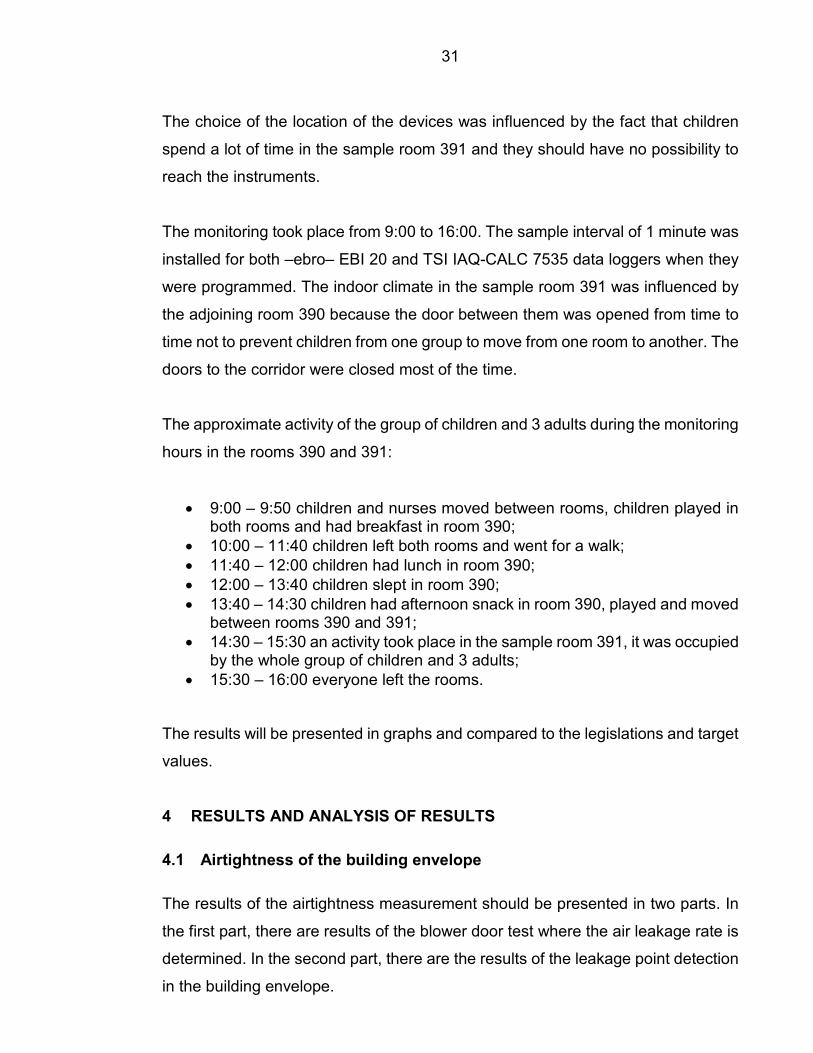
Figure 21. Tightness measuring rating
Leakage air flow rate, qv air leakage, is calculated by equation 2. For the studied
building:
𝑞𝑞𝑒𝑒 𝑎𝑎𝑎𝑎𝑎𝑎 𝑒𝑒𝑒𝑒𝑎𝑎𝑙𝑙𝑎𝑎𝑙𝑙𝑒𝑒 = 0,796
3600 ∙ 35∙ 1474,7 = 0,00932 𝑚𝑚3/𝑠𝑠
Heat loss for air leakage, Qair leakage, is calculated by equation 3. The design outdoor
temperature for Lahti is -29°C. Designed indoor temperature is +21°C For the
studied building:
𝑄𝑄𝑎𝑎𝑎𝑎𝑎𝑎 𝑒𝑒𝑒𝑒𝑎𝑎𝑙𝑙𝑎𝑎𝑙𝑙𝑒𝑒 = 1,2 ∙ 1000 ∙ 0,00932 ∙ �21 − (−29)� = 559, 2 𝑊𝑊
This value for the studied building is relatively low that means that there is not
much energy needed to compensate for the heat loss due to air leakage.
4.1.2 Detection of air leakages by the thermal imaging camera
The leakage points detected by thermal imaging camera FLIR E60 at the created
conditions of under pressure of 50 Pa inside the building in the sample room 391
are presented in figures 22 and 23.

35
As it may be seen in the thermal images, the temperature differences are small
that means that the air leakages are relatively small and do not influence much on
the thermal comfort of the residents. However, that means that the sample room
391 is relatively airtight and the income of the fresh outside air may be reduced
that may cause poor indoor air quality. That is why the indicator of indoor air quality,
CO2 concentration should be monitored and it should be checked if this value
meets the target values. The results of the monitoring are presented below.
Figure 22. The air leakage detected by the thermal imaging camera that is caused by the outer door in the sample room 391
Figure 23. The air leakage detected by the thermal imaging camera that is caused by the crack in the building envelope in the sample room 391
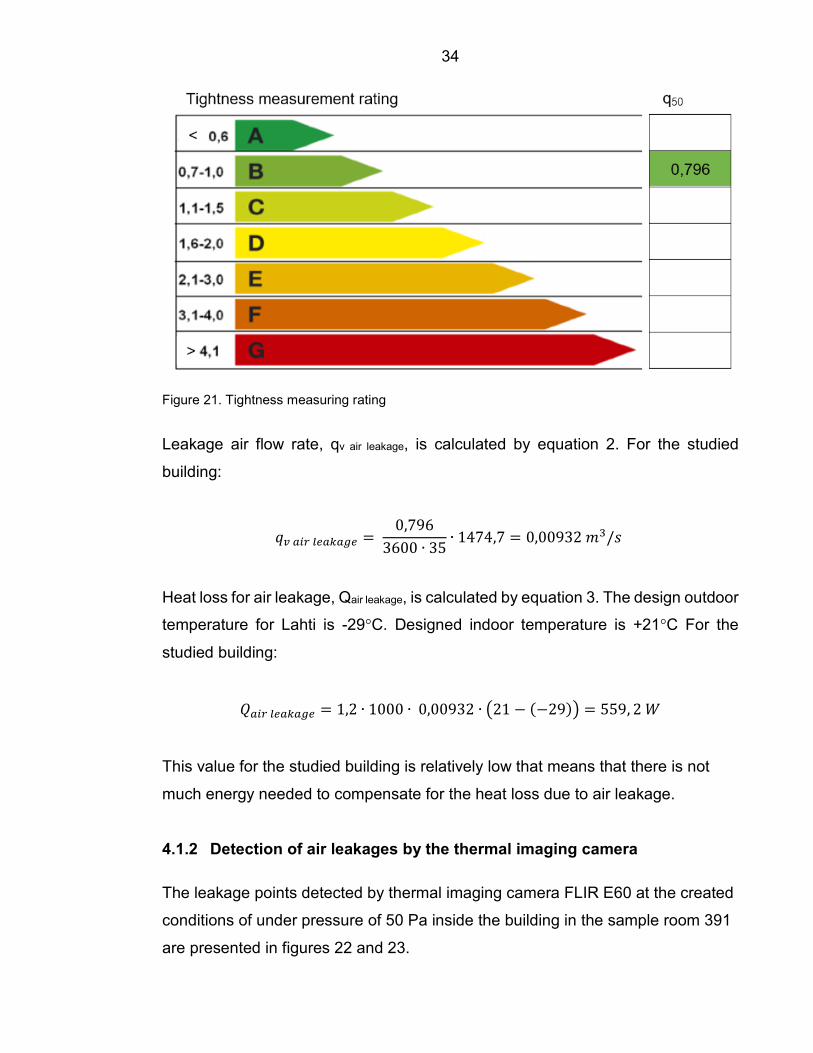
There is a thermal image taken on 08.11.2019 by the thermal imaging camera
Fluke TiS45 (figure 24). The outside temperature was -3°C, the inside temperature
was +21,5°C, no created under pressure. The image shows that the temperature
difference in winter is relatively high that is why the thermal conditions should be
36
monitored and it should be checked if the temperature and relative humidity meet
the target values. The results of the monitoring are presented below.
Figure 24. The outer door in the sample room 391
All the leaking points in the building are presented in figure 25. The full reports of
the blower door test that took place in the building on 03.07.2019 are presented in
appendix 2 and appendix 3. All the leaking points of the building envelope are
located in the most common places.
Figure 25. Leaking points detected by the thermal imaging camera FLIR E60 at the created under pressure of 50 Pa inside the building
4.2 Indoor climate
The results of the monitoring of temperature, relative humidity, and CO2
concentration show that the thermal conditions and indoor air quality in the sample
room 391 are acceptable.

37
4.2.1 Temperature and relative humidity
The monitoring results show that the maximum temperature in the sample room
391 did not exceed 22,3°C during the monitoring hours. The average temperature
was 21,8°C that is very close to the design value of 21°C. The minimum
temperature inside the room during the monitoring hours was 21,4°C. These values
show that the temperature did not fluctuate much even when the room is occupied
by the maximum number of people. The temperature also did not drop below the
lowest comfort value of 20°C that means that heat loss for air leakage is well
compensated. Figure 26 represents the results of the temperature monitoring that
took place on 08.11.2019 from 9:00 till 16:00.
Figure 26. The results of temperature monitoring on 08.11.2019 at 9:00-16:00 in room 391
The results of the monitoring of relative humidity show that the highest relative
humidity during monitoring hours in the sample room 391 was 28,3%. The average
value for relative humidity is 24,7%. The minimum relative humidity was 22,6%
when the room was not occupied by the group of children and adults. The comfort
range for relative humidity inside the building is considered to be 40-50%.
21.0
21.2
21.4
21.6
21.8
22.0
22.2
22.4
9:00
9:10
9:20
9:30
9:40
9:50
10:0
010
:10
10:2
010
:30
10:4
010
:50
11:0
011
:10
11:2
011
:30
11:4
011
:50
12:0
012
:10
12:2
012
:30
12:4
012
:50
13:0
013
:10
13:2
013
:30
13:4
013
:50
14:0
014
:10
14:2
014
:30
14:4
014
:50
15:0
015
:10
15:2
015
:30
15:4
015
:50
16:0
0
Tem
pera
ture
, °C
Time of the day
TEMPERATURE MONITORING
38
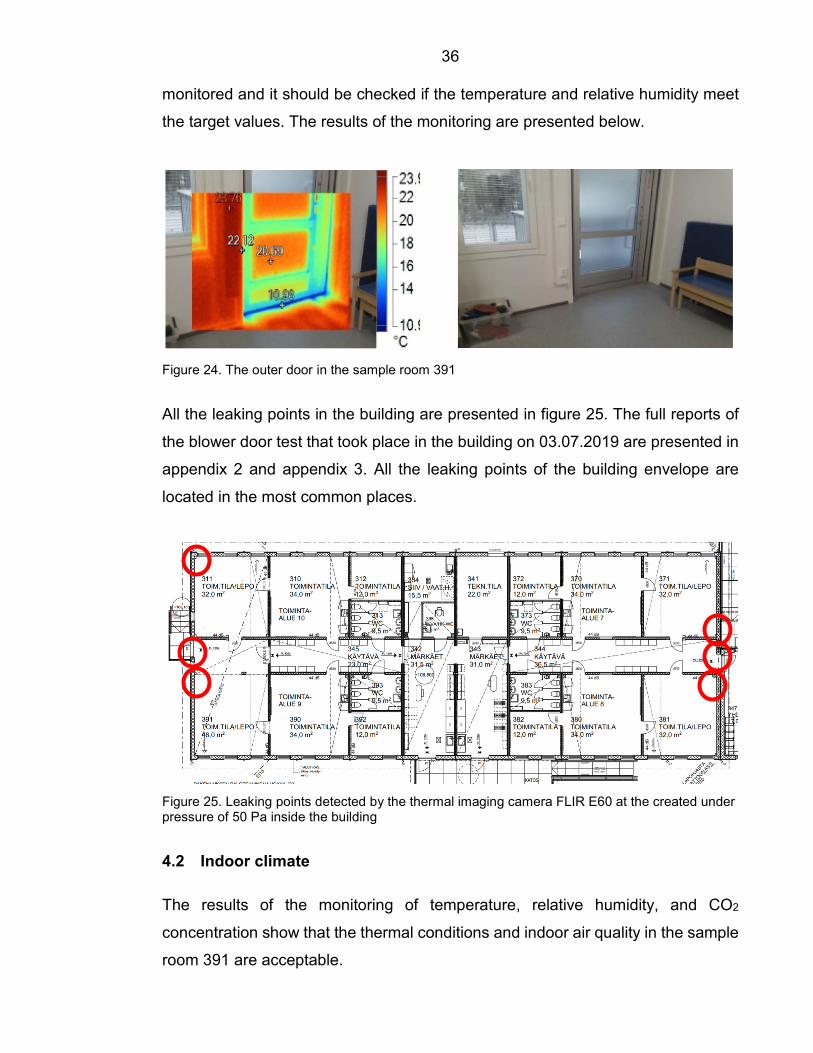
However, in winter the indoor relative humidity is usually lower than in summer
because the air is relatively dry in winter. The average calculated moisture content
in the outside air is 2,86 g/kg. The average calculated moisture content in the
indoor air is 4,07 g/kg. The results of the monitoring of relative humidity in the
sample room 391 is presented in figure 27.
Figure 27. The results of relative humidity monitoring on 08.11.2019 at 9:00-16:00 in room 391
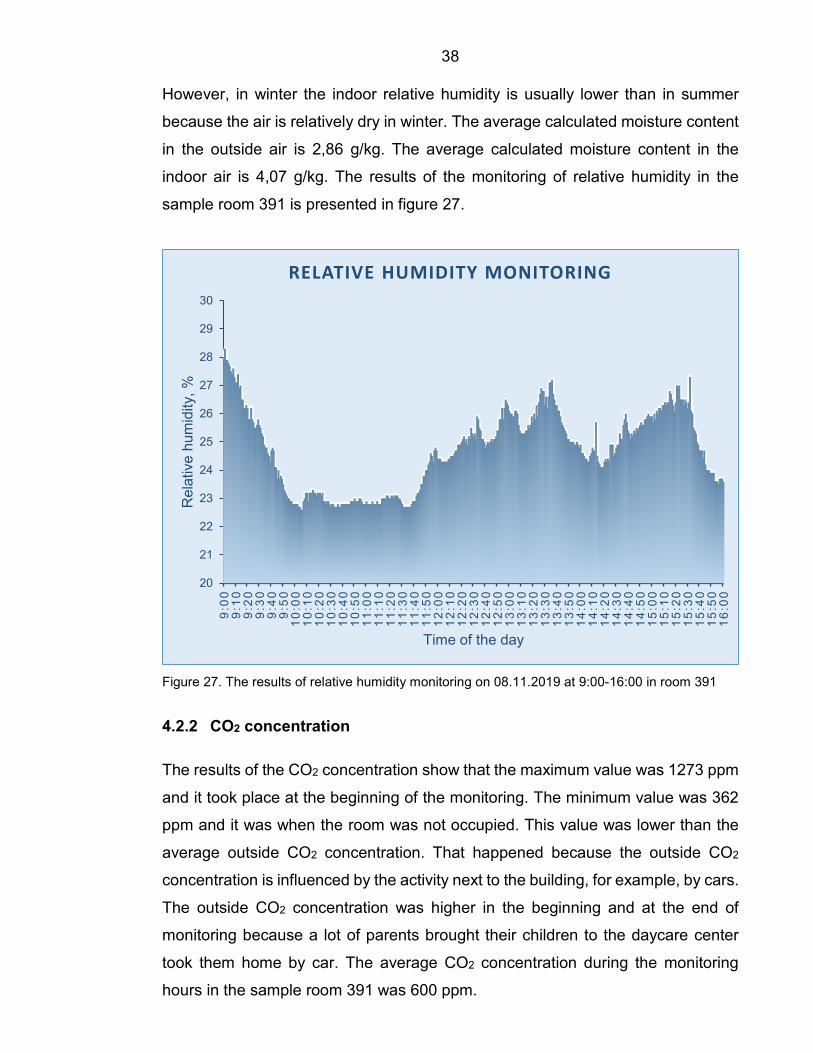
4.2.2 CO2 concentration
The results of the CO2 concentration show that the maximum value was 1273 ppm
and it took place at the beginning of the monitoring. The minimum value was 362
ppm and it was when the room was not occupied. This value was lower than the
average outside CO2 concentration. That happened because the outside CO2
concentration is influenced by the activity next to the building, for example, by cars.
The outside CO2 concentration was higher in the beginning and at the end of
monitoring because a lot of parents brought their children to the daycare center
took them home by car. The average CO2 concentration during the monitoring
hours in the sample room 391 was 600 ppm.
20
21
22
23
24
25
26
27
28
29
30
9:00
9:10
9:20
9:30
9:40
9:50
10:0
010
:10
10:2
010
:30
10:4
010
:50
11:0
011
:10
11:2
011
:30
11:4
011
:50
12:0
012
:10
12:2
012
:30
12:4
012
:50
13:0
013
:10
13:2
013
:30
13:4
013
:50
14:0
014
:10
14:2
014
:30
14:4
014
:50
15:0
015
:10
15:2
015
:30
15:4
015
:50
16:0
0
Rel
ativ
e hu
mid
ity, %
Time of the day
RELATIVE HUMIDITY MONITORING

39
Figure 28 represents the results of the monitoring of CO2 concentration and the
target values for categories S1, S2 and S3. The category S1 means that the indoor
air quality inside the building is considered to be high. The target value of CO2
concentration for the category S1 should not exceed the outside CO2 concentration
by 350 ppm. The category S2 shows that the room has good indoor air quality. The
indoor CO2 concentration for this category should not exceed the outdoor
concentration by 550 ppm. The category S3 shows that the room has acceptable
indoor air quality. The indoor CO2 concentration for this category should not exceed
the outdoor concentration by 800 ppm.
The results show that most of the time indoor air quality in the sample room 391 is
considered to be high. However, at the beginning of the monitoring, the indoor CO2
concentration exceeded the acceptable range. That means that the supply airflow
rate of the ventilation system maybe not enough for the higher occupancy.
Figure 28. The results of CO2 concentration monitoring on 08.11.2019 at 9:00-16:00 in room 391
0
200
400
600
800
1000
1200
1400
9:00
9:10
9:20
9:30
9:40
9:50
10:0
010
:10
10:2
010
:30
10:4
010
:50
11:0
011
:10
11:2
011
:30
11:4
011
:50
12:0
012
:10
12:2
012
:30
12:4
012
:50
13:0
013
:10
13:2
013
:30
13:4
013
:50
14:0
014
:10
14:2
014
:30
14:4
014
:50
15:0
015
:10
15:2
015
:30
15:4
015
:50
16:0
0
CO
2co
ncen
tratio
n, p
pm
Time of the day
CO2 CONCENTRATION MONITORING
Target value for S3 category = 1237 ppm
Target value for S2 category = 987 ppm
Target value for S1 category = 787 ppm
Average outside concentration = 437 ppm
40
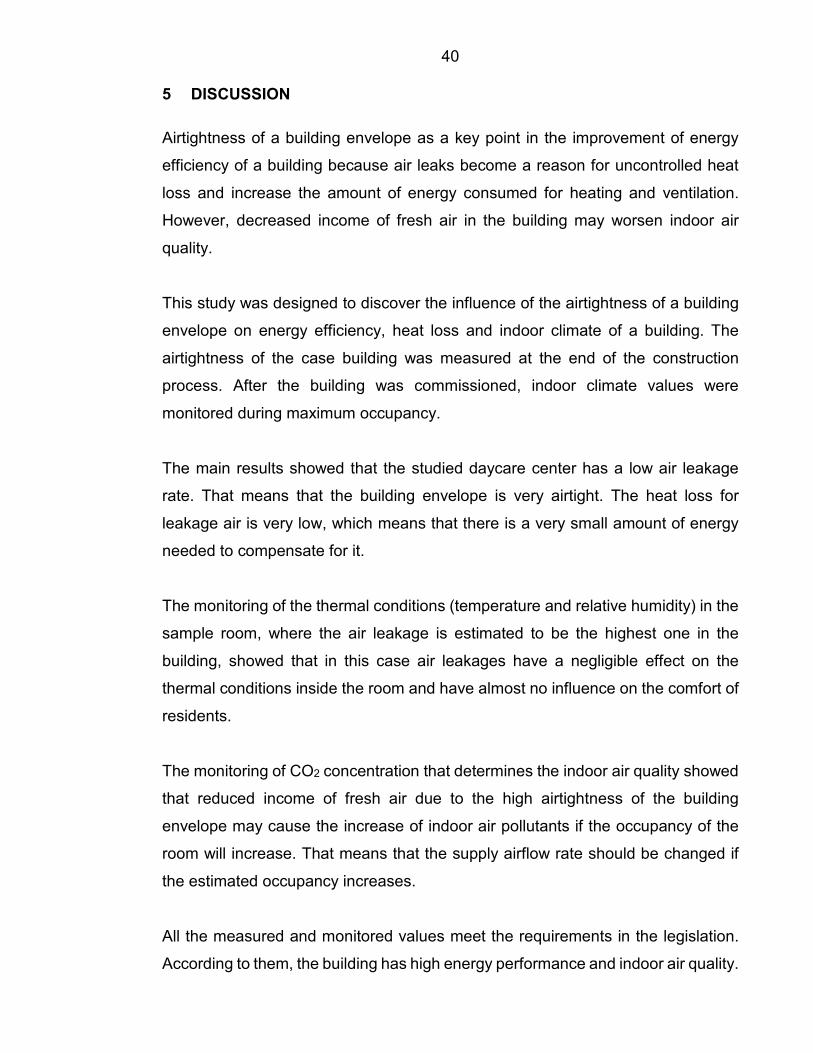
5 DISCUSSION
Airtightness of a building envelope as a key point in the improvement of energy
efficiency of a building because air leaks become a reason for uncontrolled heat
loss and increase the amount of energy consumed for heating and ventilation.
However, decreased income of fresh air in the building may worsen indoor air
quality.
This study was designed to discover the influence of the airtightness of a building
envelope on energy efficiency, heat loss and indoor climate of a building. The
airtightness of the case building was measured at the end of the construction
process. After the building was commissioned, indoor climate values were
monitored during maximum occupancy.
The main results showed that the studied daycare center has a low air leakage
rate. That means that the building envelope is very airtight. The heat loss for
leakage air is very low, which means that there is a very small amount of energy
needed to compensate for it.
The monitoring of the thermal conditions (temperature and relative humidity) in the
sample room, where the air leakage is estimated to be the highest one in the
building, showed that in this case air leakages have a negligible effect on the
thermal conditions inside the room and have almost no influence on the comfort of
residents.
The monitoring of CO2 concentration that determines the indoor air quality showed
that reduced income of fresh air due to the high airtightness of the building
envelope may cause the increase of indoor air pollutants if the occupancy of the
room will increase. That means that the supply airflow rate should be changed if
the estimated occupancy increases.
All the measured and monitored values meet the requirements in the legislation.
According to them, the building has high energy performance and indoor air quality.
41
However, the total energy class performance of the building cannot be estimated
only by air leakage rate.
Though the indoor climate and energy efficiency of the building meets all the
requirements, there are some suggestions. First of all, the outer door should be
closed by insulation or tape because according to figure 24 there is draught in
winter that may influence the comfort of occupants. It will also reduce the
air leakage rate.
To sum up, the studied building meets all the requirements of legislation in
Finland, however, there are some improvements that may be applied to
increase energy efficiency and indoor climate quality. The airtightness of a
building envelope should not be increased without increasing supply airflow rate
to create satisfactory indoor air quality.

42
REFERENCES
1. THERMAL IMAGING GUIDEBOOK FOR BUILDING AND RENEWABLE
ENERGY APPLICATIONS. 2011. FLIR Systems AB. WWW document.
Available at:
http://www.flirmedia.com/MMC/THG/Brochures/T820325/T820325_EN.pdf
[Accessed 15 November 2019].
2. BP Statistical Review of World Energy. 68th edition. Full report. BP magazine.
2019. WWW document. Available at:
https://www.bp.com/content/dam/bp/business-
sites/en/global/corporate/pdfs/energy-economics/statistical-review/bp-stats-
review-2019-full-report.pdf [Accessed 12 October 2019].
3. Energy performance of buildings. European Commission. 2014. WWW
document. Updated: 28.11.2019 Available at:
https://ec.europa.eu/energy/en/topics/energy-efficiency/energy-performance-
of-buildings/overview [Accessed 28 November 2019].
4. Decree of the Ministry of the Environment on energy Performance Certificate
of Buildings 1048/2017. 2017
5. Phase Change Composite Materials for Energy Efficient Building Envelopes.
WWW document. Available at:
https://www.seas.ucla.edu/~pilon/PCMIntro.html [Accessed 1 November
2019].
6. Decree of the Ministry of the Environment on the Energy Performance of New
Buildings. 2017.
7. Simon McGuinness. Airtightness - the sleeping giant of energy efficiency.
Passive House + magazine. 2015. WWW document. Available at:
https://passivehouseplus.ie/magazine/insight/airtightness-the-sleeping-giant-
of-energy-efficiency [Accessed 16 November 2019].
8. National Building Code of Finland, Part D5. Calculation of power and energy
needs for heating of buildings. 2012.
9. Sherman, M., Chan, R. Building Airtightness: Research and Practice.
Research Gate. 2004. WWW document. Available at:
https://www.researchgate.net/publication/238573993_Building_Airtightness_
Research_and_Practice [Accessed 1 November 2019].

43
10. Retrotec 5000 Blower Door with DM32 User Manual
11. Hunt, D. Technically Speaking: What the Blower Door Test Tells You.
Building performance institute. 2017. WWW document. Available at:
https://www.bpihomeowner.org/blog/technically-speaking-what-blower-door-
test-tells-you [Accessed 5 November 2019].
12. Blower door tests. Energy saver. WWW document. Available at:
https://www.energy.gov/energysaver/blower-door-tests [Accessed 7
November 2019].
13. Testing buildings for air leakage. CIBSE Technical Memoranda TM23. 2000.
WWW document. Available at
https://www.aivc.org/sites/default/files/airbase_13382.pdf [Accessed 13
December 2019].
14. Gradden, J. The PH+ guide to airtightness. PASSIVE HOUSE +. EJournal.
Available at: https://passivehouseplus.ie/magazine/guides/the-ph-guide-to-
airtightness [Accessed 17 November 2019].
15. RAKENNUKSEN LÄMPÖKUVAUS. Ohjekortissa käsitellään rakenteiden
lämpökuvausta rakennusten ja rakenteiden. 2016
16. Kraus, M., Kubeková, D. Airtightness of energy efficient buildings. Designing
building. 2017. Available at:
https://www.designingbuildings.co.uk/wiki/Airtightness_of_energy_efficient_b
uildings [Accessed 10 October 2019].
17. Bataille, E. Impact of low energy buildings on indoor air quality (IAQ). REHVA
Journal. EJournal. Available at: https://old-
rehva.webbaysolutions.com/fileadmin/hvac-dictio/05-2011/rj1105_p05-
8_impact-of-low-energy-buildings-on-iaq.pdf [Accessed 13 November 2019].
18. ISO 9972. Thermal performance of buildings — Determination of air
permeability of buildings — Fan pressurization method. 2015.
19. 5100 - Blower Door System. Available at: https://retrotec.com/ [Accessed 14
November 2019].
20. November 2019 Weather in Lahti — Graph. Available at:
https://www.timeanddate.com/weather/finland/lahti/historic?month=11&year=
2019 [Accessed 21 November 2019].
44
LIST OF FIGURES
Figure 1. Energy consumption by sector /5/ .......................................................... 7
Figure 2. A basic set of the equipment for blower door test /10, p. 1/ .................. 13
Figure 3. Calibrated blower door test /11/............................................................ 14
Figure 4. An example of a thermal image of a building made in the outside ....... 18
Figure 5. Diagram showing some of the potential main junctions and penetrations
in a building envelope, where good airtightness detailing and workmanship will be
required /14/ ........................................................................................................ 19
Figure 6. An example of a thermal image made in the created conditions of under
pressure inside the building to detect air leakage ................................................ 20
Figure 7. Relationship between air change rate and annual specific heating
demand and specific heat loss by ventilation /16/ ............................................... 21
Figure 8. Incoming fresh air repartition with humidity-controlled ventilation /17, p.
7/ ......................................................................................................................... 22
Figure 9. The investigated building of the daycare center ................................... 23
Figure 10. The location of the sample room 391 on the plan of the first floor ...... 25
Figure 11. The installed equipment Retrotec 6000 with DM32 WiFi digital
pressure gauge /19/ ............................................................................................ 26
Figure 12. Thermal camera FLIR E60 /1/ ............................................................ 26
Figure 13. The calibration process of TSI IAQ-CALC 7535 ................................. 27
Figure 14. –ebro– EBI 20 .................................................................................... 28
Figure 15. The location of blower door fan .......................................................... 29
Figure 16. Weather in Lahti on 08.11.2019 /20/ .................................................. 29
Figure 17. The location of –ebro– EBI 20 and TSI IAQ-CALC 7535 data loggers
during monitoring on the plan of the building ....................................................... 30
Figure 18. The location of –ebro– EBI 20 and TSI IAQ-CALC 7535 data loggers
during monitoring on the photo of the sample room 391 ..................................... 30
Figure 19. The location of –ebro– EBI 20 and TSI IAQ-CALC 7535 data loggers
during monitoring on the photo of the sample room 391 ..................................... 30
Figure 20. Air leakage curve created by the Retrotec software ........................... 33
Figure 21. Tightness measuring rating ................................................................ 34
Figure 22. The air leakage detected by the thermal imaging camera that is
caused by the outer door in the sample room 391 .............................................. 35

45
Figure 23. The air leakage detected by the thermal imaging camera that is
caused by the crack in the building envelope in the sample room 391 ................ 35
Figure 24. The outer door in the sample room 391 ............................................. 36
Figure 25. Leaking points detected by the thermal imaging camera FLIR E60 at
the created under pressure of 50 Pa inside the building ..................................... 36
Figure 26. The results of temperature monitoring on 08.11.2019 at 9:00-16:00 in
room 391 ............................................................................................................. 37
Figure 27. The results of relative humidity monitoring on 08.11.2019 at 9:00-
16:00 in room 391 ............................................................................................... 38
Figure 28. The results of CO2 concentration monitoring on 08.11.2019 at 9:00-
16:00 in room 391 ............................................................................................... 39
LIST OF TABLES
Table 1.The air leakage value of the building envelope and the building in Finland
/4, p. 10/ .............................................................................................................. 10
Table 2. The combined results of the blower door test ........................................ 32
Table 3. The series of test pressure and airflows of the fan ................................ 32
Viranomaisten arkistointimerkintöjä varten
PARMACO OyHaarlankatu 4 F (PL 50)
Puh. 020 734 001133231 TAMPERE
28.10.2018Tampere
Suunn/Piirt
Tiina Siren RA
KOORDINAATTIJÄRJESTELMÄ ETRS-GK26 KORKEUSJÄRJESTELMÄ N2000
ARK - 6318 - 002
1. kerros 1:100
49 2
KERINKALLION PÄIVÄKOTI, vaihe 2
Saarnikatu 215520 LAHTI
Kaupunginosa/Kylä Kortteli/Tila Tontti/Rnro
Rakennustoimenpide Piirustuslaji
Rakennuskohteen nimi ja osoite Piirustuksen sisältö
Juokseva nro
Mittakaava
KERINKALLIO (20)
Laajennus Pääpiirustus .
dB30
PT
dB30 dB30 dB30
PT
dB30
dB30 dB30
dB30
dB30
PT
dB30
, EI15
dB30
dB30
dB30
, EI15
PT,dB
30,E
I15
dB30
dB30dB30
dB30
PT
PT
dB30
dB30
dB30
dB30
PT
dB30
dB30 dB30
dB30
1
2
3
4
5
6
7
8
9
10
11
12
13
14
15
16
17
18
KKKK KK
KK
24
x 31
0 x
156
123456789
1011
12
1314151617181920212223
KKKK KK
KK
Luiska 1:12,5Leveys 1230Pituus 6000
Käsijohde
Luis
ka
1:10
Leve
ys 1
500
Pitu
us
6000
Teräsritilä
Luiska 1:12,5Leveys 1230Pituus 6000
Käsijohde
Teräsritilä
39 074 2 726
7 114
15 30
6
15 30
6
2. vaihe 1. vaihe
41 800
Vuoropäiväkoti
+108,800
+108,800
CC
DD
PL 1200
PL 1200
ST ST
ST ST ST
PL 1
200
RAKENNUKSEN PALOTEKNINEN LUOKKA P2
KOKO RAKENNUKSESSA SAMANAIKAISESTI MAX. 250 HENKILÖÄ
LEPOTILAT:Pintojen luokkavaatimukset B-s1,d0 ja lattioissa DFL-s1
vaihe 2: päiväkoti + yhdyskäytävä yhtKERROSALA 598,0 m² + 22,5 m² = 620,0 m²RAK.OIKEUDELLINEN KERROSALA 565,5 m² + 22,0 m² = 587,5 m²TILAVUUS 2300 m³ + 75 m³ = 2375 m³
HUONEISTOALA 528,5 m² + 17,0 m² = 545,5 m²
1.KRS
PL 1
200
Katkoviivoilla osoitetut kalusteet eivät kuulu urakkaan.
TOIMINTA-ALUE 8
TOIMINTA-ALUE 7
PPP+JS
PL 1200
ST
VAR
ATIE
VAR
ATIE
44 dB
44 d
B
44 dB
44 dB
44 d
B
IV-SÄLEIKKÖ
TOIMINTA-ALUE 9
TOIMINTA-ALUE 10
PL 1200
VAR
ATIE
VAR
ATIE
44 dB
44 d
B
44 dB
44 d
B
PL 1200
PL 1200
PL 1
200
ST ST
ST ST ST
PL 1
200
1.KRS
PL 1
200
PL 1200
PPP+JS
PL 1200
ST
KATOS
ST
Teräsritilä N 123E 400
ST
Käsijohde
VAR
ATIE
44 d
B
44 dB
44 d
B
IV-SÄLEIKKÖ
44 dB
ST
PL 1
200
44 d
B
PL 1200
44 d
B
44 d
B
44 dB
Käsi
johd
e
Käsi
johd
e
ST
ST
RAKENNUKSEN PALOTEKNINEN LUOKKA P2
KERROSALA 1196 m²RAK.OIKEUDELLINEN KERROSALA 1121.5 m²TILAVUUS 4550 m³HUONEISTOALA 1038,5 m²
PL 1200
IV-KONE
44 d
B
N 123E 400
ST
IV-SÄLEIKKÖ
44 d
B
KATOS
ST
Teräsritilä N 123E 400
ST
Käsijohde
N 123E 400
ST
PL 1
200
vaihe 1:
44 dB44 dB
ALAPOHJASTA
VESIKATTOON ASTI
EI30EI15
EI15
ALAPOHJA
STA
VESIKATTOON ASTI
EI30
Henkilömäärä yöaikaan:- enintään 10 lasta- henkilökuntaa 1-2, lasten iästä riippuen
(varhaiskasvatuksen ohjeistuksen mukaan)
373 WC 9,5 m2
383 WC 9,5 m2
313 WC 9,5 m2
393 WC 9,5 m2
113 WC 9,5 m2
123 WC 9,5 m2
344 KÄYTÄVÄ 36,5 m2
345 KÄYTÄVÄ 23,0 m2
144 KÄYTÄVÄ 23,0 m2
146 KÄYTÄVÄ 23,0 m2
370 TOIMINTATILA 34,0 m2
371 TOIM.TILA/LEPO 32,0 m2
341 TEKN.TILA 22,0 m2
372 TOIMINTATILA 12,0 m2
343 MÄRKÄET. 31,0 m2
342 MÄRKÄET. 31,5 m2
380 TOIMINTATILA 34,0 m2
381 TOIM.TILA/LEPO 32,0 m2
382 TOIMINTATILA 12,0 m2
347 YHD.KÄYT. 17,0 m2
333 INVA/HK-WC 5,5 m2
310 TOIMINTATILA 34,0 m2
311 TOIM.TILA/LEPO 32,0 m2
312 TOIMINTATILA 12,0 m2
390 TOIMINTATILA 34,0 m2
391 TOIM.TILA/LEPO 46,0 m2
392 TOIMINTATILA 12,0 m2
132 KUUMENNUSKEITTIÖ 46,5 m2
110 TOIMINTATILA 34,0 m2
111 TOIM.TILA/LEPO 32,0 m2
141 TEKN.TILA 22,0 m2
112 TOIMINTATILA 12,0 m2
KUUMENNUSK.TILAT YHT. 54,5 m2
131 KUIVAVAR. 3,5 m2
130 TK 3,5 m2
143 MÄRKÄET. 31,0 m2
142 MÄRKÄET. 31,0 m2
120 TOIMINTATILA 34,0 m2
121 TOIM.TILA/LEPO 46,0 m2
133 INVA/HK-WC 5,5 m2
140 PORRASH 22,0 m2
136 HISSI 3,0 m2
157 WC 4,5 m2
151 TOIMISTO 11,5 m2
155 PUKUH/N 22,5 m2
154 WC/Keittiö 2,5 m2
156 S+WC 3,0 m2
150 TAUKOTILA 47,5 m2
153 PUKUH/M 3,5 m2
152 S+WC 3,5 m2
122 MÄRKÄET. 11,5 m2
158IV-LAITETILA1,5 m2
PT
PT
PT
PT E
I15
PT
PT
PT
PT
39 015
pääm
itta 8
192
pääm
itta 7
114
+108,165
Teräsritilä
N 123E 400
TALOTIKAS(Alas kiipeilynesto)
Terä
sriti
lä
TALOTIKAS(Alas kiipeilynesto)
Teräsritilä
N 123E 400
KATOS
N 1
23E
400
EI15
EI15
LATT
IA JA
KAT
TO
334 SIIV / VAAT.H. 15,5 m2
134 SIIV / VAAT.H. 16,0 m2
135 TEKN. 7,5 m2
RULL.V 3,5 m2
05.08.2019 TSi Osoitettu vuoropäiväkotina käytettävät tilat ja määritelty henkilömäärä
04.07.2019 TSi Päiväkodin yksikerroksinen osuus muutettu vuoropäiväkodiksi- 1-kerroksisen osuuden pääty osastoitu EI30- lepotilat erotettu EI15-rakennusosin- pintojen luokkavaatimukset esitetty
Appendix 1

Viranomaisten arkistointimerkintöjä varten
PARMACO OyHaarlankatu 4 F (PL 50)
Puh. 020 734 001133231 TAMPERE
28.10.2018Tampere
Suunn/Piirt
Tiina Siren RA
KOORDINAATTIJÄRJESTELMÄ ETRS-GK26 KORKEUSJÄRJESTELMÄ N2000
ARK - 6318 - 005
Leikkaus 1:100
49 2
KERINKALLION PÄIVÄKOTI, vaihe 2
Saarnikatu 215520 LAHTI
Kaupunginosa/Kylä Kortteli/Tila Tontti/Rnro
Rakennustoimenpide Piirustuslaji
Rakennuskohteen nimi ja osoite Piirustuksen sisältö
Juokseva nro
Mittakaava
KERINKALLIO (20)
Laajennus Pääpiirustus .
+113,800
+112,724+112,547
+108,800
+108,457
715
1 585
+108,800
YP1
AP1
US1 VS3VS4
8°
PERUSTUKSET, SALAOJAT JA ROUTASUOJAUS ERIKOISSUUNNITELMIEN MUKAAN
RYÖMINTÄTILAMIN. 800 mm
LEIKKAUS C - C
YLÄPOHJA (YP1) EI30, RISTIKOT R30 u<0.09 W/m² KB-s1,d0
VESIKATE PROFIILIPELTIVESIKATTORUOTEET k300 25x100 mmALUSKATERIMA 25x50 mmALUSKATENAULALEVYRISTIKKO R30+ PUHALLUSVILLA 120 mm+ PALAMATON MINERAALIVILLA 250 mmPALOKIPSILEVY 15 mmPUURUNKO 42x98 mm+ MINERAALIVILLA 100 mmHÖYRYNSULKUMUOVI SFS 4225KOOLAUS k300 mm 23x120 mmAKUSTO-/KIPSILEVY 13 mm
ULKOSEINÄ (US1) u<0.17 W/m² K (osastoiva seinä EI30)B-s1,d0
KIPSILEVY EK 13 mmHÖYRYNSULKUMUOVI SFS 4225PYSTYRUNKO 48x248 mm+ PALAMATON KIVIVILLA 250 mmTUULENSUOJAKIPSILEVY 9 mmPYSTYKOOLAUS 30x100 mmPANELOINTI VAAKA 23*175 mm
ALAPOHJA (AP1) u<0.16 W/m² KDFL-s1
MUOVIMATTOPONTATTU LASTULEVY 22 mm(KOSTEISSA TILOISSA VANERI)HARVALAUTA 23x100/LATTIALÄMMITYS 23 mmLATTIAPALKIT KERTOPUU k400 mm 45x270 mm+ PALAMATON KIVIVILLA 270 mmKUITUSEMENTTILEVY (tuulens.) 9 mmSUOJALAUDAT 19x100 mm k400 mm 19 mmPAINEKYLLÄSTETTYÄ PUUTA
IKKUNAT JA OVET u =1,0 W/m²K
RAKENNUKSEN PALOLUOKKA P2
ALAPOHJA (VÄLIKKÖ) u<0.16 W/m² K
MUOVIMATTOPONTATTU LASTULEVY 22 mm(KOSTEISSA TILOISSA VANERI)LATTIAPALKIT KERTOPUU k400 mm 45x270 mm+ PALAMATON KIVIVILLA 270 mmKUITUSEMENTTILEVY (tuulens.) 9 mmSUOJALAUDAT (19+23)x100 mm k400 mm 19+23 mmPAINEKYLLÄSTETTYÄ PUUTA
VÄLISEINÄ (VS1) 44 dB(viipaleväliseinä)
KIPSILEVY EK 13 mmPUURUNKO 42x66 mm 66 mm+ PALAMATON KIVIVILLA 70 mm
HOMESUOJATTU VANERI 6.5 mmILMARAKO (elementtisauma) 37 mm HOMESUOJATTU VANERI 6.5 mmPUURUNKO 42x66 mm 66 mm+ PALAMATON KIVIVILLA 70 mm
KIPSILEVY EK 13 mm
VÄLISEINÄ (VS2) B-s1,d0 (osastoiva seinä EI15)(huoneiden välinen ei-kantava seinä)
KIPSILEVY EK 13 mmKIPSILEVY N 13 mmVANERI 12 mmPUURUNKO 42x98 mm 98 mm+ MINERAALIVILLA 100 mm
VANERI 12 mmKIPSILEVY N 13 mmKIPSILEVY EK 13 mm
VÄLISEINÄ (VS3) 44 dB/ R30 B-s1,d0(kantava väliseinä)
KIPSILEVY EK 13 mmKIPSILEVY N 13 mmPUURUNKO 48x123 mm 123 mm+ MINERAALIVILLA 125 mm
KIPSILEVY N 13 mmKIPSILEVY EK 13 mm
VÄLISEINÄ (VS4) 44 dB/ R30 B-s1,d0(kantava väliseinä, jossa jakotukit)
KIPSILEVY EK 13 mmKIPSILEVY N 13 mmPUURUNKO 48x148 mm 148 mm+ MINERAALIVILLA 125 mm
KIPSILEVY N 13 mmKIPSILEVY EK 13 mm
VÄLISEINÄ (VS5)(kevyt väliseinä)
KIPSILEVY EK 13 mmPUURUNKO 42x66 mm 66 mm+ MINERAALIVILLA 70 mm
KIPSILEVY EK 13 mm
2 51
0
PERUSTUKSET, SALAOJAT JA ROUTASUOJAUS ERIKOISSUUNNITELMIEN MUKAAN
8°
8°
14,04°
LEIKKAUS D - D
04.07.2019 TSi Päiväkodin yksikerroksinen osuus muutettu vuoropäiväkodiksiRakennetyyppeihin merkitty: US osastointi EI30, VS osastointi EI15,rakenteiden pintaluokat
Appendix 2

040-7075474 [email protected]
05.07.2019
ILMATIIVIYDEN TESTIRAPORTTI Noudattaa standardia ISO 9972
Kohteen tiedot
Rakennuksen osoite: Kerinkallionkatu 6 Lahti, 15520 Testaaja: Jouni Haimilahti Yritys: Caverion Suomi Oy
Rakennuksen tilavuus: 0 Vaipan kokonaispinta-ala: 1 474,7 Rakennuksen tuulialttius: Osin suojattu rakennus Rakennuksen mittojen virhe: 0%
Laitteisto - Puhallin: Retrotec 6000 , SN: - Painemittari: DM32 , SN: 408681
Tulos q50 = 0,796 m3/hm2
Yhdistetyt tulokset Arvo Vaihteluväli Epävarmuus
Ilmavirtaus 50 Pa, V50 [m3/h] 1174,0 1146,5 1202,5 +/-2,4%
Ilmanvuotoluku N50 [1/h]
Ilmanvuotoluku q50 [m3/hm2] 0,796 0,771 0,821 +/-3,1%
Lisätiedot: Laitteisto oli asennettuna valmiiseen pääoveen.
Appendix 3

040-7075474 [email protected]
ALIPAINE
Mittaustulokset Päiväys: 2019-07-03 Olosuhteet: Ilmanpaine: 100,2 KPa. Tuulen nopeus: 4: Kohtalainen tuuli
Lämpötilat: Alussa: sisällä 21,8 , ulkona 14,6. Lopussa: sisällä 21,8 , ulkona 14,6.
Vallitseva paine alussa[Pa]
-0,06 -0,48 -0,66 0,12 0,0
Testipaine [Pa] -9,2 -16,2 -22,4 -28,0 -33,1 -40,0 -46,5 -51,1 -58,6 -63,7
Vallitseva paine lopussa [Pa]
-3,66 -3,66 -2,38 0,14 0,56
Puhallinpaine[Pa]
Virtaus, Vr [m3/h] 323,262
492,004
624,876
768,449
875,158
1051,59
1108,49
1192,82
1284,17
1405,01
Korjattu virtaus, Venv [m3/h]
317,44 483,15 613,63 754,62 859,41 1032,7 1088,5 1171,4 1261,1 1379,7
Virhe [%] 1,0% -1,9% -2,7% 0,7% 1,2% 5,6% -0,5% -0,2% -2,9% -0,1%
Vallitsevan paineen keskiarvot: alussa [Pa] ∆P01 -0,22, ∆P01- -0,40, ∆P01+ 0,06 , lopussa [Pa] ∆P01 -1,80, ∆P01- -3,23, ∆P01+ 0,35
tulokset 95% varmuus epävarmuus
Ilmavirtaus 50 Pa, V50 [m3/h]
1174,2 1146 1203 +/-2,4%
Ilmanvuotoluku 50 Pa, n50
[1/h]
Ilmanvuotoluku 50 Pa, q50 [m3/h.m2]
0,7962 0,771 0,821 +/-3,1%
Ominaisvuoto 50 Pa, w50 [m3/h.m2]
2,0488 1,9849 2,1127 +/-3,1%
Ilmavuotokäyrä
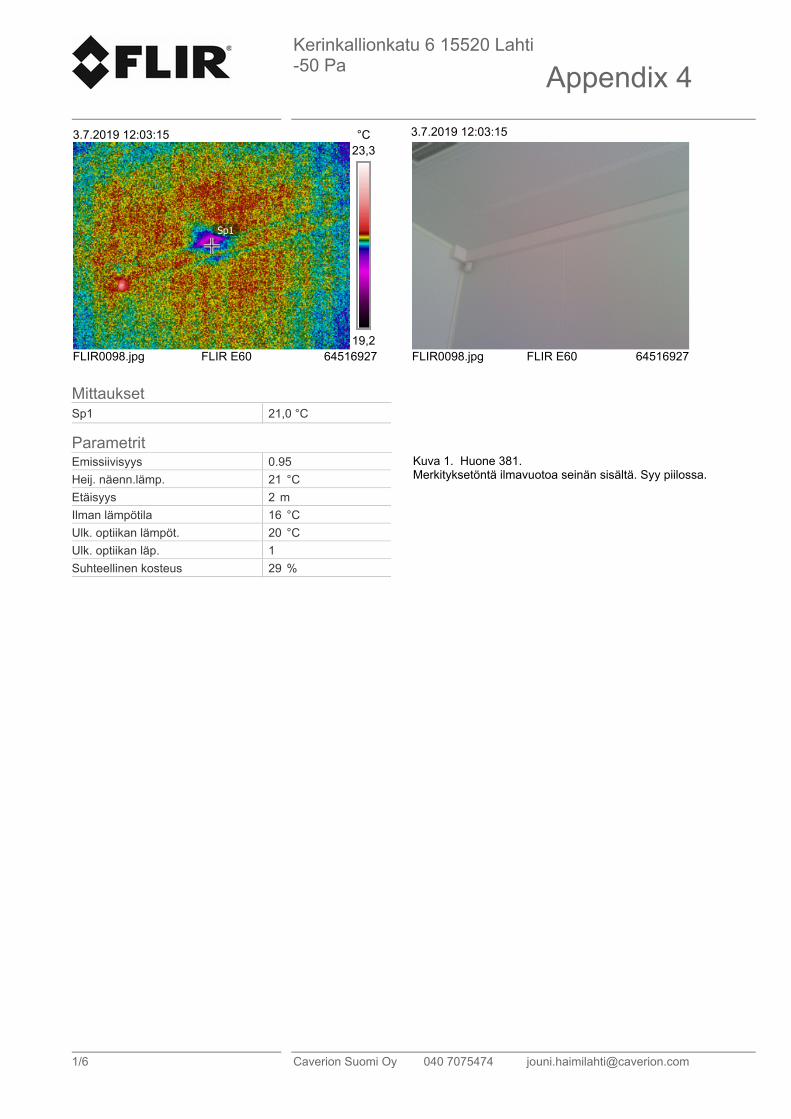
Kerinkallionkatu 6 15520 Lahti-50 Pa
1/6 Caverion Suomi Oy 040 7075474 [email protected]
3.7.2019 12:03:15 °C
Sp1
23,3
19,2FLIR0098.jpg FLIR E60 64516927
MittauksetSp1 21,0 °C
ParametritEmissiivisyys 0.95
Heij. näenn.lämp. 21 °C
Etäisyys 2 m
Ilman lämpötila 16 °C
Ulk. optiikan lämpöt. 20 °C
Ulk. optiikan läp. 1
Suhteellinen kosteus 29 %
3.7.2019 12:03:15
FLIR0098.jpg FLIR E60 64516927
Kuva 1. Huone 381. Merkityksetöntä ilmavuotoa seinän sisältä. Syy piilossa.
Appendix 4
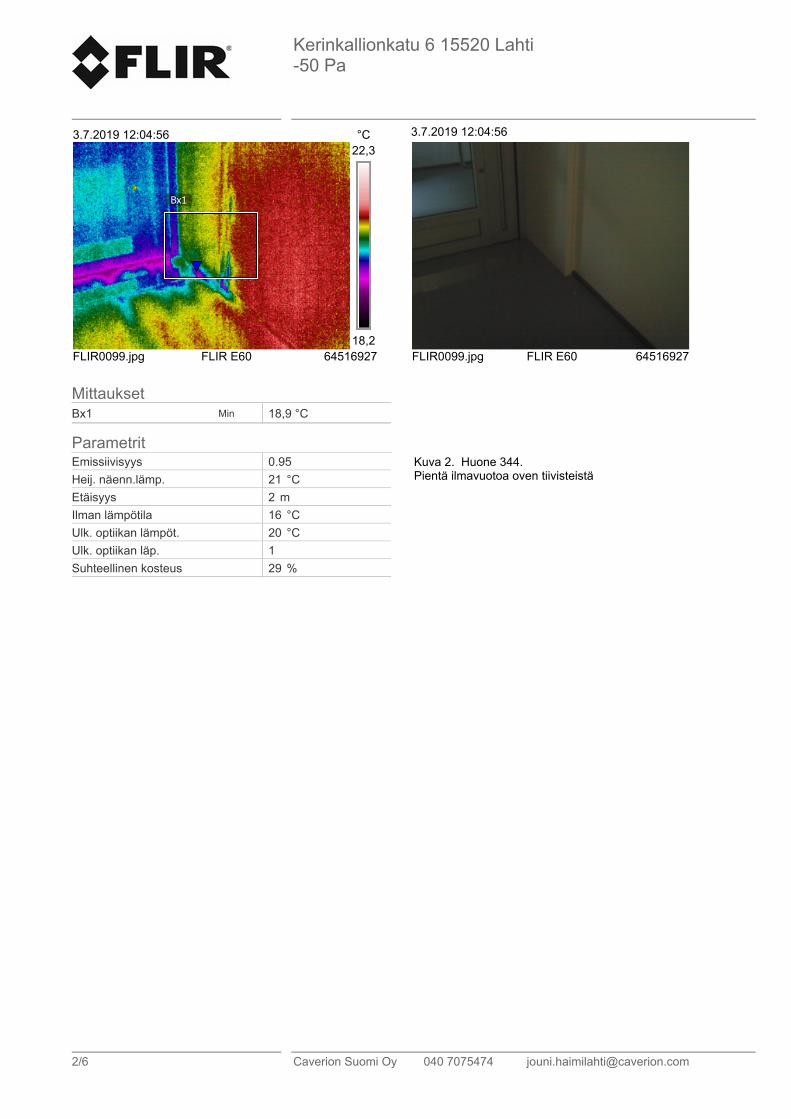
Kerinkallionkatu 6 15520 Lahti-50 Pa
2/6 Caverion Suomi Oy 040 7075474 [email protected]
3.7.2019 12:04:56 °C
Bx1
22,3
18,2FLIR0099.jpg FLIR E60 64516927
MittauksetBx1 Min 18,9 °C
ParametritEmissiivisyys 0.95
Heij. näenn.lämp. 21 °C
Etäisyys 2 m
Ilman lämpötila 16 °C
Ulk. optiikan lämpöt. 20 °C
Ulk. optiikan läp. 1
Suhteellinen kosteus 29 %
3.7.2019 12:04:56
FLIR0099.jpg FLIR E60 64516927
Kuva 2. Huone 344. Pientä ilmavuotoa oven tiivisteistä

Kerinkallionkatu 6 15520 Lahti-50 Pa
3/6 Caverion Suomi Oy 040 7075474 [email protected]
3.7.2019 12:06:35 °C
Bx1
22,7
18,7FLIR0100.jpg FLIR E60 64516927
MittauksetBx1 Min 19,6 °C
ParametritEmissiivisyys 0.95
Heij. näenn.lämp. 21 °C
Etäisyys 2 m
Ilman lämpötila 16 °C
Ulk. optiikan lämpöt. 20 °C
Ulk. optiikan läp. 1
Suhteellinen kosteus 29 %
3.7.2019 12:06:35
FLIR0100.jpg FLIR E60 64516927
Kuva 3. Huone 371. Merkityksetöntä ilmavuotoa seinän sisältä. Syy piilossa.

Kerinkallionkatu 6 15520 Lahti-50 Pa
4/6 Caverion Suomi Oy 040 7075474 [email protected]
3.7.2019 12:13:07 °C
Bx1
22,8
18,7FLIR0101.jpg FLIR E60 64516927
MittauksetBx1 Min 19,0 °C
ParametritEmissiivisyys 0.95
Heij. näenn.lämp. 21 °C
Etäisyys 2 m
Ilman lämpötila 16 °C
Ulk. optiikan lämpöt. 20 °C
Ulk. optiikan läp. 1
Suhteellinen kosteus 29 %
3.7.2019 12:13:07
FLIR0101.jpg FLIR E60 64516927
Kuva 4. Huone 311. Merkityksetöntä ilmavuotoa seinän sisältä. Syy piilossa.
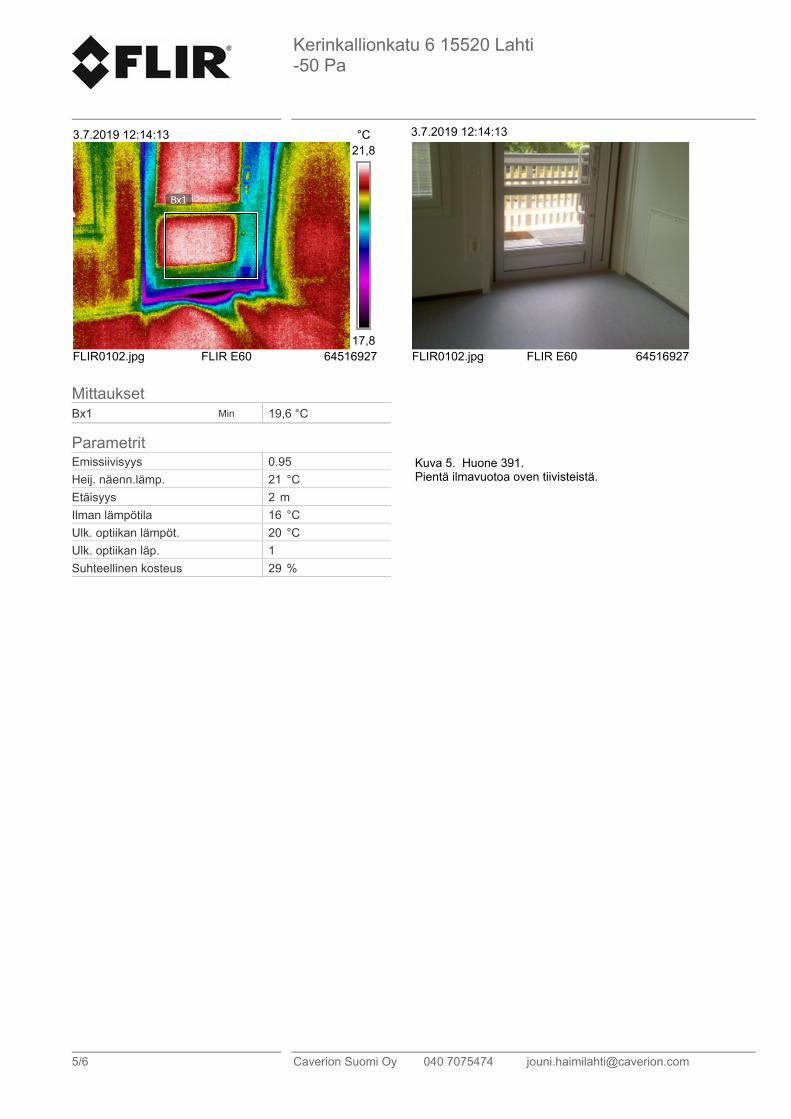
Kerinkallionkatu 6 15520 Lahti-50 Pa
5/6 Caverion Suomi Oy 040 7075474 [email protected]
3.7.2019 12:14:13 °C
Bx1
21,8
17,8FLIR0102.jpg FLIR E60 64516927
MittauksetBx1 Min 19,6 °C
ParametritEmissiivisyys 0.95
Heij. näenn.lämp. 21 °C
Etäisyys 2 m
Ilman lämpötila 16 °C
Ulk. optiikan lämpöt. 20 °C
Ulk. optiikan läp. 1
Suhteellinen kosteus 29 %
3.7.2019 12:14:13
FLIR0102.jpg FLIR E60 64516927
Kuva 5. Huone 391. Pientä ilmavuotoa oven tiivisteistä.

Kerinkallionkatu 6 15520 Lahti-50 Pa
6/6 Caverion Suomi Oy 040 7075474 [email protected]
3.7.2019 12:15:10 °C
Bx1
23,2
19,2FLIR0103.jpg FLIR E60 64516927
MittauksetBx1 Min 19,7 °C
ParametritEmissiivisyys 0.95
Heij. näenn.lämp. 21 °C
Etäisyys 2 m
Ilman lämpötila 16 °C
Ulk. optiikan lämpöt. 20 °C
Ulk. optiikan läp. 1
Suhteellinen kosteus 29 %
3.7.2019 12:15:10
FLIR0103.jpg FLIR E60 64516927
Kuva 6. Huone 391. Merkityksetöntä ilmavuotoa seinän sisältä. Syy piilossa.