Airport Noise Management Report 1st Quarter 2017 · Airport Noise Management Report 1st Quarter...
10
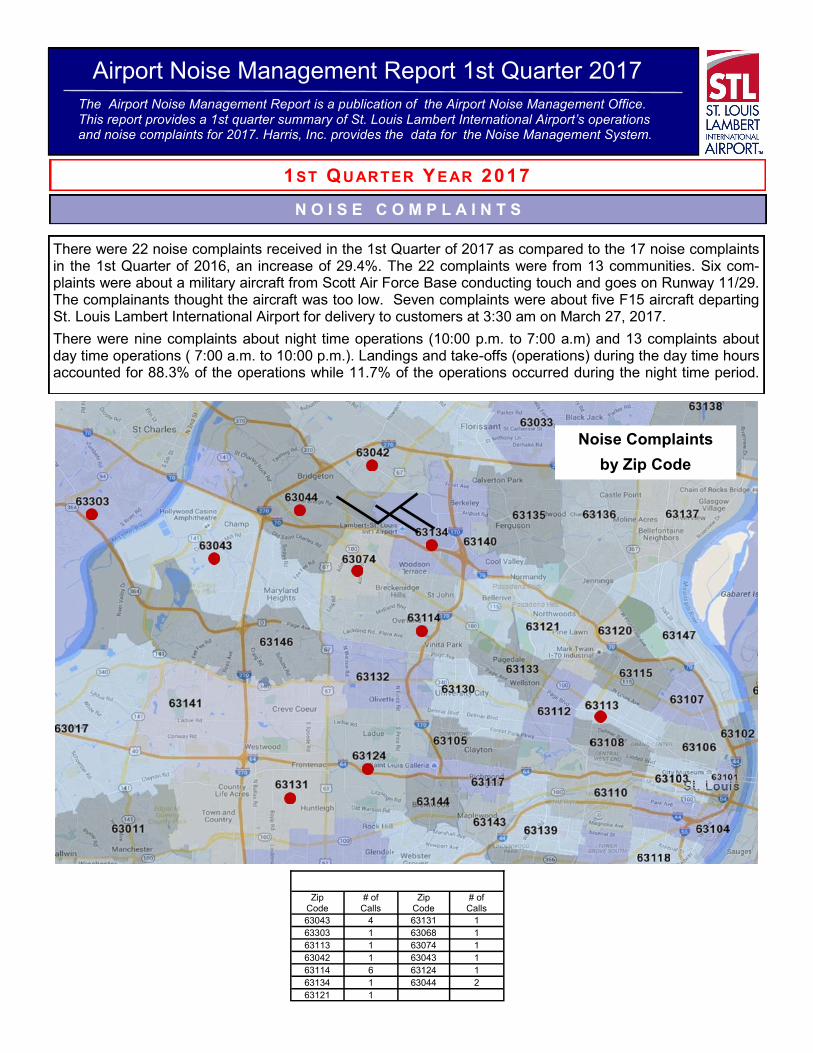
Airport Noise Management Report 1st Quarter 2017 The Airport Noise Management Report is a publication of the Airport Noise Management Office. This report provides a 1st quarter summary of St. Louis Lambert International Airport’s operations and noise complaints for 2017. Harris, Inc. provides the data for the Noise Management System. 1 ST Q UARTER Y EAR 2017 There were 22 noise complaints received in the 1st Quarter of 2017 as compared to the 17 noise complaints in the 1st Quarter of 2016, an increase of 29.4%. The 22 complaints were from 13 communities. Six com- plaints were about a military aircraft from Scott Air Force Base conducting touch and goes on Runway 11/29. The complainants thought the aircraft was too low. Seven complaints were about five F15 aircraft departing St. Louis Lambert International Airport for delivery to customers at 3:30 am on March 27, 2017. There were nine complaints about night time operations (10:00 p.m. to 7:00 a.m) and 13 complaints about day time operations ( 7:00 a.m. to 10:00 p.m.). Landings and take-offs (operations) during the day time hours accounted for 88.3% of the operations while 11.7% of the operations occurred during the night time period. N O I S E C O M P L A I N T S Noise Complaints by Zip Code Zip Code # of Calls Zip Code # of Calls 63043 4 63131 1 63303 1 63068 1 63113 1 63074 1 63042 1 63043 1 63114 6 63124 1 63134 1 63044 2 63121 1
Transcript of Airport Noise Management Report 1st Quarter 2017 · Airport Noise Management Report 1st Quarter...
Airport Noise Management Report 1st Quarter 2017
The Airport Noise Management Report is a publication of the Airport Noise Management Office. This report provides a 1st quarter summary of St. Louis Lambert International Airport’s operations and noise complaints for 2017. Harris, Inc. provides the data for the Noise Management System.
1ST QUARTER YEAR 2017
There were 22 noise complaints received in the 1st Quarter of 2017 as compared to the 17 noise complaints in the 1st Quarter of 2016, an increase of 29.4%. The 22 complaints were from 13 communities. Six com-plaints were about a military aircraft from Scott Air Force Base conducting touch and goes on Runway 11/29. The complainants thought the aircraft was too low. Seven complaints were about five F15 aircraft departing St. Louis Lambert International Airport for delivery to customers at 3:30 am on March 27, 2017.
There were nine complaints about night time operations (10:00 p.m. to 7:00 a.m) and 13 complaints about day time operations ( 7:00 a.m. to 10:00 p.m.). Landings and take-offs (operations) during the day time hours accounted for 88.3% of the operations while 11.7% of the operations occurred during the night time period.
N O I S E C O M P L A I N T S
Noise Complaints
by Zip Code
Zip Code
# of Calls
Zip Code
# of Calls
63043 4 63131 1 63303 1 63068 1 63113 1 63074 1 63042 1 63043 1 63114 6 63124 1 63134 1 63044 2 63121 1
Airport Noise Management Report 1st Quarter 2017 Page 2
N O I S E M O N I T O R I N G D A T A
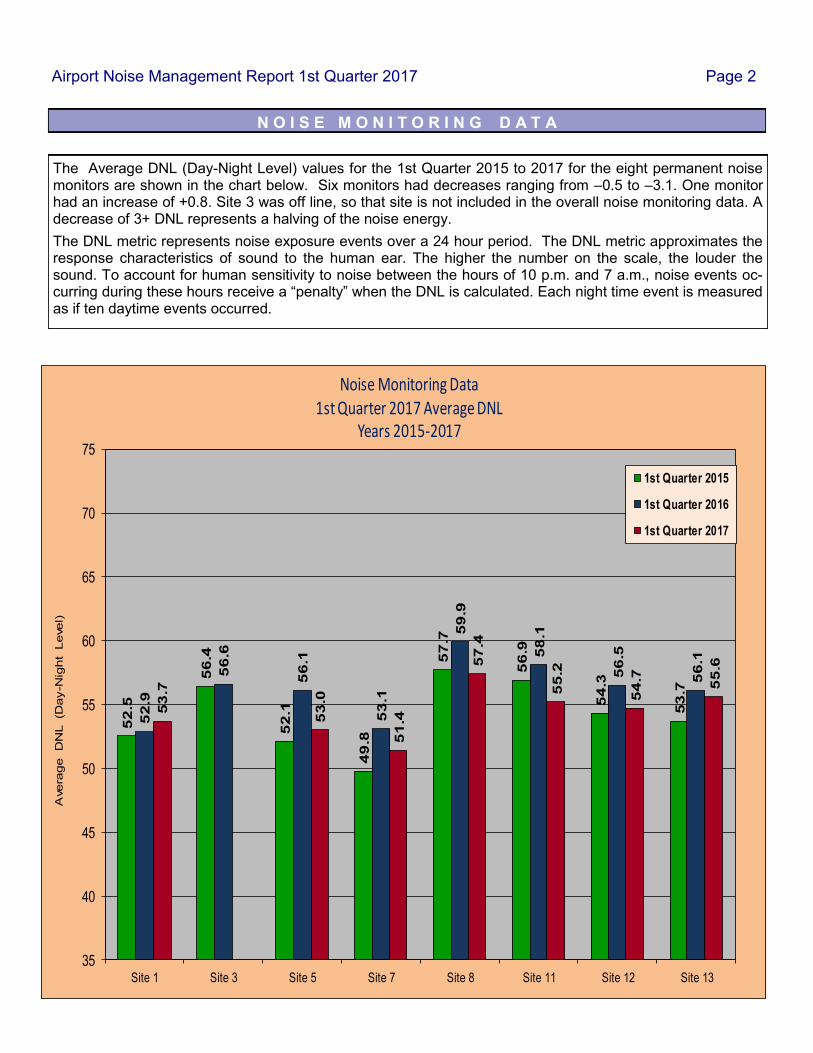
The Average DNL (Day-Night Level) values for the 1st Quarter 2015 to 2017 for the eight permanent noise monitors are shown in the chart below. Six monitors had decreases ranging from –0.5 to –3.1. One monitor had an increase of +0.8. Site 3 was off line, so that site is not included in the overall noise monitoring data. A decrease of 3+ DNL represents a halving of the noise energy.
The DNL metric represents noise exposure events over a 24 hour period. The DNL metric approximates the response characteristics of sound to the human ear. The higher the number on the scale, the louder the sound. To account for human sensitivity to noise between the hours of 10 p.m. and 7 a.m., noise events oc-curring during these hours receive a “penalty” when the DNL is calculated. Each night time event is measured as if ten daytime events occurred.
52
.5
56
.4
52
.1
49
.8
57
.7
56
.9
54
.3
53
.7
52
.9
56
.6
56
.1
53
.1
59
.9
58
.1
56
.5
56
.1
53
.7
53
.0
51
.4
57
.4
55
.2
54
.7
55
.6
35
40
45
50
55
60
65
70
75
Site 1 Site 3 Site 5 Site 7 Site 8 Site 11 Site 12 Site 13
Avera
ge D
NL (D
ay-N
ight
Level)
Noise Monitoring Data1st Quarter 2017 Average DNL
Years 2015-2017
1st Quarter 2015
1st Quarter 2016
1st Quarter 2017

Airport Noise Management Report 1st Quarter 2017 Page 3
The Permanent Noise Monitoring Sites (NMS) are : Site 1- Benedetta, City of Bridgeton; Site 3- Ferguson Lane, Bridgeton Athletic Complex; Site 5-Villa Rosa & Auriesville, City of Hazelwood; Site 7-Belfore & Logan-berry, City of Bel-Ridge; Site 8- Emerling, City of Cool Valley; Site 11-North Hills & Country Club, Village of Pasadena Park; Site 12-Belwood & Kirkland, City of Normandy; and, Site 13-North Hills & Brotherton, City of Ferguson. The runways at St. Louis Lambert International Airport are: 12R/30L (11,019’x200’), 12L/30R (9,003’x150’), 11/29 (9,001’x150’), and 6/24 (7,607’x150’).
NOISE MONITORING LOCATIONS AND RUNWAY IDENTIFICATION
Site 5
Site 13
Site 7
Site 8
Site 12
Site 11
Site 3
Site 1
N O I S E M O N I T O R I N G S I T E S

O P E R A T I O N S B Y R U N W A Y
Airport Noise Management Report 1st Quarter 2017 Page 4
There were 45,809 operations recorded in the 1st Quarter of 2017 as compared to 44,709 operations in the 1st Quarter of 2016, an increase of +2.5%. The most utilized runway for known arrivals was Runway 30R (11,046) with 24.1% all operations. The most utilized runway for known departures was Runway 30L (9,940) with 21.7% of all operations. There were 45,447 (99.2%) operations in which the runway was identified and 362 operations (0.8%) where the runways were not identified.
11,046
9,940
8,532
7,158
2,540
1,248
1,220
994
939
694
685
289
260
102
88
34
21
19
0 3,000 6,000 9,000 12,000 15,000
30R ARR
30L DEP
12L DEP
12R ARR
29 DEP
11 ARR
30L ARR
12L ARR
12R DEP
24 ARR
30R DEP
29 ARR
UNK DEP
UNK ARR
24 DEP
11 DEP
6 DEP
6 ARR
ARR = ArrivalsDEP = Departures
Operations by Runway1st Quarter 2017
45,447 Operations with runway identified45,809 Total Operations

Airport Noise Management Report 1st Quarter 2017 Page 5
O P E R A T I O N S B Y A I R L I N E
The top twenty airlines accounted for 91.2% of all operations. The top three airlines were Southwest Airlines with 37.4% of all operations, followed by Cape Air (9.8%), and American (8.9%). Eleven regional commercial passenger jet airlines that serve St. Louis Lambert International Airport were in the top twenty airlines and accounted for 21.7% of the 1st Quarter operations. There were 59 Part 121 and Part 135 airlines that utilized St. Louis Lambert International Airport during this period. Part 121 airlines are commercial scheduled airlines
and Part 135 airlines are charter and air taxi.
17,155
4,499
4,059
2,008
2,004
1,873
1,789
1,754
1,230
943
722
663
574
461
436
404
302
299
297
296
0 5,000 10,000 15,000 20,000
Southwest
Cape Air
American
Air Choice One
Delta
ExpressJet (1)
Trans States (2)
GoJet (3)
Sky West (4)
Frontier
Endeavor (5)
Republic (6)
Netjets
PSA Airlines (7)
Air Wisconsin (8)
Envoy (9)
Mesa Airlines (10)
Air Georgian (11)
Alaska Airlines
Gamma Charter
Operations By Airline1st Quarter 2017
Top Twenty Airlines Are ShownThis represents 91.2% of all operations (45,809)
1. Operated as United connection.2. Operated as United and American connection.3. Operated as Delta and United connection.4. Operated as Alaska, Delta, and United connection.5. Operated as Delta connection.6. Operated as American and United connection.7. Operated as American connection.8. Operated as American connection.9. Operated as American connection10. Operated as United and American connection.11. Operated as Air Canada Express connection
Airport Noise Management Report 1st Quarter 2017 Page 6
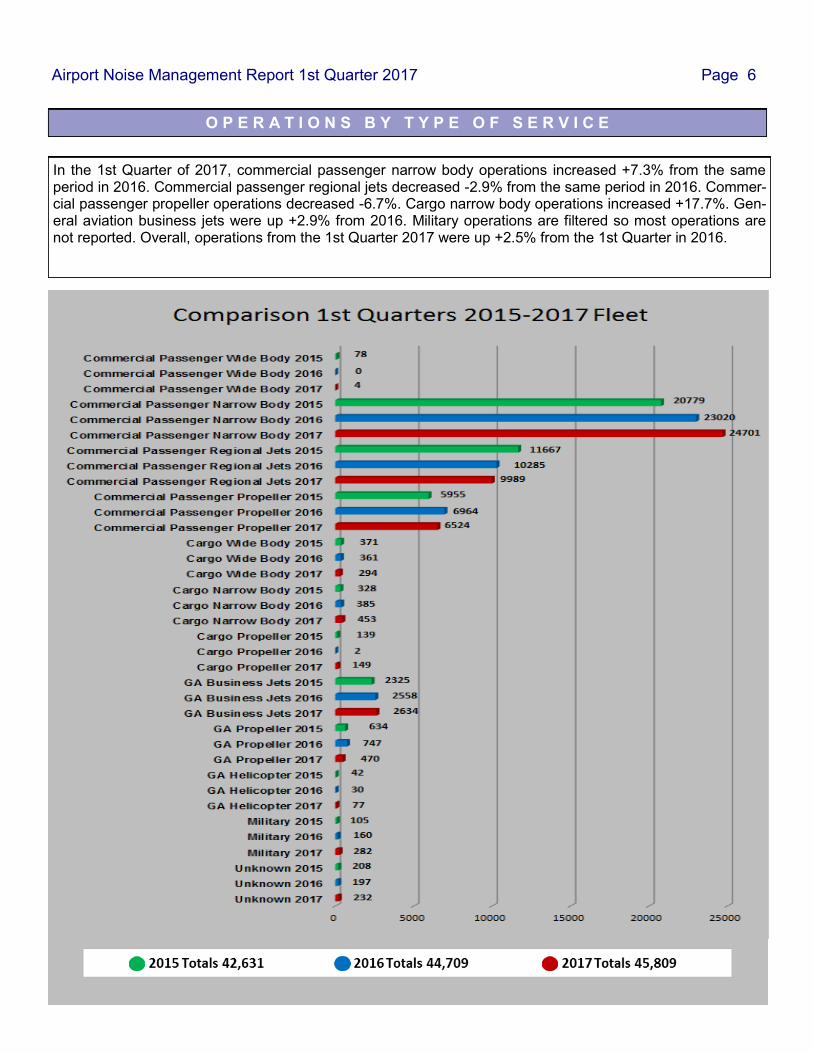
O P E R A T I O N S B Y T Y P E O F S E R V I C E
In the 1st Quarter of 2017, commercial passenger narrow body operations increased +7.3% from the same period in 2016. Commercial passenger regional jets decreased -2.9% from the same period in 2016. Commer-cial passenger propeller operations decreased -6.7%. Cargo narrow body operations increased +17.7%. Gen-eral aviation business jets were up +2.9% from 2016. Military operations are filtered so most operations are not reported. Overall, operations from the 1st Quarter 2017 were up +2.5% from the 1st Quarter in 2016.

Airport Noise Management Report 1st Quarter 2017 Page 7
O P E R A T I O N S B Y T Y P E O F S E R V I C E
Commercial Passenger, Commercial Cargo, General Aviation, Military, and Unknown Operations are the five categories of operations. The Unknown Operations category include aircraft that were not identified by either the airline or aircraft equipment type, or both. The largest number of operations was Commercial Passen-gers with 89.9% . General Aviation was at 6.9%, Commercial Cargo had 1.9%, and the Unknown category represented 0.5% of the total operations. Reported Military operations were at 0.6%, however, military op-erations are filtered and not all military operations are reported in the data.
Commercial Passenger
41,218 Operations (89.9%)
Commercial Cargo 896 Operations (1.9%)
General Aviation3,181 Operations
(6.9%)
Unknown232 Operations (0.5%)
Military282 Operations
(0.6%)
Operations by Type of Service1st Quarter 2017
Airport Noise Management Report 1st Quarter 2017 Page 8
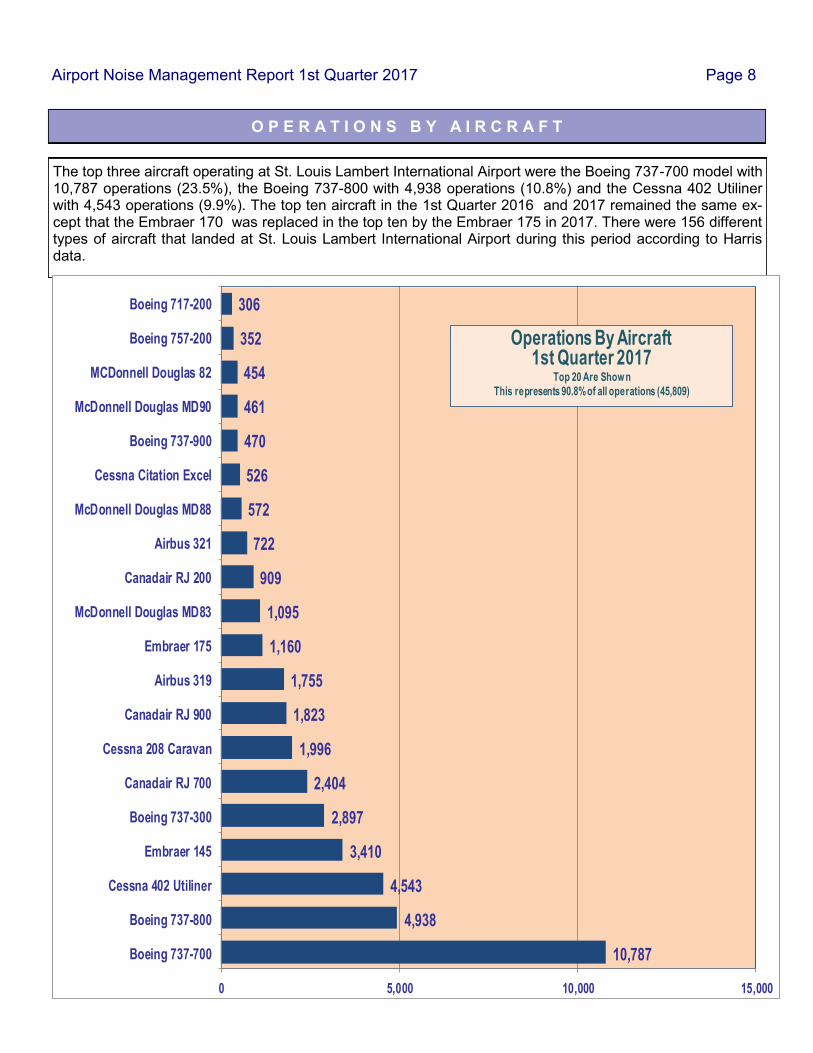
O P E R A T I O N S B Y A I R C R A F T
The top three aircraft operating at St. Louis Lambert International Airport were the Boeing 737-700 model with 10,787 operations (23.5%), the Boeing 737-800 with 4,938 operations (10.8%) and the Cessna 402 Utiliner with 4,543 operations (9.9%). The top ten aircraft in the 1st Quarter 2016 and 2017 remained the same ex-cept that the Embraer 170 was replaced in the top ten by the Embraer 175 in 2017. There were 156 different types of aircraft that landed at St. Louis Lambert International Airport during this period according to Harris data.
10,787
4,938
4,543
3,410
2,897
2,404
1,996
1,823
1,755
1,160
1,095
909
722
572
526
470
461
454
352
306
0 5,000 10,000 15,000
Boeing 737-700
Boeing 737-800
Cessna 402 Utiliner
Embraer 145
Boeing 737-300
Canadair RJ 700
Cessna 208 Caravan
Canadair RJ 900
Airbus 319
Embraer 175
McDonnell Douglas MD83
Canadair RJ 200
Airbus 321
McDonnell Douglas MD88
Cessna Citation Excel
Boeing 737-900
McDonnell Douglas MD90
MCDonnell Douglas 82
Boeing 757-200
Boeing 717-200
Operations By Aircraft1st Quarter 2017
Top 20 Are Shown
This represents 90.8% of all operations (45,809)
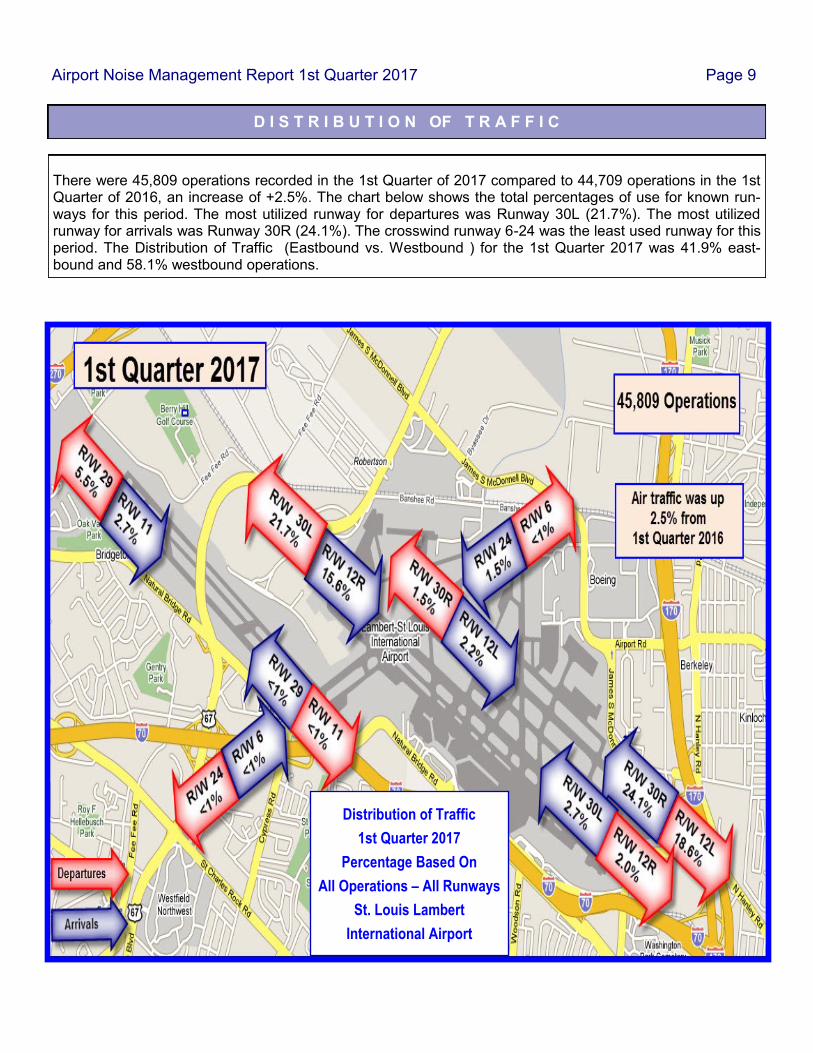
There were 45,809 operations recorded in the 1st Quarter of 2017 compared to 44,709 operations in the 1st Quarter of 2016, an increase of +2.5%. The chart below shows the total percentages of use for known run-ways for this period. The most utilized runway for departures was Runway 30L (21.7%). The most utilized runway for arrivals was Runway 30R (24.1%). The crosswind runway 6-24 was the least used runway for this period. The Distribution of Traffic (Eastbound vs. Westbound ) for the 1st Quarter 2017 was 41.9% east-bound and 58.1% westbound operations.
D I S T R I B U T I O N OF T R A F F I C
Airport Noise Management Report 1st Quarter 2017 Page 9
Distribution of Traffic
1st Quarter 2017
Percentage Based On
All Operations – All Runways
St. Louis Lambert
International Airport

H I G H ES T D A I L Y N U M B E R O F O P E R A T I O N S 1st Q U A R T E R 2 0 1 7
Airport Noise Management Report 1st Quarter 2017 Page 10
Airport Noise Management Office
Airport Planning & Development
St. Louis Lambert International Airport®
P.O. Box 10212
St. Louis, MO 63145
Noise Complaint Hot Line (314) 551-5070 — [email protected] — Fax: (314) 551-5013
Publication of St. Louis Lambert International Airport Noise Management Office
Busiest Day of the
1st Quarter
March 16, 2017
STL Traffic Only
Blue: Arrivals
Red: Departures