Airport forecasting
34
By : Mohammed Salem Awadh Consultant Airport Forecasting Collection Articles Part One
-
Upload
mohammed-hadi -
Category
Business
-
view
366 -
download
0
Transcript of Airport forecasting

By :
Mohammed Salem Awadh Consultant
Airport Forecasting
Collection Articles Part One

Contents :
Introduction ----------------------------------------------------
1- Airport Performance -----------------------------------
2- Hard Target ---------------------------------------------
3- Forecasting by Objective -----------------------------
4- Getting The Right Picture -----------------------------
5- Short Term vs Long Term Forecast----------------
6- Measuring Forecasting Accuracy ------------------
7- Airport Forecasting ------------------------------------

Introduction:
Long time ago, a group of students assigned to carry forecasting project by using ARIMA model, at that time I have a good contact with faculty of Engineering at Aden University, as a field supervisor and I asked them to utilize and forecast the data of Air Yemen. The work is fair and good, we are presented the work in Warangal conference - India.. the following link shows this work.
http://www.slideshare.net/wings_of_wisdom/a-multiplicative-time-series-model

Today – the forecasting concept is enhanced by many practical procedures, advance tools and packages of software, and many companies practice these techniques.
A new concept is used by using Max/Min Signal Tracking Approach, which define two main elements that derive the Forecasting Model i.e Displacement and Rotational so accordingly we can setup a forecasting accuracy matrix
that positioning the parameters of the model in the main quartets locations according the preset constrains for R and Signal Tracking as shown in figure.
While addressing Airport Forecasting, it is the factor for Airport Capacity Planning, either to set the right infrastructure or planning ahead to avoids a congestion issues, and defining the right seasonality patterns for the

purpose of assigning the right size of labor force, especially in a peak time.
But, defining the KPIs system is the main issue for airports performance, by setting the targets and their level of acceptance. ( short and long terms). ■

“Excellence is never an accident. It is always the result of high intention, sincere effort, and intelligent execution; it represents the wise choice of many alternatives – choice, not chance, determines your destiny.” Aristotle
26
Any performance report always reflect the comparison between the existing period vs the same period of the previous year giving an indicator of how the airline perform in the past, but in a planning process that involving forecasting the story is different, we compare what is achieved to what is planned (forecast) by using present figure vs.future (forecasted) figures, to indicate what is the best approach, we to evaluate the standard error for both scenario.
Toronto International Airport Case Study:1- Input Data: The data is split in two parts – Basic Data and Evaluation Data: Basic Data: Monthly 3 years data period (2010-2012) Evaluation Data: 6 months of 2013.
2- Signal Tracking Analysis: The max/min signal tracking approach define three points are out of the range data are 9, 21, and 35. Reporting by ± 4.77 as shown in the graph. 3- Seasonality Model: Coefficient of Determination: 99.1% and Max/Min Signal Tracking: ± 4.77
4- Results: Passengers Forecast 2013= 36,705,584 Growth= 5.50
Past Vs Future: By calculating the standard error for both scenario (classical one and the forecasted one).The result fairly support the forecasted approach by Standard Error of 0.53 represent by Future period, while Standard Error of the classical approach is 3.11 represent by past period.
Prepared by: Mohammed Salem AwadResearch Scholar – Aviation Management
Airport Performance – Past vs. Future, It is your choice!
Airports Forecasting
New Method Passenger Movements 2013 Month Forecast (F) Actual (A) (F) - (A) / (F)Jan 2,886,017 2,781,425 (3.62)Feb 2,707,698 2,565,532 (5.25)Mar 3,094,788 3,074,281 (0.66)Apr 2,952,835 2,881,764 (2.41)May 3,012,450 2,996,758 (0.52)Jun 3,143,234 3,093,930 (1.57)Jul 3,583,257 Aug 3,672,747 Sep 3,061,353 Oct 2,977,543 Nov 2,633,804 Dec 2,979,858 Standard Error 0.53
Toronto International AirportClassic Method Toronto Airport Month 2011 (11) 2012 (12) (12) - (11) / (11)Jan 2,627,686 2,682,581 2.09Feb 2,438,279 2,764,028 13.36Mar 2,826,974 2,621,169 7.28-Apr 2,684,556 2,951,030 9.93May 2,783,106 2,825,987 1.54Jun 2,865,070 2,832,779 1.13-Jul 2,292,149 2,972,845 9.70-Aug 2,357,974 3,351,065 0.21-Sep 2,806,234 3,523,644 25.56Oct 2,683,757 2,908,905 8.39Nov 2,386,911 2,827,934 18.48Dec 2,682,581 2,528,817 5.73-Standard Error 3.11
1700000
2200000
2700000
3200000
3700000
4200000
No
of P
asse
nger
s
TIME (Month)
Toronto International Airport
Forecast
Total Passengers 2013
Actual
R2
= 99.1 %S.T.= 4.77 (2010 - 2012) 2013 (F) = 36,705,584 PaxGrowth = 5.50
3.11 Past 0.53Future
CAMA Magazine | issue 20 | June, 2014

camamagazine.com
27Airport Forecasting
Canadian Airports: Forecast of 2013Airports Forecasting 2013Deerlake Regional Airport 334,371 Fort McMurray Airport 1,026,957 Kelowna International Airport 1,455,559 Victoria International Airport 1,510,075 Winnipig International Airport 3,638,834 Halifax International Airport 3,725,705 Ottawa Macdonald-Cartier Int. Airport 4,878,335 EIA International Airport 6,881,180 Calgary International Airport 13,963,704 Montreal International Airport 14,538,536 Vancouver International Airport 17,945,517 Toronto Person International Airport 36,705,584
YVR AirportNew Method Passenger Movements 2013 Month Forecast (F) Actual (A) (F) - (A) / (F)Jan 1,382,910 1,349,201 (2.44)Feb 1,296,412 1,270,257 (2.02)Mar 1,474,340 1,429,669 (3.03)Apr 1,402,801 1,364,586 (2.72)May 1,509,221 1,481,471 (1.84)Jun 1,594,422 1,611,297 1.06 Jul 1,783,904 Aug 1,838,650 Sep 1,525,463 Oct 1,412,963 Nov 1,261,172 Dec 1,463,258 Total Forecast 17,945,517 Standard Error 0.61
EIA AirportNew Method Passenger Movements 2013 Month Forecast (F) Actual (A) (F) - (A) / (F)Jan 545,231 551,651 1.18 Feb 537,556 541,616 0.76 Mar 594,140 594,879 0.12 Apr 573,410 572,370 (0.18)May 567,688 573,654 1.05 Jun 561,298 557,077 (0.75)Jul 619,912 Aug 639,047 Sep 548,559 Oct 558,790 Nov 547,037 Dec 588,512 Total Forecast 6,881,180 Standard Error 0.31
Montreal AirportNew Method Passenger Movements 2013 Month Forecast (F) Actual (A) (F) - (A) / (F)Jan 1,189,631 1,134,558 (4.63)Feb 1,121,519 1,072,426 (4.38)Mar 1,287,320 1,284,637 (0.21)Apr 1,184,078 1,130,416 (4.53)May 1,137,629 1,107,695 (2.63)Jun 1,267,192 1,216,028 (4.04)Jul 1,422,791 Aug 1,428,242 Sep 1,224,556 Oct 1,171,370 Nov 990,065 Dec 1,114,141 Total Forecast 14,538,536 Standard Error 0.71
1,000,000
1,100,000
1,200,000
1,300,000
1,400,000
1,500,000
1,600,000
1,700,000
1,800,000
1,900,000
No
of P
asse
nger
s
TIME (Month)
YVR International Airport
Forecast
Total Passengers 2013
Actual
R2 = 99.0 %S.T.=4.52 (2010-2012)2013(F) = 17,945,517 PaxGrowth = 1.92
450,000
470,000
490,000
510,000
530,000
550,000
570,000
590,000
610,000
630,000
650,000
No
of P
asse
nger
s
TIME (Month)
EIA International Airport
Forecast
Total Passengers 2013
Actual
R2 = 95.9 %S.T.= 8.12 (2010-2012)2013(F) = 6,881,180 PaxGrowth = 3.37
800,000
900,000
1,000,000
1,100,000
1,200,000
1,300,000
1,400,000
1,500,000
No
of P
asse
nger
s
TIME (Month)
MONTREAL International Airport
Forecast
Passengers Movements 2013
Actual
R2 = 97.0 %S.T.= 7.18 (2010-2012)2013(F) = 14,538,536 PaxGrowth = 5.53
Gander
St. John’s
Moncton
Charlottetown
Halifax
Saint JohnFredericton
Toronto
Ottawa
London
MontrealQuebec
Thunder Bay
WinnipegRegina
SaskatoonCalgary
Edmonton
Victoria
Vancouver
Prince George
CANADIAN AIRPORTS

Airports Forecasting28
Victoria International AirportNew Method Passenger Movements 2013 Month Forecast (F) Actual (A) (F) - (A) / (F)Jan 112,633 111,371 (1.12)Feb 107,754 108,851 1.02 Mar 124,485 126,818 1.87 Apr 121,654 123,197 1.27 May 131,736 134,280 1.93 Jun 126,111 136,726 8.42 Jul 140,279 139,790 (0.35)Aug 149,441 159,545 6.76 Sep 128,638 Oct 131,189 Nov 111,687 Dec 124,467 Total Forecast 1,510,075 Standard Error 1.19
Ottawa Macdonald-Cartier International Airport New Method Passenger Movements 2013 Month Forecast (F) Actual (A) (F) - (A) / (F)Jan 399,659 378,182 (5.37)Feb 408,817 381,086 (6.78)Mar 442,206 426,602 (3.53)Apr 393,056 379,741 (3.39)May 402,583 377,094 (6.33)Jun 411,765 371,482 (9.78)Jul 403,536 382,084 (5.32)Aug 419,504 Sep 389,817 Oct 411,996 Nov 383,296 Dec 412,099 Total Forecast 4,878,335 Standard Error 0.82
Winnipig International AirportNew Method Passenger Movements 2013 Month Forecast (F) Actual (A) (F) - (A) / (F)Jan 303,534 294,372 (3.02)Feb 299,457 285,455 (4.68)Mar 317,664 306,771 (3.43)Apr 281,570 264,316 (6.13)May 288,238 278,834 (3.26)Jun 306,472 292,264 (4.64)Jul 335,032 Aug 338,017 Sep 294,972 Oct 301,127 Nov 273,269 Dec 299,482 Total Forecast 3,638,834 Standard Error 0.48
Kelowna International AirportNew Method Passenger Movements 2013 Month Forecast (F) Actual (A) (F) - (A) / (F)Jan 128,707 125,439 (2.54)Feb 125,443 131,540 4.86 Mar 131,057 109,973 (16.09)Apr 110,850 113,976 2.82 May 109,817 117,104 6.64 Jun 111,046 133,482 20.20 Jul 128,724 143,555 11.52 Aug 136,269 Sep 114,530 Oct 115,754 Nov 109,973 Dec 133,388 Total Forecast 1,455,559 Standard Error 4.29
80,000
90,000
100,000
110,000
120,000
130,000
140,000
150,000
160,000
No
of P
asse
nger
s
TIME (Month)
Victoria International Airport
ActualForecast
Total Passengers 2013
R2 = 96.7 %S.T.= 3.87 (2010-2012)2013(F) = 1,510,075 PaxGrowth = 0.21
300000
320000
340000
360000
380000
400000
420000
440000
460000
No
of P
asse
nger
s
TIME (Month)
Ottawa Macdonald-Cartier International Airport
Forecast
Total Passengers 2013
Actual
R2 = 77.3 %S.T.= 6.84 (2010-2012)2013(F) = 4,878,335 PaxGrowth = 3.73
230,000
250,000
270,000
290,000
310,000
330,000
350,000
No
of P
asse
nger
s
TIME (Month)
Winnipig International Airport
ActualForecast
Total Passengers 2013
R2 = 91.7 %S.T.= 7.01 (2010-2012)2013(F) = 3,638,834 PaxGrowth = 2.65
80,000
90,000
100,000
110,000
120,000
130,000
140,000
No
of P
asse
nger
s
TIME (Month)
Kelowna International Airport
Forecast
Total Passengers 2013
Actual
R2 = 94.3 %S.T.= 4.30 (2010-2012)2013(F) = 1,455,559 PaxGrowth = 0.96
CAMA Magazine | issue 20 | June, 2014

camamagazine.com
29Airport Forecasting
Calgary International Airport New Method Passenger Movements 2013 Month Forecast (F) Actual (A) (F) - (A) / (F)Jan 1,072,551 1,092,390 1.85 Feb 1,047,803 1,052,912 0.49 Mar 1,164,374 1,187,811 2.01 Apr 1,128,212 1,144,194 1.42 May 1,137,530 1,151,024 1.19 Jun 1,176,611 1,160,841 (1.34)Jul 1,350,627 Aug 1,358,582 Sep 1,170,418 Oct 1,149,343 Nov 1,063,522 Dec 1,144,130 Total Forecast 13,963,704 Standard Error 0.51
Halifax International Airport New Method Passenger Movements 2013 Month Forecast (F) Actual (A) (F) - (A) / (F)Jan 228,506 226,999 (0.66)Feb 288,009 232,961 (19.11)Mar 327,364 328,082 0.22 Apr 345,346 332,421 (3.74)May 321,058 Jun 309,791 Jul 371,951 Aug 394,918 Sep 316,069 Oct 308,195 Nov 241,239 Dec 273,259 Total Forecast 3,725,705 Standard Error 4.51
Deerlake Regional Airport New Method Passenger Movements 2013 Month Forecast (F) Actual (A) (F) - (A) / (F)Jan 19,464 Feb 19,830 Mar 24,985 Apr 25,647 May 26,663 Jun 30,378 Jul 41,913 Aug 42,556 Sep 29,707 Oct 28,508 Nov 21,576 Dec 23,146 Total Forecast 334,371 Standard Error
Fort McMurray Airport New Method Passenger Movements 2013 Month Forecast (F) Actual (A) (F) - (A) / (F)Jan 80,887 89,761 10.97 Feb 80,317 90,328 12.46 Mar 86,615 96,420 11.32 Apr 79,309 95,300 20.16 May 85,593 101,676 18.79 Jun 88,096 100,196 13.73 Jul 86,133 107,942 25.32 Aug 89,952 Sep 89,291 Oct 89,796 Nov 88,177 Dec 82,791 Total Forecast 1,026,957 Standard Error 2.05
800,000
900,000
1,000,000
1,100,000
1,200,000
1,300,000
1,400,000
No
of P
asse
nger
s
TIME (Month)
Calgary International Airport
Forecast
Total Passengers 2013
Actual
R2 = 97.8 %S.T.= 7.65 (2010-2012)2013(F) = 13,963,704 PaxGrowth = 2.80
100,000
150,000
200,000
250,000
300,000
350,000
400,000
450,000
No
of P
asse
nger
s
TIME (Month)
Halifax International Airport
Forecast
Total Passengers 2013
Actual
-
5,000
10,000
15,000
20,000
25,000
30,000
35,000
40,000
45,000
No
of P
asse
nger
s
TIME (Month)
Deerlake Regional Airport
Forecast
Total Passengers 2013
Actual
R2 = 98 %S.T.= 5.24 (2010-2012)2013(F) = 334,371 PaxGrowth = 9.27
40,000
50,000
60,000
70,000
80,000
90,000
100,000
No
of P
asse
nger
s
TIME (Month)
Fort McMurray Airport
Forecast
Total Passengers 2013
Actual
R2 = 85.9 %S.T.= 11.46 (2010-2012)2013(F) = 1,026,957 PaxGrowth = 9.04
R2
= 92.7 %S.T.= 4.00 (2010 - 2012) 2013 (F) = 3,725,705 PaxGrowth = 2.92

Prepared by: Mohammed Salem AwadResearch Scholar – Aviation Management
HARD TARGET
Airports Forecasting
Most of Airlines and Airports works on achieving targets, and goals but at what level they designs their targets, what are their objectives, is it short term or long term objectives, how to reflect the long term targets with short term one, is it possible to build seasonality model based on three years data to match the trend forecasting results. How to plan and develop a 3 in 1 strategy i.e mean Trend target (10 years), Total Seasonality Target (3 years) and Target that results from International and Domestic (3 years)
3 in 1 Forecasting Strategy:The idea of this strategy is how to achieve the same target (figure) by different approaches, in our case the trend target of 2013 for traffic forecasting of all major US airports = 532,847,993 according to 2002-2012 annual data base.While for short range forecast of 2013 for Total passengers based on 3 years that reflect 36 months (data set) is = 532,847,993 Further, Total Passengers = International + Domestic So the International traffic forecast of 2013 = 79,765,704 and The Domestic traffic forecast of 2013 = 453,082,289 and by summation (Total) = 532,847,993
“There are two kinds of forecasters: those who don’t know, and those who don’t know they don’t know.” John Kenneth Galbraith
Passenger Forecasting 2013All Major US Airports (Seasonality Model)Passenger Forecasting 2013All Major US Airports (Seasonality Model)
30,000,000
35,000,000
40,000,000
45,000,000
50,000,000
55,000,000
Jan-
10
Apr-
10
Jul-1
0
Oct
-10
Jan-
11
Apr-
11
Jul-1
1
Oct
-11
Jan-
12
Apr-
12
Jul-1
2
Oct
-12
Jan-
13
Apr-
13
Jul-1
3
Oct
-13
Jan-
14
Apr-
14
Jul-1
4
Oct
-14
Passenger Forecasting 2013All Major US Airports (Seasonality Model)
Developing 3 in 1 Forecasting Strategy –Airports Forecasting
CAMA Magazine | issue 19 | June, 2013
34
R2
= 98.5 %S.T.= -33.31 2013 (F) = 532,847,993 Pax

2,700,000
2,900,000
3,100,000
3,300,000
3,500,000
3,700,000
3,900,000
4,100,000
4,300,000
4,500,000
4,700,000
Jan-
10
Apr-
10
Jul-1
0
Oct
-10
Jan-
11
Apr-
11
Jul-1
1
Oct
-11
Jan-
12
Apr-
12
Jul-1
2
Oct
-12
Jan-
13
Apr-
13
Jul-1
3
Oct
-13
Jan-
14
Apr-
14
Jul-1
4
Oct
-14
Passenger Forecasting 2013Atlanta, GA: Hartsfield – Jackson Atlanta International Airport
1,200,000
1,300,000
1,400,000
1,500,000
1,600,000
1,700,000
1,800,000
1,900,000
Jan-
10
Apr-
10
Jul-1
0
Oct
-10
Jan-
11
Apr-
11
Jul-1
1
Oct
-11
Jan-
12
Apr-
12
Jul-1
2
Oct
-12
Jan-
13
Apr-
13
Jul-1
3
Oct
-13
Jan-
14
Apr-
14
Jul-1
4
Oct
-14
Passenger Forecasting 2013Miami, FL: Miami International Airports (Seasonality Model)
1,200,000
1,300,000
1,400,000
1,500,000
1,600,000
1,700,000
1,800,000
1,900,000
2,000,000
Jan-
10
Apr-
10
Jul-1
0
Oct
-10
Jan-
11
Apr-
11
Jul-1
1
Oct
-11
Jan-
12
Apr-
12
Jul-1
2
Oct
-12
Jan-
13
Apr-
13
Jul-1
3
Oct
-13
Jan-
14
Apr-
14
Jul-1
4
Oct
-14
Passenger Forecasting 2013Houston, TX: George Bush International/Houston Airport
800,000
900,000
1,000,000
1,100,000
1,200,000
1,300,000
1,400,000
1,500,000
Jan-
10
Apr-
10
Jul-1
0
Oct
-10
Jan-
11
Apr-
11
Jul-1
1
Oct
-11
Jan-
12
Apr-
12
Jul-1
2
Oct
-12
Jan-
13
Apr-
13
Jul-1
3
Oct
-13
Jan-
14
Apr-
14
Jul-1
4
Oct
-14
Passenger Forecasting 2013Boston, MA: Logan International Airport
camamagazine.com
35Airport Forecasting
R2
= 98 %S.T.= 0.00 2013 (F) = 46,386,947 Pax
R2
= 85.5 %S.T.= 0.00 2013 (F) = 18,960,323 Pax
R2
= 96.3 %S.T.= 0.00 2013 (F) = 18,900,593 Pax
R2
= 96.2 %S.T.= 0.00 2013 (F) = 14,397,952 Pax

1,200,000
1,300,000
1,400,000
1,500,000
1,600,000
1,700,000
1,800,000
1,900,000
Jan-
10
Apr-
10
Jul-1
0
Oct
-10
Jan-
11
Apr-
11
Jul-1
1
Oct
-11
Jan-
12
Apr-
12
Jul-1
2
Oct
-12
Jan-
13
Apr-
13
Jul-1
3
Oct
-13
Jan-
14
Apr-
14
Jul-1
4
Oct
-14
Passenger Forecasting 2013Charlotte, NC: Charlotte Douglas International Airport
1,200,000
1,700,000
2,200,000
2,700,000
3,200,000
3,700,000
Jan-
10
Apr-
10
Jul-1
0
Oct
-10
Jan-
11
Apr-
11
Jul-1
1
Oct
-11
Jan-
12
Apr-
12
Jul-1
2
Oct
-12
Jan-
13
Apr-
13
Jul-1
3
Oct
-13
Jan-
14
Apr-
14
Jul-1
4
Oct
-14
Passenger Forecasting 2013Chicago, IL: Chicago O’Hare International Airport
1,200,000
1,400,000
1,600,000
1,800,000
2,000,000
2,200,000
2,400,000
2,600,000
2,800,000
Jan-
10
Apr-
10
Jul-1
0
Oct
-10
Jan-
11
Apr-
11
Jul-1
1
Oct
-11
Jan-
12
Apr-
12
Jul-1
2
Oct
-12
Jan-
13
Apr-
13
Jul-1
3
Oct
-13
Jan-
14
Apr-
14
Jul-1
4
Oct
-14
Passenger Forecasting 2013Dallas/Fort Worth, TX: Dallas/Fort Worth International Airport
1,200,000
1,400,000
1,600,000
1,800,000
2,000,000
2,200,000
2,400,000
2,600,000
Jan-
10
Apr-
10
Jul-1
0
Oct
-10
Jan-
11
Apr-
11
Jul-1
1
Oct
-11
Jan-
12
Apr-
12
Jul-1
2
Oct
-12
Jan-
13
Apr-
13
Jul-1
3
Oct
-13
Jan-
14
Apr-
14
Jul-1
4
Oct
-14
Passenger Forecasting 2013Denver, CO: Denver International Airport
CAMA Magazine | issue 19 | June, 2013
Airports Forecasting36
R2
= 77.2 %S.T.= 0.00 2013 (F) = 19,649,999 Pax
R2
= 98.1 %S.T.= 0.00 2013 (F) = 32,317,534 Pax
R2
= 95.9 %S.T.= 0.00 2013 (F) = 28,120,137 Pax
R2
= 98.3 %S.T.= 0.00 2013 (F) = 25,735,852 Pax

Passenger Forecasting 2013Detroit, MI: Detroit Metro Wayne Country Airport
800,000
900,000
1,000,000
1,100,000
1,200,000
1,300,000
1,400,000
1,500,000
1,600,000
Jan-
10
Apr-
10
Jul-1
0
Oct
-10
Jan-
11
Apr-
11
Jul-1
1
Oct
-11
Jan-
12
Apr-
12
Jul-1
2
Oct
-12
Jan-
13
Apr-
13
Jul-1
3
Oct
-13
Jan-
14
Apr-
14
Jul-1
4
Oct
-14
-
200,000
400,000
600,000
800,000
1,000,000
1,200,000
1,400,000
1,600,000
1,800,000
Jan-
10
Apr-
10
Jul-1
0
Oct
-10
Jan-
11
Apr-
11
Jul-1
1
Oct
-11
Jan-
12
Apr-
12
Jul-1
2
Oct
-12
Jan-
13
Apr-
13
Jul-1
3
Oct
-13
Jan-
14
Apr-
14
Jul-1
4
Oct
-14
Passenger Forecasting 2013Minneapolis, MN: Minneapolis-St Paul International Airport
1,200,000
1,300,000
1,400,000
1,500,000
1,600,000
1,700,000
1,800,000
1,900,000
Jan-
10
Apr-
10
Jul-1
0
Oct
-10
Jan-
11
Apr-
11
Jul-1
1
Oct
-11
Jan-
12
Apr-
12
Jul-1
2
Oct
-12
Jan-
13
Apr-
13
Jul-1
3
Oct
-13
Jan-
14
Apr-
14
Jul-1
4
Oct
-14
Passenger Forecasting 2013Las Vegas, NV: McCarran International Airport
Passenger Forecasting 2013Los Angeles, CA: Los Angeles International Airport
1,700,000
1,900,000
2,100,000
2,300,000
2,500,000
2,700,000
2,900,000
3,100,000
3,300,000
Jan-
10
Apr-
10
Jul-1
0
Oct
-10
Jan-
11
Apr-
11
Jul-1
1
Oct
-11
Jan-
12
Apr-
12
Jul-1
2
Oct
-12
Jan-
13
Apr-
13
Jul-1
3
Oct
-13
Jan-
14
Apr-
14
Jul-1
4
Oct
-14
camamagazine.com
37Airport Forecasting
R2
= 98.6 %S.T.= 0.00 2013 (F) = 15,633,034 Pax
R2
= 98.5 %S.T.= 0.00 2013 (F) = 16,110,186 Pax
R2
= 95.1 %S.T.= 0.00 2013 (F) = 20,185,872 Pax
R2
= 97.6 %S.T.= 0.00 2013 (F) = 32,112,724 Pax

32
Prepared by: Mohammed Salem AwadResearch Scholar – Aviation Management Forecasting by Objective
Case Study TALLINN Airport
Airports Forecasting
To carry a traffic forecast for an airport is uneasy task, As most of the statistician rely on coefficient of determination R2 to ensure the fairness of the analysis. In this article we will try to create many scenarios that will reflects, what the top management thinks, are they interesting to rely R2 (Classical approach), are they trying to minimize the errors by setting Signal Tracking to Zero, or trying to merge long range trend forecast to be targeted (accumulated) for the seasonality model, or to ask to follow the most update and recent input data (recent years). Really all the four scenarios are addressed, in case study of TALLINN Airport.
Case Study – TALLINN Airport: Tallinn Airport (Estonian: Lennart Meri Tallinna lennujaam) (IATA: TLL, ICAO: EETN) or Lennart Meri it formerly Ülemiste Airport, is the largest airport in Estonia and home base of the national airline Estonian Air. Tallinn Airport is open to both domestic and international flights. It is located approximately 4 km from the centre of Tallinn on the eastern shore of Lake Ülemiste. As Tallinn is located nearest to Asia Pacific of all EU capitals, this gives Tallinn Airport a major geographical advantage for establishing long-haul flights between these two regions.Two set of data are examined to develop a Trend and Seasonality Models.
A- Trend Model (15 years data set)Based on these data the a trend model is developed and with R2 = 86.1 and Signal Tracking = -1.84, the 2013 Forecasted is = 2,495,900.
B- Seasonality Model (36 months data set)Four Scenarios are developed as it is shown in the following table.
1- Maximize R2
2- Setting Signal Tracking = Zero 3- Setting Trend Target to 2,495,9004- Reflects the latest Input Data
Results: All scenarios shows high values of R2 (all closes value) while Signal Tracking shows a large divergence with respect to the bond values and the best selection decision is scenario no. 3 (why) as it is almost cover three pre-constrained parameters in spite of slight divergence of S. T. of the bond and also it reflects the lowest one in the results.Forecasted by Trend Target for 2013 = 2,495,900 PaxR2 = 92.22%Signal Tracking: 6.662
“The only true wisdom is in knowing you know nothing.” Socrates
R2 > 80% and -4 < T.S. < 4
-
500,000
1,000,000
1,500,000
2,000,000
2,500,000
3,000,000
1998
1999
2000
2001
2002
2003
2004
2005
2006
2007
2008
2009
2010
2011
2012
2013
y = 443370e0.108x
R2 = 0.861
2,49
5,90
0
TRENDANALYSIS
No. Scenarios Objective ?
Coefficient of Determination (R2)
Signal Tracking (S. T.)
Forecasting of 2013
Remarks
1 MaximizeR2
93.46% -33.31 2,907,888 -
2 Setting S. T. = zero
92.67% 0.0000004 2,568,499 -
3 15 Years Tren Target = 2,495,900
92,22% 6.662 2,495,900 Fair
4 Reflecting the Latest Input Data
93.34% -26.26 2,794,463 -
TALLINN AIRPORT (Seasonlity Model)Passengers Forecasting 2013
-
50,000
100,000
150,000
200,000
250,000
300,000
350,000
No
of P
asse
nger
s
TIME (Month)
ForecastActual
Forecasting by Trend Target R2 = 92.22 %S.T.= 6.6620
Pax900,495,2(F) = 2013
CAMA Magazine | issue 18 | March, 2013

33Airport forecAsting
Washington Dulles International Airport (IATA: IAD, ICAO: KIAD, FAA LID: IAD) is a public airport in Dulles, Virginia, 26 miles (41.6 km) west of downtown Washington, D.C. The airport serves the Baltimore-Washington-Northern Virginia metropolitan area centered on the District of Columbia. It is named after John Foster Dulles, Secretary of State under Dwight D. Eisenhower. The Dulles main terminal is a well-known landmark designed by Eero Saarinen. Operated by the Metropolitan Washington Airports Authority, Dulles Airport occupies 11,830 acres (47.9 km2) straddling the border of Fairfax County and Loudoun County, Virginia.
R2 = 96.1S.T.= 0.02013 (F) = 11,641,322 Pax
Detroit Metropolitan Wayne County Airport (IATA: DTW, ICAO: KDTW), usually called Detroit Metro Airport, Metro Airport locally, or simply DTW, is a major international airport in the United States covering 7,072-acre (11.050 sq mi; 2,862 ha) in Romulus, Michigan, a suburb of Detroit. It is Michigan’s busiest airport and one of the world’s largest air transportation hubs.The airport serves as Delta’s second busiest hub. Delta, along with SkyTeam partner Air France, occupy the McNamara Terminal.
R2 = 92.3 S.T.= -4 2013 (F) = 16,770,937 Pax
Forecasting of US Airports:Airport forecasting is an important issue in Aviation industry. It becomes an integral parts of transportation planning. It sets targets and goals for the airports, either for long term or medium term planning. The primary statistical methods used in airport aviation activity forecasting are market share approach, econometric modeling, and time series modeling.While we will use R and Signal Tracking Approach.
Detroit Airport (Seasonlity Model)Passengers Forecasting 2013
1,000,000
1,100,000
1,200,000
1,300,000
1,400,000
1,500,000
1,600,000
1,700,000
No of
Pas
seng
ers
TIME (Month)
Forecast
Actual
R2 = 92.3 %S.T.= - 42013(F) = 16,770,937 Pax
Washington Dulles Airport (Seasonlity Model)Passengers Forecasting 2013
500,000
600,000
700,000
800,000
900,000
1,000,000
1,100,000
1,200,000
No of
Pas
seng
ers
TIME (Month)
Forecast
Actual
R2 = 96.1%S.T.= 0.02013(F) = 11,641,322 Pax
CAMA Magazine | issue 18 | March, 2013

34
International Airport
(IATA: FLL, ICAO: KFLL, FAA LID: FLL) is an international commercial airport located in unincorporated Broward County, Florida, three miles (5 km) southwest of the central business district of Fort Lauderdale. It is also located near the city of Hollywood and is 21 miles (33.7 km) north of Miami.
R2= 96.8S.T.= 0.0 2013(F) = 12,080,874 Pax
Charlotte Douglas International Airport
(IATA: CLT, ICAO: KCLT, FAA LID: CLT) is a joint civil-military public international airport located in Charlotte, North Carolina. Established in 1935 as Charlotte Municipal Airport, in 1954 the airport was renamed Douglas Municipal Airport after former Charlotte mayor Ben Elbert Douglas, Sr. The airport gained its current name in 1982 and is currently US Airways’ largest hub, with service to 175 domestic and international destinations as of 2008. In 2009, it was the 9th busiest airport in the United States and in 2010, the 24th busiest airport in the world by passenger traffic.
R2= 85.6 S.T.= 02013(F) = 21,135,269 Pax
Los Angeles International Airport
(IATA: LAX, ICAO: KLAX, FAA LID: LAX) is the primary airport serving the Greater Los Angeles Area, the second-most populated metropolitan area in the United States. LAX is located in southwestern Los Angeles along the Pacific coast in the neighborhood of Westchester, 16 miles (26 km) from the downtown core and is the primary airport of Los Angeles World Airports (LAWA), an agency of the Los Angeles city government formerly known as the Department of Airports.
R2= 97.7 S.T.= 42013(F) = 32,269,576 Pax
Fort Lauderdale–Hollywood Airport (Seasonlity Model)Passengers Forecasting 2013
Charlotte Douglas Airport (Seasonlity Model)Passengers Forecasting 2013
Los Angeles Airport (Seasonlity Model)Passengers Forecasting 2013
600,000
700,000
800,000
900,000
1,000,000
1,100,000
1,200,000
1,300,000
No of
Pas
seng
ers
TIME (Month)
Forecast
Actual
R2 = 96.8 %S.T.= 0.002013(F) = 12,080,874 Pax
1,800,000
2,000,000
2,200,000
2,400,000
2,600,000
2,800,000
3,000,000
3,200,000
No of
Pas
seng
ers
TIME (Month)
Forecast
Actual
R2 = 85.6 %S.T.= 0.02013(F) = 21,135,269 Pax
1,800,000
2,000,000
2,200,000
2,400,000
2,600,000
2,800,000
3,000,000
3,200,000
No of
Pas
seng
ers
TIME (Month)
Forecast
Actual
R2 = ̂ 7.7 %S.T.= 42013(F) = 32,269,576 Pax
Airport forecAsting
CAMA Magazine | issue 18 | March, 2013

Minneapolis–Saint Paul International Airport
(IATA: MSP, ICAO: KMSP, FAA LID: MSP) is a joint civil-military public use airport. Located in a portion of Hennepin County, Minnesota outside of any city or school district, within ten miles (16 km) of both downtown Minneapolis and downtown Saint Paul, it is the largest and busiest airport in the five-state upper Midwest region of Minnesota, Iowa, South Dakota, North Dakota, and Wisconsin.
R2= 95.3%S.T.= -3 2013(F) = 16,650,355 Pax
Chicago Midway International Airport
(IATA: MDW, ICAO: KMDW, FAA LID: MDW), is an airport in Chicago, Illinois, United States, located on the city’s southwest side, eight miles (13 km) from Chicago’s Loop.Dominated by low-cost carrier Southwest Airlines, Midway is the Dallas-based carrier’s largest focus city as of 2011. Both the Stevenson Expressway and Chicago Transit Authority’s Orange Line provide passengers access to downtown Chicago. Midway Airport is the second largest passenger airport in the Chicago metropolitan area, as well as the state of Illinois, after Chicago O’Hare International Airport.
R2= 96%S.T.= 4 2013(F) = 9,397,884 Pax
Dallas/Fort Worth International Airport
(IATA: DFW, ICAO: KDFW, FAA LID: DFW) is located between the cities of Dallas and Fort Worth, Texas, and is the busiest airport in the U.S. state of Texas. It generally serves the Dallas–Fort Worth metropolitan area.DFW is the fourth busiest airport in the world in terms of aircraft movements. In terms of passenger traffic, it is the eighth busiest airport in the world. It is the largest hub for American Airlines. DFW Airport is considered to be an Airport City.
R2= 97.3%S.T.= 0.76 2013 (F) = 28,183,463 Pax
35
Dallas Airport (Seasonlity Model)Passengers Forecasting 2013
Minneapolis–Saint Paul Airport (Seasonlity Model)Passengers Forecasting 2013
Chicago Midway Airport (Seasonlity Model)Passengers Forecasting 2013
1,600,000
1,800,000
2,000,000
2,200,000
2,400,000
2,600,000
2,800,000
No of
Pas
seng
ers
TIME (Month)
Forecast
Actual
R2 = ̂ 7.3 %S.T.= 0.752013(F) = 28,183,463 Pax
1,000,000
1,100,000
1,200,000
1,300,000
1,400,000
1,500,000
1,600,000
1,700,000
1,800,000
No of
Pas
seng
ers
TIME (Month)
Forecast
Actual
R2 = ̂ 5.˼ %S.T.= - 32013(F) = 16,650,355 Pax
400,000
500,000
600,000
700,000
800,000
900,000
1,000,000
No of
Pas
seng
ers
TIME (Month)
Forecast
Actual
R2 = 96.1%S.T.= 0.02013(F) = 9,397,884 Pax
Airport forecAsting
CAMA Magazine | issue 18 | March, 2013

30
Prepared by: Mohammed Salem AwadResearch Scholar – Aviation Management
Getting The Right Picture
Head to Head analysisSeasonally Adjusted Vs Seasonally Fitted
Airports Forecasting
Furthers to my previous articles, this article will address the difference and compare the Seasonally Adjusted technique Vs Seasonally Fitted. Basically Forecasting model can be defined by four components i.e Trend, Cyclical, Seasonal, and Irregular. A model that treats the time series values as a sum of the components is called an additive component model (Yt=Tt+Ct+St+It) , While a model that treats the time series values as a product of the components is called a multiplicative component model (Yt=Tt×Ct×St×It)
Seasonally Adjusted: Most economic series published by international Organizations ) IATA, ICAO( are seasonally adjusted because seasonal variation is not of primary interest. Rather, it is the general patterned of economic activity, independent of normal seasonal fluctuation that is of interest. So seasonally adjusted is done to simplify data so that they may be more easily interpreted by statistically unsophisticated users without a significant loss of information. e.g – IATA Forecasting.
Seasonally Fitted: General guidance, we set a constrains to measure the Goodness of Fit, this time we use R and Signal Tracking ( R ≥ 80 and 4 ≥ S.T.≥ -4 ). The seasonal model fairly fitted by defining and controlling two main factors for mapping the figure, first is Displacement Factor which can be defined by the value of signal tracking, it is either upper or lower of the base forecasting line. Where the second factor is the rotating angle and that can be monitor by the value of R i.e why both R and signal tracking are displayed in the graph.
Summary: Both methods are fair, so to get the general trend, we use seasonally adjusted but to ensure to get the right picture we have to define the seasonality patterned and define their accuracy measuring factors in terms of R and Signal Tracking, the issue of this method only its applicability for short range period 1-3 years if we exceed the time/period the program should modified and set a new one.
CAMA Magazine | issue 17 | December, 2012
billion’s monthly f/cast
Actual Seasonally Adjusted Forcast
R2 = 90%
Tracking Signal = -0.0000028
Time
billi
on’s
mon
thly
International scheduled passenger traffic (RPKs) Industry totalLatest data April 2011
Time
OumraSession
HajjSession
SummerSession
WinterSession
Actual Year Cycle
Forecasted Year Cycle
Sal
es /
Pas
seng
ers
Back to schoolSession
“Facts are Many but the Truth is One.” Rabindranath Tagore
IATA
IATA
31
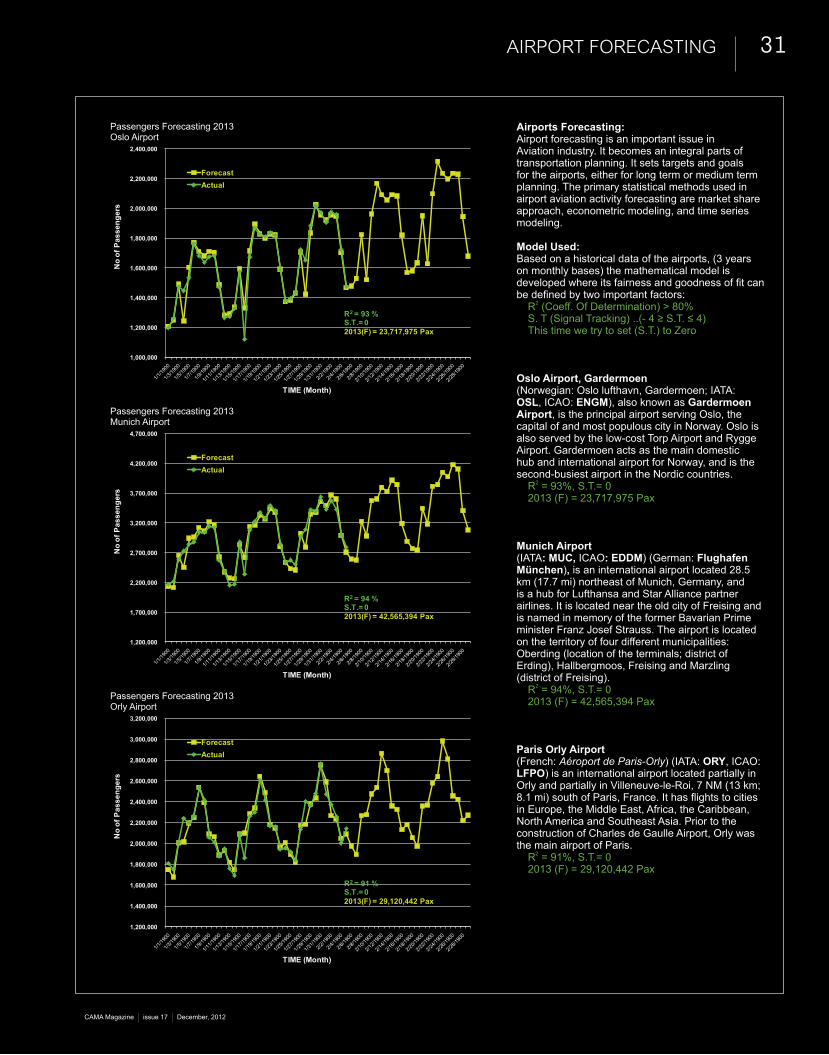
Airports Forecasting:Airport forecasting is an important issue in Aviation industry. It becomes an integral parts of transportation planning. It sets targets and goals for the airports, either for long term or medium term planning. The primary statistical methods used in airport aviation activity forecasting are market share approach, econometric modeling, and time series modeling.
Model Used:Based on a historical data of the airports, )3 years on monthly bases( the mathematical model is developed where its fairness and goodness of fit can be defined by two important factors:
R2 )Coeff. Of Determination( > 80%S. T (Signal Tracking) ..(- 4 ≥ S.T. ≤ 4) This time we try to set )S.T.( to Zero
Oslo Airport, Gardermoen)Norwegian: Oslo lufthavn, Gardermoen; IATA: OSL, ICAO: ENGM(, also known as Gardermoen Airport, is the principal airport serving Oslo, the capital of and most populous city in Norway. Oslo is also served by the low-cost Torp Airport and Rygge Airport. Gardermoen acts as the main domestic hub and international airport for Norway, and is the second-busiest airport in the Nordic countries.
R2 = 93%, S.T.= 02013 )F( = 23,717,975 Pax
Munich Airport)IATA: MUC, ICAO: EDDM( )German: Flughafen München(, is an international airport located 28.5 km )17.7 mi( northeast of Munich, Germany, and is a hub for Lufthansa and Star Alliance partner airlines. It is located near the old city of Freising and is named in memory of the former Bavarian Prime minister Franz Josef Strauss. The airport is located on the territory of four different municipalities: Oberding )location of the terminals; district of Erding(, Hallbergmoos, Freising and Marzling )district of Freising(.
R2 = 94%, S.T.= 02013 )F( = 42,565,394 Pax
Paris Orly Airport)French: Aéroport de Paris-Orly( )IATA: ORY, ICAO: LFPO( is an international airport located partially in Orly and partially in Villeneuve-le-Roi, 7 NM )13 km; 8.1 mi) south of Paris, France. It has flights to cities in Europe, the Middle East, Africa, the Caribbean, North America and Southeast Asia. Prior to the construction of Charles de Gaulle Airport, Orly was the main airport of Paris.
R2 = 91%, S.T.= 02013 )F( = 29,120,442 Pax
Passengers Forecasting 2013Oslo Airport
1,000,000
1,200,000
1,400,000
1,600,000
1,800,000
2,000,000
2,200,000
2,400,000
No
of P
asse
nger
s
TIME (Month)
ForecastActual
R2 = 93 %S.T.= 02013(F) = 23,717,975 Pax
Passengers Forecasting 2013Munich Airport
1,200,000
1,700,000
2,200,000
2,700,000
3,200,000
3,700,000
4,200,000
4,700,000
No
of P
asse
nger
s
TIME (Month)
ForecastActual
R2 = 94 %S.T.= 02013(F) = 42,565,394 Pax
Passengers Forecasting 2013Orly Airport
1,200,000
1,400,000
1,600,000
1,800,000
2,000,000
2,200,000
2,400,000
2,600,000
2,800,000
3,000,000
3,200,000
No
of P
asse
nger
s
TIME (Month)
ForecastActual
R2 = 91 %S.T.= 02013(F) = 29,120,442 Pax
CAMA Magazine | issue 17 | December, 2012
Airport forecAsting

32
Edinburgh Airport
)Scottish Gaelic: Port-adhair Dhùn Èideann( )IATA: EDI, ICAO: EGPH( is located at Turnhouse in the City of Edinburgh, Scotland, and was the busiest airport in Scotland in 2011, handling just under 9.4 million passengers in that year. It was also the sixth busiest airport in the UK by passengers and the fifth busiest by aircraft movements. It is located 5 nautical miles )9.3 km; 5.8 mi( west of the city centre and is situated just off the M8 motorway.
R2= 93%S.T.= 02013)F( = 9,688,572 Pax
Avinor – (airports traffic)
AS is a state-owned limited company that operates most of the civil airports in Norway. The Norwegian state, via the Norwegian Ministry of Transport and Communications, controls 100 percent of the share capital. Avinor was created on 1 January 2003, by the privatization of the Norwegian Civil Aviation Administration known as Luftfartsverket. Its head office is in Bjørvika, Oslo, located on the seaside of Oslo Central Station.
R2= 92%S.T.= 02013)F( = 49,847,034 Pax
Gold Coast Airport, or Coolangatta Airport
)IATA: OOL, ICAO: YBCG( is an Australian domestic and international airport at the southern end of the Gold Coast, some 100 km )62 mi( south of Brisbane and 25 km )16 mi( south of Surfers Paradise. The entrance to the airport is situated in the suburb of Bilinga on the Gold Coast. The runway itself straddles five suburbs of twin cities across the state border of Queensland and New South Wales. During summer these states are in two different time zones.
R2= 0.64%S.T.= 02013)F( = 5,551,812 Pax
Passengers Forecasting 2013Edinburgh Airport
Passengers Forecasting 2013Avinor Airport
Passengers Forecasting 2013Gold Coast Airport
400,000
500,000
600,000
700,000
800,000
900,000
1,000,000
1,100,000
No
of P
asse
nger
s
TIME (Month)
ForecastActual
R2 = 93 %S.T.= 02013(F) = 9,688,572 Pax
2,200,000
2,700,000
3,200,000
3,700,000
4,200,000
4,700,000
5,200,000
No
of P
asse
nger
s
TIME (Month)
ForecastActual
R2 = 92 %S.T.= 02013(F) = 49,847,034 Pax
300,000
350,000
400,000
450,000
500,000
550,000
600,000
No
of P
asse
nger
s
TIME (Month)
ForecastActual
R2 = 0.64 %S.T.= 02013(F) = 5,551,812 Pax
CAMA Magazine | issue 17 | December, 2012
Airport forecAsting

Cairns Airport
)IATA: CNS, ICAO: YBCS( is an international airport in Cairns, Queensland, Australia. Formerly operated by the Cairns Port Authority, the airport was sold by the Queensland Government in December 2008 to a private consortium. It is the seventh busiest airport in Australia. The airport is located 2.3 nautical miles )4.3 km; 2.6 mi( north northwest [1] of Cairns or 7 kilometres )4.3 mi( north of the Cairns central business district, in the suburb of Aeroglen. The airport lies between Mount Whitfield to the west and Trinity Bay to the east.
R2= 92%S.T.= 02013)F( = 4,297,288 Pax
[1] http://en.wikipedia.org/wiki/Main_Page
Melbourne Airport
)IATA: MEL, ICAO: YMML(, also known as Tullamarine Airport, is the primary airport serving the city of Melbourne, and the second busiest airport in Australia. It was opened in 1970 to replace the nearby Essendon Airport. Melbourne Airport is the sole international airport of the four airports serving the Melbourne metropolitan area.The airport is 23 km )14 mi( from the city centre. The airport has its own postcode—Melbourne Airport, Victoria )postcode 3045(. This is adjacent to the suburb of Tullamarine.
R2= 83%S.T.= 02013)F( = 29,942,351 Pax
Brisbane Airport
)IATA: BNE, ICAO: YBBN( is the sole passenger airport serving Brisbane and is the third busiest airport in Australia after Sydney Airport and Melbourne Airport. Brisbane Airport has won many awards. Brisbane is currently served with 46 domestic destinations in all States and Territories and 32 international destinations. For the 12 months ending May 2011 total passengers were 20,056,416.
R2= 93%S.T.= 02013)F( = 21,932,169 Pax
33
Passengers Forecasting 2013Brisbane Airport
Passengers Forecasting 2013Cairns Airport
Passengers Forecasting 2013Melbourne Airport
1,200,000
1,300,000
1,400,000
1,500,000
1,600,000
1,700,000
1,800,000
1,900,000
2,000,000
2,100,000
No
of P
asse
nger
s
TIME (Month)
ForecastActual
R2 = 93 %S.T.= 02013(F) = 21,932,169 Pax
200,000
250,000
300,000
350,000
400,000
450,000
No
of P
asse
nger
s
TIME (Month)
ForecastActual
R2 = 92 %S.T.= 02013(F) = 4,297,288 Pax
1,800,000
1,900,000
2,000,000
2,100,000
2,200,000
2,300,000
2,400,000
2,500,000
2,600,000
2,700,000
2,800,000
No
of P
asse
nger
s
TIME (Month)
ForecastActual
R2 = 83 %S.T.= 02013(F) = 29,942,351 Pax
CAMA Magazine | issue 17 | December, 2012
Airport forecAsting

28
Prepared by: Mohammed Salem AwadResearch Scholar – Aviation Management
Matching Long Range Data Targets By Short Range Data Targets
“Plans are nothing; planning is everything.” Dwight D. Eisenhower
Airports Forecasting
Forecasting is the right tool for a fair decision making, we use it to create a proper plans ,activities and setting up budgets. But what is the right effective model, what are the right parameters to measure the goodness of fits, and how to plan to match the long range targets by a short range targets, can we get same answer from different models. This is what we will address it in….
Nice Airport Case Study: 1- Developing Long Range Targets:Trend Model:Based on annual historical data period (1950-2011)Input Data: 51 sets (Annually)Coefficient of Determination: 99.6% Signal Tracking: 0.0000011 Results:Passengers Forecast 2012= 10,467,360Passengers Forecast 2013= 10,493,391
2- Developing Short Range Targets:Seasonality Model:Based on monthly 3 years data period (2009-2011)Input Data: 36 sets (Monthly)Coefficient of Determination: 96.7%Signal Tracking: -30.14 Results:Passengers Forecast 2012= 10,467,360Passengers Forecast 2013= 10,493,391
Summary: The results are fairly matched, so it possible to plan in such a way that, we utilize the annual trends to meet the annual cumulative forecast of the seasonality model for two forecasted years, keeping in mind the pre-request constrains for both models.
400000
500000
600000
700000
800000
900000
1000000
1100000
1200000
1300000
No
of P
asse
nger
s
TIME (Month)
ForecastActual
0
2000000
4000000
6000000
8000000
10000000
12000000
Pass
enge
rs
Years
ForecastPassengers
Forecasting 2012, 2013Seasonlity Model
Forecasting 2012, 2013
1950 - 2011 Passengers
Coefficient ofDetermination = 0.996
Signal Tracking = 0.0000011
R2= 96.7%
S.T.= -30.172012 (F)= 10,467,360 Pax2013 (F)= 10,493,391 Pax
2012(F)= 10,467,360 Pax2013(F)= 10,493,391 Pax
CAMA Magazine | issue 16 | September, 2012

29AIRPORTS FORecASTIng
Airports Forecasting:Airport forecasting is an important issue in Aviation industry. It becomes an integral parts of transportation planning. It sets targets and goals for the airports, either for long term or medium term planning. The primary statistical methods used in airport aviation activity forecasting are market share approach, econometric modeling, and time series modeling.
Model Used:BaBased on a historical data of the airports, (3 years on monthly bases) the mathematical model is developed where its fairness and goodness of fit can be defined by two important factors:
R2 (Coeff. Of Determination) > 80%S. T (Signal Tracking) ..(-4 < S.T. < 4)
This time we try to set (S.T.) to Zero
Airport Performances:There are many factors that may measure the airport performance, mainly:
1) Number of Passengers2) Aircraft Movement and;3) Freight
SANA’A AirportSana’a International Airport or El Rahaba Airport (Sana’a International) (IATA: SAH, ICAO: OYSN) is an international airport located in Sana’a, the capital of Yemen. Recently Yemen passes in a transition phase, as results a democracy. This situation effects on 2011 data base.
So the basic analysis addressing 2008, 2009, and 2010. And the forecasted period are 2011 and 2012. But in this issue we are addressed the Yemenia and Other Operators
Yemenia:Passenger Forecasting 2012 = 764,398 PaxPeak Periods: July-August Annual Growth : (0.02) % The Model is not fair as R = 44%
Other Operators:Passenger Forecasting 2012 = 600513PaxPeak Periods: July Annual Growth : 0.08 % The Model is not fair as R = 77%
Total –Yemenia and Other OperatorsPassenger Forecasting 2012 = 1,340,118PaxPeak Periods: July - August Annual Growth : 0.01 % The Model is not fair as R = 66%
yemen AIRPORTS
Sanaa Airport, Forecasting 2011, 2012Seasonlity Model (Other Carriers)
Sanaa Airport, Forecasting 2011, 2012Seasonlity Model (Yemenia)
Sanaa Airport, Forecasting 2011, 2012Seasonlity Model (IY + Other Carriers)
20000
25000
30000
35000
40000
45000
50000
55000
60000
65000
70000
No
of P
asse
nger
s
TIME (Month)
ForecastActual
80000
90000
100000
110000
120000
130000
140000
150000
160000
No
of P
asse
nger
s
TIME (Month)
ForecastActual
R2 = 77%
S.T.= 002012(F) = 600,513 PaxAnnual Growth : 0.08
R2= 66%
S.T.= -0.002012(F)= 1,340,118 PaxAnnual Growth : 0.01
40000
50000
60000
70000
80000
90000
100000
No
of P
asse
nger
s
TIME (Month)
ForecastActual
R2= 44%
S.T.= 002012(F)= 764,398 PaxAnnual Growth: (0.02)
CAMA Magazine | issue 16 | September, 2012

30 AIRPORTS FORecASTIng InTeRnATIOnAl AIRPORTS
Paris-Charles de Gaulle Airport
(IATA: CDG, ICAO: LFPG) (French: Aéroport Paris-Charles de Gaulle), is one of the world’s principal aviation centers, as well as France’s largest airport. It is named after Charles de Gaulle (1890–1970), leader of the Free French Forces and founder of the French Fifth Republic. It is located within portions of several communes, 25 km (16 mi) to the northeast of Paris. The airport serves as the principal hub for Air France. In 2011, the airport handled 60,970,551 passengers and 514,059 aircraft movements, making it the world’s sixth busiest airport and Europe’s second busiest airport (after London Heathrow) in passengers served.
Passenger Forecasting 2012= 62,166,461 PaxAnnual Growth: 2.6% The Model is fair fitted as R2= 93%
Denver International Airport
(IATA: DEN, ICAO: KDEN, FAA LID: DEN), often referred to as DIA, is an airport in Denver, Colorado. In 2011 Denver International Airport was the 11th-busiest airport in the world by passenger traffic with 52,699,298 passengers. It was the fifth-busiest airport in the world by aircraft movements with over 635,000 movements in 2010.. Denver International Airport is the main hub for low-cost carrier Frontier Airlines and commuter carrier Great Lakes Airlines. It is also the fourth-largest hub for United Airlines.
Passenger Forecasting 2012 = 53,986,884 PaxAnnual Growth: 2.21% The Model is fair fitted as R2 = 97.7%
Chicago O’Hare International Airport (IATA: ORD, ICAO: KORD, FAA LID: ORD), also known as O’Hare Airport, O’Hare Field, Chicago Airport, Chicago International Airport, or simply O’Hare, is a major airport located in the northwestern-most corner of Chicago, Illinois, United States. prior to 1998, O’Hare was the busiest airport in the world in terms of the number of passengers. O’Hare has a strong international presence, with flights to more than 60 foreign destinations: it is the fourth busiest international gateway in the United States behind John F. Kennedy International Airport in New York City, Los Angeles International Airport and Miami International Airport.
Passenger Forecasting 2012 = 67,859,340 PaxAnnual Growth: 1.34 % The Model is fair fitted as R2 = 97.3%
Forecasting 2012, 2013Seasonlity Model
Forecasting 2012, 2013Seasonlity Model
Forecasting 2012, 2013Seasonlity Model
3000000
3500000
4000000
4500000
5000000
5500000
6000000
6500000
No
of P
asse
nger
s
TIME (Month)
ForecastActual
R2= 93 %
S.T.= 02012(F)= 62,166,461 Pax2013 (F)= 63,812,317 PaxAnnual Growth= 2.6%
3000000
3500000
4000000
4500000
5000000
5500000
6000000
No
of P
asse
nger
s
TIME (Month)
ForecastActual
R2= 97.7 %
S.T.= 02012 (F)= 53,986,884 Pax2013 (F)= 55,184,393 PaxAnnual Growth: 2.21%
3000000
3500000
4000000
4500000
5000000
5500000
6000000
6500000
7000000
No
of P
asse
nger
s
TIME (Month)
ForecastActual
R2= 97.3%
S.T.= 0.002012 (F)= 67,859,340 Pax2013 (F)= 68,773,005 PaxAnnual Growth: 1.34%
CAMA Magazine | issue 16 | September, 2012

Edmonton International Airport
(IATA: YEG, ICAO: CYEG) is the primary air passenger and air cargo facility in the Edmonton region of the Canadian province of Alberta. It is a hub facility for Northern Alberta and Northern Canada, providing regularly scheduled nonstop flights to over fifty communities in Canada, the United States, Latin America and Europe. It is one of Canada’s largest airports by total land area, the 5th busiest airport by passenger traffic, and the 10th busiest by aircraft movements. Operated by Edmonton Airports and located 14 NM (26 km; 16 mi) south southwest of downtown Edmonton, in Leduc County, and adjacent to the City of Leduc, it served over 6.2 million passengers in 2011.
Passenger Forecasting 2012 = 6,329,057 PaxAnnual Growth : 1.4 % The Model is fair fitted as R2 = 91.9 %
London Heathrow Airport or Heathrow
(IATA: LHR, ICAO: EGLL) is a major international airport serving London, England, United Kingdom. Located in the London Borough of Hillingdon, in West London, Heathrow is the busiest airport in the United Kingdom and the third busiest airport in the world (as of 2012) in terms of total passenger traffic, handling more international passengers than any other airport around the globe. It is also the busiest airport in the EU by passenger traffic and the third busiest in Europe given the number of traffic movements, with a figure surpassed only by Paris-Charles de Gaulle Airport and Frankfurt Airport.
Passenger Forecasting 2012 = 70,557,827 PaxAnnual Growth : 2.6 % The Model is fair fitted as R2 = 89 %
Nice Côte d’Azur Airport
(IATA: NCE, ICAO: LFMN) is an airport located 3.2 NM (5.9 km; 3.7 mi) southwest of Nice, in the Alpes-Maritimes department of France. The airport is positioned 7 km (4 mi) west of the city centre, and is the principal port of arrival for passengers to the Côte d’Azur. It is the third busiest airport in France after Charles de Gaulle International Airport and Orly Airport, both in Paris. Due to its proximity to the Principality of Monaco, it also serves as the city-state’s airport, Some airlines marketed Monaco as a destination via Nice Airport. it is also serves as a hub for Air France.
Passenger Forecasting 2012 = 10,496,380 PaxAnnual Growth : 2.62 % The Model is fair fitted as R2 = 98.3 %
31AIRPORTS FORecASTIng InTeRnATIOnAl AIRPORTS
Forecasting 2012, 2013Seasonlity Model
Forecasting 2012, 2013Seasonlity Model
Forecasting 2012, 2013Seasonlity Model
400000
500000
600000
700000
800000
900000
1000000
1100000
1200000
1300000
No
of P
asse
nger
s
TIME (Month)
ForecastActual
Optimum Solution
R2= 98.3 %
S.T.= 02012 (F)= 10,496,380 Pax2013 (F)= 10,772,005 Pax Annual Growth : 2.6 %
450000
470000
490000
510000
530000
550000
570000
590000
610000
No
of P
asse
nger
s
TIME (Month)
ForecastActual
R2= 91.9%
S.T.= 02012(F)= 6,329,057 Pax2013 (F)= 6,419,625 PaxAnnual Growth= 1.4%
4000000
4500000
5000000
5500000
6000000
6500000
7000000
7500000
No
of P
asse
nger
s
TIME (Month)
ForecastActual
R2= 89%
S.T.= 02012(F)= 70,557,827 Pax2013(F)= 72,406,685 Pax Annual Growth: 2.6%
CAMA Magazine | issue 16 | September, 2012

30
Prepared by: Mohammed Salem AwadResearcher in Aviation science
“The golden rule is that there are no golden rules” George Bernard Shaw
Airports Forecasting
Figure (1). Recommended Forecasting Methods
Measuring Forecast Accuracy
Coefficient of Determination (R2 ) Vs Signal Tracking ( S. T.)
Usually in practicing forecast, the golden rule for fitting data is to define R2 as the best indicator, this statement is not perfectly right ... why !!!!! It may indicate that, there is relation between two sets of data, but not with minimizing errors, this can be explained clearly by Turkish Airline data as shown in the figure (1),The process started by a normal forecasting procedure and by test the Goodness of Fit and calculating R2, then reduce the forecasting results by 500 and test the Goodness of Fit by calculating R2, again reduce the forecasting results now by 1000 and test the Goodness of Fit by calculating R2 . You will find that R2 is same for the three trails which is (97%) this prove that R2 just indicate a relation between two set of data. While there is another factor that refine the final results this factor is S. T. (Signal Tracking). Which control and set to the acceptable level (Zero).so Error = Actual Passengers – ForecastOr et = At – Ft
while there are many other factors as:
Mean Forecast Error (MFE)For n time periods where we have actual demand and forecast values:Ideal value = 0;MFE > 0, model tends to under-forecastMFE < 0, model tends to over-forecast
Mean Absolute Deviation (MAD)For n time periods where we have actual demand and forecast values:
While MFE is a measure of forecast model bias, MAD indicates the absolute size of the errorsTracking SignalUsed to pinpoint forecasting models that need adjustment
As long as the tracking signal is between –4 and 4, assume the model is working correctly.In this analysis, we control the value of Tracking Signal to be Zero while R is evaluated normally provided that it should be greater than 80%
-
500
1,000
1,500
2,000
2,500
3,000
3,500
4,000
4,500
5,000
01-J
an-0
9
01-M
ar-0
9
01-M
ay-0
9
01-J
ul-0
9
01-S
ep-0
9
01-N
ov-0
9
01-J
an-1
0
01-M
ar-1
0
01-M
ay-1
0
01-J
ul-1
0
01-S
ep-1
0
01-N
ov-1
0
01-J
an-1
1
01-M
ar-1
1
01-M
ay-1
1
01-J
ul-1
1
01-S
ep-1
1
01-N
ov-1
1
01-J
an-1
2
01-M
ar-1
2
01-M
ay-1
2
01-J
ul-1
2
01-S
ep-1
2
01-N
ov-1
2
01-J
an-1
3
01-M
ar-1
3
01-M
ay-1
3
01-J
ul-1
3
01-S
ep-1
3
01-N
ov-1
3
No.
of P
asse
nger
s x
1000
TIME
Turkish Airline - Traffic Forecasting 2012
Forecast -500Forecast-1000ActualForecast
All are same ( R2 ) = 97 %S.T.= are different2012(F) = …………… PAX
CAMA Magazine | issue 15 | June, 2012

31AIRPORTS FORecASTIng
Airports Forecasting:Airport forecasting is an important issue in Aviation industry. It becomes an integral parts of transportation planning. It sets targets and goals for the airports, either for long term or medium term planning. The primary statistical methods used in airport aviation activity forecasting are market share approach, econometric modeling, and time series modeling.
Model Used:Based on a historical data of the airports, (3 years on monthly bases) the mathematical model is developed where its fairness and goodness of fit can be defined by two important factors:
R2 (Coeff. Of Determination) > 80%S. T (Signal Tracking) ..(-4 < S.T. < 4)
This time we set (S.T.) to Zero
Airport Performances:There are many factors that may measure the airport performance, mainly:
1) Number of Passengers2) Aircraft Movement and;3) Freight
SANA’A AirportSana’a International Airport or El Rahaba Airport (Sana’a International) (IATA: SAH, ICAO: OYSN) is an international airport located in Sana’a, the capital of Yemen. Recently Yemen passes in a transition phase, as results a democracy. This situation effects on 2011 data base.
So the basic analysis addressing 2008, 2009, and 2010. And the forecasted period are 2011 and 2012. But in this issue we are addressed the Domestic segment.
Passenger Forecasting 2012 = 688,596 PaxPeak Periods: not properly defined Annual Growth : 19 % The Model is good as R = 77%
Aircraft Movement Forecasting 2012 = 19,983 Peak Periods: not properly defined Annual Growth: 29%.The Model is hardly fitted as R = 73%
Freights &Mails Forecasting 2012 = 689 Tone. Peak Periods: not properly definedAnnual Growth: - 5 %.The Model reflects a lot of discrepancies as R = 45% with a negative trends and growth, so results should be take in caution.
yemen AIRPORTS
-
10,000
20,000
30,000
40,000
50,000
60,000
70,000
No
of P
asse
nger
s
TIME (Month)
SANA'A Airport (Seasonlity Model)Domestic Passengers Forecasting 2012
Forecast
Actual
-
20
40
60
80
100
120
140
160
01-J
an-0
8
01-M
ar-0
8
01-M
ay-0
8
01-J
ul-0
8
01-S
ep-0
8
01-N
ov-0
8
01-J
an-0
9
01-M
ar-0
9
01-M
ay-0
9
01-J
ul-0
9
01-S
ep-0
9
01-N
ov-0
9
01-J
an-1
0
01-M
ar-1
0
01-M
ay-1
0
01-J
ul-1
0
01-S
ep-1
0
01-N
ov-1
0
01-J
an-1
1
01-M
ar-1
1
01-M
ay-1
1
01-J
ul-1
1
01-S
ep-1
1
01-N
ov-1
1
01-J
an-1
2
01-M
ar-1
2
01-M
ay-1
2
01-J
ul-1
2
01-S
ep-1
2
01-N
ov-1
2
Frei
ght +
Mai
ls
TIME (Month)
SANA'A Airport (Seasonlity Model)Freight & Mails inTonne Forecasting 2012
ForecastActual
-
200
400
600
800
1,000
1,200
1,400
1,600
1,800
2,000
01-J
an-0
8
01-M
ar-0
8
01-M
ay-0
8
01-J
ul-0
8
01-S
ep-0
8
01-N
ov-0
8
01-J
an-0
9
01-M
ar-0
9
01-M
ay-0
9
01-J
ul-0
9
01-S
ep-0
9
01-N
ov-0
9
01-J
an-1
0
01-M
ar-1
0
01-M
ay-1
0
01-J
ul-1
0
01-S
ep-1
0
01-N
ov-1
0
01-J
an-1
1
01-M
ar-1
1
01-M
ay-1
1
01-J
ul-1
1
01-S
ep-1
1
01-N
ov-1
1
01-J
an-1
2
01-M
ar-1
2
01-M
ay-1
2
01-J
ul-1
2
01-S
ep-1
2
01-N
ov-1
2
No
of L
andi
ng
TIME (Month)
SANA'A Airport (Seasonlity Model)Aircraft Movement Forecasting 2011-2012
ForecastActual
R2= 45%S.T.= -0.002012(F)= 689Annual Growth: - 0.05
R2= 73%S.T.= -0.002012(F)= 19,983Annual Growth= 0.29
R2= 77%S.T.= -0.002012(F)= 688,596Annual Growth: 0.19
CAMA Magazine | issue 15 | June, 2012

32 AIRPORTS FORecASTIng ARABIc AIRPORTS
Doha International Airport
(IATA: DOH, ICAO: OTBD) is the only commercial airport in Qatar.. There are 60 check-in gates, 8 baggage claim belts and over 1,000 car parking spaces.. As of 2010, it was the world’s 27th busiest airport by cargo traffic. The existing airport will be replaced in early 2013 when the first phase of New Doha International Airport is expected to open. The new airport is located 4 km from the current facility. It covers 5400 acres (approx. 2200 hectares) of land and will be able to handle 12.5 million passengers per year after the first phase of construction is completed. The airport is currently ranked as a 3-star by Skytrax.
Passenger Forecasting 2012 = 19,841,946 PaxAnnual Growth: 13% The Model is fairly fitted as R2 = 96%.
Queen Alia International Airport
(IATA: AMM, ICAO: OJAI) is Jordan’s largest airport that is situated in Zizya (زيزياء) area, 20 miles (32 km) south of Amman. The airport has three terminals: two passenger terminals and one cargo terminal. It is the main hub of Royal Jordanian Airlines, the national flag carrier, as well as being a major hub for Jordan Aviation. It was built in 1983 and is named after Queen Alia, the third wife of the late King Hussein of Jordan.
Passenger Forecasting 2012= 5,623,315 PaxAnnual Growth: 4% The Model is fair fitted as R2= 88%.
Beirut Rafic Hariri International Airport (formerly Beirut International Airport; IATA: BEY, ICAO: OLBA; is located 9 kilometres (5.6 mi) from the city centre in the southern suburbs of Beirut, Lebanon and is the only operational commercial airport in the country. It is the hub for Lebanon’s national carrier, Middle East Airlines. It is also the hub for the Lebanese cargo carrier Trans Mediterranean Airways, as well as the charter carriers Med Airways and Wings of Lebanon. The airport was selected by “Skytrax Magazine” as the second best airport and aviation hub in the Middle East; it came behind Dubai International Airport.
Passenger Forecasting 2012= 5,669,461 PaxAnnual Growth: 3% The Model is fairly fitted as R2= 94%.
200,000
300,000
400,000
500,000
600,000
700,000
800,000
900,000
No
of P
asse
nger
s
TIME (Month)
QAIA Airport (Seasonlity Model)Passengers Forecasting 2012
Forecast
Actual
200,000
300,000
400,000
500,000
600,000
700,000
800,000
900,000
No
of P
asse
nger
s
TIME (Month)
Beirut Airport (Seasonlity Model)Passengers Forecasting 2012
Forecast
Actual
200,000
300,000
400,000
500,000
600,000
700,000
800,000
900,000
No
of P
asse
nger
s
TIME (Month)
Beirut Airport (Seasonlity Model)Passengers Forecasting 2012
Forecast
Actual
800,000
1,000,000
1,200,000
1,400,000
1,600,000
1,800,000
2,000,000
2,200,000
No
of P
asse
nger
s
TIME (Month)
Doha Airport (Seasonlity Model)Passengers Forecasting 2012
Forecast
Actual
R2= 94%S.T.= 0.002012(F)= 5,669,461Annual Growth= 0.03
R2= 88%S.T.= 0.002012(F)= 5,623,315Annual Growth= 0.04
R2= 96%S.T.= 0.002012(F)= 19,841,946Annual Growth= 0.13
CAMA Magazine | issue 15 | June, 2012

Geneva International Airport
(IATA: GVA, ICAO: LSGG), formerly known as Cointrin Airport and officially as Genève Aéroport, is an airport serving Geneva, Switzerland. It is located 4 km (2.5 mi) northwest of the city centre. It is a major hub for EasyJet Switzerland and Darwin Airline, a lesser hub for Swiss International Air Lines and the former hub of Swiss World Airways, which ceased operations in 1998. Geneva International Airport has extensive convention facilities and hosts an office of the International Air Transport Association (IATA) and the world headquarters of Airports Council International (ACI).
Passenger Forecasting 2012= 13,622,031 PaxAnnual Growth: 6% The Model is fairly fitted as R2 = 91%
Sydney (Kingsford Smith) Airport (also known as Kingsford-Smith Airport and Sydney Airport)
(IATA: SYD, ICAO: YSSY) (ASX: SYD) is located in the suburb of Mascot in Sydney, Australia. It is the only major airport serving Sydney, and is a primary hub for Qantas, as well as a secondary hub for Virgin Australia and Jetstar Airways. Sydney Airport is one of the oldest continually operated airports in the world, and the busiest airport in Australia, handling 36 million passengers in 2010 and 289,741 aircraft movements in 2009. It was the 28th busiest airport in the world in 2009. Currently 47 domestic destinations are served to Sydney direct.
Passenger Forecasting 2012= 36,346,492 PaxAnnual Growth: 2% The Model is fairly fitted as R2= 84% Annual Growth: 6.1% The Model is fair fitted as R2= 96%
Montréal-Pierre Elliott Trudeau International Airport
(IATA: YUL, ICAO: CYUL), formerly known as Montréal-Dorval International Airport, is located on the Island of Montreal. It is the busiest airport in the province of Quebec, the third busiest airport in Canada by passenger traffic and fourth busiest by aircraft movements, with 13,660,862 passengers in 2011 and 217,545 movements in 2010. and it is one of the main gateways into Canada with 8,436,165 or 61.7% of its passengers being on non-domestic flights.
Passenger Forecasting 2012= 14,251,824 PaxAnnual Growth: 5% The Model is fair fitted as R2= 97%
33AIRPORTS FORecASTIng InTeRnATIOnAl AIRPORTS
2,400,000
2,600,000
2,800,000
3,000,000
3,200,000
3,400,000
No
of P
asse
nger
s
TIME (Month)
Sydney Airport (Seasonlity Model)Passengers Forecasting 2012
Forecast
Actual
600,000
800,000
1,000,000
1,200,000
1,400,000
1,600,000
No
of P
asse
nger
s
TIME (Month)
Montréal Airport (Seasonlity Model)Passengers Forecasting 2012
Forecast
Actual
600,000
800,000
1,000,000
1,200,000
1,400,000
1,600,000
No
of P
asse
nger
s
TIME (Month)
Genève Airport (Seasonlity Model)Passengers Forecasting 2012
Forecast
Actual
R2= 84%S.T.= 0.002012(F)= 36,346,492Annual Growth= 0.02
R2= 91%S.T.= 0.002012(F)= 13,622,031Annual Growrh = 0.06
R2= 97%S.T.= 0.002012(F)= 14,251,824Annual Growth= 0.05
CAMA Magazine | issue 15 | June, 2012

30
Airport Forecasting Forecasts of airport aviation activity have become an integral part of transportation planning. Most airport-specific forecasts are prepared on behalf of airport sponsors and state or regional agencies. The type and method of forecasting can depend importantly on the purpose for which the forecast is being made.
The primary statistical methods used in airport aviation activity forecasting include market share analysis, econometric modeling, and time series modeling. These methods can be used to create forecasts of future airport activity over time. Simulation models are a separate method of analysis used to provide snapshot estimates of traffic flows across a network or through an airport.
The main measuring performance factors for airports are traffic passengers, aircraft movements and freight. And consequently these factors are breakdown to sublevels in term of departures, arrivals and transit activities.
Forecasting MethodsThe majority of airport and regional and state aviation activity studies use fairly simple methods to produce forecasts, and address forecast uncertainty only in informal and nonsystematic ways. Figure (1). Summary of Recommended Forecasting Methods.
Prepared by: Mohammed Salem AwadResearcher in Aviation science
Purpose of Activity Forecast
Historical Data Availability
Increasing Data Requirements
Stable TrendStable Relationship with:
External Forecasts Causal Variables
Short-Term Operational Planning: Annual Budgeting
Time series trend extrapolation, or smoothing/Box-Jenkins if complex time dependencies
Market Share Forecasting Econometric Modeling
Identify Long-Term Capacity Needs: Financial Planning to Support Facility Expansion
Market share forecasting or econometric modeling Market Share Forecasting Econometric Modeling
Examine Alternative Environment:Compare Alternative Policies Econometric Modeling
Obtain High-Fidelity Estimates of Travel Time and Delays (Aircraft or Passengers)
Simulation Modeling
“The easiest way to predict the future is to invent it.” Immanuel Kant - German Philosopher
Reference: Aviation Forecasting - FAA
AIRPORTS FORecASTIng
Figure (1). Recommended Forecasting Methods
CAMA Magazine | issue 14 | March, 2012
AIRPORTS FORecASTIng

SANA'A Airport (Seasonlity Model)Passengers Forecasting 2011-2012
100,000
120,000
140,000
160,000
180,000
200,000
220,000
No
of T
otal
Pas
sang
ers
TIME (Month)
ForecastActual
R2 = 78 %S.T.= -2.022012(F) = 2,048,088 Pax
01/0
1/20
08
01/0
4/ 2
008
01/0
7/20
08
01/1
0/20
08
01/0
1/20
09
01/0
4/20
09
01/1
0/20
09
01/1
0/20
09
01/0
1/20
10
01/0
4/20
10
01/0
7/20
10
01/1
0/20
10
01/0
1/20
11
01/0
4/20
11
01/0
7/20
11
01/1
0/20
11
01/0
1/20
12
01/0
4/20
12
01/0
7/20
12
01/1
0/20
12
Aircraft Movement Forecasting 2011-2012
1,400
1,800
2,200
2,600
3,000
3,400
3,800
No
of (L
andi
ng +
Tak
eoff)
ForecastActual
R2 = 94 %S.T.= -12.652012(F) = 39,606
TIME (Month)
01/0
1/20
08
01/0
3/20
08
01/0
5/20
08
01/0
7/20
08
01/0
9/20
08
01/1
1/20
08
01/0
1/20
09
01/0
3/20
09
01/0
5/20
09
01/0
7/20
09
01/0
9/20
09
01/1
1/20
09
01/0
1/20
10
01/0
3/20
10
01/0
5/20
10
01/0
7/20
10
01/0
9/20
10
01/1
1/20
10
01/0
1/20
11
01/0
3/20
11
01/0
5/20
11
01/0
7/20
11
01/0
9/20
11
01/1
1/20
11
01/0
1/20
12
01/0
3/20
12
01/0
5/20
12
01/0
7/20
12
01/0
9/20
12
01/1
1/20
12
Freights & Mails Forecasting 2011-2012
1,000
1,200
1,400
1,600
1,800
2,000
2,200
2,400
Frei
ght +
Mai
l (To
nne)
ForecastActual
R2 = 38 %S.T.= -3.022012(F) = 23493 Tonne
TIME (Month)
01/0
1/20
08
01/0
3/20
08
01/0
5/20
08
01/0
7/20
08
01/0
9/20
08
01/1
1/20
08
01/0
1/20
09
01/0
3/20
09
01/0
5/20
09
01/0
7/20
09
01/0
9/20
09
01/1
1/20
09
01/0
1/20
10
01/0
3/20
10
01/0
5/20
10
01/0
7/20
10
01/0
9/20
10
01/1
1/20
10
01/0
1/20
11
01/0
3/20
11
01/0
5/20
11
01/0
7/20
11
01/0
9/20
11
01/1
1/20
11
01/0
1/20
12
01/0
3/20
12
01/0
5/20
12
01/0
7/20
12
01/0
9/20
12
01/1
1/20
12
31AIRPORTS FORecASTIng
Airports Forecasting:Airport forecasting is an important issue in Aviation industry. It becomes an integral parts of transportation planning. It sets targets and goals for the airports, either for long term or medium term planning. The primary statistical methods used in airport aviation activity forecasting are market share approach, econometric modeling, and time series modeling.
Model Used:Based on a historical data of the airports, (3 years on monthly bases) the mathematical model is developed where its fairness an goodness of fit can be defined by two important factors:
R2 (Coeff. Of Determination) > 80%S. T (Signal Tracking) ..(- 4 < S.T. < 4)
Airport Performances:There are many factors that may measure the airport performance, mainly:
1) Number of Passengers2) Aircraft Movement and3) Freight
SANA’A AirportSana’a International Airport or El Rahaba Airport (Sana’a International) (IATA: SAH, ICAO: OYSN) is an international airport located in Sana’a, the capital of Yemen. Recently Yemen passes in a transition phase, as results a democracy. This situation effects on 2011 data base.
So the basic analysis addressing 2008, 2009, and 2010. And the forecasted period are 2011 and 2012.
Passenger Forecasting 2012 = 2,048,088 PaxPeak Periods: Jul =210,230 Aug =206,205Annual Growth Rate: 3 % The Model is good as R = 78%
Aircraft Movement Forecasting 2012 = 39,606 Peak Periods: Jul =3540 Aug =3361 Annual Growth: 16%.The Model is fairly fitted as R = 94%And reflects the recent data
Freights &Mails Forecasting 2012 = 23493 Tone. Peak Periods: May =2205 Tone.Annual Growth: 2.4%.The Model reflects a lot of discrepancies as R=38% while its signal tracking = -3.02, so results should take in caution.
yemen AIRPORTS
CAMA Magazine | issue 14 | March, 2012
Passengers Forecasting 2012
Aircraft Movement Forecasting 2012
Freights & Mails Forecasting 2012
Sana’a Airport (Seasonlity Model)

32 AIRPORTS FORecASTIng ARAb AIRPORTS
400,000
450,000
500,000
550,000
600,000
650,000
700,000
No
of P
asse
nger
s
Sharjah AirportTraffic Forecasting 2012
ForecastActual
R2 = 89 %S.T.= -1.172012(F) = 6,863,141 PAX
TIME (Month)
01/0
1/20
09
01/0
3/20
09
01/0
5/20
09
01/0
7/20
09
01/0
9/20
09
01/1
1/20
09
01/0
1/20
10
01/0
3/20
10
01/0
5/20
10
01/0
7/20
10
01/0
9/20
10
01/1
1/20
10
01/0
1/20
11
01/0
3/20
11
01/0
5/20
11
01/0
7/20
11
01/0
9/20
11
01/1
1/20
11
01/0
1/20
12
01/0
3/20
12
01/0
5/20
12
01/0
7/20
12
01/0
9/20
12
01/1
1/20
12
650,000
700,000
750,000
800,000
850,000
900,000
950,000
No
of P
asse
nger
s
Bahrain AirportTraffic Forecasting 2011-2012
ForecastActual
R2 = 71%S.T.= - 2.792012(F)= 9,287,978 Pax
TIME (Month)
01/0
1/20
08
01/0
4/ 2
008
01/0
7/20
08
01/1
0/20
08
01/0
1/20
09
01/0
4/20
09
01/1
0/20
09
01/1
0/20
09
01/0
1/20
10
01/0
4/20
10
01/0
7/20
10
01/1
0/20
10
01/0
1/20
11
01/0
4/20
11
01/0
7/20
11
01/1
0/20
11
01/0
1/20
12
01/0
4/20
12
01/0
7/20
12
01/1
0/20
12
Dubai International Airport
(IATA: DXB, ICAO: OMDB) is an international airport serving Dubai. It is a major aviation hub in the Middle East, and is the main airport of Emirates States.
In 2011 DXB handled a record 50.98 million in passenger traffic, a 8% increase over the 2010 fiscal year. This made it the 13th busiest airport in the world by passenger traffic and the 4th busiest airport in the world by international passenger traffic.
Passenger Forecasting 2012 = 56,277,296 PaxPeak Periods: Jul = 5116686 Aug = 5109256 Annual Growth Rate: 10.5% The Model is fairly good as R2 = 89%.
Bahrain International Airport
(IATA: BAH, ICAO: OBBI) is an international airport located in Muharraq, an island on the northern tip of Bahrain, about 7 km (4.3 mi) northeast of the capital Manama. It is the primary hub for Gulf Air and Bahrain Air.
The airport has a three star rating from Skytrax’s airport grading exercise. In 2010, Bahrain Airport was named as the winner of the Best Airport in the Middle East Award at the Skytrax 2010 World Airport Awards.
Passenger Forecasting 2012 = 9,287,978 PaxPeak Periods: Jul = 903722Aug = 912338 Annual Growth Rate: 1.3% The Model is fair as R2 = 71%.
Sharjah International Airport (IATA: SHJ, ICAO: OMSJ) is located in Sharjah, United Arab Emirates. Sharjah Airport is the second largest Middle East Airfreight Hub in terms of cargo tonnage, according to official 2009 statistics from Airports Council International. Ground services company, Sharjah Aviation Services, handled 421,398 tonnes in 2009 - a 16.1% increase year on year.
Sharjah International Airport is home base of the low-cost carrier Air Arabia.
Passenger Forecasting 2012 = 6,863,141 PaxPeak Periods: Jul = 903722Aug = 912338 Annual Growth Rate: 4.9% The Model is fair fitted as R2 = 89%.
2,500,000
3,000,000
3,500,000
4,000,000
4,500,000
5,000,000
5,500,000
No
of P
asse
nger
s
Dubia AirportTraffic Forecasting 2011-2012
ForecastActual
R2 = 89%S.T.= 3.062012 (F) =56,277,296 Pax
TIME (Month)
01/0
1/20
08
01/0
4/ 2
008
01/0
7/20
08
01/1
0/20
08
01/0
1/20
09
01/0
4/20
09
01/1
0/20
09
01/1
0/20
09
01/0
1/20
10
01/0
4/20
10
01/0
7/20
10
01/1
0/20
10
01/0
1/20
11
01/0
4/20
11
01/0
7/20
11
01/1
0/20
11
01/0
1/20
12
01/0
4/20
12
01/0
7/20
12
01/1
0/20
12
CAMA Magazine | issue 14 | March, 2012
Traffic Forecasting 2011 - 2012
Traffic Forecasting 2011 - 2012
Traffic Forecasting 2012
Dubai Airport (Seasonlity Model)
Bahrain Airport (Seasonlity Model)
Sharjah Airport (Seasonlity Model)

Hong Kong International Airport (HKIA)
(IATA: HKG, ICAO: VHHH) is the main airport in Hong Kong. It is colloquially known as Chek Lap Kok Airport. The airport opened for commercial operations in 1998, replacing Kai Tak, and is an important regional trans-shipment centre, passenger hub and gateway for destinations in Mainland China and the rest of Asia. Hong Kong International Airport has won eight Skytrax World Airport Awards for customer satisfaction in eleven years. HKIA ranked second and third in 2009 and 2010 respectively for the Skytrax World Airport Awards, and has also won the Skytrax World Airport of the Year 2011.
Passenger Forecasting 2012 = 60,503,000 PaxPeak Periods: Jul = 5165000Aug = 5314000 Annual Growth: 6.4% The Model is fair fitted as R2 = 85%
3,000
3,500
4,000
4,500
5,000
5,500
No
of P
asse
nger
s ( 1
000)
HONG KONG Airport (Seasonlity Model)Passengers Forecasting 2012
ForecastActual
R2 = 85 %S.T.= 2.432012(F) = 60,503,000 Pax
TIME (Month)
01/0
1/20
09
01/0
3/20
09
01/0
5/20
09
01/0
7/20
09
01/0
9/20
09
01/1
1/20
09
01/0
1/20
10
01/0
3/20
10
01/0
5/20
10
01/0
7/20
10
01/0
9/20
10
01/1
1/20
10
01/0
1/20
11
01/0
3/20
11
01/0
5/20
11
01/0
7/20
11
01/0
9/20
11
01/1
1/20
11
01/0
1/20
12
01/0
3/20
12
01/0
5/20
12
01/0
7/20
12
01/0
9/20
12
01/1
1/20
12
Amsterdam Airport Schiphol
(IATA: AMS, ICAO: EHAM) is the Netherlands’ main international airport, The airport is the primary hub for KLM, Martinair, Transavia and Arkefly. Schiphol is an important European airport, ranking as Europe’s 4th busiest and the world’s 12th busiest by total passenger traffic. It also ranks as the world’s 6th busiest by international passenger traffic and the world’s 17th largest for cargo tonnage. 45.3 million passengers passed through the airport in 2010, a 4% increase compared with 2009.
Passenger Forecasting 2012 = 51,989,842 PaxPeak Periods: Jul = 5440000Aug = 5360000 Annual Growth: 6.1% The Model is fair fitted as R2 = 96%2,500
3,000
3,500
4,000
4,500
5,000
5,500
No
of P
asse
nger
s (1
000)
(Seasonlity Model)Passengers Forecasting 2012
ForecastActual
R2 = 96 %S.T.= -1.922012(F) = 51,989,842 Pax
TIME (Month)
01/0
1/20
09
01/0
3/20
09
01/0
5/20
09
01/0
7/20
09
01/0
9/20
09
01/1
1/20
09
01/0
1/20
10
01/0
3/20
10
01/0
5/20
10
01/0
7/20
10
01/0
9/20
10
01/1
1/20
10
01/0
1/20
11
01/0
3/20
11
01/0
5/20
11
01/0
7/20
11
01/0
9/20
11
01/1
1/20
11
01/0
1/20
12
01/0
3/20
12
01/0
5/20
12
01/0
7/20
12
01/0
9/20
12
01/1
1/20
12
Hartsfield–Jackson Atlanta International Airport
(IATA: ATL, ICAO: KATL, FAA LID: ATL), known locally as Atlanta Airport, Hartsfield Airport, and Hartsfield–Jackson. It has been the world’s busiest airport by passenger traffic and number of landings and take-offs since 2005. Hartsfield–Jackson held its ranking as the world’s busiest airport in 2010, both in terms of passengers and number of flights, by accommodating 89 million passengers (243,000 passengers daily) and 950,119 flights.
Passenger Forecasting 2012 = 94,030,596 PaxPeak Periods: Jul = 9,028,647 Annual Growth: 2.2% The Model is fair fitted as R2 = 96%.
5,500
6,000
6,500
7,000
7,500
8,000
8,500
9,000
9,500
No
of P
asse
nger
s (1
000)
(Seasonlity Model)Passengers Forecasting 2012
ForecastActual
R2 = 96 %S.T.= 0.002012(F) = 94,030,595 Pax
TIME (Month)
01/0
1/20
09
01/0
3/20
09
01/0
5/20
09
01/0
7/20
09
01/0
9/20
09
01/1
1/20
09
01/0
1/20
10
01/0
3/20
10
01/0
5/20
10
01/0
7/20
10
01/0
9/20
10
01/1
1/20
10
01/0
1/20
11
01/0
3/20
11
01/0
5/20
11
01/0
7/20
11
01/0
9/20
11
01/1
1/20
11
01/0
1/20
12
01/0
3/20
12
01/0
5/20
12
01/0
7/20
12
01/0
9/20
12
01/1
1/20
12
33AIRPORTS FORecASTIng InTeRnATIOnAl AIRPORTS
CAMA Magazine | issue 14 | March, 2012
Passengers Forecasting 2012
Passengers Forecasting 2012
Passengers Forecasting 2012
Atlanta Airport (Seasonlity Model)
Hong Kong Airport (Seasonlity Model)
Schiphol Airport (Seasonlity Model)

Mohammed Salem Awadh
Currently, he is a Consultant at Yemenia – Yemen Airways, has an Executive - MBA, from a dual MBA program form MSM and Sana’a University ( 2010), A bachelor’s degree in Mechanical Engineering from Aden University (1986), IATA Diploma in Airline Management – 1996 (Geneva ), IATA Diploma in Airline Marketing (distinction) -2006 (Geneva ), he joined Yemenia in 1988, and hold many managerial various positions among which; Head of reliability and maintenance, projects and research manager, Acting a Corporate Planning Director, Aden Regional Director and finally Chairman Adviser . He served many Yemeni companies and airlines as a scientific consultant in supply chain, forecasting and maintenance. Also he served as member of the both the Arabic Strategic Team and Arabic Planning Committee of AACO. Mohammed is a member of AGIFORS and ATRS.