AN AIRLINE NETWORK DESIGN APPROACH CONSIDERING ENVIRONMENTAL AND
Airline Network Strategies Bruce Tecklenburg
Network, Fleet and Schedule
Strategic Planning
Module 5: 30 March 2015
Istanbul Technical University
Air Transportation Management
M.Sc. Program
2
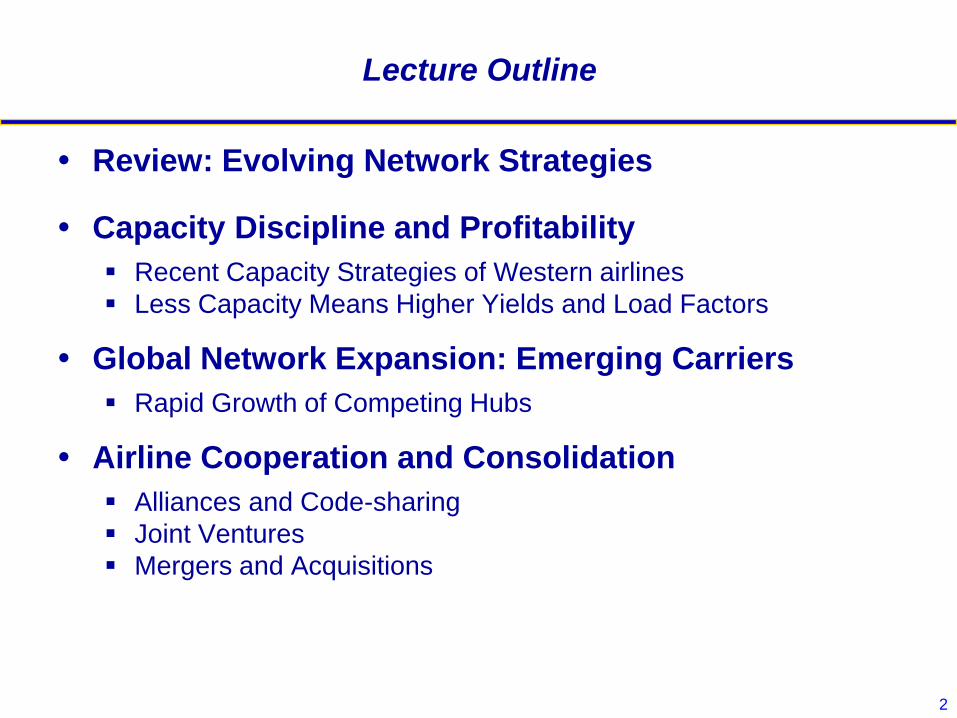
Lecture Outline
Review: Evolving Network Strategies
Capacity Discipline and Profitability
Recent Capacity Strategies of Western airlines
Less Capacity Means Higher Yields and Load Factors
Global Network Expansion: Emerging Carriers
Rapid Growth of Competing Hubs
Airline Cooperation and Consolidation
Alliances and Code-sharing
Joint Ventures
Mergers and Acquisitions
2 20 de marzo de 2015
3
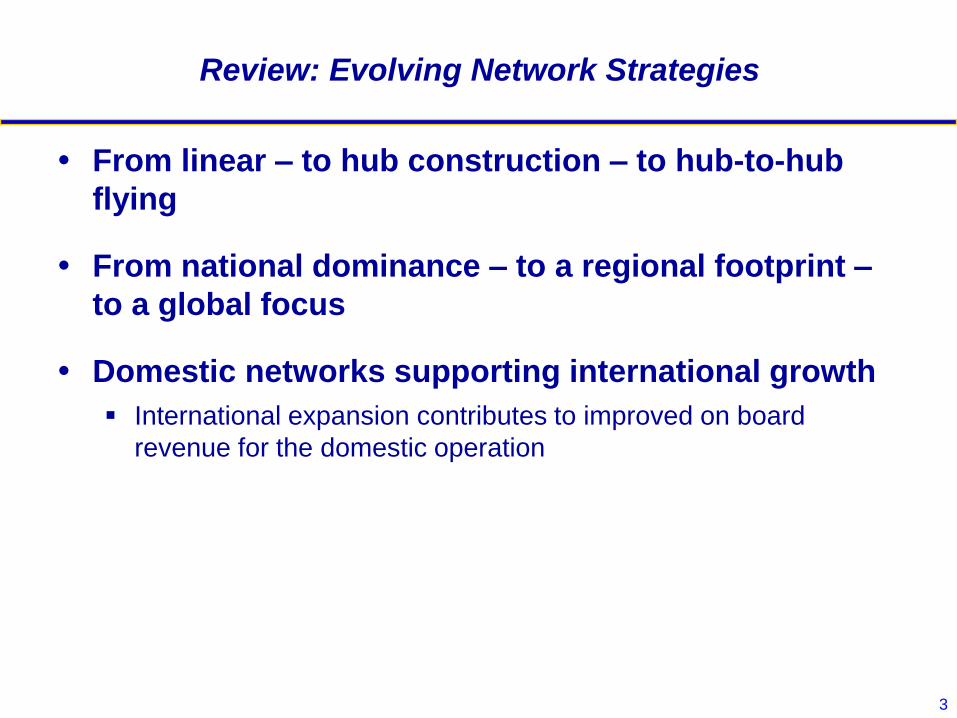
Review: Evolving Network Strategies
From linear – to hub construction – to hub-to-hub
flying
From national dominance – to a regional footprint –
to a global focus
Domestic networks supporting international growth
International expansion contributes to improved on board
revenue for the domestic operation
4
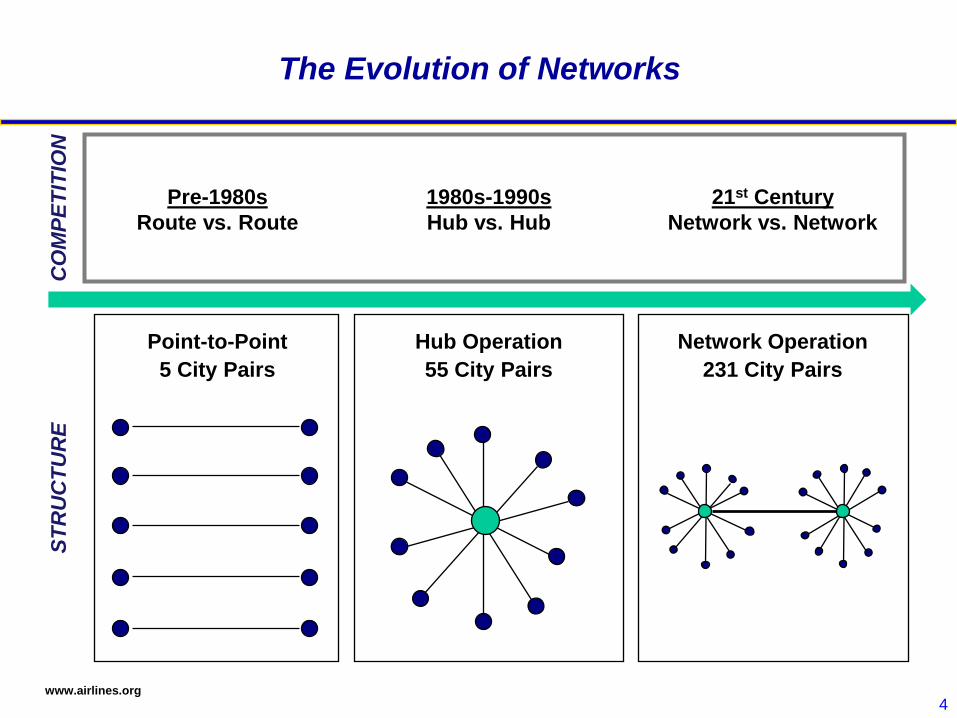
The Evolution of Networks
Hub Operation
55 City Pairs
Network Operation
231 City Pairs
Point-to-Point
5 City Pairs
Pre-1980s
Route vs. Route
1980s-1990s
Hub vs. Hub
21st Century
Network vs. Network
CO
MP
ET
ITIO
N
ST
RU
CT
UR
E
www.airlines.org
5
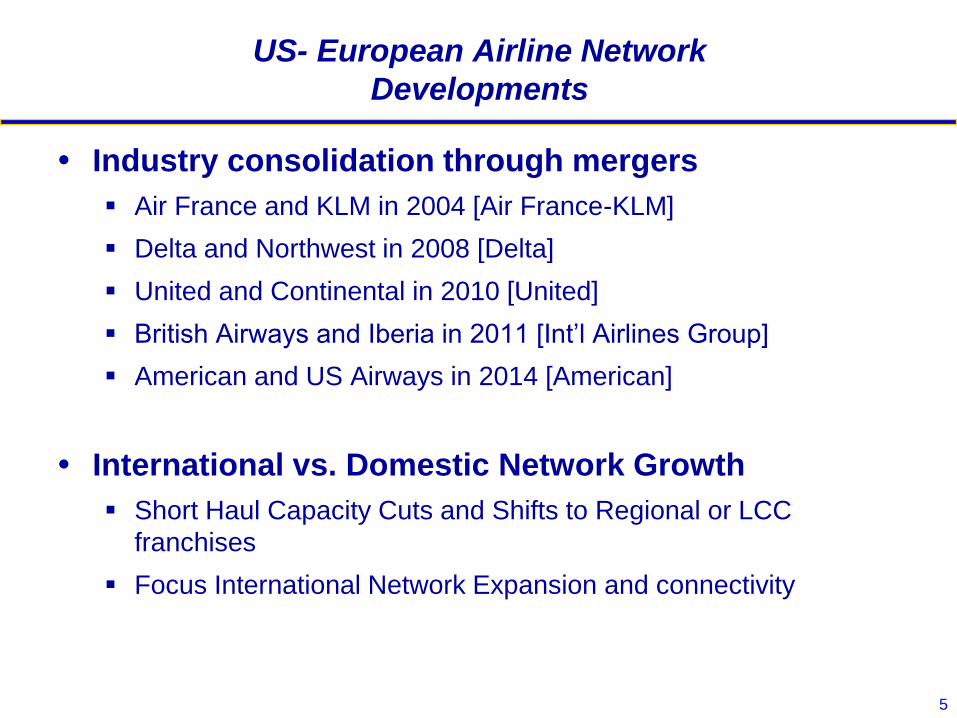
US- European Airline Network
Developments
Industry consolidation through mergers
Air France and KLM in 2004 [Air France-KLM]
Delta and Northwest in 2008 [Delta]
United and Continental in 2010 [United]
British Airways and Iberia in 2011 [Int’l Airlines Group]
American and US Airways in 2014 [American]
International vs. Domestic Network Growth
Short Haul Capacity Cuts and Shifts to Regional or LCC
franchises
Focus International Network Expansion and connectivity
6
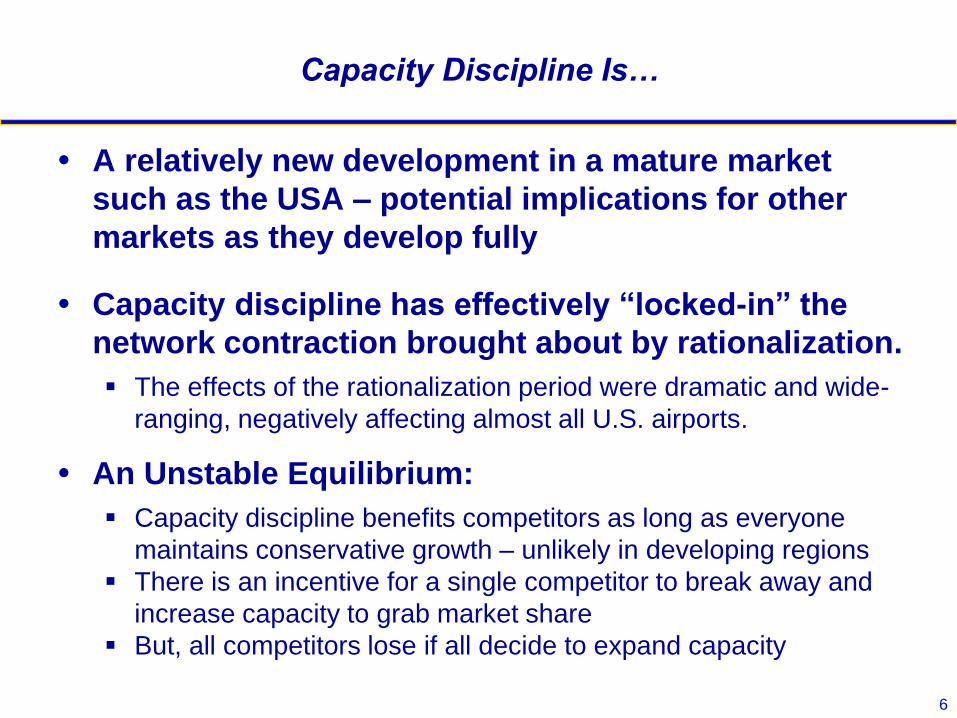
Capacity Discipline Is…
A relatively new development in a mature market
such as the USA – potential implications for other
markets as they develop fully
Capacity discipline has effectively “locked-in” the
network contraction brought about by rationalization.
The effects of the rationalization period were dramatic and wide-
ranging, negatively affecting almost all U.S. airports.
An Unstable Equilibrium:
Capacity discipline benefits competitors as long as everyone
maintains conservative growth – unlikely in developing regions
There is an incentive for a single competitor to break away and
increase capacity to grab market share
But, all competitors lose if all decide to expand capacity
7
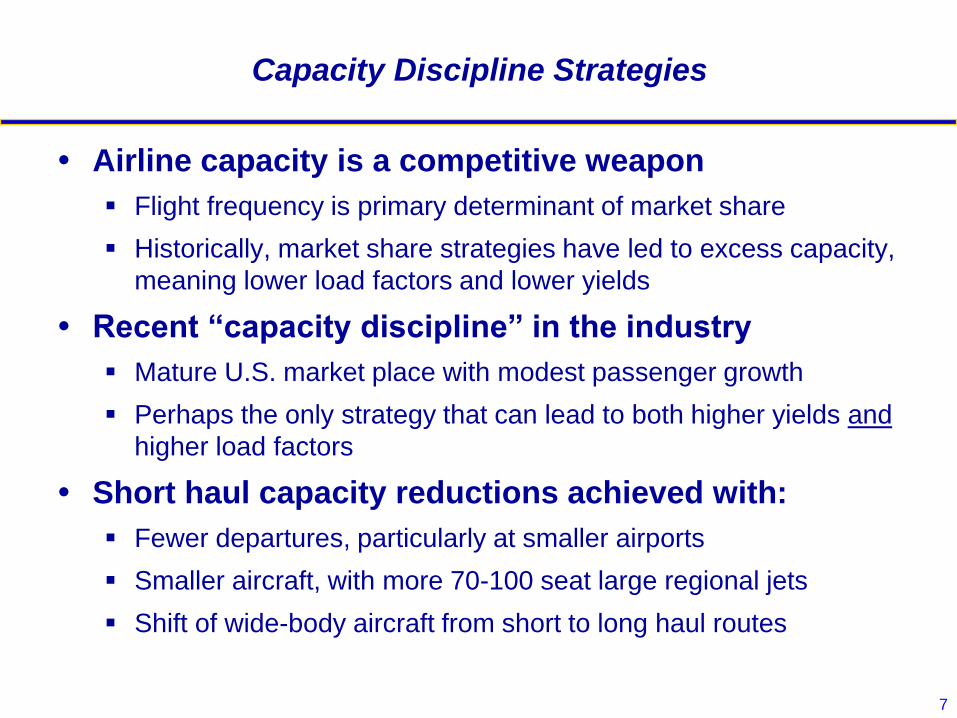
Capacity Discipline Strategies
Airline capacity is a competitive weapon
Flight frequency is primary determinant of market share
Historically, market share strategies have led to excess capacity,
meaning lower load factors and lower yields
Recent “capacity discipline” in the industry
Mature U.S. market place with modest passenger growth
Perhaps the only strategy that can lead to both higher yields and
higher load factors
Short haul capacity reductions achieved with:
Fewer departures, particularly at smaller airports
Smaller aircraft, with more 70-100 seat large regional jets
Shift of wide-body aircraft from short to long haul routes
8
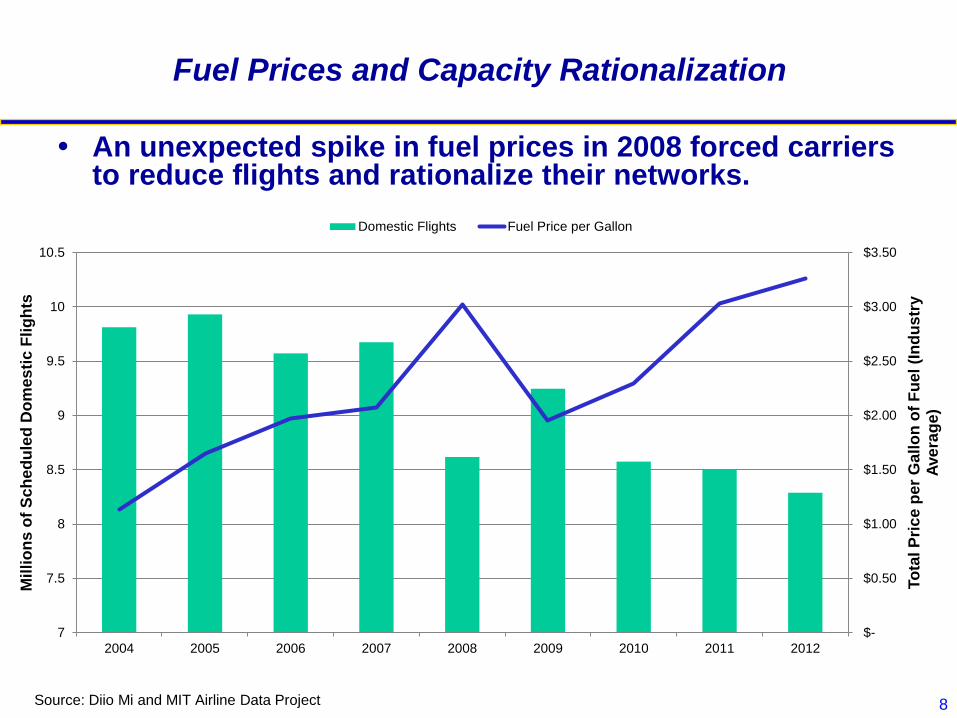
Fuel Prices and Capacity Rationalization
$-
$0.50
$1.00
$1.50
$2.00
$2.50
$3.00
$3.50
7
7.5
8
8.5
9
9.5
10
10.5
2004 2005 2006 2007 2008 2009 2010 2011 2012
To
tal P
ric
e p
er
Ga
llo
n o
f F
ue
l (I
nd
us
try
Ave
rag
e)
Mil
lio
ns o
f S
ch
ed
ule
d D
om
es
tic F
lig
hts
Domestic Flights Fuel Price per Gallon
An unexpected spike in fuel prices in 2008 forced carriers to reduce flights and rationalize their networks.
Source: Diio Mi and MIT Airline Data Project
9
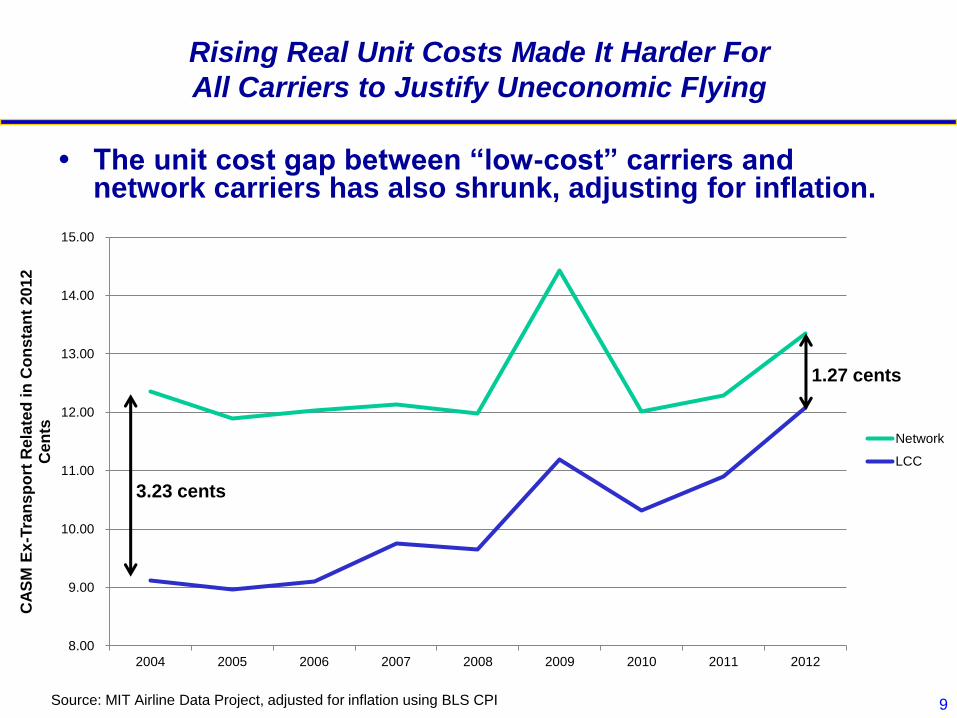
Rising Real Unit Costs Made It Harder For
All Carriers to Justify Uneconomic Flying
The unit cost gap between “low-cost” carriers and network carriers has also shrunk, adjusting for inflation.
8.00
9.00
10.00
11.00
12.00
13.00
14.00
15.00
2004 2005 2006 2007 2008 2009 2010 2011 2012
CA
SM
Ex
-Tra
nsp
ort
Rela
ted
in
Co
ns
tan
t 2
01
2
Cen
ts
Network
LCC
Source: MIT Airline Data Project, adjusted for inflation using BLS CPI
3.23 cents
1.27 cents
11
Global Network Expansion:
Emerging Global Carriers
Continued rapid growth of these airlines will affect
global traffic flows
Emirates (Dubai), Etihad (Abu Dhabi), Qatar (Doha) and Turkish
(Istanbul) building large hubs that depend on connecting traffic
Future success is highly dependent on negotiating new bilateral
rights to further expand their hub networks
Implications for airports
Emerging carriers looking for new spoke cities to feed their
connecting global hubs with 6th freedom international traffic
Operations involve long-haul, wide-body (and A380) aircraft and
full-service products (premium classes, lounges)
Competition among airports to attract these new services – at
BOS, Turkish started in May 2014 and Emirates in March 2014
12
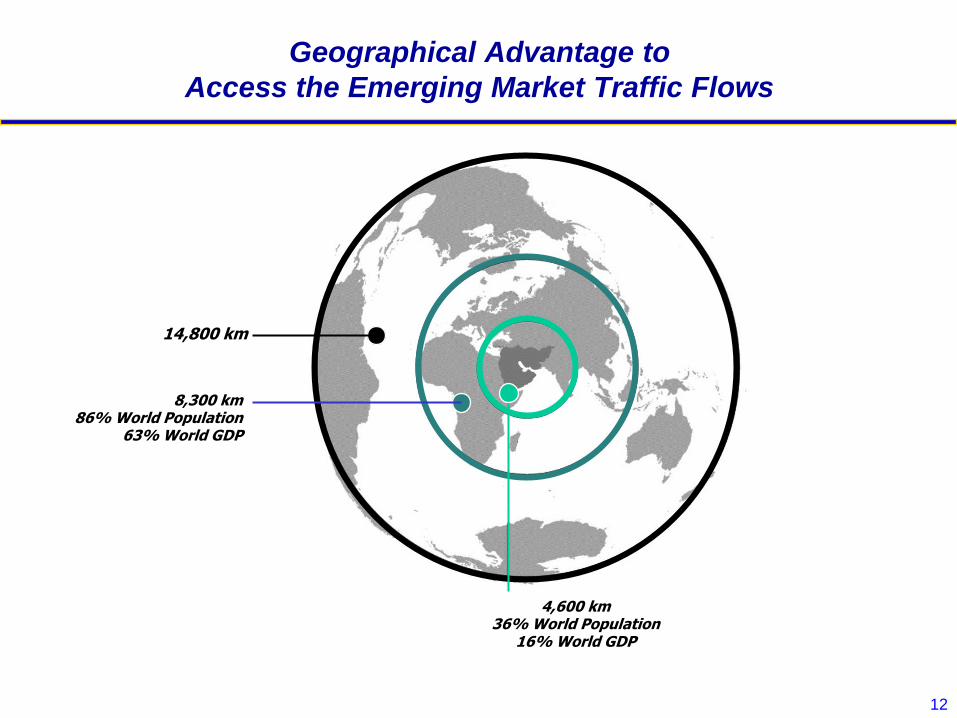
Geographical Advantage to
Access the Emerging Market Traffic Flows
14,800 km
8,300 km 86% World Population
63% World GDP
4,600 km 36% World Population
16% World GDP
13
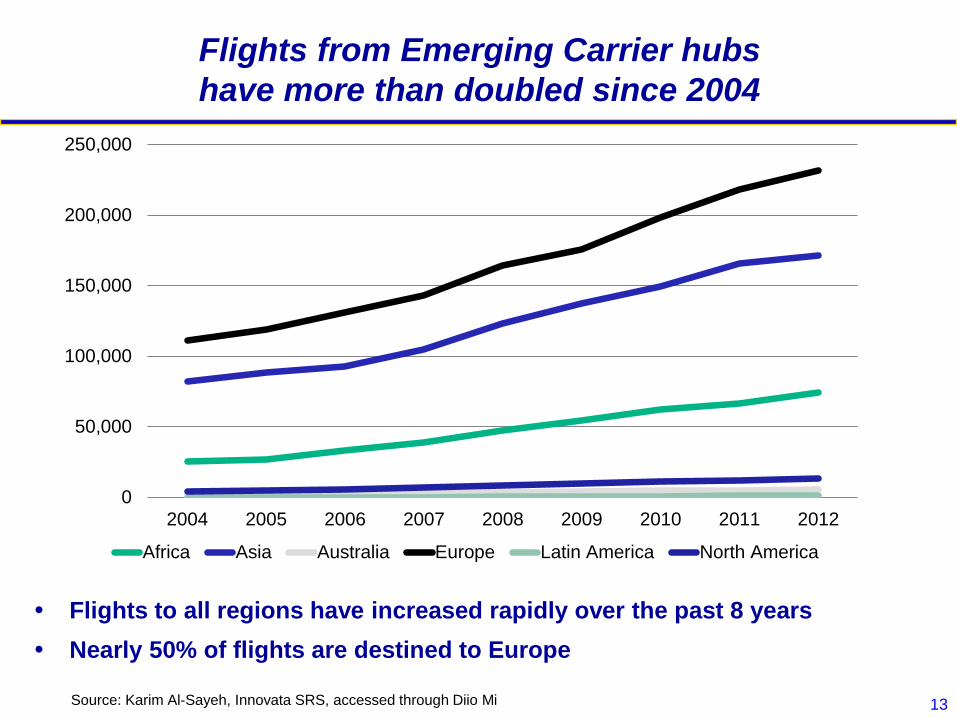
Flights from Emerging Carrier hubs
have more than doubled since 2004
Flights to all regions have increased rapidly over the past 8 years
Nearly 50% of flights are destined to Europe
0
50,000
100,000
150,000
200,000
250,000
2004 2005 2006 2007 2008 2009 2010 2011 2012
Africa Asia Australia Europe Latin America North America
Source: Karim Al-Sayeh, Innovata SRS, accessed through Diio Mi
14
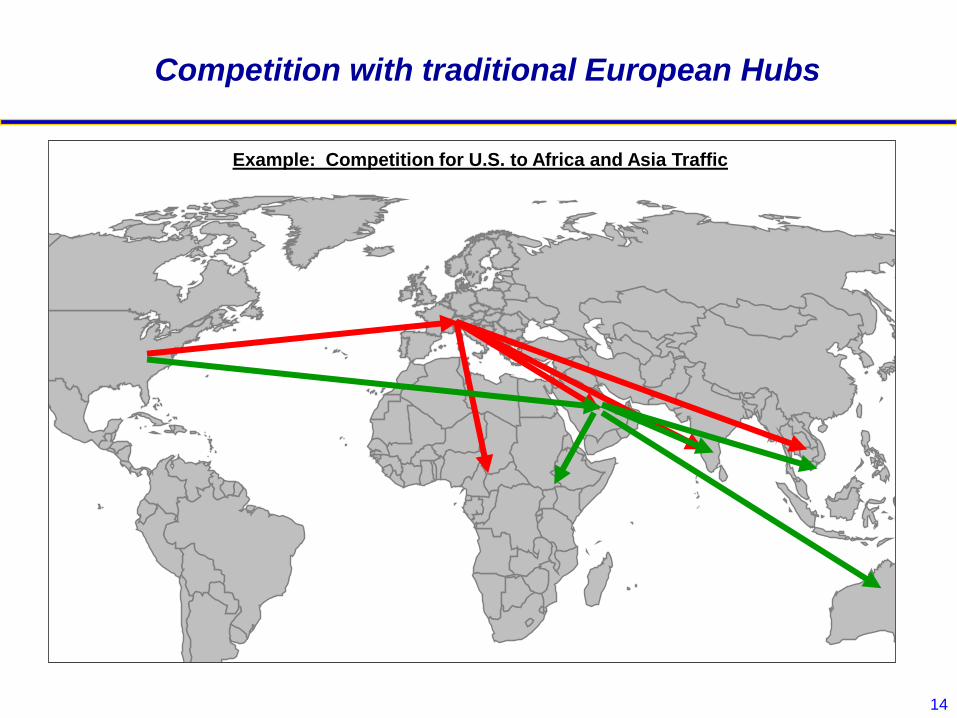
Competition with traditional European Hubs
Example: Competition for U.S. to Africa and Asia Traffic
15
What are the implications of the forecasted
fleet growth for the emerging carriers?
How will they attract 100 million new passengers?
Is it reasonable to assume that they can maintain 10% growth
rates through the end of the decade?
Can their home airports accommodate the influx of wide-body
aircraft?
What effect will the emerging carriers have on global
air transportation?
How will their growth further affect legacy carriers around the
world?
Will the growth of new LCCs and the revamping of legacy carriers
affect them?
Can all four emerging carriers coexist?
16
Airline Cooperation and Consolidation
Regulatory hurdles block the type of cross-border
consolidation that has occurred in other industries.
International flight operations still regulated by bilateral
agreements
Limits on foreign ownership of airlines in many countries
Influence of political and union forces against such consolidation
Anti-trust laws can constrain mergers and cooperation even
within same country
Many forms of cooperation possible:
Code-sharing agreements between two airlines
Membership in global airline alliances
Joint ventures to share both revenues and costs
Mergers and acquisitions
17
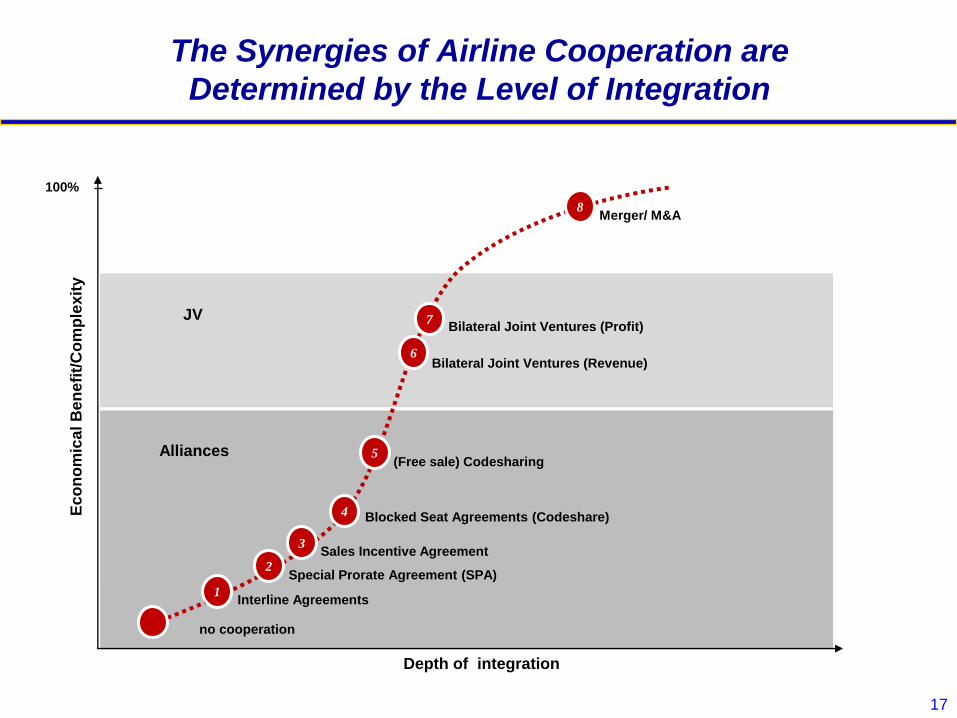
The Synergies of Airline Cooperation are
Determined by the Level of Integration E
co
no
mic
al B
en
efi
t/C
om
ple
xit
y
Special Prorate Agreement (SPA)
(Free sale) Codesharing
Merger/ M&A
Depth of integration
100%
no cooperation
Interline Agreements
Sales Incentive Agreement
Blocked Seat Agreements (Codeshare)
1
2
3
4
5
6
8
Alliances
JV
Bilateral Joint Ventures (Revenue)
Bilateral Joint Ventures (Profit) 7
18
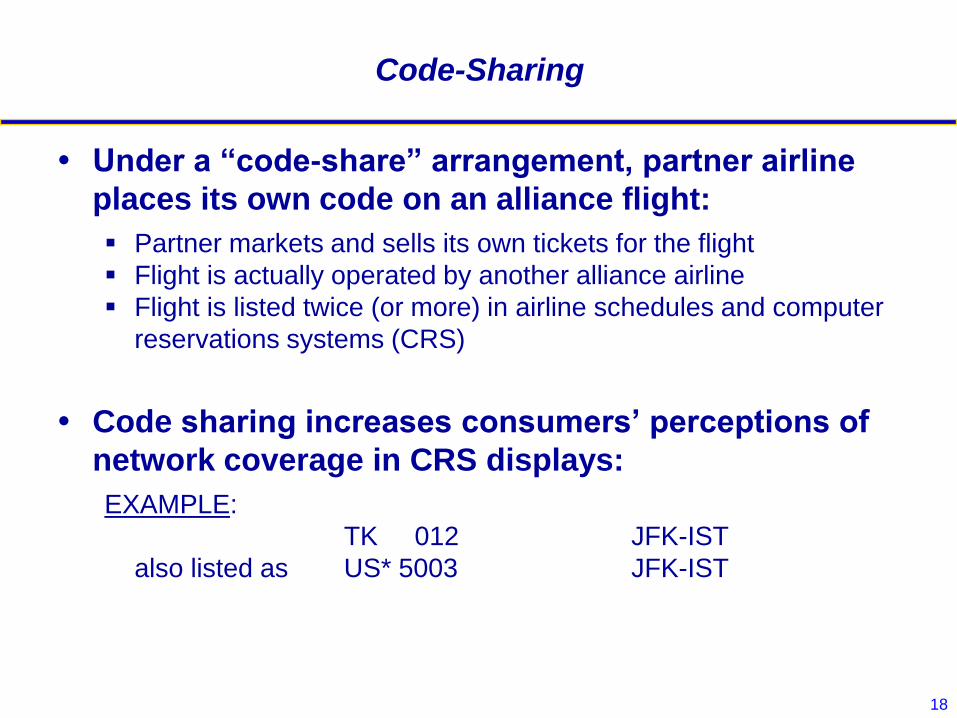
Code-Sharing
Under a “code-share” arrangement, partner airline
places its own code on an alliance flight:
Partner markets and sells its own tickets for the flight
Flight is actually operated by another alliance airline
Flight is listed twice (or more) in airline schedules and computer
reservations systems (CRS)
Code sharing increases consumers’ perceptions of
network coverage in CRS displays:
EXAMPLE:
TK 012 JFK-IST
also listed as US* 5003 JFK-IST
19
Airline Alliances and Network Coverage
“Strategic alliances” between two airlines take the
economic logic of hub networks one step further:
Partner airlines can expand their network coverage without
increasing their own flights and operating costs
Leads to further consolidation of loads, as two or more airlines
now contribute passengers to a single “alliance flight”
Marketing power of larger networks is reinforced--more
destinations, seamless connections, frequent flyer benefits
Additional cost savings are possible in alliance airlines due to
combined flights, airport check-in and club operations, integrated
purchasing and information systems
20
Hubs
Airline I
Hubs
Airline II
Network
Airline II
Network
Airline I
Aircraft
Airline IAircraft
Airline II
Aircraft
Airline II
& Airline I
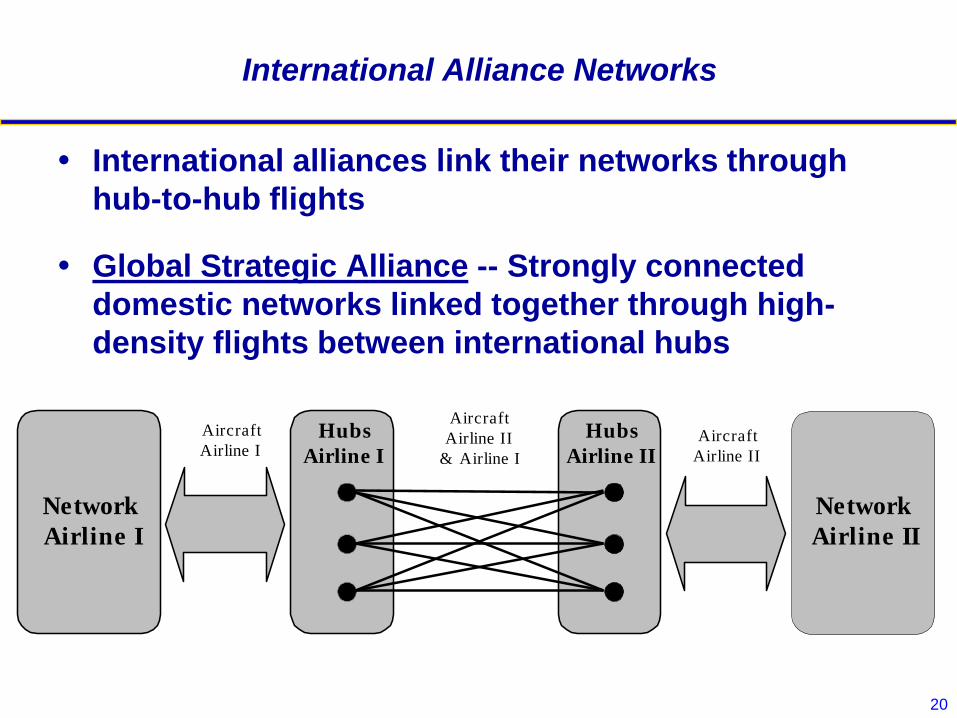
International Alliance Networks
International alliances link their networks through
hub-to-hub flights
Global Strategic Alliance -- Strongly connected
domestic networks linked together through high-
density flights between international hubs
21
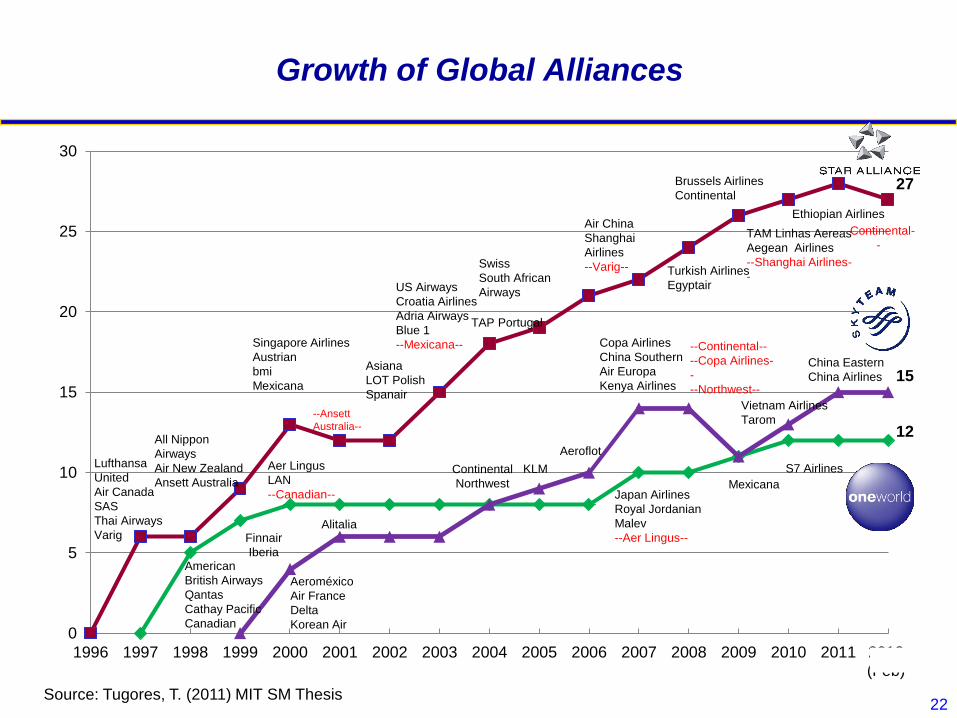
Global Airline Alliances
Airline alliances are strategic partnerships between
several airlines which focus primarily on large scale
code-sharing agreements
KLM – Northwest Alliance in 1989 was the first step in
the establishment of multinational alliances
Anti-trust immunity is a central tenet of airline
alliances
Currently there are 3 large airline alliances:
Star Alliance (1997)
oneworld (1999)
SkyTeam (2000)
22
0
5
10
15
20
25
30
1996 1997 1998 1999 2000 2001 2002 2003 2004 2005 2006 2007 2008 2009 2010 2011 2012(Feb)
Aeroméxico
Air France
Delta
Korean Air
Alitalia
Continental
Northwest
KLM
Aeroflot
Copa Airlines
China Southern
Air Europa
Kenya Airlines
--Continental--
--Copa Airlines-
-
--Northwest--
Vietnam Airlines
Tarom
China Eastern
China Airlines
American
British Airways
Qantas
Cathay Pacific
Canadian
Finnair
Iberia
Aer Lingus
LAN
--Canadian-- Japan Airlines
Royal Jordanian
Malev
--Aer Lingus--
Mexicana
S7 Airlines Lufthansa
United
Air Canada
SAS
Thai Airways
Varig
All Nippon
Airways
Air New Zealand
Ansett Australia
Singapore Airlines
Austrian
bmi
Mexicana
--Ansett
Australia--
Asiana
LOT Polish
Spanair
US Airways
Croatia Airlines
Adria Airways
Blue 1
--Mexicana--
Swiss
South African
Airways
Air China
Shanghai
Airlines
--Varig--
TAP Portugal
Turkish Airlines
Egyptair
Brussels Airlines
Continental
TAM Linhas Aereas
Aegean Airlines
--Shanghai Airlines-
-
--Continental-
-
27
15
12
Ethiopian Airlines
Growth of Global Alliances
Source: Tugores, T. (2011) MIT SM Thesis
23
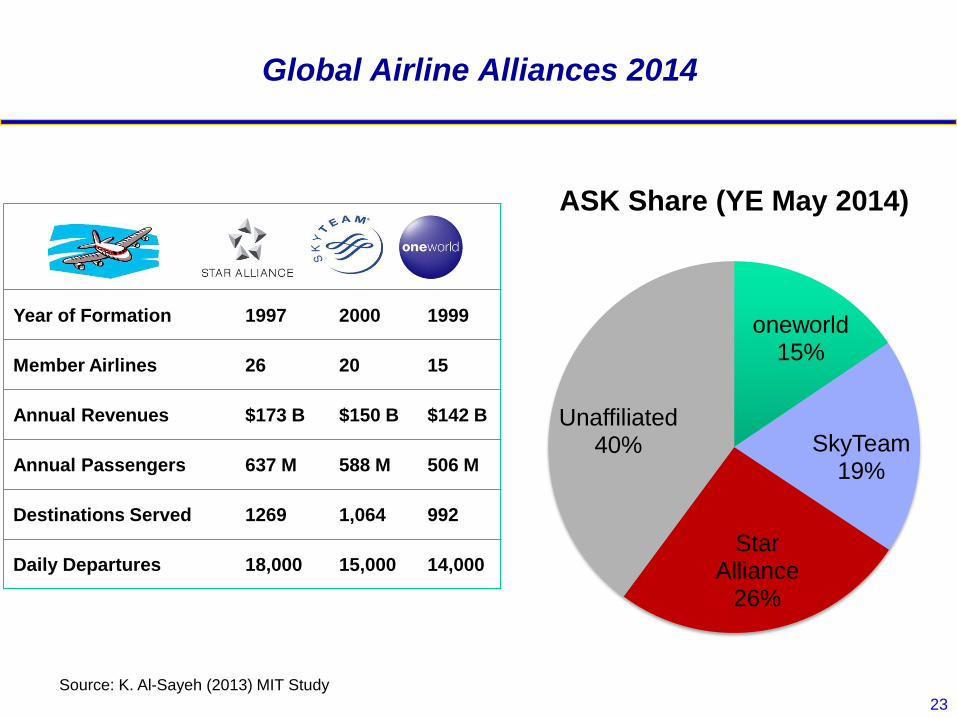
Global Airline Alliances 2014
Year of Formation 1997 2000 1999
Member Airlines 26 20 15
Annual Revenues $173 B $150 B $142 B
Annual Passengers 637 M 588 M 506 M
Destinations Served 1269 1,064 992
Daily Departures 18,000 15,000 14,000
Source: K. Al-Sayeh (2013) MIT Study
oneworld 15%
SkyTeam 19%
Star Alliance
26%
Unaffiliated 40%
ASK Share (YE May 2014)
24
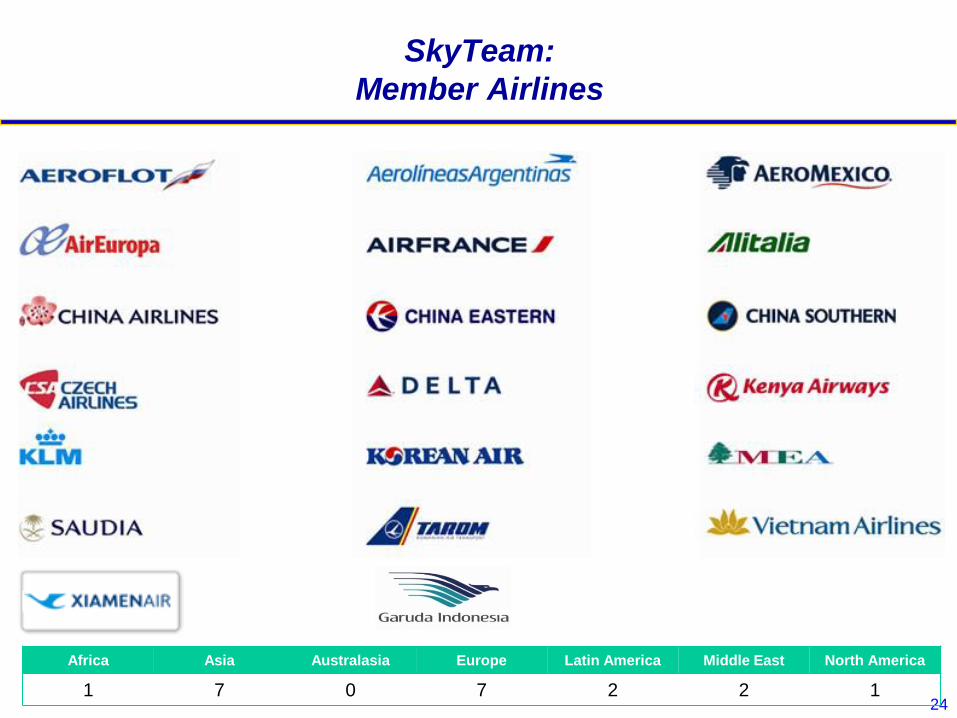
SkyTeam:
Member Airlines
Africa Asia Australasia Europe Latin America Middle East North America
1 7 0 7 2 2 1
25
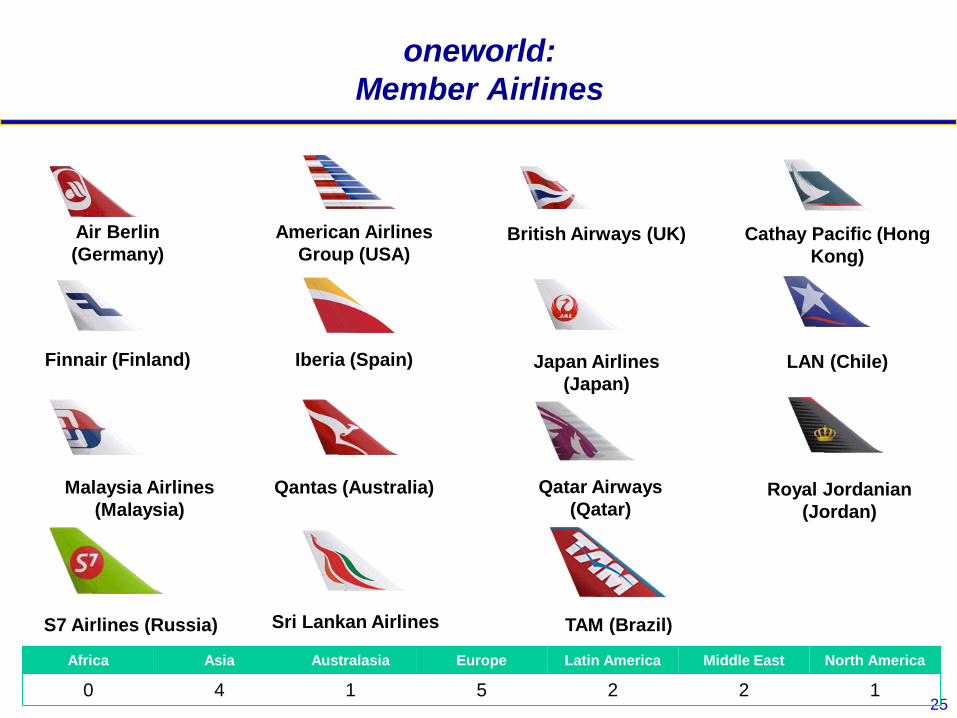
oneworld:
Member Airlines
American Airlines
Group (USA)
Air Berlin
(Germany) British Airways (UK) Cathay Pacific (Hong
Kong)
Iberia (Spain) Finnair (Finland) Japan Airlines
(Japan)
LAN (Chile)
Qantas (Australia) Malaysia Airlines
(Malaysia) Royal Jordanian
(Jordan)
S7 Airlines (Russia)
Qatar Airways
(Qatar)
TAM (Brazil) Sri Lankan Airlines
Africa Asia Australasia Europe Latin America Middle East North America
0 4 1 5 2 2 1
26
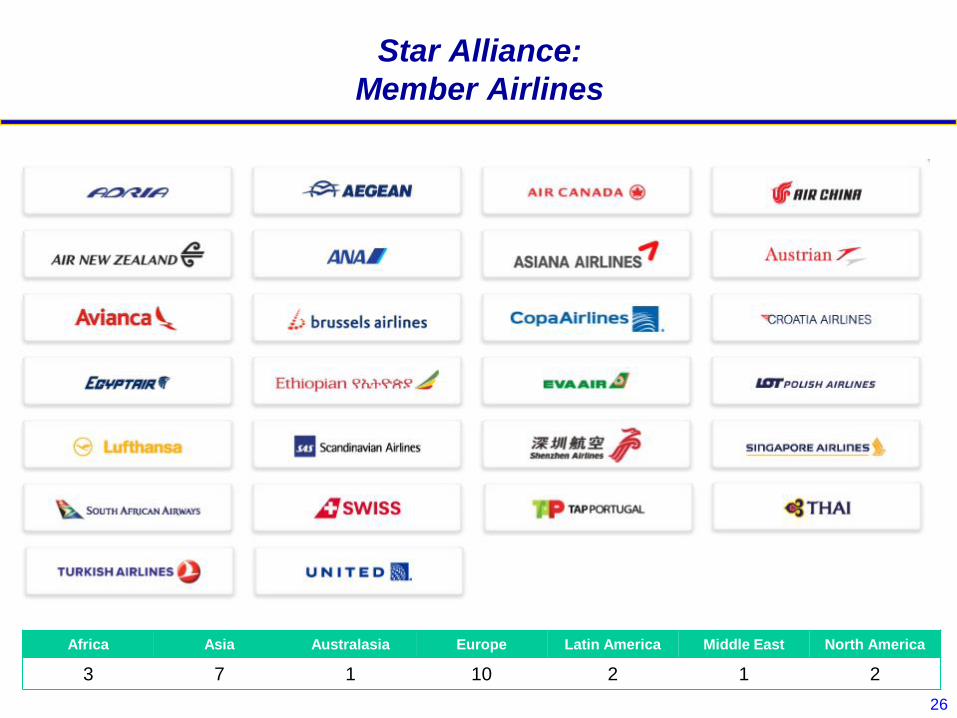
Star Alliance:
Member Airlines
Africa Asia Australasia Europe Latin America Middle East North America
3 7 1 10 2 1 2
27
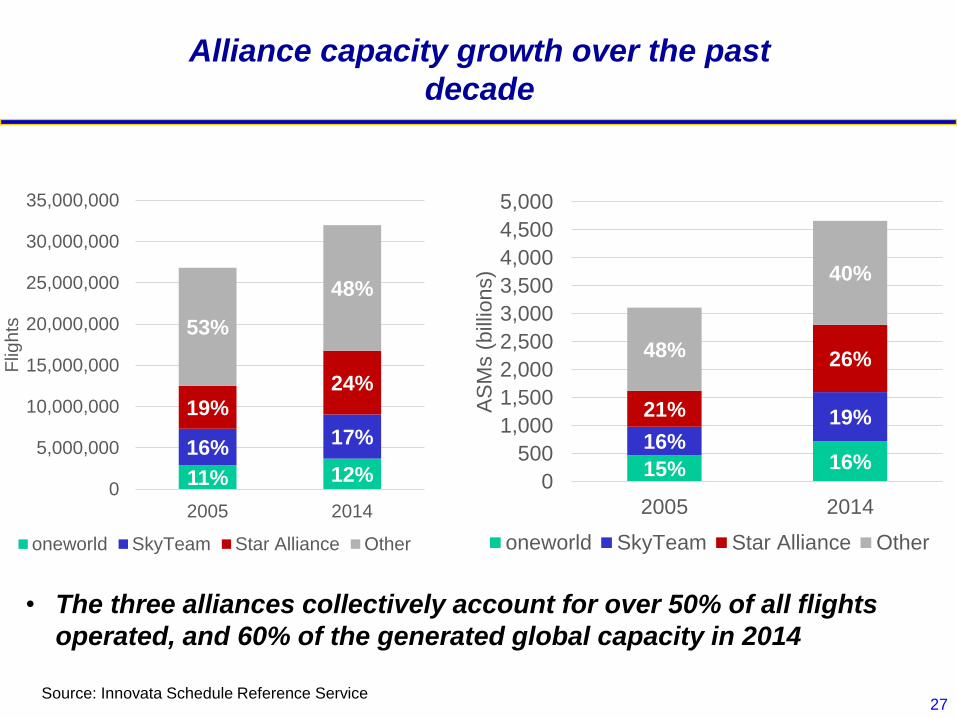
Alliance capacity growth over the past
decade
11% 12%
16% 17%
19% 24%
53%
48%
0
5,000,000
10,000,000
15,000,000
20,000,000
25,000,000
30,000,000
35,000,000
2005 2014
Flig
hts
oneworld SkyTeam Star Alliance Other
15% 16% 16%
19% 21%
26% 48%
40%
0
500
1,000
1,500
2,000
2,500
3,000
3,500
4,000
4,500
5,000
2005 2014A
SM
s (
bill
ions)
oneworld SkyTeam Star Alliance Other
• The three alliances collectively account for over 50% of all flights
operated, and 60% of the generated global capacity in 2014
Source: Innovata Schedule Reference Service
28
Advantages of Airline Alliances
Airlines can strengthen networks and market position
against competing alliances:
Expand network coverage with little risk or increased operating
costs, and no new capital required (aircraft or facilities)
Access to new O-D markets and incremental revenues
Increased market shares in existing markets due to greater
presence, meaning increased traffic, revenues, and profit
For consumers, a “seamless” travel experience:
World-wide service with single check-in, consistent passenger
service standards, club rooms and FFP benefits
29
Disadvantages of Airline Alliances
Potential for disagreements among airline partners:
Can be difficult and costly to completely standardize customer
service standards and procedures
Cost savings might not be as great as anticipated
Conflicting network and revenue sharing objectives
Possible for one partner to actually lose revenue as dominant
airline exerts market and RM strengths
Alliance relationships are not permanent, as airlines switch
partners and alliances
For consumers, confusion about code-sharing,
operating carriers and potentially anti-competitive
impacts
30
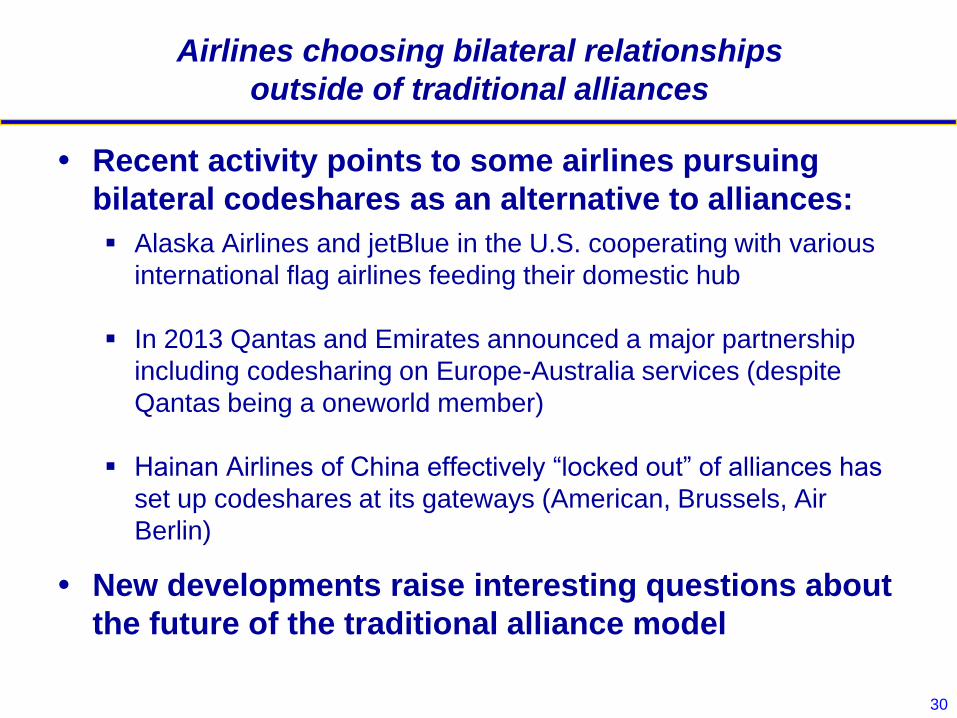
Airlines choosing bilateral relationships
outside of traditional alliances
Recent activity points to some airlines pursuing
bilateral codeshares as an alternative to alliances:
Alaska Airlines and jetBlue in the U.S. cooperating with various
international flag airlines feeding their domestic hub
In 2013 Qantas and Emirates announced a major partnership
including codesharing on Europe-Australia services (despite
Qantas being a oneworld member)
Hainan Airlines of China effectively “locked out” of alliances has
set up codeshares at its gateways (American, Brussels, Air
Berlin)
New developments raise interesting questions about
the future of the traditional alliance model
31
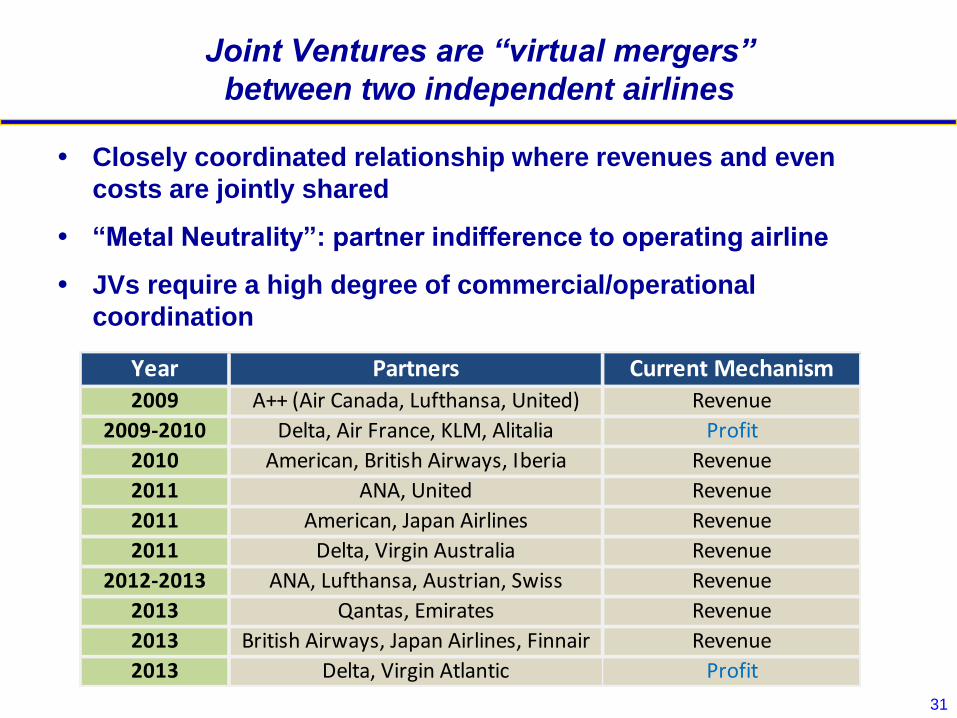
Joint Ventures are “virtual mergers”
between two independent airlines
Closely coordinated relationship where revenues and even
costs are jointly shared
“Metal Neutrality”: partner indifference to operating airline
JVs require a high degree of commercial/operational
coordination
Year Partners Current Mechanism2009 A++ (Air Canada, Lufthansa, United) Revenue
2009-2010 Delta, Air France, KLM, Alitalia Profit
2010 American, British Airways, Iberia Revenue
2011 ANA, United Revenue
2011 American, Japan Airlines Revenue
2011 Delta, Virgin Australia Revenue
2012-2013 ANA, Lufthansa, Austrian, Swiss Revenue
2013 Qantas, Emirates Revenue
2013 British Airways, Japan Airlines, Finnair Revenue
2013 Delta, Virgin Atlantic Profit
32
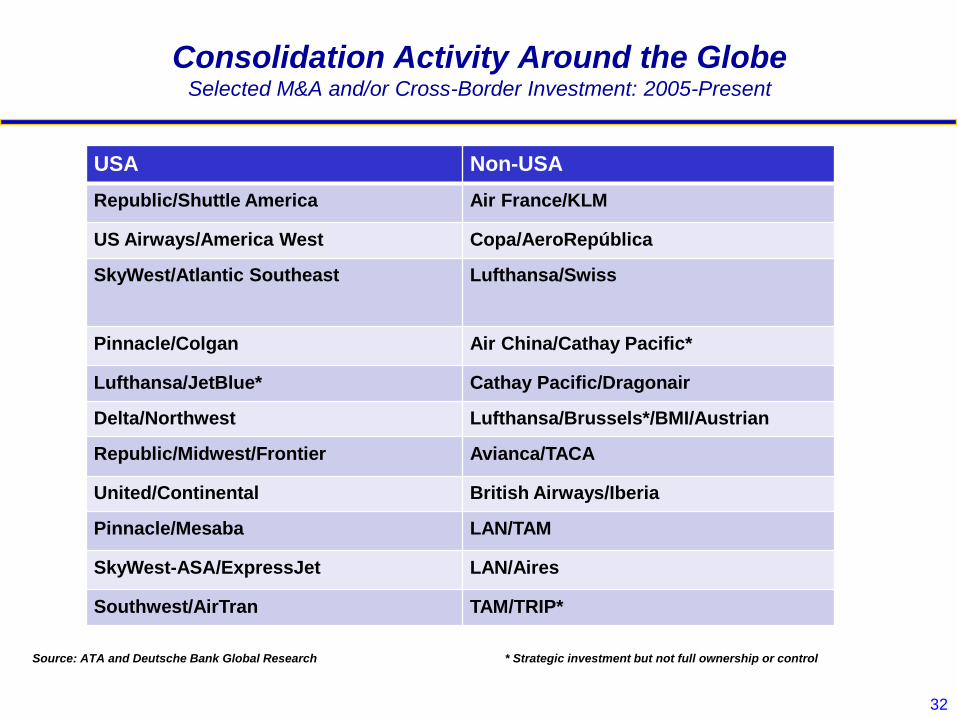
Consolidation Activity Around the Globe Selected M&A and/or Cross-Border Investment: 2005-Present
USA Non-USA
Republic/Shuttle America Air France/KLM
US Airways/America West Copa/AeroRepública
SkyWest/Atlantic Southeast Lufthansa/Swiss
Pinnacle/Colgan Air China/Cathay Pacific*
Lufthansa/JetBlue* Cathay Pacific/Dragonair
Delta/Northwest Lufthansa/Brussels*/BMI/Austrian
Republic/Midwest/Frontier Avianca/TACA
United/Continental British Airways/Iberia
Pinnacle/Mesaba LAN/TAM
SkyWest-ASA/ExpressJet LAN/Aires
Southwest/AirTran TAM/TRIP*
Source: ATA and Deutsche Bank Global Research * Strategic investment but not full ownership or control
33
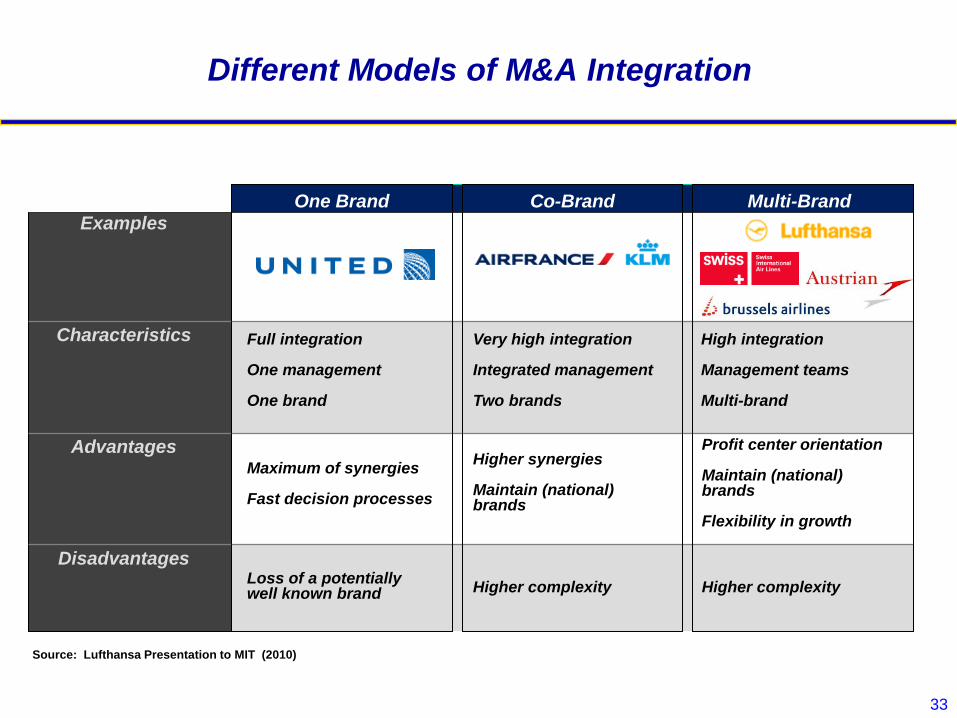
Different Models of M&A Integration
Examples
Characteristics
Advantages
Disadvantages
One Brand Co-Brand Multi-Brand
Full integration One management One brand
Maximum of synergies Fast decision processes
Loss of a potentially well known brand
Very high integration Integrated management Two brands
Higher synergies Maintain (national) brands
Higher complexity
High integration Management teams Multi-brand
Profit center orientation Maintain (national) brands Flexibility in growth
Higher complexity
Source: Lufthansa Presentation to MIT (2010)
34
Factors Affecting Future Networks
Network Structure
• No evidence of shift away from large hub and spoke networks
• Even LCCs have been developing “focus cities” for connections
Industry Consolidation
• Recent (and future) mergers could eliminate smaller hubs
• Alliances and joint ventures reinforce largest international hubs
Availability of New Aircraft Options
• 787 has opened up many new route opportunities
• Replacement alternatives for smaller narrow-body fleet?


![the role of the airline transportation network · arXiv:q-bio/0507029v1 [q-bio.OT] 18 Jul 2005 Prediction and predictability of global epidemics: the role of the airline transportation](https://static.fdocuments.in/doc/165x107/5eb7e40b15e49a3fcf0366d5/the-role-of-the-airline-transportation-network-arxivq-bio0507029v1-q-bioot.jpg)