Airborne Particulate Matter in the United - Defra, UK · Prof R M Harrison The Queen Elizabeth ......
188
Airborne Particulate Matter in the United Kingdom May 1996 Third Report of the Quality of Urban Air Review Group Prepared at the request of the Department of the Environment
Transcript of Airborne Particulate Matter in the United - Defra, UK · Prof R M Harrison The Queen Elizabeth ......
Airborne
Particulate
Matter in the
United
Kingdom
May 1996
Third Report of theQuality of Urban Air Review Group
Prepared at the request of theDepartment of the Environment


Airborne
Particulate
Matter in the
United Kingdom
May 1996
Third Report of the
Quality of Urban Air Review Group
Prepared at the request of the
Department of the Environment
X

© Quality of Urban Air Review Group 1996
Prepared at the request of theDepartment of the Environment
ISBN 0 9520771 3 2
Further copies available from :
The University of Birmingham
Institute of Public and Environmental Health
School of Chemistry
Edgbaston
Birmingham
B15 2TT
Cover Picture: Airborne Particles Collected on the
Surface of a Nuclepore Filter from the Atmosphere of
Birmingham

The Quality of Urban Air Review Group
ChairmanProf R M HarrisonThe Queen Elizabeth II Birmingham CentenaryProfessor of Environmental HealthThe University of Birmingham
Prof P BrimblecombeUniversity of East Anglia
Dr R G DerwentMeteorological Office
Dr G J DollardAEA, NETCEN
Dr S EgglestonAEA, NETCEN
Prof R S HamiltonMiddlesex University
Mr A J HickmanTransport Research Laboratory
Dr C HolmanIndependent Consultant
Dr D P H LaxenIndependent Consultant
Mr S MoorcroftTBV Science
Observers
Dr S CosterDepartment of the Environment
Ms L EdwardsDepartment of the Environment
Dr R L MaynardDepartment of Health
Secretariat
A R Deacon Institute of Public and Environmental HealthThe University of Birmingham
The authors accept responsibility for the contents of this report but theviews are their own and not necessarily those of the organisations towhich they belong or the Department of the Environment
X

ACKNOWLEDGEMENTS
The Review Group is most grateful to the following individuals and organisations for assistance.
John Garland (NETCEN) - main authorship of Chapter 2
David Mark (AEA Technology, Harwell) - main authorship of Chapter 3
Gary Hayman (NETCEN) - main authorship of Chapter 6
Helen Clark, Alison Loader, John Stedman, Ken Stevenson, Paul Willis, Geoff Broughton, Glenn Campbell and
David Lee (NETCEN) - data analyses for Chapter 6
Marcus Jones (The University of Birmingham) - data analyses
Alan Turnbull (The University of Birmingham) - information on biological particles
Andrew Clarke (The University of Leeds) - provision and interpretation of air quality data
Chris Miller (Salford University) - air quality trend data
Bob Appleby, Gavin Tringham and Peter Fallon (Birmingham City Council) - provision of air quality data
David Muir (Bristol City Council) - provision of air quality data
Westminster City Council, Planning and Environment Department - provision of air quality data
John Rice and Sean Beevers (South East Institute of Public Health) - provision of air quality data
Michael Grassi and Colin Harris (The Grassi Design Company) - graphic design and illustration work

Airborne particulate matter is a very diverse material in terms of its physical and chemical properties and there are
many sources which contribute to atmospheric concentrations. This report, the Third Report of the Quality of
Urban Air Review Group, reviews knowledge of the sources, chemical composition and physical properties and
concentrations of airborne particles and examines the implications for control of particulate matter in UK urban air.
Airborne particles are typically very small; they range in size from a few nanometres in diameter to 100 or more
micrometres*. Whilst particles from throughout this range can be found in the atmosphere, those capable of
remaining airborne for long periods (typically 10 days or so), are in the more limited size range of approximately
0.1-2 micrometres diameter. The size fraction measured by the UK Automatic Urban Network includes particles
up to 10 micrometres (termed PM10). The Report reviews the methods available for measuring airborne particulate
matter and highlights the performance characteristics of various common instruments.
Airborne suspended particulate matter may be either primary or secondary in its origins. Primary particles are
those directly emitted to the atmosphere from sources such as road traffic, coal burning, industry, windblown soil
and dust and sea spray. On the other hand, secondary particles are particles formed within the atmosphere by
chemical reaction or condensation of gases, and the major contributors are sulphate and nitrate salts formed from
the oxidation of sulphur dioxide and nitrogen oxides respectively. Emissions inventories are available for primary
particulate matter which indicate that nationally the major sources are road transport (25%), non-combustion
processes such as construction, mining and quarrying and industrial processes (24%), industrial combustion plants
and processes with combustion (17%), commercial, institutional and residential combustion plants (16%) and
public power generation (15%). Industrial sources may thus lead to locally elevated concentrations of PM10.
Domestic coal burning in some areas of the UK, for example Belfast, can also lead to elevated levels. Within
urban areas generally, however, the influence of road traffic is far more marked and in Greater London it is
estimated that 86% of PM10 emissions in 1990 arose from this source. The contribution of secondary particles is
far more uniform as these are formed relatively slowly in the atmosphere and have a long atmospheric lifetime.
Nonetheless, there is a distinct gradient in concentrations with the highest in the south-east of the UK, decreasing
progressively to the north and west. Recent data show concentrations of secondary particles some 10% higher in
the spring and summer months of the year than the annual average.
For many years measurements of particles in the UK atmosphere have been carried out using the black smoke
method. This depends upon the blackness rather than the weight of particles. Originally, this was designed to
measure airborne particles derived from the burning of coal, but nowadays in most urban areas the measurements
reflect primarily emissions from diesel vehicles. More recently, automatic measurements of PM10 have been made
and data from the UK Automatic Urban Network show uniformity of annual average concentrations across the
major UK urban areas, with mean concentrations within the range of 20-30 micrograms per cubic metre.
Exceptional behaviour has been observed in Belfast where coal burning is still a major source of airborne particles,
and for a time in Cardiff when construction activity adjacent to the sampling site influenced the measurements.
Examination of the highest daily mean concentrations shows a seasonal pattern with the highest values generally
occurring in the winter months with variations between urban areas much clearer than for the annual average
concentration. There are relatively few data for rural measurement of PM10, but it appears that concentrations are
of the order of 10-15 micrograms per cubic metre, reflecting mainly secondary particles.
Receptor modelling techniques based upon an analysis of measurements of airborne particles and their chemical
components have been used to identify the major contributors to PM10 in urban air. The results indicate that
exhaust emissions from road traffic together with secondary particles dominate the PM2.5 (small particle) fraction
which comprises the major part of elevated PM10 concentrations and hence is potentially more important in relation
to health impacts. The sources of coarse particles, in the 2.5-10 micrometre range, are less clearly defined, but
resuspended street dusts, windblown soils and sea spray particles are major contributors. In the winter months
Executive Summary
Quality of Urban Air Review Group i
* 1 nanometre is one millionth of a millimetre; 1 micrometre is one thousandth of a millimetre.
episodes of high PM10 are associated almost wholly with raised concentrations of PM2.5 arising from vehicle
exhaust emissions. In summer, the contribution of secondary particles during photochemical pollution episodes is
also important. Road traffic contributes to secondary particle formation through emissions of NOx. Emissions
inventories do not currently give a complete breakdown of the sources of particulate matter in UK urban air as they
cannot account for secondary particles, and estimates of emissions from diffuse and natural sources such as dust
suspended from road surfaces by wind and traffic-induced turbulence are subject to very great uncertainties.
There are currently many exceedences of the EPAQS recommended limit of 50 micrograms per cubic metre as a
running 24 hour average concentration. For example, in Central London between 1992 and 1994 this value was
exceeded on 75 days measured from midnight to midnight, or 139 days when measured as a 24-hour running mean
in accordance with the EPAQS recommendation. Control of PM10 concentrations to within the limit recommended
by EPAQS will require major controls on the sources of emission. In winter, our analysis shows that far the major
contributor to episodes of high PM10 concentration is exhaust emission from road transport. A reduction of about
two thirds in emissions from this source would lead to achievement of the air quality standard at background sites
in most UK urban areas, but control of roadside concentrations and pollution episodes to meet the EPAQS
recommendation would require further emission reductions. For example, to have limited 24-hour average PM10 to
below 50 µg/m3 in the December 1991 pollution episode in London is estimated to require a reduction of over 80%
in road traffic exhaust emissions. Current projections indicate a cut in emissions of about 52% by 2010. In
summer, secondary sulphate and nitrate particles formed from atmospheric oxidation of sulphur and nitrogen
oxides appear to be the primary cause of episodes of high PM10 concentration, although in summer the contribution
of coarse particles, largely resuspended surface dusts, is also important. Numerical model predictions indicate that
agreed controls on emission of sulphur and nitrogen oxides across Western Europe will deliver an improvement of
about 40% in average concentrations of secondary particles across the UK by the year 2010. This alone is unlikely
to be sufficient to bring summer concentrations in line with the EPAQS recommendation.
Our analyses clearly indicate the need for tighter controls on the sources of PM10 to achieve the EPAQS standard
throughout the UK. In some areas improved controls on industry and a reduction in emissions from the burning of
solid fuels for home heating may be required. However, for the majority of UK urban areas the key sources
requiring control if air quality is to meet the standards recommended by EPAQS are twofold. The first is road
traffic, and our Second Report pointed out the particularly important contribution of diesel emissions in regards of
atmospheric particulate matter. The second is that of secondary particles formed in the atmosphere from emissions
of sulphur and nitrogen oxides. These are formed from Europe-wide emissions rather than solely those from the
UK, and hence international agreements for SOx/NOx control beyond those already in place will also be needed.
Airborne Particulate Matter in the United Kingdom
ii

1 Introduction ................................................................................................................11.1 Sources of Airborne Particulate Matter .................................................................21.2 Sizes and Shapes of Airborne Particulate Matter .................................................4
References............................................................................................................6
2 Properties of Airborne Particulate Material ....................................................................72.1 Introduction ...........................................................................................................72.2 Formation of Aerosol Particles..............................................................................72.3 Properties and Behaviour of Airborne Particles ..................................................102.4 Lifetime and Travel of Aerosols ..........................................................................14
References..........................................................................................................14
3 Measurement Methods ...................................................................................................173.1 Introduction .........................................................................................................173.2 Airborne Particles................................................................................................173.3 Nuisance Dust.....................................................................................................32
References..........................................................................................................35
4 Sources and Emissions of Primary Particulate Matter................................................374.1 Introduction .........................................................................................................374.2 Primary Emission Sources..................................................................................384.3 Emission Estimates.............................................................................................464.4 Ambient PM10 Levels and Emissions ..................................................................494.5 Future Emission Trends......................................................................................504.6 Uncertainties .......................................................................................................524.7 Biological Particles..............................................................................................524.8 Key Points...........................................................................................................53
References..........................................................................................................54
5 Sources and Concentrations of Secondary Particulate Matter ..................................575.1 Introduction to Secondary Particulate Material ...................................................575.2 Concentrations of Secondary Particulate Material in the United Kingdom .........605.3 Key Points...........................................................................................................69
References..........................................................................................................69
6 Concentrations and Trends in Particulate Matter ........................................................716.1 Introduction .........................................................................................................716.2 Measurements of Particulate Matter ...................................................................716.3 Measurements and Trends in Particulate Matter ................................................756.4 Correlation Between Different Measures of Particulate Matter ...........................926.5 Behaviour of Particulate Matter Concentrations .................................................956.6 Exceedences of Air Quality Standards and Guidelines ....................................1066.7 Spatial Distribution of Particulate Matter...........................................................1086.8 Ultrafine Particles and Particle Number Counts in Urban Air............................1156.9 Key Points.........................................................................................................116
References........................................................................................................117
7 The Chemical Composition of Airborne Particles in the UK Urban Atmosphere ...1197.1 Introduction .......................................................................................................1197.2 Composition of Airborne Particles.....................................................................1207.3 Results of Reported Studies .............................................................................1227.4 Data Summary ..................................................................................................1347.5 Conclusions ......................................................................................................1347.6 Key Points.........................................................................................................135
Acknowledgement.............................................................................................136References........................................................................................................136
Table of Contents
Quality of Urban Air Review Group
8 Receptor Modelling and Source Apportionment........................................................1398.1 Introduction .......................................................................................................1398.2 Receptor Modelling of Total Suspended Particulate Matter..............................1398.3 Receptor Modelling & Source Apportionment of PM10 ......................................1428.4 Interpretation of PM10 and PM2.5 Dataset from North-West Birmingham...........1498.5 Implications for the Control of Atmospheric Concentrations of PM10 ................1498.6 Summer Data....................................................................................................1518.7 Meeting the EPAQS Recommended Standard.................................................1518.8 Conclusions ......................................................................................................1548.9 Key Points.........................................................................................................154
References........................................................................................................155
9 Effects of Airborne Particulate Material ......................................................................1579.1 Health Effects of Non-biological Particles .........................................................1579.2 The Effects of Particulate Matter on Visibility....................................................1619.3 Nuisance from Soiling .......................................................................................1629.4 Effects of Atmospheric Aerosols on Climate Change .......................................164
References........................................................................................................164
10 Conclusions ............................................................................................................167
Research Recommendations .......................................................................................171
Glossary of Terms and Abbreviations ........................................................................173
Terms of Reference and Membership .........................................................................175
Airborne Particulate Matter in the United Kingdom

In its First Report (QUARG, 1993a) this Review
Group sought to summarise the present state of
knowledge with regard to the urban air pollution
climate of the United Kingdom. Concern was
expressed that a number of pollutants exceed present
health-based standards and guidelines. It was also
noted that increasingly, as other sources come under
better control, the relative importance of motor vehicle
traffic as a source of air pollution in our towns and
cities has increased. Comparing national and urban
inventories of pollutant emissions, there are major
divergences attributable to the greater impact of road
traffic in urban areas. A tentative look into the future
revealed that toughening standards on vehicle
emissions will lead to significant improvements in air
quality over the next five or ten years, but that unless
such emission standards were tightened yet further, an
increase in traffic growth could negate the benefits
obtained from lower pollutant emissions per vehicle,
and that for many pollutants, concentrations might
once again start to increase after about 2005.
Having highlighted the important role of road traffic
in influencing urban air quality, it was natural that our
Second Report (QUARG, 1993b) should deal with a
major aspect of this question. The Report reviewed
the impact of diesel vehicle emissions on urban air
quality and highlighted the fact that with the advent of
three-way catalytic converters on new petrol cars, the
impact of diesel emissions, at that time mostly from
Heavy Duty Vehicles (trucks and buses), on urban air
quality would become more marked. A further
contribution to this trend was also arising from a
substantially increased market penetration of diesel
cars which had until 1991 comprised only about 5-6%
of the new car market, but increased rapidly to take
about 25% of the market at the end of 1993. The
report highlighted the very large contribution which
diesel emissions make to urban concentrations of
particulate matter in general, black smoke in
particular, and of nitrogen oxides. Based upon an
evaluation of the relative importance of the various
vehicle-emitted pollutants and of future trends in
emissions, the Review Group expressed concern over
the impact of particulate matter and nitrogen oxides
from diesels on urban air quality and recommended
against an increase in the number of diesel vehicles on
our roads unless problems with these two pollutants
are effectively addressed.
Since the publication of our Second Report,
considerable new information has emerged. A
detailed evaluation of the December 1991 pollution
episode in London has revealed an increase of about
10% in mortality during the week of the episode
compared with the same period in earlier years
(Anderson et al, 1995). Statistically significant
increases in some illnesses were also established. A
careful analysis of the data led to the conclusion that
the most probable cause of the adverse health effects
was air pollution, and it appears that the deadly smogs
of the 1950’s and 1960’s have not been wholly
banished. The 1991 episode appears to be a more
modern manifestation of those serious pollution
incidents and has in common with them the greatly
elevated levels of black smoke particles, but differs in
that concentrations of sulphur dioxide were very much
lower in 1991, but oxides of nitrogen were probably
considerably elevated over concentrations in the
1950's, before routine measurements of nitrogen
oxides were made.
The epidemiological evidence for the adverse health
effects of airborne particles has also strengthened
greatly since the publication of our Second Report.
There have been further publications of time series
studies in which day-to-day changes in mortality and
illness are shown to be related to concentrations of
airborne particulate matter. Additionally, two major
cross-sectional studies in which mortality rates in
different cities have been shown to relate to their air
pollution have been published. The Harvard Six
Cities Study (Dockery et al, 1993) examined mortality
amongst 8,000 known individuals over a period of
some 15 years and after controlling for other risk
factors such as smoking, excess body weight and
socio-economic class, showed a strong relationship
between mortality and the concentration of fine
particulate matter in the atmosphere. The more recent
study based upon the American Cancer Society
database of over half a million people used data on
fine particulate matter from some 50 urban areas as
well as particulate sulphate data from 151 urban areas,
showing a clear relationship between mortality and
concentrations of the air pollutant (Pope et al, 1995).
1 Introduction
Quality of Urban Air Review Group 1

As a reaction to the increasing weight of evidence on
the adverse health effects of airborne particles, other
UK advisory panels and committees have also been
active. The Expert Panel on Air Quality Standards
has recently concluded its deliberations upon airborne
particulate matter and has recommended a standard.
In parallel with this exercise, the Department of
Health’s Committee on the Medical Effects of Air
Pollution appointed a Sub-Committee on Particulate
Matter which has published a detailed report on non-
biological particles and health. These reports provide
valuable advice upon the health risks of particulate
matter which will form part of the information needed
by Government to formulate policy.
The Quality of Urban Air Review Group also has a
role to play in providing advice on particulate matter
and this, our Third Report, seeks to provide
information from our perspective as air pollution
scientists. Current research suggests that the health
impact of airborne particles is dependent upon their
size, but apparently not upon their chemical
composition. One hypothesis on the biological
mechanism of health injury due to airborne particles
implies that the number of particles to which the
individual is exposed is more important than their
mass (Seaton et al, 1995). In this Report we seek to
review knowledge on both the chemistry and physics
of airborne particles. We provide information on the
measured sizes of particulate matter in the UK
atmosphere as well as on the chemical composition,
which may yet prove to be significant in the toxicity,
but notwithstanding, is a very valuable indicator of the
source of the particles.
Any control strategy for airborne particulate matter
must be based upon a firm understanding of the
origins of those particles and the factors which
influence their concentrations in the atmosphere. This
report seeks to review the current state of knowledge
on these issues. For example, it is clear that airborne
particulate matter may be both primary, ie emitted as
such into the atmosphere, or secondary, ie formed in
the atmosphere from chemical reactions of gaseous
precursors such as sulphur and nitrogen oxides. The
two kinds of particulate matter show different
seasonal patterns and a different dependence upon the
control of sources. Here we seek to review the limited
knowledge available on the partition between primary
and secondary sources, and upon the contributors to
the primary particulate matter in the atmosphere.
The review and analysis included in this Report
reveals the considerable diversity in the sources of
particulate matter and the many factors influencing its
atmospheric behaviour. In this context, particulate
matter is certainly the most complex of the common
air pollutants to understand and may ultimately prove
one of the most difficult to control because of its
multiplicity of sources. However, by targeting major
sources of primary emissions such as road traffic, as
well as sources of the sulphur oxide and nitrogen
oxide precursors of secondary aerosol, it should be
feasible to make progress over the coming few years.
Refined and updated projections of future emissions
are included in this Report.
1.1 SOURCES OF AIRBORNE PARTICULATE MATTER
At this point in the Report it is appropriate to give a
very brief summary of the sources of airborne
particles. Those which are relevant will be amplified
further in the Report. On a global scale a number of
natural sources such as volcanic emission of particles,
forest and brush fires and ingress of extra-terrestrial
particles into the atmosphere may be significant. In
the context of the United Kingdom, and particularly in
relation to urban areas, these sources are dwarfed by
particles arising from human activity and will not be
considered further.
Suspension of Soil Dust
The action of the wind on dry loose soil surfaces leads
to particles blowing into the air. This is most
obviously seen in association with sand and dust
storms common during windy conditions in the
world’s deserts. These processes do, however, extend
to other regions of the globe, although their magnitude
is obviously reduced where soils are moist and have
vegetation cover. It is estimated that suspension of
surface soils causes the introduction of 150 million
tonnes of dust per year to the Northern Hemisphere
atmosphere and around double this if the Sahara
Desert is included. This leads to an atmospheric
Airborne Particulate Matter in the United Kingdom
2

burden of dust in the Northern Hemisphere,
(excluding the Sahara plume) of 3 million tonnes on
average. The presence of such particles in the UK
atmosphere is manifested by the accumulation of dust
on surfaces such as motor cars during dry weather
periods. Much enhanced deposition is occasionally
seen when the atmosphere carries dust from the
Sahara Desert regions. Such particles are generally
rather coarse (ie large in size) and frequently have
only a limited atmospheric lifetime and range,
although their transport from North Africa to the UK
shows that this is not always the case.
Factors favouring the suspension of soil dust particles
into the atmosphere are an exposed dry surface of fine
soil and a strong windspeed. In towns and cities the
areas of exposed soil, particularly in town centres, are
rather small. However, there are considerable
quantities of dusts on road and pavement surfaces
which arise from ingress of soil on vehicle tyres and
from the atmosphere, the erosion of the road surface
itself and degradation of parts of the vehicle,
especially the tyres. Because these particles lie on a
surface which readily dries, and are subject to
atmospheric turbulence induced by passing vehicles,
this provides a ready source of particles for
resuspension into the atmosphere. The amounts of
dust resuspended in this process are extremely
difficult to predict or measure as they depend critically
upon factors such as the dust loading of the surface,
the preceding dry period and the speed of moving
traffic. However, the size distribution and chemical
composition of particles in the urban atmosphere give
a clear indication that this source contributes
significantly to the airborne particle loading of our
cities.
Seasalt
Breaking waves on the sea cause the ejection of many
tiny droplets of seawater into the atmosphere. These
droplets dry by evaporation leaving seasalt particles
suspended in the air. Whilst these particles are, in the
main, rather coarse in size, a minor part of the mass is
in particles small enough to have an appreciable
atmospheric lifetime, and all parts of the UK are
influenced to some extent by particles of seasalt.
Clearly, coastal areas are the most affected, but seasalt
is measurable even at the most inland of UK locations.
In winter months, identification of this source by
measurement of the chemical composition of airborne
particles is complicated by the use of salt for de-icing
the roads. Most road de-icing salt has a chemical
composition almost identical to that of seasalt and the
two are effectively indistinguishable. Vehicles
travelling at high speed on the motorway in wet
conditions raise very visible plumes of spray which
contain salt if the road has been treated with de-icing
salt. Although the process is less visible, it occurs
also on urban roads at lower traffic speeds.
Anthropogenic Primary Particles
All combustion and metallurgical processes and many
other industrial operations lead to the emission of
particles into the atmosphere. If these particles are
directly emitted from a source, they are termed
primary. The largest individual contributor of
particles is combustion processes, although the mode
of formation and chemical composition of the
particles varies greatly from one source to another.
Thus, in the case of coal combustion, the major part of
the particle emissions arises from so-called fly-ash,
which is fine particles of mineral material contained in
the coal. In the case of emissions from diesel
vehicles, the particles comprise largely elemental and
organic carbon with some sulphate and water. Fuel is
introduced into the combustion chamber of the engine
as a spray of fine droplets, each of which leaves a tiny
residual particle of unburned and pyrolysed fuel and
oxidised sulphur which is emitted from the exhaust.
Combustion of other more volatile carbon-containing
fuels can lead to formation of carbon-based particles
through combination of carbon atoms within the
combustion zone. High temperature metallurgical
processes and refuse incineration cause the formation
of fine metal-rich particles by the condensation of
cooling vapours. Despite the best efforts of
arrestment plants, a small proportion of such particles
inevitably enter the atmosphere. The emissions of
anthropogenic primary particles are those most easily
quantified and inventories of emission are available
which will be elaborated upon later in this report.
Many other industries and processes also lead to
emissions of primary particles. These include, for
Chapter 1 : Introduction
Quality of Urban Air Review Group 3

example, mining, quarrying, construction and
demolition.
Anthropogenic Secondary Particles
The term secondary particles is used to describe those
particles that are formed within the atmosphere,
mostly from the chemical oxidation of atmospheric
gases. The most prevalent secondary particles are
sulphates formed from the oxidation of sulphur
dioxide. The first product of this oxidation process is
a mist of sulphuric acid droplets, although there is
generally ample ammonia available in the UK
atmosphere to neutralise this first to ammonium
bisulphate and subsequently to ammonium sulphate.
This compound is one of the most abundant
substances in UK air.
Nitrogen dioxide may also be oxidised in the
atmosphere to form nitric acid. The latter is more
volatile than sulphuric acid and exists in the
atmosphere in the gas phase, but when reacted with
ammonia can form particles of ammonium nitrate. It
can also react with seasalt particles to form sodium
nitrate. Another less abundant form of secondary
particles comprises ammonium chloride formed from
the reaction of ammonia with hydrochloric acid gas
emitted from combustion of coal and municipal
incineration.
Chemical reactions of hydrocarbons within the
atmosphere can also lead to the production of
involatile or semi-volatile products which contribute
to the loading of atmospheric particles. The
composition of such particles and the chemistry
leading to their formation has been studied in the
context of pollution in Southern California, but there
has been no research on the matter in the UK, and
whilst it is likely that secondary organic materials are
a component of particles in the UK atmosphere, there
is currently no data upon the concentrations or
composition.
Biological Particles
It has long been known that the atmosphere acts as a
medium for transport of a variety of biological
particles. The sizes of such particles cover a very
wide range. Vegetation canopies are a major source
of natural biological particles such as those derived
from fungal, bacterial and viral plant pathogens as
well as pollen grains derived from the flowers of
wind-pollinated plants. There are well established
networks for sampling, counting and identifying
airborne pollens and spores in the UK atmosphere.
Information on bacteria and viruses is much more
scarce, generally being related to investigations of
specific problems. However, the recent development
of DNA-based techniques in molecular biology offers
the opportunity for more extensive work in this field.
Airborne biological particles can cause disease. The
effects produced are dependent on the nature of the
particles: viral, bacterial, fungal or pollen. While such
effects are of important health significance they are
not a facet of urban air pollution specifically and are
outside the remit of this Report.
1.2 SIZES AND SHAPES OF AIRBORNE PARTICLES
Airborne particles cover a very wide size range from a
few nanometres (billionths of a metre) to tens of
micrometres (millionths of a metre). The recently
published EPAQS recommendation relates to PM10, or
particles passing an inlet of defined characteristics
with a 50% sampling efficiency at 10 micrometres
(µ m) aerodynamic diameter. Thus, to a good
approximation, PM10 is particulate matter smaller than
10 µm diameter, and usually comprises the majority
of airborne particle mass. Particles outside of this size
range are relatively very large in size and have little
impact on health. Within the PM10 size range,
particles of less than 2.5 µm aerodynamic diameter
(known as PM2.5) are normally described as fine,
whilst the 2.5 to 10 µm fraction is termed coarse. The
fine particles are capable of reaching the deepest part
of the lung, whilst coarse particles generally deposit in
the upper airways. As a rough generalisation,
particles generated from combustion and condensation
of vapours are mostly in the fine fraction, whilst
particles from mechanical break-up of solids and
liquids are coarse.
The physical form of PM10 may be assessed by
electron microscopy. Some examples appear in
Airborne Particulate Matter in the United Kingdom
4

Chapter 1 : Introduction
Quality of Urban Air Review Group 5
Figure 1.1 Airborne Particles Collected on the Surface of a Nuclepore Filter from the Atmosphere of Birmingham. The Dark Circles are Pores in the Filter, about 0.4 micrometres in Diameter.
(a) Mixed small particles. The branched chain structures are probably vehicle-generated particles.
(b) Close-up of a cluster formed from coagulation of many small particles, each about 50 nanometres in diameter.
(c) Two very large particles, about 5 micrometres in diameter. One (on the left) appears to be a layered mineral, whilst the other is a massive cluster of tiny particles.

Figure 1.1. This exemplifies the wide variety of sizes
and shapes of particles typically encountered in the
atmosphere.
REFERENCES
Anderson HR, Limb ES, Bland JM, Ponce de Leon A,
Strachan DP and Bower JS (1995) Health Effects ofan Air Pollution Episode in London, December1991, Thorax, 50, 1188-1193.
Dockery DW, Pope CA, Xu, X et al (1993) AnAssociation Between Air Pollution and Mortality inSix US Cities, N Engl J Med, 329, 1753-1759.
QUARG (1993a) Urban Air Quality in the UnitedKingdom, First Report of the Quality of Urban Air
Review Group, QUARG, London.
QUARG (1993b) Diesel Vehicle Emissions andUrban Air Quality , Second Report of the Quality of
Urban Air Review Group, QUARG, Birmingham.
Pope CA, Thun MJ, Namboodiri MM, Dockery DW,
Evans JS, Speizer FE and Heath CW (1995)
Particulate Air Pollution as a Predictor ofMortality in a Prospective Study of U.S. Adults,Am J Respir Crit Care Med, 151, 669-674.
Seaton A, MacNee W, Donaldson D and Godden D
(1995) Particulate Air Pollution and Acute HealthEffects, Lancet, 345, 176-178.
Airborne Particulate Matter in the United Kingdom
6

2.1 INTRODUCTION
Simple physical processes and properties profoundly
influence the behaviour of atmospheric particles, and
their effects on our health and environment. The air
near the ground contains a variable mixture of diverse
particles, some solid and some partly or wholly liquid,
including many of the pollutants of current concern.
Although the properties of each particle differ
according to its size, shape and composition, the effect
of particle size is strongly dominant.
The purpose of this Chapter is to provide a brief
overview of the properties of aerosol particles that are
of major importance. The persistence in the air affects
the atmospheric concentration and the distance
travelled before deposition. If this distance is
sufficiently great, the effects of pollution are
international or even intercontinental issues. The
same characteristics determine how far particles
follow the flow of inhaled air into the respiratory
system, and whether the particles are retained in the
nose, bronchi or lungs, or are simply exhaled
harmlessly. Light absorption and scattering by
particles influence the visibility of distant objects in
conditions of haze, the colour of the sky (when cloud
is absent) and the appearance of the landscape. The
bibliography includes a few references that provide
more detail of the general properties and effects of
aerosols.
2.2 FORMATION OF AEROSOL PARTICLES
2.2.1 Size Scale
The mechanism of formation is crucial in influencing
the size of aerosol particles. Several distinct
mechanisms contribute particles to the atmosphere,
and as a result the atmospheric aerosol spans a very
wide range of sizes. The mechanisms operate
differently for various materials and as a result the
composition varies markedly over the size range.
The units used to describe aerosol particles, and the
range of sizes involved, are illustrated in Figure 2.1.
The range of sizes encountered is limited at the lower
end by the size of a cluster of half a dozen or so
molecules: this is the smallest entity of the condensed
phase that can exist. The upper limit of size is
approximately the size of a sand grain. Such particles
fall quickly to the ground and normally travel only
short distances while airborne. They cannot be
properly described as suspended in the air except in
extreme, high wind conditions.
2.2.2 Condensation and Nucleation
The finest particles result from the condensation of
small numbers of involatile molecules. They may be
formed in combustion processes and in evaporation
from hot surfaces. Smokes and fumes from
metallurgical processes, coal and oil burning, motor
engines and even electric fires and cookers, contain
numerous particles in this size range. Such particles
also may result from gas-phase reactions (such as
oxidation of SO2 to form H2SO4) in the free
atmosphere that form involatile molecules.
When molecules of an involatile substance are present
in concentrations that far exceed the saturation vapour
pressure, they have a strong tendency to condense. If
a molecule encounters other molecules of the same
substance it may combine to form a condensation
nucleus - a very small particle. The molecule may
meet a nucleus that already exists, or a particle of
another substance, and condense causing growth in
size. In practice nucleation is self-limiting, since once
a sufficient number of nuclei have formed, further
condensation is likely to occur on existing nuclei
rather than form new ones.
These very fine particles (of order 1 to 10 nm
diameter) are very light (see Figure 2.1). Where
measurable concentrations of vapour condense in
smoke or fume, they are generated in vast numbers -
105 to 106 per cubic centimetre of air is common in
urban and industrial regions. They collide as a result
of their rapid Brownian motion, adhere and
agglomerate to form larger droplets, or the long
dendritic chains of particles commonly seen in smoke.
Further involatile matter, such as the sulphuric acid
formed in sulphur dioxide oxidation, may condense on
these particles. These processes gradually result in
particles in the ‘accumulation mode’, roughly 0.05 to
2 µm diameter.
2 Properties of Airborne ParticulateMaterial
Quality of Urban Air Review Group 7

Airborne Particulate Matter in the United Kingdom
8
Fig
ure
2.1
Aer
osol
Siz
e-S
cale
s.
Uni
ts (D
iam
eter
)O
ther
Siz
e-S
cale
s fo
rA
eros
ol C
ompo
nent
sP
artic
les
per
Com
paris
onM
icro
gram
me
1mm
1000
µm
106
nm
0.1m
m10
0µm
1
terr
estr
ial
infr
a-re
d
0.01
mm
10µ
m10
00
sola
r
infr
a-re
d
0.00
1mm
1µm
1000
nm10
6
wav
elen
gth
of v
isib
le li
ght
UV
-A,U
V-B
0.1µ
m10
0nm
109
:
0.01
µm
10nm
1012
10-6
mm
0.00
1µm
1nm
1015
terr
estr
ial
infr
a-re
d
coar
se m
ode
nucl
eatio
nm
ode
fine
fum
e.ca
rbon
met
als
etc.
accu
mul
atio
nm
ode
Ultr
avio
let
wav
elen
gth
of v
isib
le li
ght
sola
r in
fra-
red
sand silt
pollenspores
bacteria
soil dust, cloud dropssea spray
nitrate
heavy metal, sulphate, lead
clay

2.2.3 Comminution
A number of processes reduce massive material to
fine particles: the energy requirement depends on the
surface area of the particles produced and the large
amount of energy that would be required to generate
great numbers of very small particles is usually
prohibitive. In practice particles smaller than about
5 µm diameter are rarely generated this way, although
evaporation of spray drops may result in particles a
few times smaller.
In the natural world, various mechanisms result in the
fragmentation of rocks, the dispersal of soil in the air
or the formation of sea spray. Often wind energy is
the agent involved in the final step of rendering
particles airborne, and often in the fracturing of bulk
material.
Man intensifies this process locally by various
activities including quarrying, crushing and grinding
of ores and other substances, raising dust in
agriculture and road transport, spraying etc. In
general, the result of artificial or natural dispersal of
dust and spray in the atmosphere is a peak in the size
distribution in the aerosol in the region of 10 µm
diameter.
2.2.4 Fly Ash
This is a significant source of aerosol in some areas
and is worth a special mention. Strictly, fly ash is a
special case of a comminution aerosol. The fuel is
reduced to small dimensions by crushing (coal) or
spraying (oil) and suspended in the flame. Carbon
and organic matter is lost by oxidation to leave
involatile components as particles, which often show
evidence of melting. This aerosol component is often
accompanied by a fine condensation aerosol.
2.2.5 Cloud and Cloud Chemistry
Although rain and other forms of precipitation result
in removal of a large fraction of the aerosol particles
from the atmosphere, many clouds do not produce
rain, and precipitation is frequently seen to evaporate
before reaching the ground. Chemical processes
within cloud droplets produce additional aerosol
material. Cloud droplets condense onto pre-existing
aerosol particles, and the result of droplet growth,
cloud chemistry and evaporation is therefore expected
to increase the size of the particle and perhaps to
change its composition. Similarly, in cloud there are
increased opportunities for aggregation of aerosol
particles, with further growth in size. There is also
some evidence that nucleation (probably of sulphuric
acid solution droplets) is favoured at the high relative
humidities within or close to clouds, where new, small
particles are formed. The effects of clouds on the size
distribution have not been quantified, but it is likely
that particles chiefly in the accumulation mode
increase in size as a result of cloud processes.
2.2.6 Size Distribution
The atmospheric aerosol shows evidence of the
several categories of sources in its size distribution.
Typically, three major components are recognisable:
The first (nucleation mode) is attributable to the
nucleation process described above. This may contain
very large numbers of particles of ~10 nm diameter,
but because of the small size of each particle the mass
in this component is often a small fraction of the total
aerosol mass concentration.
The second component is often called the
accumulation mode. Particles roughly in the size
range 0.05 to 2 µm diameter are long-lived in the
atmosphere since the removal mechanisms are least
efficient in this region (see section 2.3 below).
Coagulation and condensation leads to growth of
particles in the nucleation mode into this region, and
often a significant fraction of the aerosol mass
accumulates in this size region. Particles in this size
range are important vectors for long range transport
(because they are long-lived) and are efficient light-
scatterers, so they are often dominant in optical effects
such as visibility.
Finally, the coarsest particle peak in the atmosphere
comprises particles of ~10 µm extending to about
100 µm in diameter. These are shorter-lived, very
variable according to local conditions, and are likely
to travel distances typically of metres to hundreds of
kilometres according to size and wind speed. They
Chapter 2 : Properties of Airborne Particulate Material
Quality of Urban Air Review Group 9

may contribute substantially to aerosol mass, although
the number of such particles is often small.
These components can overlap to comprise the broad
size distribution observed in the atmosphere (eg
Figure 2.2). The greatest number of particles is
almost invariably in the region smaller than 0.1 µm
diameter. The mass of particles is predominantly in
the accumulation and coarse particle regions, which
may make comparable contributions to the total. Even
the most remote, unpolluted parts of the atmosphere
contain particles at total concentrations of order 300
per cm3 of air, while urban air may have number
concentrations about 1000 times larger.
2.3 PROPERTIES AND BEHAVIOUR OF AIRBORNE PARTICLES
2.3.1 Fundamental Principles
The physical properties of small particles, suspended
in air, provide the scientific background for
understanding the behaviour of the atmospheric
aerosol. In this section some of the relevant physical
properties are introduced.
(i) Brownian Motion : Small particles suspended in
still air are seen to move about erratically. This
motion results from the variations in the number and
directions of impacts of air molecules on the surface
of the particle. The smallest particles are most
responsive to the tiny impulses from individual
molecular impacts, and the effect decreases with
particle size (see Figure 2.3).
The random motion that results causes particles to
disperse slowly in still air, and to collide with each
other and with surfaces: they adhere when they touch,
and these contacts result in coagulation to form larger
particles, and deposition onto surfaces.
(ii) Sedimentation: Solid and liquid particles are
about 1000 times denser than air at ground level.
They cannot be buoyed up by the air and must fall
through it, whatever their size. However, the
gravitational settling of the particles is resisted by the
viscosity of air, and each particle falls at a constant
rate determined by its shape, size and density. The
turbulent fluctuations in wind speed near the ground
include upward motions but these are rarely much
faster than 50 cm/s. Particles that fall through the air
Airborne Particulate Matter in the United Kingdom
10
Particle diameter d (µm)
Source: based on Jaenicke, 1993.
1 10 1000.1
0.1
10 80
60
40
20
0
103
10-3
10-5
105
10-7
rural
rural
urban
urban
dNd(log d)
cm-3
dVd(log d)
µm3/cm3
Figure 2.2 Typical Size Distributions of Atmospheric Aerosol in Urban and Rural Areas.
Note: The upper curves indicate number distributions, on a logarithmic scale (left hand scale). The lower curves indicate volume distributions (right hand, linear scale), roughly equivalent to mass distribution in units of µg/m3.
Particle diameter (µm)
(cm
)
cm/s
0.1 1.0 10
10-4
10-3
10-5
100
0.01
0.1
1.0
10
100
Displacement in 1s byBrownian motion
Sedimentation velocity (unit
density spheres)
Sedimentation Velocity and Brownian Motion, as a Function of Particle Diameter.
Figure 2.3

as fast as this cannot be lifted far away from the
ground surface, and if raised by some disturbance
must soon fall out.
(iii) Impaction: Close to the ground the wind must
flow around obstacles, such as the leaves and stems of
trees and grass, irregularities in the soil surface, as
well as buildings and other man-made objects. The
inertia of the larger particles present in the air prevents
them from following the flow around some
obstructions to flow. The particles impact against
obstructions and may adhere or (usually less often)
bounce. The efficiency of this process increases with
the air velocity, and particle size, and decreases with
the size of the obstacle.
This process is significant in contributions to the
deposition of particles onto surfaces, but also is used
in sampling particles for measurement. The
commonest size-selective samplers are cascade
impactors, in which the largest particles are collected
first by impaction from a jet of air, usually against a
flat plate. In subsequent stages of the instrument,
progressively faster air jets separate progressively
smaller particles onto impaction plates. The aerosol is
size-segregated according to its inertial characteristics.
Strictly, the separation depends also on density and
particle shape, and the result is specified in terms of
the ‘aerodynamic diameter’ which is the size of a
spherical particle of the same density as water with the
same inertia.
(iv) Interception: Small particles following the
airflow around an obstacle may make grazing contact
with the surface just because the flow brings them
within touching distance. This is an inefficient
process, partly because viscosity retards the flow so
close to the surface. However it is enhanced by the
presence of fine surface structure (leaf hairs, surface
roughness of soil, building materials etc) and is
important for particles for which Brownian motion
and impaction are inefficient.
(v) Optical Properties: Impairment of the visual
quality of the atmosphere due to haze is often the most
immediately apparent effect of air pollution. Particles
may both absorb and scatter light, and both affect the
visibility of distant objects and the appearance of the
sky and landscape. Only particles containing
elemental carbon (soot) absorb light significantly, and
scattering is by far the dominant process. Even the
molecules of clean air scatter light to some degree,
explaining the blue colour of the sky in clear,
unpolluted conditions. Molecular scattering (and
scattering by the smallest particles) is much more
effective for blue light than red, being proportional to
the fourth power of the ratio (radius/wavelength). For
larger particles, the dependence on radius is more
complex. When the radius becomes similar to the
wavelength, interference between light, refracted
through various parts of the particle and diffracted
around its edges, causes peaks and troughs in the total
scattering, and complex patterns in the distribution of
scattered light. Particles a few times larger than the
wavelength scatter light equivalent to twice their cross
sectional area. When particle mass is taken into
account, the most efficient scattering is achieved by
particles close in size to the wavelength (Figure 2.4).
Scattering by such particles is not much affected by
wavelength - hence the whitish appearance of dense
haze.
Chapter 2 : Properties of Airborne Particulate Material
Quality of Urban Air Review Group 11
Figure 2.4
Particle diameter (µm)
Mas
s ex
tinct
ion
coef
ficie
nt (
m2 /
g)
Source: Based on Harshvardhan, 1993, Ch 3 of 'Aerosol-Cloud-Climate Interactions, (PV Hobbs, ed) Academic Press, London and New York.
0.1 1 10
1
10
0.1
Mass Extinction Coefficient, as a Function of Particle Diameter.
Note: The mass extinction coefficient (the example shown is for slightly absorbing spherical particles of refractive index 1.53-0.01i) is a measure of the effectiveness of particles in obscuring distant objects, or reducing the brightness of the direct beam from a distant light. For a given mass concentration, particles of about 0.3µm diameter have the most effect on light obscuration, and particles smaller than 0.1µm or larger than 1.0 µm are many times less effective.

(vi) Uptake of Water Vapour: Many aerosol
particles consist largely of soluble matter. Sulphuric
acid or ammonium sulphate and ammonium nitrate
comprise a large fraction of the accumulation mode in
industrialised regions, and sea salt is an important
constituent in coastal regions. These hygroscopic
substances take up water vapour at moderate and high
relative humidities (Fig. 2.5). This results in an
important increase in particle diameter, and influences
many processes (light scattering, deposition) that
depend on particle size.
In fog and cloud, the air cools until slightly
supersaturated with water vapour. Each aerosol
particle has a critical supersaturation: up to this point,
the particle size increases with relative humidity
(supersaturation is relative humidity minus 100%)
maintaining equilibrium between the hygroscopic
properties of its constituents and the effect of
curvature of its surface, which favours evaporation.
However, once the critical supersaturation is exceeded
the particle continues to take up water vapour, limited
only by availability of vapour. The particle grows to
form a cloud droplet several microns in diameter. In
practice, only a fraction of the larger aerosol particles
grow to form cloud or fog droplets. They exhaust the
supply of vapour before smaller particles reach their
critical supersaturations. The effective particles are
called cloud condensation nuclei, and are generally
from the accumulation size range. Polluted air with
large numbers of nuclei results in fogs or clouds with
large numbers of small droplets; speculatively, these
have greater persistence and opacity, and reduced
likelihood of rain.
2.3.2 Deposition
A combination of processes removes particles from
the air to the surface of the earth. Rain collects
particles from the atmosphere, as can be demonstrated
by analysis of samples of rainwater. Independently of
rain, snow and other forms of precipitation, particles
are brought to earth by gravity and by several other
processes, collectively called dry deposition. Wet
deposition, dependent on precipitation, is episodic,
since in the UK precipitation occurs less than 10 per
cent of the time, but removes particles from a great
depth of the atmosphere. Dry deposition operates
continuously but only at the surface. Together these
categories of deposition must account for removal of
all particles in the atmosphere.
Airborne Particulate Matter in the United Kingdom
12
Figure 2.5a
Ratio of particle diameter at a given relative humidity to that in dry air
Rel
ativ
e hu
mid
ity (
%)
1.51 2.0 2.5
80
60
40
20
100
0
sulphuric acid
ammoniumsulphate
Illustration of the Growth of Hygroscopic Particles with Increasing Relative Humidity.
Figure 2.5b.
Time of rise (s)
Dro
plet
rad
ius
(µm
)
Source: Adapted from BJ Mason, 1971, The Physics of Clouds, Clarendon Press, Oxford.
101100 102
100
10-1
101
10-2
v = 10-15
v = 10-17
v = 10-18
v = 10-19
v = 10-16
100
10-1
101
10-2
Sup
ersa
tura
tion
(%)
The Growth of Cloud Droplets when an Aerosol of Sodium Chloride Particles of Different Sizes is Carried into a Cloud in a Steady Updraft. In this Example only Particles of 10-17 moles of NaCl or more Grow to Form Cloud Droplets.

2.3.3 Dry Deposition
Near the surface of the earth, the air is mixed rapidly
by turbulent motions, generated by the friction of the
wind at the surface. The buoyancy of warm air,
heated by contact with the surface in daytime adds to
the turbulence, while, on clear nights cooling of the
surface leads to an adjacent cold layer of air that
inhibits turbulence.
The mixing distributes particles through the boundary
layer, which usually extends to a height of about 1 km,
and is the air layer that is directly affected by friction
and heat exchange at the earth’s surface. Away from
the effects of sources the concentration in this layer
would be roughly uniform with height, and in
particular, turbulence maintains the concentration near
the surface. However, immediately adjacent to a
surface, air is retarded by viscosity and must flow
parallel to the surface. Particles are carried though
this layer, a fraction of a mm thick, inter alia by
gravity, Brownian motion and impaction, or contact
the surface by interception.
Once particles touch the surface, they are retained by
surface forces (although large particles may bounce,
they are likely to be trapped following multiple
bounces). The combination of mechanisms and the
resulting rate of deposition is illustrated in Figure 2.6
The deposition rate is generally expressed as the
deposition velocity
Vd (m/s) = Flux Density to the Surface (g/m2/s)
Concentration at Reference Height (g/m3)
and the surface includes any vegetation, buildings or
other features standing on a m2 of land.
The deposition velocity depends on surface geometry,
wind speed and atmospheric stability (the last is
controlled by the heating of the surface by the sun, or
its cooling at night) but the shape of the curve is
generally much the same. The conspicuous minimum
at about 0.05 to 2.0 µm diameter coincides with the
accumulation mode size range.
2.3.4 Wet Deposition
Falling raindrops collect particles from the air that
they traverse by much the same mechanisms. In
particular Brownian motion, interception and
impaction cause rain to scavenge particulate
contamination from the air. As in dry deposition, the
capture rate is minimum for particles roughly of 0.05
to 2 µm.
However, wet deposition is more difficult to
investigate than dry deposition and our knowledge of
wet deposition mechanisms is less complete.
Processes within clouds differ from those below cloud
in important respects. Rain clouds form in air that has
risen from the surface, carrying moisture and aerosol
from various sources. The droplets that constitute
cloud form by condensation of water vapour on
particles of roughly accumulation mode size, resulting
in an order of magnitude increase in particle diameter.
Generally in the UK, rain formation involves
formation of ice crystals, larger than the more
numerous water droplets, in the higher parts of the
cloud. The falling ice crystals (or snow flakes) collect
cloud droplets by impaction and interception before
melting to form rain drops. Thus the particles
involved as condensation nuclei have a high
probability of being scavenged. Together with below-
cloud processes, in-cloud scavenging ensures that all
parts of the aerosol size distribution are subject to
substantial removal rates during rain. Analysis of rain
Chapter 2 : Properties of Airborne Particulate Material
Quality of Urban Air Review Group 13
Figure 2.6
Aerodynamic diameter (µm)
Dep
ositi
on v
eloc
ity (
cm/s
)
0.1 1 100.01
0.1
1
10
Brownian m
otion
interception
impa
ctio
nse
dim
enta
tion
Dry Deposition Velocity to Grassland as a Function of Particle Size.
Note: The aerodynamic diameter indicates the inertial and sedimentation behaviour of particles, taking density and shape into account. The diagram shows how different mechanisms combine to remove small and large particles more effectively than those of intermediate size.

confirms that particulate tracers of all sizes are
removed. Averaging wet and dry days together, the
results imply an effective removal rate in rain over the
UK of about 7% per day for particles of about 1 µm
diameter and 15 to 30% per day for particles of 3 to 5
µm diameter and larger.
2.4 LIFETIME AND TRAVEL OF AEROSOLS
From the above discussion, it is possible to indicate
the length of time that aerosol particles are likely to
spend in the atmosphere (Figure 2.7). The smallest
particles (1 nm diameter) last only for some 10
minutes, but their loss is due to agglomeration with
other particles (and growth into the accumulation size
range) and not loss of material from the atmosphere.
In the accumulation size range, particles are likely to
be removed from the lower atmosphere by rain in
about 10 days (dry deposition alone would take 100 to
1000 days).
Larger particles (say 10 µm diameter) are likely to be
airborne for 10 or 20 hours before dry deposition
removes them. In the lower troposphere the mean
wind speed is about 7 m/s, so the larger particles
travel distances of 20 or 30 km while the smaller
particles (0.1 to 1 µm) may travel several thousand
km.
Atmospheric conditions are very variable, and, while
these values are useful to provide an indication of the
average consequences of the emission of pollution to
the atmosphere, they should be applied with caution to
any particular event or trace substance.
A proportion of particles escape from the boundary
layer to higher levels in the troposphere, often as a
result of involvement in convective clouds or uplift of
air in frontal systems. Those that are not removed in
rain are likely to have longer residence times, due to
the remoteness of the surface and the lower frequency
of falling rain. The small fraction that reach the
tropopause (about 8 to 15 km high) may remain
airborne for times approaching a year.
The combined effect of persistence and transport of
atmospheric aerosols was vividly illustrated by 137Cs
from the Chernobyl accident: the primary particles
were measurable for over 2 months, showed a mean
residence time of about 10 days, and reached all parts
of the northern hemisphere.
REFERENCES
Finlayson-Pitts BJ, and Pitts JN (1986) AtmosphericChemistry: Fundamentals and ExperimentalTechniques, Chapter 12: Particulate Matter in theAtmosphere: Primary and Secondary Particles,John Wiley and Sons, New York.
Jaenicke R (1988) Aerosol Physics and Chemistry,in ‘Numerical Data and Functional Relationshipsin Science and Technology’, Landolt BernsteinNew Series V: Geophysics and Space Research, 4:Meteorology (G Fischer, ed.); Physical andChemical Properties of the Air, 391-457, Springer,
Berlin.
Jaenicke R (1993) Tropospheric Aerosols, Ch. 3 of‘Aerosol-Cloud-Climate Interactions’, (PV Hobbs,
ed) Academic Press, London and New York.
Junge CE (1963) Air Chemistry and Radioactivity ,
Academic Press, London and New York.
Preining O (1993) Global Climate Change Due toAerosols, Ch. 3 of ‘Global Atmospheric Chemical
Airborne Particulate Matter in the United Kingdom
14
Figure 2.7
Particle diameter (µm)
Mea
n re
side
nce
time
(day
s)
Source: Adapted from Jaenicke, 1993.
0.001 0.01 0.1
0.01
0.1
1 10 100
1
10
A
B
The Residence Time of Atmospheric Particles Entering the Boundary Layer.
Note: Curve A represents the deposition of aerosol particles to the ground, while curve B also includes the effect of coagulation, which reduces the number of small particles without removing their substance from the air.

Change’(CN Hewitt and WT Sturges, eds), Elsevier
Applied Science, London and New York.
Twomey S (1977) Atmospheric Aerosols, Elsevier
Scientific Publishing Company, Amsterdam, Oxford
and New York.
Chapter 2 : Properties of Airborne Particulate Material
Quality of Urban Air Review Group 15

Airborne Particulate Matter in the United Kingdom
16

3.1 INTRODUCTION
There is a wide range of samplers available for
monitoring particles. The choice though depends
crucially upon the purpose of the monitoring. There
are two basic reasons for particle monitoring that are
dealt with in this Chapter:
• human health effects
• nuisance effects
In the case of human health it is the airborne
concentration of particles that needs to be measured,
while for nuisance effects it is principally deposited
particles that have to be determined. The methods
considered are designed to measure the quantity of
material in the air or the amount deposited. Methods
for chemical or physical analysis of collected particles
are not covered.
The potential for particles to cause health effects is
related to their size. Particles up to 100 µm enter the
body during breathing, but it is only the very small
particles, below about 5 µm aerodynamic diameter
that can reach deep into the lung. It is widely
accepted that it is these very small particles that have
the main potential for causing health effects. It is
therefore very important to define the size of the
particles that are to be measured. It is no longer
sufficient to measure what is termed “total suspended
particulate” (TSP) or “suspended particulate matter”
(SPM), as the size fractions being sampled are not
specific but depend upon the equipment used to
collect the sample. The current focus of health-related
sampling of particulate matter is on PM10, and this will
therefore be the focus of the measurement methods
described in this Chapter. There is also a growing
interest in the finer fraction of particles, such as PM2.5,
so some consideration will be given to sampling of
this fraction.
3.2 AIRBORNE PARTICLES
3.2.1 Scientific Framework
For health effects that are suspected to have arisen
from particles entering the body through the nose and
mouth during breathing, one must use a sampler
whose performance mimics the efficiency with which
particles enter the nose and mouth and penetrate to the
region in the body where the harmful effect occurs.
Workers in the occupational hygiene field have
realised this for some years and defined the respirable
fraction for those particles that penetrate to the
alveolar region of the lung and cause diseases such as
pneumoconiosis, silicosis, asbestosis, etc.
Since the early 1980s an ad-hoc working group of the
International Standards Organisation has been
formulating health-related sampling conventions for
airborne dusts both in the ambient atmosphere and in
the workplace. The final agreed conventions have
passed through all stages of the approval procedure
and should soon become available as International
Standard IS 7708 (ISO, 1994). They are defined in
Figure 3.1 and comprise four main fractions:
Inhalable Fraction (EI) is defined as the mass
fraction of total airborne particles which is inhaled
through the nose and/or mouth. It was derived from
wind tunnel measurements of the sampling efficiency
of full-size tailor’s mannequins and replaces the very-
loosely defined “total” aerosol fraction used
previously. For ambient atmospheres it is given by:
EI = 0.5 (1 + exp [-0.06D]) + 10-5 U2.75 exp (0.05D)
where D is the aerodynamic diameter of the particle
(defined as the diameter of an equivalent spherical
particle of density 103 kg/m3,which has the same
falling speed as the particle in question), and U is the
windspeed (up to 10 m/s).
Thoracic Fraction is defined as the mass fraction of
inhaled particles penetrating the respiratory system
beyond the larynx. As a function of total airborne
particles, it is given by a cumulative lognormal curve,
with a median aerodynamic diameter of 10 µm and
geometric standard deviation of 1.5.
Respirable Fraction is defined as the mass fraction
of inhaled particles which penetrates to the unciliated
airways of the lung (alveolar region). As a function of
total airborne particles, it is given by a cumulative
3 Measurement Methods
Quality of Urban Air Review Group 17

lognormal curve with a median aerodynamic diameter
of 4 µm and a geometric standard deviation of 1.5.
`High Risk’ Respirable Fraction is a definition of
the respirable fraction for the sick and infirm , or
children. As a function of total airborne particles, it is
given by a cumulative lognormal curve with a median
aerodynamic diameter of 2.5 µm and a geometric
standard deviation of 1.5.
These conventions provide target specifications for the
design of health-related sampling instruments, and
give a scientific framework for the measurement of
airborne dust for correlation with health effects. For
example, the inhalable fraction applies to all particles
that can enter the body, and is specifically of
relevance to those coarser toxic particles that deposit
and dissolve in the mouth and nose. The respirable
fraction, on the other hand, relates to those diseases of
the deep lung, such as the pneumoconioses, whilst the
thoracic fraction may be relevant to incidences of
bronchitis, asthma and upper airways diseases. Until
recently, this philosophy has not been taken on board
by the environmental community for health-related
sampling.
In the European Union (and thus the UK), ambient
airborne particle sampling has been guided by the
Sulphur Dioxide and Suspended Particulate Directive
(80/779/EEC). This Directive makes no reference to
any particular health-related aerosol fraction. The
measurement methods accepted are either for ‘black
smoke’ or ‘suspended particulates’ by a gravimetric
method. The EC Ambient Air Quality Assessment
Airborne Particulate Matter in the United Kingdom
18
1 10 1000
20
40
60
80
100
"HIGH RISK"RESPIRABLECONVENTION
RESPIRABLECONVENTION
THORACICCONVENTION
INHALABLECONVENTION
Aerodynamic diameter (µm)
Per
cent
age
of to
tal a
irbor
ne p
artic
les
in c
onve
ntio
n
Figure 3.1 ISO Health-Related Particle Sampling Conventions IS 7708 (1994).

and Management Directive, which has now reached a
common position, sets out a number of pollutants to
be covered by daughter Directives. These include
“suspended particulate matter” and “fine particulate
matter (including PM10)”. Technical work on these
has now started within Europe.
There is a US EPA definition of the thoracic aerosol
fraction known as PM10 (EPA, 1987), which has been
systematically measured with validated instruments in
the USA for the last 8-9 years. It differs slightly from
the ISO definition in that its upper cut off is lower at
16 µm, as shown in Figure 3.2, although in practice
this difference is not significant.
The USA is currently giving consideration to
implementation of sampling for a finer aerosol
fraction, with a median aerodynamic diameter of
about 2.5 µm, which may eventually prove to be of
greater health significance than PM10. This would
separate the finer particles of mostly anthropogenic
origin from the coarser particles which include natural
components. PM2.5 sampling would equate to the high
risk respirable fraction defined in IS 7708. Such
samplers are already available and are starting to be
used in the UK, although not in a routine way.
Ambient particle sampling currently focuses on the
mass of the particles rather than their number. Recent
suggestions that adverse effects of exposure to
ambient particles may be caused by the ultrafine
fraction (<0.1 µm) (Seaton et al, 1995), are likely to
generate greater research interest in the measurement
of particle numbers.
Chapter 3 : Measurement Methods
Quality of Urban Air Review Group 19
1 10 1000
20
40
60
80
100
ISO ThoracicConvention
PM10 Convention
Particle aerodynamic diameter (µm)
Per
cent
age
of to
tal a
irbor
ne p
artic
les
in c
onve
ntio
n
Figure 3.2 PM10 and ISO Thoracic Particle Sampling Conventions.

3.2.2 Early Techniques of Health-relatedSampling of Particles in the UK
Sampling of ambient airborne particles was
introduced into the UK on a routine basis in the first
half of this century. In the 1960s the scale of
sampling expanded rapidly, in response to the
concerns about the health effects of the smogs. A
countrywide network of simple samplers operated by
local authorities was established to measure the levels
of black smoke in the atmosphere. These samplers,
shown in Figure 3.3, comprised a downwards-facing
funnel into which air was drawn. The sampled
particles were collected on a paper filter at some
distance (typically 2 m) from the inlet. The quantity
of dust was assessed by measurement of light
reflectance from the surface of the filter. The black
particles prevalent in the smoke from fossil fuels
contributed most to the measurements at this time,
which was converted to mass units using a calibration
curve. This method was adopted by the British
Standards Institute as the standard method for
measuring airborne particulate matter (BSI, 1969a). It
is still used today and is covered by the Sulphur
Airborne Particulate Matter in the United Kingdom
20
SUCTIONPUMP
GASMETER
METALCONDUIT
INLET ONLY
COMPLETE FLOW SYSTEM
FILTER CLAMP IN SCREW-TYPE HOLDER
*STAINLESS STEEL STANDARD 47mm AEROSOL FILTER HOLDER ALSO USED
1m
0
20
40
60
80
100
2 4 6 8 10 20 40
Figure 3.3 Components of British Black Smoke Sampler Together with its Sampling Efficiency.
Pen
etra
tion
(%)
Aerodynamic particle diameter (µm)
2 Km/hr
2 Km/hr
8 Km/hr
*

Dioxide and Suspended Particulates Directive
(80/779/EEC). It should be noted, though, that the
calibration curve in the EC directive differs from that
in the British Standard (BS black smoke = 0.85 x EC
black smoke). This is a useful reminder that the
calibration of the black smoke method depends on the
composition of the particles. For current particles, the
black smoke method provides an indication of particle
concentration but this is both site and season-specific.
This can be seen in the comparisons between black
smoke and PM10 measurements reported in Chapter 6.
The sampling performance of the BS system
(McFarland and Ortiz, 1984) is also shown in Figure
3.3, where it can be seen to collect particles below 4
µm with a high efficiency. It therefore approximates
to the ‘respirable’ fraction defined in IS 7708.
In the early 1970s, the Government instigated two
other national surveys of ambient dust to monitor
sulphate aerosol and metals. Two very similar
samplers were used in the surveys. The “S-type” for
sulphate and the “M-type” for metals. The “M-type”
sampler, is shown in Figure 3.4. It comprises a
downwards-facing cylindrical hood covering a 37 mm
open-face filter holder. The design was influenced
primarily by the need to protect the filter from wind
and rain. However, this inevitably meant that large
particles were not sampled, as can be seen in the
results of the wind-tunnel performance tests also
shown in Figure 3.4 (Upton and Barrett, 1985). Its
performance is strongly windspeed dependent,
although at 6 m/s, which is close to the average wind
speed in the UK, its sampling efficiency is close to
Chapter 3 : Measurement Methods
Quality of Urban Air Review Group 21
0 10 15 2050
20
40
60
80
100
120
Figure 3.4 Details of M-type Sampling Head Together with its Sampling Efficiency.
Aerodynamic diameter (µm)
Sam
plin
g ef
ficie
ncy
(%)
TUBING TO PUMP AND METER
STAINLESS STEELCONNECTOR
MEMBRANE FILTER
PROTECTIVE SKIRT(CIRCULAR)
FILTER HOLDER
240
31
160190
SECTIONAL VIEW - DIMENSIONS IN mm
U = 2m/s
U = 6m/s
U = 9m/s
Thoracic convention
PM10 convention
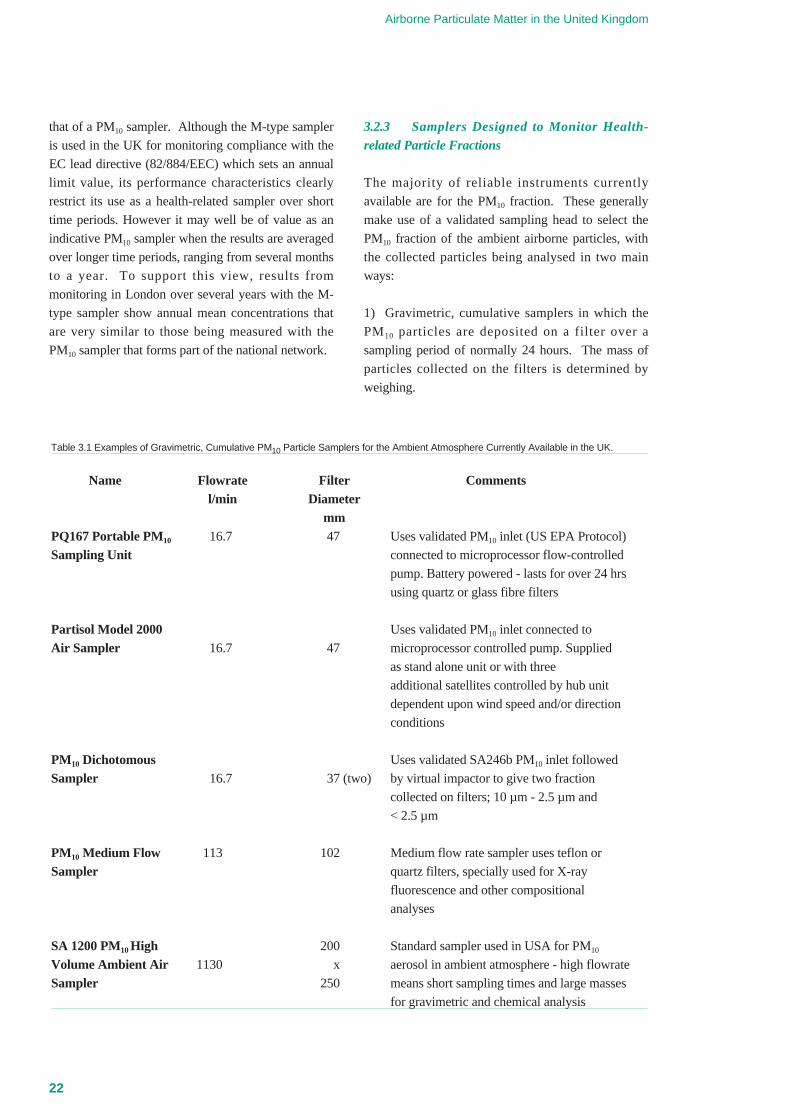
that of a PM10 sampler. Although the M-type sampler
is used in the UK for monitoring compliance with the
EC lead directive (82/884/EEC) which sets an annual
limit value, its performance characteristics clearly
restrict its use as a health-related sampler over short
time periods. However it may well be of value as an
indicative PM10 sampler when the results are averaged
over longer time periods, ranging from several months
to a year. To support this view, results from
monitoring in London over several years with the M-
type sampler show annual mean concentrations that
are very similar to those being measured with the
PM10 sampler that forms part of the national network.
3.2.3 Samplers Designed to Monitor Health-related Particle Fractions
The majority of reliable instruments currently
available are for the PM10 fraction. These generally
make use of a validated sampling head to select the
PM10 fraction of the ambient airborne particles, with
the collected particles being analysed in two main
ways:
1) Gravimetric, cumulative samplers in which the
PM10 particles are deposited on a filter over a
sampling period of normally 24 hours. The mass of
particles collected on the filters is determined by
weighing.
Airborne Particulate Matter in the United Kingdom
22
Table 3.1 Examples of Gravimetric, Cumulative PM10 Particle Samplers for the Ambient Atmosphere Currently Available in the UK.
Name Flowrate Filter Commentsl/min Diameter
mmPQ167 Portable PM10 16.7 47 Uses validated PM10 inlet (US EPA Protocol)
Sampling Unit connected to microprocessor flow-controlled
pump. Battery powered - lasts for over 24 hrs
using quartz or glass fibre filters
Partisol Model 2000 Uses validated PM10 inlet connected to
Air Sampler 16.7 47 microprocessor controlled pump. Supplied
as stand alone unit or with three
additional satellites controlled by hub unit
dependent upon wind speed and/or direction
conditions
PM10 Dichotomous Uses validated SA246b PM10 inlet followed
Sampler 16.7 37 (two) by virtual impactor to give two fraction
collected on filters; 10 µm - 2.5 µm and
< 2.5 µm
PM10 Medium Flow 113 102 Medium flow rate sampler uses teflon or
Sampler quartz filters, specially used for X-ray
fluorescence and other compositional
analyses
SA 1200 PM10 High 200 Standard sampler used in USA for PM10
Volume Ambient Air 1130 x aerosol in ambient atmosphere - high flowrate
Sampler 250 means short sampling times and large masses
for gravimetric and chemical analysis

2) Direct-reading monitors in which the selected PM10
particles are either deposited on a filter, with
continuous assessment of the change of a property of
the filter due to their presence, or passed through an
optical sensing region.
The PM2.5 fraction can be measured using the same
analysers, provided use is made of a PM2.5 sampling
head.
3.2.3.1 Gravimetric, Cumulative Samplers
These samplers basically comprise an omnidirectional
rain-protected entry followed by a size-selective stage
(normally an impactor) to separate the PM10 particles
which are collected on the filter. There are a number
of different samplers available, ranging in flowrate
from 16.7 to 1130 l/min. A summary of the important
features of some samplers available in the UK is given
in Table 3.1 and a brief description of the design
features and relative performance of the sampling
heads is given below.
High flowrate samplers such as the Graseby Andersen
PM10 Hi-Vol Sampler (see Figure 3.5) have been the
mainstay of routine PM10 measurements in the USA.
The high flowrate of 1130 l/min has the advantage of
providing sufficient sample both for gravimetric and
chemical analysis over the specified 24 hr sampling
period. Hi-Vol samplers (without a complete PM10
inlet) were used in the Department of the
Environment’s national survey of dioxins, PCBs and
PAHs in the ambient atmosphere (Coleman et al,
1995). The important features of the PM10 sampling
head are an omnidirectional narrow slot entry, which
samples particles independently of windspeed up to 10
m/s, and a multi-orifice single stage impactor, which
allows the PM10 fraction to penetrate to a 25 x 20 cm
filter. The efficiency of the sampler demonstrates full
agreement with the US EPA PM10 Convention, as
shown in Figure 3.5. The sampler is mains powered
with either volume or mass flowrate automatically
controlled. A high volume virtual impactor is
available to insert between the impactor and the filter
to provide the PM2.5 fraction of the PM10 particles.
A number of low flowrate PM10 samplers are available
in the UK. They all make use of the SA246b PM10
inlet developed and validated by Graseby Andersen.
The entry (see Figure 3.6) consists of a flanged
cylindrical pipe with a disc rain cap held some
distance above. This forms the omnidirectional entry
through which particles enter, followed by a single
stage impactor which allows the PM10 fraction to
Chapter 3 : Measurement Methods
Quality of Urban Air Review Group 23
HI-VOL BLOWER
FILTER
FRACTIONATOR
INLET
INLET COVER
FLOW
Figure 3.5 High volume PM10 Sampler Together with its Sampling Efficiency.
1 10 1000
10
20
30
40
50
60
70
80
90
100
110
ThoracicConventionPM10
Droplet Tests0.6 m/s2.2 m/s6.7 m/s10 m/s
Aerodynamic diameter (µm)
Col
lect
ion
effic
ienc
y (%
)
0 25 50cm
SCALE

penetrate to a filter. The sampling efficiency of the
entry, which demonstrates full agreement with the US
EPA PM10 Convention, is also shown in Figure 3.6.
Three devices are included in Table 3.1, each having
separate features that makes them to a certain extent
complementary. The Casella PQ 167 Portable PM10
Sampling Unit uses a specially designed battery-
powered pump which lasts for 24 hrs, and a 47 mm
diameter quartz or glass fibre filter. This makes the
sampler very useful at sites where mains power is not
easily available.
The Rupprecht and Patashnick Partisol Model 2000
Air Sampler can either be supplied as a stand-alone
unit or with three additional satellite PM10 sampling
head and filter units. The satellites are connected to
the main hub unit (at a maximum distance of about
3 m) through simple air flow lines which are switched
via solenoid valves controlled by a user defined
sampling programme. This enables four daily
samples to be taken without attention. In addition,
separate samples can be taken for different wind
speeds, wind directions and at specified times, thereby
providing useful evidence for source apportionment
studies and for correlation with meteorological
conditions. For all units the PM10 head can be
replaced with a small cyclone inlet which has a 50%
penetration at 2.5 µm. The sampler runs off mains
power only.
Finally, the Graseby Andersen PM10 Dichotomous
Sampler separates particles into two distinct fractions:
2.5 to 10 µm and < 2.5 µm. This is achieved by
following the PM10 inlet with a virtual impactor with a
50% penetration at 2.5 µm, and collecting both
fractions on 37 mm diameter teflon membrane filters.
This gives some size distribution information of
particles within the PM10 fraction, and provides
separate samples for chemical species studies.
Airborne Particulate Matter in the United Kingdom
24
ACCELERATION ASSEMBLY
COLLECTOR ASSEMBLY
Figure 3.6 Low Volume PM10 Sampling Head Together with its Sampling Efficiency.
1 10 1000
10
20
30
40
50
60
70
80
90
100
0.5 m/s
6.7 m/s
ISO Thoracic Convention
PM10 Convention
Particle aerodynamic diameter (µm)
Ove
rall
sam
plin
g ef
ficie
ncy
(%)

3.2.3.2 Direct-reading Monitors
For these instruments, sampling and analysis is carried
out within the instrument, and the concentration can
be obtained almost immediately. Like the low
flowrate cumulative samplers described above, these
instruments generally use the validated SA 246b PM10
inlet to select the PM10 particles which either deposit
on a special filter stage or penetrate into a particle
sensing region. Instead of direct weighing the
presence of the particles either on the filter or in the
sensing region gives rise to a property change, which
can be related by calibration to the mass of particles
present. A number of different instruments are
available and these may be classified into three main
categories: optical, resonance oscillation, and beta
particle attenuation. A summary of the main features
of the direct-reading instruments for health-related
purposes is given in Table 3.2, and the principles of
operation are described below.
Optical
These instruments employ the interaction between
airborne particles and visible light in a sensing region,
and generally their response is dependent upon the
size distribution, shape and refractive index of the
particles. They therefore require calibration to give
results in terms of mass or number concentrations.
This calibration only holds provided that the nature of
the particles does not change and hence measurements
obtained in ambient air are open to considerable
uncertainty. Two instruments are currently available.
The DataRAM Portable Real-Time Aerosol Monitor
uses a near infrared source and forward angle
scattering to detect the concentration of particles in the
range 0.1 to 1000 µg/m3. It uses a scaled-down
version of the SA 246b PM10 inlet to select the PM10
fraction at a flowrate of 2 l/min, although this has not
been experimentally validated. The impactor stage
can be replaced to give a nominal 50% penetration at
2.5 µm. The instrument is powered by a 6 V lead acid
battery which lasts for 20 hours, making it useful at
sites where mains power is not easily available. It is
calibrated with AC fine test dust (mass median
aerodynamic diameter 2 to 3 µm, standard deviation
2.5), and may need on-site calibration to ensure valid
results in terms of mass concentration.
The Grimm Stationary Environmental Dust Analyser
1.200 comprises two samplers in one unit. The
“reference” unit uses a standard 16.7 l/min PM10 inlet
connected to a 25 mm diameter glass fibre filter. This
is essentially a standard gravimetric sampler as
previously described, with the concentration
determined by weighing the filter. However an
airflow splitter is used to extract air at 1.26 l/min
downstream of the PM10 head, this sub-sample being
fed into a light scattering optical particle counter. The
optical counter uses peak height analysis to separate
the particles into 8 channels in the range 0.3 to 15 µm.
The mass concentration within these fractions is
determined using calibration factors which can be
determined from an in-built back-up filter (although a
long sample period is required to collect sufficient
sample on the back up filter with the low flow rate
used). The optical particle counter is also available as
a stand-alone unit as a nominal PM10 sampler. In this
form it is particularly attractive because of its small
size. It is a potentially versatile tool that provides both
number and (nominal) mass size distributions.
However, its performance as a mass sampler depends
crucially on the calibration, which is based on
integration over a long period and over all size
fractions. It is not clear, yet, how variable the
calibration factor is with time (hour by hour) and from
one size fraction to another. Until these issues are
addressed, the results from the optical unit must be
treated with caution.
Oscillating Microbalance
The frequency of mechanical oscillation of an element
such as a tapered glass tube is directly proportional to
the mass of the tube. Change in effective mass of the
tube, such as that due to deposition of particles on the
surface of a filter at the free end of the tube, is
reflected in a change in its resonant frequency.
This is the principle of operation behind the Rupprecht
and Patashnick Tapered Element Oscillating
Microbalance (TEOM), as shown in Figure 3.7. A
standard 16.7 l/min PM10 inlet selects the PM10
particles which pass through a flow splitter in which 3
Chapter 3 : Measurement Methods
Quality of Urban Air Review Group 25

Airborne Particulate Matter in the United Kingdom
26
Tab
le 3
.2 E
xam
ples
of D
irect
-Rea
ding
Mon
itors
for
PM
10P
artic
les
in th
e A
mbi
ent A
tmos
pher
e.
Nam
eM
easu
rem
ent
Flo
wra
teP
artic
leC
once
ntra
tion
Pre
cisi
on µ
g/m3
Com
men
tsT
echn
ique
l/min
Fra
ctio
nR
ange
µg/
m31
hour
24 h
ours
TE
OM
Ser
ies
1400
aT
aper
ed e
lem
ent
16.7
thro
PM
10 w
ith
Onl
y di
rect
-rea
ding
mon
itor
Am
bien
t Par
ticul
ate
osci
llatin
g in
let w
ith 3
poss
ible
2.5
or
0.06
- 1
500
1.5
0.5
in w
hich
out
put d
irect
ly r
elat
ed
Mon
itor
mic
roba
lanc
eth
ro’ f
ilter
/1.
0 µ
mto
mas
s. E
mpl
oyed
as
part
icle
dete
ctor
mon
itor
at n
atio
nal A
utom
atic
Urb
an N
etw
ork
Site
s.
W &
A B
eta
Gau
geA
ttenu
atio
n of
bet
a O
ne o
f a n
umbe
r of
filte
r
Aut
omat
ed P
artic
lera
ys b
y pa
rtic
les
18.9
PM 10
4 -
104
40.
1ta
pe b
ased
bet
a ga
uges
-
Sam
pler
colle
cted
on
a fil
ter
mea
sure
men
t cyc
le 1
hou
r.
Airb
orne
Par
ticle
Atte
nuat
ion
of b
eta
Cas
sette
sys
tem
with
30
filte
rs
Mon
itor
AP
M1
rays
by
part
icle
s15
- 3
0P
M 102
- 10
756
2in
seq
uent
ial l
oade
r. In
tegr
ity
colle
cted
on
a fil
ter
(non
val
idat
ed)
of e
ach
sam
ple
mai
ntai
ned
for
com
posi
tiona
l ana
lysi
s.
GR
IMM
Mod
elLi
ght-
scat
terin
g16
.7 th
ro’
PM 10
with
Opt
ical
par
ticle
cou
nter
with
1.10
4 D
ust m
onito
rph
otom
eter
inle
t 1.2
6 th
ro’
EP
A v
alid
ated
1 -
5 x
104
Not
Not
in-b
uilt
filte
r fo
r on
-site
cal
ibra
tion,
dete
ctor
head
indi
cate
dgi
ven
give
nas
res
pons
e m
ay b
e de
pend
ent u
pon
refr
activ
e in
dex
and
size
of p
artic
les.
Dat
aRA
M P
orta
ble
Ligh
t-sc
atte
ring
PM 1
0or
PM
2.5
0.1
- 10
3N
otO
ptic
al d
evic
e ca
libra
ted
with
AC
Rea
l-Tim
e A
eros
olph
otom
eter
2(n
on v
alid
ated
)in
dica
ted
1.0
give
nfin
e te
st d
ust.
May
nee
d on
-site
Mon
itor
calib
ratio
n to
giv
e re
liabl
e m
ass
mea
sure
men
ts a
s re
spon
se
depe
nden
t upo
n re
frac
tive
inde
x
and
size
of p
artic
les.
Ent
ry
depe
nden
t upo
n w
inds
peed
.

l/min passes through a 16 mm diameter filter
connected to the top of the narrow end of a hollow
tapered glass tube. As the particles collect on the
filter, the tube’s natural frequency of oscillation
decreases. The change in this frequency is directly
proportional to the added mass. The inlet including
the sensing system is kept at a steady 50°C to drive off
any sampled water droplets. The instrument is
microprocessor controlled and the mass concentration
values are updated every 13 seconds with average
concentrations provided every 30 minute or every
hour. This instrument is the particulate monitor
chosen for the Department of the Environment's
Automatic Urban Network sites and has been used by
many organisations both in the UK and worldwide.
Some concern has been expressed about the potential
loss of volatile material at the stable temperature of
50°C (Weiner, 1995).
Beta Particle Attenuation
This involves the measurement of the reduction in
intensity of beta particles passing through a dust-
laden filter or collection substrate. The change in
attenuation reflects the rate at which particles are
collected on the filter and hence the concentration in
the sampled air. The mass of particles collected is
calculated from a knowledge of their mass absorption
coefficient. The instrument is calibrated using the
mass absorption coefficient for quartz. Measurements
with ambient aerosols suggest the mass absorption
coefficient may in practice vary by up to ±20%. The
beta attenuation method is therefore inherently less
accurate than gravimetric methods. Two main types
of instrument have been developed: one using filter
tape to collect the particles, and the other using a stack
of conventional filters in a sequential loader.
There are many tape-based beta particle attenuation
devices available, and details of just one typical
example are given here.
Chapter 3 : Measurement Methods
Quality of Urban Air Review Group 27
TO FLOW CONTROLLER
FLOWFLOW
HEATED-AIR INLET
SAMPLING HEAD
TAPEREDELEMENT
FILTER CARTRIDGE
MICROPROCESSOR
ELECTRONICFEEDBACK SYSTEM
Figure 3.7 Schematic Diagram of Rupprecht and Patashnick TEOM Ambient Aerosol Monitor.

The Wedding & Associates Beta Gauge Automated
Particle Sampler uses their version of the low volume,
validated PM10 inlet at 18.9 l/min to select the PM10
particles which are deposited on to either a glass fibre
or PTFE filter tape. A beta particle attenuation system
comprising a 3.7 MBq 14C source and a fast response
silicon semiconductor detector is used to detect the
presence of dust on the filter with a one hour
measurement cycle.
The Elecos Airborne Particle Monitor APM-1 is an
interesting alternative to the tape based beta particle
attenuation monitors. Instead of the filter tape, it
deposits PM10 particles onto one of thirty 47 mm
diameter filters held in a sequential loader system.
This prevents violation of the integrity of the
deposited particles enabling subsequent unambiguous
gravimetric and chemical analyses to be made.
Beta particle monitors have been widely employed in
a number of European countries. Further evaluation
of Beta particle monitors by setting them up alongside
a TEOM is however desirable.
3.2.3.3 Health-related Samplers for CoarseParticles
Particles as large as 100 µm can enter the human nose
and mouth during breathing. Whilst the occurrence of
these large particles may be rare, they can occur close
to industrial processes and during periods of high
windspeeds. Once inhaled they will deposit in the
nasopharyngeal region and if toxic (such as lead,
radioactive particles, etc) may enter the blood system
there or in the gut.
The relevant ISO health-related fraction is the
inhalable fraction, for which there is currently no
commercially available instrument. The old “total
suspended particulate” (TSP) was effectively defined
by the “high-volume” sampler used to measure this
parameter. The performance of this well-known
device is both orientation and windspeed dependent,
with its efficiency falling well below the inhalable
aerosol convention, especially with large particles
(Wedding et al, 1977).
Recent work has been carried out to develop a sampler
to match the requirements of the ISO Inhalable
aerosol fraction (Mark et al, 1990). It uses a single
orifice that rotates through 360˚ (see Figure 3.8) to
make it omnidirectional. A protective canopy protects
it from rain and snow. The efficiency, as tested in a
large wind tunnel, at different wind speeds is shown in
Figure 3.8 (Mark et al, 1990, 1994).
3.2.4 General Sampling Procedures to MonitorHealth-related Particle Fractions
3.2.4.1 Selection of Samplers for PM10 Monitoring
The choice of samplers will be influenced by the
timescale required for the measurement. The standard
proposed by the Expert Panel on Air Quality
Standards is 50 µg/m3 as a rolling 24-hour average.
This requires measurements to be made to a 1-hour
timescale, with the 24-hour average being updated
every hour. However, measurements of 24-hour
concentrations over a fixed time frame will still
provide a useful indication of air quality in relation to
the proposed standard, but will underestimate the
frequency and magnitude of exceedences. There is a
range of samplers that meet the 1-hour or fixed 24-
hour time frames, as indicated in Tables 3.1 and 3.2.
The majority are relatively expensive, in the range
£5,000-£20,000. Unfortunately there is no very cheap
sampler available, as is the case with nitrogen dioxide,
where the diffusion tube is now a widely used option
to provide indicative results. The nearest equivalent
for sampling of particulate matter is the ‘M Type’
sampler, which costs around £1,500. Its sampling
characteristics make it a reasonable indicative sampler
for long-term (eg annual average) PM10
concentrations, although other more expensive
samplers with true PM10 inlets are preferable.
The TEOM is the sampler used in the UK Automatic
Urban Network. It is relatively easy to operate once
set up and provides concentrations resolved to 1-hour.
It is however the most expensive sampler. Beta
particle gauges are somewhat cheaper and the latest
models are claimed to be capable of providing data
resolved to 1-hour. As discussed above, their
accuracy is probably not as good as the gravimetric
samplers. The only other instruments capable of
Airborne Particulate Matter in the United Kingdom
28

producing time resolved data over 1-hour are the
optical samplers, although there is still some
uncertainty as to their accuracy as nominal
gravimetric samplers.
The alternative approach to accurate PM10
measurement is the gravimetric sampler. These are
somewhat cheaper than the automatic samplers to
purchase, but set against this is the fact that they are
labour intensive, in most cases requiring daily visits to
change the filters, and access to a precision balance to
carry out the weighing. The high-volume samplers
favoured in the USA are more bulky and noisier to
operate. These samplers are, however, all incapable
of providing rolling 24-hour mean concentrations and
there is an inevitable delay before results are available.
3.2.4.2 Sampling Strategy
Programme Types
There are two main types of programme:
1) Long-term studies at a number of fixed sites
throughout the country to monitor pollution trends. At
these sites a whole range of pollutants (including
aerosols) are measured by continuous monitors with
the results being sent by telemetry to a central data
acquisition centre. Besides being used to monitor
compliance with European Directives and the
effectiveness of national policies, these programmes
also provide invaluable data for public information
and epidemiological studies.
Chapter 3 : Measurement Methods
Quality of Urban Air Review Group 29
ROTATION ANDPUMPING UNIT
RAIN CAP (730mm DIAMETER)25mm INLET
FILTER
560
640
880
1000
ALL DIMENSIONS IN mm
Figure 3.8 CEC Ambient Inhalable Particle Sampler Together with its Sampling Efficiency.
Aerodynamic diameter (µm)
Sam
plin
g ef
ficie
ncy
(%)
0
20
40
60
80
100
0
20
40
60
80
100
0 10 20 30 40 50 60 70 80 90 100 1100
20
40
60
80
100
120
2 m/s
5 m/s
9 m/s
AloxiteBallotini
Fluorescein DEHS dropletsInhalable fraction

2) Shorter-term studies designed to address a specific
pollution problem. In these studies a large number of
samplers are concentrated in a small area around a
particular aerosol source, and measurements are
normally taken before and after a specific operation
has taken place. For instance, the construction of a
new road, or a major industrial plant could result in
significant dust exposures to the general public during
construction but not before and after.
Sampler Location
The siting of the sampler has to take into account the
purpose of the monitoring (QUARG 1993). For
instance, is it to identify concentrations close to roads
or is it to measure the more general urban
background? Alternately, is it to measure the impact
of a particular source, such as a construction site or
mineral operation? Whatever the type of site, a
number of general considerations need to be taken
into account, including:
• obstructions to air flow caused by buildings, trees
etc., which could introduce localised separations and
swirls into the airflow and cause highly variable
concentration gradients. These should be avoided
wherever possible, especially if the larger particle
fraction is being sampled.
• the height of the sampler entry above the ground.
Ideally, for health-related studies the sample inlet
should be at head height, although a compromise is
often required for security reasons.
• for some samplers, including the TEOM, the
sampler and sample head must be vertically aligned.
This reduces the flexibility for site selection,
especially at roadside locations.
Sampling Frequency and Duration
To ensure accurate estimates of likely human
exposure, measurements should be carried out
continuously. This is the approach used in the UK’s
Automatic Urban Network. The reason for this is that
concentrations can vary considerably from one day to
another. If shorter-term studies are to be carried out
then they need to consider the daily and seasonal
variability of particle concentrations. While a three
month period of sampling should provide an estimate
of the annual mean to within about 25%, it is likely to
give only a poor estimate of peak concentrations,
depending on whether or not any pollution episodes
occurred during the sample period. In the USA, PM10
measurements have commonly been made using high-
volume gravimetric samplers. These are labour
intensive, as the filters have to be changed daily, and
hence expensive to run. Because of this in the United
States, in areas where the US limits are not exceeded,
the sampling is carried out once every three days.
This provides a statistical sampling of PM10 exposure,
including exposure to peaks.
3.2.4.3 Operational Aspects
Most manufacturers supply comprehensive
operational instructions with the instruments that they
sell, and these should be read carefully before
planning the details of the sampling programme.
There are some general aspects, however, that merit
mention here.
Choice of Filters
The choice of suitable filters for the gravimetric
samplers mentioned above depends upon the sampling
and analytical requirements. The most commonly
used filters for sampling aerosols in the ambient
atmosphere are glass fibre filters. These robust filters
have low moisture retention, and high collection
efficiencies at relatively low pressure drops. As the
particles are collected in the depth of the fibre bed,
glass fibre filters also have the ability to collect and
retain large sample masses with a low pressure build
up rate (and small change in flowrate). However, if
compositional analysis or microscopic investigation of
the collected particles is required, membrane filters
are more suitable.
Membrane filters are made from a number of different
materials with pore sizes ranging from 0.03 to 8 µm.
For compositional analysis, cellulose nitrate or
cellulose triacetate membrane filters are most widely
used as they dissolve easily in organic solvents
enabling the collected material to be recovered within
a small volume of solvent for chemical analysis.
Airborne Particulate Matter in the United Kingdom
30

However, they are prone to weight changes due to
moisture absorption, and more suitable membrane
filters are made from PVC, which are widely used for
quartz-containing aerosols, analysed by direct on-filter
infra-red absorption techniques. Pure silver
membrane filters are ideal for situations where
impurities in the filter or high weight losses render
normal membranes unsuitable. An example of this is
in the sampling of coal tar pitch volatiles.
The other application where membrane filters offer
distinct advantages is in the analysis of samples by
microscopy. For optical microscopy, the filters are
made transparent to light by the application of a liquid
of the same refractive index as the filter.
Polycarbonate pore filters (eg Nuclepore) are ideal for
collecting particles for analysis by electron
microscopy, but suffer from high electrical charge
which can cause problems during weighing and very
high pressure drop across the filter during sampling.
The main problem with all membrane filters is that,
unlike glass fibre filters, particle collection takes place
at the surface of the membrane filter. This severely
limits the amount of sample that can be collected,
because when more than a single layer of particles is
deposited on the surface, the resistance to airflow
increases rapidly. There is also a tendency for the
deposit to be dislodged from the filter, especially
during transport back to the laboratory.
Filter choice for continuous monitors is very limited.
Beta particle monitors can be used with either glass
fibre or PTFE filters, with the 30 separate filters
contained in the cassette of the Elecos APM-1 device
being especially suitable for analysis.
It is important to recognise that air filtration is not
analogous to "sieving" and air filters can collect
particles well below their nominal pore size with high
efficiency. Nonetheless, filters with pore sizes of
above about 2 µm may show appreciable efficiency
limitations for small particles, especially at low
surface loadings.
Filter Handling, Conditioning and Weighing
Important aspects that are often overlooked in the
methodology of sampling are the handling and
conditioning of the filters. When taking new filters
from their boxes it is important to inspect the state of
the surfaces. For instance, glass fibre filters often
have loose fibres from the cutting process that could
be easily lost at any stage of the sampling process. It
is essential, therefore, that these are removed prior to
the first weighing. In addition, some membrane filters
have been seen with a very fine powder coating when
new. Such filters should be rejected and a new batch
used. When laden with dust, it is essential that the
filters are supported and kept upright to prevent the
loss of material that could arise from either sharp
impact or touching the internal walls of the containers.
There are a number of schools of thought about the
conditioning of filters prior to weighing. It is
recommended that all weighing is carried out under
temperature and humidity control, and that the filters
are allowed to condition in that atmosphere for at least
24 hours both before and after sampling. The use of
desiccators is not recommended, because when the
filter is removed from the desiccator the weight will
be unstable due to the absorption of moisture from the
balance room atmosphere. A set of control filters to
take account of changing conditions is highly
recommended; one control for every five sample
filters is a reasonable number to choose.
With annual mean mass concentrations of PM10 in the
ambient atmosphere generally about 20 to 30 µg/m3,
care must be taken to ensure that the balance used has
sufficient accuracy and precision. This normally
requires a five-place or six-place balance. This should
be placed on a solid, vibration-free bench in a room
specially designated for this purpose, with
temperature, and preferably humidity, control.
Flowrate Calibration
Besides the measurement of the mass of the collected
sample, the most important parameter to determine
accurately is the flowrate. Fortunately, most aerosol
Chapter 3 : Measurement Methods
Quality of Urban Air Review Group 31

samplers are fitted with automatic flowrate control or
compensating systems, in which the air velocity or
pressure drop is continuously monitored and signals
are sent via a feed-back loop to either open a valve or
to increase the speed of the motor when they have
changed by 5%. In the instruments made by Wedding
and Associates, flow control is provided by means of
a “choked” flow venturi system, which limits the
flowrate to a maximum value provided that sufficient
vacuum potential is maintained.
While flow control devices provide major
improvements in maintaining the set flowrate
throughout the sampling period, it is still necessary to
set the flowrate before sampling can begin. Ideally
this should be carried out by measuring the flow
entering the sampling inlet using a calibrated wet
gasmeter, but this is only possible for samplers with
single unidirectional entries. For those
omnidirectional samplers with horizontal slit entries,
setting the flow rate is achieved by removing the entry
and using a special fitting with an orifice plate over
the installed filter. Once set to the correct value, the
size selective entry is replaced and the flow control
systems maintain the flowrate to within the specified
limits (normally 5%).
3.2.5 Future Requirements
Currently, the PM10 fraction has been selected as the
appropriate particle fraction to sample for health-
related monitoring. However, it is thought that PM2.5,
or smaller fractions, may eventually prove to be of
greater health significance than PM10. Attention is
likely therefore to focus on PM2.5 samplers and
possibly even on PM1 samplers. Sample heads to
separate out these fractions are already available and
can be interchanged with those on existing PM10
samplers. The PM10 Dichotomous Sampler, which
provides two samples - 10 to 2.5 µm and <2.5 µm,
should be useful in this context.
For specific epidemiological studies, it may be
necessary to use personal samplers to provide a
reliable estimate of individual exposures to ambient
particles. A number of samplers, developed initially
for workplace sampling, could be used to monitor all
three health-related fractions. A pilot study on behalf
of the Department of the Environment is currently
under way in Birmingham using prototype personal
samplers for the thoracic fraction. The units are
designed to be light and quiet, so as to minimise
discomfort to the wearer.
An interesting new development is the Rupprecht and
Patashnick Ambient Carbon Particulate Monitor. This
device automatically determines hourly averages of
organic and elemental carbon particulate matter
concentrations. It therefore provides additional
information on the composition of particulate matter
on a fine timescale, which will help in the
understanding of the sources of airborne particles.
Finally, suggestions have been made that the health
effects of particles may be related more to particle
numbers than to particle mass. This focuses attention
on the ultrafine (<0.1µm) fraction, which can be
sampled and counted using devices such as
Condensation Nucleus Counters, which give number
concentrations of particles down to below 0.01 µm.
3.3 NUISANCE DUST
Nuisance dust is generated by a wide range of
activities, including traffic; construction/demolition;
mineral workings; and industry. It can give rise to
considerable public concern about the quality of their
environment. Unfortunately, the term nuisance dust is
not readily definable. It covers a number of effects,
ranging from soiling of surfaces, such as window
ledges and cars, to clouds of dust that can cause
physical irritation. These effects have different
attributes and different timescales, all of which means
that no single measurement method is appropriate.
The soiling of surfaces is generally a reflection of dust
accumulated over a period of time, ranging from days
to weeks, whereas the cloud of dust is a transient
phenomenon, that may last a matter of only a few
minutes.
The soiling aspect of nuisance dust is measured by
collecting dust deposited on a surface. Two basic
approaches have been adopted
• determination of the quantity of dust deposited, by
weight
Airborne Particulate Matter in the United Kingdom
32

• determination of the soiling of a surface, by a
change in its property
The short-lived dust clouds that can give rise to
nuisance are not easily measured. Some form of
measurement of total suspended particulates would
seem appropriate. Most measurement methods deal
with a minimum of 24-hour concentrations, although
the TEOM and Beta particle counter produce 1-hour
data (15-minute values can be obtained with the
TEOM for high concentrations) (see section 3.2.3.2).
Optical samplers may also have a useful role to play,
because of their fine time resolution, especially in
identifying dust clouds, where the issue of accuracy
may be less important than knowledge that an event is
taking place.
Deposit Gauges
There are two basic methods in common use. The
first is the British Standard Deposit Gauge (BS 1747
Part 1), which has been in use for many years. This is
essentially a large bowl, which is used to collect all
material deposited over a one-month period. Many
measurements were made in the UK using this method
during the 1960s and 70s, and information was
collated nationally until the early 1980s, since when
data have not been reported. The second method
evolved during the 1980s, based on work carried out
by Warren Spring Laboratory. It uses an inverted
frisbee as the collector. This is more aerodynamically
sound in terms of its disturbance of the airflow,
minimising the effect of eddies on the collection and
loss of particles. It is also smaller and hence easier to
use in the field. A third type of sampler, the
Directional Dust Gauge (BS 1974 Part 5) has also
been fairly widely used. This is a bundle of four
vertical tubes with slots facing in four separate
directions. The device is not a deposit gauge, but a
means of measuring the horizontal flux of dust. It is
used to indicate the direction from which dust is
coming. Measurements with this gauge have not been
related to nuisance effects.
The frisbee deposit gauge has been used fairly widely
over a number of years, usually collecting weekly
samples. The relationship of the frisbee to the British
Standard gauge is, however, very uncertain, hence the
relevance of the new data to previous findings cannot
be judged. Wind tunnel testing showed the basic
frisbee to be more efficient than the BS gauge (Hall
and Upton, 1988), while tests in the field showed it
collected 20-30% less than the BS gauge (Vallack,
1995). Variants of the frisbee have been used to help
retain the deposited dust, including coating the surface
with liquid paraffin and inserting a nylon mesh. Field
tests have shown the coated frisbee to collect 15-80%
more dust than the BS gauge, while the nylon mesh
increased the collection by 2-11% in one study
(Vallack and Chadwick, 1992) and decreased it by 2%
in another (Vallack, 1995). The field tests have been
limited and it is not clear how generally applicable the
findings are. It is therefore not possible to use
correction factors to produce BS gauge equivalent
values. The frisbee with nylon mesh would appear,
however, to be the closest to the BS gauge and hence
the most relevant in terms of continuity with historic
data.
Recently, the frisbee deposit gauge has undergone a
further change (Vallack, 1995). It is now
recommended that the gauge has a porous foam liner
fitted. This is designed to trap the deposited particles
and prevent them being blown out of the collector.
Recent studies have been carried out comparing the
new frisbee (which is now cast out of aluminium and
has slightly different dimensions to a real frisbee) with
both the previous design and the British Standard
deposit gauge. The results showed that the frisbee
with the foam insert collected 30% more than the BS
gauge and 87% more than the basic frisbee. Yet
further modifications have been proposed, including a
flow deflector and a slightly deeper bowl (Hall et al,
1994). This new design has not been compared with
previous gauges. These frequent changes in collector
design make it essentially impossible to compare
findings from one study to another.
A further major limitation of the deposit gauge as a
measure of nuisance dust, is the lack of reliable
criteria to assess the findings. Reference is frequently
made to an annual deposition rate of 200 mg/m2/day,
although the basis of this figure has never been
adequately traced. This value is said to represent the
threshold for serious nuisance (Bate and Coppin,
Chapter 3 : Measurement Methods
Quality of Urban Air Review Group 33

1990). Several factors need to be borne in mind when
considering use of this criterion:
• It was developed many years ago, at a time when
the public's acceptance of dust was probably much
more tolerant than now.
• There have been no recent studies to confirm its
appropriateness to current public sensitivities about
the environment.
• The literature contains a range of criteria from 133
to 350 mg/m2/day (Bate and Coppin, 1990) and not
a single figure.
• The details of the studies used to develop the
criterion are not readily available, and hence it is not
possible to establish how applicable the findings are
today.
• The criterion is an annual average. It is therefore
not valid to compare individual monthly or weekly
values with this criterion. A shorter term criterion
would be more useful for assessing the occasional
dust incident.
• The nature of the dust plays an important role in
determining its nuisance impact. For instance, it has
been suggested that for coal dust a deposition rate of
80 mg/m2/day is likely to give rise to complaints.
• The standard is based on the use of the BS gauge,
and is therefore not directly applicable to results
obtained with the frisbee.
It has been suggested that, given the unreliability of
the 200 mg/m2/day criterion, it would be appropriate
to set a criterion for nuisance of two to three times the
existing background deposition rate (Bate and Coppin,
1990). This has some merit, but there is no reliable
published database of existing deposition rates, using
either the British Standard gauge or the frisbee gauge,
to act as the starting point.
Soiling Methods
An alternative approach to the deposit gauge is to
measure the soiling of a surface. The advantage of
this method is that it is a more direct measure of the
nuisance effect caused by dust. It is also easier and
cheaper to carry out the monitoring. One
disadvantage, though, is that it is not possible to
predict soiling rates, whereas it is possible to predict
quantitative deposition rates.
There are two basic methods that are used. One
involves exposing a white adhesive tape for a period
of several days (Beaman and Kingsbury, 1981). The
particles stick to the tape and the quantity collected is
measured using a smoke stain reflectometer. The
results are expressed as the percentage effective area
coverage (ie percentage reduction in reflectance) per
day. Typical soiling rates have been published,
ranging from 0.01% EAC/day in rural areas to 1%
EAC/day in industrial areas (Beaman and Kingsbury,
1981). However, recent measurements using this
method indicate much higher soiling rates, averaging
0.7% EAC/day at urban fringe/rural sites (Coppin,
1995). The reason for these divergent results is
unknown. Criteria have also been produced to assess
the nuisance effect. It is claimed that possible
complaints start at 0.5% EAC/day and serious
complaints at 5% EAC/day (Beaman and Kingsbury,
1981), but the basis for these criteria has never been
published. Comparisons have been made between
soiling rates measured with the sticky pad and total
suspended airborne dust (Beaman and Kingsbury,
1984). A soiling rate of 0.5% EAC/day equated to 34
µg/m3, 1% EAC/day to 65 µg/m3 and 5% EAC/day to
280 µg/m3. It is not clear what time periods these
measurements were made over, and hence how
applicable the findings are to measurements over
several days.
The sticky pad method has been used fairly widely, by
a number of consultancies, and by British Coal.
However, its wider acceptance is hindered by the lack
of published data on the range of existing soiling rates
or on the criteria for interpretation.
The second approach to the measurement of soiling
rates is the glass slide method (Schwar, 1994). This is
based on exposing glass microscope slides
horizontally in the field for a week, then returning
them to the laboratory to measure the reduction in
reflectance at a 45˚ angle from the surface, using a
Airborne Particulate Matter in the United Kingdom
34

gloss-meter. The measurement method is now
commercially available. The results are expressed as
a soiling rate in soiling units (su) per week. One
soiling unit is a one percent reduction in reflectance.
Typical soiling rates are around 10 su/week, rising to
over 30 su/week close to very dusty activities.
Criteria have been determined to establish public
acceptability of different soiling rates. A rate of
around 20-25 su/week, averaged over 4 weeks,
appears to be the boundary between acceptable and
unacceptable dust levels (Moorcroft and Laxen,
1990).
Concerns have been raised about material being
washed off the glass slide, as the surface is not coated.
In practice this is only a problem if there is extremely
heavy rainfall. Generally, the dust adheres readily to
the glass, even with moderate rainfall. In contrast to
other methods, the glass slide is not designed to
collect and retain all the dust deposited. The behaviour
of this collector is designed to mimic the natural
behaviour of dust on outside surfaces, such as the
paintwork on cars, including the effects of removal
and redistribution by rainfall. It is understood that
some workers have modified the method to retain
more of the dust, however, this invalidates any
comparison of the findings with the acceptability
criteria developed with the original method. The
glass slide method has been compared with both dry
frisbee measurements of deposited dust and airborne
dust measurements using the M-type sampler
(Moorcroft, 1995). No relationship was found
between the frisbee and glass slide results. On the
other hand, the glass slide results were positively
related to those of the M-type sampler. This indicates
that the glass slide method is measuring a different
component of deposited dust to the frisbee deposit
gauge.
It is clear from the discussion of the different methods
of measuring deposited dust, that no consistent
approach is yet available. One of the major problems
with all the methods is the tendency for workers to
continually develop modifications to the methods.
This makes it difficult to build up a database of
measured concentrations and of acceptability criteria.
All methods also suffer from a dearth of published
information on both existing levels in different
settings and acceptability criteria. Without these
features it is difficult to assess the findings of any of
the available methods. There is a clear need for a
standardised approach to measuring and assessing
nuisance dust to be developed.
REFERENCES
Bate KJ and Coppin NJ (1990) Impact of Dust fromMineral Workings , Paper presented to County
Planning Officers Society Committee No 3
Conference, Loughborough Univ, 19-21 Sept. 1990.
Beaman AL and Kingsbury RWSM (1981)
Assessment of Nuisance from DepositedParticulates Using a Simple and InexpensiveMeasuring System, Clean Air, 11, 77-81.
Beaman AL and Kingsbury RWSM (1984) RecentDevelopments in the Method of Using Sticky Padsfor the Measurement of Particulate Nuisance,Clean Air, 14, 74-81.
BS 1747 (1969) Methods for the Measurement ofAir Pollution, Part 1, Deposit Gauges, BSI, London.
BS 1747 (1969) Methods for the Measurement ofAir Pollution, Part 2, Determination ofConcentration of Suspended Matter, BSI, London.
BS 1747 (1972) Methods for the Measurement ofAir Pollution, Part 5, Directional Dust Gauges,BSI, London.
Coleman P (1995) Personal Communication.
Coppin NJ (1995) Personal Communication.
Ferris BG and Spengler JD (1985) Harvard AirPollution Health Study in Six Cities in the USA,Tokai J. Exp. Clin. Med. 10, 263.
Hall DJ and Upton SL (1988) A Wind Tunnel Studyof the Particle Collection Efficiency of an InvertedFrisbee used as a Dust Deposition Gauge, Atmos.
Environ, 22, 1383-1394.
Chapter 3 : Measurement Methods
Quality of Urban Air Review Group 35

Hall DJ, Upton SL and Marsland GW (1994) Designsfor a Deposition Gauge and a Flux Gauge forMonitoring Ambient Dust , Atmos. Environ, 28,
2963-2979.
International Standards Organisation (1994) AirQuality - Particle Size Fraction Definitions forHealth-Related Sampling, IS 7708, ISO, Geneva.
Mark D, Vincent JH, Aitken RJ, Botham RA, Lynch
G, van Elzakker BG, van der Meulen A and Zierock
K-H (1990) Measurement of Suspended ParticulateMatter in the Ambient Atmosphere, Institute of
Occupational Medicine Report No TM/90/14.
Mark D, Upton SL, Hall DJ, Lyons CP, Douglass EJ,
Marsland GW and Walken S (1994) Improvementsto the Design and Performance of the AmbientInhalable Aerosol Sampler, AEA Technology
Report, AEA-TPD-0299.
McFarland AR and Ortiz CA (1984)
Characterisation of the Sierra-Andersen 321A 10µm Size Selective Inlet for Hi-Vol Samplers, Dept.
of Civil Engineering, Texas A&M University, Air
Quality Lab Report No 4716/01/02/84/ARM.
Moorcroft JS and Laxen DPH (1990) Assessment ofDust Nuisance, Environ Hlth, Aug 1990, 215-217.
Moorcroft JS (1995) Personal Communication.
Ott W (1977) Development of Criteria for Siting ofAir Monitoring Stations , J. Air Pollut Contr Assoc,
27, 543.
QUARG (1993)Urban Air Quality in the UnitedKingdom, First Report of the Quality of Urban Air
Review Group, QUARG, London.
Schwar MJR (1994) A Dust Meter for MeasuringDust Deposition and Soiling of Glossy Surfaces,
Clean Air, 24, 164-169.
Seaton A, MacNee W, Donaldson K and Godden D
(1995) Particulate Air Pollution and Acute HealthEffects, The Lancet, 345, 176-178.
Upton SL and Barrett CF (1985) A Wind TunnelStudy of the Inlet Efficiency of the Warren SpringLaboratory “S” and “Directional” Samplers ,
Warren Spring Laboratory Report No 526(AP)M.
Vallack HW (1995) A Field Evaluation of Frisbee-Type Dust Deposit Gauges, Atmos Environ, 29,
1465-1470.
Vallack HW and Chadwick MJ (1992) A FieldComparison of Dust Deposit Gauge Performanceat Two Sites in Yorkshire, 1987-1989, Atmos
Environ, 26A, 1445-1451.
Wagner M, von Nieding G and Waller RE (1988)
Health Effects of Suspended Particulate Matter,Final Report on CEC Contract No BU (84) 146 (491).
Wedding JB, McFarland AR and Cermak JE (1977)
Large Particle Collection Characteristics ofAmbient Aerosol Samplers, Environ Sci Technol,
11, 387-390.
Weiner RW (1995) Personal Communication.
NOTE TO READERS
This Chapter seeks only to indicate some of the
equipment choices available to those wishing to
measure airborne particulate matter. It makes no
attempt to be exhaustive, and some commercial
instruments have not been included. Omission of an
instrument should not be inferred as conveying any
opinion by the Review Group and equally, inclusion
does not constitute an endorsement by QUARG.
Airborne Particulate Matter in the United Kingdom
36

4.1 INTRODUCTION
This Chapter describes the primary sources of
particulate matter, and attempts to quantify their
emissions. Secondary sources (formation in the
atmosphere from other forms of pollution) are
discussed in Chapter 5. The term “particulate matter”
describes all particles present in the atmosphere, and
includes both solid particles and liquid droplets (but
not their water content). Unless stated otherwise,
inventory data in this Chapter refer to the mass of
particles in the PM10 size range, although some
sources emit a substantial mass of particles of larger
size. Particle numbers are not considered.
In comparison to other pollutants there are two
features of particulate matter that increase the
difficulty and uncertainty of estimating their
emissions. The first is that the range of sources that
emit particulate matter include, not just fuel use, but
also fugitive sources whose scale and activity rates are
poorly known. The other is the overlapping
definitions of particulate matter. The size distribution
of particulate emissions differs markedly from source
to source. Other definitions of particulate matter such
as “Black Smoke” do not have an unequivocal
relationship with particle mass. In the literature,
studies of particulate matter have used different
definitions for what they mean by particulate matter
and are thus difficult to compare. This Chapter will
estimate emissions of particulate matter in terms of
their PM10 mass.
Primary emissions of particulate matter can arise from
many sources. The main sources are:-
Road Transport. This term refers to all road traffic.
Emissions arise mainly from the exhaust, but tyre and
brake wear also generate airborne particles. In
general, diesel engined vehicles emit a greater mass of
particulate matter per vehicle than those with petrol
engines.
Stationary Combustion. Domestic coal burning is
traditionally the major source of particulate matter
emissions. This has now been restricted in major
cities due to the Clean Air Acts but is still important in
some smaller towns and villages, in Northern Ireland
and in areas associated with the coal industry.
Industrial Processes. This includes bulk handling,
construction and quarrying. These sources are
difficult to quantify both due to the nature of the
source and due to the lack of information on the extent
of some of these activities.
Fugitive emissions relate to pollutant losses from
points in a process not associated with a defined
process stream (such as a stack). Such sources
generate particulate matter through two main
processes:
(i) Mechanical break-up through pulverisation or
surface abrasion resulting in the production of dust.
This can include tyre and brake wear, mineral
processing, wear of wheels and blades and various
construction activities.
(ii) Wind-blown dust. For example soil erosion or
erosion of stockpiles by winds with speeds typically in
excess of 5.4m/s (12 mph).
Temporary activities such as construction create
particles from a wide range of cutting, grinding and
crushing operations. Despite their temporary nature,
construction sites can have a substantial impact on
local air quality .
This Chapter looks at the main sources of primary
particulate matter in the UK and their emission rates.
It does not consider secondary production of aerosol.
The problems and uncertainties in estimating
emissions are indicated. Estimates of PM10 emissions
for the UK and London are presented.
These estimates of primary PM10 sources differ from
earlier estimates (eg QUARG, 1993) for a number of
reasons. Firstly, revised PM10 emission factors for
road transport have been used which are based on a
greater amount of measured data. Secondly, estimates
of non-fuel use sources are included (eg construction)
and finally, all the other fuel use emission estimates
have been reconsidered.
4 Sources and Emissions of PrimaryParticulate Matter
Quality of Urban Air Review Group 37

4.2 PRIMARY EMISSION SOURCES
4.2.1 Road Transport - Engine Emissions
Road transport is thought to be the major source of
PM10 in urban areas. In general diesel engines emit
particulate matter at a much higher rate than petrol
engines. Whilst particulate emissions have been part
of the European Union type approval emission test
procedure for diesel engines, this has not been the case
for petrol engines, and thus few measurements of
exhaust emissions of particulate matter from petrol
cars are available.
Diesel particles start their formation in the high
temperature combustion process. Initially only soot
particles of carbon are formed while the other
compounds are in the vapour phase. The
hydrocarbons and sulphate (which results from the
fuel sulphur) condense as the temperature drops. The
type approval test procedure requires that the exhaust
is cooled to 52°C, at which temperature these particles
consist of a carbon core with a coating of
hydrocarbons and sulphate. Particles grow by
coagulation, condensation and adsorption. These
processes occur predominantly after the gas has left
the exhaust pipe as the residence time in the pipe is
too short for coagulation and the temperature too high
for adsorption and condensation.
The particle size distribution tends to be bimodal with
particles of 0.0075 to 0.050 µm diameter, in the
nucleation mode, consisting of either carbon spheres
or condensed liquid hydrocarbons, and an
Airborne Particulate Matter in the United Kingdom
38
Table 4.1 Size Fractions of Particulate Matter Emissions from Road Transport (from USEPA, 1985).
Mass percentage in size fraction< 2.5 µm < 10 µm
Leaded - no catalyst 67 80
Petrol cars Unleaded - no catalyst 70 90
Three-way catalyst 90 97
Diesel cars 92 100
Diesel HGV 92 100
Tyre Wear 39 55
Brake Lining 39 98
Cum
ulat
ive
frac
tion
Particle size (micrometres)
0 1 2 3 4 5 6 7 8 9 100
0.1
0.2
0.3
0.4
0.5
0.6
0.7
0.8
0.9
1
Non-TWC Leaded
Non-TWC Unleaded
TWC
Figure 4.1 Size Distributions of Particulate Matter Emissions from Petrol Engined Cars (USEPA, 1985).
Note: Error ranges are 95% confidence intervals. The size axis has been displaced slightly for each curve for clarity.

accumulation mode of about 0.05 to 1 µm diameter.
(See Glossary for definition of terms).
The official European test procedure collects material
on a filter through a heated line and so may not
measure exactly the mass of particulate matter
actually emitted into the atmosphere. Research shows
that the sizes of diesel particles are virtually all less
than 10 µm (Table 4.1, Figures 4.1 and 4.2) with
particulate matter from the use of leaded petrol
slightly larger (USEPA, 1990). The factors in this
table were applied to the emission rates quoted in this
section to obtain the emission rates of particular size
fractions.
PM10 emission rates for existing vehicles are those
detailed in UK Petrol and Diesel Demand(Gover et
al, 1994) which result from a detailed survey of the
literature. The most detailed information is available
for diesel cars and Table 4.2 shows the average
emission rates of particulate matter on different types
of road.
Less is known about emissions from other diesel
vehicles, such as buses and coaches. Far fewer
measurements have been made on large vehicles and
some of these factors, especially for buses, have been
estimated on the basis of measurements made on
vehicles with similar engines and a few direct
measurements. Table 4.3 shows the factors for other
diesel vehicles.
There is little available data for petrol engine
emissions of particulate matter. The factors in Table
4.4 are the result of a literature survey (Gover et al,
1994; USEPA, 1985) which included some US data
which showed the highest mass emission rates for old
petrol engined vehicles with leaded gasoline. The
range indicates that found in the literature.
Emission limits for particulate matter mass from
diesel vehicles will fall in the future due to a series of
European Union Directives (91/542/EEC, 94/12/EEC,
93/59/EEC). Table 4.5 indicates the reductions in the
Chapter 4 : Sources and Emissions of Primary Particulate Matter
Quality of Urban Air Review Group 39
Cum
ulat
ive
frac
tion
Particle size (micrometres)
Figure 4.2 Size Distributions of Particulate Emissions from Diesel Engined Cars (USEPA, 1985).
Note: Error ranges are 95% confidence intervals.
0 1 2 3 4 5 6 7 8 9 100
0.1
0.2
0.3
0.4
0.5
0.6
0.7
0.8
0.9
1
Table 4.2 Particulate Matter Emission Factors from IDI DieselCar Without Catalyst (Regulation ECE 15.04 (83/351/EEC)) -g/km.
Road Type Engine Engine SizeTemperature
Small Medium Large
(<1.4 l) (1.4-2 l) (> 2 l)
Urban Cold 0.24 0.34 0.36
Urban Hot 0.12 0.17 0.18
Minor Rural Hot 0.10 0.13 0.15
Major Rural Hot 0.09 0.11 0.13
Motorway Hot 0.15 0.20 0.22

emission rates implied by these Directives. These are
based on the Directive test values assuming that on-
road emissions are at the maximum levels specified by
the Directives, and hence the actual emission rates
may be different in practice.
The introduction of unleaded petrol and three-way
catalysts has resulted in a decrease in the emission
rates of particles from petrol engines but this reduction
was not the result of a specific particulate emission
limit regulation. Emissions reduced with the
introduction of unleaded fuel, and a further reduction
with the use of three-way catalysts was the result of
emission limits for NOx, VOC and CO.
Data on particulate matter emissions from large diesel
engines, trucks, buses and coaches are sparse. In
particular the contribution of these vehicle types in the
past is poorly quantified. Often, measurements were
made on engine test beds rather than whole vehicles
on the road or on a chassis dynamometer. Also, while
vehicle emissions may increase as the vehicle ages
Airborne Particulate Matter in the United Kingdom
40
Table 4.5 Past and Future Reduction in Regulated Particulate Matter Emission Rates.
Date of Petrol with Diesel Car Diesel HGV HGVintroduction three-way catalyst IDI LGV <85kW >85kWPre 1993 100 100 100 100 100
31/12/92 56
1/10/93 46 46
1/10/94 56
1/1/96 32
1/10/96 12 19
1/10/97 44*
Normalised emission rates. Pre-1993 = 100
* This is a weighted average as different rates apply to different weight classes
Table 4.3 Particulate Matter Emission Factors for Diesel Road Vehicles- g/km (as PM10).
Road TypeUrban Minor Major Motorway
Rural RuralLGV IDI non-catalyst 0.28 0.23 0.21 0.29
Small HGV 3.5 - 7.5 t GVW 1.90 1.17 0.83
Medium HGV 7.5 - 17 t GVW 1.53 0.95 1.08
Large HGV 17 - 38 t GVW 1.52 0.91 0.71
Mini-bus up to 16 seats 0.40 0.36
Midi-bus 17-35 seats 1.90 1.17
Bus over 35 seats 1.60 1.40
Coach over 35 seats 1.52 0.91 0.71
Table 4.4 Emission Factors for Total Particulate Matter fromPetrol Engined Vehicles - g/km (as PM10).
Emissions RangeCar non-catalystleaded 0.06 0.02 - 0.16
Car non-catalystunleaded 0.02 0.02 - 0.03
Car three-waycatalyst 0.01 0.01 - 0.02
LGV non-catalystleaded 0.08 0.05 - 0.11
LGV non-catalystunleaded 0.04 0.03 - 0.05
LGV three-way catalyst 0.02 na

this has not been well quantified. In the figures
quoted in this Chapter any effect of vehicle wear and
tear has not been included.
Table 4.6 and Figure 4.3 show the emission estimates
that result from these emission factors. The future
vehicle usage assumed in the calculation is the mean
of the upper and lower projections from the
Department of Transport’s National Road Traffic
Forecasts (these are predictions of road traffic up to
Chapter 4 : Sources and Emissions of Primary Particulate Matter
Quality of Urban Air Review Group 41
Table 4.6 Exhaust Emissions of PM10 from Road Traffic (ktonnes).
1970 1975 1980 1985 1990 1995 2000 2005 2010 2015 2020 2025Cars Petrol 9.0 10.7 12.6 14.7 14.8 10.3 4.5 4.1 4.2 4.4 4.7 5.0
Diesel 0.5 0.6 0.7 1 2.1 4.5 5.1 4.8 5.1 5.7 6.1 6.5
All Cars 9.5 11.3 13.4 15.7 16.9 14.8 9.6 8.9 9.3 10.1 10.8 11.5
LGV Petrol 1.2 1.4 1.5 1.6 1.4 0.2 0.1 0.1 0.1 0.1 0.2 0.2
Diesel 1.1 1.2 1.3 1.4 4.3 8.3 6.2 5.8 6.6 7.5 8.5 9.6
All LGV 2.3 2.6 2.8 3.0 5.7 8.6 6.3 5.9 6.7 7.6 8.6 9.8
HGV Large 3.3 3.8 5.0 5.7 8.2 7.1 3.3 2.2 2.4 2.6 2.9 3.2
Small 21.5 22.8 23.2 22.1 25.5 20.1 9.3 6.2 6.7 7.4 8.2 9.1
All HGV 24.8 26.6 28.2 27.8 33.7 27.2 12.6 8.4 9.1 10.0 11.1 12.2
Buses and Coaches 5.3 4.8 5.2 5.3 6.7 6.3 4.2 3.1 2.0 1.4 1.3 1.3
Motorcycles 0.4 0.4 0.7 0.6 0.6 0.4 0.4 0.4 0.4 0.5 0.5 0.5
All Diesel 31.6 33.2 35.4 35.5 46.8 46.3 28.1 22.1 22.8 24.6 26.9 29.7
All Petrol 10.6 12.5 14.8 16.9 16.7 10.9 5.0 4.6 4.7 5.0 5.4 5.7
Total 42.1 45.7 50.2 52.4 63.6 57.2 33.1 26.8 27.5 29.6 32.3 35.4Note: Assumes diesels comprise 20% of new car sales.
Cars
HGV
Bus
LGV
Total
Em
issi
ons
(kto
nnes
)
Figure 4.3 UK Road Transport Emissions of PM10 (Diesel Car Sales 20%).
Year
0
10
20
30
40
50
60
70
80
20102000199019801970
Note: The split lines in future projections correspond to low and high forecasts of traffic.

2025). The introduction of low sulphur diesel in 1996
will reduce particulate matter emissions from existing
diesel engines by up to 13% for HGV and have a
smaller, but beneficial effect upon emissions from
light duty vehicles. Diesel cars are assumed to
comprise 20% of new car sales, close to the
percentage achieved in 1994/95.
4.2.2 Road Transport - Other Emissions
Particulate matter is also emitted from tyre wear and
brake wear. Information from the USA gives an
indication of the importance of these sources.
4.2.2.1 Tyre Wear
The USEPA gives a factor of 0.002 g/mile for
particles <10µm (0.0012 g/km) for tyre wear from
cars. As the particles are produced by attrition
processes, particle sizes are probably larger than for
exhaust emissions, and so emissions of particles less
than 2.5µm are likely to be negligible. Assuming that
HGVs have larger emission rates (scaling as the
number of wheels) and that these figures apply to the
UK this gives the emission rates shown in Table 4.7.
4.2.2.2 Brake Linings
The USEPA gives a factor of 0.0128 g/mile (0.00795
g/km) of particles from wear of brake linings on cars.
Table 4.1 shows that 98% of these emissions are less
than 10µm. Again, assuming that emissions from
large vehicles are larger than from cars (emissions are
scaled according to the number of wheels) and that
these US figures apply to the UK, emission estimates
appear in table 4.8.
Airborne Particulate Matter in the United Kingdom
42
Particle size (micrometres)
Figure 4.4 Typical Cumulative Particle Size Distributions for Particles from Coal Combustion, Quarrying and Road Dust (USEPA, 1990).
Note: Error ranges are 95% confidence intervals.
% o
f em
issi
ons
less
than
siz
e
0 5 10 15 20 25 300
10
20
30
40
50
60
70
80
90
100
Coal CombustionQuarrying etc.Road Dust
Table 4.7 Annual Tyre Wear Emissions of PM10 (ktonnes) in theUK.
1970 1980 1990 1993Tyre WearEmissions 0.31 0.39 0.57 0.57
(ktonne)
Table 4.8 Annual Brake Wear Emissions of PM10 (ktonnes) in theUK.
1970 1980 1990 1993Brake WearEmissions 1.95 2.61 3.78 3.80
(ktonne)

4.2.2.3 Road Dusts
Particulate matter may also enter the atmosphere from
dust on the road surface. This dust is entrained by the
motion of the vehicle along the road. It may come
originally from deposited atmospheric dusts, material
carried onto the road by vehicles or erosion, or the
wear of the road surface itself.
It is very difficult to estimate the emission from these
sources. The USEPA has produced a formula which
is appropriate for the USA, but notably not for the
much wetter climate of the UK. The US data does
give an indication of the particle size distribution for
these sources. Of the TSP emitted about 20% is PM10
and less than 9% PM2.5 (see Figure 4.4).
One of the factors that determines the emission rate is
the ‘silt loading’ of the road. This is the mass of ‘silt’,
defined as material less than 75µm, in a square metre
of road surface. The USEPA gives a range of silt
loadings measured in the US ranging from 0.01 to 30
grams/m2. There is little information for the UK but
Ball and Caswell (1983) give data that would equate
to about 0.02 grams/m2 as an upper limit. This would
result in an emission factor for PM10 about the same as
that for exhaust emissions from petrol engined cars
with three-way catalysts. However, as the wet climate
in the UK is so different to that of the USA, it is likely
that the true annual average emission rate is even
lower.
Given the wide range of silt loadings for the USA, and
the differences between the UK and USA the annual
emission from road dusts in the UK cannot be
estimated with any reliability. This is an area that
needs further investigation in order to quantify this
source.
4.2.3 Other Mobile Sources
4.2.3.1 Railways, Shipping and Aircraft
Emissions from these sources have been estimated
from fuel related emission factors. They do not
account for significant emissions on a national scale
but may be important locally. The current emissions
are about 5 ktonnes annually.
4.2.3.2 Off-Road Sources
This is a wide-ranging category than includes a variety
of domestic commercial, agricultural and forestry
sources, such as lawnmowers, construction plant,
cement mixers, chain saws and combine harvesters. A
survey of quantity and usage of these sources has is
been performed (Precision Research, 1995), and
indicates that the current emissionof PM10 from these
engines is about 2 ktonnes annually.
4.2.4 Other Stationary Sources
4.2.4.1 Domestic Sources
The main source of PM10 from domestic premises is
from the use of coal. Much of this coal is burnt in
open fires with high emissions. Following the smogs
of the 1950s and 60s, smoke control areas were
introduced, and only "smokeless" fuels can be used in
open fires in most urban areas. Over the past few
decades there has also been a substantial switch to
electricity and gas for domestic heating over much of
the UK.
Domestic emissions, whilst they currently amount to
19% of the total UK emissions, are not so important in
most urban areas. They may be significant in those
small towns and villages where coal and other solid
Chapter 4 : Sources and Emissions of Primary Particulate Matter
Quality of Urban Air Review Group 43
Table 4.9 Annual Emissions of PM10 from UK Power Stations.
Fuel Ash TSP % PM10 PM10 PM10 kg PM10
Burnt Emitted Emission Emission Emission Emissionktonnes ktonnes Factor g/kg Factor g/kg ktonnes per MWh
generatedCoal-fired 64,090 64.8 1 80 0.6 38.45 0.267
Oil-fired 4,330 4.8 1.1 20 0.2 0.962 0.116
Gas Turbines 4,556 0.02 0.093 0.004

fuels are still widely used, and in Northern Ireland
where no supplies of natural gas are yet available.
4.2.4.2 Large Combustion Sources
Power stations are the largest users of coal in the UK.
However all coal-fired stations are equipped with
electrostatic precipitators (ESP) which remove on
average 99.5% of the particulate matter. In contrast,
oil fired power stations are not equipped with
precipitators. As data on particulate matter emissions
from power stations for the whole UK was not
available, data for England and Wales (PowerGen,
1994, National Power, 1995) has been scaled up to
estimate UK emissions, as shown in Table 4.9. The
ash emitted equates to total particulate matter. An
increasing proportion of electricity is being generated
by plant which uses natural gas as the fuel. The gas
emission factor used is the emission limit for an
individual gas turbine, which, in fact relates to PM5
(particulate matter less than 5 microns). While the
actual emission of PM5 will be less than this upper
limit, the PM10 emission rate is higher than that of
PM5 so the factor was used unchanged to indicate the
likely emissions. The final column shows the
emissions per MWh generated. This clearly shows
how even without ESPs oil-fired stations are cleaner
than coal-fired ones with ESPs, while gas-fired station
emissions are extremely small.
Other industrial and commercial users use coal in a
range of boilers. However these are more efficient
than domestic open fires and have lower intrinsic
emission rates. Industrial, commercial and
institutional users have switched away from coal,
initially to oil and now to natural gas. This has
steadily reduced emissions. Emissions factors are
taken from Gillham et al (1994).
4.2.4.3 Other Sources
There are a number of processes that emit particulate
matter. These cover a wide range of sources and are
difficult to quantify without precise details of the
individual emitter.
HMIP has set up a Chemical Release Inventory (CRI)
that will include details of the emissions from each
authorised site under Part A of the Environmental
Protection Act (1990). The emissions included are
only for those sites that have been authorised, some
sectors still await the authorisation procedure. Also,
Part B processes, which come under local authority
control are not included. The figures relate to
emissions of particulate matter (not PM10) and may
include emissions from fuel combustion. They only
include emissions after the date of authorisation -
there is no indication where the data relate to part of a
year. Despite these limitations, the data give valuable
insights, but these sources are unlikely to contribute
much to urban emissions because of their locations.
Table 4.10 lists the particulate matter emissions in the
CRI.
Estimates of emissions from these process sources can
also be made from average emission factors and
overall production statistics. The factors were those in
the USEPA Factor Information and Retrieval (FIRE)
system (USEPA, 1995b). This gives a total of about
30 ktonnes from industrial processes and about 29
ktonnes from sand and gravel extraction and quarrying
from stone. This appears to be compatible with the
Airborne Particulate Matter in the United Kingdom
44
Table 4.10 Total Particulate Matter Emissions in the ChemicalRelease Inventory (tonnes).
Carbonisation and associated processes 626
Gasification and associated processes 55
Petroleum processes 1614
Iron and steel 3
Non-ferrous metals 0.1
Cement/Lime manufacture 4456
Ceramic production 723
Glass manufacture and production 112
Other mineral fibres 536
Asbestos processes 11
Acid processes 8473
Chemical fertiliser production 132
Inorganic chemical processes 347
Manufacture and use of organic chemicals 511
Pesticide production 1
Petrochemical processes 21
Processes involving halogens 88
Incineration 2031
Production of fuel from waste 5
Recovery Processes 18
Total 19764

CRI which is not yet complete and only includes
authorised processes. The data from the average
factors was used to estimate national emissions, rather
than the CRI.
4.2.5 Construction Sources
The amount of dust emissions from a construction site
will depend on the size of the site and the amount of
construction activity. It would be expected that a
component of the emissions would be correlated with
the silt content of the soil ( the fraction < 70µm) and
the speed and weight of the vehicles but negatively
correlated with the moisture content of the soil. Other
activities on such sites also generate dust.
An American study of TSP around apartment and
shopping centre construction sites suggested a factor
of 2.69 tonnes/hectare/month. PM10 emissions will be
lower. Using an estimate that 20% of TSP is PM10
gives a factor of 0.538 tonnes/ha/month. (This
proportion of 20% comes from data for emissions of
dust from roads but is the best estimate available.
Given the nature of the source it is likely that the
majority of the dust emissions are greater in size that
10µm.) However this data is appropriate to a generally
dryer climate and the emissions in the UK should be
lower.
Material carried outside the site and deposited on
nearby roads may be entrained either by passing
traffic or the wind and may result in a significant
source. The US factors are not appropriate for the UK
as they depend on a dryer climate. The damper
conditions in the UK result in much lower emissions.
Currently these do not appear to be significant on a
UK scale but they may be important locally.
Despite these problems with the data an order of
magnitude estimate is possible. The amount of
construction in the UK annually includes 150,000 to
200,000 houses, 2 to 2.5 million m2 of office
floorspace, 11.5 to 12.5 million m2 of industrial and
warehousing floorspace and 1.5 to 2 million m2 of
retail floorspace (DoE 1992, 1994). Assumptions
need to be made to account for the greater area
developed than the actual floorspace, the length of
time building takes, and a reduction for the amount of
rain in the UK. The number of days with rain each
year is about 150 to 250 (as measured by the
Department of the Environment’s acid rain monitoring
network) (Hjellbrekke et al, 1995). Therefore the
emissions should be no more than one half of those in
an arid climate. All these factors lead to an estimate
of 0.5 - 8.3 ktonnes of PM10 annually.
In order to check this, these emissions can be
compared with emission rates for other similar
processes. The total amount of waste arising from
these activities in the UK is about 70 million tonnes
(DoE, 1995). Of this, about 24 million tonnes is brick
and concrete with most of the remainder soils and
clays. An emission of 0.5 - 8.3 ktonnes annually
would indicate an emission rate for construction and
demolition of 0.007 to 0.119 kg/tonne of waste
produced. US emission factors for mineral handling,
quarrying and mining range from 0.001 to 54 kg/tonne
(USEPA, 1995a) and so the emission rate estimate for
demolition and construction seems to be a reasonable
estimate considering that the damper conditions in the
UK should reduce emissions below US levels.
The local effects of construction work can be seen in
ambient measurements. During 1994 the monitoring
site in Cardiff showed elevated levels (up to 80%
higher monthly mean) from June to October. This is
thought to be due to construction work which started
in January and finished in October. The reduced
impact of the work during January to May could be
due to both the nature of the work and the weather. In
winter and spring it will both rain more and dry
slower; this will reduce emissions.
4.2.6 Agricultural
Emissions from agricultural activities can potentially
come from a range of activities. These include land
preparation, fertiliser application and harvesting.
Stubble burning is now, except for a few limited
exceptions, banned in England and Wales so this is no
longer a significant source.
Of the different sources it is expected that harvesting
is the main source if only because it is usually done
when the crops are dry and so conditions will be
suitable for larger emissions. Currently, suitable
Chapter 4 : Sources and Emissions of Primary Particulate Matter
Quality of Urban Air Review Group 45
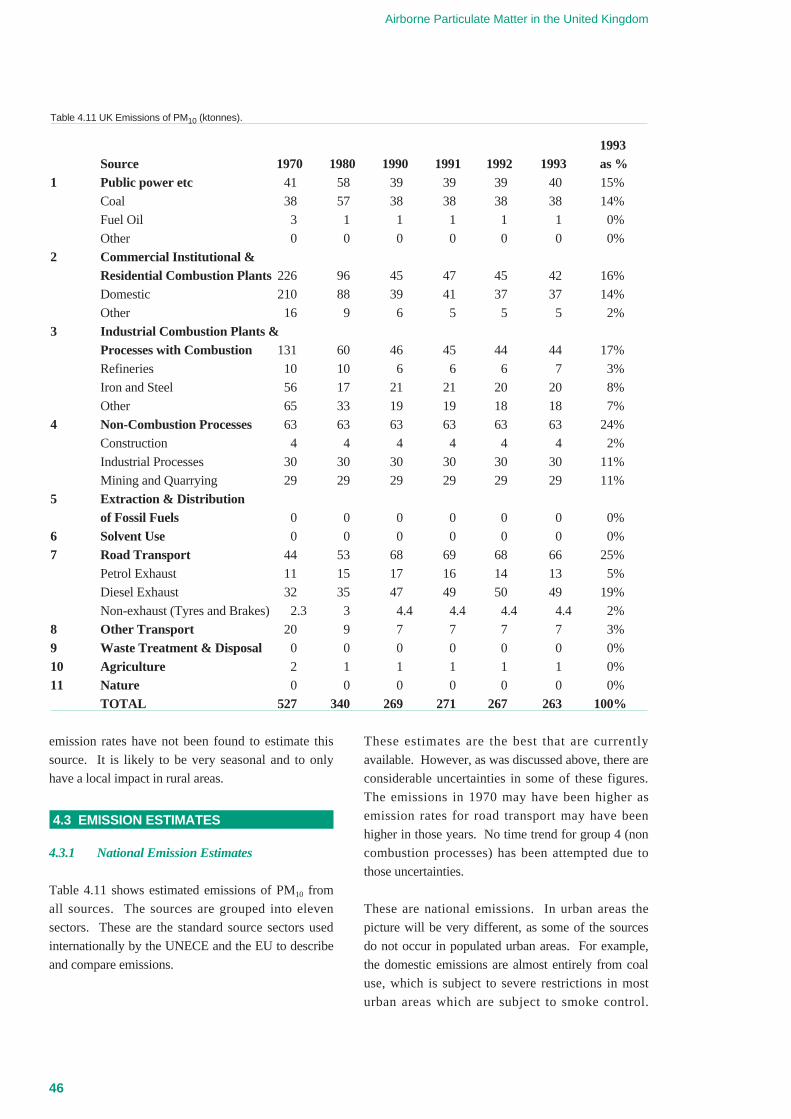
emission rates have not been found to estimate this
source. It is likely to be very seasonal and to only
have a local impact in rural areas.
4.3 EMISSION ESTIMATES
4.3.1 National Emission Estimates
Table 4.11 shows estimated emissions of PM10 from
all sources. The sources are grouped into eleven
sectors. These are the standard source sectors used
internationally by the UNECE and the EU to describe
and compare emissions.
These estimates are the best that are currently
available. However, as was discussed above, there are
considerable uncertainties in some of these figures.
The emissions in 1970 may have been higher as
emission rates for road transport may have been
higher in those years. No time trend for group 4 (non
combustion processes) has been attempted due to
those uncertainties.
These are national emissions. In urban areas the
picture will be very different, as some of the sources
do not occur in populated urban areas. For example,
the domestic emissions are almost entirely from coal
use, which is subject to severe restrictions in most
urban areas which are subject to smoke control.
Airborne Particulate Matter in the United Kingdom
46
Table 4.11 UK Emissions of PM10 (ktonnes).
1993Source 1970 1980 1990 1991 1992 1993 as %
1 Public power etc 41 58 39 39 39 40 15%
Coal 38 57 38 38 38 38 14%
Fuel Oil 3 1 1 1 1 1 0%
Other 0 0 0 0 0 0 0%
2 Commercial Institutional & Residential Combustion Plants226 96 45 47 45 42 16%
Domestic 210 88 39 41 37 37 14%
Other 16 9 6 5 5 5 2%
3 Industrial Combustion Plants &Processes with Combustion 131 60 46 45 44 44 17%
Refineries 10 10 6 6 6 7 3%
Iron and Steel 56 17 21 21 20 20 8%
Other 65 33 19 19 18 18 7%
4 Non-Combustion Processes 63 63 63 63 63 63 24%
Construction 4 4 4 4 4 4 2%
Industrial Processes 30 30 30 30 30 30 11%
Mining and Quarrying 29 29 29 29 29 29 11%
5 Extraction & Distribution of Fossil Fuels 0 0 0 0 0 0 0%
6 Solvent Use 0 0 0 0 0 0 0%
7 Road Transport 44 53 68 69 68 66 25%
Petrol Exhaust 11 15 17 16 14 13 5%
Diesel Exhaust 32 35 47 49 50 49 19%
Non-exhaust (Tyres and Brakes) 2.3 3 4.4 4.4 4.4 4.4 2%
8 Other Transport 20 9 7 7 7 7 3%
9 Waste Treatment & Disposal 0 0 0 0 0 0 0%
10 Agriculture 2 1 1 1 1 1 0%
11 Nature 0 0 0 0 0 0 0%
TOTAL 527 340 269 271 267 263 100%

Industrial emissions do not usually occur in central
urban areas. In the London area there is only one
large coal user left, and that is on the periphery of the
urban area. The main source nationally of PM10 from
stationary fuel use is from the burning of coal.
Chapter 4 : Sources and Emissions of Primary Particulate Matter
Quality of Urban Air Review Group 47
Table 4.12 Emissions of PM10 in London in 1990.
Emissions (tonnes) Emissions as %City of London Greater London 1x1 km* Greater London
Cars 14 1430 13% 16%
Taxis 11 182 10% 2%
LGV 9 699 8% 8%
MGV 31 2508 28% 28%
HGV 9 1968 8% 22%
Buses 20 766 18% 9%
Motorcycles 2 75 2% 1%
Trains 0 16 0% 0%
Water 0 5 0% 0%
Air 0 558 0% 6%
Domestic 0 12 0% 0%
Industrial 1 212 1% 2%
Commercial & Institutional 6 325 6% 4%
Construction 7 220 6% 2%
TOTAL 111 8975
* Equates approximately to the City of London.
RoadTransport
■ Cars
■ LGV
■ HGV
■ Buses
■ Motorcycles
■ Other Transport
■ Domestic Combustion
■ Other Stationary Combustion
■ Non-Combustion
Em
issi
ons
as %
of T
otal
Figure 4.5 Comparison of London and UK Emissions of PM10.
0
10
20
30
40
50
60
70
80
90
100
National 2010National 1990Greater London 1990City of London 1990

Airborne Particulate Matter in the United Kingdom
48
Mon
thly
mea
n co
ncen
trat
ion
(µg/
m3 )
Month
Figure 4.6 Monthly Mean Concentrations of PM10 for Urban Background Sites, 1993 and 1994.
Jan
'93
Apr
'93
Jul '
93
Oct
'93
Jan
'94
Apr
'94
Jul '
94
Oct
'94
0
10
20
30
40
50
CardiffBristolLeeds
Newcastle
Birmingham CentreBelfastLondon BloomsburyEdinburgh
% D
iffer
ence
from
mea
n of
all
site
s
Month/Year
Figure 4.7 PM10 Monthly Means - % Deviation from Mean of all Sites.
Jan
'93
Apr
'93
Jul '
93
Oct
'93
Jan
'94
Apr
'94
Jul '
94
Oct
'94
-30
0
30
60
90
CardiffBristolLeeds
Newcastle
Birmingham CentreBelfastLondon BloomsburyEdinburgh

These figures show that on a national scale road
transport accounts for about one third of the
emissions. About a half comes from stationary fuel
combustion.
4.3.2 PM10 Emissions in London
Emissions in urban areas will differ substantially from
national emission estimates. Sources such as
domestic and industrial fuel use will be much reduced
while road transport will become a much more
important source.
An inventory of emissions from energy-related
sources for London has been made for 1990 on a 1x1
kilometre grid (LRC, 1993). It covered an area
broadly similar to the extent of the old Greater
London Council. This considered a number of
pollutants but not PM10. However, as the emission
factors that were used in it are known it is possible to
make an estimate of the emissions of PM10 in London
based on their estimates of black smoke. Estimates of
emissions from construction were added, scaled from
the national estimates based on the employment in
construction work in London and the UK. The other
sources, such as mining and quarrying, do not occur
significantly in the area covered by this London
inventory, shown in Table 4.12.
Figure 4.5 compares emission estimates for Greater
London with national emission estimates. This clearly
shows the predominance of road transport emissions
of particulate matter in London. The national 2010
estimates are discussed in Section 4.5
4.4 AMBIENT PM10 LEVELS AND EMISSIONS
Ambient concentrations of PM10 are measured at a
number of sites across the UK; the measurement
methods and data are described in Chapter 6. There is
some interesting information about emissions that can
be extracted from the measurements.
Eight sites produced data for both 1993 and 1994 and
are considered here. All the sites are classified as
urban background. The emission data described
above implies that most of the PM10 emissions in the
area around the sites would be from road transport,
which does not have a significant seasonal variation.
The exceptions to this are Belfast and Cardiff.
Belfast has no natural gas supplies, and as a result
Chapter 4 : Sources and Emissions of Primary Particulate Matter
Quality of Urban Air Review Group 49
1970 1975 1980 1985 1990 1995 2000 2005 20100
10
20
30
40
Em
issi
ons
(kto
nnes
)
Figure 4.8 Past and Projected UK Urban Road Transport Emissions of PM10 (Diesel Car Sales 20%).
■ Motorcycles
■ LGV
■ Buses
■ HGV
■ Cars
Year

there is still considerable domestic coal combustion.
Thus, there should be a seasonal contribution to the
winter PM10 emissions as coal burning occurs
predominantly in the winter. The Cardiff site was
very close to construction work which started in
January 1994 and lasted until October 1994.
Figure 4.6 shows the monthly mean PM10
concentrations for the sites. Two features are
particularly notable. Firstly the Cardiff site does not
follow the same pattern as the other sites, particularly
in the central 10 months or so of 1994. Secondly, it is
striking how the concentrations at all the sites rise and
fall together. Weather conditions are one factor that
drives this, with still, stable conditions leading to
elevated concentrations. Figure 4.7 presents the same
data in a different way. The mean concentration for
all the sites was calculated. Then, for each site, the
percentage difference from this overall mean was
plotted. This shows that, except for two sites, all the
monthly mean concentrations are within ±30% of the
mean. The exceptions are Cardiff and Belfast. The
elevated levels at Cardiff seem to have stopped in
October 1994, when the construction work ended.
The cause of the peak in July 1993 is not known. The
elevated levels in Belfast occur in the winter months
while in the summer the concentrations are lower than
the UK mean.
These results are consistent with our knowledge of
PM10 sources. A local construction source has a large
impact on the air quality with an increase of nearly
90% in one monthly mean and an increase of over
50% for six months. This would imply that over a
third and up to a half of the ambient PM10
concentrations at Cardiff during January to October
1994 were caused by the construction work. In
Belfast the concentrations are about 40% higher than
the overall mean in the winter and up to 30% lower in
the summer. This indicates that of the order of a half
of the monthly mean ambient PM10 concentrations are
coming from domestic smoke in the winter.
The other sites show much similarity in behaviour to
one another and thus are likely to have similar
sources. More detailed analyses of ambient data are
presented in Chapter 6, and receptor modelling in
Chapter 8.
4.5 FUTURE EMISSION TRENDS
Predicting future trends in emissions of PM10 relies on
making judgements and assumptions on future
activities, both nationally and in urban areas. The
emissions estimates presented here are based on the
following assumptions:
Airborne Particulate Matter in the United Kingdom
50
1970 1980 1990 1991 1992 1993 1995 2000 2005 20100
100
200
300
400
500
600
■ Agriculture
■ Other Transport
■ Road Transport
■ Non-Combustion Processes
■ Industrial Combustion Plants/ Processes with Combustion
■ Commercial/Industrial/ Residential Combustion Plants
■ Public Power etc.
Em
issi
ons
(kto
nnes
)Figure 4.9 UK Emissions of PM10 by Source Category, 1970-2010.
Year

• In the absence of any other information it is
assumed that emissions from non-fuel combustion
stationary sources will continue into the future at
their current rates. Changes in PM10 into the future
will depend primarily on changes in two sectors;
fuel combustion and road transport.
• Road transport emissions of PM10 will change as
result of two factors: increasing road usage and the
implementation of stricter emission limits on new
vehicles. The National Road Transport Forecasts
(NRTF, DoT, 1994) have been used as the basis of
predictions of the growth of vehicle kilometres and
vehicle fleets.
• Future European emissions regulations that have
already been agreed to are included. Limits for
HGVs come into force in 1995/6 (91/542/EEC).
New car limits will come into force in 1996
(94/12/EEC) while limits on diesel vans will come
into force in 1997 (93/59/EEC). New, Stage III
limits for emissions from vehicles are planned to be
introduced by the EU in 2000. These are, however,
still the subject of discussion and cannot be included
in the projections. It is assumed that diesel cars will
account for 20% of all car sales each year from
1995.
The make-up of the vehicle parc, and in particular the
percentage of diesel vehicles in the car fleet is an
important determinant of the emissions from road
transport. In our Second Report (QUARG, 1993), this
Review Group showed that future reductions in
particulate matter emissions effected by tighter
exhaust emission regulations could be largely lost if
the percentage of diesels in the car fleet approached
50% as in some other European countries. Hence the
predictions are highly sensitive to the market share of
diesel cars.
Figure 4.3 shows the latest projection of road transport
emissions of PM10 in the UK, whilst Figure 4.8 shows
the road transport emissions in urban areas only. As
this follows the NRTF, it may overestimate emissions
for London, where traffic growth is now well below
the national average. Emission estimates for
stationary fuel use are based on estimates of fuel use
published by the DTI (DTI, 1995). The scenario
based on 'central growth, low fuel prices' (DTI, 1995)
is used. While the amounts of fuel used change,
specific emission rates are assumed to be constant.
Figure 4.9 shows national emission estimates until
2010.
Estimates of future emissions in urban areas depend
on the traffic growth estimates for those urban areas.
Such estimates are not currently published, and each
urban area is likely to be different. However, it is
clear that road transport will continue to be dominant
in urban areas until after 2010.
Chapter 4 : Sources and Emissions of Primary Particulate Matter
Quality of Urban Air Review Group 51
Table 4.13 - PM10 Sources in Order of Decreasing Reliability of Emission Estimate.
Source CommentsDiesel Cars Based on a number of detailed measurements
Diesel LGV and HGV Based on a few measurements
Diesel Buses and Coaches Only a few measurements. For some types the factors are extrapolated from
similar vehicle types.
Petrol Cars Only a few measurements. The factors chosen are uncertain especially for cars
without catalysts
Other Mobile Sources Little data and uncertain activity data.
Stationary Combustion Only a few measurements. Some of the PM10 factors have to be interpreted from
smoke or TSP data
Industrial Processes Few data of questionable applicability. Order of magnitude estimates possible.
Mining and Quarrying Few data of questionable applicability. Order of magnitude estimates possible.
Construction Only USA data which is not strictly appropriate for the UK. Order of magnitude
estimates possible.

4.6 UNCERTAINTIES
Emission inventories are estimates of emissions of
specific pollutants from a given area over a specified
time period. While measured data is used where
possible, it is also necessary to include estimates of
emissions from some categories of source because it is
impossible to measure all the sources all the time.
Additionally it cannot be stated with certainty that all
the sources that exist have been considered. In
practice, the major sources are included as they are
well known and any ‘missing’ emissions are small.
The estimates are generally based on a few
measurements with the assumption that these results
are typical of the behaviour of all similar sources.
The emission estimates of PM10 presented in this
Report are based where possible on measurements of
PM10 emissions, although in some instances measured
total particulate matter emissions have been converted
to PM10. While there have been a number of
investigations of particulate mass emission from
diesel-engined motor vehicles, this is not true of many
fugitive sources. Stationary fuel combustion falls
between these extremes. The figures presented above
are indicative estimates only for some sources,
particularly construction, quarrying and industrial
processes. Given the lack of knowledge about these
emissions it is not possible to give quantitative
indications of the accuracy of the emission estimates.
It is however possible to give an indication of the
reliability of the estimates, and these are presented in
Table 4.13.
A joint research programme sponsored by the
Department of the Environment, Department of
Transport and the motor industry is currently
investigating size-fractionated mass and number
emissions of particles from petrol and diesel vehicles,
and should enable more accurate estimates of
emissions from road vehicles to be made in the future.
4.7 BIOLOGICAL PARTICLES
The biological content of airborne particulate matter
has been an important area of scientific interest since
the nineteenth century. Transmission of hospital
infections and pathogenic crop diseases are known to
be related to the varied airborne dispersal mechanisms
of micro-organisms, and considerable research has
been undertaken within these fields.
The biological particles present in ambient air,
including pollen grains, fungal spores, bacteria and
viruses, have all been implicated in a wide variety of
health issues. Clearly, allergenic response to certain
pollen species presents an annual misery for millions
of hayfever sufferers across Europe. Also,
occupational diseases such as Farmer's Lung and
Toxic Organic Dust Syndrome are known to be
related to extended exposure to high concentrations of
fungal spores found in certain working environments.
Direct infection by such organisms as Legionella
bacteria from air conditioned buildings has also held a
high media profile, although with respect to a
relatively small number of cases. High episodic levels
of spores released by heavy summer rain have been
related to ten fold increases in asthma admissions
(Packe and Ayres, 1986). Although the significance
of natural allergens for asthmatics has been well
documented, little is currently known of the relative
mass composition of the species-specific or general
biological aerosol with respect to the detailed
determination of urban PM10 concentrations.
Table 4.14 Atmospheric Micro-organisms and their Relative Sizes
Micro-organism Type Mean size (µm)Pollens 10-100
Fungal Spores 5-40
Bacterial Spores 0.3-20
Viruses 0.003-0.5
Biological components associated with airborne
particulates have historically been assessed by
traditional microbiological growth techniques (agar
plates) or by optical (microscope) analysis. The
typical sizes of different types of micro-organism
appear in Table 4.14. Many sampling techniques are
now understood to be far from quantitative, and in
addition, many detection methods are significantly
biased towards some organisms and against others.
This lack of qualitative and quantitative information
suggests data from past research is often not
representative of the real environment, nor easily
comparable to other research. Data on the sources and
Airborne Particulate Matter in the United Kingdom
52

variability of bioaerosols in the atmosphere will
therefore be dependent upon these sampling and
analytical issues. In addition, the biological viability
of any given species in the atmosphere will depend
upon its tolerance of UV radiation, relative humidity
and temperature fluctuations, although the importance
of the physical aerosol may not necessarily be related
to its biological activity.
The terrestrial rather than marine environment is
generally considered to be the major source of
airborne micro-organisms (Roffey et al, 1977).
Vegetation and general farming activities, including
animal husbandry and arable cropping are major
contributors to the ambient bioaerosol, although
release mechanisms will depend strongly on
meteorological conditions. Urban sources of bacteria
have been estimated to be up to an order of magnitude
greater than corresponding rural regions (Bovallius et
al, 1978). However seasonal and regional activities,
such as wheat harvesting, may reverse the source
apportionment of specific species. More easily
defined anthropogenic sources include sewage
treatment works, landfill sites and power generation
cooling towers.
Although variability in composition will depend
heavily on seasonal and diurnal cycles, specific
species viability and release may be greatly influenced
by the relative impact of rainfall, high wind speeds,
and fluctuating humidity. Overall it has been
suggested that bacteria are associated mostly with
springtime, yeasts during the summer, and fungal
spores in the winter. Pollens are generally greatest
during warmer months, with grasses normally peaking
in late June and early July. Tree pollens tend to peak
earlier in the spring with Platanus pollens highest in
April and Betula during May. Diurnal pollen studies
have found maximum release generally occurs during
late afternoon (Norris-Hall and Emberlin, 1991).
Clearly, variability between differing years may be
great, and in addition, as little as 1 mm rainfall will
rapidly remove the majority of pollens from the
atmosphere, leading to large hourly and daily
fluctuations. Qualitatively, bioaerosol composition
analysed between 1958 and 1961 in Cardiff found that
mean pollen levels represented just 2% by number of
the bioaerosol content of the atmosphere (Knox,
1979), the remaining components being made up of
bacteria and fungal spores. Other quantitative studies
have determined fungal spores peaking at over
50,000/m3 in July, with lowest recordings around
10,000/m3 in May. Single bracken fronds have been
found to release up to 300 million spores during the
late autumn. One determination of pollen release
from cultivated grass estimated 210 kg per hectare
during the year (Knox, 1979).
With the increased awareness of the importance of
airborne particulates, it is perhaps surprising that
relatively little is known of the importance or relative
mass composition of the biological component of
ambient air in relation to the PM10 levels routinely
measured in urban areas. Ongoing development of
molecular DNA techniques may soon be able to
provide more reliable qualitative and quantitative data
on the biological composition of ambient aerosol.
Further assessment of the importance of these
parameters can then be considered in relation to other
current research into urban air quality and health.
4.8 KEY POINTS
• Road transport is a significant source of primary
particulate matter emissions, especially in urban
areas. Nationally it accounts for about a third of
emissions of PM10; in London this rises to over
80%.
• Stationary combustion sources are significant
contributors to particulate matter emissions on a
national scale. They account for about one half of
the PM10 emissions. However in cities this
contribution may become very small; in London it
accounts for about 5% of all the emissions, but is
larger in Belfast.
• There are a number of industrial processes that can
emit large quantities of PM10. While this may
dominate emissions locally they do not contribute a
large fraction of the emissions nationally.Their
impact on urban inventories is generally also small
due to their being sited out of town.
• Primary national emissions of PM10 are predicted to
fall by about one quarter between 1995 and 2010.
Chapter 4 : Sources and Emissions of Primary Particulate Matter
Quality of Urban Air Review Group 53

• Future emissions of PM10 in cities will depend
crucially on the amount of diesel fuel consumed and
the proportion of diesel vehicles in the fleet.
• Emissions estimates for PM10 from different source
categories vary greatly in their reliability. The most
reliable are from diesel cars and are based on a
number of detailed measurements. Contributions
from some other sources such as mining and
quarrying, and construction are subject to great
uncertainty.
• Biological particles comprising pollens, fungal
spores, bacteria and viruses are widespread. Whilst
their number concentrations have been evaluated,
their contribution to particle mass is not known.
REFERENCES
Ball DJ and Caswell R (1985) Smoke from DieselEngined Road Vehicles, Atmos Environ, 17, 169-
183.
Bovallius A, Bucht B, Roffey R and Anas P (1978b)
Three Year Investigation of the Natural AirborneBacterial Flora at Four Localities in Sweden, Appl
Environ Microbiol, 35, 847-852.
Department of the Environment. (1992) The UKEnvironment, HMSO, London 1992.
Department of the Environment (1994) SustainableDevelopment. The UK Strategy, HMSO, London
1994.
Department of the Environment (1995) ManagingDemolition and Construction Wastes. Report byHoward Humphreys & Partners, HMSO, London
1995.
Department of Trade and Industry (1995) EnergyProjection for the UK. Energy Paper 65, HMSO,
London 1995.
Department of Transport (1995) Transport StatisticsGB, 1994, Department of Transport, London.
Eggleston HS et al (1993) CORINAIR WorkingGroup on Emission Factors for Calculating 1990Emissions from Road Traffic Volume 1:Methodology and Emission Factors, EEC, Brussels
& Luxembourg 1993.
Gillham CA, Couling S, Leech PK, Eggleston HS and
Irwin JG (1994) UK Emissions of Air Pollutants,1970-1991, WSL Report LR 961, Stevenage, Herts.
Gover MP et al (1994) UK Petrol and DieselDemand - Energy and Emissions Effects of aSwitch to Diesel, ETSU Report, Harwell 1994.
Hjellbrekke AG, Lovblad G, Sjoberg K, Schaug J,
Skjelmoen JE (1995) EMEP Data Report 1993, Part 1:
Annual Summaries, EMEP, Norway.
HMIP Chemical Release Inventory1994.
Knox R.B (1979) Studies in Biology, No. 107; Pollenand Allergy, Edward Arnold Publishers Ltd.
LRC (1993) Energy Use in London, London
Research Centre, London.
National Power (1994) Environmental PerformanceReview, National Power.
Norris-Hall J and Emberlin J (1991) DiurnalVariation of Pollen Concentration in the Air ofNorth-Central London , Grana, 30, 229-234.
Packe GE and Ayres JG (1986) Aeroallergenic SkinSensitivity in Patients with Severe Asthma duringa Thunderstorm, The Lancet,i, 850-851.
PowerGen (1994) Environmental PerformanceReport, PowerGen.
PowerGen (1995) Environmental PerformanceReport, PowerGen.
Precision Research (1995) Off-road VehicleEmissions Equipment Ownership and Usage.
QUARG (1993) Diesel Vehicle Emissions andUrban Air Quality , QUARG, London.
Airborne Particulate Matter in the United Kingdom
54

Roffey R, Bovallius A, Anas P, and Konberg E
(1977) Semicontinuous Registration of AirborneBacteria at an Inland and Coastal Station inSweden, Grana,16, 171-177.
USEPA (1990) Air Emissions Species Manual,Volume II: Particulate Matter Species Profiles,2nd Edition, EPA-450/2-90-001b, USEPA Research
Triangle Park, NC, USA.
USEPA (1985) Compilation of Air PollutantEmssion Factors 4th Edition, Volume II: MobileSources, USEPA, Ann Arbor, USA.
USEPA (1995a) Compilation of Air PollutantEmission Factors 5th Edition, Volume I:Stationary Sources, USEPA, RTP North Carolina,
USA.
USEPA (1995b) Factor Information RetrievalSystem, USEPA, RTP North Carolina, USA.
Chapter 4 : Sources and Emissions of Primary Particulate Matter
Quality of Urban Air Review Group 55

Airborne Particulate Matter in the United Kingdom
56

5.1 INTRODUCTION TO SECONDARY PARTICULATE MATERIAL
In this section, attention is directed to that fraction of
the suspended particulate material in the particle size
range of less than 10 micrometres (µm) in diameter,
which was not directly emitted into the atmosphere in
particle form. A significant fraction of the PM10
consists of particles containing material which was
originally present in the gas phase in the atmosphere,
but has been subsequently taken up into the particulate
phase. The term secondary particulate material refers
to this material, originally gaseous but present as an
intimate component of the PM10.
Reviews of the many thousands of measurements of
the particle size distributions of the suspended
particulate matter in urban atmospheres have been
synthesised to yield idealised relationships between
the number of particles, their superficial area, volume
and mass, and their particle diameters. Figure 5.1
shows the idealised particle size distribution of urban
aerosols in the USA, in the form of three curves
showing the number-, area- and volume-size
distributions, taken from Whitby (1978).
Figure 5.1a shows the fraction of the number of
particles in each size range in the idealised urban
aerosol. The curve shows a predominant single peak
with a shoulder to higher particle sizes. This number
distribution peaks at about 0.013 µm (13 nm) with a
total number density of about 100,000 particles/cm3.
Particles in the size range less than 0.1 µm are said to
be in the nucleation mode and include the Aitken
nuclei.
Nucleation mode particles have been emitted into the
atmosphere as primary particles by combustion
sources (primary particulate material), both stationary
and mobile. These particles include elemental carbon
from diesel vehicles and flyash from pulverised coal-
fired power stations. However, some nucleation mode
particles are formed by condensation of gaseous
material through gas-particle conversion processes
(secondary particulate material). Few vapours can
readily form totally new nucleation mode particles
directly themselves but sulphuric acid vapour, formed
by the photochemical oxidation of sulphur dioxide,
exhibits this ability. In urban areas, nucleation mode
particles are the most numerous of all the particles.
Figure 5.1b shows the fraction of total surface area of
the particles in each size range in the same idealised
urban aerosol as Figure 5.1a. In this case the curve
shows a strong single peak with shoulders to both
higher and lower particles sizes. The area distribution
peaks at about 0.1 µm with a total area of about 500
µm2 /cm3. Particles in the size range 0.1 to 1 µm are
said to be in the accumulation mode.
Few accumulation mode particles were actually
emitted into the atmosphere in this particle size range.
Because this mode contains the bulk of the surface
area of the particles, see Figure 5.1b, these particles
offer the largest target area for adsorbing other aerosol
particles (coagulation) or for adsorbing gaseous
material. The process of coagulation reduces the
number of particles. The process of adsorption of
gaseous material from the atmosphere onto pre-
existing nucleation or accumulation mode particles
leaves the number of particles unchanged but causes
the area, volume and mass of the suspended
particulate material to grow rapidly. The accumulation
mode is therefore the aging region for all small
particles because growth is rapid and loss processes
are at a minimum at 0.1-0.3 µm. Thus, particles
originally present as nucleation mode particles tend to
accumulate in the accumulation mode. Typically there
might be about 10,000 particles per cm3 in the
accumulation mode in an urban area. Coarse and
nucleation mode particles make a small contribution
to the total superficial area of the urban aerosol.
Figure 5.1c shows the fraction of the total volume
(and hence mass) of the particles in each size range in
the same idealised urban aerosol as Figure 5.1a. In this
case the curve shows a bimodal distribution and the
complete absence of a shoulder to lower particle sizes.
The volume (or mass) distribution peaks at particle
sizes of about 0.3 and 6 µm, respectively, with total
volumes of about 20 and 30 µm3 /cm3 under each
peak. The volume (or mass) of the urban aerosol
appears to be in two modes: the accumulation mode
and the coarse mode, with the latter containing
particles in the size range 2 µm and above. The
5 Sources and Concentrations ofSecondary Particulate Matter
Quality of Urban Air Review Group 57

nucleation mode particles, although the greatest in
number contain a negligible fraction of the aerosol
volume and mass.
Most of the particles in the coarse mode are formed by
the frictional processes of comminution, such as wind-
suspended soil dust or evaporated sea-spray (primary
suspended particulate material) and from the slow
growth of particles from the accumulation mode
(secondary particulate material). Typically, there
might be a few tens or hundreds particles per cm3 in
the coarse mode in an urban area. However, not all of
the coarse mode particles pass through the PM10
sampling and monitoring system and are measured.
Coarse mode particles account for generally about 20-
50% of the urban PM10 mass in the UK.
The contributions to the particle size distribution of
the different types of atmospheric aerosol are
visualised in Figure 5.2, taken from Slinn (1983).
Around 1 µm there is a saddle point which separates
on the one hand the suspended particulate material
formed by storms, the oceans and volcanoes, from the
fine particulate matter formed by fires, combustion
and chemistry.
Following a consideration of these idealised aerosol
distributions, attention is turned to the situation in the
United Kingdom and to what is known about the
concentrations of secondary particulate material
derived from the following sources:
• sulphuric acid and ammonium sulphate in
particulate form, derived from the oxidation of
sulphur dioxide emitted by combustion sources,
Airborne Particulate Matter in the United Kingdom
58
Figure 5.1 Idealised Particle Size Distribution of Urban Aerosols in the USA.
0
200
400
600
8000
5
10
15
0
10
20
30
40
0.001 0.01 0.1 1.0 10 100
(a) Number Distribution
(b) Area Distribution
(c) Volume-size Distribution
∆N/∆
log
dp (
cm-3
x104
)∆S
/∆ lo
g dp
(µm
2 /cm
3 )∆V
/∆ lo
g dp
(µm
3 /cm
3 )
dp (µm)
Source: based on Whitby (1978).

• ammonium and other nitrates in particulate form,
derived from the oxidation of nitrogen oxides
emitted by combustion sources,
• semi-volatile organic compounds adsorbed onto the
atmospheric aerosol, derived from motor vehicles,
the resuspension of previously deposited material,
industrial processes and stationary fuel combustion,
Clearly, from the definitions adopted here, none of the
above sources have been taken into account in
producing the emission inventories described
elsewhere in this report.
Chapter 5 : Sources and Concentrations of Secondary Particulate Matter
Quality of Urban Air Review Group 59
Heavy AutoTraffic
Typical Urban Pollution
Industry
Sea SaltSouth-AtlanticBackground
North-AtlanticBackground
ContinentalBackground
Dust Storms
Volcanic Plumes
Sand StormsIntenseSmog
Forest Fire Plumes
Increasing Wind, Decreasing Height
Increasing Distance from Source
Increasing Insolation
Gas-to-Particle Conversion
∗
∗
Particle Diameter D (µm)
EvaporationDry DepositionPrecipitation Scavenging
Sedimentation
Are
a D
istr
ibut
ion
∆ S
/∆ lo
g D
(µm
2 /cm
3 )
Figure 5.2 Major Sources of Aerosol Particles.
105
104
103
102
101
100
10-1
10-3 10-2 10-1 100 101 102 103
Sinks:Coagulation
Source: Slinn (1983).
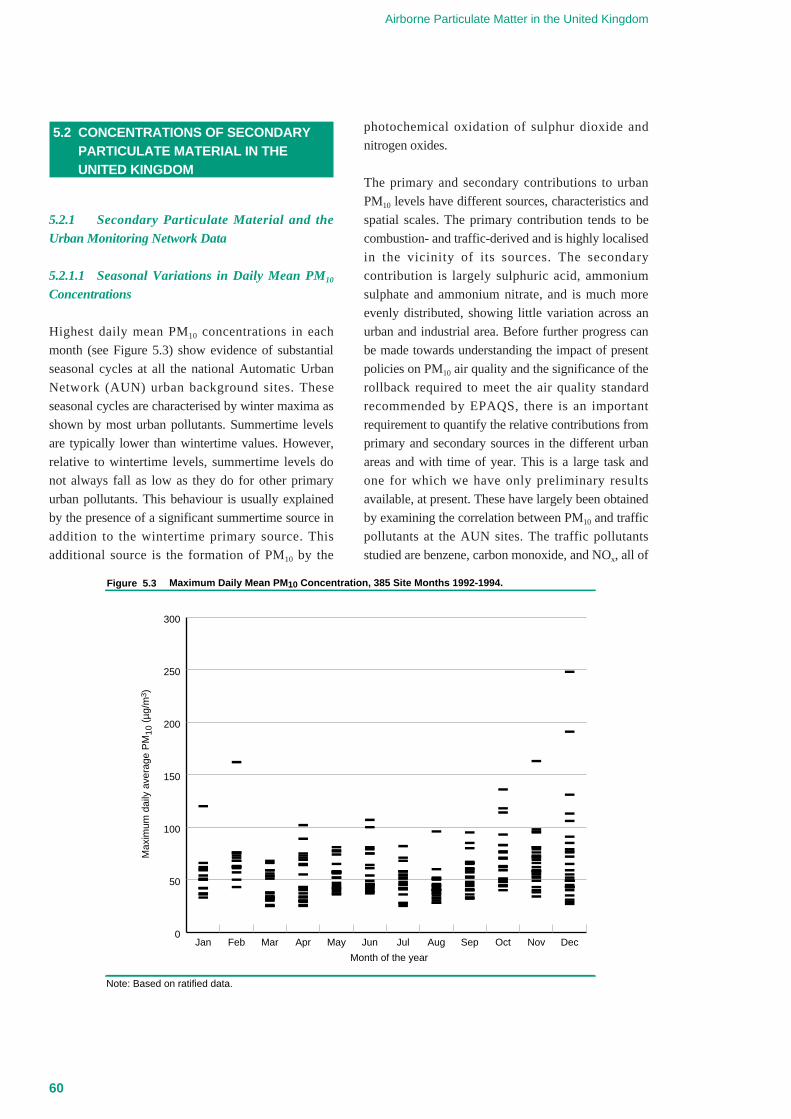
5.2 CONCENTRATIONS OF SECONDARY PARTICULATE MATERIAL IN THEUNITED KINGDOM
5.2.1 Secondary Particulate Material and theUrban Monitoring Network Data
5.2.1.1 Seasonal Variations in Daily Mean PM10
Concentrations
Highest daily mean PM10 concentrations in each
month (see Figure 5.3) show evidence of substantial
seasonal cycles at all the national Automatic Urban
Network (AUN) urban background sites. These
seasonal cycles are characterised by winter maxima as
shown by most urban pollutants. Summertime levels
are typically lower than wintertime values. However,
relative to wintertime levels, summertime levels do
not always fall as low as they do for other primary
urban pollutants. This behaviour is usually explained
by the presence of a significant summertime source in
addition to the wintertime primary source. This
additional source is the formation of PM10 by the
photochemical oxidation of sulphur dioxide and
nitrogen oxides.
The primary and secondary contributions to urban
PM10 levels have different sources, characteristics and
spatial scales. The primary contribution tends to be
combustion- and traffic-derived and is highly localised
in the vicinity of its sources. The secondary
contribution is largely sulphuric acid, ammonium
sulphate and ammonium nitrate, and is much more
evenly distributed, showing little variation across an
urban and industrial area. Before further progress can
be made towards understanding the impact of present
policies on PM10 air quality and the significance of the
rollback required to meet the air quality standard
recommended by EPAQS, there is an important
requirement to quantify the relative contributions from
primary and secondary sources in the different urban
areas and with time of year. This is a large task and
one for which we have only preliminary results
available, at present. These have largely been obtained
by examining the correlation between PM10 and traffic
pollutants at the AUN sites. The traffic pollutants
studied are benzene, carbon monoxide, and NOx, all of
Airborne Particulate Matter in the United Kingdom
60
Maximum Daily Mean PM10 Concentration, 385 Site Months 1992-1994.Figure 5.3
Max
imum
dai
ly a
vera
ge P
M10
(µg
/m3 )
Month of the year
0
50
100
150
200
250
300
DecNovOctSepAugJulJunMayAprMarFebJan
Note: Based on ratified data.

which pollutants have well characterised motor
vehicle sources.
5.2.2 Particulate Sulphuric Acid and AmmoniumSulphate
The earliest urban measurements of particulate
sulphuric acid were made during the London smog
episode in December 1952, when reported
concentrations were especially high. Continuous
measurements of both particulate sulphuric acid and
sulphate aerosol in the United Kingdom were made as
part of the Teesside Mist Study in the late 1960’s.
Although urban concentrations were significantly
elevated, on occasions rural concentrations could be
elevated as well by the drift of suspended particulate
material out of the industrial conurbations.
With the discovery of photochemical ozone formation
in the United Kingdom and the associated haze
production (Atkins, Cox and Eggleton, 1972), much
of the interest in particulate sulphur compounds
switched from their health impacts to their role in
visibility reduction. Elevated hourly concentrations of
particulate sulphuric acid and ammonium sulphate
were reported together with ozone concentrations in
the range 80-100 ppb, during July 1971, at Harwell,
Oxfordshire.
Long term time series of total particulate sulphate
concentrations are available from 1954 onwards for
Chilton near Harwell in Oxfordshire (Lee and Atkins,
1994) and are shown in Figure 5.4. The concentrations
are reported as µg S/m3 and show a steady rise
through the 1950s and 1960s to a maximum in the
1970s, when concentrations started to fall through to
the present day. Because of the relatively long lifetime
of particulate sulphate, these concentrations are
thought to be representative of a rather wide area of
southern England.
The rise in particulate sulphate observed at Harwell,
Oxfordshire since the 1950s and its subsequent
decrease is reflected in the longer term record of
sulphur deposition in Greenland ice (Mayewski et al,
1986). Here the growth in use of sulphur-containing
fossil fuels can be clearly detected as setting in around
the mid-19th century. A more recent decline is also
detectable showing that the pattern observed in
southern England is likely to have been reproduced
throughout much of continental Europe.
The growth in interest in acid rain and environmental
acidification in Europe during the 1970s prompted the
establishing of the UNECE European Measurement
and Evaluation Programme (EMEP) and a monitoring
network for particulate sulphate in rural areas across
Europe. By the 1990s, a network of over one hundred
stations has been established, reporting monthly mean
particulate sulphate concentrations (Schaug et al,
1994). Results are presented in Figure 5.5 for the
entire EMEP network, showing a clear gradient in
levels across the UK from about 1.5 µg S/m3 in the
south and east to about 0.5 µg S/m3 in the north and
west, which approaches a factor of three.
Urban monitoring of particulate sulphate levels started
in the UK during the 1970s at a handful of sites and
Chapter 5 : Sources and Concentrations of Secondary Particulate Matter
Quality of Urban Air Review Group 61
1954
µg/m
3 as
S o
r N
1958 1962 1966 1970 1974 1978 1982 1986 19900
1
2
3
4
5
Figure 5.4 Three-month Running Mean Concentration of Particulate Sulphate and Particulate Nitrate at Chilton, 1954 to 1988.
particulate nitrateparticulate sulphate
Year
Source: RGAR, 1990.

confirmed the importance of photochemical oxidation
as the main source, as in the rural areas. Mean UK
urban concentrations tended to be similar to rural
levels, confirming that long range transport rather than
urban scale production was the dominant source of the
elevated urban summertime particulate sulphate
concentrations.
With the onset of national urban PM10 monitoring in
the United Kingdom in 1992, increasing interest has
been given to assessing the contribution made by
particulate sulphuric acid and ammonium sulphate to
urban PM10 levels. Almost all the rural measurements
of particulate sulphur compounds are reported as µg
S/m3 and so are not directly comparable with urban
PM10 measurements reported as µg/m3. A simple
conversion factor does not exist, but a rather good
guide can be obtained if results in µg S/m3 are scaled
by a factor of about 4. Assuming that rural
concentrations can be taken as a guide to urban
concentrations, baseline urban levels of particulate
Airborne Particulate Matter in the United Kingdom
62
Figure 5.5 Sulphate in Aerosols Across Europe, 1993.
Below 0.3
0.3-0.9
0.9-1.2
Above 2.41.2-1.8
1.8-2.4
Sulphate in aerosols (µg S/m3)
Source: Hjellbrekke et al, 1995.

sulphate of the order of 6 µg/m3 on a PM10 basis can
be anticipated.
The strongest evidence that photochemically-
generated secondary particulate sulphate contributes
to urban PM10 measurements comes from an analysis
of the AUN PM10 data itself. Monthly mean PM10
concentrations exhibit a significantly different
seasonal cycle to that of the typical primary pollutants
such as carbon monoxide, NOx and some of the
VOCs. PM10 levels tend to be highest in autumn and
winter, as do the typical primary pollutants, but differ
in that summer mean levels are only slightly lower,
whereas they are significantly lower for the primary
pollutants. These points are illustrated in Table 5.1
and Figure 5.3 with the available national PM10 data
for 1992-1994.
PM10 levels tend to rise during summertime
photochemical episodes and at several sites
simultaneously in response to the changing
meteorological situation (see Figure 5.6 and Figure
8.4). In this respect, the behaviour shown by urban
PM10 concentrations is reminiscent of that of rural
ozone concentrations. Summertime maximum hourly
ozone concentrations appear to correlate well with
maximum daily mean PM10 concentrations at some
AUN sites. Hourly PM10 and ozone concentrations
tend not to correlate well because ozone shows a
characteristic diurnal variation which is not shared by
PM10, since it lacks the efficient nocturnal depletion
mechanisms of dry deposition and chemical reaction
with NO exhibited by ozone.
The highly time-resolved hourly measurements of
particulate sulphuric acid and ammonium sulphate
concentrations reported during the photochemical
episode during 1971 show that it is indeed likely that
much or all of the urban PM10 currently measured
during the summertime could be accounted for by the
regional scale transport of photochemically oxidised
sulphur compounds. In which case, the majority of the
particulate sulphur is anticipated to be present in the
accumulation mode, in the particle size range 0.1-0.3
µm. In this size range its dry deposition velocity is at a
minimum, and its lifetime many days.
5.2.3 Particulate Ammonium and Other Nitrates
Although particulate nitrate and sulphate share many
common features, their formation mechanisms and
atmospheric behaviour are in fact rather different. The
processes involved with particulate nitrate are only
being slowly understood and are complicated by
measurement inadequacies, artefacts and lack of
coverage.
Nitrate can be detected in suspended particulate
material and its presence usually correlates well with
that of sulphate showing some measure of association.
The long-term time-series of particulate nitrate
concentrations measured at Harwell, Oxfordshire (Lee
and Atkins, 1994) shows a steady rise throughout the
period from 1954 onwards, without the recent
decrease observed for particulate sulphate (Figure
5.4). Again, this behaviour parallels that of nitrate in
Greenland ice (Mayewski et al, 1986) since
preindustrial times.
The UNECE EMEP programme has established a
network for total inorganic nitrate, which includes
both particulate nitrate and gaseous nitric acid,
although fewer sites have contributed on a historic
basis compared with those measuring particulate
sulphate. Table 5.2 shows the data for the UK
monitoring sites. Clearly human activities produce
elevated nitrate aerosol concentrations and a gradient
is likely to exist in concentrations across the UK as
with sulphate aerosol.
No long-term routine measurements of particulate
nitrate aerosol appear to have been made in urban
areas of the UK. Measurements have been reported for
urban and rural areas of Essex by Harrison and Allen
(1990). There is no reason to expect that particulate
nitrate aerosol is not an ubiquitous contributor to
urban PM10 levels. Indeed, measurements made in the
Los Angeles basin show that particulate nitrate is the
major inorganic contributor to urban PM10 levels in
that city.
The main fate of the NOx emitted in urban and rural
areas is oxidation to nitric acid vapour by hydroxyl
radicals during daytime and by ozone to N2O5 at night.
Sulphuric acid produced by the oxidation of sulphur
Chapter 5 : Sources and Concentrations of Secondary Particulate Matter
Quality of Urban Air Review Group 63

Airborne Particulate Matter in the United Kingdom
64
TABLE 5.1 Maximum Daily Mean PM10 Concentrations for National Network Stes (µg/m3).
Site Year Jan Feb Mar Apr May June July Aug Sep Oct Nov Dec
London 1992 85 68 51 94 47 75 68 41 66 43 43 79
Bloomsbury 1993 66 76 68 75 81 100 54 50 44 48 81 29
1994 42 75 31 41 57 54 58 41 46 93 58 91
Belfast 1992 - - 20 30 56 45 28 28 95 136 95 248
1993 120 61 66 73 78 107 25 42 65 118 98 40
1994 39 162 38 40 57 49 42 30 66 83 55 191
Edinburgh 1992 - - - - - - - - - 32 29 72
1993 36 38 43 43 41 46 - 37 32 45 66 35
1994 33 43 25 25 42 38 41 28 25 62 38 49
Newcastle 1992 - - 37 71 66 72 48 51 67 40 40 71
1993 42 62 54 65 45 79 63 - - 38 73 43
1994 50 63 33 43 52 51 51 37 53 77 58 59
Birmingham 1992 - - 27 69 77 64 71 60 57 59 34 131
Centre 1993 42 26 56 102 57 79 27 40 66 44 71 27
1994 33 63 30 30 43 43 46 39 36 71 56 113
Cardiff 1992 - - - - - 38 36 45 52 48 69 85
1993 61 52 59 89 65 75 54 - - - 62 45
1994 60 68 59 64 58 81 82 96 80 76 72 43
Leeds 1993 57 62 71 50 42 50 29 52 60 51 96 43
1994 62 59 33 34 41 46 55 51 60 114 76 77
Bristol 1993 37 63 53 75 57 61 58 44 61 49 81 49
1994 54 71 34 33 47 42 41 40 40 83 49 52
Liverpool 1993 - - - 93 74 - 29 44 85 48 163 49
1994 51 76 32 29 52 39 47 39 58 84 59 76
Birmingham 1993 - - - - - - - - - - - 31
East 1994 51 57 26 26 37 41 45 32 33 62 79 106
Southampton 1994 50 39 33 55 39 45 48 35 40 63 53 43
Leicester 1994 59 50 25 30 36 39 42 40 33 51 52 65
Hull 1994 56 73 34 37 58 37 52 46 48 85 62 55
London 1994 - - - - 27 44 58 33 41 70 58 49
Bexley
Swansea 1994 - - - - - - - - - - - 46

dioxide can readily self-nucleate to form particulate
material or can be adsorbed to pre-existing particles to
produce accumulation mode aerosol. Nitric acid
vapour does not share this property of self-nucleation.
Furthermore, those accumulation mode particles
which are loaded up with acidic sulphur compounds
are not expected to take up nitric acid vapour
efficiently. Nitric acid can however be adsorbed by
sea-salt particles displacing HCl, leaving sodium
nitrate aerosol. Alternatively, it may react with
gaseous ammonia to form ammonium nitrate which
may itself be adsorbed by accumulation mode
particles. During nightime, N2O5 itself reacts with sea
salt particles to produce sodium nitrate aerosol. So
there are mechanisms by which particulate nitrate can
be formed; however, they are likely to have a
markedly variable efficiency compared with those for
particulate sulphate.
The evidence that particulate nitrate is associated with
summertime photochemical episodes is more difficult
to find. Nevertheless, it is likely that regional scale
photochemical production of particulate nitrate does
occur and that this contributes to urban PM10
concentrations in the UK. Almost all the rural
measurements of particulate nitrate are reported as
µg N/m3 and so are not directly comparable with
urban PM10 measurements reported as µg/m3. A
simple conversion factor does not exist, but a rather
good guide can be obtained if results in µg N/m3 are
scaled by a factor of about 4. Assuming that rural
concentrations can be taken as a guide to urban
concentrations, baseline urban levels of particulate
Chapter 5 : Sources and Concentrations of Secondary Particulate Matter
Quality of Urban Air Review Group 65
Dai
ly m
axim
um P
M10
(µg
/m3 )
Day/month
Figure 5.6 Daily Maximum PM10 May to June 1993.
0
20
40
60
80
100
120
LondonBelfastEdinburgh
Newcastle
BirminghamBristolLiverpoolLeeds
25 27 29 1 3 5 7 9 11 13 15 17 19 21 23 25 27 29 31 2 4 6 8 10 12 14 16 18 20 22 24May June
Table 5.2 Nitrate Plus Nitric Acid Data from the EMEP Monitoring Network, 1992 (µg N/m3).
Site Annual Mean Standard Deviation Minimum MaximumEskdalemuir 0.39 0.63 0.0 4.93
High Muffles 0.88 0.95 0.03 6.51
Source: Schaug et al, 1994.

nitrate of the order of 4 µg/m3 on a PM10 basis can be
anticipated. This secondary contribution to urban
PM10 is somewhat smaller than that of particulate
sulphate but is still quite significant.
5.2.4 Impact of Present Policies On FutureSecondary PM10 Air Quality
The spatial distribution of the secondary aerosol
concentrations has been calculated with the Hull Acid
Rain Model (HARM) at a spatial resolution of
20kmx20km across the United Kingdom. The model
treats both European and UK sources of sulphur
dioxide, nitrogen oxides, ammonia and hydrogen
chloride, together with their interacting chemistry, dry
deposition and wet removal. The spatial patterns
calculated of the particulate concentrations of
sulphate, nitrate, chloride and ammonium agree with
the available observations, such as they are. Figure
5.7 illustrates the geographical variation in the model-
calculated concentrations, with a peak in the south
east and a minimum in the north west of Britain. The
model aims to give a detailed source attribution of the
secondary PM10 aerosol species across the United
Kingdom. Full details of the model are given
elsewhere (Metcalfe et al 1995).
It has been possible to estimate how the distribution of
secondary PM10 will respond to policy measures
already in hand by developing an emission scenario
for the year 2010. This scenario has then been used in
the HARM model to estimate future secondary PM10
contributions. The elements of the emission scenario
are as follows:
• the Oslo Protocol to the UNECE international
convention on Long Range Transboundary Air
Pollution, which should lead to about a 60%
reduction in sulphur dioxide emissions across
Europe by the year 2010 on present day levels,
• the Sofia Protocol to the UNECE international
convention which should lead to a freeze on
nitrogen oxide emissions at 1987 levels,
• the installation of three-way catalyst technologies on
petrol-engined motor vehicles in the EU countries
and Norway and some limited action on diesel
vehicle emissions during the late 1990s in line with
the proposals of the European Commission,
• NOx emissions from Large Combustion Plant in the
UK have been assumed to decrease in accord with
the EC Directive and stay constant from 1997
onwards,
• HCl emissions are assumed to decrease in line with
power station SO2 emissions,
• no action has been assumed on ammonia emissions
across Europe.
Mean PM10 contributions across Great Britain are
tabulated in Table 5.3 in both scenarios. There appears
to be a 39% reduction in secondary PM10 to be
anticipated by the year 2010 due to present policies.
The result will be a future secondary aerosol which is
largely composed of nitrate.
5.2.5 Semi-Volatile Organic Compounds
It has been long recognised that large quantities of
organic compounds are emitted into the urban
atmosphere. The main sources involve evaporation or
fuel spillage, natural gas leakage, solvent usage,
industrial and chemical processes and the use of
bitumen and road asphalt. The sources of much of the
Airborne Particulate Matter in the United Kingdom
66
Table 5.3 Contribution from the Major Aerosol Species to PM10 in the Present Day and Future Atmospheres as Calculated in the HARMModel.
Contribution Present Day PM10, µg/m3 Future 2010 PM10, µg/m3
Sulphate 2.8 1.2
Nitrate 2.9 2.2
Ammonium 0.7 0.5
Chloride 0.1 0.1
Total 6.5 4.0
Source: Metcalfe et al, 1995

low-molecular weight organic compounds have been
quantified for the UK. This material is of high
volatility generally and is readily removed from the
atmosphere over a period of days to years by
atmospheric oxidation. However, as molecular weight
increases, volatility decreases and there comes a point
when the atmospheric behaviour of the more complex
organic compounds changes radically from that
exhibited by the low-molecular weight compounds.
For some organic compounds volatility is so low that
evaporation is an exceedingly slow process. Emissions
to the atmosphere occur through some form of high
temperature process such as firing, curing or melting
as with the laying of road asphalt. Under these
circumstances, the emitted organic compounds rapidly
cool and condense on any pre-existing particles in the
atmosphere. Although nucleation mode particles are
the most numerous in urban areas, they do not offer
the large superficial area as that provided by the
Chapter 5 : Sources and Concentrations of Secondary Particulate Matter
Quality of Urban Air Review Group 67
Figure 5.7 Secondary PM10 Concentration as Calculated by the HARM Model.
Mean 6.6 µg/m3
■ > 9.00
■ 6.00 - 9.00
■ 3.00 - 6.00
■ 0.00 - 3.00
Source: Metcalfe et al, 1995.

Airborne Particulate Matter in the United Kingdom
68
Table 5.4 Concentrations of Organic Compounds Formed in Air Samples Taken in Belgium, (reprinted courtesy of Elsevier Science Ltd).
Concentration (ng/m3)Particle Gas-phase Distribution
Compound Samples P Samples G Factor P/G
Aliphatic Hydrocarbonsn-nonadecane 0.80 15.1 0.053
n-eicosane 0.85 7.55 0.113
n-heneicosane 1.08 4.12 0.262
n-docosane 2.33 4.23 0.551
n-triosane 4.75 3.38 1.41
n-tetracosane 8.15 4.63 1.76
n-pentacosane 9.50 5.74 1.66
n-hexacosane 9.73 8.70 1.12
n-heptacosane 11.1 9.03 1.39
n-octasane 8.10 7.80 1.04
n-nonacosane 15.8 7.32 2.41
n-tricontane 5.75 4.87 1.18
n-hentriacontane 11.2 3.99 2.81
Polyaromatic HydrocarbonsPhenanthrene and anthracene 1.21 44.7 0.027
Methylphenanthrene and methylanthracene 0.90 10.2 0.088
Fluoranthene 2.22 8.52 0.261
Pyrene 3.17 3.36 0.488
Benzofluorenes 2.33 1.87 1.246
Methylpyrene 0.93 - P
Benz(a)anthracene and chrysene 12.2 3.87 3.15
Benzo(k)fluoranthene and benzo(b)fluoranthene 23.1 2.01 11.5
Benzo(a)pyrene, benzo(e)pyrene and perylene 20.1 2.69 7.47
Phthalic Acid Estersdi-isobutylphthalate 1.73 32.8 0.053
di-n-butylphthalate 101 353 0.286
di-2-ethylhexylphthalate 54.1 127 0.426
MiscellaneousAnthraquinone 1.59 5.66 0.281
Fatty Acid EstersLauric acid 0.01 30.3 0.0003
Myristic acid 1.39 7.58 0.183
Pentadecanoic acid 3.60 5.35 0.673
Palmitic acid 29.0 4.77 6.08
Heptadecanoic acid 2.84 5.71 0.497
Oleic acid 2.06 - P
Stearic acid 35.7 2.27 15.73
Nonadecanoic acid 1.91 1.02 1.87
Eicosanoic acid 9.04 3.00 3.01
Heneicosanoic acid 2.56 1.65 1.55
Docosanoic acid 13.7 - P
Tricosanoic acid 3.23 - P
Tetracosanoic acid 10.7 - P
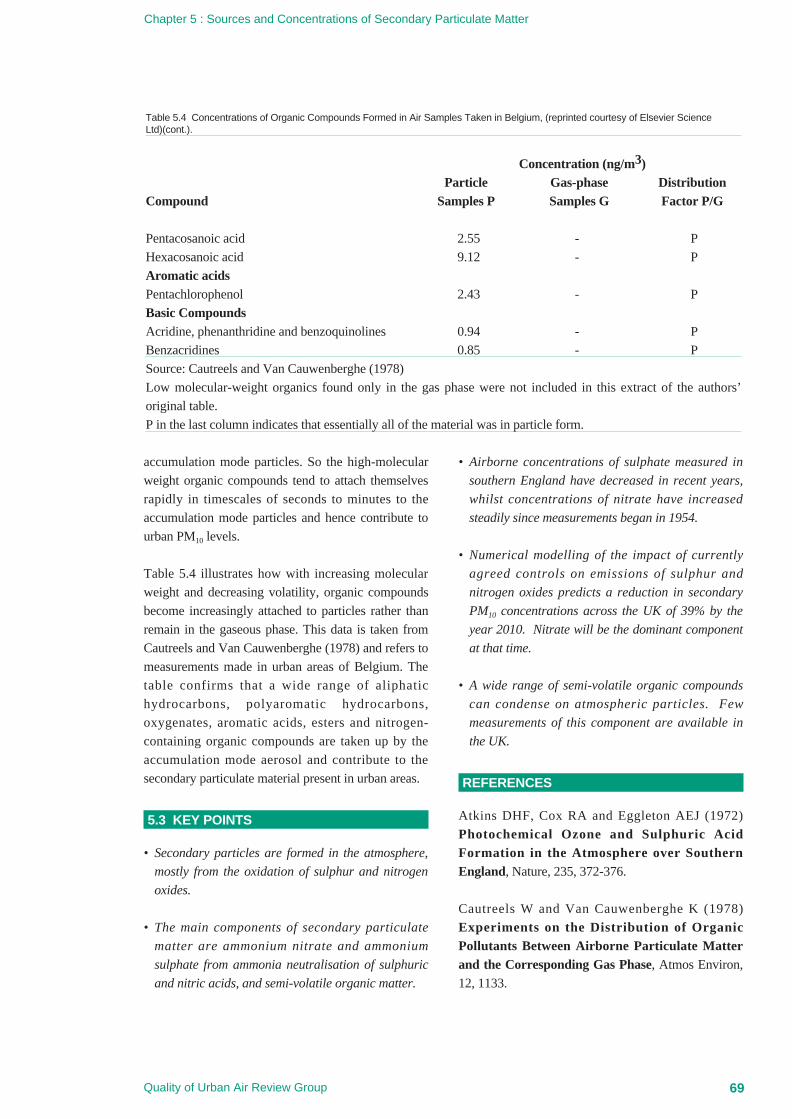
accumulation mode particles. So the high-molecular
weight organic compounds tend to attach themselves
rapidly in timescales of seconds to minutes to the
accumulation mode particles and hence contribute to
urban PM10 levels.
Table 5.4 illustrates how with increasing molecular
weight and decreasing volatility, organic compounds
become increasingly attached to particles rather than
remain in the gaseous phase. This data is taken from
Cautreels and Van Cauwenberghe (1978) and refers to
measurements made in urban areas of Belgium. The
table confirms that a wide range of aliphatic
hydrocarbons, polyaromatic hydrocarbons,
oxygenates, aromatic acids, esters and nitrogen-
containing organic compounds are taken up by the
accumulation mode aerosol and contribute to the
secondary particulate material present in urban areas.
5.3 KEY POINTS
• Secondary particles are formed in the atmosphere,
mostly from the oxidation of sulphur and nitrogen
oxides.
• The main components of secondary particulate
matter are ammonium nitrate and ammonium
sulphate from ammonia neutralisation of sulphuric
and nitric acids, and semi-volatile organic matter.
• Airborne concentrations of sulphate measured in
southern England have decreased in recent years,
whilst concentrations of nitrate have increased
steadily since measurements began in 1954.
• Numerical modelling of the impact of currently
agreed controls on emissions of sulphur and
nitrogen oxides predicts a reduction in secondary
PM10 concentrations across the UK of 39% by the
year 2010. Nitrate will be the dominant component
at that time.
• A wide range of semi-volatile organic compounds
can condense on atmospheric particles. Few
measurements of this component are available in
the UK.
REFERENCES
Atkins DHF, Cox RA and Eggleton AEJ (1972)
Photochemical Ozone and Sulphuric AcidFormation in the Atmosphere over SouthernEngland, Nature, 235, 372-376.
Cautreels W and Van Cauwenberghe K (1978)
Experiments on the Distribution of OrganicPollutants Between Airborne Particulate Matterand the Corresponding Gas Phase, Atmos Environ,
12, 1133.
Chapter 5 : Sources and Concentrations of Secondary Particulate Matter
Quality of Urban Air Review Group 69
Table 5.4 Concentrations of Organic Compounds Formed in Air Samples Taken in Belgium, (reprinted courtesy of Elsevier ScienceLtd)(cont.).
Concentration (ng/m3)Particle Gas-phase Distribution
Compound Samples P Samples G Factor P/G
Pentacosanoic acid 2.55 - P
Hexacosanoic acid 9.12 - P
Aromatic acidsPentachlorophenol 2.43 - P
Basic CompoundsAcridine, phenanthridine and benzoquinolines 0.94 - P
Benzacridines 0.85 - P
Source: Cautreels and Van Cauwenberghe (1978)
Low molecular-weight organics found only in the gas phase were not included in this extract of the authors’
original table.
P in the last column indicates that essentially all of the material was in particle form.

Harrison RM and Allen AG (1990) Measurements ofAtmospheric HNO3, HCl and Associated Specieson a Small Network in Eastern England, Atmos
Environ, 24, 369-376.
Hjellbrekke AG, Lovblad G, Sjoberg K, Schaug J and
Skjelmoen JE (1995) EMEP Data Report 1993,
EMEP.
Mayewski PA, Lyons WB, Spencer MJ, Twickler M,
Dansgaard W, Koci B, Davidson CI and Honrath RE
(1986) Sulphate and Nitrate Concentrations from aSouth Greenland Ice Core, Science, 232, 975-977.
Metcalfe SE, Whyatt D and Derwent RG (1995) AComparison of Model and Observed NetworkEstimates of Sulphur Deposition across GreatBritain for 1990 and its Likely Source Attribution ,.
Q J Royal Met Soc, 121, 1387-1412.
RGAR (1990) Acid Deposition in the UnitedKingdom 1986-1988, RGAR, London.
Slinn WG (1983) Precipitation Scavenging, DryDeposition and Resuspension, Proceedings of theFourth International Conference, (Pruppacher HR,
Semonin RG and Slinn WG, Coords), Elsevier, New
York.
Schaug J, Pederson U, Skjelmoen JE and Kvalvagnes
I (1994) EMEP Data Report 1992, EMEP.
Whitby K (1978) The Physical Characteristics ofSulphur Aerosols, Atmos Environ, 12, 135.
Airborne Particulate Matter in the United Kingdom
70

6.1 INTRODUCTION
Particulate matter, unlike other ambient atmospheric
pollutants, tends to be classified by the measurement
technique used. Thus, PM10, PM2.5, black smoke,
strong acid aerosol, total suspended particulate are all
terms which are used to characterize the physical or
chemical state of airborne particulate matter and
which give an indication of the measurement method
employed.
Historically, filter methods were first employed to
measure the concentrations of particulate matter. The
material collected on a filter paper for a specified
interval, typically a day, was analysed by weighing or
by determining the intensity of the black stain
produced (the “black smoke” or “smoke stain”
method). Measurements have been made at certain
sites which go back to the early part of this century.
Although these sampling methods continue to be used
and do provide extensive spatial and temporal
coverage, automatic analysers such as the tapered
element oscillating microbalance (TEOM) have
recently been introduced in the United Kingdom and
are increasingly being used to give measurements on a
finer timescale. There has been a tremendous increase
in the amount of data available in the United Kingdom
on particulate matter as PM10 since the introduction of
these instruments and the emphasis of this Chapter
will be primarily on these newer measurements.
The general picture gained from the measurements,
especially from the smoke and sulphur dioxide
networks, is of a dramatic decline in the levels of
particulate matter over the course of the last 40 years.
The introduction of smoke control areas after the
London smog episodes of 1952 and 1962, the shift
away from coal burning for space heating and cooking
in most parts of the UK (Northern Ireland excepted)
and the "tall stack" policy have greatly reduced the
emissions of particulate matter and their ambient
concentrations.
Although the levels of particulate matter are now
significantly lower than those observed historically,
the epidemiological studies undertaken recently, most
notably in the United States (Dockery et al, 1993;
Pope et al, 1995), have once again focussed attention
on current levels of particulate matter. This Chapter
will review the measurements made by the different
monitoring techniques in both urban and rural
environments, will seek to identify trends in the
concentration of particulate matter, to discern
relationships with other pollutants and ultimately to
see whether the sources of particulate matter can be
identified.
6.2 MEASUREMENTS OF PARTICULATE MATTER
The different measurement techniques used to
characterize particulate matter were described in
Chapter 3 of this report. At the present time,
measurements of particulate matter are made on a
routine basis in three national networks:
(1) the Basic Urban Network for smoke and sulphur
dioxide, in which daily concentrations of particulate
matter are determined using the “smoke stain”
method. The measurements made in this network
represent the longest running series of data. Sites
were chosen to be representative of locations in major
population centres whilst ensuring spatial coverage of
the whole country. The network currently comprises
154 sites, 84 of which are also included in the EC
Directive network described in (2) below.
(2) the EC Directive network for smoke and sulphur
dioxide, in which daily concentrations of particulate
matter are again determined using the smoke stain
method. This network was established to monitor
compliance with the EC Directive (80/779/EC) on
Sulphur Dioxide and Suspended Particulate Matter. It
currently comprises 155 sites. The measurements are
specifically made at sites which were at risk of
breaching the Directive or where breaches have
occured. The number of sites has fallen from a peak
of 330 sites in 1986 as levels of smoke have declined
(QUARG, 1993a).
(3) the Automatic Urban Network, in which hourly
concentrations of particulate matter are determined as
PM10 using tapered element oscillating microbalance
(TEOM) instruments. The network was established in
1992 and now comprises 16 sites positioned in urban
background locations.
6 Concentrations and Trends in ParticulateMatter
Quality of Urban Air Review Group 71

•Belfast •Leicester
•Bristol •Liverpool
•Birmingham (Centre) •London (Bexley)
•Birmingham (East) •London (Bloomsbury)
•Cardiff •Middlesbrough
•Edinburgh •Newcastle
•Kingston-upon-Hull •Southampton
•Leeds •Swansea
The network is set to expand, with the establishment
of a further 13 sites by the end of 1996.
In addition the Department of the Environment has
announced that it intends to integrate around 35
locally operated sites into the national network by
1996. Some of these sites are expected to monitor
PM10.
Airborne Particulate Matter in the United Kingdom
72
Figure 6.1 Basic Urban Network Sites, 1993/94.

Figures 6.1 to 6.3 present the positions of the current
monitoring sites in these networks across the United
Kingdom.
The Basic Urban and EC Directive networks grew out
of the National Survey for smoke and sulphur dioxide
which was started in 1961. The objective of the
National Survey was to monitor the implementation of
smoke control measures. Although many of the
original sites are still operational, the number of sites
has fallen from a peak of 1410 in 1967/68. The
measurements made in this network represent the
longest running series of data and, in the absence of
historical PM10 measurements, have been widely used
in epidemiological studies. (The relationship between
black smoke and PM10 is discussed in section 6.4.2).
Chapter 6 : Concentrations and Trends in Particulate Matter
Quality of Urban Air Review Group 73
Figure 6.2 EC Directive Network Sites, 1993/94.

Following the reorganisation of the National Survey
network in 1981 into the Basic Urban and EC
Directive networks, the sites in non-urban
environments were subsequently transferred to the UK
Acid Deposition network. Measurements of smoke
have not been undertaken at rural sites since 1991.
In addition, there are long-term time-series
measurements of particulate sulphate and nitrate
which have been made at Chilton, Oxfordshire and of
particulate sulphate at 8 rural sites. In the “multi-
element” survey, which was started in 1976, a range
of trace elements, including lead, are currently
measured at 5 urban sites. Previously, a series of
measurements of strong acid aerosol had been made
by the Medical Research Council’s Air Pollution Unit
based at St Bartholomew’s Hospital between 1963
and 1972. Other measurements of particulate matter
Airborne Particulate Matter in the United Kingdom
74
Figure 6.3 DoE PM10 Particulate Matter Air Quality Network, Operational Sites (as at September 1995).
2
5 6
10 89
3
1113
15
16
1214
1
4
7
1 Edinburgh Centre 2 Newcastle Centre
3 Belfast Centre 4 Middlesbrough 5 Leeds Centre 6 Hull Centre 7 Liverpool Centre 8 Leicester Centre 9 Birmingham East
10 Birmingham Centre11 Swansea Centre12 London Bloomsbury13 Cardiff Centre14 London Bexley15 Bristol Centre16 Southhampton Centre

have been made over shorter periods at several
locations around the country.
With the increased concern about particulate matter, a
number of local authorities in the United Kingdom
have recently established monitoring sites to measure
PM10. Some of these sites are situated in roadside
locations and are beginning to provide extremely
valuable data on concentrations of particulate matter
in these locations which complement the more
extensive sets of measurements made in urban
background locations.
6.3 MEASUREMENTS AND TRENDS IN PARTICULATE MATTER
6.3.1 Black Smoke Measurements
Historically, particulate matter has been measured
using filter sampling techniques and extensive datasets
exist for specific sites back to the early part of this
century. Figure 6.4 shows the mean concentrations of
smoke measured between October and March at the
Kew Observatory between 1922/23 and 1970/71 using
the smoke stain method (Clout, 1978). The figure
shows a tenfold decline in the mean levels of smoke
over this period.
In December 1952 and again in December 1962, two
major “smog episodes” occurred in London. Hourly
measurements of smoke made at three London sites in
the 1962 episode are shown in Figure 6.5 (MAAPE,
1992). The highest recorded hourly level was
observed at the Islington site and was in excess of
6000 µg/m3. Although the levels of sulphur dioxide
recorded in the 1962 episode were comparable to
those observed in the earlier episode, the overall
concentrations of smoke were much lower. Indeed,
during the 1952 episode, many of the samplers were
overloaded. Epidemiological studies of the 1952 and
1962 smog episodes indicated that 4000 and 700
excess deaths respectively could be associated with
the elevated pollution levels present during the
episodes (see also Chapter 9).
Following these major smog episodes in London,
Clean Air Acts were introduced in 1956 and 1968.
Although these Acts had an effect on the
concentrations of smoke observed in urban
environments through the creation of smoke control
areas, other features such as the long-term shift away
from siting power stations in urban environments, the
use of fuels other than coal for space heating and
domestic cooking and the construction of taller stacks
were as significant in reducing the concentration of
smoke. Figure 6.6 illustrates the decline in smoke
concentrations observed at specific sites located in
Belfast, London (Lambeth), Stoke-on-Trent and
Norwich. Smoke concentrations fell rapidly during
the 1960s and 1970s but there has been a slower
decrease in smoke levels through the 1980s and 1990s
which may, in part, reflect the increasing emissions of
smoke from road traffic.
Coal burning areas in the UK still show some of the
highest concentrations although, as elsewhere, these
Chapter 6 : Concentrations and Trends in Particulate Matter
Quality of Urban Air Review Group 75
1922-23 40-41 55-56 1970-710
100
200
300
400
Figure 6.4 Average Smoke Levels at Kew during October-March 1922-3 to 1970-71.
Source: Clout, 1978.
Passage of Clean Air Act
Mea
n sm
oke
(µg/
m3 )
Year

Airborne Particulate Matter in the United Kingdom
76
MD MN MD MN MD MN MD MN MD
Mon Tue Wed Thurs Fri
0
1000
2000
3000
4000
5000
6000
7000
0
1000
2000
3000
4000
Figure 6.5 Hourly Smoke Concentrations in 1962 Smog Episode.
London fog, 1962. Hourly smoke concentrations at Islington, 3rd-7th December.
Sm
oke
conc
entr
atio
n µg
/m3
Sm
oke
conc
entr
atio
n µg
/m3
MD MN MD MN MD MN MD MN MD
Mon Tue Wed Thurs Fri
London fog, 1962. Hourly smoke concentrations at Lewisham, 3rd-7th December.
Islington
Lewisham
0
1000
2000
3000
4000
Sm
oke
conc
entr
atio
n µg
/m3
MD MN MD MN MD MN MD MN MD
Mon Tue Wed Thurs Fri
London fog, 1962. Hourly smoke concentrations at Westminster, 3rd-7th December.
Westminster
Source: MAAPE, 1992.
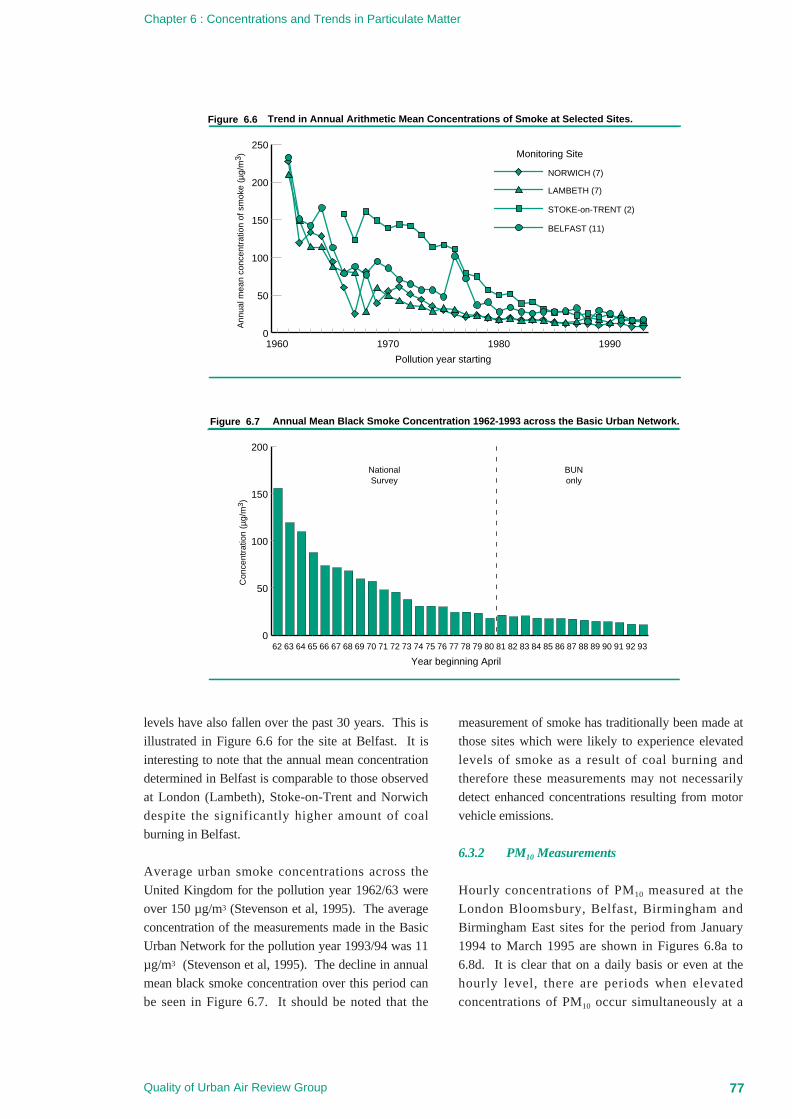
levels have also fallen over the past 30 years. This is
illustrated in Figure 6.6 for the site at Belfast. It is
interesting to note that the annual mean concentration
determined in Belfast is comparable to those observed
at London (Lambeth), Stoke-on-Trent and Norwich
despite the significantly higher amount of coal
burning in Belfast.
Average urban smoke concentrations across the
United Kingdom for the pollution year 1962/63 were
over 150 µg/m3 (Stevenson et al, 1995). The average
concentration of the measurements made in the Basic
Urban Network for the pollution year 1993/94 was 11
µg/m3 (Stevenson et al, 1995). The decline in annual
mean black smoke concentration over this period can
be seen in Figure 6.7. It should be noted that the
measurement of smoke has traditionally been made at
those sites which were likely to experience elevated
levels of smoke as a result of coal burning and
therefore these measurements may not necessarily
detect enhanced concentrations resulting from motor
vehicle emissions.
6.3.2 PM10 Measurements
Hourly concentrations of PM10 measured at the
London Bloomsbury, Belfast, Birmingham and
Birmingham East sites for the period from January
1994 to March 1995 are shown in Figures 6.8a to
6.8d. It is clear that on a daily basis or even at the
hourly level, there are periods when elevated
concentrations of PM10 occur simultaneously at a
Chapter 6 : Concentrations and Trends in Particulate Matter
Quality of Urban Air Review Group 77
0
50
100
150
200
250
NORWICH (7)
LAMBETH (7)
STOKE-on-TRENT (2)
BELFAST (11)
1990198019701960
Trend in Annual Arithmetic Mean Concentrations of Smoke at Selected Sites.
Ann
ual m
ean
conc
entr
atio
n of
sm
oke
(µg/
m3 ) Monitoring Site
Pollution year starting
Figure 6.6
0
50
100
150
200
9392919089888786858483828180797877767574737271706968676665646362
Annual Mean Black Smoke Concentration 1962-1993 across the Basic Urban Network.
Con
cent
ratio
n (µ
g/m
3 )
Year beginning April
Figure 6.7
NationalSurvey
BUNonly

number of sites (eg PM10 measurements in December
at Birmingham and London). This observation is
demonstrated graphically in Figure 6.9 which presents
the daily average levels of PM10 recorded at 9 urban
sites across the UK between April and June 1993.
There are also episodes arising from local sources
and/or local meteorological conditions. This is
particularly the case at the Belfast site where coal
burning, in the absence of natural gas, is the main
energy source for domestic heating and cooking; in
Airborne Particulate Matter in the United Kingdom
78
Figure 6.8 PM10 Time Series Plot, Hourly Averages, January 1994 - March 1995.
Jan Feb Mar Apr May Jun Jul Aug Sep Oct Nov Dec Jan Feb Mar
1994/1995
Jan Feb Mar Apr May Jun Jul Aug Sep Oct Nov Dec Jan Feb Mar
1994/1995
Jan Feb Mar Apr May Jun Jul Aug Sep Oct Nov Dec Jan Feb Mar
1994/1995
Jan Feb Mar Apr May Jun Jul Aug Sep Oct Nov Dec Jan Feb Mar
1994/1995
PM
10 (
µg/m
3)
PM
10 (
µg/m
3)
PM
10 (
µg/m
3)
PM
10 (
µg/m
3)
0
100
200
300
400
500
0
100
200
300
400
500
0
100
200
300
400
500
0
100
200
300
400
500(a) London Bloomsbury
(b) Belfast Centre
(c) Birmingham Centre
(d) Birmingham East
Note: 1994 data are ratified, 1995 data are provisional.

Chapter 6 : Concentrations and Trends in Particulate Matter
Quality of Urban Air Review Group 79
Tab
le 6
.1 -
Sum
mar
y S
tatis
tics
for
Hou
rly A
vera
ge P
M10
for
1993
and
199
4 (B
ower
et a
l, 19
95 a
nd 1
996)
.
1993
(ra
tifie
d da
ta)
1994
(ra
tifie
d da
ta)
Site
Ann
ual M
ean
98th
Per
cent
Max
. Hou
rP
eak/
Mea
nA
nnua
l Mea
n98
th P
erce
ntM
ax. H
our
Pea
k/M
ean
(µg/
m3 )
(µg/
m3 )
(µg/
m3 )
(µg/
m3 )
(µg/
m3 )
(µg/
m3 )
Bel
fast
3279
445
13.9
2666
490
18.8
Bris
tol
2764
270
10.0
2459
612
25.5
Birm
ingh
am (
Cen
tral
)26
6618
67.
223
5531
113
.5
Birm
ingh
am (
Eas
t)21
5031
915
.2
Car
diff
3476
564
16.6
Edi
nbur
gh23
4314
06.
120
4130
715
.4
Hul
l26
5626
410
.2
Leed
s27
6416
26.
026
6431
011
.9
Leic
este
r21
5020
39.
7
Live
rpoo
l25
6825
710
.3
Lond
on (
Blo
omsb
ury)
2975
140
4.8
2756
307
11.4
New
cast
le26
6029
711
.4
Sou
tham
pton
2348
291
12.7
Not
es:
(1)
En
trie
s a
re o
nly
giv
en
fo
r th
ose
site
s w
hic
h w
ere
op
era
tion
al
for
mo
re t
ha
n 9
mo
nth
s in
a g
ive
n y
ea
r.
Th
e s
ites
at
Lo
nd
on
(B
ex
ley)
, S
wa
nse
a a
nd
Mid
dles
brou
gh h
ave
not b
een
incl
uded
for
this
rea
son.
(2)
98t
h pe
rcen
tile
valu
es r
efer
to th
e 98
th p
erce
ntile
of d
aily
mea
ns.

Airborne Particulate Matter in the United Kingdom
80
1/4/932/4/933/4/934/4/935/4/936/4/937/4/938/4/939/4/93
10/4/9311/4/9312/4/9313/4/9314/4/9315/4/9316/4/9317/4/9318/4/9319/4/9320/4/9321/4/9322/4/9323/4/9324/4/9325/4/9326/4/9327/4/9328/4/9329/4/9330/4/93
1/5/932/5/933/5/934/5/935/5/936/5/937/5/938/5/939/5/93
10/5/9311/5/9312/5/9313/5/9314/5/9315/5/9316/5/9317/5/9318/5/9319/5/9320/5/9321/5/9322/5/9323/5/9324/5/9325/5/9326/5/9327/5/9328/5/9329/5/9330/5/9331/5/93
1/6/932/6/933/6/934/6/935/6/936/6/937/6/938/6/939/6/93
10/6/9311/6/9312/6/9313/6/9314/6/9315/6/9316/6/9317/6/9318/6/9319/6/9320/6/9321/6/9322/6/9323/6/9324/6/9325/6/9326/6/9327/6/9328/6/9329/6/9330/6/93
Figure 6.9 Daily Average PM 10 Data, April - June 1993 at Nine Urban Sites.
no data0-15 µg/m3
16-30 µg/m3
31-45 µg/m3
46-60 µg/m3
61-75 µg/m3
over 75 µg/m3
Date Day A B C D E F G H I
A - London BloomsburyB - Edinburgh CentreC - Cardiff CentreD - Belfast CentreE - Birmingham CentreF - Newcastle CentreG - Leeds CentreH - Bristol CentreI - Liverpool Centre
Note: Day 1 = Sunday
5671234567123456712345671234567123456712345671234567123456712345671234567123456712345671234
212220171923364231201921496274311712202718182219183833396575812223272722292830475555473121203326222025254055423716252325192634344638503359
100551914312326242420161921372534303024
2236208
112226
374038373718221114121611182221222332304320111922192228181831332115111511171931223228364128222125241520181427292422233046333923211825172214181216131917201617284224
1728141737381515201712163370652512162643232017202157456170
539
143623191821284957655322181624212018261427423622232918202330233731404237417539252126163517261626191921272925252337
3233161720353216232233304173462337132821232329243640704958
171823365138553535625843341818142126317828172758433829312126203337373130272121
107862931272422182016138
13132721271321268221
26171412151925
26182113446264188
121917141612202062815566
102341515272820232633515748521411121816213018193044392726201813172035503834382538795324183314
1717121414
2440401416223942342542444845492529133323142223312535334251653515142427273224244245372818171530314127433133403231304029151236353743242425457949633325193315
916222222281619345047
192833192020344131
412050
3842
14
40
294233131428
1625
30
121625373226
50452326163313241617
1318
15301715
2331242514223462
1113241748375064754513193024211820244753575315151623221918192226393823202328
364241244661372018311125141913171518192425222021383341
2721329340487018107
183535362424383942741712142722221718222945

Cardiff, where the monitoring site was affected by
building development in the vicinity between March
and October 1994 and at the Newcastle site which was
unduly influenced by local sources and was re-located
in June 1994 to give more representative
measurements of an urban background site.
As shown in Table 6.1, the annual mean
concentrations of PM10 are relatively uniform across
the country, lying between 20-34 µg/m3. From these
data, there is a slight tendency for mean
concentrations to be larger in regions with large traffic
densities (eg London) or significant domestic coal
burning (eg Belfast). The mean NOx (nitrogen oxides)
concentrations show a similar variation at these sites
and the PM10/NOx ratio is relatively constant except at
Belfast and Cardiff where the PM10 concentrations are
relatively large. (See also Chapter 4).
In comparison with many of the influences described
in the sections above, the influences of weather
conditions tend to be more subtle. The passage of
large scale weather systems causes day-by-day
variations in most pollutants, PM10 included. If these
weather systems are large enough and intense enough,
then PM10 concentrations at several sites can
apparently change simultaneously or with time lags of
a few hours or less. Such events tend to be infrequent
though and much of the variation in urban PM10
concentrations is driven by local variations in
emissions and strong correlations are found with other
urban pollutants.
A detailed study has been conducted of the
correlations between the hourly PM10 concentrations
measured at the AUN site in Edinburgh and the
weather data for Edinburgh Airport for 1994. The
analysis is summarised in Table 6.2, for the following
hourly weather parameters:
• windspeed in knots,
• temperature in oC,
• rain in the last hour in 0.1 mm,
• sunshine intensity in W/m2.
The analysis clearly shows that the correlations
between PM10 and weather parameters tend to be
weak and intensely seasonal. In the wintertime, PM10
concentrations appear inversely related to the
Chapter 6 : Concentrations and Trends in Particulate Matter
Quality of Urban Air Review Group 81
Table 6.2. An Analysis of the Correlations between Hourly PM10 Levels Measured at the AUN site in Edinburgh and the Weather Data forEdinburgh Airport for all Months in 1994.
Month Linear Regression SlopesWindspeed Temperature Rain during the last Sunshine Intensity
(knots) (Degrees C) hour, 0.1 mm (W/m2)January -0.403* -0.789* -0.099 0.0054
February -0.406 -0.411 -0.114 0.0174
March 0.010 0.346 -0.289* 0.0169*
April -0.011 0.256 0.036 0.0111*
May 0.566* 0.954* 0.222 0.0070
June 0.281 0.931* 0.110 0.0200*
July -0.517 1.005* 0.221** 0.0078
August 0.160 0.852* 0.201 0.0168*
September -0.278 0.588 -0.054 0.0050
October -0.724* 0.810 -0.111 0.0035
November -0.432 -0.555 -0.329* 0.0013
December -0.942** -0.766* -0.104 0.0027
Notes:
* indicates a regression correlation coefficient, R > 0.2, n<744.
** indicates R>0.4, n<744.
Based on provisional data

Airborne Particulate Matter in the United Kingdom
82
windspeed. The greater the windspeed the lower the
urban PM10 concentrations due to the effects of
dilution and ventilation. In the summertime, this trend
reverses and PM10 concentrations tend to increase with
windspeed. There are two likely explanations for this
phenomenon. The first is that wind-driven
resuspension of surface dusts is greater in the dryer
summer months. Secondly, at this coastal location,
brisk sea breezes are common in the warmer hours of
the day when traffic emissions of PM10 are highest..
Correlations with temperature show a similar seasonal
turn-over from a wintertime inverse relationship to a
summertime dependence. Winter days with strong
PM10 concentration build-up tend to be those with
colder mornings. During the summertime, PM10
concentrations build up during the day due to traffic
activity and secondary particle formation takes place
as temperatures rise giving an apparent association.
Rainfall could in principle exert a variety of impacts
on PM10 concentrations. However, the Edinburgh data
show that PM10 is inversely correlated with rainfall in
the last hour during wintertime and positively
correlated during summertime. In the wintertime,
rainfall is associated with the passage of frontal
systems with increased windspeeds and the general
conditions under which urban pollutant build-up is not
anticipated. Hence there appears to be a negative
correlation between rain in the last hour and PM10
levels. In the summertime, rain tends to be more
infrequent, more intense and has the potential to
resuspend more material from the earth’s surface
when it falls.
Correlations of PM10 concentrations with sunshine
intensity examine the relative diurnal profiles of PM10
and sunshine. As the mean diurnal curve of PM10
adjusts with season to reflect the changing balance of
primary and secondary sources, then its correlation
with sunshine hours alters. It is best in summer
months when secondary paricles play a major role.
This effect is illustrated in Table 6.2.
The cumulative distribution frequency of the PM10
concentrations observed at four of the sites operational
in 1994 indicate that although there appears to be a
degree of uniformity in the mean PM10 concentrations,
differences are apparent when higher percentiles are
considered as shown in Figures 6.10a to 6.10d. This
reflects the impact that local sources or conditions can
have on PM10 concentrations.
Further analysis and discussion on the PM10
measurements is given in subsequent sections of this
and other Chapters in this report.
6.3.3 PM2.5 Measurements
Although particulate matter is measured as PM10 at the
national automatic monitoring sites, there is also an
on-going measurement programme being undertaken
at Hodge Hill in Birmingham by the City Council.
The concentrations of PM2.5, PM10 and black smoke
are simultaneously being determined using two
TEOM instruments with appropriate inlets and the
smoke stain method respectively. The measurement
site is about 70 metres south of an elevated section of
the M6 motorway and the measurements have been
made since October 1994. The data for the period
from January to June 1995 indicate that the daily
averages of PM2.5, PM10 and black smoke lie between
2-60 µg/m3, 4-76 µg/m3 and 1-41 µg/m3 respectively,
as shown in Table 6.3 (Appleby, 1995). The
concentrations of PM2.5 are always lower than those of
PM10, varying between 28 to 100% with an average
value of 60%. The variation appears to be weather
dependent. (See also Chapter 8).
6.3.4 Strong Acid Aerosol Measurements
Strong acid aerosol was measured on a daily basis in
London between 1963 and 1972 by the MRC Air
Pollution Unit based at St Bartholomew’s Hospital.
Earlier measurements (from 1957) had only been
made during pollution episodes. Samples were
collected on filter paper and the total acidity
determined by back titration following the addition of
sodium tetraborate. The acidity was assumed to be
solely due to sulphuric acid. Table 6.4 gives a
summary of the measurements made during this
period (MAAPE, 1992). The highest daily mean level
of H2SO4 recorded was 134.1 µg/m3 in 1964 which
can be compared with the highest daily and hourly
levels of 347 and 678 µg/m3 respectively which were
recorded during the December 1962 episode. The

table shows that between 1964 and 1972 H2SO4
concentrations fell by more than 50%.
Sulphuric acid concentrations showed a smaller winter
to summer ratio than those observed for sulphur
dioxide and other primary pollutants. The ratio
indicated that there was a significant source in the
summer and two distinct production mechanisms were
identified. The photochemical nature of one of the
production mechanisms was clearly illustrated by the
strong correlation observed between total particulate
sulphate and ozone measurements made in central
London during a photochemical episode in June 1989.
(MAAPE, 1992).
Concentrations of sulphuric acid tend to be lower in
rural areas but are harder to interpret reliably because
of the interference from ammonia to form ammonium
sulphate either in the atmosphere or during sampling
and subsequent analysis. One of the few direct
Chapter 6 : Concentrations and Trends in Particulate Matter
Quality of Urban Air Review Group 83
1 2 5 2010 50 80 90 95 98 991
10
100
1000
Figure 6.10c Birmingham Centre PM10 Cumulative Frequency Distribution Plot (Hourly Averages).
1994Summer 94Winter 94/95
PM
10 (
µg/m
3 )
Percentile1 2 5 2010 50 80 90 95 98 99
1
10
100
1000
Figure 6.10d Birmingham East PM10 Cumulative Frequency Distribution Plot (Hourly Averages).
1994Summer 94Winter 94/95
PM
10 (
µg/m
3 )
Percentile
1 2 5 2010 50 80 90 95 98 991
10
100
1000
Figure 6.10a London Bloomsbury PM10 Cumulative Frequency Distribution Plot (Hourly Averages).
1994Summer 94Winter 94/95
PM
10 (
µg/m
3 )
Percentile1 2 5 2010 50 80 90 95 98 99
1
10
100
1000
Figure 6.10b Belfast Centre PM10 Cumulative Frequency Distribution Plot (Hourly Averages).
1994Summer 94Winter 94/95
PM
10 (
µg/m
3 )
Percentile

measurements was when simultaneous measurements
were made at 3 sites in Essex over 33 days between
1987 to 1989 (Kitto and Harrison, 1992). The
measurements gave mean H+ ion concentrations
between 11.5 to 28.7 neq/m3, equivalent to 0.6-1.4
µg/m3 of H2SO4. Approximate H+ ion concentrations
have also been inferred from the extended series of
measurements of sulphate, nitrate and ammonium
made at Harwell assuming ionic balance (i.e. H+ =
(SO42- + NO3
-) - NH4+ in equivalence units)
(MAAPE, 1992; Lee and Derwent, 1995). A simple
regression analysis suggested a downward trend in the
H2SO4 concentration with absolute concentrations in
1991 between 3-5 µg/m3. The Harwell measurements
are discussed further in section 6.3.6. Although the
concentrations observed in Essex were lower than
those inferred from the Harwell dataset, this is
consistent with the higher NH3 concentrations
expected in Essex.
6.3.5 Other Urban Measurements of ParticulateMatter
As part of the London Air Quality Network run on
behalf of London Boroughs by the South East
Institute of Public Health, TEOM instruments have
been set up to measure PM10 concentrations at a
number of sites across London: Bexley, Greenwich,
Haringey, Kensington and Chelsea, Sutton, Tower
Hamlets and Thurrock. The site at Bexley is an
affiliated site in the national urban network although
particulate matter was measured as total suspended
particulate prior to affiliation. Data for the sites
operational in 1994 (at Bexley, Greenwich and Tower
Airborne Particulate Matter in the United Kingdom
84
Table 6.3 Comparison of Monthly Average Measurements of Black Smoke, PM2.5 and PM10 made at Birmingham, Hodge Hill for Januaryto June 1995 (Appleby, 1995).
Month Average Monthly Value Ratio*Smoke PM2.5 PM10 Smoke:PM2.5 Smoke:PM10 PM2.5:PM10
(µg/m3) (µg/m3) (µg/m3)January 9 11 15 0.80 0.56 0.70
February 4 11 17 0.31 0.21 0.64
March 7 12 22 0.48 0.29 0.60
April 5 15 28 0.34 0.19 0.57
May 6 15 26 0.38 0.20 0.56
June 6 11 24 0.59 0.27 0.48
Minimum Daily Value 1 3 4 0.07 0.04 0.3
Maximum Daily Value 41 43 66 1.72 1.45 1.0
Mean Value 6 13 22 0.48 0.29 0.60
* Mean value of ratios determined for each day in that month,
Table 6.4 Historical London Daily Acid Aerosol Concentration (µg/m3 of total H+ as H2SO4) (MAAPE, 1992).
Year Annual Winter*Mean S.D. Max. Mean S.D. Max.
1964 6.8 9.6 134.1 10.4 15.5 134.1
1965 5.1 3.4 26.3 7.3 5.0 42.2
1966 4.6 3.2 24.3 7.5 4.1 24.3
1967 4.1 2.9 20.2 5.2 2.7 22.5
1968 4.5 2.9 25.3 7.6 3.9 25.3
1969 4.3 3.0 19.0 6.0 3.2 17.0
1970 3.0 2.5 18.2 4.8 2.9 19.0
1971 3.2 2.7 29.7 3.3 3.7 29.7
1972 3.2 2.7 22.9 4.5 2.4 13.7
(*) The winter period is from 1st November of the preceding year to 28th or 29th February of the year shown.

Hamlets) are summarised in Table 6.5. The annual
mean concentrations of 25, 21 and 26 µg/m3 recorded
respectively at the three sites are comparable to the
PM10 concentrations observed at the urban background
sites in the national urban monitoring network.
Two of the sites in the network at Haringey and Sutton
are situated in roadside locations. The measurements
made at these sites and also at Thurrock for the period
from January to June 1995 are presented in Figure
6.11 and are compared in the same Figure with the
measurements made at the national sites at London
Bexley and Bloomsbury over the same period. The
mean and maximum hourly concentrations recorded at
certain of these sites between January and June 1995
are given in Table 6.6. The Sutton site only became
operational in June 1995. The concentrations
observed at the roadside sites are thus far comparable
to those measured at the urban background sites
during this period.
Other roadside measurements have clearly
demonstrated an elevation in PM10 concentration close
to road traffic. Figure 6.12 shows a time series of
PM10 measurements made by Westminster City
Council at Marylebone Road and Oxford Street in
Chapter 6 : Concentrations and Trends in Particulate Matter
Quality of Urban Air Review Group 85
Table 6.5 1994 Statistics for PM10 from the Sites in the London Air Quality Network.
Site Bexley Greenwich Tower HamletsSite Type SB SB UBNumber of Days Operational 197 321 340
Number of Days on which dailymean levels of PM10 (µg/m3) exceeded
10 188 302 329
20 116 144 194
30 59 51 96
40 33 18 47
50 8 4 12
60 2 4 5
70 1 2 4
80 0 1 1
90 0 0 0
100 0 0 0
Annual Mean Concentration (µg/m3) 25 21 26
Notes: SB - suburban background; UB - urban background. Data from Greenwich and Tower Hamlets are
provisional
Table 6.6 Provisional Statistics for PM10 from the Roadside Sites in the London Air Quality Network and the National Automatic UrbanMonitoring Sites in London for January to June 1995.
Site London London Haringey ThurrockBloomsbury Bexley
Site Type UB SB R UBAverage PM10
Concentration (µg/m3) 26 22 22 24
Maximum Hourly PM 10
Concentration (µg/m3) 249 173 130 108
Number of Days on whichDaily Mean Level of 9 8 6 5
PM10 ≥ 50 µg/m3
Data Capture % 96 97 91 51
Notes: (1) Site types: R - roadside; SB - suburban background; UB - urban background.
(2) The Thurrock site became operational in March 1995.

Central London using TEOM instruments, compared
with the AUN site at London, Bloomsbury. The
highest concentration over the period monitored was
at the Oxford Street site (mean = 52 µg/m3), compared
with 36 µg/m3 at Marylebone Road and 29 µg/m3 at
Bloomsbury. Oxford Street is notable for being
restricted to buses and taxis only. Marylebone Road
appears similar to Bloomsbury for the period 21st July
to 1st September, when traffic is reduced due to
summer holidays. In September and October it shows
Airborne Particulate Matter in the United Kingdom
86
Figure 6.11 Roadside PM10 Data from London Compared to Urban Background PM10 Measurements.
0
300
0
300
0
300
0
300
0
300
Jan Feb Mar Apr May Jun
Jan Feb Mar Apr May Jun
Jan Feb Mar Apr May Jun
Jan Feb Mar Apr May Jun
Jan Feb Mar Apr May Jun
PM
10 (
µg/m
3 )P
M10
(µg
/m3 )
PM
10 (
µg/m
3 )P
M10
(µg
/m3 )
PM
10 (
µg/m
3 )
London Bloomsbury (UB)
Bexley (UB)
Haringey (R)
Thurrock (UB)
Sutton (R)
Note: UB = Urban Background R = Roadside Data for roadside stations provided by SEIPH Data for London Bloomsbury and Bexley are provisional.

a clear elevation, typically by 10-20 µg/m3 above
concentrations at the Bloomsbury site.
Eight-hourly daytime measurements of PM10 have
also been made on the busy A38 road in Birmingham,
and compared with data collected simultaneously
from the urban background AUN site at Birmingham,
Centre. The data (Figure 6.13) show a clear elevation
at the roadside site (mean = 45.5 µg/m3) over the
background site (mean = 25.4 µg/m3) consistent with
that observed for Marylebone Road and Oxford Street
in London.
The former London Scientific Services measured
concentrations of airborne particulate matter at four
sites in London using M-type samplers, with
subsequent gravimetric analysis of the particulate
matter (QUARG, 1993a). This sampler has a particle
size cut-off of approximately 10 to 15 µm (see
Chapter 3) and, depending on the wind speed may
Chapter 6 : Concentrations and Trends in Particulate Matter
Quality of Urban Air Review Group 87
Hourly-mean Concentrations of PM10 at Roadside and Urban Background Sites in London, July to October 1995.
PM
10 c
once
ntra
tion
(µg/
m3 )
Date
Figure 6.12
0
20
40
60
80
100Bloomsbury
Marylebone Road
Oxford Street
21 Jul 95 01 Aug 95 01 Sep 95 01 Oct 9510 Oct 95
Source: Westminster City Council, 1995.
Eight-hourly Concentrations of PM10 at Roadside and Background Sites in Birmingham.
PM
10 (µ
g/m
3 )
Date (September 1994)
Figure 6.13
0
20
40
60
80
100Birmingham City Centre (mean = 25.4)
A38 near University (mean = 45.5)
302928272623222120161514137
Source: Jones and Harrison, 1995.

therefore tend to under or overestimate PM10
concentrations. The samplers were located at three
background and one roadside site. The measurements
made are summarised in Figure 6.14. The levels
measured at the roadside were 2.5 to 3 times higher
than those at the background locations, indicating the
importance of road traffic as a source of particulate
matter. The apparent downward trend for the
Airborne Particulate Matter in the United Kingdom
88
80 82 84 86 88 90 92 94 960
20
40
60
80
100
120
140
Figure 6.15 Trends in Weekly-mean Suspended Particle Concentrations, Manchester 1980-93.
Par
ticle
mas
s (µ
g/m
3 )
Source: Miller and Lewis, 1996.
Year
1986 1987 1988
Year
19890
20
40
60
80
100
120
Figure 6.14 Annual Mean Concentrations of Suspended Particles at Four Sites in London (1986-1989).
West London
Par
ticul
ates
(µg
/m3)
Central London (background)
East London
Central London (roadside)
Source: LSS, 1989.

background locations was believed to be real as other
pollutants measured at these sites did not show any
significant trend over the period.
An extended series of measurements of suspended
particulate matter using M-type samplers was made at
Piccadilly Gardens in central Manchester between
1980 and 1993 (Miller and Lewis, 1996). The
measurements showed a very strong seasonal
behaviour. The dataset was corrected for the seasonal
effect and an underlying decline in particulate matter
of about 1 µg/m3 per year was observed (Figure 6.15).
During 1987 and 1988, a series of measurements was
made using an 8-stage Andersen cascade impactor. A
pre-separator was used to remove particles with sizes
greater than 13.5 µm. The highest concentration was
observed for the size range of less than 2 µm with a
median value of 1.2 µ m. Unfortunately these
measurements were not repeated to identify trends in
the size distribution.
The national multi-element survey has also shown that
the concentration of a range of elements, averaged
over the 5 monitoring sites, has fallen considerably
over the 17 years of operation of the survey (Loader,
1994).
6.3.6 Rural Measurements of Particulate Matter
Black smoke measurements were made at a number of
rural locations as part of the smoke and sulphur
dioxide network until 1991. Figure 6.16 shows the
annual mean concentrations of black smoke recorded
at 4 sites in the network: Caenby, Husborne Crawley,
Ratcliffe and Camborne. Although the decline in
smoke levels was not as dramatic as those observed at
urban sites, there has still been a fivefold reduction
between the early 1960s and 1991. The annual mean
concentrations recorded in 1990 at the Caenby,
Husborne Crawley, Ratcliffe and Camborne sites were
7, 8, 11 and 3 µg/m3 respectively. The values at the
urban sites in Belfast, Stoke-on-Trent, Lambeth and
Norwich were 17, 19, 25 and 12 µg/m3 respectively.
The ratio of urban to rural smoke levels has fallen
substantially over this period so that urban levels are
now closer to those recorded at rural sites.
A campaign to measure particulate matter
concentrations in rural areas was undertaken by TBV
Science over a three month period between July and
September 1994. Sampling was carried out at 6 sites
in the rural West Midlands area using M-type
samplers. The average concentrations recorded over
this period at the different sites were found to lie
between 11 and 20 µg/m3.
A study has recently been undertaken to compare
concentrations of PM10 at a rural site near Bristol,
Chew Lake, with those observed at the national
monitoring sites at Bristol and Cardiff (International
Mining Consultants Limited, 1995). The monitoring
site was chosen to be representative of rural
background concentrations and was therefore sited
away from any major industrial or local pollution
sources. PM10 measurements were made using a
TEOM instrument for one month between 24 January
and 21 February 1995. Figure 6.17 shows the 30
minute mean PM10 measurements made at Chew
Lake, Bristol and Cardiff during this period. Although
there are periods when concentrations of PM10 were
elevated at the urban sites, these are not apparent in
the rural measurements. The rural concentrations
were generally low primarily as a result of the wind
blowing mainly from the west during the
measurement period. The mean concentration of
PM10 measured during this period was 14 µg/m3 at
Chew Lake, 20 µg/m3 for the Bristol site and 23 µg/m3
at the Cardiff site. Further analysis of the
measurements led the authors of the study to conclude
that rural particulate matter consists of several
different components and ashing of representative
samples indicated that the component attributable to
vehicle exhaust was no greater than 30%. These
conclusions are tentative given the limited monitoring
period of the study.
There are various other networks from which data on
particular chemical constituents in particulate matter
(e.g. Na+, Ca2+, Mg2+, NH4+, Cl-, SO4
2- and NO3-) are
available. These data can be used to infer the total
particle mass. None of these measurements have used
inlets designed to sample a defined size fraction.
However, like the M-type sampler, the methods used
tend not to sample large particles efficiently.
Chapter 6 : Concentrations and Trends in Particulate Matter
Quality of Urban Air Review Group 89

At Chilton (SU 472854) in Oxfordshire,
measurements of particulate sulphate, nitrate and
ammonium have been carried out using a filter
sampler since 1954 as shown in Figure 6.18 (Lee and
Derwent, 1995). Between 1954 and 1975 the mean
concentration of particulate sulphate increased from
around 6 µg/m3 to 8 µg/m3 while that of particulate
nitrate increased from 1.5 µg/m3 to 4.5 µg/m3. By the
1990s, the mean concentration of particulate sulphate
had decreased to 4 µg/m3 and that of particulate nitrate
had increased to 5 µ g/m3. The total mass of
ammonium nitrate and ammonium sulphate present at
this site can be calculated if it assumed that the
counter cation for the nitrate and sulphate is only
ammonium. This suggests that the present
concentration is approximately 12 µg/m3 which has
fallen from a value of 16 µg/m3 in the mid 1970s.
Airborne Particulate Matter in the United Kingdom
90
Figure 6.17 30 Minute Mean PM10 Concentrations at Chew Lake compared with Bristol and Cardiff.
PM
10 C
once
ntra
tion
(µg/
m3 )
Date (1995)
150
-50
0
50
100
24 Jan 21 Feb14 Feb07 Feb31 Jan
Chew Lake (14)
Bristol AUN (20)
Cardiff AUN (23)
Note: Data for Bristol and Cardiff are provisional.
0
10
20
30
40
50
60
Camborne (1)
Ratcliffe (13)
Husborne Crawley (1)
Caenby (1)
1990198519801975197019651960
Annual Arithmetic Mean Concentrations of Smoke at Rural Sites.
Ann
ual m
ean
conc
entr
atio
n of
sm
oke
(µg/
m3 ) Monitoring Site
Pollution year starting
Figure 6.16

Chapter 6 : Concentrations and Trends in Particulate Matter
Quality of Urban Air Review Group 91
Figure 6.18 Chilton Time Series Measurements of SO42-, NO3
-, NH4+ and Inferred H+.
Infe
rred
con
cent
ratio
n of
hy
drog
en io
ns (
µeq/
m3 )
Year
1950 1970 1980 1990 20000
0.1
0.2
0.3
Mea
sure
d co
ncen
trat
ion
of a
mm
oniu
m(µ
g/m
3 )
Mea
sure
d co
ncen
trat
ion
of n
itrat
e(µ
g/m
3 )M
easu
red
conc
entr
atio
n of
sul
phat
e(µ
g/m
3 )
1960 1970 1980 1990 20000
2
4
6
8
10
1960 1970 1980 1990 20000
10
20
30
1960 1970 1980 1990 20000
10
20
30
Note: Sampling durations are not constant throughout the programme.
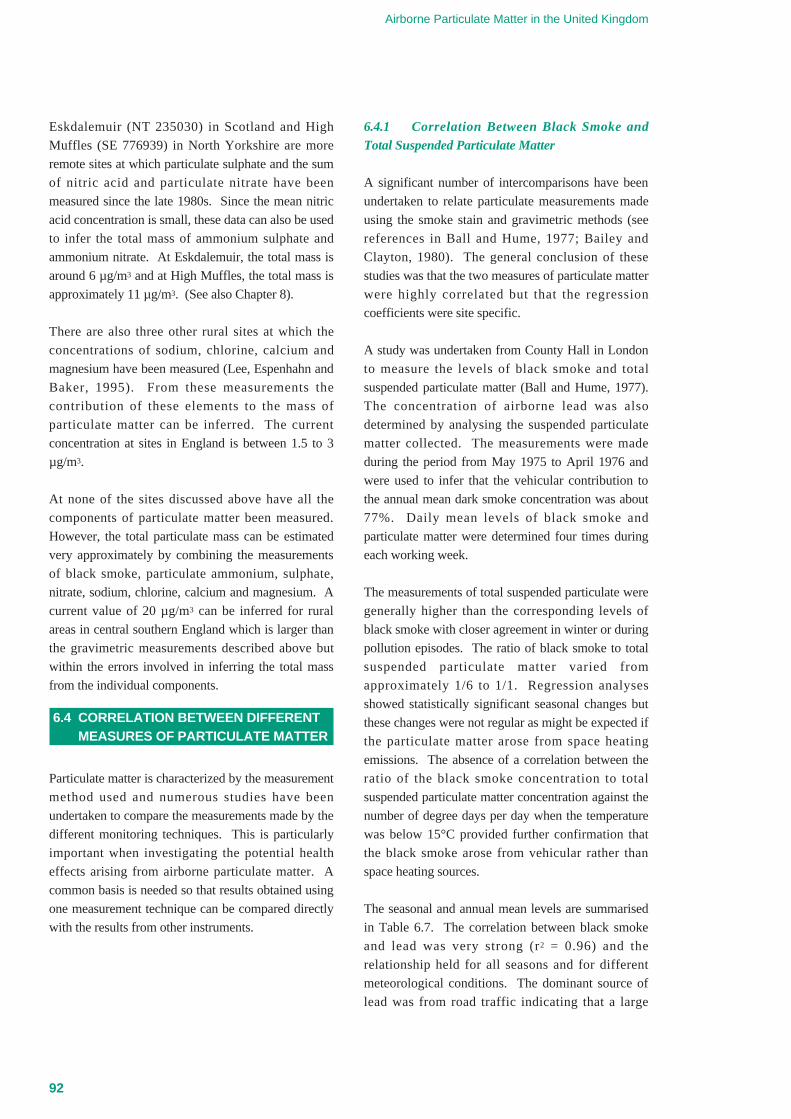
Eskdalemuir (NT 235030) in Scotland and High
Muffles (SE 776939) in North Yorkshire are more
remote sites at which particulate sulphate and the sum
of nitric acid and particulate nitrate have been
measured since the late 1980s. Since the mean nitric
acid concentration is small, these data can also be used
to infer the total mass of ammonium sulphate and
ammonium nitrate. At Eskdalemuir, the total mass is
around 6 µg/m3 and at High Muffles, the total mass is
approximately 11 µg/m3. (See also Chapter 8).
There are also three other rural sites at which the
concentrations of sodium, chlorine, calcium and
magnesium have been measured (Lee, Espenhahn and
Baker, 1995). From these measurements the
contribution of these elements to the mass of
particulate matter can be inferred. The current
concentration at sites in England is between 1.5 to 3
µg/m3.
At none of the sites discussed above have all the
components of particulate matter been measured.
However, the total particulate mass can be estimated
very approximately by combining the measurements
of black smoke, particulate ammonium, sulphate,
nitrate, sodium, chlorine, calcium and magnesium. A
current value of 20 µg/m3 can be inferred for rural
areas in central southern England which is larger than
the gravimetric measurements described above but
within the errors involved in inferring the total mass
from the individual components.
6.4 CORRELATION BETWEEN DIFFERENT MEASURES OF PARTICULATE MATTER
Particulate matter is characterized by the measurement
method used and numerous studies have been
undertaken to compare the measurements made by the
different monitoring techniques. This is particularly
important when investigating the potential health
effects arising from airborne particulate matter. A
common basis is needed so that results obtained using
one measurement technique can be compared directly
with the results from other instruments.
6.4.1 Correlation Between Black Smoke andTotal Suspended Particulate Matter
A significant number of intercomparisons have been
undertaken to relate particulate measurements made
using the smoke stain and gravimetric methods (see
references in Ball and Hume, 1977; Bailey and
Clayton, 1980). The general conclusion of these
studies was that the two measures of particulate matter
were highly correlated but that the regression
coefficients were site specific.
A study was undertaken from County Hall in London
to measure the levels of black smoke and total
suspended particulate matter (Ball and Hume, 1977).
The concentration of airborne lead was also
determined by analysing the suspended particulate
matter collected. The measurements were made
during the period from May 1975 to April 1976 and
were used to infer that the vehicular contribution to
the annual mean dark smoke concentration was about
77%. Daily mean levels of black smoke and
particulate matter were determined four times during
each working week.
The measurements of total suspended particulate were
generally higher than the corresponding levels of
black smoke with closer agreement in winter or during
pollution episodes. The ratio of black smoke to total
suspended particulate matter varied from
approximately 1/6 to 1/1. Regression analyses
showed statistically significant seasonal changes but
these changes were not regular as might be expected if
the particulate matter arose from space heating
emissions. The absence of a correlation between the
ratio of the black smoke concentration to total
suspended particulate matter concentration against the
number of degree days per day when the temperature
was below 15°C provided further confirmation that
the black smoke arose from vehicular rather than
space heating sources.
The seasonal and annual mean levels are summarised
in Table 6.7. The correlation between black smoke
and lead was very strong (r2 = 0.96) and the
relationship held for all seasons and for different
meteorological conditions. The dominant source of
lead was from road traffic indicating that a large
Airborne Particulate Matter in the United Kingdom
92

fraction of the black smoke also arose from road
traffic emissions.
6.4.2 Correlation Between PM10 and BlackSmoke
A number of studies have recently been undertaken to
investigate the correlation between the concentrations
of PM10 and black smoke to see whether the more
extensive database available and the on-going
measurement programmes of black smoke could be
used to infer PM10 concentrations.
PM10 concentrations at the automatic monitoring sites
operational in the pollution year 1992/93 were
compared with black smoke recorded at the nearest
smoke and sulphur dioxide network site. The
regression analysis of the daily mean concentrations
of PM10 and black smoke indicated that the correlation
is no stronger than that observed for PM10 with other
pollutants, as shown in Table 6.8. The correlation
between daily mean PM10 and black smoke is however
stronger in the winter than in the summer, indicating
the larger contribution of motor-vehicle derived PM10
Chapter 6 : Concentrations and Trends in Particulate Matter
Quality of Urban Air Review Group 93
Table 6.8 Correlations Between PM10 and Other Pollutants Including Black Smoke. Daily Averages for Pollution Year 1992/93.
Site Period Ozone NOx NO NO2 CO SO2 SO2 by BlackNet Acidity Smoke
MethodLondon summer 92 0.25 0.68 0.45 0.88 0.45 0.73 0.58 # 0.68 #
(2.3 km) winter 92/93 -0.25 0.71 0.71 0.59 0.56 0.62 0.59 0.79#
year 92/93 0.08 0.59 0.52 0.73 0.49 0.62 0.58 0.69 #
Edinburgh summer 92 - - - - - - - -
(0.4 km) winter 92/93 -0.53 0.67 0.66 0.62 0.61 0.62 0.32 0.46 #
year 92/93 -0.53 # 0.68 # 0.68 # 0.65 # 0.61 # 0.62 # 0.32 # 0.46 #
Cardiff summer 92 0.09 # 0.36 0.26 0.44 0.40 0.42 0.24 0.70
(1.2 km) winter 92/93 -0.34 0.57 0.56 0.46 0.40 0.54 0.27 0.42 #
year 92/93 -0.25 0.58 0.56 0.48 0.45 0.56 0.15 0.53 #
Belfast summer 92 -0.20 0.71 0.59 0.68 0.57 0.65 0.34 0.34
(0.3 km) winter 92/93 -0.42 0.87 0.88 0.69 0.90 0.86 0.63 0.73 #
year 92/93 -0.40 0.85 0.84 0.65 0.85 0.85 0.64 0.71 #
Birmingham summer 92 -0.08 0.74 0.61 0.82 0.63 0.71 0.66 0.69 #
(5.5 km) winter 92/93 -0.42 0.58 # 0.88 0.65 # 0.88 0.87 0.73 0.90 #year 92/93 -0.23 0.70 # 0.76 0.78 # 0.74 0.79 0.69 0.74 #
Newcastle summer 92 -0.11 0.59 0.46 0.77 0.57 0.51 0.25 0.54 #
(0.1 km) winter 92/93 -0.56 0.76 0.70 0.78 0.56 0.61 0.43 0.77 #year 92/93 -0.33 0.64 0.56 0.75 0.55 0.55 0.34 0.63 #
Notes (1) Black Smoke from national survey sites; (2) The distances between the PM10 and black smoke sites are
given beneath the site name; (3) Numbers are highlighted where the correlation is greater than 0.75; (4) # indicates
that the data capture rate is less than 50%.
Table 6.7 Seasonal and Annual Mean Concentrations of BlackSmoke, Total Suspended Particulate Matter and Airborne Lead(in µg/m3) as Measured at County Hall, London (Ball and Hume,1977).
Period Black TSP AirborneSmoke Lead
Summer 30 77 0.50
Winter 59 108 1.06
Annual 45 93 0.78

Airborne Particulate Matter in the United Kingdom
94
-40
-20
0
20
40
60
Figure 6.19b Daily-average (PM10 - Black Smoke) at Bloomsbury AUN Site, April 1994 to March 1995.
Month
Con
cent
ratio
n (µ
g/m
3 )
Apr
May Jun
Jul
Aug Oct
Nov
Dec
Jan
Feb
Sep
Mar
Note: Data for 1995 are provisional.
0
20
40
60
80
100
120
PM10 Daily Average
BS Daily Average
Figure 6.19a Daily-average PM10 and Black Smoke at Bloomsbury AUN site, April 1994 to March 1995.
Con
cent
ratio
n (µ
g/m
3 )
Month
Apr
May Jun
Jul
Aug Oct
Nov
Dec
Jan
Feb
Sep
Mar

in the winter and the contribution of secondary PM10
to the summer concentrations.
This work has been extended by measuring PM10 and
black smoke concentrations at 3 co-located sites in
Belfast (Centre), Birmingham (Centre) and London
(Bloomsbury) between April 1994 and March 1995
(Loader, 1995). The results indicate that the 24-hour
average PM10 concentrations are generally higher than
those of black smoke and the two pollutants generally
rise and fall together as shown in Figure 6.19a for the
London Bloomsbury site. A plot of the difference
between PM10 and black smoke shows a seasonal
variation (Figure 6.19b). PM10 concentrations are
systematically higher in the summer with comparable
concentrations of both pollutants in the wintertime,
and occasionally episodes when the black smoke
exceeds the PM10. Analysis of the data indicates that
the two pollutants are correlated. The correlation was
again stronger for the wintertime period than for the
summertime at all sites but the regression coefficients,
given in Table 6.9, show significant variation from
site to site. These results are consistent with a larger
fraction of the particulate matter in the summertime
being of secondary origin with different optical
properties (since it contains a greater proportion of
lighter coloured material) than the particulate matter
generated in the wintertime, which is more likely to
arise from road traffic. The differences between sites
reflect the contributions of the various sources to the
observed concentrations of particulate matter. This is
not surprising given the nature of the emission sources
present in these cities. Further work is needed to
determine whether the relationships identified so far
hold for other urban environments with similar
emission patterns.
Similar conclusions were reached when PM10
measurements made at the national monitoring site in
Bristol were compared with average concentrations of
black smoke measurements made at 6 other sites in
the Bristol conurbation during 1993 (Muir and Laxen,
1995). The study again found a strong seasonal effect
on the relationship between PM10 and black smoke.
PM10 concentrations were generally higher than those
of black smoke. A regression analysis of the daily
mean PM10 on black smoke gave a slope of 3.7 for the
summertime data and 2.0 for the wintertime data.
Black smoke concentrations increased in wintertime
and these changes were not apparent in the PM10
record. The study concluded that the black smoke
measurements referred to a different sub-set of the
airborne particulate matter to that being sampled by
the TEOM instruments.
6.5 BEHAVIOUR OF PARTICULATE MATTERCONCENTRATIONS
6.5.1 Correlation With Other Pollutants
In the first QUARG report (QUARG, 1993a), a
regression analysis of the PM10 and carbon monoxide
monitoring data suggested that there was a weak
correlation between the two pollutants. Since then,
the relationship between PM10 and other pollutants
such as ozone, nitrogen oxides and benzene has been
investigated by a number of workers
Chapter 6 : Concentrations and Trends in Particulate Matter
Quality of Urban Air Review Group 95
Table 6.9 Linear Regression Analysis of Co-located Black Smoke and PM10 Measurements Made at Three Sites between April 1994 andMarch 1995 (Loader, 1995).
Site Summer Winter Annual(Apr-Sep) (Oct-Mar) (Apr-Mar)
Slope Intercept Slope Intercept Slope InterceptBelfast (Centre) 0.54 -1.30 1.29 -14.1 1.19 -13.7
0.83 * -3.14 * 0.76 * -3.81 *
Birmingham (Centre) 0.45 +0.86 1.17 -10.4 0.97 -8.99
0.97 * -6.54 * 0.79 * -5.04 *
London (Bloomsbury) 0.42 +6.87 0.80 -0.18 0.67 1.85
(*) Regression analysis with outliers excluded from the analysis.
Note: Regression of black smoke on PM10.
PM10 data for 1995 are provisional.

• to define relationships between PM10 and pollutants
which could be used to infer ambient concentrations
of PM10 in the absence of direct measurements
• to use the relationship between pollutants to
establish sources and to estimate the contribution
made by these sources to ambient concentrations.
The latter point is discussed in other Chapters of this
report.
The daily-averaged concentrations of the pollutants
recorded at the urban automatic monitoring sites
together with the measurements of acidity and black
smoke from the nearest national smoke and SO2
network site have been analysed for the pollution year
1992/93. The correlation coefficients derived for the
relationship between PM10 and the other pollutants
(O3, NO, NO2, NOx, CO, SO2, acidity and black
smoke) for specific periods are given in Table 6.8.
Airborne Particulate Matter in the United Kingdom
96
Belfast
Bexley
Birm
ingham
Birm
inghamE
ast
Bristol
Cardiff
Edinburgh
Hull
Leeds
Leicester
Liverpool
LondonB
loomsbury
New
castle
Southam
pton
0.025
0.020
0.015
0.010
0.005
0.0
Figure 6.20 Monthly Regressions of PM10 and CO on Hourly Data Points.
PM
10/C
O (
hour
ly m
ass)
Belfast
Bexley
Birm
ingham
Birm
inghamE
ast
Bristol
Cardiff
Edinburgh
Hull
Leeds
Leicester
Liverpool
LondonB
loomsbury
New
castle
Southam
pton
0.025
0.020
0.015
0.010
0.005
0.0
Figure 6.21 Monthly Regressions of PM10 and NOx on Hourly Data Points.
PM
10/N
Ox
(hou
rly m
ass)
Note: Based on provisional data.
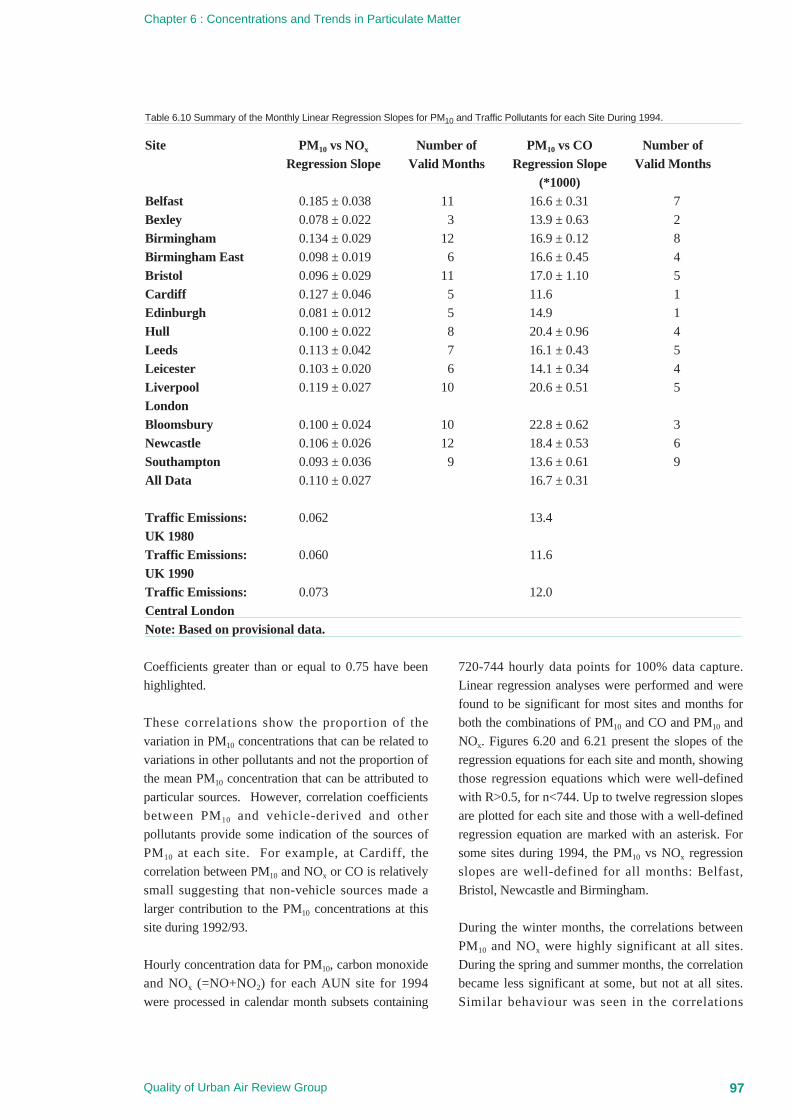
Coefficients greater than or equal to 0.75 have been
highlighted.
These correlations show the proportion of the
variation in PM10 concentrations that can be related to
variations in other pollutants and not the proportion of
the mean PM10 concentration that can be attributed to
particular sources. However, correlation coefficients
between PM10 and vehicle-derived and other
pollutants provide some indication of the sources of
PM10 at each site. For example, at Cardiff, the
correlation between PM10 and NOx or CO is relatively
small suggesting that non-vehicle sources made a
larger contribution to the PM10 concentrations at this
site during 1992/93.
Hourly concentration data for PM10, carbon monoxide
and NOx (=NO+NO2) for each AUN site for 1994
were processed in calendar month subsets containing
720-744 hourly data points for 100% data capture.
Linear regression analyses were performed and were
found to be significant for most sites and months for
both the combinations of PM10 and CO and PM10 and
NOx. Figures 6.20 and 6.21 present the slopes of the
regression equations for each site and month, showing
those regression equations which were well-defined
with R>0.5, for n<744. Up to twelve regression slopes
are plotted for each site and those with a well-defined
regression equation are marked with an asterisk. For
some sites during 1994, the PM10 vs NOx regression
slopes are well-defined for all months: Belfast,
Bristol, Newcastle and Birmingham.
During the winter months, the correlations between
PM10 and NOx were highly significant at all sites.
During the spring and summer months, the correlation
became less significant at some, but not at all sites.
Similar behaviour was seen in the correlations
Chapter 6 : Concentrations and Trends in Particulate Matter
Quality of Urban Air Review Group 97
Table 6.10 Summary of the Monthly Linear Regression Slopes for PM10 and Traffic Pollutants for each Site During 1994.
Site PM10 vs NOx Number of PM10 vs CO Number ofRegression Slope Valid Months Regression Slope Valid Months
(*1000)Belfast 0.185 ± 0.038 11 16.6 ± 0.31 7
Bexley 0.078 ± 0.022 3 13.9 ± 0.63 2
Birmingham 0.134 ± 0.029 12 16.9 ± 0.12 8
Birmingham East 0.098 ± 0.019 6 16.6 ± 0.45 4
Bristol 0.096 ± 0.029 11 17.0 ± 1.10 5
Cardiff 0.127 ± 0.046 5 11.6 1
Edinburgh 0.081 ± 0.012 5 14.9 1
Hull 0.100 ± 0.022 8 20.4 ± 0.96 4
Leeds 0.113 ± 0.042 7 16.1 ± 0.43 5
Leicester 0.103 ± 0.020 6 14.1 ± 0.34 4
Liverpool 0.119 ± 0.027 10 20.6 ± 0.51 5
LondonBloomsbury 0.100 ± 0.024 10 22.8 ± 0.62 3
Newcastle 0.106 ± 0.026 12 18.4 ± 0.53 6
Southampton 0.093 ± 0.036 9 13.6 ± 0.61 9
All Data 0.110 ± 0.027 16.7 ± 0.31
Traffic Emissions: 0.062 13.4
UK 1980Traffic Emissions: 0.060 11.6
UK 1990Traffic Emissions: 0.073 12.0
Central LondonNote: Based on provisional data.

between PM10 and carbon monoxide, which were
found to be highly significant during the winter.
However, almost all sites showed little evidence of
correlation between PM10 and CO during the
summertime.
Table 6.10 compares the linear regression slopes
between PM10 vs CO and PM10 vs NOx with the
corresponding estimates of the respective ratios of the
emissions. The level of agreement between the air
quality data and the emission inventories is most
encouraging.
6.5.2 Diurnal Variation of Particulate Matter
The measurements from the automatic monitoring
stations allow the diurnal variation of PM10 and a
number of other pollutants during the working week
to be investigated as shown in Figure 6.22a and 6.22b
for Bristol and Belfast. The pollutants are plotted
relative to the minimum hourly value which typically
occurs in the early hours of the morning. The
pollutant levels all increase substantially during the
early morning with a maximum concentration at about
08.00 hours. This feature is characteristic of traffic-
related pollutants for which emissions peak in the
morning travel-to-work time, or of pollutants which
are depleted in the shallow night-time boundary layer
Airborne Particulate Matter in the United Kingdom
98
0
50
100
150
200
250
300
23222120191817161514131211109876543210
Figure 6.22a Bristol 1993 Diurnal Plot.
PM10
NO2
SO2
CO
GMT
% M
in
Note: Values are plotted as a proportion of the minimum.
0
50
100
150
200
250
300
23222120191817161514131211109876543210
Figure 6.22b Belfast 1993 Diurnal Plot.
% M
in
Hour of day
Note: Values are plotted as a proportion of the minimum.
PM10
NO2
SO2
CO

Chapter 6 : Concentrations and Trends in Particulate Matter
Quality of Urban Air Review Group 99
Tab
le 6
.11
Sea
sona
l Var
iatio
n in
PM
10an
d O
ther
Pol
luta
nts
for
the
Pol
lutio
n Y
ear
1993
/94.
Pol
luta
ntP
M10
CO
NO
2S
O2
O3
Rat
io o
f sum
mer
toR
atio
of s
umm
er to
Rat
io o
f sum
mer
toR
atio
of s
umm
er to
Rat
io o
f sum
mer
tow
inte
r se
ason
alw
inte
r se
ason
alw
inte
r se
ason
alw
inte
r se
ason
alw
inte
r se
ason
alS
iteM
eans
98th
M
eans
98th
M
eans
98th
M
eans
98th
M
eans
98th
P
erce
nt.
Per
cent
.P
erce
nt.
Per
cent
.P
erce
nt.
Bel
fast
0.84
0.75
0.63
0.34
0.80
0.94
0.48
0.46
1.29
1.06
Bris
tol
0.93
0.90
0.88
0.65
--
1.00
1.10
1.13
1.14
Birm
ingh
am (
Cen
tral
)1.
001.
051.
000.
800.
881.
091.
001.
281.
311.
11
Car
diff
--
0.63
0.50
0.80
0.92
1.00
1.14
1.58
1.46
Edi
nbur
gh1.
050.
910.
860.
650.
961.
080.
700.
771.
251.
00
Leed
s0.
930.
830.
780.
570.
750.
850.
750.
871.
501.
19
Live
rpoo
l0.
810.
850.
830.
72-
-0.
650.
97-
-
Lond
on (
Blo
omsb
ury)
1.00
0.99
0.83
0.75
0.92
1.08
0.69
0.58
1.57
1.41
New
cast
le-
-0.
880.
710.
971.
020.
880.
74-
-
Ave
rage
(A
ll S
ites)
0.94
0.90
0.81
0.63
0.87
1.00
0.79
0.88
1.38
1.19

but remain at daytime concentrations aloft. The
diurnal variation of the pollutants which are primarily
derived from motor vehicle emissions show a
pronounced second maximum as observed at the
Bristol site for carbon monoxide and nitrogen dioxide.
For PM10, there is no discernible second maximum but
rather a gradual decline throughout the rest of the day.
A similar trend is observed at the other national sites.
This is apparently consistent with the different
emission and use patterns of light and heavy duty
vehicles through the course of the day.
6.5.3 Seasonal Variation of Particulate Matter
Table 6.11 compares the ratios of the summer (April
to September) to the winter (October to March)
seasonal means for PM10, CO, NO2, SO2 and O3 and
the corresponding ratios for the 98th percentile levels.
The ratios for PM10 are close to one, apparently
indicating little seasonal variation. This is in contrast
to the behaviour of the primary pollutants such as CO
or SO2 which show larger winter concentrations or of
that of O3 which is a secondary pollutant with a
distinct summer maximum. Closer examination of the
daily average concentration of PM10 recorded in each
month between 1992 and 1994, as shown in Figure
6.23, reveals a more complex behaviour. Generally,
days of highest PM10 concentration occur in winter
rather than in summer. It is clear from the ratios
presented in Table 6.11 that PM10 has other sources
compared to those pollutants, such as CO or NOx,
which are derived predominantly from motor vehicle
emissions. This again confirms the role of other
sources of PM10 such as secondary aerosol formation.
6.5.4 Behaviour of Particulate Matter inEpisodes
Two specific types of air pollution episodes can be
identified - the so-called “summertime” and
“wintertime” smog episodes. Summertime air
pollution episodes are associated with anticyclonic
conditions, light winds, high temperatures and clear
skies whereas wintertime smog episodes which also
occur under anticyclonic conditions are accompanied
by low or light winds, low temperatures and shallow
mixing layer depths. In the fourth MAAPE report
(MAAPE, 1995), clusters of pollutants were identified
which could be used to characterize such episodes.
The summertime episode was characterized by
elevated concentrations of O3 which are strongly anti-
correlated with those of NO2. Indeed, it is often the
sum of O3 and NO2 which is used in analyses since
this gives the total oxidant present in the atmosphere.
The wintertime episodes were sub-divided into two
classes:
(a) the traditional wintertime smog episode in which
SO2, CO and PM10 were strongly correlated, with
a less strong association to NO2.
(b) those resulting primarily from motor vehicle
emissions in which the cluster of CO, PM10 and
NO2 could be identified.
An example of a summertime episode is that observed
at the London Bloomsbury site in June 1993. Figure
6.24 shows the simultaneous rise and fall of the daily-
averaged levels of PM10 and five other pollutants
during the episode. Analysis of this episode indicated
a stronger correlation between PM10 and O3
suggesting a significant secondary component to the
PM10 fraction. A wintertime episode which occurred
in Belfast and Birmingham during December 1994 is
shown in Figure 6.25. In this episode, strong
correlations can be seen between the hourly-averaged
concentrations of PM10 and a number of the other
pollutants. There are several other examples which
could have been used to illustrate the same point.
Other pollutants such as benzene, which arises
predominantly from motor vehicle emissions, also
show periods when a strong correlation exists with
PM10. The benzene and PM10 measurements made at
the London Bloomsbury site for the period from 6 to
12th October 1994 are shown in Figure 6.26 and the
scatter plot is given in Figure 6.27.
In the fourth MAAPE report (MAAPE, 1995), those
periods in 1992 and 1993 when the concentrations of
O3 (≥ 90 ppb or 180 µg/m3) NO2 (≥ 100 ppb or 191
µg/m3) and SO2 (≥ 125 ppb or 357 µg/m3) were
elevated have been analysed to identify correlations
between pollutants. Correlations between pairs of
pollutants were determined. When hourly average
concentrations of O3 were equal to or exceeded 90
ppb, the only strong correlations identified were
Airborne Particulate Matter in the United Kingdom
100

Chapter 6 : Concentrations and Trends in Particulate Matter
Quality of Urban Air Review Group 101
1 2 3 4 5 6 7 8 9 10 11 12
0
50
100
150
200
250
Figure 6.23 Daily Mean PM10 Concentrations from the AUN, 1992 - 1994.
Dai
ly m
ean
leve
l of P
M10
(µg
/m3 )
Months of the year
Note: Based on ratified data.
3/6/
93
4/6/
93
5/6/
93
6/6/
93
7/6/
93
8/6/
93
9/6/
93
10/6
/93
11/6
/93
12/6
/93
13/6
/93
14/6
/93
15/6
/93
0
10
20
30
40
50
60
70
80
90
100
0.4
0.6
0.8
1.0
1.2
1.4
1.6
SO2
PM10
O3
NO2
NO
CO
ppb;
µg/
m3
ppm
CO
Figure 6.24 Daily-Mean PM10 and other Pollutants; London; June 1993.
Date

Airborne Particulate Matter in the United Kingdom
102
Figure 6.25b Hourly-mean PM10 and Other Pollutants, Birmingham Centre, 21st - 23rd December 1994.
Time (GMT)
ppb,
µg/
m3
ppb
NO
, CO
x 10
0ppm
0 2 4 6 8 10121416 182022 0 2 4 6 8 10 121416182022 0 2 4 6 8 101214161820220
50
100
150
200
250
300
350
0
200
400
600
800
1000
1200
1400
1600Sulphur Dioxide
PM10 Particulate Matter
Ozone
Nitrogen Dioxide
Nitric Oxide
Carbon Monoxide
ppb,
µg/
m3
Figure 6.25a Hourly-mean PM10 and Other Pollutants, Belfast, 21st - 23rd December 1994.
Time (GMT)
ppb
NO
, CO
x100
ppm
0 2 4 6 8 10121416182022 0 2 4 6 8 10121416182022 0 2 4 6 8 101214161820220
50
100
150
200
250
300
350
400
450
500
0
200
400
600
800
1000
1200
1400
1600
1800Sulphur Dioxide
PM10 Particulate Matter
Ozone
Nitrogen Dioxide
Nitric Oxide
Carbon Monoxide

between O3 and NO2 and O3 and NOx. The averaged
concentrations of all the other pollutants were
depressed except for PM10, as shown in Table 6.12.
For hourly concentrations of NO2 equal to or greater
than 100 ppb, the strongest correlations were with CO
and PM10 and to a lesser extent, SO2. There were
strong correlations between SO2 and all the other
pollutants except for O3 when hourly concentrations
of SO2 were equal to or greater than 125 ppb. It
should be noted that most of these episodes of
elevated concentrations of SO2 occurred at the Belfast
site. The mean concentrations of the pollutants
observed during the periods when the concentrations
of NO2 or SO2 were elevated are also given in Table
6.12. These mean levels are again compared to the
mean concentrations determined from all the available
measurements. The analysis indicates that elevated
PM10 concentrations are associated with elevated
levels of NO2 or O3. An association with elevated
concentrations of SO2 is also evident but this is
heavily influenced by the measurements made at the
Belfast site.
6.5.4.1 Particle Concentrations During theDecember 1991 Episode
In previous QUARG Reports, reference has been
made to the December 1991 episode when
unprecedented concentrations of NO2 were reported in
central London. Concentrations of many other
pollutants also reached elevated levels and for the
Chapter 6 : Concentrations and Trends in Particulate Matter
Quality of Urban Air Review Group 103
0
2
4
6
8
10
12Benzene
0
20
40
60
80
100
120
PM10 Particulate Matter
0181260181260181260181260181260181260181260
Ben
zene
hou
rly v
alue
(pp
b)
PM
10 P
artic
ulat
e m
atte
r ho
urly
val
ue (
µg/m
3 )
Figure 6.26 Hourly-mean PM10 and Benzene, Bloomsbury 6 - 12 October 1994.
Time (GMT)
0 20 40 60 80 100 1200
2
4
6
8
10
12
Ben
zene
con
cent
ratio
n (p
pb)
PM10 concentration (µg/m3)
Figure 6.27 Correlation of Hourly-mean PM10 and Benzene, Bloomsbury 6 -12 October 1994.
r=0.87

majority, these have not been approached at any time
since.
Typical daily average black smoke levels in central
London sites during winter lie in the range 10-30
µg/m3. During the December 1991 episode, however
these concentrations rose to levels which were an
order of magnitude higher, 150-200 µg/m3. Daily
average concentrations of black smoke for 11 London
sites during December 1991 are shown in Table 6.13
(Anderson et al, 1995). It is interesting to note that the
maximum values observed in 1991 are an order of
magnitude lower than the corresponding maxima
during the London smogs of the 1950s and 60s. This
emphasises once again the different nature of the 1991
winter episode to previous episodes as discussed in the
first QUARG report.
Unfortunately, automatic hourly measurements of
PM10 had not commenced in London at the time of the
December 1991 episode. It is interesting, however, to
speculate what the corresponding PM10 concentrations
would have been during the episode to resolve the
relative importance of a range of causative factors and
agents in bringing about the observed public health
response.
The 11 black smoke monitoring sites operating in
London showed daily average levels on the 12th
December 1991 ranging from 7 to 228 µg/m3. The
average concentration of black smoke on that day was
113 µg/m3 which is 83 µg/m3 above the monthly mean
of the 11 stations (30 µg/m3 ). The black smoke to
PM10 ratio is known to vary by season and by site, but
based on simultaneous measurements of both made in
Airborne Particulate Matter in the United Kingdom
104
Table 6.12 Analysis of Periods in 1992 and 1993 when Concentrations of O3 ≥ 90 ppb, NO2 ≥ 100 ppb or SO2 ≥ 125 ppb (MAAPE, 1995).
Analysis of Measurements for O3 Concentrations ≥ 90 ppbPollutant Mean Number of such Mean
when O3 ≥ 90 ppb Measurements of all dataO3 (ppb) 94 13 14
NO2 (ppb) 13 13 26
NOx (ppb) 14 13 64
CO (ppm) 0.5 13 0.7
PM10 (µg/m3) 40 13 28
SO2 (ppb) 5 13 10
Analysis of Measurements for NO2 Concentrations ≥ 100 ppbPollutant Mean Number of such Mean
when NO2 ≥ 100 ppb Measurements of all dataO3 (ppb) 9 52 14
NO2 (ppb) 126 63 26
NOx (ppb) 530 61 64
CO (ppm) 3.2 59 0.7
PM10 (µg/m3) 127 49 28
SO2 (ppb) 57 59 10
Analysis of Measurements for SO2 Concentrations ≥ 125 ppbPollutant Mean Number of such Mean
when SO2 ≥ 125 ppb Measurements of all dataO3 (ppb) 7 152 14
NO2 (ppb) 58 148 26
NOx (ppb) 367 148 64
CO (ppm) 6.0 155 0.7
PM10 (µg/m3) 207 145 28
SO2 (ppb) 172 155 10

Chapter 6 : Concentrations and Trends in Particulate Matter
Quality of Urban Air Review Group 105
Tab
le 6
.13
Dai
ly B
lack
Sm
oke
Con
cent
ratio
ns (
µg/
m3)
Rec
orde
d in
Lon
don,
Dec
embe
r 19
91.
Day
Act
on 1
5C
ambe
rwel
l 4C
ity 1
6C
royd
on 1
5E
alin
g 7
Enf
ield
14
Ilfor
d 6
Islin
gton
9K
ensi
ngto
n 13
Ste
pney
5W
estm
inst
er 1
7M
ean
Max
1 2 311
1218
1317
810
714
715
1218
411
1220
1616
710
1112
926
1426
514
1420
2421
47
1125
717
1525
630
3535
1642
1028
1149
2149
3049
760
4047
1471
1661
741
2668
4171
845
5453
1363
1144
454
2465
3965
945
6162
1163
1152
1655
2448
4163
1032
3142
842
111
1143
2040
2643
1157
5863
1382
2265
1249
2652
4582
1215
312
514
015
209
2422
87
166
3114
811
322
8
1316
280
128
1516
726
181
1215
836
121
9918
1
1411
088
105
1012
413
8012
145
3699
7514
5
1581
3881
1371
1758
784
3181
5184
1644
2537
2535
724
731
2438
2744
1741
815
1215
1314
416
814
1541
1812
514
138
23
96
78
14
1911
419
264
147
56
510
26
209
69
345
711
78
1134
212
25
163
67
45
616
223
28
281
47
47
28
237
414
87
611
35
714
2416
1515
3217
1811
1217
1732
2514
1220
1312
133
1212
1220
264
410
133
83
74
36
13
2723
2815
1123
428
721
2619
28
2827
1216
253
323
2117
32
2921
1922
253
157
1416
25
3034
2020
388
247
1921
38
31 Mea
n39
2940
1743
1138
838
1943
30
Max
162
125
140
3420
926
228
1616
636
160

1992, the best estimate of the mean PM10 increase
across London during the episode is 110 µg/m3. On
this basis, the increase in black smoke and PM10 could
explain some of the increase in mortality and
morbidity observed in London (Anderson et al, 1995).
6.6 EXCEEDENCES OF AIR QUALITY STANDARDS AND GUIDELINES
Air Quality guidelines and standards currently exist
for particulate matter characterized as black smoke or
total suspended particulate and PM10. The EC
Directive (80/779/EC) on Sulphur Dioxide and
Suspended Particulate Matter gives separate guide and
limit values for smoke and suspended particulate
matter. As stated earlier, there is no simple
relationship between black smoke and total suspended
particulate and the United Kingdom has chosen to
implement the Directive using black smoke
measurements (Annex 1 of the Directive) (Table
6.14). The Directive also gives guide and limit values
for sulphur dioxide but these are dependent on the
associated concentration of smoke (Table 6.14). This
linkage of the two pollutants arose from the
observations and epidemiological studies of the
London smog episodes. The limit and guide values
for suspended particulate matter are currently used in
the Department of Transport’s Design Manual for
Roads and Bridges (DOT, 1994).
Table 6.15 gives the number of exceedences of the EC
Directive from the 1987/88 pollution year to the
1994/95 pollution year. In the pollution year 1993/94,
there were no exceedences of the EC Directive. As
part of the Directive, a number of derogation areas
were established, principally where coal remained a
significant fuel source and breaches of the Directive
could possibly occur. Since 1993, such derogations
no longer exist.
The World Health Organization has recommended air
quality guidelines for particulate matter, which are
linked to the concentration of sulphur dioxide. The
current guideline values are summarised in Table 6.16
Airborne Particulate Matter in the United Kingdom
106
Table 6.14 Limit and Guide Values for Smoke and Sulphur Dioxide (in µg/m3) Specified in EC Directive on Smoke and Sulphur Dioxide(80/779/EC).
(1) Limit ValuesReference Period Limit Values for
Smoke Sulphur DioxidePollution Year(median of daily values) 68 120 if smoke ≤ 34
80 if smoke > 34
Pollution Year(98th percentile of daily values) 213 350 if smoke ≤ 128
250 if smoke > 128
Winter(median of daily values Oct-Mar) 111 180 if smoke ≤ 51
130 if smoke > 51
(2) Guide ValuesReference Period Guide Values for
Smoke Sulphur DioxideYear(arithmetic mean of daily values) 34-51 40-60
24 hours(daily mean values) 85-128 100-150
Note: Limit and Guide Values given for smoke are for the BS calibration as used in the UK. The limits stated in
the EC Directive relate to the OECD method; the relationship between concentration determined using the OECD
and BS calibration is: BS = 0.85 OECD.

but are presently under revision. In America, the US
EPA has established air quality standards for
particulate matter. The primary standards which are
set to protect human health are
• 24 hour mean concentration of 150 µg/m3 PM10
which is not to be exceeded on more than 0.27% of
occasions (1 in 365 days). This was previously set
as 260 µg/m3 TSP.
• arithmetric annual mean concentration of 50 µg/m3
PM10 which was previously set as 150 µg/m3 annual
geometric mean TSP.
Chapter 6 : Concentrations and Trends in Particulate Matter
Quality of Urban Air Review Group 107
Table 6.15 Exceedences of the EC Directive for SO2 and Suspended Particulate Matter.
Site Pollution Year/Criterion1987/88 1988/89 1989/90 1990/91 1991/92 1992/93 1993/94 (a) 1994/95 (a)
Crewe 17 Sm≥3cd - - - - - - -
Mexborough 19 Sm≥3cd - - - - - - -
Seaham 2 Sm/98, - - - - - - -
Sm≥3cd
Hetton-le- Sm/98, Sm/98 Sm/98, - - - - -
Hole 3 Sm≥3cd Sm>3cd
Houghton-le- Sm/98, - - - - - - -
Spring 3 Sm≥3cd
Sunderland 8 Sm/98 - - - - - - -
Featherstone 1 Sm/98, - - - - - - -
Sm≥3cd
Washington 4 Sm≥3cd - - - - - - -
New Ollerton 2 - Sm≥3cd - - - - - -
Durham - - - - Sm/98 - - -
Sherburn 1Grimethorpe 3 - - - - - (b) - -
Belfast 11 (c) - - - Sm/98, - - - -
Sm≥3cd
Belfast 12 (c) - - - Sm/98, - - - -
Sm≥3cd
Belfast 39 (c) Sm≥3cd Sm/98, - - - - - -
Sm≥3cd
Belfast 42 (c) - - Comb/98 Comb/98 Comb/98 - - -
Comb≥3cd
Newry 3 (c) - - Sm/98, - - - - -
Sm≥3cd
Criteria (1) Sm/98 - limit value for the 98th percentile of daily values in a year exceeded for black smoke.
(2) Sm≥3cd - at least one period of 3 or more consecutive days when daily values were above the 98th
percentile limit value for black smoke.
(3) Comb/98 - both black smoke and SO2 98th percentiles exceeded the combined limit values (i.e. 128
µg/m3 BS or 150 µg/m3 OECD for smoke and 250 µg/m3 for SO2).
(4) Comb≥3cd - at least one period of 3 or more consecutive days when daily values were above the 98th
percentile limit values of both black smoke and sulphur dioxide.
Notes (a) There were no exceedences of the Directive in 1993/94 and 1994/95.
(b) The only exceedence in 1992/93 was at the Grimethorpe 3 site when the limit value for the 50th
percentile of daily values in a year was exceeded for SO2.
(c) Prior to 1993, a number of derogation areas existed, one of which covered the Belfast sites.

Secondary standards have been established to protect
the environment, to increase amenity, etc. These were
originally different from the primary standards but
have now been set to the same values as for the
primary standards.
The Expert Panel on Air Quality Standards has
recommended air quality standards for a number of
atmospheric pollutants in the United Kingdom,
including PM10. The air quality standard
recommended by EPAQS (1995) for PM10 is 50 µg/m3
as a 24-hour rolling average. Table 6.17 gives the
number of exceedences of the EPAQS
recommendation as well as those of a number of
threshold levels, corresponding to daily mean
concentrations of 50 µg/m3, 75 µg/m3, 100 µg/m3 and
150 µg/m3, which have been determined at each of the
sites in the national automatic monitoring network for
the years 1992 to 1994. Whilst it can be seen that
there are a significant number of days at all sites for
which the 50 µ g/m3 level (both the EPAQS
recommendation and the daily concentration) is
exceeded, it is clear that there are progressively fewer
exceedences of the higher thresholds with only a
limited number of exceedences of the 150 µg/m3
threshold. More than one exceedence of the 150
µg/m3 daily level has occurred only at the Belfast site
during this period. A further point to note from Table
6.17 is that the number of exceedences of the EPAQS
recommended air quality standard for PM10 as a 24-
hour rolling average is about two times greater than
the number of exceedences which would have occured
if the standard were expressed as a daily mean
concentration of 50 µg/m3. Figure 6.23 shows the
mean daily concentration of PM10 recorded at all the
operational sites plotted for each month for the period
from 1992 to 1994. It is evident from this figure that
the highest concentrations of PM10 and therefore the
greatest number of exceedences have tended to occur
in the winter months when the dispersion of
atmospheric pollution is poorer.
6.7 SPATIAL DISTRIBUTION OF PARTICULATE MATTER
6.7.1 Across an Urban Area
There is an extensive database of black smoke
measurements for a range of industrial, residential and
commercial site types in urban areas. Although these
Airborne Particulate Matter in the United Kingdom
108
Table 6.16 WHO Guideline Values* for Combined Exposure to Sulphur Dioxide and Particulate Matter(a).
Gravimetric AssessmentAveraging Sulphur Reflectance Assessment: Total Suspended Thoracic Particles
Time Dioxide Black Smoke (b) Particulate (TSP) (c) (TP) (d)µg/m3 µg/m3 µg/m3 µg/m3
Short Term 24 hours 125 125 120 (e) 70 (e)
Long Term 1 year 50 50 - -
Notes (a) No direct comparisons can be made between values for particulate matter since both health
indicators and measurement methods differ. While numerically TSP/TP values are generally
greater than those of black smoke, there is no consistent relationship between them, the ratio of
one to the other varying widely from time to time and place to place, depending on the nature
of the sources.
(b) Nominal µg/m3 units, assessed by reflectance. Application of the black smoke value is
recommended only in areas where coal smoke from domestic fires is the dominant component
of the particulate matter. It does not necessarily apply where diesel smoke is an important
contributor.
(c) TSP: measurement by high volume sampler, without any size selection.
(d) TP: equivalent values as for sampler with ISO-TP characteristics (having 50% cut-off point at
10 µm); estimated from TSP values using site specific TSP/ISO-TP ratios.
(e) Values to be regarded as tentative as they are based on a single study which also involved
sulphur dioxide exposure.
* currently under review.

Chapter 6 : Concentrations and Trends in Particulate Matter
Quality of Urban Air Review Group 109
Tab
le 6
.17
Exc
eede
nces
Rec
orde
d be
twee
n 19
92 a
nd 1
994
for
Var
ious
Thr
esho
ld V
alue
s fo
r D
aily
Ave
rage
Lev
els
of P
M10
.
Site
Site
Firs
tY
ear
Num
ber
of D
ays
24 H
our
Max
imum
Dai
ly
Ope
ratio
nal
Whe
n D
aily
Mea
n P
M10
Lev
els
Exc
eede
dM
ean ≥
50 µ
g/m
3M
ean
PM
10
50 µ
g/m
370
µg/
m3
100
µg/
m315
0 µ
g/m3
EP
AQ
S C
ount
Day
sLe
vel µ
g/m3
Lond
onJa
n 19
9219
9227
40
062
843
94
(Blo
omsb
ury)
1993
3110
00
788
5710
0
1994
173
00
485
3993
Bel
fast
Mar
199
219
9223
125
355
240
248
1993
4513
30
1075
8012
0
1994
176
32
433
3219
1
Birm
ingh
am
Mar
199
219
9221
61
052
637
131
(Cen
tral
)19
9325
51
056
839
102
1994
153
10
366
2311
3
New
cast
leM
ar 1
992
1992
213
00
487
3872
1993
144
00
430
3279
1994
231
00
481
3977
Car
diff
May
199
219
9321
30
049
240
89
1994
5513
00
1319
9196
Edi
nbur
ghO
ct 1
992
1993
20
00
394
66
1994
10
00
303
62
Bris
tol
Jan
1993
1993
274
00
701
5281
1994
163
00
370
3083
Leed
sJa
n 19
9319
9323
40
059
440
96
1994
247
10
549
4411
4
Live
rpoo
lA
pr 1
993
1993
226
00
449
2816
3
1994
195
00
471
3484
Birm
ingh
amD
ec 1
993
1994
102
10
234
1910
6
(Eas
t)H
ull
Jan
1994
1994
163
00
373
3085
Leic
este
rJa
n 19
9419
945
00
017
817
65
Sou
tham
pton
Jan
1994
1994
70
00
147
1663
Not
e: E
ntrie
s ar
e on
ly g
iven
for
thos
e si
tes
whi
ch w
ere
oper
atio
nal f
or m
ore
than
9 m
onth
s in
a g
iven
yea
r.
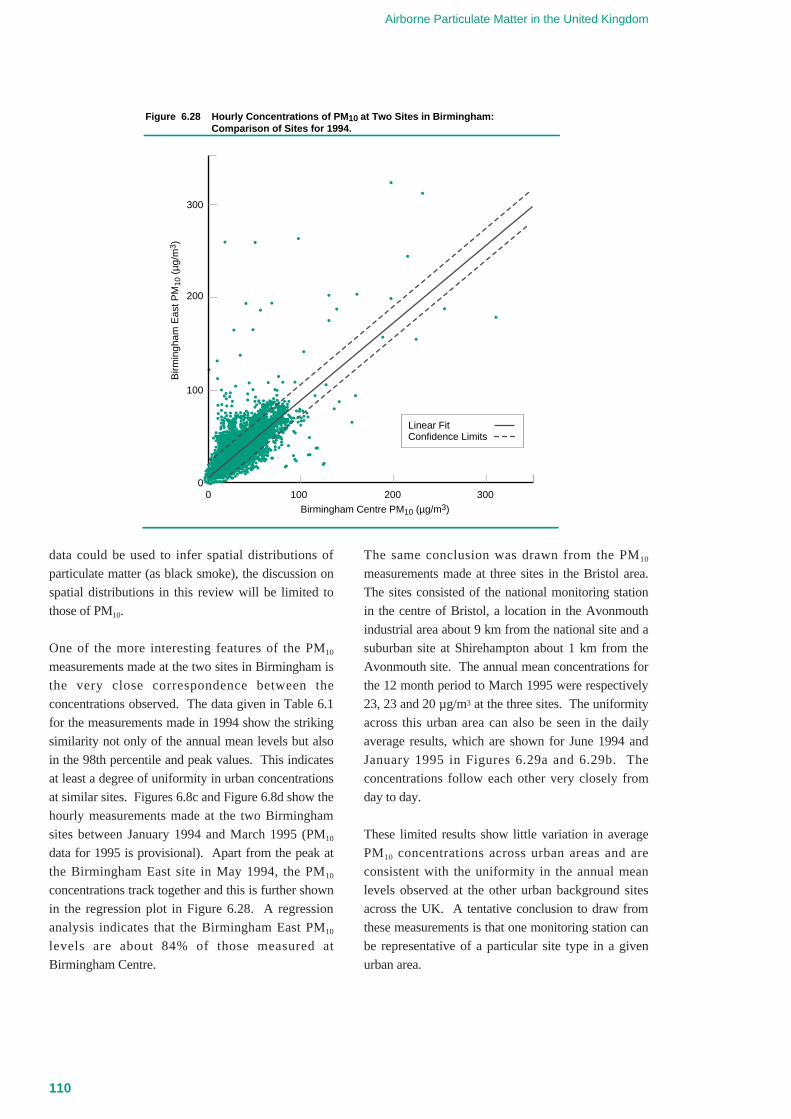
data could be used to infer spatial distributions of
particulate matter (as black smoke), the discussion on
spatial distributions in this review will be limited to
those of PM10.
One of the more interesting features of the PM10
measurements made at the two sites in Birmingham is
the very close correspondence between the
concentrations observed. The data given in Table 6.1
for the measurements made in 1994 show the striking
similarity not only of the annual mean levels but also
in the 98th percentile and peak values. This indicates
at least a degree of uniformity in urban concentrations
at similar sites. Figures 6.8c and Figure 6.8d show the
hourly measurements made at the two Birmingham
sites between January 1994 and March 1995 (PM10
data for 1995 is provisional). Apart from the peak at
the Birmingham East site in May 1994, the PM10
concentrations track together and this is further shown
in the regression plot in Figure 6.28. A regression
analysis indicates that the Birmingham East PM10
levels are about 84% of those measured at
Birmingham Centre.
The same conclusion was drawn from the PM10
measurements made at three sites in the Bristol area.
The sites consisted of the national monitoring station
in the centre of Bristol, a location in the Avonmouth
industrial area about 9 km from the national site and a
suburban site at Shirehampton about 1 km from the
Avonmouth site. The annual mean concentrations for
the 12 month period to March 1995 were respectively
23, 23 and 20 µg/m3 at the three sites. The uniformity
across this urban area can also be seen in the daily
average results, which are shown for June 1994 and
January 1995 in Figures 6.29a and 6.29b. The
concentrations follow each other very closely from
day to day.
These limited results show little variation in average
PM10 concentrations across urban areas and are
consistent with the uniformity in the annual mean
levels observed at the other urban background sites
across the UK. A tentative conclusion to draw from
these measurements is that one monitoring station can
be representative of a particular site type in a given
urban area.
Airborne Particulate Matter in the United Kingdom
110
0 100 200 3000
100
200
300
Birmingham Centre PM10 (µg/m3)
Birm
ingh
am E
ast P
M10
(µg
/m3 )
Figure 6.28 Hourly Concentrations of PM10 at Two Sites in Birmingham: Comparison of Sites for 1994.
Linear Fit Confidence Limits

6.7.2 Across the United Kingdom
The spatial distribution of PM10 is of interest since it
allows the annual exposure of different areas of the
country to be assessed. The current measurements of
PM10 have only been made at a limited number of
sites across the United Kingdom and these do not
allow the spatial distribution of PM10 across the whole
country to be calculated reliably.
Whilst the smoke and sulphur dioxide network does
provide a greater coverage of the UK, these
measurements can only be used to infer the spatial
distribution of PM10 providing the relationship
between PM10 and black smoke has been established.
Measurements have been undertaken to compare the
levels of PM10 and of black smoke recorded at co-
located or close sites as discussed in section 6.3.6.
The analysis indicated that the relationships (between
PM10 and black smoke) are very site specific. Further
work is being undertaken to refine these observations.
Chapter 6 : Concentrations and Trends in Particulate Matter
Quality of Urban Air Review Group 111
0 2 4 6 8 10 12 14 16 18 20 22 24 26 28 300
10
20
30
40
50
Figure 6.29a Daily-mean PM10 Concentrations from Sites in the Bristol Area, June 1994.
Avonmouth Shirehampton Broadmead
PM
10 (
µg/m
3 )
Date
0 2 4 6 8 10 12 14 16 18 20 22 24 26 28 300
10
20
30
40
50
Figure 6.29b Daily-mean PM10 Concentrations from Sites in the Bristol Area, January 1995.
Avonmouth Shirehampton Broadmead
PM
10 (
µg/m
3 )
Date

In the absence of direct data, the spatial distribution of
PM10 has been inferred from the relationships between
PM10 and other pollutants which have been measured
on a larger spatial scale (Stedman, 1995). Two
national NO2 diffusion tube surveys (in 1986 and
1991) have been undertaken to derive monthly and
annual levels of NO2. The NO2 measurements made
in the 1991 survey were then mapped onto 5 km by 5
km grids covering the United Kingdom using
population and land use statistics. These NO2 maps
were then used to generate firstly maps of NOx and
thence maps of PM10. The co-located measurements
of PM10 and NOx made at the London Bloomsbury
monitoring station were analysed to give a
relationship between NOx and PM10. The regression
analysis of the hourly PM10 and NOx data for the two
year period from the start of 1992 to the end of 1993
led to the relationship
PM10 (in µg/m3) = 0.18 NOx (in ppb) + 15.4
Airborne Particulate Matter in the United Kingdom
112
Figure 6.30 Estimated Spatial Variation in Annual Mean PM 10 Concentration Across the United Kingdom, 1991.
Above 26 µg/m3
24-26 µg/m3
22-24 µg/m3
20-22 µg/m3
18-20 µg/m3
16-18 µg/m3
Below 16 µg/m3

with a regression coefficient r2 equal to 0.35. The
annual mean concentrations of NO2 and NOx in 1993
determined at the automatic monitoring sites were
analysed to give the relationship between NOx and
NO2 in urban areas as NOx = 2.5 NO2 (r2 = 0.5). The
expression for the relationship between NOx and NO2
in rural areas was derived from the ratio of the annual
mean concentrations of NOx and NO2 recorded at the
Lullington Heath site in 1993.
Figure 6.30 shows the map of estimated annual mean
PM10 concentration (for 1991) derived in this manner
for the United Kingdom (Stedman, 1995). It can be
seen that the highest concentrations of PM10 are likely
to be found in the south-east of England with annual
mean levels above 26 µg/m3. The concentrations of
PM10 may fall radially outwards from London. Major
conurbations such as Birmingham, Manchester,
Liverpool and Glasgow can be identified on these
maps.
These maps, derived from maps of NOx, can only take
account of the likely variation in the vehicle-derived
component of PM10. As discussed above, there are
other sources of particulate matter in the atmosphere,
especially significant, when mean levels rather than
episodes of elevated concentrations are considered. In
these maps, other sources are taken account of by the
15.4 µg/m3 constant term. In future work, the
variation of PM10 from other sources will be
considered and the relationship derived between NOx
Chapter 6 : Concentrations and Trends in Particulate Matter
Quality of Urban Air Review Group 113
0.01 0.10 1.00
0
100
200
300
400
500
600
RoadsideUrban Background
Figure 6.31 A Comparison of Two Mean Particle Size Distributions, by Number.
Num
ber
conc
entr
atio
ns/c
m-3
Diameter (µm)
Source: Collins, Jones and Harrison, 1995.

Airborne Particulate Matter in the United Kingdom
114
1 2 3 4 5 6 7 8 9 10 11 12 13 14 15 16 17 18 19 20 21 22 23 2415000
20000
25000
30000
35000
40000
45000
50000
Hour ending (GMT)
Par
ticle
s / c
m3
PM
10 (
µg/m
3 )
20
22
24
26
28
30
32
34
36
Figure 6.33 Hourly-mean Diurnal Particle Count and PM10 Mass, Central Birmingham.
Count PM10
Source: Jones and Harrison, 1995.
Figure 6.32 Time Series of Particle Count Measurements Near a Busy Road in Birmingham.
0
100000
200000
300000
400000
500000
600000
700000
800000
11:2
6:02
11:3
2:02
11:3
8:02
11:4
4:02
11:5
0:02
11:5
6:02
12:0
2:02
12:0
8:02
12:1
4:02
12:2
0:02
12:2
6:02
12:3
2:02
12:3
8:02
12:4
4:02
12:5
0:02
12:5
6:02
13:0
2:02
13:0
8:02
13:1
4:02
13:2
0:02
13:2
6:02
13:3
2:02
13:3
8:02
13:4
4:02
13:5
0:02
13:5
6:02
14:0
2:02
14:0
8:02
14:1
4:02
14:2
0:02
14:2
6:02
14:3
2:02
14:3
8:02
14:4
4:02
14:5
0:02
14:5
6:02
15:0
2:02
Par
ticle
s /c
m3 ;
1 m
inut
e av
erag
e
Time
Source: Jones and Harrison, 1995.

and PM10 will be refined using the larger amount of
observational data now available.
6.8 ULTRAFINE PARTICLES AND PARTICLENUMBER COUNTS IN URBAN AIR
The discussion thus far has concentrated solely on the
mass of particulate matter measured at the different
monitoring sites. There is a view that it is the total
number of particles which is of concern rather than the
total mass. There have been a number of studies in
which the total number of particles as well as the total
mass of the particulate matter have been determined.
As indicated in Chapter 2, there are abundant small
particles in the atmosphere which contribute
substantially to the total particle number count, but
represent very little of the total mass concentration
because of their tiny volume, and hence mass. These
particles are termed ultrafine particles (generally
defined as particles less than 50 nm in diameter). A
size distribution (Figure 6.31) of particles sampled in
the air of Birmingham and expressed in terms of
particle number shows that the large majority of
particles are smaller than 50 nm, and almost all are
below 100 nm diameter. Thus, measures of particle
number count, which may be made continuously with
a condensation nucleus counter, are a good measure of
the ultrafine particle loading.
Especially when close to sources of particle emissions,
very large numbers of particles can be counted in
urban air. Figure 6.32 shows a time series of particle
count measurements taken 3 metres from the busy
A38 Bristol Road in Birmingham as part of the DoE
Air Quality Research Programme. The count varies
rapidly between about 103 and 106/cm3 with an
average count of around 180,000/cm3. A count made
under similar weather conditions at a background site
a few hundred metres away revealed a mean particle
count of 27,000/cm3. Thus particle numbers reduced
about six-fold between the roadside site and the
background due to dilution with cleaner air and
particle coagulation processes which reduce the
number count. Comparative measurements of PM10
for the same sites indicate that the roadside site has
PM10 concentrations about 80% greater than the
background site. This demonstrates clearly the very
large impacts of freshly emitted particles upon the
number count at the roadside site. These particles
contribute relatively little to PM10 mass because of
their very small volume. These particle number
concentrations may be compared with air over the
North Atlantic Ocean, which in the absence of recent
Chapter 6 : Concentrations and Trends in Particulate Matter
Quality of Urban Air Review Group 115
13 16 18 20 23 25 28 30 2 5 7 10 12 14 17 19 2214 17 19 22 24 26 29 1 4 6 8 11 13 16 18 21 23
0
10
20
30
40
50
60
70
80
1000
2000
3000
4000
5000
6000
7000
8000
PM10Particle Count
Figure 6.34 24-Hour Rolling Mean PM10 and Particle Count from a Site in Birmingham.
PM
10 (
µg/m
3 )
Par
ticle
s pe
r cu
bic
cent
imet
re
Date
Source: Jones and Harrison, 1995.

pollutant inputs shows typical particle number counts
of around 200/cm3.
Measurements of particle count have also been made
in central Birmingham at a background site adjacent
to the PM10 measurements of the Birmingham
(Central) Automatic Urban Network site. The
majority of particle count data at this site were below
100,000 particles/cm3, although there were occasional
excursions above this number, which was the upper
limit of the instrument used for particle counting.
Figure 6.33 shows moving average PM10 and particle
count data through one 24 hour period. In general, the
two measures of particle abundance are reasonably
well related. The variation of particle number count
and PM10 concentration over a five week sampling
period is shown in Figure 6.34. The two exhibit
roughly comparable patterns, although the number
count starts to rise earlier in the morning than the
PM10 concentration and does not fall in the afternoon
in the way that PM10 does at this site. If 24 hour
particle count data are correlated with PM10 over the
same 24 hour intervals, the data show an
approximately linear relationship with a correlation
coefficient of 0.59.
Measurements made in London by Waller (1976)
using electron microscopy revealed concentrations of
the order of 104/cm3 at background sites, 3-5 x 10⁴/cm3
in street samples and up to 16 x 104/cm3 in samples
taken in tunnels and urban fogs. These measurements
suggest that particle number densities have changed
little since the 1960s although mass concentrations are
expected to have diminished appreciably.
6.9 KEY POINTS
• There has been a substantial decline in the
concentration of particulate matter (as black smoke)
over the past 40 years in both urban and rural
locations across the United Kingdom. These
measurements continue to provide a valuable
source of information on the concentrations of
particulate matter.
• With the introduction of automatic instruments, a
sophisticated national urban monitoring network
now exists to measure PM10. The measurements
have been made mainly in urban background
locations and there is now a need to extend the
measurement of PM10 to other site types.
• The annual mean concentration of PM10 at the
urban background sites in the national Automatic
Urban Monitoring Network lie between
approximately 20 to 34 µg/m3. Although the annual
mean concentrations appear relatively uniform
across the United Kingdom, there is a substantial
variation from day-to-day, from site-to-site, and
from season-to-season.
• Analysis of the measurements of PM10 with those of
other pollutants indicate that strong correlations
exist between PM10 and CO and also between PM10
and NOx at some locations. Such relationships can
be used to infer the concentration of PM10 in the
absence of direct measurements and for source
apportionment.
• Attention is increasingly being focussed on the
PM2.5 size fraction. There are currently very few
measurements of PM2.5 concentrations in the United
Kingdom. Measurements made at Birmingham
indicate that the PM2.5 size fraction can represent
between 30 to 100% of the PM10 concentration, the
proportion being dependent on the meteorological
conditions.
• In general, there have been a few or no exceedences
of a fixed 24-hour mean PM10 concentration of 100
µg/m3 at the sites in the national Automatic Urban
Monitoring Network between 1992 and 1994, the
exception being the Belfast site where 11
exceedences were observed. On the other hand,
there have been widespread exceedences of a daily
mean level of 50 µg/m3 at all sites in the network
during this period.
• The EPAQS recommended standard of 50 µg/m3,
24-hour rolling mean, is exceeded more frequently
than the same concentration measured over fixed
24-hour daily periods. Over the period 1992-1994
there were approximately double the number of
exceedences of the 50 µg/m3 rolling mean, than of
the same concentration expressed as a fixed daily
mean.
Airborne Particulate Matter in the United Kingdom
116

• The number concentration of particles in urban air
fluctuates widely, but normally lies between 103 and
106 per cubic centimetre. This reflects mainly the
ultrafine particles which are very numerous but
contribute little to PM10 mass.
• When averaged over 24 hour periods, particle
number concentration is correlated with the PM10
mass and within a 24 hour period shows a similar
diurnal variation.
• Particle number concentration is highly elevated
close to a busy road, by a factor far greater than the
elevation in PM10 mass.
REFERENCES
Anderson HR et al (1995) The Health Effects of anAir Pollution Episode in London, December 1991,St George's Hospital Medical School, Department of
Public Health Sciences, Cranmer Terrace, London
SW17 0RE
Bailey DLR and Clayton P (1980) The Measurementof Suspended Particulate and CarbonConcentrations in the Atmosphere Using StandardSmoke Shade Methods, Warren Spring Laboratory
Report LR 325 (National Environmental Technology
Centre, AEA Technology, Culham Laboratory,
Abingdon, Oxon., OX14 3DB).
Ball DJ and Hume R (1977) The RelativeImportance of Vehicular and Domestic Emissionsof Dark Smoke in Greater London in the Mid-1970s, the Significance of Smoke ShadeMeasurements, and an Explanation of theRelationship of Smoke Shade to GravimetricMeasurements of Particulate, Atmos. Environ., 11,
1065-1073.
Bower JS, Broughton GFJ, Willis PG and Clark H
(1995) Air Pollution in the UK 1993/94, NETCEN.
Bower JS, Broughton GFJ, Willis PG, Clark H (1996)
Air Pollution in the UK 1994, NETCEN.
Clout H (1978) Changing London, University
Tutorial Press, Yeovil.
Collins G, Jones MR and Harrison RM (1995)
Unpublished Data.
Dockery WD, Pope CA, Xu X, Spengler JD, Ware
JH, Fay ME, Ferris BG and Speizer FE (1993) AnAssociation between Air Pollution and Mortality inSix US Cities, New Engl J Med, 329, 1753-1759.
DoT (1994) Design Manual for Roads and Bridges,Department of Transport, Volume 11, Section 3, Part
1 Air Quality.
EC (1980) Air Quality Limit Values and GuideValues for Sulphur Dioxide and SuspendedParticulates, EC Directive (80/779/EEC).
EPAQS (1995) Particles, Department of the
Environment Expert Panel on Air Quality Standards,
HMSO, London.
Kitto AMN and Harrison RM (1992) ProcessesAffecting Concentrations of Aerosol Strong Acidityat Sites in Eastern England, Atmos. Environ.,26A,
2389-2399.
International Mining Consultants Limited (1995)
Preliminary Study of Ambient AirborneParticulate Matter , International Mining
Consultants.
Jones MR and Harrison RM (1995) Unpublished
Data.
Lee DS and Derwent RG (1995) The Behaviour ofAmmonia in the Atmosphere, Manuscript in
preparation.
Lee DS, Espenhahn S and Baker S (1995) BaseCation Concentrations in Air and Precipitation inthe United Kingdom, Report AEA/16405532/001/
Final Report prepared for Her Majesty’s Inspectorate
of Pollution under contract HMIP/CPR2/41/1/146.
Loader A (1994) Multi-Element Survey: DataSummary 1976/77-1992/93, Report
(AEA/CS/16419032/Z001) prepared for Department
of the Environment.
Chapter 6 : Concentrations and Trends in Particulate Matter
Quality of Urban Air Review Group 117

Loader A (1995) Comparison of PM10 and BlackSmoke Measurements using Co-located Samplers,
Report (AEA/RAMP/16419046/003) Prepared for
Department of the Environment.
LSS (1989) London Air Pollution MonitoringNetwork Fourth Report , Rendel Science and
Environment, London.
MAAPE (1992) Sulphur Dioxide, Acid Aerosolsand Particulates, Second Report prepared by the
Department of Health’s Advisory Group on Medical
Aspects of Air Pollution Episodes, HMSO, London.
MAAPE (1995) Health Effects of Exposures toMixtures of Pollutants, Fourth Report prepared by
the Department of Health’s Advisory Group on
Medical Aspects of Air Pollution Episodes, HMSO,
London.
Miller CE and Lewis RH (1996) Trends inConcentrations of Suspended Particulates inCentral Manchester 1980-93, Environ Technol, in
press.
Muir D and Laxen DPH (1995) Black Smoke as aSurrogate for PM10 in Health Studies?Atmos.
Environ.,29, 959-962.
Pope CA, Thun MJ, Namboodiri MM, Dockery, WD,
Evans JS, Speizer FE and Heath CW (1995)
Particulate Air Pollution as a Predictor ofMortality in a Prospective Study of US Adults,Amer J Respir Crit Care Med, 151, 669-674.
QUARG (1993a) Urban Air Quality in the UnitedKingdom. First Report of the Quality of Urban Air
Review Group, Department of the Environment,
London.
Stedman JR (1995) Estimated High ResolutionMaps of the United Kingdom Air PollutionClimate, Report (AEA/CS/16419035/001) Prepared
for Department of the Environment on Contract
PECD 7/12/138.
Stevenson KJ, Loader A, Mooney D and Lucas R
(1995) UK Smoke and Sulphur Dioxide Monitoring
Networks. Summary Tables for April 1993-March1994, Report Prepared for Department of the
Environment on Contract PECD 7/12/124.
Waller RE (1967) Studies on the Nature of AirPollution. London Conference on MuseumClimatology, International Institute for Renovation of
Works of Art; 65-69.
Westminster City Council (1995) Personal
Communication.
WHO (1987) Air Quality Guidelines for Europe.World Health Organisation Regional Office forEurope, European Series Number 23, World Health
Organisation, Copenhagen.
Airborne Particulate Matter in the United Kingdom
118

7.1 INTRODUCTION
There have been numerous studies of some aspect of
atmospheric particle chemistry undertaken on aerosol
collected in the UK atmosphere. In this Chapter we
seek to review that information and provide an
estimate of “typical” UK airborne particle
composition. Clearly, composition is variable in both
time and space, and since no study has sought to
characterise either kind of variation for more than one
or two individual components, this point will not be
addressed in detail.
The composition of atmospheric particles is
influenced by a balance between sources, chemical
transformations in the atmosphere, long-range
transport effects and removal processes. Particles
with a relatively long atmospheric lifetime and no
significant localised sources (eg sulphate in fine
particles) show quite high spatial uniformity on scales
of tens, and possibly hundreds of kilometres. On the
other hand, particles with short residence times and/or
localised sources (eg quarry dust) show strong spatial
concentration gradients. Thus no generalised
statements on the degree of uniformity of atmospheric
particles are possible. Undoubtedly there are
substantial temporal and spatial variabilities in
atmospheric particle loadings, and appreciable spatial
variations in mean composition. Nonetheless, there
are common chemical components which appear at
relatively similar concentrations throughout the
developed world (Sturges et al, 1989), and within the
UK, airborne particle concentrations and composition
are not expected to vary greatly from one location to
another of the same type (eg urban) elsewhere in the
country. There will, however, be local elevations in
concentrations of some components, eg marine
aerosol at coastal locations.
There are two main sources of information on aerosol
composition in the UK atmosphere. Extensive
national surveys have been carried out for individual
components, chiefly metals and toxic organic
compounds. As these studies have only investigated
specific trace components of particulate matter, to
obtain information on the bulk components use must
be made of ad-hocstudies carried out by various
research groups. This can lead to difficulties in
comparing and combining the results obtained by
different researchers as different sampling and
analytical protocols were used.
A simple comparison of the raw published data from
ad hocstudies is limited by the following difficulties:
1) There is no overall national strategy behind the
selection of sampling sites. The majority of sites for
which comprehensive studies have been made are not
truly representative of the urban areas in which most
people live.
2) There is no common standard for sampler design,
so the fraction of particulate matter analyzed in
different studies will often contain different particle
size groups. It will be shown later that the
composition of particles is highly dependent on their
size.
3) There are large differences between analytical
methods, and in the choice of species analysed.
4) The reported data cover an appreciable time
interval and temporal changes in mean concentrations
will have occurred over this time.
An additional source of data is from the two national
particulate matter monitoring networks: the long-
running and extensive National Survey of Air
Pollution for black smoke, and the continuous PM10
instruments in the Automated Urban Network.
7.11 The Comparability of Data from SizeSelective Samples
A frequently quoted distinction between size fractions
is that of “fine” particles, aerodynamic diameter
< 2.5 µm, and “coarse” particles, 2.5 to 10, or 15 µm.
The 15 µ m upper limit corresponds to the UK
definition for “smoke”; 10 µm to the definition given
earlier for PM10. The “fine” fraction can be
considered to be “respirable” and includes the
“accumulation mode” and is thus the fraction of
greatest interest (QUARG, 1993). The “coarse”
fraction is largely “inhalable”, but clearly includes a
substantial fraction which are neither “thoracic” nor
“respirable”. (See Chapter 3 for definitions). The size
7 The Chemical Composition of AirborneParticles in the UK Urban Atmosphere
Quality of Urban Air Review Group 119

fraction in which a species is predominantly found can
tell a lot about the source of a species; if it is mostly
found in the fine fraction it will probably be
anthopogenic in origin. Natural dusts including
marine aerosol are in most cases predominantly
coarse.
Size selective samplers come in a variety of types with
different size ranges employed. The two way
division into “coarse” and “fine” is used in the so-
called dichotomous samplerand has been employed in
a study of urban air in Leeds by Clarke et al (1984).
Size selection in this sampler is carried out using a
virtual impactor, a device unlike the more usual
cascade impactor. Because of its direct applicability
to health effects studies, the dichotomous sampler is
becoming increasingly popular, especially in the US
where aerosol sampling has been far more widespread
than in the UK. Most of the few UK studies which
have taken size-resolved samples have used the
cascade impactor which provides samples in several
size ranges typically ranging from <0.5 µm to >12
µm. In most other studies of atmospheric particles no
size discrimination is employed, making the data
obtained less useful for evaluation of health effects.
Obviously data from different size ranges are not
directly comparable.
When different samplers which nominally capture the
same size range are compared they will still not
always agree. Studies comparing the High-Volume
Sampler with the dichotomous sampler have shown
that the Hi-Vol gives higher concentrations of total
mass and of some ionic species, especially sulphate
(Clarke et al, 1984 and Trijonis, 1983). This may be
due, at least in part, to the formation of artefacts on the
filter media: gaseous species in the incoming air react
with some filter media and with collected particles to
produce additional solid matter. Best known is the
conversion of sulphur dioxide to sulphate on alkaline
glass fibre media.
Even where size selection is used it has been found
that the effects of high relative humidity can produce
inconsistent results. Particles, especially those with a
high sulphate content, will grow when exposed to high
relative humidity thus changing their size distribution,
a phenomenon investigated in detail by Koutrakis et al
(1989). A US study by Keeler et al (1988)
investigated the effect this has on dichotomous
samplers and found that under extreme conditions
50% of the material usually found in the fine fraction
will appear with the coarse. Given that night-time
humidities are higher than daytime, and that most
public exposure occurs indoors under conditions of
low relative humidity, it seems likely that the “fine”
fraction will frequently be underestimated by outdoor
sampling. During a sampling campaign in Leeds by
Clarke et al (1984) it was found that under conditions
of high humidity their filters would clog up rapidly so
the air was later pre-heated to avoid this problem.
Such pre-heating will have altered the size distribution
of their samples during the campaign. Pre-heating is
also used on the TEOM continuous PM10 monitor
(Patashnick and Rupprecht, 1991). Conventional
methods using Hi-vols and dichotomous samplers do
not employ pre-heating, rather the filters are
conditioned to standard relative humidity before
weighing. This has clear implications for the
behaviour of both water content and the collection of
volatile components leading to differences in
gravimetric concentration. In this case size-
distribution will not be affected because the heating is
applied after the selective inlet.
All these inconsistencies must be borne in mind when
the results of the following sampling campaigns are
discussed.
7.2 COMPOSITION OF AIRBORNE PARTICLES
A typical approximate breakdown of UK particulate
matter composition may be expressed as follows:
ammonium ~5%, sulphate, nitrate and chloride ~30%,
carbonaceous material ~40%, metals ~5% and
insoluble material (minerals) ~20%. (QUARG, 1993).
Figure 7.1 illustrates this graphically. This has been
derived by combining data from several studies
carried out in different places at different times using
different techniques and so cannot be regarded as
being especially rigorous. The trace heavy metals and
specific organic compounds comprise a tiny
percentage of the total mass, and it is these which
have been covered by the most extensive sampling
Airborne Particulate Matter in the United Kingdom
120
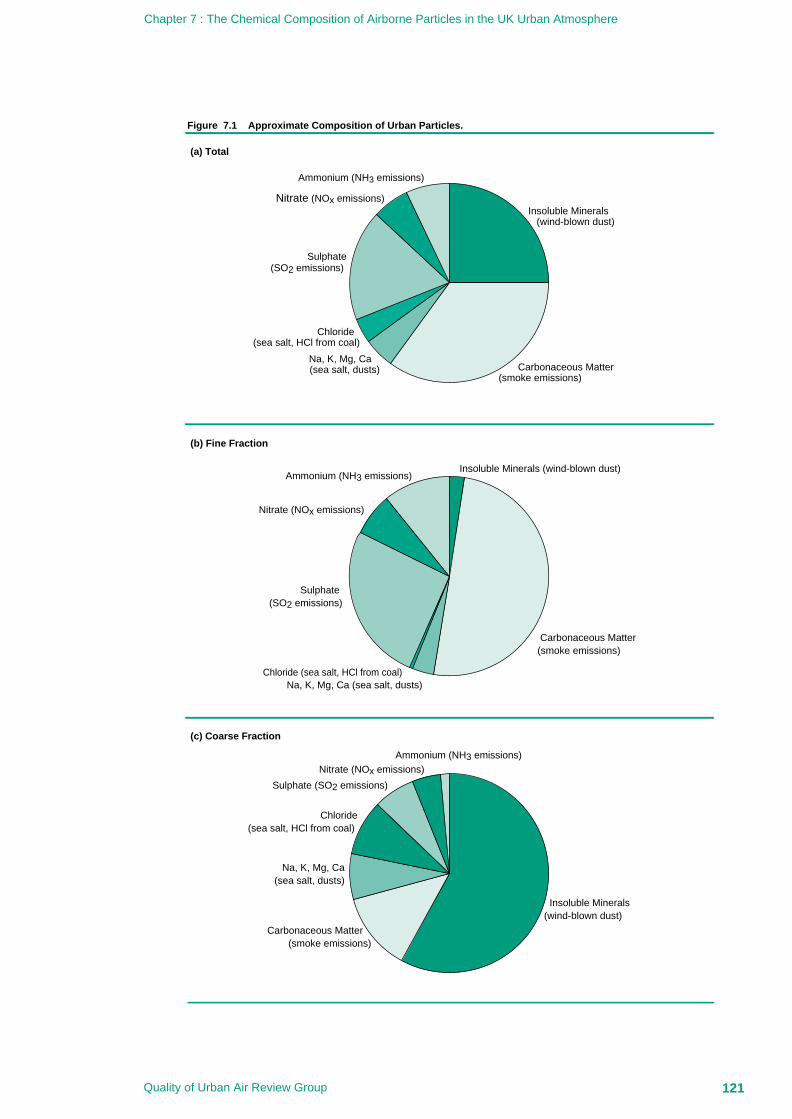
Chapter 7 : The Chemical Composition of Airborne Particles in the UK Urban Atmosphere
Quality of Urban Air Review Group 121
Figure 7.1 Approximate Composition of Urban Particles.
(a) Total
(b) Fine Fraction
(c) Coarse Fraction
Ammonium (NH3 emissions)
Na, K, Mg, Ca(sea salt, dusts)
Sulphate (SO2 emissions)
Nitrate (NOx emissions)Ammonium (NH3 emissions)
Carbonaceous Matter (smoke emissions)
Insoluble Minerals(wind-blown dust)
Chloride(sea salt, HCl from coal)
Insoluble Minerals (wind-blown dust)
Na, K, Mg, Ca (sea salt, dusts)Chloride (sea salt, HCl from coal)
Nitrate (NOx emissions)
Ammonium (NH3 emissions)
Sulphate (SO2 emissions)
Carbonaceous Matter(smoke emissions)
Chloride (sea salt, HCl from coal)
Na, K, Mg, Ca (sea salt, dusts)
Sulphate(SO2 emissions)
Insoluble Minerals (wind-blown dust)
Carbonaceous Matter(smoke emissions)
Nitrate (NOx emissions)
campaigns. No survey covering all the components
simultaneously has yet been carried out in the UK
7.2.1 Background on the Reported Studies
Leeds 1982A study of rural and urban particulates was made by
Clarke et al (1984) in the Leeds area. They used the
dichotomous samplers described earlier. A series of
24 hour samples were taken between June and
September 1982. Analysis was performed for SO42-,
NO3-, NH4
+, and Cl-. As the filters were weighed to
determine the total mass concentration in each fraction
it is possible to express the concentration of each
species as a percentage of the total mass. This study is
consequently the most useful yet done in the UK, and
the results derived have been used in other reviews (eg
QUARG, 1993) as representative of urban exposures
in general. It will thus be used as the main source of
data for the soluble fraction, with other studies
supplementing it.
Lancaster 1979-1981Harrison and Pio (1983) describe a sampling
campaign near Lancaster, in north-west England. The
site is far from major urban regions so is
representative of rural air. As the sea is 10 km away
some of the samples were from maritime air masses.
Twenty-four hour samples were taken using cascade
impactors to provide a range of size selections which
were analysed for 9 ionic species, including four
metals (Ca, K, Na and Mg). The totals of measured
nano-equivalent concentrations balanced to within 3%
implying that these 9 species represented the vast
majority of the soluble ionic fraction. This study
covers the greatest number of ionic species and so
provides the most information about the chemical
combinations within the ionic material. Comparison
with the Leeds data is meaningful if the cascade
impactor ranges are grouped into two fractions
corresponding to the fine and coarse dichotomous
sampler ranges.
Lancaster 1978-1982Colbeck and Harrison (1984) report measurements for
sulphate, nitrate, and ammonium from five sampling
periods at different locations in the Lancaster area.
Size fractionation was not employed. Two of the
campaigns involved simultaneous measurement at two
sites giving information about the spatial distribution
of the species. At one site the total suspended
particulate (TSP) was measured allowing a rough
estimate to be made of the percentage by mass
contributed by each species.
Essex 1987-1988Measurement of particulate NO3
-, SO42-, NH4
+, and
Cl- were made by Harrison and Allen (1990) at a
small network of sites in eastern England. No particle
size discrimination was employed. In addition
measurements were made of gaseous NH3, HCl, and
HNO3. While detail is not given on these in this
report they do give some useful insights into the
sources of the particles.
Essex 1987-1989The survey by Kitto and Harrison (1992a, b) in Essex
to investigate processes affecting aerosol acidity
involved taking weekly 24 hour samples at four sites,
with three sites operated simultaneously. The
concentration of strong acid was measured as well as
those of the usual ionic species, allowing the amount
of SO42- present as sulphuric acid to be determined.
The first three sites were sampled simultaneously
between May and December 1987.
7.3 RESULTS OF REPORTED STUDIES
7.3.1 Sulphates
Leeds 1982As expected the fine fraction concentrations (r=0.95,
n=96) are better correlated between sites than the
coarse (r=0.7, n=96). 85% of the sulphate occurs in
the fine fraction, with both urban and rural sites
having the same distribution between fractions.
(Table 7.1).
Lancaster 1979-1981The concentrations of sulphate were measured, and
the results are shown in Table 7.2. Sulphate
concentrations in the fine fraction, averaged over the
period, were 7.9 µg/m3. This represents about 34% by
mass of the total soluble ionic fraction (calculated as a
percentage of the averages, rather than an average of
the percentages). Further investigation of the balance
Airborne Particulate Matter in the United Kingdom
122

of nano-equivalent concentrations indicates that the
sulphate is mostly present as ammonium sulphate,
although some is present as sodium sulphate of marine
origin. The latter occurs in particles with a mode of
about 3.5 µm: this is in the coarse fraction, but the
particles will still be partly respirable.
Lancaster 1978-1982Only at Hazelrigg 1979-1981 were measurements
made of the total sampled mass on the filter: in this
case the mean Total Suspended Particulates (TSP), as
defined earlier, was 39.24 µg/m3 with a range of 20.0 -
73.0 µg/m3. This indicates that sulphate was about
22% by mass of the TSP when calculated from the
means, which is smaller than that found in Leeds.
Essex 1986-1987Mean sulphate concentrations (µg/m3) are shown in
Table 7.3. No calculation of the fraction of sulphate
in the total soluble ionic species is made. The only
cation measured is NH4+ so an accurate ion balance is
not possible. However, an estimate based on the
overall means shows that sulphate represents about
34-35% of the total sulphate, nitrate, chloride and
ammonium fraction, which is in keeping with the
value obtained in Lancaster for total soluble ions.
Note that the Lancaster survey shows that these four
species amount to about 91% by mass of the total
soluble ionic fraction.
Essex 1987-1989Linear regressions were performed between the three
simultaneous sites which gave values of r2 of between
Chapter 7 : The Chemical Composition of Airborne Particles in the UK Urban Atmosphere
Quality of Urban Air Review Group 123
Table 7.1 Sulphate Measurements from Leeds, 1982.
Site Size Fraction [SO42-] µg/m3 % of Total Mass Number of
mean in Fraction samplesLeeds Fine 5.8 26.1 97
(Urban) Coarse 1.0 7.5 98
Haverah Fine 5.3 30.8 111
Park Coarse 0.9 9.3 111
(Rural)
Table 7.2 Sulphate Measurements from Lancaster, 1979-1981.
Mean SulphateSite Period Concentration Range Standard
µg/m3 µg/m3 DeviationHeysham 31/5/78 - 1/9/78 8.37 0.1-38.4 7.41
Hazelrigg 23/10/78 - 22/11/78 6.71 0.3-21.6 6.39
Lancaster, Town Hall 23/10/78 - 22/11/78 7.27 1.2-21.1 6.47
Hazelrigg 1979 - 1981 8.78 1.6-52.2 8.12
Lancaster,Town Hall 24/9/79 - 24/10/79 9.23 1.1-33.1 7.70
Cockerham 24/9/79 - 24/10/79 6.01 0.3-22.9 5.44
Stodday 4/5/82 - 1/9/82 5.12 0.7-24.3 5.30
Table 7.3 Sulphate Measurements (µg/m3) from Essex, 1986-1987.
OverallPeriod Essex Colchester Dedham Walton Mean (all
University Pier sites)21.8.86 - 13.11.86 3.46 3.44 3.75 3.22 3.47
24.2.87 - 16.4.87 9.34 10.70 9.28 8.47 9.45

0.92 and 0.96 for sulphate concentrations. Such
uniform spatial distributions are consistent with
sulphate being found in the “fine” fraction (Table 7.4).
Conclusions from the Sulphate StudiesSulphate consistently appears to account for about 30-
35% by mass of the soluble ionic fraction. Where the
total mass has been measured it is ~25% of the mass
of the fine fraction, although studies employing size
discrimination do not do this in a consistent way.
Sulphate levels demonstrate good spatial uniformity,
fitting in with their likely origins as fine particles of
ammonium sulphate formed as secondary aerosol in
the atmosphere. The evidence from the ionic balance
studies, especially Harrison and Pio (1983), points to
sulphate being associated with NH4+ as the
predominant cation. It may thus be present as fully
neutralised (NH4)2SO4 or as acidic NH4HSO4 or
H2SO4 dependent upon the extent of neutralisation by
ammonia.
7.3.2 Aerosol Acid
While sulphate is usually largely present as a neutral
salt, some concern has arisen about the effects on
health of acid aerosol, the majority of which is
expected to be ammonium bisulphate or sulphuric acid
(Radojevic and Harrison, 1992). Few measurements
have been made of the concentration of H+. The
study in Essex during 1987-89 (Kitto and Harrison,
1992b) investigated the processes affecting strong acid
concentrations. The concentrations of strong acid
were usually very small: ~0-178 neq/m3, atmospheric
NH3 is usually present in sufficient quantities to
neutralise any H+ present (Table 7.5). The typically
low concentrations usually found when expressed in
µg/m3 can give a misleading impression of the
importance of H+. Because the molecular mass is
small the percentage of H+ in the total ionic fraction is
far greater when the concentrations are expressed in
chemical equivalents, which gives a more realistic
measure of the amount of H+ available for reaction.
7.3.3 Ammonium Compounds
All the studies quoted where sulphate was measured
also give values for ammonium concentrations. As
before the Leeds study can be considered the most
useful (Table 7.6).
Leeds 1982The correlation between the fine fraction
concentrations at the two sites was 0.97 for 44
samples. Very little is found in the coarse fraction:
Airborne Particulate Matter in the United Kingdom
124
Table 7.4 Sulphate Measurements from Essex, 1987-1989.
Walton Essex Great Essex Ardleigh ArdleighPier University Domsey University (Day) (Night)
2Sampling May - Dec May - Dec May - Dec March - Dec May - July May - JulyPeriod 1987 1987 1987 1987 1989 1989Mean[SO4
2-] 5.7 5.4 5.8 8.3 8.5 6.9
µg/m3
Standard 4.6 4.4 4.8 8.1 7.6 6.0
Deviation
Table 7.5 Aerosol Strong Acid Measurements, 1987-1989.
Walton Essex Great Essex Ardleigh ArdleighPier University Domsey University (Day) (Night)
2Sampling May - Dec May - Dec May - Dec March - Dec May - July May - JulyPeriod 1987 1987 1987 1987 1989 1989Mean [H+] 0.029 0.018 0.012 0.017 0.018 0.014
µg/m3

often zero to within the experimental error. This is
not surprising since, as explained earlier, the coarse
particles are predominantly mineral materials which,
being alkaline, would not react with gaseous
ammonia. The correlations between fine NH4+ and
fine SO42- were found to be 0.99 at both sites, fitting
the expected pattern of the fine particles being largely
composed of ammonium sulphate formed through
reaction in the atmosphere.
Lancaster 1979-1981Ammonium concentrations averaged 4.2 µg/m3 over
the period. This represents 18.2% by mass of the
soluble ionic fraction. Once again virtually all was
present in the fine fraction. As this is the only study
where a cascade impactor was used it provides useful
information on the size distribution of the particles.
The bulk of ammonium, together with sulphate and
nitrates, occurs in particles between 0.05 and 2 µm in
diameter.
Lancaster 1978-1982Ammonium was measured at three of the five sites
used by Colbeck and Harrison (1984). Concentrations
arte shown in Table 7.7. This represented between 20
and 23% by mass of the of the measured soluble ions:
NH4+, SO4
2-, and NO3-. Given that the other
Lancaster study indicated that these three species
contribute nearly 80% of the soluble mass then it
could be estimated that this represents about 18% of
the total soluble ionic material, a figure which fits
with the other study.
Essex 1986-1987Ammonium concentrations are shown in Table 7.8.
The overall mean concentration of ammonium was
26% of the soluble fraction in the first campaign, and
21% in the second.
Essex 1987-1989As only sulphate and ammonium were measured it is
not possible to calculate a percentage of the soluble
fraction, or total mass (Table 7.9).
Conclusions from the Ammonium StudiesAmmonium accounts for between about 18 to 25% of
the soluble ionic fraction of particulate matter. It is
almost entirely confined to the fine fraction where it is
present as chlorides, sulphates and nitrates formed
Chapter 7 : The Chemical Composition of Airborne Particles in the UK Urban Atmosphere
Quality of Urban Air Review Group 125
Table 7.6 Ammonium Measurements from Leeds, 1982.
Site Size Fraction [NH4+] µg/m3 % of Total Mass Number of
in Fraction SamplesLeeds Fine 2.2 9.9 45
(Urban) Coarse 0.2 1.5 45
HaverahPark Fine 2.3 13.4 60
(Rural) Coarse 0.3 3.1 60
Table 7.7 Ammonium Measurements from Lancaster, 1978-1982.
Mean AmmoniumSite Period Concentration Range Standard
µg/m3 µg/m3 Deviation µg/m3
Heysham 31/5/78 - 1/9/78 3.18 0.1-11.5 2.39
Hazelrigg 1979 - 1981 4.32 0.2-26.2 4.13
Stodday 4/5/82 - 1/9/82 2.07 0.1-9.9 2.26
Table 7.8 Ammonium Measurements from Essex, 1986-1987.
Period Essex Colchester Dedham Walton Overall meanUniversity Pier (all Sites)
µg/m3 µg/m3 µg/m3 µg/m3 µg/m3
21.8.86 - 13.11.86 2.62 2.48 3.21 2.34 2.66
24.2.87 - 16.4.87 5.76 5.89 5.75 5.13 5.63

through reaction in the atmosphere between ammonia
and acid gases originating from pollution sources.
7.3.4 Nitrates
Leeds 1982Nitrate was found to be 7.5% to 8.5% of the fine
fraction, and the fine fraction represented the majority
of the nitrate (68% in Leeds, 61% Haverah Park);
(Table 7.10).
Lancaster 1978-1982
Nitrate comprised 25-29% of three major ionic species
NH4+, SO4
2-, NO3- (Table 7.11).
Essex 1986-1987Nitrate was found to be about 25-39% of the total
nitrate, sulphate, ammonium and chloride fraction.
(Table 7.12).
Conclusions from the Nitrate StudiesNitrate represents about 25% of the total soluble ionic
fraction, mostly confined to the fine fraction, although
Airborne Particulate Matter in the United Kingdom
126
Table 7.10 Nitrate Measurements from Leeds, 1982.
Site Size Fraction [NO3-] µg/m3 % of Total Mass Number of
in Fraction SamplesLeeds Fine 1.9 8.5 97
(Urban) Coarse 0.9 6.8 97
HaverahPark Fine 1.7 9.7 111
(Rural) Coarse 1.1 11.3 111
Table 7.11 Nitrate Measurements from Lancaster, 1978-1982.
Mean nitrate Range StandardSite Period concentration deviation
µg/m3 µg/m3 µg/m3
Heysham 31/5/78 - 1/9/78 3.19 0.2-12.8 3.18
Hazelrigg 23/10/78 - 22/11/78 5.53 0.7-14.2 4.11
Lancaster, Town Hall 23/10/78 - 22/11/78 5.96 0.3-15.2 4.49
Hazelrigg 1979 - 1981 5.45 0.6-20.2 5.04
Lancaster,Town Hall 24/9/79 - 24/10/79 3.6 0.1-13.4 3.17
Cockerham 24/9/79 - 24/10/79 5.03 0.1-16.7 4.57
Stodday 4/5/82 - 1/9/82 2.68 0.1-11.2 2.87
Table 7.9 Ammonium Measurements from Essex, 1987-1989.
Walton Essex Great Essex Ardleigh ArdleighPier University Domsey University (Day) (Night)
2Sampling May - Dec May - Dec May - Dec March - Dec May - July May - JulyPeriod 1987 1987 1987 1987 1989 1989Mean[NH4
+] 2.7 3.0 3.3 5.3 3.9 4.5
µg/m3
StandardDeviation 2.4 2.4 2.8 5.4 3.4 3.4
µg/m3

this association is less clear-cut with nitrates than
sulphates. The bulk is probably in the form of
ammonium nitrate, with some sodium nitrate.
7.3.5 Chloride
Leeds 1982Results obtained are in Table 7.13
Lancaster 1979-1981Harrison and Pio record Cl- concentrations of 2.9±1.6
µg/m3, 12.9% of the soluble fraction..
Essex 1986-1987Data appear in Table 7.14
Conclusions from Chloride StudiesTwo distinct contributors of chloride appear to be
present. The majority is in the coarse fraction where
marine aerosol is present; here it is mainly sodium
chloride, with some ammonium chloride. In the fine
fraction, chloride is formed from gaseous HCl
originating from pollution and is usually ammonium
chloride. Note that all the areas described above are
subject to considerable influence from marine aerosol.
None of the campaigns covered any of the largest
conurbations in Britain, but it would be expected that
samples taken in coastal areas would contain far larger
fractions of sea salt than an inland conurbation like the
West Midlands. A second source of salt is the grit
used for de-icing roads in winter. Again this is
expected to appear as higher chloride concentrations
in the coarse fraction in winter. While size
discrimination was not applied during the Essex 1987-
88 study it is clear that samples taken during the
winter period contained up to three times the chloride
found during the late summer and autumn.
Chemical Associations of Soluble Ionic SpeciesA few studies have sought to identify which chemical
cations and anions are associated with one another in
airborne particles. The most common and clear
associations are as follows:
Sulphate is predominantly present as (NH4)2SO4 with
lesser amounts of NH4HSO4 and H2SO4.
Chapter 7 : The Chemical Composition of Airborne Particles in the UK Urban Atmosphere
Quality of Urban Air Review Group 127
Table 7.12 Nitrate Measurements from Essex, 1986-1987.
OverallPeriod Essex Colchester Dedham Walton Mean (All
University Pier Sites)µg/m3 µg/m3 µg/m3 µg/m3 µg/m3
21.8.86 - 13.11.86 3.06 2.74 3.53 2.96 3.07
24.2.87 - 16.4.87 9.14 9.84 8.96 8.21 9.04
Table 7.13 Chloride Measurements from Leeds, 1982.
Site Size Fraction [Cl-] µg/m3 % of Total Mass Number ofin Fraction Samples
Leeds Fine 0.4 1.8 97
(Urban) Coarse 1.1 8.2 97
HaverahPark Fine 0.2 1.2 111
(Rural) Coarse 0.9 9.3 111
Table 7.14 Chloride Measurements from Essex, 1986-1987.
Period Essex Colchester Dedham Walton Overall MeanUniversity Pier (All Sites)
µg/m3 µg/m3 µg/m3 µg/m3 µg/m3
21.8.86 - 13.11.86 0.89 1.06 1.28 1.13 1.09
24.2.87 - 16.4.87 2.27 3.06 2.31 2.39 2.51

Nitrate is present as NH4NO3, with some NaNO3
Chloride is mainly NaCl close to coasts, with NH4Cl
predominating inland.
Ammonium is combined with sulphate, nitrate and
chloride.
Sodium is mostly bound with chloride, with some
nitrate and sulphate.
Calcium is largely present as sulphate or carbonate.
Magnesium is associated with chloride in coastal
regions, and with carbonates in areas with dolomitic
geology.
Spatial and Temporal Changes in SecondaryAerosol ComponentsThere is a spatial trend in annual average sulphate
aerosol across the United Kingdom with highest
concentrations in the south and east, declining towards
the north-west of Britain. This trend is expected to
apply also to nitrate and ammonium concentrations.
There is also a seasonal pattern with slightly higher
concentrations of sulphate observed in the summer
months. These are illustrated diagrammatically in
Chapter 8.
Most of the data presented to date have been annual
means, and short-term excursions to far higher
concentrations may be observed. The ranges
indicated, for example, for the Lancaster area in 1978-
82 show 24 hour average sulphate reaching up to 52
µg/m3 with nitrate up to 20 µg/m3. Peak to mean
ratios for 24-hour samples were thus up to 5.9 and 3.7
for sulphate and nitrate respectively. Data collected at
Harwell in 1971 (Atkins et al, 1972) show hourly
average sulphate concentrations reaching 70 µg/m3 in
a pollution episode. It is unlikely that sulphate would
now reach such high levels due to a general reduction
in sulphur dioxide emissions across Europe.
7.3.6 Metals
Metals are present from both natural and
anthropogenic sources. For some species, especially
sodium and magnesium which are present in sea
water, the natural sources are dominant. Unlike the
trace metals, those of marine origin will be found
almost entirely in the soluble ionic fraction. For
others, especially heavy metals in urban areas,
anthopogenic sources dominate. Industrial emissions
of metals arise mainly from condensation and are
more likely to appear in the fine fraction. Fine
particles have a greater probability of escaping
emission controls and are capable of greater travel
distances in the atmosphere. There is some tendency
for metals to condense onto the surface of other small
particles as the surface area/mass ratio increases with
decreasing size. It is therefore possible for fine
particles to disperse widely from their source and to
present a respiratory health hazard. This has provided
the stimulus for a number of extensive UK trace
metals sampling programmes.
Analyses of Metal ConcentrationsSources of data range from small scale research
projects to national sampling campaigns designed to
monitor compliance with air quality standards.
National campaigns have the advantage of covering a
number of sites with a standardised analytical method
and strict quality control procedures. The studies
summarised here include that carried out in Lancaster
by Harrison and Pio (1983), where major metallic
species were measured in the soluble ionic fraction;
Harrison and Williams (1982) where a larger number
of metals were investigated at the same sites, and a
brief discussion of roadside deposition from a study
by Harrison and Johnston (1985). The most extensive
source of data is the Department of the Environment’s
(DoE) Multi-Element Survey undertaken by Warren
Spring Laboratory (WSL)(McInnes, 1990) whose
objectives are to provide data on the concentrations
and trends of trace elements in the urban areas across
the UK. A study by AEA-Technology which includes
both urban and rural sites also provides a substantial
long-term dataset (Lee et al, 1994).
Sodium, Magnesium, Potassium and CalciumAs part of the Lancaster survey of ionic species
described earlier, analysis was performed for four
metals. Na and Mg would be expected to be present
in relatively large amounts owing to the presence of
maritime air masses and proximity to the coast. The
results are shown in Table 7.15.
Airborne Particulate Matter in the United Kingdom
128

In contrast with the other ionic species, these metals
are mostly found in the coarse fraction. This would be
predicted from their origins in sea spray and terrestrial
dusts which exist mainly as larger particles. The
sodium is present mainly as sodium chloride and
sulphate.
Trace MetalsThe Multi-Element Survey has been in operation since
1976 as part of the National Survey of Air Pollution.
Twenty urban sites were chosen initially, reduced after
two years to the five which most frequently
experienced above-average concentrations of several
of the elements being monitored. As a consequence
they probably represent the extreme rather than typical
concentrations. For this reason the results obtained
from ad-hoc research projects provide a useful
comparison. The samples are not size fractionated,
but it would be expected that most trace metals will be
present in the fine fraction.
A summary of the results for Central London between
1984/5 and 1992/3 is given in Table 7.16; this
illustrates the trends in each element and in general
displays a reduction. Lead shows considerable
reductions resulting firstly from reductions in the lead
content of petrol, and subsequently the increased
market penetration of unleaded petrol. The Multi-
Element survey monitored metal levels in areas with
industrial metal sources and heavy urbanisation. This
is based upon the reasonable assumption that
industrial point sources are responsible for much of
the emissions. In this respect lead behaves somewhat
differently from the other metals. Emissions from
petrol combustion far exceed industrial “point
sources” so lead concentrations are in most instances
dependent on proximity to roads and the traffic
volume on the road. A study by Harrison and
Johnston (1985) investigated lead depositionas a
function of distance from the M6 in NW England.
Although deposition rate is not an exactly equivalent
measure to concentration, the results do illustrate
clearly the significance of proximity. At the
immediate roadside the deposition rate was nearly 12
mg/m2/week, this had halved by 10 metres away and
virtually levelled off at about 0.5 mg/m2/week at 20 m.
To monitor the effects of the policies to reduce vehicle
lead emissions some monitoring has been carried out
specifically at roadsides. While the Multi-Element
survey has recorded no breaches of the WHO
guidelines for lead (0.5-2 µg/m3) since 1986, the WSL
“Lead in Petrol” survey recorded roadside levels
Chapter 7 : The Chemical Composition of Airborne Particles in the UK Urban Atmosphere
Quality of Urban Air Review Group 129
Table 7.15 Measurements of Major Ion Metals, Lancaster, 1978-1982.
[Ca2+] [K +] [Na+] [Mg 2+]Mean concentration (µg/m3) 0.400 0.196 1.288 0.146
Standard deviation (µg/m3) 0.200 0.117 0.713 0.073
Mean Proportion in Fine Fraction (%) 25 44 21 19
% Mass of Total Ionic Fraction 1.8 0.8 5.6 0.6
Arithmetic Mean of Median Diameters (µm) 6.0 5.4
TABLE 7.16 Trace Metal Concentrations Measured in Central London Between 1984/5 and 1992/3 (ng/m3) (from DoE, 1995).
1984/5 1985/6 1986/7 1987/8 1988/9 1989/90 1990/1 1991/2 1992/3Cadmium 2.8 3.6 2.7 7.2 16.0 4.8 (1.3) <1 0.4
Chromium 12 5.5 10 14 15 11 (4.3) 6 5.4
Copper 27 27 .. 32 34 25 (28) 24 13
Iron 980 840 940 1,000 1,100 1,140 (1,687) 913 891
Manganese 19 18 17 18 18 20 25 15 21
Nickel 17 7.8 8.6 8.8 10 8.9 (8.6) 5 5.2
Zinc 100 94 93 94 120 111 (139) 65 59
Vanadium 32 14 14 14 16 15 (20) 15 12
Colbalt .. .. .. .. 2.2 0.8 (0.8) - 0.3
Lead 480 270 280 300 220 .. 120 99 78
Note: Figures in parentheses refer to < 75% data capture.
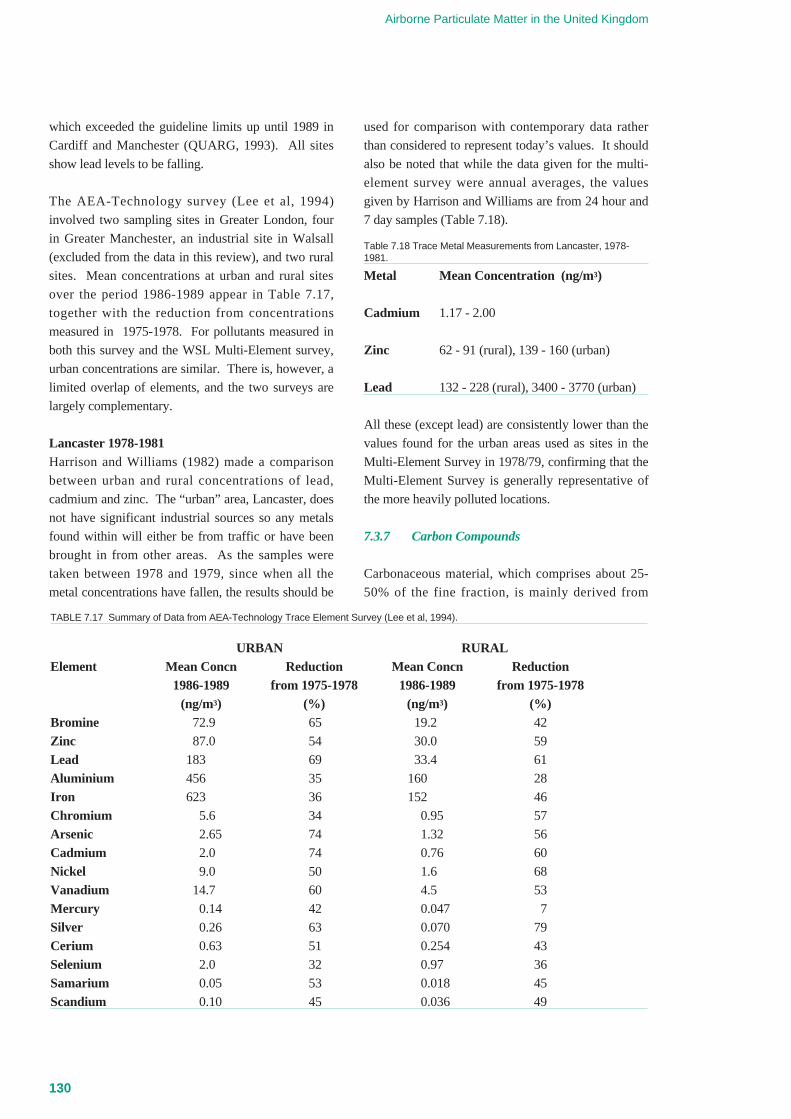
which exceeded the guideline limits up until 1989 in
Cardiff and Manchester (QUARG, 1993). All sites
show lead levels to be falling.
The AEA-Technology survey (Lee et al, 1994)
involved two sampling sites in Greater London, four
in Greater Manchester, an industrial site in Walsall
(excluded from the data in this review), and two rural
sites. Mean concentrations at urban and rural sites
over the period 1986-1989 appear in Table 7.17,
together with the reduction from concentrations
measured in 1975-1978. For pollutants measured in
both this survey and the WSL Multi-Element survey,
urban concentrations are similar. There is, however, a
limited overlap of elements, and the two surveys are
largely complementary.
Lancaster 1978-1981Harrison and Williams (1982) made a comparison
between urban and rural concentrations of lead,
cadmium and zinc. The “urban” area, Lancaster, does
not have significant industrial sources so any metals
found within will either be from traffic or have been
brought in from other areas. As the samples were
taken between 1978 and 1979, since when all the
metal concentrations have fallen, the results should be
used for comparison with contemporary data rather
than considered to represent today’s values. It should
also be noted that while the data given for the multi-
element survey were annual averages, the values
given by Harrison and Williams are from 24 hour and
7 day samples (Table 7.18).
Table 7.18 Trace Metal Measurements from Lancaster, 1978-1981.
Metal Mean Concentration (ng/m3)
Cadmium 1.17 - 2.00
Zinc 62 - 91 (rural), 139 - 160 (urban)
Lead 132 - 228 (rural), 3400 - 3770 (urban)
All these (except lead) are consistently lower than the
values found for the urban areas used as sites in the
Multi-Element Survey in 1978/79, confirming that the
Multi-Element Survey is generally representative of
the more heavily polluted locations.
7.3.7 Carbon Compounds
Carbonaceous material, which comprises about 25-
50% of the fine fraction, is mainly derived from
Airborne Particulate Matter in the United Kingdom
130
TABLE 7.17 Summary of Data from AEA-Technology Trace Element Survey (Lee et al, 1994).
URBAN RURALElement Mean Concn Reduction Mean Concn Reduction
1986-1989 from 1975-1978 1986-1989 from 1975-1978(ng/m3) (%) (ng/m3) (%)
Bromine 72.9 65 19.2 42
Zinc 87.0 54 30.0 59
Lead 183 69 33.4 61
Aluminium 456 35 160 28
Iron 623 36 152 46
Chromium 5.6 34 0.95 57
Arsenic 2.65 74 1.32 56
Cadmium 2.0 74 0.76 60
Nickel 9.0 50 1.6 68
Vanadium 14.7 60 4.5 53
Mercury 0.14 42 0.047 7
Silver 0.26 63 0.070 79
Cerium 0.63 51 0.254 43
Selenium 2.0 32 0.97 36
Samarium 0.05 53 0.018 45
Scandium 0.10 45 0.036 49

“smoke” particles (i.e. the products of incomplete
combustion). There are three main forms in which
carbon compounds occur:
carbonate: normally less than 5% of the total mass,
includes soil derived minerals, and hence is present
mainly in the coarse fractions;
organic carbon: normally about 60-80% of total
carbon, includes some compounds with potential
carcinogenic effects; and
particulate elemental carbon (PEC): which is the
black component responsible for the soiling
characteristics of particulate matter.
Both organic carbon and PEC are major constituents
in smoke from incomplete combustion processes.
“Black Smoke”, as defined by a British Standard, was
for many years the only measurement of particulate
matter made on a national scale. The method is based
upon measuring the reflectance of a filter through
which air has been drawn for 24 hours. The
particulate loading is calculated from the reflectance
by a calibration curve produced empirically in the
1950s. The coal smoke which predominated then has
now been replaced by darker smoke from combustion
of oil products, chiefly diesel vehicle fuel. Annual
means for the “pollution year” 1992-93 varied
between 11 µg/m3 (Cardiff and Birmingham) and 17
µg/m3 (Belfast). The British black smoke sampler has
been found to exhibit a 50% size cut-off at 4.4 µm so
will collect predominantly fine particles (McFarland,
1992).
Elemental Carbon (PEC)Few measurements of PEC have been made in the UK
The majority of the soiling associated with “black
smoke” is due to elemental carbon which has been
inferred from reflectance methods, (Edwards et al,
1983). A measurement programme for PEC in Leeds
gave levels of about 6 µg/m3. Recent measurements
in Birmingham (Pio et al, 1994) have indicated a
mean of ca 3 µg/m3 corresponding to about 10% of
PM10 mass.
Organic CarbonThe organic fraction contains a vast range of organic
chemicals most of which are produced in combustion
processes or formed by chemical reactions in the
atmosphere. Total organic carbon concentrations in
Birmingham are ca 5 µg/m3, about 15% of PM10 mass
(Pio et al, 1994). Toxic organic micropollutants
(TOMPs) are not confined to particles, but are also
present in gaseous form. The main types which are
commonly measured are dioxins (polychlorinated
dibenzo-p-dioxins), PCBs (polychlorinated
biphenyls), and PAH (polynuclear aromatic
hydrocarbons). There are very many other organic
compounds present in UK airborne particles, but few,
if any, measurements exist, even of a qualitative
nature.
The most useful source of data on these is from the
UK Department of Environment TOMPs network for
which preliminary data are available (Clayton et al,
1992). Four sites were originally operated at Cardiff,
London, Manchester and Stevenage. More recently,
Stevenage has closed and has been replaced by sites at
Middlesbrough and Lancaster. Measurements were
made both of concentration in the air and deposition
rates. The former will measure the suspended
particulates, predominantly of small diameter, while
the deposition rates are influenced more by the larger
particles which will have shorter lifetimes. Additional
studies of PAH only have been made in London by
Baek (1992) and in Birmingham (Smith and Harrison,
1994).
Polychlorinated Dioxins and FuransTable 7.19 summarises the dioxin/furan measurements
at UK TOMPs sites in 1993, expressed as toxic
equivalent (TEQ). Figure 7.2 describes the
breakdown of congeners by actual mass.
Polychlorinated BiphenylsThe average PCB concentration in London in 1991
was 1474 pg/m3 which breaks down into components
as shown in Figure 7.3. Table 7.19 includes the
average concentration of total measured PCBs at five
sites in 1993.
Quality of Urban Air Review Group 131
Chapter 7 : The Chemical Composition of Airborne Particles in the UK Urban Atmosphere

Polynuclear Aromatic HydrocarbonsTable 7.19 includes also the total of measured PAH
(acenaphthene, fluorene, phenanthrene, anthracene,
pyrene, benzo(a)anthracene, chrysene,
benzo(b)fluoranthene, benzo(a)pyrene and
benzo(ghi)perylene) at the five TOMPs sites during
1993. Table 7.20 gives a breakdown by compound at
various UK sites, including also the vapour phase
component.
7.3.8 Minerals
When the soluble inorganic compounds have been
quantified, and the carbonaceous fraction accounted
for, about 20-25% of the mass of urban particulate
matter remains unidentifiable. This is the insoluble
mineral fraction. Identification of individual elements
within this fraction is possible using such techniques
Airborne Particulate Matter in the United Kingdom
132
Figure 7.2 Distribution of Dioxin Congeners by Mass for London (1991).
OCDD (49%)
1234678D (21%)
1234678F (10%)
123478F (3%)
234678F (3%)
123678F (2%)23478F (2%)
OCDF (2%)12378F (2%)
OTHERS (6%)
Figure 7.3 Distribution of PCB Congeners by Mass for UK TOMPS Network Sites for 1991.
OTHER PCBs (2%)PCB 138 (2%)PCB 153 (2%)
PCB 118 (4%)
PCB 101 (9%)
PCB 52 (41%)
PCB 28 (40%)
Table 7.19 Mean Concentrations of Toxic OrganicMicropollutants at UK Sites, 1993 (From DoE, 1995).
Site Mean Mean MeanDioxin PCB PAH
(fg TEQ/m3) (pg/m3) (ng/m3)London 169 1165 120
Manchester 294 463 70
Cardiff * 206 552 56
Middlesbrough 240 213 143
Lancaster 132 87 232
* Cardiff annual mean for 1992.

as PIXE (Proton Induced X-Ray Emission) or X-Ray
Fluorescence (XRF) which can provide an accurate
multi-species breakdown of an aerosol sample on the
filter paper (Rashiduzzaman, 1981). However, these
techniques give no indication of the chemical
speciation and associations of the elements. One
approach is to use X-Ray Powder Diffraction (XRD)
which can provide a semi-quantitative estimation of
individual crystalline substances. Sturges et al (1989)
describe semi-quantitative XRD analysis of size-
fractionated samples. Unfortunately the technique has
not been widely applied in the UK, but a comparison
of a number of worldwide studies indicates that many
of the components are found to be common to all. In
general, XRD analysis finds about 50% of the total
aerosol mass to be identifiable, about half of which is
in the soluble inorganic fraction, and half is minerals.
The former have included NH4Cl, (NH4)2SO4,
NH4NO3, (NH4)2SO4.2NH4NO3, and
(NH4)2SO4.3NH4NO3, which occur mostly in the fine
fraction. Sodium compounds from sea spray appear in
the coarse fraction, along with insoluble minerals
blown from soils or industrial grinding operations. A
list of compounds identified in UK air samples by
XRD appears in Table 7.21. No UK study has been
quantitative, hence the Table includes all those
compounds which were above the detection limit
(about 1% of mass).
Studies carried out worldwide produced a large
number of species (QUARG 1993, Sturges et al,
1989) including many clay minerals. A study in
Toronto found more species than those identified by
the UK studies, including dolomite, feldspar, chlorite,
kaolinite and magnetite. The precise composition is
highly dependent on local geology, especially for the
coarse particle fraction.
Quality of Urban Air Review Group 133
TABLE 7.20 Average PAH Concentrations (ng/m3) for South Kensington, Birmingham and Manchester (From QUARG, 1993).
South Kensington(a) Birmingham(b) Manchester(c)Particulate Vapour Particulate Vapour Particulate Vapour
Naphthalene - - 0.21 13.0 - -
Acenapthylene - - 0.61 14.8 - -
Fluorene - - 1.1 12.6 0.5 26.0
Acenaphthene - - 1.6 11.9 ND 1.2
Phenanthrene 0.11 5.01 1.1 23.0 0.4 56.7
Anthracene 0.18 2.66 0.4 4.1 0.05 4.7
Fluoranthene 0.81 2.65 1.2 11.2 0.63 16.2
Pyrene 0.79 3.00 2.4 35.6 0.8 10.7
Benzo[c]phenanthrene 0.85 1.98 - - - -
Cyclo[c,d]pyrene 2.61 1.47 - - - -
Benzo[a]anthracene 0.79 0.62 1.5 4.1 1.0 0.5
Chrysene 1.22 0.40 2.2 4.3 1.8 1.6
Benzo[b]fluoranthene 0.98 0.24 - - - -
Benzo[e]pyrene 2.00 0.31 - - - -
Benzo[b]fluoranthene 1.61 0.17 2.0 0.19 2.4 ND
Benzo[k]fluoranthene 0.68 0.07 1.1 0.08 2.4 0.03
Benzo[a]pyrene 1.44 0.19 0.73 0.08 1.6 ND
Dibenzo[a,h]anthracene 0.12 ND 0.79 0.04 - -
Benzo[g,h,i]perylene 3.30 0.01 1.9 0.06 3.1 0.02
Indeno[1,2,3,c,d]pyrene 1.57 ND 2.0 ND - -
Anthanthrene 0.63 ND - - - -
Coronene 1.67 ND 1.0 ND 1.4 ND
(a) annual average;
(b) average of 27 daily samples, February 1992;
(c) results for week 7, 1992, Manchester TOMPS site.
Chapter 7 : The Chemical Composition of Airborne Particles in the UK Urban Atmosphere

7.4 DATA SUMMARY
The results obtained from various urban studies are
summarised in Table 7.22. The range of values which
are found for each parameter is very large so these
figures are chiefly intended to provide an indication of
the order of magnitude concentrations found in urban
areas. Where possible an estimate is given for the
percentage of the total mass which each species
represents. It is not always possible to do this in a
rigorous manner because the majority of workers
have not measured the total collected mass on their
filters. The fourth column, “Percentage Found in Fine
Fraction”, shows how each species is distributed
between coarse and fine fractions, a statistic which
can tell a great deal about the likely sources and health
implications. The first two indicators - PM10 and TSP
(defined earlier) - are to give an indication of the
typical mass concentrations for these two
gravimetrically determined measures of particulate
matter.
The information on soluble ionic species has been
derived entirely from research undertaken by
academic institutions. National monitoring networks
provide the most comprehensive data on trace metals
and toxic organic micropollutants, although a few
other research groups do investigate PAH. It is the
surveys which analyse for the greatest number of
species simultaneously which are of most use - this
was one of the considerations used when the table was
compiled. Least is known about the organic carbon
and insoluble inorganic fractions. The latter can be
studied by X-Ray Powder Diffraction, but very little
published data is available for the UK, and none is
quantitative.
7.5 CONCLUSIONS
No comprehensive multi-species analysis, covering all
the main fractions of airborne particulate matter, has
been performed in Britain. National surveys measure
either bulk properties like PM10 or black smoke;
chemical analysis is confined to a few trace species,
chiefly those associated with health hazards.
Information on major species, especially soluble ionic
ones, is available from a number of ad-hocstudies by
academic institutions. The extent to which these may
be compared is limited by differences between
sampling and analytical procedures. The
measurement programmes have tended to neglect the
urban environment. As a consequence, a rigorous
fractional breakdown of urban particulate matter can
only be made when comprehensive multi-species
analysis is performed in a number of urban centres,
covering both inland and coastal sites.
Certain conclusions can be made with reasonable
conviction from the available data. The coarse
fraction is mostly natural in origin, the fine fraction
predominantly anthropogenic. Most soluble ionic
species are confined to the fine fraction and are
Airborne Particulate Matter in the United Kingdom
134
TABLE 7.21 Compounds Identified in UK Urban Air Using X-RayPowder Diffraction.
NATURAL MINERALSα-Quartz (SiO2)
Calcite (CaCO3)
Epsomite (MgSO4.7H2O)
Gypsum (CaSO4.2H2O)
Feldspar (KAlSi3O8)
Chlorite )
Kaolinite ) clay minerals
Montmorillonite )
LEAD COMPOUNDS (from leaded petrol)PbSO4.(NH4)2SO4
PbSO4
PbBrCl
AMMONIUM SALTS(NH4)2SO4
NH4HSO4
NH4NO3
NH4Cl
(NH4)2SO4.2NH4NO3
(NH4)2SO4.3NH4NO3
SULPHATESCaSO4.(NH4)2SO4.H2O
Na2SO4.NaNO3.H2O
Na2SO4.(NH4)2SO4.4H2O
Fe2(SO4)3.3(NH4)2SO4
SEA SALT/ROAD SALTNaCl

formed from neutralisation by ammonia of acid
polluting gases like HCl, SO2 and NO2. Chloride is
present in both coarse and fine fractions: as
ammonium chloride in the fine, and as sodium
chloride from sea-salt in the coarse. Carbonaceous
(sooty) material is the other main component of the
fine fraction.
Most of the organic material originates from
combustion processes and is found in the fine fraction.
With the exception of trace species of health concern,
the organic fraction is very poorly characterised.
Most of the metals are pollution-derived, and found in
the fine fraction, except for sodium, calcium,
magnesium and potassium which are marine or
soil-derived in origin and found as soluble ions in the
coarse fraction. Compared to knowledge of the
organic fraction, trace metal concentrations in UK
urban air are rather well characterised.
7.6 KEY POINTS
• No recent comprehensive single-site data for the
chemical composition of UK urban particles are
available.
• It is possible to assemble a view of typical
composition based on a review of data from many
studies.
• The coarse fraction is mainly derived from soil,
dust, and marine particles, the relative amounts
depending on location. The elements calcium and
potassium are strongly associated with the former
Quality of Urban Air Review Group 135
Chapter 7 : The Chemical Composition of Airborne Particles in the UK Urban Atmosphere
TABLE 7.22 Representative Concentrations of Individual Chemical Components of Airborne Particulate Matter.
Typical PercentageAnalyte Typical Fraction of Found in
Concentrations Total Fine FractionPM10 30 µg/m3 N/A ~60%
TSP 35 µg/m3 N/A
Soluble Ionic Species:Sulphate 5-10 µg/m3 20-25% ~85%
Nitrate 2-10 µg/m3 10-20% 60-70%
Chloride 1-3 µg/m3 <10%* ~10%
Ammonium 2-6 µg/m3 <15% >95%
Strong Acid (H+) 0.02 µg/m3 Trace ~100%
Carbonaceous:Elemental Carbon 3 µg/m3 10% ~80%
Organic Carbon 5 µg/m3 15% ~80%
Minerals:Natural Minerals ~8 µg/m3 20-25% ~5%
Metals:Sodium 1 µg/m3 2%* 21%
Magnesium 0.1 µg/m3 0.2%* 19%
Calcium 0.4 µg/m3 0.8%* 25%
Potassium 0.1 µg/m3 0.2%* 44%
Lead 0.1 µg/m3 0.2% ~90%
Other Trace Metals 5-50 ng/m3 Trace Most
Iron 0.5 µg/m3 1% 35%
Toxic Organic Micropollutants:Dioxins ~200 fg TEQ/m3 Trace Most
PCBs ~1 ng/m3 Trace Most
PAH ~150 ng/m3 Trace Most
*Footnote: Surveys carried out in areas with abnormally high marine aerosol.
• sources, sodium, magnesium and chlorine with the
latter.
• Ammonium sulphate and nitrate comprise a major
part of the fine fraction particles. A small amount
of ammonium chloride may also be present.
• Carbonaceous (sooty) material is the other major
component of the fine fraction.
• There are many trace metals such as lead, cadmium
etc associated with the fine fraction of airborne
particles.
• The organic fraction of airborne particles is rather
poorly characterised. Good data are available for
dioxins/furans, PCBs and polycyclic aromatic
hydrocarbons, but not in general for other
components.
ACKNOWLEDGEMENT
This chapter draws heavily upon the article by RM
Harrison and M Jones, The Chemical Compositionof Airborne Particles in the UK Atmosphere, Sci
Tot Environ,168, 195-215 (1995), by permission of
Elsevier Science.
REFERENCES
Atkins DHF, Cox RA and Eggleton AEJ (1972)
Photochemical Ozone and Sulphuric Acid AerosolFormation in the Atmosphere over SouthernEngland, Nature, 235, 372-376.
Baek SO, Goldstone ME, Kirk PWW, Lester JN,
Perry R (1992) Methodological Aspects ofMeasuring PAH in the Atmosphere, Environ.
Technol., 12, 107-129.
Clarke AG, Willison MJ and Zeki EM (1984) AComparison of Urban and Rural AerosolComposition Using Dichotomous Samplers, Atmos.
Environ., 23, 1767-1775.
Clayton P, Davis BJ, Jones K and Jones P (1992)
Toxic Organic Micropollutants in Urban Air ,
Warren Spring Laboratory, Stevenage, UK. Lab.
Report LR 904 (PA).
Colbeck I and Harrison R. (1984) Ozone-SecondaryAerosol-Visibility Relationships in North-WestEngland, Sci Tot Environ, 34, 87-100.
DoE (1995) Digest of Environmental Statistics, No.17, HMSO, London.
Edwards JD, Ogren JA, Weiss RE and Charlson RJ
(1983) Particulate Air Pollutants: A Comparisonof British “Smoke” with Optical AbsorptionCoefficient and Elemental Carbon Concentration,Atmos Environ, 17, 2337-2341.
Harrison RM and Allen AG (1990) Measurements ofAtmospheric HNO3, HCl and Associated Specieson a Small Network in Eastern England, Atmos
Environ, 24A, 369-376.
Harrison RM and Johnston WR (1985) DepositionFluxes of Lead, Cadmium, Copper andPolynuclear Aromatic Hyerocarbons on the Vergesof a Major Highway, Sci Tot Environ, 36, 121-135.
Harrison RM and Pio CA (1983) Major IonChemical Composition and Chemical Associationsin Inorganic Atmospheric Aerosols, Environ Sci
Technol, 17, 169-174.
Harrison RM and Pio CA (1983) Size-DifferentiatedComposition of Inorganic Atmospheric Aerosols ofboth Marine and Polluted Continental Origin,
Atmos Environ, 17, 1733-1738.
Harrison RM and Williams CR (1982) AirborneCadmium, Lead and Zinc at Rural and UrbanSites in North-West England, Atmos Environ, 16,
2669-2681.
Keeler GJ et al (1988) Effect of Ambient Humidityon Dichotomous Samper Coarse/Fine Ratios,Atmos Environ, 22, 1715-1720.
Kitto AN and Harrison RM (1992a) Nitrous andNitric Acid Measurements at Sites in South-EastEngland, Atmos Environ, 26A, 235-241.
Airborne Particulate Matter in the United Kingdom
136

Kitto AN and Harrison RM (1992b) ProcessesAffecting Concentrations of Aerosol Strong Acidityat Sites in Eastern England, Atmos Environ, 26A,
2389-2399.
Koutrakis P, Wolfson JM, Spengler JD, Stern B and
Franklin CA (1989) Equilibrium Size ofAtmospheric Aerosol Sulphates as a Function ofthe Relative Humidity, J Geophys Res, 94, 6442-
6448.
Lee DS, Garland, JA and Fox AA (1994)
Atmospheric Concentrations of Trace Elements inUrban Areas of the United Kingdom, Atmos
Environ, 28, 2691-2713.
McFarland AR, Ortiz CA, Rodes CE (1982)WindTunnel Evaluation of the British Smoke ShadeSampler, Atmos Environ, 16, 325-328.
McInnes G (1990) Multi-element Survey:Summary and Trend Analysis, 1976/7-1988/9,WSL Report LR771-(AP)M, Warren Spring
Laboratory, Stevenage, UK
Patashnick H and Rupprecht EG (1991) ContinuousPM10 Monitoring Using the Tapered ElementOscillating Microbalance, J Air and Waste
Management Assoc, 41, 1079-1083.
Pio CA, Castro M, Smith DJT and Harrison RM,
Unpublished Data.
Quality of Urban Air Review Group (QUARG)
(1993) Urban Air Quality in the UK, First Reportof QUARG, Department of the Environment, UK.
Radojevic M and Harrison RM (Eds), AtmosphericAcidity: Sources, Consequences and Abatement,
Elsevier Applied Science.
Rashiduzzaman MK (1981) Proton-Induced X-RayAnalysis, CRC Crit Rev Anal Chem, 103.
Smith DJT and Harrison RM (1994), Unpublished
Data.
Sturges WT, Harrison RM and Barrie LA (1989)
Semi-Quantitative X-Ray Diffraction Analysis ofSize Fractionated Atmospheric Particles, Atmos
Environ, 23, 1083-1098.
Trijonis J (1983) Development and Application ofMethods for Estimating Inhalable and FineParticle Concentrations from Routine Hi-Vol.Data, Atmos Environ, 17, 999-1008.
Chapter 7 : The Chemical Composition of Airborne Particles in the UK Urban Atmosphere
Quality of Urban Air Review Group 137

Airborne Particulate Matter in the United Kingdom
138

8.1 INTRODUCTION
Effective strategies for control of airborne particulate
matter must depend upon a sound knowledge of the
sources of particulate matter in the atmosphere. There
are essentially two approaches to the provision of that
information: source inventories and receptor
modelling. As outlined in Chapter 4, for sources such
as road traffic which are readily quantifiable, source
inventories can provide a reliable estimate of the
magnitude of emissions. However, there are other
emissions which depend in a less definite manner
upon the quantity of the fuel or material used or the
number of miles driven. For these, it may be
extremely difficult to estimate the magnitude of
emissions using the usual techniques of the inventory.
Examples of this category are wind blown soil, street
dust resuspended by road traffic activity, and sea
spray. All of these sources are dependent in some
way upon meteorology (strength of wind, dryness of
soil etc) and their influence may in some instances be
a rather local one, especially as particle sizes tend to
be quite large and hence atmospheric lifetime rather
limited. Emissions inventories of particulate matter in
the United States have sought to include wind blown
soil and resuspended road dust but the results
obtained have not been regarded with high credibility
and the methodology is currently being revised. The
data used to derive emissions estimates from these
sources have come largely from dry climates where
the importance of such sources is greater and
extrapolation to the wetter United Kingdom climate is
problematic.
Source inventories thus describe rather well emissions
from fuel combustion and industry, as exemplified by
the inventories contained in Chapter 4. A different
approach is however needed in order to quantify
secondary sources of PM10 and the sources such as
road dust, marine aerosol and particles generated from
building and demolition activity for which the
inventories cannot give good estimates. Currently the
best available approach to quantifying these sources is
through a range of procedures known generically as
receptor modelling. Such techniques use as a starting
point measurements of particulate matter and its
individual components within the atmosphere. In
conjunction with gaseous pollutant and meteorological
data, these measurements are used to infer the
contributions of different source types to atmospheric
concentrations. This chapter seeks to introduce the
techniques which have been applied in the UK
atmosphere and to present resultant data.
8.2 RECEPTOR MODELLING OF TOTAL SUSPENDED PARTICULATE MATTER
Two main types of technique have been reported in
the research literature for source apportioning the total
mass of particulate matter in the atmosphere. The
chemical mass balance method requires a knowledge
of both the concentrations of various chemical
components of the ambient aerosol, and their fractions
in source emissions. A complete knowledge of the
composition of emissions from all contributing
sources is needed and these are combined in varying
proportions in such a way as to optimally account for
the composition of particles in the atmosphere. This
method assumes a priori that certain classes of
sources are responsible for ambient concentrations of
elements measured at the receptor. Furthermore it is
assumed that each source under consideration emits a
characteristic and conservative set of elements
(Friedlander, 1973). Whilst the chemical mass
balance approach can cope reasonably well with
primary emissions if the local source characteristics
are well understood, its ability to cope with a complex
urban atmosphere and with secondary aerosol is very
poor. Such methods have not been applied to the
comprehensive apportionment of aerosol in the UK
atmosphere.
The second type of approach to source apportionment
uses one or more of the multivariate methods which
extract information about the contribution of a source
on the basis of the variability of chemical components
measured in a large number of atmospheric samples.
If two or more chemical components originate from
the same source, their variability as a function of time
as measured at a receptor will be similar. The
objective of multivariate methods is to detect this
common variability after the fact and infer source
identity by comparing the elements with common
variability to the elements associated with specific
sources (Alpert and Hopke, 1981). In contrast to the
chemical mass balance method, no quantitative
8 Receptor Modelling and SourceApportionment
Quality of Urban Air Review Group 139

chemical composition data for source emissions are
required to determine the contributions of various
source types as the contributions are estimated solely
on the basis of statistical analysis of ambient air data.
The disadvantages of this approach are that large
numbers of ambient samples must be collected and
measured and that statistically independent source
tracers are required for each major source type. Also,
it has been observed (Henry et al, 1984) that in
practice multivariate techniques can only usually
identify between five and eight source categories.
Typical marker species have been identified as
follows (Gordon, 1988); oil burning (V, S, Ni); marine
(Na, Cl); refuse burning (Zn, Cu); soil (Mn, Fe, Ti);
coal (As, Se); vehicular (Pb, Br, elemental carbon);
secondary aerosol (SO4, NO3, NH4); metallurgical (Fe,
Mn, Cr).
A receptor modelling study of the total suspended
particulate matter sampled in Edgbaston, Birmingham
has been carried out by Smith and Harrison (1995).
Analytical data was collected on 24-hour airborne
particle samples for a range of trace elements, ions
and organic components. Meteorological data was
collected simultaneously. Sampling took place over
one month in the Summer of 1992 and one month
during the following Winter. The multivariate method
employed was Principal Component Analysis
followed by Multi-Linear Regression Analysis.
Source categories for aerosol constituents were
identified by means of Principal Component Analysis
performed using the orthogonal transformation
method with Varimax rotation and retention of
principal components whose eigenvalues were greater
than unity (Pio, 1991; Thurston, 1983). This method
allows the identification of source categories. The
contribution of each such source category to the
aerosol burden was then quantitatively assessed for
each data set by means of Multi-Linear Regression
Analysis which was applied using trace element and
compound concentrations as dependent variables and
absolute factor scores obtained from Principal
Component Analysis as independent variables. The
data was analysed in a number of separate
combinations of Winter and Summer data and coarse
and fine data and different chemical and
meteorological components. Table 8.1 shows the
factor loadings obtained from the Principal
Component Analysis using as input data fine fraction
trace elements and anions, polynuclear aromatic
hydrocarbons (sum of particulate and gas phase) and
meteorological data. The higher the factor loading the
greater the association of that chemical component or
meteorological variable with the individual factor. A
negative value indicates that a variable is
anticorrelated with the factor. Six factors are
identified by the Principal Component Analysis which
have been tentatively associated with different source
categories indicated at the base of the table. All of the
source categories for the Birmingham data have
distinct characteristics and have been assigned on the
basis of relevant marker species.
Factors 1 and 4The direct vehicular source (factor 4) can be identified
by high loadings on lead, bromine and elemental
carbon. Factor 1 also contains lead and bromine, but
with a higher contribution of other elements
suggesting contaminated road dust. High loadings on
iron and manganese are suggestive of crustal material
such as soil which is know to be the bulk matrix of
road dust although there are also minor emissions of
iron from road vehicles. Frequently Principal
Component Analysis does not well separate road dust
from vehicular emissions and there does seem to be
some overlap in this dataset.
Factor 2High loadings for sulphate, nitrate and ammonium
indicate secondary aerosol. Most of the percentage
contribution to vanadium and sulphur appears in this
factor providing evidence for oil combustion.
Factor 3The combustion of coal can be established through
two key markers of selenium (measured, but not
reported here) and arsenic. A contribution of
potassium and elemental carbon is also to be expected.
Factor 5Incineration is normally associated with high loadings
of copper and zinc as in this instance, and commonly
accompanied by moderate loadings for fine size
fractions of sodium and chloride.
Airborne Particulate Matter in the United Kingdom
140

Factor 6Sodium and chloride are easily recognised as marine
emissions or re-suspended road salt.
Multi-Linear Regression Analysis has been used to
provide quantitative estimates of the percentage
contribution of each source category to the various
chemical components measured and to total
suspended particulate matter. The results are shown
in Table 8.2. Also included in Table 8.2 are the
multiple correlation coefficients, r, which indicate that
the factors elucidated account for a large percentage of
the variance in the measured concentration data. It
must be emphasised that at present multivariate
methods are still under development and cannot be
assumed to provide accurate quantitative information
Chapter 8 : Receptor Modelling and Source Apportionment
Quality of Urban Air Review Group 141
Table 8.1 Factor Loadings obtained from Principal Component Analysis of Urban TSP Composition Data from Birmingham (Smith andHarrison, 1995).
Species Factor 1 Factor 2 Factor 3 Factor 4 Factor 5 Factor 6S 0.515 0.575 0.435
Cl 0.780
K 0.792
V 0.615 0.439
Mn 0.621 0.629
Fe 0.541 0.280 0.564 0.372
Ni 0.797
Cu 0.842
Zn 0.913
As 0.684
Br 0.371 0.637
Pb 0.387 0.746 0.391
Na 0.435 0.424 0.420
NH4 0.913
NO3 0.741
SO4 0.833 0.308
Elem C 0.254 0.286 0.796
Fluorene 0.704 0.319 0.529
Phenanthrene 0.714 0.380 0.268 0.253 0.255
Fluoranthene 0.780
Pyrene 0.746 0.431 0.253 0.251
Chrysene 0.736 0.275 0.324 0.257
Benzo(b)fluoranthene 0.755 0.257
Benzo(k)fluoranthene 0.848 0.247
Benzo(a)pyrene 0.926
Benzo(g,h,i)perylene 0.873 0.340
Indeno[1,2,3,c-d]pyrene 0.552 0.513
Coronene 0.716 0.492
BNT 0.721 0.245 0.353
TSP 0.597 0.360 0.424
Temperature - 0.615 - 0.273 - 0.391 - 0.423 - 0.236
Relative Humidity 0.522 0.497
PrecipitationSolar Radiation - 0.375 - 0.440
Wind Velocity - 0.340 0.629 - 0.357 0.278
INFERRED SOURCE road dust secondary coal vehicular incineration road saltand oil

upon source contributions. Their value is in
highlighting likely source categories and giving some
feel for their relative importance. Thus in the context
of total suspended particulate matter (which includes
some particulate material larger than PM10), the most
important sources are indicated as road traffic exhaust,
road dust and secondary aerosol. This is highly
consistent with the other data presented in this
chapter.
8.3 RECEPTOR MODELLING AND SOURCE APPORTIONMENT OF PM10
To date, no detailed multi-element receptor modelling
study of the type described above has been carried out
in the UK for PM10. There is, however, a rich base of
data on hourly average PM10 concentrations from the
Automatic Urban Network sites as well as
simultaneous data for other pollutants. These data
have been utilised to estimate the road traffic
contribution to PM10 within UK urban areas.
Airborne Particulate Matter in the United Kingdom
142
Table 8.2 Percentage Contribution of each Inferred Source to Total Concentration of each TSP Component and Multiple CorrelationCoefficients (r) (from Smith and Harrison, 1995).
Species Constant Road Dust Secondary Coal Vehicular Incineration Road Salt rand Oil
S - 19 ± 6 48 ± 4 25 ± 5 3 ± 5 1 ± 3 4 ± 6 0.96
Cl - -5 ± 5 -3 ± 2 12 ± 3 22 ± 10 14 ±4 60 ± 3 0.92
K - 39 ± 6 -1 ± 1 44 ± 18 4 ± 1 12 ± 7 2 ± 4 0.96
V - 39 ± 8 45 ± 5 5 ± 1 -2 ± 3 16 ± 9 -3 ± 1 0.92
Mn 8 ± 2 50 ± 6 3 ± 1 -1 ± 1 36 ± 6 9 ± 1 -5 ± 2 0.95
Fe 8 ± 4 34 ± 10 8 ± 3 10 ± 5 24 ± 4 12 ± 2 4 ± 3 0.93
Ni 15 ± 2 10 ± 2 22 ± 2 32 ± 6 7 ± 2 16 ± 1 -2 ± 1 0.94
Cu 6 ± 2 21 ± 9 11 ± 1 -1 ± 1 6 ± 4 59 ± 10 -1 ± 3 0.82
Zn - 12 ± 5 -4 ± 5 14 ± 4 6 ± 2 74 ± 8 -2 ± 4 0.88
As - 14 ± 4 1 ± 2 84 ± 9 0 ± 2 1 ± 2 0 ± 1 0.88
Br 2 ± 5 27 ± 7 9 ± 5 1 ± 1 55 ± 8 5 ± 2 1 ± 1 0.97
Pb 3 ± 3 22 ± 9 -3 ± 4 5 ± 3 60 ± 16 12 ± 3 1 ± 2 0.97
Na - 6 ± 4 -3 ± 3 10 ± 5 3 ± 1 23 ± 6 61 ± 5 0.84
NH4 2 ± 1 20 ± 8 74 ± 8 2 ± 2 3 ± 5 -1 ± 1 -1 ± 1 0.94
NO3 - 25 ± 8 68 ± 5 -1 ± 1 7 ± 2 -2 ± 1 3 ± 2 0.80
SO4 - 6 ± 1 65 ± 7 16 ± 4 12 ± 8 0 ± 2 1 ± 3 0.93
Elem C 4 ± 5 2 ± 3 11 ± 6 22 ± 11 54 ± 4 5 ± 1 2 ± 2 0.94
Fluorene 5 ± 2 40 ± 10 14 ± 5 4 ± 1 7 ± 2 20 ± 6 8 ± 1 0.88
Phenanthrene - 33 ± 2 26 ± 5 -3 ± 1 15 ± 7 16 ± 3 13 ± 2 0.98
Fluoranthene - 35 ± 4 23 ± 3 0 ± 1 12 ± 5 10 ± 2 20 ± 6 0.98
Pyrene - 36 ± 5 33 ± 3 -5 ± 2 8 ± 4 18 ± 3 10 ± 3 0.97
Chrysene 9 ± 2 35 ± 3 18 ± 4 22 ± 12 15 ± 8 2 ± 1 -1 ± 1 0.93
Benzo(b)fluoranthene - 69 ± 6 20 ± 7 -1 ± 1 12 ± 5 -2 ± 2 1 ± 2 0.95
Benzo(k)fluoranthene - 61 ± 3 8 ± 3 19 ± 4 10 ± 1 3 ± 1 -1 ± 3 0.95
Benzo(a)pyrene - 65 ± 4 3 ± 1 5 ± 2 23 ± 8 7 ± 5 -3 ± 5 0.98
Benzo(g,h,i)perylene 7 ± 5 58 ± 20 -1 ± 3 4 ± 1 28 ± 18 -2 ± 1 6 ± 7 0.88
Indeno[1,2,3,c-d]pyrene 2 ± 6 53 ± 12 22 ± 13 1 ± 1 18 ± 5 4 ± 5 0 ± 1 0.99
Coronene - 61 ± 12 8 ± 5 1 ± 2 32 ± 7 -1 ± 1 -1 ± 2 0.94
BNT 7 ± 6 29 ± 8 7 ± 5 14 ± 3 41 ± 10 2 ± 2 0 ± 2 0.96
TSP - 32 ± 5 23 ± 4 11 ± 7 25 ± 8 7 ± 2 2 ± 2 0.92
Note: BNT = Benzo(b)naphtho[2,1-d]thiophene

According to the available emission inventories, 91%
of carbon monoxide nationally and 98% in London
arises from motor traffic. Carbon monoxide therefore
provides an excellent tracer for traffic emissions and
this fact can be used to estimate the quantity of PM10
in city air arising from this source. The technique
used involves splitting the air monitoring data into
four seasons, and within each season extracting data
for carbon monoxide and PM10 for twelve alternate
hours of the day. For any given hour, eg 12 noon, the
paired data for carbon monoxide and PM10 for a given
site at that time on each day in the appropriate season
of the year are pooled and the relationship between the
carbon monoxide and PM10 concentration calculated
using linear regression analysis. In summer and
winter particularly, the correlations between the two
pollutants are highly significant allowing a
relationship to be identified with some confidence.
Although virtually all emissions of carbon monoxide
within an urban area arise from road traffic, there is an
external background contribution to the urban
concentration. The northern hemisphere background
of carbon monoxide arises from a number of sources
and has of magnitude of about 0.125 ppm (Novelli et
al, 1994). Derwent et al (1994) using measurements
from the Atlantic coast of Ireland have shown a
seasonal dependence of background carbon monoxide,
with in recent years background concentrations
averaging 0.10 ppm in summer and 0.14 ppm in
winter. The regression equation between carbon
monoxide and PM10 was used to estimate the PM10
concentration corresponding to the appropriate
seasonal background of carbon monoxide and hence
to a situation with zero influence of local motor
traffic. The concentration of PM10 thus arrived at
corresponds to the PM10 in air which does not arise
from road traffic. Subtraction of this concentration
from the measured average concentration for the site
and season gives an estimate of the concentration of
PM10 generated from road traffic. Such a calculation
has been performed for each alternate hour of the day
at the ten Automatic Urban Network sites with the
longest run of data for separate seasons of the year.
Figure 8.1 shows the calculated PM10 arising from
traffic, related to the carbon monoxide estimated due
to traffic. There is a point for the summer and winter
season data for each of the sites. Thus, over the ten
urban areas as a whole, traffic-generated PM10 is quite
strongly correlated with traffic-generated carbon
monoxide, with a correlation coefficient of 0.81. The
gradient of the line corresponds to the ratio of traffic-
generated carbon monoxide to traffic-generated PM10.
When the concentrations of the two pollutants are
converted to the same units, the gradient of the line
corresponding with the ratio of CO to PM10 is equal to
82.8. This may be compared with the traffic-derived
ratio of carbon monoxide to PM10 emissions in the
national and London inventories which show
respectively ratios of 78 (national, 1993); 94 (Greater
Chapter 8 : Receptor Modelling and Source Apportionment
Quality of Urban Air Review Group 143
Traffic Contribution to CO and PM10 in 10 UK Cities.
Tra
ffic
PM
10 (
µg/m
3 )
Traffic CO (ppm)
Figure 8.1
0 0.2 0.4 0.6 0.8 1 1.20
5
10
15
20
25
Lon Win
Lon Sum
Bir Win
Bir Sum
Bri Win
Sou WinLeeds Win
Leeds Sum
Lei Sum
Lei Win
Hull Win
Sou Sum
New Sum
NewWin
Edi SumEdi Win
Hull Sum
Bri Sum
Liv Win
Liv Sum
r = 0.81

London, 1990) and 84 (City of London, 1990). The
closeness of this agreement with the inventory ratios is
very encouraging, and the fact that the ratio derived
from receptor modelling lies between the national and
London inventory values probably reflects the fact
that urban traffic in cities other than London has a
composition and speed somewhere between that of the
country as a whole, including rural areas and
motorways, and London where the pattern of traffic is
very different.
The other major component of PM10 in the UK is the
secondary aerosol component comprising sulphates
and nitrates from atmospheric oxidation of sulphur
and nitrogen oxides. This has been estimated by using
measurement data collected for EMEP (the European
Measurement and Evaluation Programme). EMEP
Airborne Particulate Matter in the United Kingdom
144
6.15✶
7.61✶
6.99✶
7
9.79✶
5.89✶
12.67✶
11.29✶
8.64✶
89
109.5
9
9
9.5
10
11
10.5
7
6.5
87.
5
7.5
8.5
8.5
7
Figure 8.2 Interpolated Long-term Average Concentration of Secondary Particulate Matter across the UK (µg/m3) .

sulphate data have been converted to an equivalent
weight of ammonium sulphate, and the EMEP nitrate
data, which reflect the sum of nitrate particles and
nitric acid vapour, have been adjusted to subtract the
nitric acid vapour component (assumed to be 12.3%
based on measurement data from Allen and Harrison
(1990)) and subsequently converted to an equivalent
mass of ammonium nitrate. Data from some eight
sites across the country are available for sulphate
allowing the distribution to be mapped. Unfortunately
for nitrate, data are available from only two sites, and
the distribution of nitrate across the UK has been
assumed to be similar to that for sulphate. The result
of mapping the total secondary particulate is shown in
Figure 8.2. It may be seen that the highest
concentrations of secondary particles are in East
Anglia with concentrations generally diminishing
towards the north and west of the UK This is
consistent with the result of two influences. The first
is that emissions of nitrogen and sulphur oxides in the
west of the UK require time to be converted to
secondary aerosol as the prevailing south-westerly
winds carry them across the United Kingdom; this
results in higher levels to the east. The other influence
is that of continental sources of secondary aerosol,
which is carried to the UK during long range transport
and thus has its greatest effect in the east of the UK,
being closest to the European continent. The sulphate
data averaged across all UK sites show a seasonal
cycle (Figure 8.3) with highest concentrations in
Spring and Summer.
Using Figure 8.2, an annual average secondary
particle contribution to PM10 has been established for
each of the urban sites for which traffic-related PM10
has been calculated. The sum of vehicular (estimated
by the PM10-CO correlation method above) and
secondary PM10 account for a high percentage of total
PM10. The remaining PM10 unaccounted for by this
method arises from other sources such as wind-blown
soil, construction work, industrial emissions and
marine particles. Barbecues and bonfires also
contribute on an occasional basis. It should be noted
that the resuspended street dust and soil indicated as
an important source from the receptor modelling of
total suspended particulate matter is not accounted for
in the vehicular PM10 estimated by this method as it is
only the exhaust-emitted PM10 which correlates with
carbon monoxide. Additionally, it should be
recognised that the calculated vehicular PM10 is only
the primary emitted particles, and that secondary
nitrate particles arising from oxidation of oxides of
nitrogen emitted from vehicles is included as
secondary rather than vehicular PM10. Nitrate
accounts for on a national average basis about 3.9
µg/m3 of PM10. Since 49% of national NOx emissions
arise from road transport, about 2 µg/m3 of nitrate
particles, or 8% of typical urban PM10 may be
attributed to the vehicular source.
In a further analysis of data from 1993, months were
selected in which good correlations (r > 0.5) of CO
with PM10 were observed. In all, 64 months out of a
Chapter 8 : Receptor Modelling and Source Apportionment
Quality of Urban Air Review Group 145
0.0
0.5
1.0
1.5
2.0
DecNovOctSepAugJulJunMayAprMarFebJan
Monthly Mean Sulphate Concentration, 1990-1992 EMEP Data (all sites).
Sul
phat
e (µ
gS/m
3 )
Month
Figure 8.3

total of 168 met this criterion; of these, 61 were in the
cooler months of the year, September to April. Rather
than aggregating the data by hour of the day, the
measurements were then analysed as daily subsets.
Only those days were processed for which five or
more hourly values were available for both pollutants.
For those days with a well-defined regression
equation, an estimate of PM10 at background CO was
made, and the traffic-related PM10 determined by
difference from the daily mean. Table 8.3 summarises
the estimated “traffic-related” fractions for all sites
and days for which the linear regression equations
were well-defined. Clearly, there are wide
distributions in these fractions over all the sites during
1993. The mean “traffic-related” fractions vary from
0.66 at Edinburgh to 0.79 at London Bloomsbury.
These fractions cover a substantial number of days per
year at each site, which vary from 160 at Edinburgh to
223 in Belfast, during 1993. When days with mean
PM10 concentrations above 50 µg/m3 and those with
well-defined correlations are selected, then the
“traffic-related” fractions increase somewhat though
the number of days meeting this stricter criterion falls
sharply. The mean “traffic-related” fractions then
vary from 0.68 at Edinburgh to 0.84 at Belfast. The
frequency of days with low “traffic-related” fractions,
that is with ratios less than 0.4, falls to zero. These
data include values for Belfast, where combustion of
solid fuels within homes leads to emissions of both
PM10 and CO, thus enhancing the apparent PM10 due
to road traffic. Further studies which have used NOx
as the tracer of road traffic have indicated very similar
Airborne Particulate Matter in the United Kingdom
146
TABLE 8.3 Summary of the Fraction of the PM10 at Each Site During 1993 which is “Traffic-Related”, Based on Daily Linear RegressionAnalyses of Hourly PM10 and Carbon Monoxide Concentrations.
Site Number of days Fraction of PM10 Fraction of PM10
with r>0.5 which is “Traffic-Related” which is “Traffic-Related”on days with r>0.5 on days with r>0.5 and
PM10>50 µg/m3
Belfast 223 0.75 0.84
Birmingham 175 0.76 0.80
Bristol 181 0.76 0.79
Edinburgh 160 0.66 0.68
Leeds 204 0.74 0.80
Liverpool 133 0.78 0.80
London, Bloomsbury 190 0.79 0.83
Newcastle 193 0.69 0.75
Site Number of <0.6 0.6-0.7 0.7-0.8 0.8-0.9 0.9-1.0days withfraction
Belfast 34 39 66 63 21
Birmingham 8 34 67 56 9
Bristol 15 22 72 56 16
Edinburgh 47 46 55 12 0
Leeds 22 45 76 58 3
Liverpool 13 12 26 72 10
London Bloomsbury 9 17 57 89 19
Newcastle 32 58 76 26 1
Notes:
a. Linear regressions were performed on each days hourly data for PM10 and CO and those days were selected in
which the regression equation was well-defined, r>0.5. Based on provisional data.
b. The “baseline” PM10 contribution was defined from the daily regression equation at [CO]=0.12 ppm and the
“traffic-related” contribution obtained by subtracting this figure from the daily mean PM10 concentration.

contributions to PM10. The use only of days with high
correlation coefficients leads to a high confidence in
the result for those days, but tends to select the days
when the traffic contribution of PM10 is highest. The
data in Figure 8.1 include all days within three month
summer and winter periods and, although less precise,
may be more representative. Overall, it appears that
in Winter about 40-50% of PM10 arises from vehicle
exhaust emissions, with a higher percentage on days
with elevated PM10. Additionally, it should be noted
that vehicle emissions account for a larger proportion
of the more health-related PM2.5 fraction.
A similar analysis of summer data shows generally
poorer correlations of PM10 with CO and NOx and
indicates that for most sites the summer contribution
of road traffic to PM10 is appreciably less than in the
winter months. This is interpreted as resulting from
improved vertical mixing of pollutants in the Summer
and is consistent with general seasonal behaviour of
primary pollutants. In summer, high episodic
concentrations of secondary particles may contribute
to elevated levels of PM10. The formation of
secondary particles is favoured by the atmospheric
conditions which lead to high ozone, and the two
pollutants tend to correlate. Thus in Figure 8.4 the
maximum hourly ozone in each day is plotted against
the highest hourly PM10, confirming that the
secondary aerosol tends to be elevated during Summer
photochemical pollution events.
Taking maximum hourly PM10 concentrations in
Figure 8.4 of >60 µg/m3, maximum hourly ozone
exceeds 40 ppb on 14 out of 19 occasions, suggesting
that secondary PM10 is responsible for the majority of
episodes of high PM10 in the Summer months. A
detailed analysis of sulphate and nitrate data would be
required to better quantify this effect, but has not been
conducted as the necessary 24-hour data are not
available. The tendency for summer weather
conditions simultaneously to promote dispersion of
primary pollutants and formation of secondary
particles leads to the much poorer relationships
observed between PM10 and other traffic-related
pollutants observed in summer than in winter, as noted
at other points in this report. In winter ozone is
usually negatively correlated with PM10 as traffic
generated NOx leads to net ozone destruction in urban
areas in the winter months.
Further insights into the ratio of carbon monoxide to
PM10 in road traffic emissions can be gained from
analysis of short-lived peaks during winter episodes,
an example of which is shown in Figure 8.5. Using
Chapter 8 : Receptor Modelling and Source Apportionment
Quality of Urban Air Review Group 147
Daily Maximum Hourly-Average Ozone versus Peak Hourly Average PM10 at London (Bloomsbury), Summer 1994.
PM
10 c
once
ntra
tion
(µg/
m3 )
O3 concentration (ppb)
Figure 8.4
0 20 40 60 80 1000
20
40
60
80
100
120
(Linear fit)r = 0.59

the data from the peaks on the night of 23/24
December at the Birmigham (Centre) AUN site, the
ratio of CO to PM10 was between 52 and 96 (mean
81), highly consistent with the road traffic ratio from
the inventories showing that the peaks after
subtraction of background were almost 100%
generated from road traffic emissions. A very
different case is illustrated by Figure 8.6 which shows
a summer ozone episode at the London Bloomsbury
AUN site. It may be seen that when ozone
concentrations approached 100 ppb there was a steady
increase in PM10 consistent with photochemical
Airborne Particulate Matter in the United Kingdom
148
Time Series of Hourly PM10, CO and Ozone in London, 6 June 1993.
PM
10 a
nd o
zone
con
cent
ratio
n (µ
g/m
3 , p
pb)
CO
con
cent
ratio
n (p
pm)
Hour of day
Figure 8.6
CO
O3
PM10
PM10
O3
CO
0 1 2 3 4 5 6 7 8 9 10 11 12 13 14 15 16 17 18 19 20 21 22 230
20
40
60
80
100
0
0.2
0.4
0.6
0.8
1.0
Time Series of Hourly PM10 and CO in Birmingham, 23-25 December 1992.
PM
10 c
once
ntra
tion
(µg/
m3 )
CO
con
cent
ratio
n (p
pm)
Date
Figure 8.5
PM10
PM10
CO
CO
23/12/92 24/12/92 25/12/920
50
100
150
200
250
0
2
4
6
8
10
12
14
16

formation. After subtraction of northern hemisphere
background CO, the CO to PM10 ratio is 15.5
suggesting that less than 20% of PM10 in this instance
is from primary road traffic emissions.
8.4 INTERPRETATION OF PM10 AND PM2.5
DATASET FROM NORTH-WEST BIRMINGHAM
A site in North-West Birmingham (Birmingham,
Hodge Hill) some 70 metres from the elevated section
of the M6 motorway (see Figure 8.7) has been used
for simultaneous automated sampling of PM10 and
PM2.5 particles using TEOM instruments. The data
collected between October 1994 and March 1995 have
been analysed.
The mean concentration at PM10 at the site over this
period was 16.5 µg/m3, somewhat lower than at the
Birmingham Central (22.3 µg/m3) and Birmingham
East (21.4 µg/m3) stations of the Automatic Urban
Network. The site is clearly traffic influenced as
evidenced by the concentration of NOx, which at 60.9
ppb is higher than either Birmingham Central or
Birmingham East, (56.0 ppb and 52.0 ppb
respectively). At this site, both PM10 and PM2.5
correlate strongly with hourly NOx. The regression
equations are as follows:
PM2.5 (µg/m3) = 0.114 NOx (ppb) + 6.54 r = 0.70
PM10 (µg/m3) = 0.134 NOx (ppb) + 11.31 r = 0.70
If the NOx is taken to be wholly traffic-related, which
will be a reasonable assumption at this site as the
location is in a heavily trafficked area of a major
conurbation, then there is a background of PM10 of
11.3 µ g/m3 upon which a mean traffic-related
concentration of PM10 of 5.2 µg/m3 is superimposed.
Similarly, for PM2.5 the background is 6.5 µg/m3 with
a mean concentration of 4.5 µg/m3 of traffic-related
particles.
The coarse particle mass can be calculated for each
individual hour from the difference between PM10 and
PM2.5. Its mean concentration is 5.5 µg/m3. Coarse
particle mass is poorly correlated with NOx,
PMcoarse (µg/m3) = 0.018 NOx (ppb) + 5.3
r = 0.33
Based on the above regression equations, road traffic
is on average responsible for 41% of PM2.5 mass, 32%
of PM10 mass and 3% of coarse particle mass. This is
highly consistent with size distribution measurements
of vehicle exhaust which show primary traffic-emitted
particles to be very small in size and thus
predominantly in the PM2.5 fraction. The contribution
of road traffic to coarse particles is, as expected, very
small.
The correlation of PM2.5 with NOx indicates that on
average 4.5 µg/m3 arises from road traffic and 6.5
µg/m3 comes from other sources. The mean annual
average concentration of secondary sulphate and
nitrates predicted for Birmingham from the map in
Figure 8.2 is 10 µg/m3. Approximately 80% of
sulphate and nitrate mass is expected to be in the
PM2.5 fraction, and applying a seasonal adjustment
(Figure 8.3), this translates to a secondary PM2.5
contribution over the months October to March of 7.0
µg/m3, almost identical to the non-traffic related PM2.5
of 6.5 µg/m3. It may thus be concluded that PM2.5 is
accounted for almost wholly by traffic exhaust-
emitted and secondary particles. On the other hand,
coarse particles, which account for approximately one
third of the PM10 mass in this case, are not associated
with vehicle exhaust emissions, although they may
arise in part from wear of tyres and road surfaces and
resuspension of dust by passing traffic.
8.5 IMPLICATIONS FOR THE CONTROL OF ATMOSPHERIC CONCENTRATIONS OFPM10
Figure 8.8 shows hourly concentrations of coarse
particles as a function of PM10 concentrations. If we
define elevated concentrations of PM10 as above 50
µg/m3, then there are five hours in which coarse
particles make the major contribution to raised levels
of PM10. For the other 150 hours of elevated PM10,
whilst the PM10 concentration increases to 170 µg/m3,
the coarse particle mass is almost level at around 20-
25 µg/m3. Thus by far the majority of episodes (97%
in this dataset) are those associated with excursions in
Chapter 8 : Receptor Modelling and Source Apportionment
Quality of Urban Air Review Group 149

PM2.5 concentrations. Thus, if elevated concentrations
of PM10 are to be avoided in the Winter (when most
episodes occur), the primary requirement will be
control of the sources of PM2.5.
As noted above, the main sources of PM2.5 are (a) road
transport emissions and (b) secondary aerosol. A
clear indication of the relative importance of these two
sources at the Birmingham, Hodge Hill site in the
winter of 1994-95 may be gained from Figures 8.9
and 8.10 which relate PM10 and PM2.5 to NOx, itself a
good indicator of local vehicle emissions. There is a
group of some seven points where at concentrations of
NOx below 250 ppb, the concentration of particulate
matter exceeds 150 µg/m3. These are episodes where
substantially elevated PM2.5 is not associated with NOxand these are interpreted as due to a local source,
probably industrial in character. For the remaining
data, PM2.5 generally relates closely to NOx. There are
a few points where PM2.5 exceeds 50 µg/m3 which lie
well above the regression line and these are
interpreted as having a major contribution from
secondary particles. The vast majority of points,
however, lie very close to the regression line
indicating that road traffic is far the major cause of
elevated PM2.5, and by implication of PM10, at this
site. It should be noted that this is not an abnormally
polluted site since it has PM10 concentrations lower
than Birmingham Central and Birmingham East, and a
mean NOx concentration only slightly higher.
The very clear implication of this dataset is that in the
winter period the control of elevated concentrations of
PM10 can only be achieved by reduction of road traffic
emissions. Thus, whilst control of SO2 and NOx
emissions will have a benefit upon concentrations of
Airborne Particulate Matter in the United Kingdom
150
A45
A41
A456
A457
A38 A435
A441
A34
❸
❶ A47
A4097
A38
A452
M6
A34
A452
Figure 8.7 Locations of Air Quality Sampling Sites in Birmingham.
Source: Adapted from Birmingham City Council - The Environment in Birmingham: 1993.
A38M
Motorways
Strategic highway network
Railways
❶ Hodge Hill
❷ Ward End (Birmingham East)
❸ Birmingham Centre
❷

secondary PM2.5 and PM10 as indicated in Chapter 5,
this will not have any substantial influence upon
winter episodes of PM10 pollution.
8.6 SUMMER DATA
Data from the months April to July 1995 have been
analysed by the same methods as for the winter data.
In the summer period, the mean PM10 at the Hodge
Hill site was 24.7 µg/m3, the same as at Birmingham
Centre (24.7 µg/m3) and higher than at Birmingham
East (18.3 µg/m3). However, the maximum hourly
PM10 was highest at Birmingham Centre (193 µg/m3),
followed by Birmingham East (137 µg/m3) and Hodge
Hill (118 µg/m3). Mean NOx was highest at Hodge
Hill (49.1 ppb) compared with Birmingham Central
(31.5 ppb) and Birmingham East (22.5 ppb).
The mean concentration of PM2.5 at Hodge Hill was
13.1 µg/m3, representing only 53% of PM10. The two
were quite strongly correlated:
PM2.5 = 0.51 PM10 + 0.57 (µg/m3) r = 0.85
Correlations of PM10 and PM2.5 with NOx were
positive, but weak in comparison with the winter data.
Figures 8.11 and 8.12 show the relationship between
fine (PM2.5) and coarse (PM10 minus PM2.5) particles
respectively and PM10. The data show broad scatter
across an envelope with outer bounds of around 85%
coarse particles at one extreme and 85% fine at the
other extreme. The high abundance of coarse
particles, which exceeds that found in other studies in
Birmingham, is probably associated with the
unusually dry weather over much of this period.
Concentrations of hourly PM10 above 50 µg/m3 are
associated both with coarse and fine particles.
Exceedences of 90 µg/m3 are in all but one instance
associated with a predominance of PM2.5 and the
implications for control of excursions are the same as
for the winter period, with the caveat that occasionally
episodes of coarse dust may be a problem.
8.7 MEETING THE EPAQS RECOMMENDED STANDARD
Table 6.17 lists exceedences of various thresholds in
24 hour average concentration of PM10. There are
currently many exceedences of 50 µg/m3 over 24
hours, but far fewer exceedences of 100 µg/m3 and
virtually none of 150 µg/m3. Exceedences of the 50
µg/m3 threshold are more frequent for the rolling 24-
hour mean than the fixed (midnight to midnight)
Chapter 8 : Receptor Modelling and Source Apportionment
Quality of Urban Air Review Group 151
Plot of Hourly Coarse Particles versus PM10 for Birmingham, Hodge Hill; October 1994 to March 1995.
Coa
rse
part
icle
s (µ
g/m
3 )
PM10 (µg/m3)
Figure 8.8
0 50 100 150 200 250 300 3500
10
20
30
40
50
60
70
80
90

means. However, it is clear that a reduction of all 24-
hour concentrations currently in the 50-100 µg/m3
band to below 50 µg/m3 would reduce dramatically
the number of exceedences of the EPAQS
recommended limit.
For the winter data, it is possible to estimate
approximately the extent of control of the major
source of PM10 during episodes of high concentration,
(ie vehicle emissions), in order to reduce a
concentration of 100µ g/m3 to 50 µ g/m3. The
Birmingham (Hodge Hill) data indicate that during
episodes of high PM10, the coarse particle fraction
Airborne Particulate Matter in the United Kingdom
152
Plot of Hourly Fine Particles (PM2.5) versus NOx for Birmingham, Hodge Hill; October 1994 to March 1995.
PM
2.5
conc
entr
atio
n (µ
g/m
3 )
NOx concentration (ppb)
Figure 8.9
(Linear Fit)
0 200 400 600 800 1000 1200 14000
100
200
300
400
Plot of Hourly PM10 versus NOx for Birmingham, Hodge Hill; October 1994 to March 1995.
PM
10 c
once
ntra
tion
(µg/
m3 )
NOx concentration (ppb)
Figure 8.10
0 200 400 600 800 1000 1200 14000
100
200
300
400

shows little dependence upon the episode
concentration and is steady at about 15-20 µg/m3. The
concentration of secondary PM10 is approximately 10
µg/m3, and thus allowing for the small fraction of the
coarse particles associated with vehicle emissions and
secondary PM10, there is a background of about 25
µg/m3 which is not directly associated with vehicle
emissions and will not respond to control of this
source. Thus, to reduce a winter concentration of 100
µg/m3 to below 50 µg/m3 will require a reduction in
the vehicle-emitted component of 75 µg/m3 to 25
µg/m3, ie a control of emissions of 67%. Control of
Chapter 8 : Receptor Modelling and Source Apportionment
Quality of Urban Air Review Group 153
Plot of Hourly Coarse Particles versus PM10 for Birmingham, Hodge Hill; April to July 1995.
Coa
rse
(PM
10-P
M2.
5) (
µg/m
3 )
PM10 (µg/m3)
Figure 8.12
1:1
(Linear Fit)
0 20 40 60 80 100 1200
20
40
60
80
Plot of Hourly PM2.5 versus PM10 for Birmingham, Hodge Hill; April to July 1995.
PM
2.5
(µg/
m3 )
PM10 (µg/m3)
Figure 8.11
(Linear Fit)
1:1
0 20 40 60 80 100 1200
20
40
60
80

the precursors of secondary PM10 is estimated to
deliver a reduction in the secondary component of
about 4 µg/m3 by the year 2010. Taking this into
account, the extent of control required for vehicle
exhaust emissions is from 75 µg/m3 to 29 µg/m3, ie
61%. This analysis is applicable to the majority of
UK urban areas, although in some such as Belfast a
strategy to control emissions from combustion of solid
fuel will also be needed. It should be noted that the
analysis is based upon current measurements of PM10
at central urban background locations. Concentrations
at near-road sites are substantially higher, by a factor
of two or more, and an even greater degree of control
of vehicle emissions will be required if concentrations
at these site are to be reduced to below 50 µg/m3 as a
24 hour average.
The severe pollution episode which occurred in
London in December 1991 represents some of the
worst air quality experienced in the UK in recent
years. Unfortunately PM10 measurements commenced
in London in January 1992 and PM10 concentrations
during the episode can only be estimated from
concentrations of other pollutants. Using data for CO
from the roadside Cromwell Road site and the
inventory ratio of emissions of CO to PM10 from road
traffic in London leads to estimates of maximum
hourly and 24-hour average concentrations of PM10 of
221 µ g/m3 and 155 µ g/m3 respectively.
Concentrations of CO and NOx at the background
sites, Bridge Place and West London were little
different from Cromwell Road and using a ratio of
emissions of PM10 to CO from all sources leads to
estimated hourly and 24-hour concentrations
respectively of PM10 of 216 µg/m3 and 132 µg/m3 at
Bridge Place and 281 µg/m3 and 174 µg/m3 at West
London. These 24-hour concentrations far exceed 100
µg/m3 and indicate that the 61% control of road traffic
exhaust emissions calculated above would not have
been sufficient to bring air quality into line with the
EPAQS recommendation. Indeed, following the
methodology above, reduction of 174 µg/m3 at West
London to 50 µg/m3 would require a reduction of
traffic emissions of PM10 by over 80%.
In the summer months, the impact of vehicle exhaust
emissions on PM10 is lower than in Winter and control
of this source will have less impact. Currently, we
have insufficient information on the episodicity of
secondary particle components to estimate the degree
of control required to reduce summer concentrations
to below 50 µg/m3. However, given the greater
contribution of coarse particles to summer
concentrations of PM10, it seems likely that the 39%
reduction in secondary particle concentrations
predicted for the year 2010 by the HARM model will
be insufficient to guarantee achievement of the air
quality standard.
8.8 CONCLUSIONS
All of the various approaches to source apportionment
lead to the view that two sources of PM10
predominate. The first is road traffic, which
contributes both to coarse and fine particle mass
through resuspension of road surface dusts and
exhaust emissions, respectively. The second major
contributor is secondary aerosol, formed from
emissions of sulphur and nitrogen oxides. In the
winter, episodes of elevated PM10 are associated
almost exclusively with excursions in fine PM2.5
particles due to vehicle exhaust. In summer, there is a
much greater contribution of coarse particles and
secondary aerosol plays a greater role. The clear
implications for control of episodic high
concentrations of PM10 is that tighter limits on particle
emissions from road traffic, and on secondary aerosol
precursors will be essential if both summer and winter
episodes are to be avoided.
8.9 KEY POINTS
• Receptor modelling of the composition of urban
total suspended particulate matter indicates the
following major source categories: road dust and
soil; vehicle exhaust; secondary aerosol and oil
combustion; coal combustion; incineration and the
metals industry, and road salt/marine aerosol.
• Secondary aerosol comprising mainly ammonium
sulphate and ammonium nitrate is ubiquitous over
the United Kingdom with highest concentrations in
the south-east, progressively reducing by a factor of
over two to the north and west.
Airborne Particulate Matter in the United Kingdom
154

• Carbon monoxide and nitrogen oxides may be used
as tracers of vehicle emissions, allowing estimation
of traffic exhaust related PM10 from regression
analyses. These indicate that in winter on average
40-50% of urban PM10 arises from this source.
• The percentage contribution of road traffic to urban
PM10 is typically higher in winter episodes.
• In summer, photochemically-generated secondary
particles appear to be dominant, with a lesser
contribution from vehicle exhaust than in winter.
• In winter the PM2.5 fraction is very strongly traffic-
related with coarse particles providing a relatively
low and constant background.
• In summer the coarse fraction is more important,
although episodes of high PM2.5 do occur.
REFERENCES
Alpert DJ and Hopke PK (1981) A Determination ofthe Sources of Airborne Particles Collected duringthe Regional Air Pollution Air Study , Atmos
Environ, 15,675-687.
Derwent RG, Simmonds PG and Collins WJ (1994)
Ozone and Carbon Monoxide Measurements at aRemote Maritime Location, Mace Head, Ireland,from 1990 to 1992, Atmos Environ,28, 2623-2637.
Friedlander SK (1981) New Developments inReceptor Modelling Theory, ACS Symposium
Series,167, 1-19.
Gordon GE (1988) Wind Trajectory Method forDetermining Compositions of Particles from MajorAir Pollution Sources, Environ Sci Technol,8, 29-
61.
Gordon GE (1988) Critical Review - ReceptorModels, Environ Sci Technol,22, 1132-1142.
Harrison RM and Allen AG (1990) Measurements ofAtmospheric HNO3, HCl and Associated Specieson a Small Network in Eastern England, Atmos
Environ, 24A, 369-376.
Harrison RM, Smith DJT and Luhana L (1995)
Source Apportionment of Atmospheric PolycyclicAromatic Hydrocarbons from an Urban Locationin Birmingham, UK , Environ Sci Technol, in press.
Henry RC, Lewis CW, Hopke PK and Wiliamson HJ
(1984) Review of Receptor Size - PhysicalProperties, Atmos Environ, 18, 1507-1515.
Novelli PC, Masarie KA, Tans PP and Lang PM
(1994) Recent Changes in Atmospheric CarbonMonoxide, Science, 263, 1587-1590.
Pio CA. Santos IM, Anacleto TD, Nunes TV and Leal
RM (1991) Particulate and Gaseous Air PollutantLevels at the Portuguese West Coast,Atmos
Environ, 25, 669-680.
Thurston GD (1983) A Source Apportionment ofParticulate Air Pollution in Metropolitan Boston ,
PhD Thesis, Harvard University, Boston,
Massachusetts.
Chapter 8 : Receptor Modelling and Source Apportionment
Quality of Urban Air Review Group 155

Airborne Particulate Matter in the United Kingdom
156

9.1 HEALTH EFFECTS OF NON-BIOLOGICAL PARTICLES
A detailed review of the possible effects of particulate
air pollution on health has recently been completed by
the Department of Health’s Committee on the Medical
Effects of Air Pollutants (COMEAP, 1995). These
findings are summarised here. Readers are referred to
the COMEAP report for details of the evidence
considered and the detailed justification for the
conclusions presented.
9.1.1 Summary of COMEAP Report
The evidence considered in the COMEAP report is
concerned with effects on health of “suspended
particulate matter” (SPM), comprising solid (soluble
or insoluble) or liquid material present in the air in
particles small enough to remain in suspension for
some hours or days and liable to travel considerable
distances from the source. This corresponds
approximately with the size range of particles,
typically less than 10 µm diameter, capable of
entering the respiratory tract and reaching the deeper
parts of the lungs.
SPM is not a defined entity: both chemical and
physical characteristics vary widely with respect to
source, location and time. There is no clear evidence
as to whether effects on health are related to certain
components or whether they represent non-specific
effects of inhaled particles. Other pollutants or other
factors in the environment, for example, changes in
temperature, can affect the same health endpoints. It
has proved difficult to do representative studies of the
effects of the ambient aerosol under controlled
conditions owing to the impossibility of recreating the
precise particle mixture found in outdoor air. Studies
of the effects of well defined small particles could be
done and these would contribute useful baseline data;
unfortunately few such studies have been reported.
Because of this, there is little evidence other than from
epidemiological studies. Some insight into possible
mechanisms of effect have come from animal studies
though no completely satisfactory explanation for the
findings of epidemiological studies has yet been
produced.
PM10 represents the size range of particles likely to
pass the nose and mouth, PM2.5 represents more
closely the size range of particles able to reach the
deeper parts of the respiratory tract. A significant
proportion of the mass of material collected as PM10 is
less than 2.5 µm in diameter. Particles of about 0.5
µm diameter are least likely to be deposited in the
respiratory tract. Exercise may have a variable effect
on particle deposition depending on particle size and
pattern of respiration. The estimated typical adult
deposition of particles in the PM10 range is about 250
µg/day: in terms of traditional toxicology of inhaled
particles a small dose.
Some experimental studies, mainly in animals and at
high concentrations, show that mixtures of particles
with pollutant gases such as SO2, NO2 or O3 have
effects greater than those of the components
separately, though it is not clear whether these results
would apply at the low concentrations normally
present in the environment. The adsorption of such
gases, or of metals or acid-sulphates, on the surface of
particles may be important. Animal studies also
indicate a potentially important role for ultrafine
particles (< 0.05 µm diameter). They are cleared only
very slowly from the lung and they can penetrate the
pulmonary interstitium inducing inflammatory
responses. It has been suggested that allergenic
material may be carried into the lung in association
with particles though evidence is lacking.
Extensive studies of the effects of well characterised
particles (eg, acid sulphates and sulphuric acid) have
been carried out in volunteers. It has been
demonstrated that at the concentrations likely to be
experienced in the UK no effects would be expected
in normal individuals. Exposure to concentrations of
acid particles and gaseous pollutants has been shown
to lead to an enhanced effect though the findings are
not consistent. Subjects with asthma show enhanced
non-specific reactivity following sulphuric acid
challenge, but not, apparently, following sulphate
challenge. However, all these changes in either lung
volumes or bronchial responsiveness are, in general,
small. The reasons for this may be in part
methodological, but the evidence suggests that there is
unlikely to be a large effect of acid or sulphate
challenge on human subjects.
9 Effects of Airborne Particulate Matter
Quality of Urban Air Review Group 157

On the basis of findings from studies of pollution
episodes in the 1950s to 1960s, when concentrations
of suspended particulate matter, together with SO2,
were very high, it was not anticipated that adverse
effects on health would be demonstrable at the much
reduced concentrations of more recent years.
However, a series of intensive studies, mainly in the
United States, has demonstrated small changes in a
wide range of health indicators, showing clearer
associations with concentrations of particles than with
other pollutants.
To some extent, the new findings have been
dependent on the introduction of advanced statistical
computing techniques, handling large data sets
covering many variables. Such methods have passed
into general use during the past 10-15 years. These
procedures have been examined carefully and they are
considered to be appropriate and the results are robust
to a variety of statistical methods. It is unlikely that
the findings of recent epidemiological studies are an
artefact of the statistical methods employed.
Indicators of ill-health examined in relation to acute
effects have included day-to-day variations in
mortality, hospital admissions, emergency room visits,
time off school or work, respiratory symptoms,
exacerbations of asthma and changes in lung function.
Of these various indices, the measurement of
mortality is the most certain. In addition, effects on
mortality have been particularly well studied and the
results have been generally more consistent than those
regarding the other indices. In most, associations with
SPM, expressed at least in the more recent studies as
PM10, have been observed, within a relatively low
range of concentrations of similar magnitude to those
found in the UK today. It does not necessarily follow
that the same types or sizes or components of particles
are involved in these diverse effects. The composition
of particles monitored as PM10 can vary widely from
area to area and with time. However, the size of the
estimated effects, particularly as regards effects on
mortality, does not vary greatly with location.
Short-term variations in these health indicators have
been demonstrated to be influenced by factors such as
temperature and (even minor) epidemics of infections
such as influenza, as well as possible effects of other
pollutants, including SO2 and ozone. Considerable
efforts to control statistically for the effects of
confounding factors have been made in recent
epidemiological studies. For example, in the most
recent studies in the United States, possible effects of
air pollution have only been examined once all other
identifiable variations in the health indicators have
been accounted for. The likely success of the methods
used inevitably depends on how well the confounding
factors have been characterised and on this point there
remains room for debate. Overall, control for
confounding factors, in the more recent studies, is
accepted as good. The possibility of some
unmeasured confounding factor playing a role cannot
be dismissed, but this is not considered likely.
Though the results of most epidemiological studies are
described as providing exposure-response
relationships, it should be remembered that, in
general, they provide information on ambient
concentration-response relationships across the
population studied. In any population the range of
personal exposure and consequently dose is likely to
be considerable and monitoring the ambient
concentration of a pollutant will provide only an
estimate of exposure.
There is no clear indication that effects on health are
restricted to specific types of particles. Findings from
epidemiological studies have demonstrated
associations with particles in a wide range of
circumstances, including those in which primary
emissions from motor vehicles, industrial sources or
coal fires or where secondary aerosols derived from
gaseous emissions (SO2 and NOx from power stations
and other stationary sources with further NOx from
traffic) are important. It is unlikely, however, that
coarse, wind-blown particles have a significant effect
upon health.
It is well established from the reported studies that
those with pre-existing respiratory and/or cardiac
disorders are at most risk of acute effects from
exposure to particles. It has been suggested that acute
effects occur when air pollution worsens an acute
condition such as a respiratory infection or heart
attack in people with pre-existing chronic disease.
There is no convincing evidence that healthy
Airborne Particulate Matter in the United Kingdom
158

individuals are likely to be significantly affected by
levels of particles found in ambient air in the UK.
In most of the statistical analyses of epidemiological
studies, relationships have been expressed as
regression equations from which the magnitude of
effects linked with changes in pollution can be judged.
An example, from a study in Detroit, indicates that a
30 µg/m3 increase in PM10, as a 24 hour average, was
associated with a 3.5% increase in hospital admissions
for pneumonia. This, of course, does not imply that
exposure to such pollution initiated the illness: it
should be considered as causal only through
predisposing to, or worsening, the illness and
precipitating the need for admission to hospital.
No evidence for thresholds of effect has appeared
from the studies so far reported, though it should be
noted that several studies are not powerful enough to
examine the issue critically at low concentrations.
The principal question to consider in reviewing the
rapidly expanding literature on effects of SPM is
whether the statistical associations demonstrated
indicate a causal role. There is certainly a remarkable
degree of consistency and coherence in the direction
and magnitude of findings from a diversity of studies,
carried out in different localities in the United States
and elsewhere, with a range of different health
indicators and varying sources of pollution.
COMEAP considers the reported associations
between levels of particles and effects on health
principally reflect an actual relationship and not some
artefact of technique or the effect of some
confounding factor. The indications that the
association is likely to be causal are certainly strong.
The only major difficulty in reaching any firmer
conclusion about causality is the lack of established
mechanisms of action. The mass of SPM associated
with adverse effects is very small, and while there is
evidence relating to acute effects of some
components, the fact that in epidemiological studies
similar effects have been reported in localities with
different types of suspended particulate matter
suggests that there may be a non-specific effect of
particles. The effects have not been explained in
terms of the results of conventional inhalation
toxicology studies but carriage of material on particle
surfaces could play a role. It has been suggested, but
by no means proven, that ultrafine particles (< 0.05
µm) may play a role. Such particles would be more
prominent close to sources, before they had time to
coalesce into the more stable accumulation mode, and
they would represent only a small proportion of the
mass of material measured as PM10, though they
would represent a high proportion of the number of
particles present. Although reported studies indicate a
range of effects, from small changes in ventilatory
function or exacerbations of asthma through to
increases in deaths among the elderly or chronic sick,
it does not necessarily follow that the same
components would be involved in each effect.
9.1.1.1 Implications for Public Health in the UK
COMEAP concluded that, in terms of protecting
public health, it would be imprudent not to regard the
associations as causal and also that the findings of the
epidemiological studies of the acute effects of
particles, which have been conducted in the US and
elsewhere, can be transferred to the UK at least in a
qualitative sense. However, it was considered that
there are insufficient UK data available to allow direct
extrapolation and reliable estimation of effects in the
UK.
It would be possible, but unwise, to take a weighted
average of the results of the published studies and
apply this to conditions in the UK. The coefficient
produced by Schwartz (1994) with regard to effects of
particles on mortality was 1.06 (CI: 1.05-1.07) for a
100 µg/m3 change in TSP. No similar figure based on
structured meta-analysis and providing confidence
intervals is available with respect to PM10. Because of
this, COMEAP felt it would be unwise to offer a
single coefficient with regard to effects on mortality or
other indices of ill health. The reader is referred to the
COMEAP report where a collection of estimates
derived from a wide range of studies is presented. It
should be recalled that estimates based on studies
reported in this collection are likely to provide only a
first approximation to the actual effect in the UK.
COMEAP recommend that studies should be
undertaken urgently to allow better quantitative
predictions to be made. In comparison with other
Chapter 9 : Effects of Airborne Particulate Matter
Quality of Urban Air Review Group 159

uncontrolled factors, eg, variations in temperature, the
effects of day-to-day variations in levels of particles
are small.
9.1.1.2 Chronic Effects
With regard to indicators of possible chronic effects
on health as a result of exposure to particles, in the
UK, there has been a long-established association
between the prevalence of, and mortality from,
chronic respiratory disease (bronchitis) and exposure
to the SO2/particle complex associated with coal-
burning. The role of the particulate component has
remained uncertain and other factors, notably
smoking, have been shown to be of major importance.
Disentangling the roles of multiple factors operating
throughout life has proved to be a difficult task, but in
some recent US studies, it has been possible to follow
selected population groups for a number of years,
relating death-rates among them to local pollution
levels. Associations have been found to be closer with
concentrations of particles than with those of other
pollutants, but in view of uncertainties about the
possible relevance of (higher) exposures to pollution
earlier in life and the difficulties in fully adjusting for
confounding factors, quantitative assessments are in
doubt. The lower prominence given to this aspect of
the effects of particles on health in the COMEAP
report reflects the lack of data rather than the potential
importance of possible effects on the public health.
Evidence regarding the effects of long term exposure
to particles on health is less well developed than that
regarding the acute effects. The possibility of
confounding in such studies is considerable and it is
difficult to estimate the exposures of individuals over
relevant time periods. Here again the results of recent
US studies are probably transferable to the UK in a
qualitative sense though confidence in the accuracy of
the predictions is lower than with regard to the acute
effects of particles. Though the evidence is limited
COMEAP advised that it would be prudent to
consider these associations as causal.
There is little evidence to show that exposure to
atmospheric particles contributes significantly to the
burden of cancer in the UK. The presence of
genotoxic carcinogens in particles means that such a
contribution cannot be ruled out, though it is likely to
be exceedingly small.
9.1.1.3 Conclusions
The COMEAP report ended with the following brief
conclusions:
“The Committee considers the reported associations
between levels of particles and effects on health
principally reflect an actual relationship and not some
artefact of technique or the effect of some
confounding factor.
In terms of protecting public health it would be
imprudent not to regard the demonstrated associations
between levels of particles and effects on health as
causal.
We find it difficult to reach a firmer conclusion about
causality due to the lack of any established
mechanism of action.
We believe that the findings of the epidemiological
studies of the acute effects of particles, which have
been conducted in the US and elsewhere, can be
transferred to the UK, at least in a qualitative sense.
It as accepted that insufficient UK data are available to
establish the reliability of quantitative predictions of
the effects of particles upon health in the UK.
We consider that results of recent US studies of the
effects of long-term exposure to particles are probably
transferable to the UK, though confidence in the
accuracy of the predictions is lower than with regard
to the acute effects. Although the evidence is limited,
we advise that it would be prudent to consider these
associations as causal.
There is no convincing evidence that healthy
individuals are likely to be significantly affected by
levels of particles found in ambient air in the UK.”
Airborne Particulate Matter in the United Kingdom
160
9.2 THE EFFECTS OF PARTICULATE MATTER ON VISIBILITY
Good visibility away from towns and cities in Europe
is generally around 40-50 km (Horvath, 1995) and on
very rare occasions may be as great as 100-150 km.
The light seen by an observer consists of radiance
transmitted directly from the target plus radiance
along the path. The transmitted light decreases as
light is either scattered or absorbed along the path and
visibility is thus reduced. As the range of vision
increases, path radiance (light scattered into the sight
path) increases and the light transmitted from the
target decreases, causing a decrease in the visibility.
Transmittance is governed by the extinction
coefficient of the atmosphere, which is made up of
two terms, one for particles and one for gases and
each of these is made up of two further terms, one
accounting for scattering and one for absorption of
light.
Absorption of visible light is most effective at particle
diameters around 1 µm, as these particles have a
diameter close to the wavelength of light. Scattering
of light is effective over a range of particle diameters
but is dominated by aerosol of between 0.2 and 2 µm.
These aerosol particles may be particularly affected by
changes in relative humidity, as deliquescence may
occur as humidity increases, causing the formation of
a haze which may decrease visibility. Studies have
been conducted into visibility reduction by identifying
individual substances within the atmosphere and
applying an extinction coefficient to each of these.
These studies suggest that scattering is the dominant
process for light extinction, with absorption being
responsible for between 10% (in rural areas) and 30%
(in urban areas) of extinction.
Atmospheric visibility is defined as that distance at
which a black object can be seen against the horizon.
Particles suspended in the atmosphere between the
observer and the object act to reduce the contrast and
thus reduce the visual range. From studies in the
south of England, Lee (1990) has suggested that the
most important source of long-term changes in
visibility is changes in primary emissions within the
UK rather than the long distance transport of polluted
air from continental Europe. However it was also
found that wind directions and circulation types most
favourable for the transport of pollution from central
Europe are those in which there has been least
improvement, showing that the continent is a
significant source of air pollution during the summer.
Gomez and Smith (1987) found a decrease in fog
frequency in Oxford after the implementation of the
Clean Air Act, despite that the fact that there were no
increases in winter sunshine levels over the same
study period. Clarke and Papapanayotou (1987) made
measurements of optical properties of roadside aerosol
in the city of Leeds, and found that the absorption
coefficient of aerosol at the roadside was three times
that on a rooftop 30m above the road. The authors
also suggested that smoke values could be used to
predict the atmospheric absorption coefficient, and
that in this way smoke data could be used to assess the
importance of optical absorption on visibility
degradation.
Lee (1994) has also analysed visibility trend data from
22 sites in urban, coastal and inland rural locations.
He found that visibility at nearly all sites had
increased over the period 1962-1990, with the largest
improvements being in urban areas where median
visibility often now approached or exceeded values at
rural locations. Visibility increases at rural sites were
most marked in the north of the country away from
both major UK and continental sources. The
improvement in visibility in southern England is less
marked and it is speculated that this may be due to
increased frequency of photochemical episodes, and
the long range transport of pollutants from the
continent. Harrison and Colbeck (1984) also found
that high concentrations of secondary pollutants
caused a decrease in visibility in north-west England,
the best correlation being with the ammonium
concentration.
Research currently underway at The University of
Birmingham is investigating the influence of PM10
concentrations on visibility, and is looking at long
term trends in visibility. Figure 9.1 shows the
increase over time in visibility as represented by
percentiles of visual range for the Elmdon reporting
station at Birmingham airport. The graphs show that
for 10th 50th and 90th percentiles the visibility has
Chapter 9 : Effects of Airborne Particulate Matter
Quality of Urban Air Review Group 161

increased appreciably since 1950 during both Summer
and Winter periods.
PM10 data collected at the Birmingham city centre
AUN site have also been related to visibility data
provided by the University Weather Service, from a
site approximately 3 miles south of the city centre.
There are problems associated with the analysis of
visibility data however, due to the fact that the data are
recorded by comparing visibility against markers
(such as buildings or landmarks) at known distances
from the observer, hence the data appear as a
frequency distribution. The data for Birmingham for
1993 at 15.00 show a high degree of correlation
between PM10 concentration and visibility (r2 = 0.57)
when a mean PM10 concentration is taken for each
visibility class (Figure 9.2), indicating that particulate
matter exerts a strong control on visibility. Similar
relationships can be found at different times of day,
although other meteorological parameters such as
relative humidity will influence visibility to a greater
extent.
9.3 NUISANCE FROM SOILING
The issues of nuisance from smoke, fumes and odour
were considered by QUARG in their First Report
(Section 2.9) and Second Report (Section 4.9). The
specific issue of the effects on buildings and materials
were addressed in Sections 2.10 and 4.11 respectively.
Soiling is generally regarded as the dirtying or
blackening of surfaces by particulates. Road vehicles
contribute to urban soiling mainly through the
deposition of exhaust particulates onto surfaces.
Vehicles are a major source of particulate matter and
black smoke in urban areas (QUARG, 1993) with
diesel emissions widely regarded as having a greater
blackening propensity than petrol engine emission and
coal fires. Assessment of the relative contributions of
various sources to urban soiling is complex and may
depend on a number of factors, such as:
Airborne Particulate Matter in the United Kingdom
162
0
10
20
30
40
50
60
70
80
858075706560551950
Figure 9.1a Visibility Trends, Elmdon Summer.
10 Percentile
50 Percentile
90 Percentile
Year
Vis
ibili
ty (
'000
m)
0 20 40 60 80 1002
3
4
5
Figure 9.2 PM10 Concentration vs log Visibility, 15.00 hours Readings for Birmingham.
Note: Visibility data are for Edgbaston, and PM10 data for Centenary Square in the city centre.
PM10 concentration (µg/m3)lo
g vi
sibi
lity
(m)
0
10
20
30
40
50
60
70
80
858075706560551950
Figure 9.1b Visibility Trends, Elmdon Winter.
10 Percentile
50 Percentile
90 Percentile
Year
Vis
ibili
ty (
'000
m)

• the particular soiling/dirt problem under
investigation;
• the blackness per unit mass of smoke;
• the particle size distribution;
• the chemical nature of the particles;
• substrate-particle interfacial binding;
• surface orientation;
• micrometeorological conditions.
Recent research (Williams and McCrae, 1995) has
indicated that the soiling of buildings is a low priority
environmental issue compared to other concerns the
public have about their local environment, as
displayed in Table 9.1. The relative rankings are based
on the number of respondents from each location who
were very/extremely worried about each issue. The
rankings are averages and run from 1 to 10, with 1
representing the highest level of concern and 10 the
lowest. The low ranking of building soiling is
unexpected given its very visible impact, especially on
high profile historic buildings such as St Paul’s
Cathedral, and the economic costs of cleaning soiled
buildings. However, although this issue is relatively
lowly ranked in comparison to other local
environmental issues, it still generates a significant
amount of public concern in certain areas of the
country. The research showed that on average, 48% of
respondents in UK cities claimed moderate to extreme
disturbance from building soiling, with the range
extending from 12-70% depending upon area and
respondent group. In general, 20-40% of respondents
blamed the soiling of buildings upon road traffic
pollution. These figures are in good agreement with
those of Ball and Caswell (1983), who suggested that
one-third of the UK population were bothered by
vehicle-induced soiling of property in the early 80’s.
This evidence, together with other data showing that
the physical presence of road traffic is as important as
the presence of pollutants, may indicate that health
and safety concerns are more important to the public
than aesthetic issues associated with diesel pollution.
The Middlesex University team have conducted a
series of exposure studies (Hamilton and Mansfield,
1992) using stone tablets and painted wood, in a road
tunnel and in the ambient environment (sheltered and
unsheltered). The existing models predict an
exponential decrease of reflectance with time and
these were satisfactory for predicting soiling in a
tunnel but not in an ambient situation. Satisfactory
empirical relationships for ambient exposures involve
a loss in reflectance ∆R which varies with the square
root of the exposure time.
Chapter 9 : Effects of Airborne Particulate Matter
Quality of Urban Air Review Group 163
Table 9.1 Rank Order of Respondent Concern About Local Environmental Issues at Selected UK Sites.
Issue Birmingham Cardiff Coventry Edinburgh Sheffield Wood Green OverallLitter & Rubbish 2.8 2.2 2.0 4.0 1.2 1.3 2.3
Amount ofRoad Traffic 1.8 1.8 4.0 1.2 2.2 4.0 2.4
Smoke, Fumes& Odour 2.0 3.0 1.8 2.2 3.5 2.7 2.5
Dog Mess 3.8 2.8 2.0 3.0 4.8 2.0 3.1
Dust & Dirt 5.8 5.2 6.8 5.0 5.0 4.3 5.4
Ugly/DisusedBuildings 6.5 6.2 5.2 8.0 6.0 7.3 6.5
Noise 5.8 7.8 6.8 6.0 8.0 7.7 7.0
Graffiti 7.8 8.2 8.2 7.5 5.0 6.7 7.3
Smog 8.5 8.0 7.5 8.0 7.8 8.3 8.2
Blackening ofBuilding Walls 9.5 9.5 9.2 9.0 9.8 9.7 9.4

Rainfall generally produced a cleaning effect but the
relationship is complex and cannot be quantified at
present.
9.4 EFFECTS OF ATMOSPHERIC AEROSOLS ON CLIMATE CHANGE
Atmospheric aerosol in the troposphere influences
climate in two ways: directly, through the reflection
and absorption of solar radiation, and indirectly
through the modification of the optical properties and
lifetime of clouds. Estimation of the radiative forcing
induced by atmospheric aerosols is much more
complex and uncertain compared with the well-mixed
greenhouse gases because of the complex physical and
chemical processes involved with aerosols and
because of their short lifetimes which make their
distributions inherently more inhomogeneous.
The haze visible from high-flying aircraft over
continental areas is a dramatic manifestation of the
important role played by the atmospheric aerosol in
scattering sunlight. Much of this aerosol is derived
from human activities and the increase in optical depth
over and downwind of industrial regions is significant
compared with the natural background. The major
contributions to the man-made component of the
aerosol optical depth arise from sulphates produced by
the oxidation of sulphur dioxide released by fossil fuel
combustion and from the oxidation of the organic
substances produced by biomass burning.
The net global mean radiative forcing due to the
increase in atmospheric aerosols due to human
activities, including fossil fuel combustion and
biomass burning, since pre-industrial times is
negative, exerting a cooling influence on the climate
system. The Intergovernmental Panel on Climate
Change estimates this influence to be -0.5 W/m2
globally, or about 20% of the total effect of
greenhouse gases. However the effects of aerosols are
highly regional, reaching a maximum over
industrialised land masses. The IPCC have only given
firm estimates for the direct, scattering effect. The
indirect effect is highly uncertain and is in the range
0 - 1.5W/m2.
Human activities lead to the emission of black soot or
carbon particles whose main effect is to absorb
radiation rather than to scatter it. Such aerosols can
exert a warming effect on the climate system although
it is very much smaller in magnitude than that due to
the greenhouse gases. The IPCC estimates the
radiative effect of soot aerosols to be around +0.1
W/m2, or approximately 5% of total greenhouse gas
forcing. This is accounted for in the total forcing
influence of -0.5 W/m2 above.
The impact of aerosol on the optical properties of low
level clouds has been demonstrated in localised
observations but the global scale impact has yet to
rigorously quantified. These indirect effects of
aerosols on climate depend on complex processes
involving aerosol particles and the nucleation and
growth of cloud droplets. These effects are expected
to be smaller for additional aerosol introduced into
already polluted air. There is some observational
evidence to suggest that the mean sizes of cloud
droplets are larger in the Southern Hemisphere where
tropospheric aerosol concentrations are generally
lower than in the Northern Hemisphere where aerosol
concentrations are generally higher.
Estimates of the indirect effect of sulphate aerosols are
somewhat larger than the direct effect, though
significantly more uncertain. Taken together, both
direct and indirect, both scattering and absorption,
have led to a negative radiative forcing since
preindustrial times which is about one half to three-
quarters that due to the long-lived greenhouse gases. It
is likely that much of this radiative forcing is
concentrated over continental areas and that it has a
significantly different spatial pattern to that of the
greenhouse gases.
REFERENCES
Ball DJ and Caswell R (1983) Smoke from Diesel-Engined Road Vehicles - an Investigation into theBasis of British and European Emission Standards,Atmos Environ, 17, 169-181.
Clarke AG and Papapanayotou I (1987) Optical andChemical Properties of Roadside Aerosols, Sci Tot
Environ, 59, 131-140.
Airborne Particulate Matter in the United Kingdom
164
Colbeck I and Harrison RM (1984) Ozone-Secondary Aerosol-Visibility Relationships inNorth West England, Sci Tot Environ, 34, 87-100.
Committee on the Medical Effects of Air Pollutants
(1995) Health Effects of Non-Biological Particles,Department of Health, HMSO, London.
Gomez B and Smith CG (1987) AtmosphericPollution and Fog Frequency in Oxford, 1926-1980, Weather, 42, 98-106.
Horvath H (1995) Estimation of the AverageVisibility in Central Europe , Atmos Environ,29,
241-246.
IPCC (1996) IPCC Second Assessment Report, in
Press.
Lee DO (1990) The Influence of Wind Direction,Circulation Type, and Air Pollution Emissions onSummer Visibility Trends in Southern England,
Atmos Environ, 24, 195-201.
Lee DO (1994) Regional Variations in Long-termVisibility Trends in the UK, 1962-1990, Geography,
79, 108-121.
QUARG (1993) Urban Air Quality in the UnitedKingdom, QUARG, London.
Schwartz J (1994) Air Pollution and DailyMortality: a Review and Meta-Analysis, Environ
Res, 64, 36-52.
Williams ID and McCrae IS (1995) Road TrafficNuisance in Residential and Commercial Areas,Sci Tot Environ, 169, 75-82.
Chapter 9 : Effects of Airborne Particulate Matter
Quality of Urban Air Review Group 165

Airborne Particulate Matter in the United Kingdom
166

The study of airborne particulate matter has lagged
behind research on most of the other common air
pollutants. This has probably happened because
particulate matter was not perceived as a significant
threat to health once the extreme pollution
characterised by the London smogs was abolished.
The other problems associated with airborne
particulate matter, such as soiling and visibility
degradation were not perceived as major issues in
comparison to health concerns relating to pollutants
such as sulphur dioxide, nitrogen dioxide and ozone.
However, the recent epidemiological work pioneered
by the Harvard School of Public Health, but now
being repeated around the world, has built a strong
case for believing that fine airborne particles have a
serious detrimental influence on health. This has led
to a burgeoning of interest in particulate pollutants,
although the base of data has been severely limited.
For reasons which were sound at the time, airborne
particulate matter in the UK atmosphere has
traditionally been measured by the Black Smoke
method. This nowadays gives no useful indication of
the mass of particles per unit volume of air, and it was
a far-sighted decision by the Department of
Environment to introduce automatic gravimetric
TEOM monitors for particulate matter when the
Enhanced Urban Network (now part of the Automatic
Urban Network) was established, starting in 1991.
This Network, which is still growing, has provided
invaluable high quality data upon the concentrations
of PM10 particles in our major towns and cities. The
data available to the policy makers and research
workers from this network, to be made available in
due course to the general public, probably equals that
of any other country in the world and far exceeds the
quality of data available in many other developed
countries in terms of the time response and speed of
availability to the user.
Airborne particles in the UK atmosphere arise from a
wide variety of sources. Receptor modelling methods,
which depend upon hour-to-hour and day-to-day
variations in the concentrations and chemical
composition of the airborne particles, give a useful
indication of the diverse range of sources. These
show road transport to be a very major source of
particles in urban air, both through exhaust emissions
and coarse dust resuspended from the road surface by
atmospheric turbulence induced by the passage of
traffic. Traffic also generates particles from the wear
of rubber tyres and of the road surface itself. Both sea
spray and de-icing salt lead to the presence of sodium
chloride particles in the atmosphere, even at locations
remote from the sea. The other main source of
particles arises from the emission of sulphur dioxide,
mostly from power stations and other industry, and of
nitrogen oxides from road traffic, power stations and
other combustion sources. These gases are oxidised in
the atmosphere to form sulphuric and nitric acids
which are neutralised with atmospheric ammonia to
form the so-called secondary aerosol of mainly
ammonium sulphate and ammonium nitrate. Because
of its rather slow formation and long atmospheric
lifetime, concentrations of secondary particles are far
more uniform across the UK than the primary
emissions from road traffic, which are concentrated
mainly in urban areas. The European continent
contributes significantly to the airborne loading of
secondary particles in the UK atmosphere.
Concentrations of secondary aerosol are highest in the
South-East of the country, diminishing towards the
North and West. Road transport contributes to
secondary aerosol concentrations through emissions of
NOx. In London, a very high proportion of PM10 is
accounted for by the sum of vehicle exhaust emissions
and secondary particles.
Airborne particles vary greatly in their size and this
influences their atmospheric behaviour. Particles
emitted from combustion sources and formed from
gas to particle conversion are initially very small in
size (around 0.02 µm diameter) and very numerous.
These particles have the greatest influence on the
atmospheric particle number count, which in polluted
locations often exceeds 100,000 particles per cubic
centimetre. These very fine nucleation mode particles
rapidly coagulate with other particles in the air to form
the accumulation mode, comprising particles of
intermediate size which are capable of existing in the
atmosphere for 10 days or so, which can therefore be
transported over very large distances by the wind.
Most particles arising from human activity fall into
these two size categories which have the greatest
implications for human health. Airborne dusts
produced by mechanical disintegration processes such
10 Conclusions
Quality of Urban Air Review Group 167

as grinding and milling, break-up of soil surfaces by
the wind and formation of sea spray from breaking
waves tend to be appreciably larger in size and form
the coarse particle fraction within PM10. Whilst such
particles arise in part from human activity, such as
dusts resuspended from the road surface by passing
traffic, a major proportion is probably natural in origin
and hence very difficult to subject to controls. Indeed,
it is only because the UK has a relatively wet climate
and much of the ground is covered in vegetation that
airborne concentrations of wind-blown dust are not
much higher.
Emissions inventories are well able to quantify
sources such as road traffic exhaust and power station
emissions. They also include such activities as
quarrying and the generation of particles from tyre
wear; the associated emission factors must be far less
certain, however. The inventories attribute an
appreciable proportion of airborne particulate matter
nationally to road traffic emissions and show that in
urban areas the influence of road traffic is very much
greater. Emissions from diesels make up far the major
part of the total particle mass from road traffic; the
modern catalyst-equipped petrol engine is currently
the cleaner option with respect to PM10 emissions.
The inventories are not well able to accommodate
secondary particles formed in the atmosphere, but
high quality numerical models of atmospheric
chemistry and transport are available, which not only
give a good capability for predicting current
concentrations of secondary components in the
atmosphere, but can also predict the impact of future
controls on SO2 and NOx emissions upon airborne
concentrations of secondary PM10.
Control strategies for airborne particulate matter must
address the sources of particles contributing to
episodes of elevated concentrations. In some areas,
these include coal burning, and locally may include
construction and demolition activities as well as
industrial operations like iron and steel production and
minerals extractions. In the great majority of urban
areas, however, vehicle emissions, predominantly of
fine particles (PM2.5) are the dominant source.
Simultaneous measurements of PM10 and PM2.5 show
that in winter road traffic contributes little to coarse
particle concentrations in the atmosphere, and also
that coarse particles rarely contribute significantly to
raised concentrations of PM10 in the urban
atmosphere. Coarse particles are also of limited
atmospheric lifetime, and hence travel distance, and
may thus give rise to local problems, but have little
impact on a city-wide or national basis. The sources
are largely natural and/or diffuse, and control
strategies need careful consideration in the light of
this.
There are a number of reasons why control strategies
for PM10 in urban areas should concentrate on the fine
PM2.5 fraction which include:
• The most severe excursions in PM10 occur in the
winter months when PM2.5 is the predominant
fraction.
• As noted above, it is excursions in PM2.5 which lead
to the majority of elevated concentrations of PM10,
especially in the winter months.
• The sources of PM2.5 are well defined and are
controllable.
The work in which PM2.5 and PM10 have been
measured simultaneously over a period of many
months clearly indicates that road traffic exhaust
emissions and secondary aerosol together can account
for essentially all of the atmospheric loading of PM2.5.
It follows that these are the sources which should be
the main target if controls on PM10 are required.
Using data upon winter concentrations of PM10 it is
possible to calculate the extent of control required to
reduce 24-hour PM10 concentrations of 100 µg/m3 to
meet the EPAQS recommended standard of 50 µg/m3.
The reasoning has been set out in Chapter 8 and leads
to an estimated requirement of about 60% control of
vehicle-emitted particulate matter if the majority of
central urban background sites are not to exceed 50
µg/m3, or are to exceed it only very infrequently. The
projected reduction in emissions of particulate matter
from road traffic by the year 2010 are about 50% but
this gives no ground for complacency. Firstly, the
projected reductions in particulate matter emissions
assume that renewal of the vehicle fleet will continue
at a rate comparable to that in the past, and that new
Airborne Particulate Matter in the United Kingdom
168

vehicles will conform to the EC emissions limits and
continue to do so even as they age. Secondly, the
dataset from which current airborne concentrations are
taken comes from measurements at central urban
background locations. To meet the EPAQS standard
at roadside sites, where concentrations are typically
double the urban background, and during extreme
episodes will require a far greater degree of control.
For example, to have limited 24-hour average PM10 to
below 50 µg/m3 in the December 1991 pollution
episode in London is estimated to require a reduction
of over 80% in road traffic exhaust emissions.
Data based on fixed 24-hour measurements of PM10
listed in Table 6.17 indicate that measures which
effect a reduction of all 24-hour PM10 concentrations
currently in the 50-100 µg/m3 band to below 50
µg/m3 would have a dramatic influence upon air
quality. Exceedences of 50 µg/m3 over fixed 24-hour
periods would drop from 442 to just 5 in the 1992-
1994 data from the network listed in Table 6.17 if
Belfast, which is exceptional due to the continued
combustion of solid fuels in domestic premises, is
omitted. This requires a 50% cut in peak
concentrations of PM10, although to bring all rolling
24-hour concentrations below the 50 µ g/m3
recommended by EPAQS would require a larger
reduction. Whilst the majority of exceedences of 100
µ g/m3 (24 hour average) occur in winter,
concentrations in the 50-100 µg/m3 band occur in all
months of the year. In summer, the seasonal average
contribution of vehicle emissions to PM10 is
considerably less than that in winter, and the
significant correlation of peak hourly PM10 with peak
hourly ozone clearly indicates the importance of
photochemically produced secondary particles at this
time of year. Coarse particles can also make a
substantial contribution in summer. Numerical
projections using the HARM model indicate that a
39% reduction in secondary particles is likely to be
achieved by the year 2010 on the basis of agreements
already in place for the control of sulphur and nitrogen
oxides. The background PM10 due to coarse particles
is typically greater in summer than in winter, and
although our understanding of the episodicity of PM10
pollution due to secondary particles is not as complete
as for vehicle-emitted particles in winter, it seems
certain that a level of control of secondary particles
well in excess of 39% will be needed to reduce
summer PM10 to below 50 µg/m3 given the high
background of coarse particles. A complementary
strategy would involve control of coarse particles also,
but current understanding of the sources and hence
implications for control is insufficient in relation to
coarse particles.
Detailed analyses of the air quality data clearly show
the immense importance of road traffic emissions in
influencing PM2.5 and PM10 concentrations when these
are elevated. In winter, a dramatic reduction of hourly
exceedences of 50 µg/m3 of PM10 could be achieved
solely by limiting road traffic exhaust emissions.
Currently, diesel vehicles, in particular trucks and
buses, are the main contributor to PM10 emissions
from this sector. In our Second Report, the results of
predictive calculations of future emissions of
particulate matter from road transport were presented.
These indicated the importance of control of diesel
vehicles in reducing emissions of particulate matter
from road traffic. The revised projections of future
emissions included in this report show that measures
currently in place will not deliver a sufficient
reduction in primary emissions to ensure that all
concentrations fall within the EPAQS recommended
limit, even by the year 2010. These projections are
based upon a modest level of market penetration by
diesel cars, and any increase in market share for
diesels would inevitably make matters worse as the
current technology diesel car emits far more
particulate matter than the modern petrol car, and
although technological development of the diesel will
narrow the gap, there is no current prospect of the
diesel improving beyond the petrol car. Additionally,
the diesel car emits more nitrogen oxides than the
near-equivalent petrol vehicle with a three-way
catalyst and hence the impact of more diesel cars in
the parc upon future secondary particle concentrations
will also be deleterious.
In its eighteenth report on transport and the
environment, the Royal Commission on
Environmental Pollution recommended the
implementation of the most stringent controls
practicable on particulate matter in the Stage III
emission limits to be introduced by the European
Commission in the year 2000. The Royal
Chapter 10 : Conclusions
Quality of Urban Air Review Group 169

Commission also drew attention to the problems of
simultaneous control of both particulate matter and
nitrogen oxides from the diesel and recommended that
limits on one pollutant should not be at the expense of
the other. It is clear from the data and analyses
presented in this report that stringent additional
controls both on particulate matter from road
transport, and upon the emissions across Europe of
sulphur and nitrogen oxides responsible for the
formation of secondary particles in the atmosphere,
will be essential if UK urban particulate matter
concentrations are to be reduced in line with the
recommendation of the Expert Panel on Air Quality
Standards. Additionally, in some localities, further
controls on burning of coal and other solid fuels, and
of emissions from major point sources will also be
required.
Airborne Particulate Matter in the United Kingdom
170
Inventories
1. Further studies of emission factors for particulate matter from road vehicles, especially heavy duty vehicles are
needed. This should include tyre and brake wear as well as exhaust emissions. Where possible, on-the-road
measurements are preferable.
2. Size differentiated emission factors for other sources of primary particulate matter such as construction work,
quarrying, agriculture and resuspension from road surfaces should be determined under typical UK conditions.
3. Inventories of primary PM10 are needed for a greater number of urban areas.
Monitoring and Chemistry
4. A number of PM10 monitoring stations should be located in rural areas to establish rural concentrations and to
evaluate particulate matter concentrations in air arriving from the European continent.
5. Monitoring of PM2.5 should be carried out at a number of Automatic Urban Network stations.
6. Measurements of particle number count should be carried out on an experimental basis at sites including urban,
rural and roadside locations.
7. Measurements of size distribution of particles in the UK atmosphere in terms of particle number and mass, and
for individual chemical constituents, should be made.
8. Studies of personal exposure to airborne particles should be conducted, including co-exposure to particles and
airborne allergens.
9. Co-located measurements of TSP, PM10, PM2.5 and black smoke should be conducted at selected sites to
establish inter-relationships in relation to particle chemical composition.
10. Studies of the surface chemical composition of particles are relevant to a full comprehension of their health
impact, and are hence recommended.
11. Studies of the spatial distribution of PM10 and PM2.5 across urban areas are needed.
Receptor Modelling and Source Apportionment
12. Detailed studies of the full chemical composition of representative samples of PM10 are required.
13. Daily samples of PM10 and PM2.5 should be analysed for selected chemical species indicative of specific
sources over at least a year at representative sites.
14. Studies should be undertaken of the composition and sources of coarse particles, whose origins are currently
poorly defined.
15. Studies of the influence of meteorological factors upon concentrations of PM10 and its specific components are
recommended.
Research Recommendations
Quality of Urban Air Review Group 171

Effects of Particulate Matter
16. The role of urban particles in influencing cloud and fog formation and visibility deserve attention.
17. Further detailed studies of the health effects and mechanism of action of PM10 in humans are required.
Specific recommendations appear in the report of COMEAP.
Airborne Particulate Matter in the United Kingdom
172

Accumulation modeA part of the size spectrum of airborne particles,
between approximately 0.1-2 µm diameter, in which
particles have a long atmospheric lifetime
AeroallergensAirborne antigens that cause allergy in a sensitive
individual, e.g. pollen, house dust mite
Aerodynamic diameterThe aerodynamic diameter of a particle is the diameter
which the particle would have if it were to be
spherical in shape, to be of unit mass and to have the
same sedimentation rate.
AerosolAn atmosphere containing particles which remain
airborne for a reasonable length of time
Black SmokeNon-reflective (dark) particulate matter, associated
with the smoke stain measurement method
Brownian motionConstant small movement of suspended bodies due to
bombardment by surrounding molecules
Coarse particle modeA part of the size spectrum of airborne particles,
greater than about 2 µm diameter, in which particles
have arisen mostly from disintegration of bulk solid
and liquid materials
Coarse ParticlesParticles within the coarse particle mode. In this
report, often refers to particles in the 2.5-10 µm size
fraction.
Count Median Diameter (CMD)Term used to characterise the size distribution of
particles in an aerosol. 50% of particles are of
diameter less than the count median diameter
Fine ParticlesParticles smaller than about 2 µm diameter which
arise mainly from condensation of hot vapours and
chemically-driven gas to particle conversion
processes. In this Report, often refers to the PM2.5
fraction.
Geometric standard deviationTerm used to describe size distribution of particles
conforming to a log-normal function
Hygroscopic growthGrowth of particles due to uptake of water from the
atmosphere
Inhalable particlesParticles which may be breathed in. “Inhalability” is
the orientation-averaged aspiration efficiency of the
human head. (Also termed inspirable)
Mass concentrationThe concentration of particles in air expressed as mass
per unit volume
MMADMass Median Aerodynamic Diameter. Term used to
characterise the distribution of sizes of particles in an
aerosol. MMAD is the size where half the mass of the
cloud is contained in particles of aerodynamic
diameter smaller than the stated aerodynamic diameter
and half in larger particles
MMDMass Median Diameter. As for MMAD except that
the diameter considered is the actual diameter rather
than the aerodynamic diameter
MonodisperseTerm used to describe an aerosol containing particles
of only one size
Nucleation modeA part of the size spectrum of airborne particles,
below about 100 nm diameter, in which particles arise
mostly from fresh emissions from combustion
processes, and gas to particle conversion
Number concentrationThe concentration of particles in air expressed as
number of particles per unit volume
Glossary of Terms and Abbreviations
Quality of Urban Air Review Group 173

Number median diameter (NMD)Term used to characterise the distribution of sizes of
particles in an aerosol. The NMD is that size where
half the total number of particles are of diameter
greater than NMD and half of diameter less than
NMD (same as count median diameter)
Photochemical smogSmog caused by the formation of particles due to a
chemical reactions driven by sunlight
PM2.5
Particulate matter less than 2.5 µm aerodynamic
diameter (or, more strictly, particles which pass
through a size selective inlet with a 50% efficiency
cut-off at 2.5 µm aerodynamic diameter)
PM10
Particulate matter less than 10 µm aerodynamic
diameter (or, more strictly, particles which pass
through a size selective inlet with a 50% efficiency
cut-off at 10 µm aerodynamic diameter)
PM15
As PM10, but with 15 µm as the cut-off
ppbParts per billion, 1 part by volume in 109
ppmParts per million, 1 part by volume in 106
Relative humidityActual vapour pressure/saturated vapour pressure
expressed as a percentage. A measure of the degree of
saturation of the air with water vapour
Respirable ParticlesParticles which can penetrate to the unciliated regions
of the deep lung.
SmokeParticulate matter, <15µ m, derived from the
incomplete combustion of fuels.
Suspended Particulate Matter (SPM)A general term embracing all airborne particles.
TEOMTapered Element Oscillating Microbalance, an
instrument for the continuous measurement of
suspended particulate matter in air
Thoracic particle massDescribes that fraction of the particles which
penetrates beyond the nasopharynx and larynx
Total Suspended Particulate (TSP)A term describing the gravimetrically determined
mass loading of airborne particles, most commonly
associated with use of the US high volume air sampler
in which particles are collected on a filter for weighing
TroposphereLayer of the atmosphere extending upwards from the
earth’s surface for about 10 km
TSPTotal suspended particulate
Ultrafine particlesParticles of less than 50 nm diameter (some workers
use 100 nm)
Airborne Particulate Matter in the United Kingdom
174

1. The UK Review Group on Urban Air Quality is a
working group of experts established by the
Department of the Environment to review current
knowledge on urban air quality and to make
recommendations to the Secretary of State for the
Environment.
2. The initial objective of the Group is to prepare a
review of urban air quality and how it is assessed in
the United Kingdom especially in relation to public
exposure, and how this information is passed on to
the public. To this end the Group will consider:
i) the pollutants measured,
ii) the extent of monitoring networks,
iii) the consistency of data,
iv) the types and location of monitoring
equipment and
v) any other relevant material.
3. The longer term objectives of the Group will be to:
i) perform a rolling review of the subject in the
light of scientific and technological
developments,
ii) consider, in the light of national and
international guidelines and advice, the need to
add or subtract sites from the networks and the
need for additional networks for different
pollutants and
iii) to consider arrangements for the public
availability of data.
4. The Group will identify areas of uncertainty and
recommend where further research is needed.
5. The Group will make recommendations for
changes to relevant monitoring networks and
public information systems.
6. The Group will act as an informal forum for the
discussion of research plans and results.
7. The Group will act as a point of liaison with
relevant international bodies.
Terms of Reference and Membership
Quality of Urban Air Review Group 175
TERMS OF REFERENCE

Professor R M Harrison (Chairman)
Institute of Public and Environmental Health
School of Chemistry
The University of Birmingham
Edgbaston
Birmingham B15 2TT
Professor P Brimblecombe
School of Environmental Sciences
University of East Anglia
Norwich NR4 7TJ
Dr R G Derwent
Meteorological Office, Room 156
Met O (APR)
London Road
Bracknell
Berkshire RG12 2SY
Dr G J Dollard
AEA Technology
National Environmental Technology Centre
Culham
Abingdon
Oxfordshire OX14 3DB
Dr S Eggleston
AEA Technology
National Environmental Technology Centre
Culham
Abingdon
Oxfordshire OX14 3DB
Professor R S Hamilton
Urban Pollution Research Centre
Middlesex University
Bounds Green Road
London N11 2NQ
Mr A J Hickman
Transport Research Laboratory
Old Wokingham Road
Crowthorne
Berkshire RG11 6AU
Dr C Holman
Brook Cottage
Camp Lane
Elberton
Bristol BS9 2AU
Dr D P H Laxen
Air Quality Consultants
12 St Oswalds Road
Bristol BS6 7HT
Mr S Moorcroft
TBV Science
The Lansdowne Building
Lansdowne Road
Croydon CRO 2BX
Observers:
Dr S Coster
Ms L Edwards
Air Quality Division
Department of the Environment, Room B355
Romney House, 43 Marsham Street
London SW1P 3PY
Dr R L Maynard
Department of Health
Hannibal House
Elephant and Castle
London SE1 6TE
Secretariat:
A R Deacon
University of Birmingham
Institute of Public and Environmental Health
School of Chemistry
Edgbaston
Birmingham B15 2TT
Diesel Vehicle Emissions and Urban Air Quality
176
MEMBERSHIP


ISBN 0 9520771 3 2Printed on environmentally friendly chlorine free paper