Forecasting fine particulate matter (PM2.5) across the United States in a changing climate
Upload
duongkhanhCategory
view
217download
0
Contract Report 525
Airborne Fine Particulate Matter (PM10) in Southeast Chicago
by Stephen J. Vermette1 and Sheldon Landsberger2
1Office of Air Quality 2Department of Nuclear Engineering, University of Illinois at Urbana-Champaign
Sponsored by the Illinois Department of Energy and Natural Resources
Illinois Environmental Protection Agency
May 1991
Illinois State Water Survey Atmospheric Sciences Division Champaign, Illinois
A Division of the Illinois Department of Energy and Natural Resources

AIRBORNE FINE PARTICULATE MATTER (PM10) IN SOUTHEAST CHICAGO
FINAL REPORT
Prepared by:
Stephen J. Vermette Office of Air Quality
Illinois State Water Survey 2204 Griffith Dr.
Champaign, IL 61820-7495
and
Sheldon Landsberger Department of Nuclear Engineering
University of Illinois 214 Nuclear Engineering Laboratory
103 S. Goodwin Ave Urbana, IL 61801
Sponsored by:
Illinois Department of Energy and Natural Resources Illinois Environmental Protection Agency
May 1991

ISSN 0733-3927
The body of this report was printed on recycled and recyclable paper

CONTENTS Page
INTRODUCTION 1
SAMPLING LOCATIONS AND STUDY AREAS 1
METHODS AND QUALITY ASSURANCE 3 Sampling Methods 3 Analytical Methods 4 Receptor Modeling Methods 6 Quality Assurance 6
SOURCE IDENTIFICATION 11 Site Reconnaissance and Emission Inventories 11
Average Trace Element Concentrations 19 Carbon Determinations 23 Seasonal Trends 23 Wind Trajectory Analysis 23 Enrichment Factor Calculations 29 Factor Analysis 37
SOURCE APPORTIONMENT 39 Chemical Mass Balance 39
CONCLUSION AND RECOMMENDATIONS 56
REFERENCES 57
APPENDIX A: SURFACE DUST PROFILES: METHODOLOGIES 60
i

TABLES Pase
Table 1 Filter Blanks and Duplicate Analysis 7
Table 2 Receptor Modeling Estimates of Industrial Primary Emissions 13
Table 3 Contribution of Inventoried Sources to S.E. Chicago Average Ambient Trace Element Concentrations 14
Table 4 Average Concentrations of PM10 Mass and Trace Elements 22
Table 5 Airborne Fine Particle Concentrations Sorted by Wind Sectors for the Bright School Site 27
Table 6 Airborne Coarse Particle Concentrations Sorted by Wind Sectors for the Bright School Site 28
Table 7 Airborne Fine Particle Concentrations Sorted by Wind Sectors for the Washington School Site 30
Table 8 Airborne Coarse Particle Concentrations Sorted by Wind Sectors for the Washington School Site 31
Table 9 Fine Particle Factor Loadings for S.E. Chicago 38
Table 10 Coarse Particle Factor Loadings for S.E. Chicago 40
Table 11 CMB Source Profiles 42
Table 12 Southeast Chicago Elemental Source Contributions - Coarse Particle Mean Conditions 44
Table 13 Southeast Chicago Elemental Source Contribution - Coarse Particle Steel Fetch 46
Table 14 Southeast Chicago Elemental Source Contributions — Coarse Particle Urban Fetch 48
Table 15 Southeast Chicago Elemental Source Contributions - Fine Particle Mean Conditions 51
ii
Table 16 Southeast Chicago Elemental Source Contributions - Fine Particle Steel Fetch 53
Table 17 Southeast Chicago Elemental Source Contributions - Fine Particle Urban Fetch 55
iii

FIGURES Page
Figure 1 Southeast Chicago study area: major industries and PM10 ambient air sampling sites 2
Figure 2 Inter-method comparison of selected elemental determinations 8
Figure 3 Southeast Chicago airshed box model 12
Figure 4 Range of PM10 mass concentrations: comparison of a regional site with S.E. Chicago 16
Figure 5 Individual fine and coarse PM10 mass concentrations by season 17
Figure 6 Variability of fine and coarse PM10 mass concentrations by season 18
Figure 7 Southeast Chicago filter samples by season 20
Figure 8 Southeast Chicago filter samples by wind direction (A) and compared with an annual wind rose (B) 21
Figure 9 Carbon mass expressed as a percent of PM10 mass 24
Figure 10. Seasonal variability of fine airborne chloride (Cl) concentrations 25
Figure 11. Seasonal variability of coarse airborne silicon (Si) concentrations 26
Figure 12. Average enrichment factors for S.E. Chicago using a crustal reference material 33
Figure 13. Enrichment factors for S.E. Chicago plotted by wind direction using a crustal reference material 34
Figure 14. Enriched (EF>5) elements plotted by wind sector using regional air concentrations as a reference material 36
Figure 15. Southeast Chicago source contribution estimates coarse particle average conditions 43
iv

Figure 16. Southeast Chicago source contribution estimates: coarse particle steel fetch 45
Figure 17. Southeast Chicago source contribution estimates: coarse particle urban fetch 47
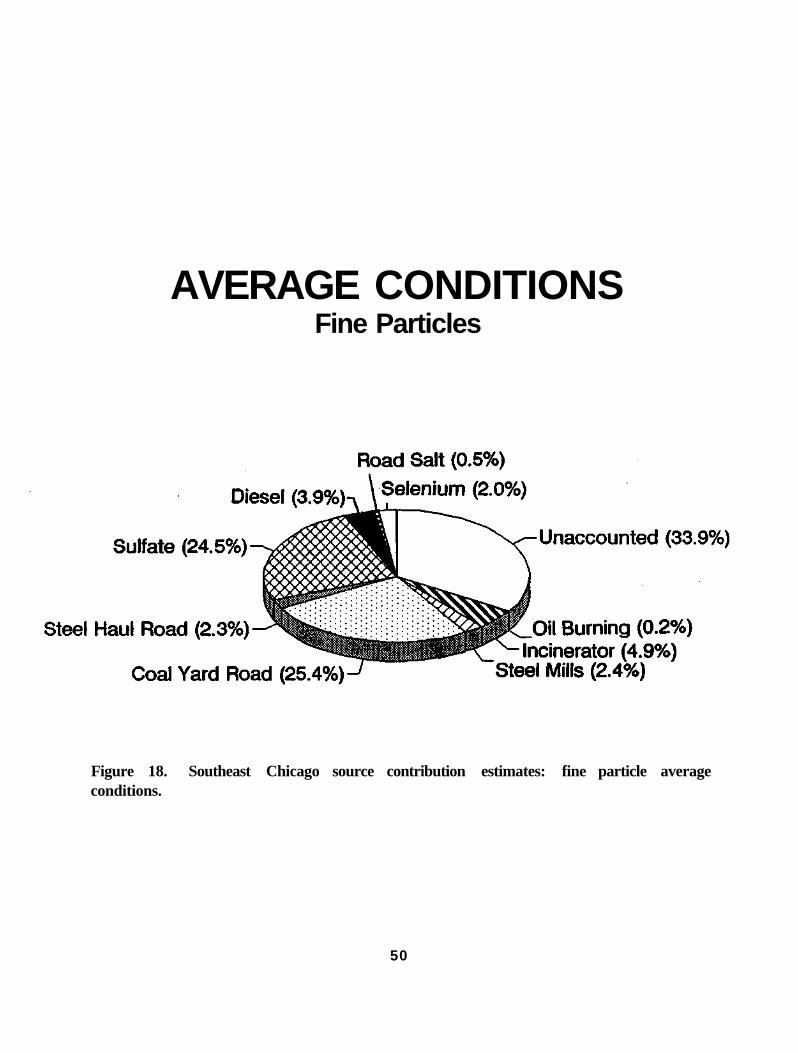
Figure 18. Southeast Chicago source contribution estimates: fine particle average conditions SO
Figure 19. Southeast Chicago source contribution estimates: fine particle steel fetch 52
Figure 20. Southeast Chicago source contribution estimates: fine particle urban fetch 54
v

ABSTRACT
The airborne concentrations and sources of PM10 mass and 26 elements were evaluated in southeast (S.E.) Chicago for the period from 1985 to 1988. X-ray fluorescence and neutron activation analysis were used for elemental determinations, and a weight-of-evidence receptor modeling approach — wind trajectory analysis, enrichment factors, factor analysis and chemical mass balance — was used to provide source identification. Particle concentrations remained in compliance of the PM10 National Ambient Air Quality Standard (NAAQS) throughout the study period. Receptor modeling analysis identified steel and steel-related industries as a substantial source of airborne PM10, however, the impact of stack emissions is minor in relation to industrial surface dust emissions. The control of industrial surface dust emissions offers the best strategy to reduce airborne PM10 -- greatest impact on air quality with the least disruption to industrial activity.
vi

ACKNOWLEDGMENTS
Support for this work has been provided by the Illinois Department of Energy and Natural Resources and the Illinois Environmental Protection Agency. Our appreciation goes to Paul Nelson for providing site maintenance, to Veryan Vermette and Lauren Sievers for providing data analysis, and to Allen Williams for assisting in the development of surface dust profiles. The report was edited by Eva Kingston.
vii
INTRODUCTION
A new PM10 National Ambient Air Quality Standard (NAAQS) has replaced total suspended particulates (TSP) as the federal ambient standard for particulates. PM10 represents the inhalable fraction of TSP, particles ≤10 micrometers (μm); of which particles > 5 μm are generally deposited in the nose and throat and particles < 5 μm reach further into the respiratory tract to the lungs.
Southeast Chicago has some of the worst known air quality in Illinois in terms of criteria pollutants. Several Illinois Environmental Protection Agency (IEPA) monitoring sites in S.E. Chicago have regularly recorded TSP excursions above the old TSP NAAQS. Based on earlier work by Kolaz et al. (1986) showing PM10 particles to constitute 60 percent of TSP in urban areas in Illinois, sites in S.E. Chicago are anticipated to exceed the PM10 NAAQS. Southeast Chicago has been designated as a Group 1 area, having a greater than 95 percent probability of exceeding the standard (IEPA, 1988).
In addition to criteria pollutants such as TSP and PM10, airborne concentrations of individual elements (e.g.,Cr, Cd, Mn, and Pb) may be high enough to pose a health hazard (Thomson et al., 1985). At present, ambient air quality standards exist only for lead (IEPA, 1988).
The overall objective of the project was to identify important sources of inhalable PM10
particles (PM10) in S.E. Chicago. A receptor modeling approach was used, which provides an in-depth chemical and physical characterization of individual elements and their sources. Preliminary results were discussed in four interim reports (Vermette et al.,1988;Vermette and Williams, 1989a; Vermette and Williams, 1989b; and Vermette et al., 1990). This final report contains project findings, conclusions and recommendations on airborne fine particulate matter (PM10) in S.E. Chicago.
SAMPLING LOCATIONS AND STUDY AREAS
The Chicago study area is a 64-square-kilometer (km) area in S.E.Chicago bounded by 95th Street to the north, the Indiana state line to the east, the Chicago city limits to the south, and State Street to the west (Figure 1). The area within these boundaries has hosted industrial and disposal activities since 1869 (Colten, 1985). Originally wetlands, much of the area is built on industrial waste materials. Iron and steel and related industries dominate the study area's manufacturing base and inventoried emissions. These industries are largely confined to a north-south strip on either side of the Calumet River. Associated with the iron and steel industries are large tracts of land that serve as storage locations for coal, slag, scrap steel, limestone, and other raw materials. Other significant facilities include numerous landfills and waste disposal sites. In proximity to the industry are a number of residential communities and wetlands.
1

Figure 1. Southeast Chicago study area: major industries and PM10 ambient air sampling sites.
2

Air quality was measured at two sites in the study area: Bright Elementary School at 10740 S.Calhoun, from October 1985 to August 1987, and Washington Elementary School at 3611 E. 114 Street, from December 1987 to June 1988. The locations of these sites and major industries are shown (Figure 1). A recent dispersion model study (Crowder et al., 1989) recommends both sites as suitable to monitor local (within the study area) sources of air pollution.
The third site is in a rural area near Champaign, EL, 8 km south of Bondville, EL. This site, chosen to be representative of regional air quality, is also used in several national air and precipitation monitoring programs. There are no point sources within 10 km, and the site is at least 50 km downwind of urban areas during times of prevailing northwest and southwest winds. In this location, concentrations of airborne toxic air pollutants should be representative of conditions in most of rural Illinois and provide an estimate of the contribution of regional background to urban pollution. Samples were collected between September 1985 and September 1987.
METHODS AND QUALITY ASSURANCE
In this section sampling and analysis methods for the trace elements will be discussed in detail along with quality assurance (QA) procedures.
Sampling Methods
Samples were collected for 12- or 24-hour periods using an automatic dichotomous virtual impactor fitted with a PM10 inlet made by Anderson Samplers, Inc., Atlanta, GA (Series 245). This sampler separates particles less than 10 μm in diameter into two size fractions: a fine particle fraction (< 2.5 μm) and a coarse particle fraction (2.5 to 10 urn). It samples at a flow rate of 0.0167 cubic meters per minute (m3/min) and has the capability of exposing up to 20 filter pairs automatically. U.S. Environmental Protection Agency (EPA) tests of this system have demonstrated good precision and accuracy for PM10 measurements (Rodes et al., 1985).
The filters used are 37 millimeter (mm) diameter TeflonR disks with a polyethylene support ring. They have an average pore size of 2.0 tun. According to the manufacturer (Gelman Sciences, Ann Arbor, MI), these filters collect all particles with diameters greater than 0.2 μm from the air passing through them. Filters are equilibrated for 24 hours at 50 percent relative humidity before weighing. All filter handling and weighing is done in a clean room on a laminar flow clean bench. Using a Cahn microbalance, the precision (standard deviation) of duplicate weighings under these conditions is ±5 micrograms (μg).
In normal field operation, the samplers are run for 2 to 3 weeks collecting 14 to 20 pairs of filters. A chart recorder verifies normal operation of the sampler pump and filter changes.
3

Any filters for which the sampler did not operate normally are discarded. To operate this sampler in the winter, a supplementary heater was installed in the filter chamber to maintain temperatures above freezing (Conley and Buckman, 1987). After filters are exposed, they are equilibrated at room temperature and SO percent relative humidity for 24 hours before reweighing. Once a month the samplers are calibrated to ensure a total flow of 0.0167 m3/minute (1.00 m3/hour) using a mass flow meter (Model 71S, Sierra Instruments, Inc.,Carmel, CA). Deviations in flow were usually within +.5 percent; if the deviation was more than 5 percent, an average flow rate was calculated and the volume corrected. Measured masses were corrected for dichotomous sampler error according to the formula supplied by the manufacturer and sample volumes were corrected for differences between the ambient and standard temperatures for the calibrator (21°C).
Filters were chosen for analysis after evaluation of meteorological data for the sampling period. In general, the sampling periods selected were those in which the standard deviation of the wind direction was less than 20 degrees. An attempt was made to include filters representing the widest possible variety of wind directions and meteorological conditions.
Analytical Methods
Trace element analyses were made by NEA, Inc.,Beaverton, OR, using x-ray fluorescence (XRF) analysis, and by the University of Illinois, Department of Nuclear Engineering, using neutron activation analysis (NAA). TeflonR filters were shipped in special plastic holders (Petrislides™, Millipore Corp., Bedford, MA) to ensure that sample integrity was maintained during transport. During the initial stages of this work, approximately 50 TeflonR
filters were reweighed after shipment and XRF analysis. No change in the mass on the filters carrying fine particles could be detected. In some cases, a loss of coarse particles was measurable but this amounted to no more than 10 percent of the total deposit. TeflonR
filters were first sent for XRF analysis and upon return were reweighed and sent for NAA. After NAA, filter weights could not be checked because of the destructive nature of the technique.
XRF Methods
The XRF analyses were carried out using an ORTEC TEFA III energy dispersive XRF analyzer. Each filter was analyzed three times in each of three different excitation conditions optimizing the sensitivity for specific elements as indicated below:
Al, Si, P, Fe Mo anode, no filter, 15 kilo-electron volts (KeV), 200 microamps (Μ amps)
S, Cl, K, Ca, Ti, W anode, Cu filter, 35 KeV, 200 μ amps V, Cr, Mn, Fe
4

Fe, Ni, Cu, Zn, Mo anode, Mo filter, SO KeV, 200 Μ amps Ga, As, Se, Br, Rb, Sr, Ba, La, Hg. Pb
Filter blanks were analyzed and an average blank spectrum was used as a background subtraction for each sampled filter. The raw analytical data were reviewed by a laboratory supervisor at the contract laboratory before processing was completed. Sample data were then corrected for spectral interferences, particle size, and deposit absorption effects.
NAA Methods
Elemental concentrations for the air filters were determined using the following NAA procedures. The support ring around the filter was removed before analysis. Earlier work by Sweet and Gatz (1988) showed the TeflonR filter support ring to be contaminated with Cr, Mn, and Sb. Removal of the ring was not necessary with XRF, because only the center portion of the filter (1 square centimeter (cm2)) is analyzed. For the short-lived radioisotopes (Al, Ba, Ca, Cu, In, Sr, Mn, V, Ti, Cl, and Na), filters were inserted in an acid-washed 7 cubic centimeter (cc) polyethylene vial placed in rabbit carriers, and irradiated for a period of five minutes at a flux of 1.5 * 1012 neutrons per square-centimeter per second (n/cm2/s). After the return of the carrier, the filter was removed from the vial and carefully placed in an inert acid-washed 7 cc polyethylene vial and presented for counting in front of a hyper-pure germanium counter. Typical delay times were of the order of 4 to 5 minutes. Samples were counted for 10 minutes. Deadtime corrections were evaluated by using a 60 hertz (Hz) pulser. Variations in neutron flux were monitored using sulfur standards every few hours throughout the day. Flux variations (1 percent or less) were constant during the day, but varied up to 5 percent for different days. All variations were normalized to the standard calibrations.
For the medium-lived (As, Sb, La, Sm, and Mo) and long-lived isotopes (Se, Zn, Cr, Fe, Ni, Sc, etc.), filter samples were irradiated for 10 hours at a flux of 4.5 * 1012 n/cm2/sec. Delay times of 3 to 4 days and counting times of 30 to 60 minutes were used. The long-lived isotopes were counted for a period of 20,000 seconds (5.55 hours) after a 3 to 4 week decay. Flux variations ± 5 percent were monitored.
Carbon Determinations
Total carbon analysis (elemental and organic carbon) was carried out by the Office of Services & Institutional Water Treatment of the Illinois State Water Survey, using a Dohrmann analyzer. Suspended filter deposits on glass fiber filters were first treated with hydrochloric (HCL) acid to remove carbonate and then combusted at 800°C to convert both the elemental and organic carbon to carbon dioxide (CO2).
5

Receptor Modeling Methods
Receptor modeling is an approach by which sources contributing to air quality are identified from the perspective of the receptor, in this project, filters from the dichotomous sampler. Source identification, using a receptor modeling approach, is possible, assuming that a measured element is linearly additive and follows the principle of conservation of mass, such that the concentration per unit volume of air at the receptor site is set equal to the sum of the contribution of various sources. Using Fe as an example, these assumptions may be expressed, relative to the receptor, as:
A number of specific calculations and models exist within the broader receptor modeling approach (e.g.,wind trajectory analysis, enrichment factors, and chemical mass balance), and each may rightfully be described as a receptor model. The approach used in this study is described as "stepwise" or "weight-of-evidence" where a series of models are followed, designed with a degree of redundancy, such that source identification is supported by a number of observations, model outputs, or both.
Quality Assurance
For XRF, the laboratory's approach is based on a well-established, validated standard operating procedure (SOP), an x-ray analysis QA plan, and validated standards. The SOP has been validated through numerous interlaboratory and intermethod comparisons including an EPA validation of XRF calibration films for certification. Analytical precision was determined by resubmitting previously analyzed samples on a "blind" basis. This could not be done for NAA because the samples are destroyed during analysis. Results for four typical filters are shown in Table 1. For elements that are well above detection limits, analytical precision is generally ± 10 percent.
For NAA, calibration was performed using liquid standards from atomic absorption solutions. Coal standards and blank filters were run with each group of filters.
Where possible, a comparison of XRF and NAA analytical results was made to determine the accuracy of the reported values (Figure 2). In general, agreement was within 10 to 15 percent between the two methods. Two exceptions were Cu and V, where NAA and XRF gives somewhat higher values for Cu and V, respectively. Since Cu was not analyzed by NAA in the coal standard and is closer to NAA detection limits, Cu values used in this report are from XRF analysis. Values reported for V are closer to XRF detection limits, thus V values used in this report are from NAA analysis. Unexplained elemental concentrations showing a discrepancy of greater than 20 percent between XRF and NAA were excluded from analysis.
6

Table 1. Filter Blanks and Duplicate Analysis1
Sample Filter Sample Filter Parameter Blank Fine Coarse Fine Coarse
(n-4) First Second3 First Second First Second First Second
Al 7+-18 2273+-135 2207+-133 4659+-251 4270+-234 2008+-118 1943+-114 10786+-556 10379+-535 Si 3+-11 3313+-177 3379+-180 15583+-789 15123+-766 4698+-24 4857+-251 40699+-2049 40385+-2027 P 7+-11 1806+-362 1824+-366 804+-162 739+-149 793+-160 564+-114 2896+-581 2011+-403 S 178+-55 40548+-2079 40278+-2065 17479+-909 17635+-915 14789+-761 16041+-824 3447+-190 3809+-214 Cl 6+-23 418+-103 20+-99 1021+-80 975+-79 BDL 69+-40 581+-40 711+-50 k 11+-10 1199+-69 1123+-66 1159+-69 1172+-69 979+-53 954+-53 3214+-167 3267+-171 C8 19+-8 849+-48 799+-45 13490+-679 13273+-668 1190+-63 1234+-66 16910+-853 17644+-887 Ti <1 45+-6 55+-7 290+-17 276+-17 BDL BDL 226+-67 102+-84 V 4+-3 22+-4 20+-5 38+-6 32+-6 BDL BDL BDL BDL Cr <1 40+-5 11+-5 55+-5 13+-5 38+-5 32+-5 61+-5 63+-6 Mn <1 164+-11 150+-10 176+-11 185+-11 86+-5 76+-6 197+-11 218+-13 Fe 74+-9 1260+-67 1227+-65 4710+-240 4637+-236 1221+-65 1148+-61 5897+-300 5559+-282 Ni <1 49+-5 52+-6 39+-5 42+-5 18+-3 18+-3 19+-3 22+-3 Cu 37+-5 7694+-387 7615+-383 1464+-75 1457+-75 42+-5 50+-5 43+-5 38+-4 Zn <1 2466+-131 2536+-134 2355+-119 2353+-119 287+-16 298+-17 159+-10 142+-9 Se <1 75+-6 75+-6 15+-3 18+-4 41+-4 27+-3 15+-3 13+-3 Br 5+-4 178+-11 160+-11 70+-6 70+-7 158+-9 98+-7 56+-5 42+-4 Rb 4+-6 42+-7 36+-7 40+-6 19+-7 24+-5 12+-4 30+-5 20+-4 Sb <1 232+-135 255+-153 190+-133 193+-156 BDL BDL BDL BDL Sn 35+-88 739+-75 725+-82 BDL BDL BDL BDL BDL BDL Pb 19+-14 3548+-181 3582+-183 1475+-77 1441+-76 732+-40 632+-35 323+-21 266+-18 1 - ng/filter 2 - First determination 3 - Second determination BDL - Below Detection Limit
7

Filter Samples
Figure 2. Inter-method comparison of selected elemental determinations.
8

Filter Samples
Figure 2. Continued.
9

Filter Samples
Figure 2. Concluded.
10

SOURCE IDENTIFICATION
Site Reconnaissance and Emission Inventories
As a first step in identifying PM10 sources, industrial facilities and emission inventories were examined for S.E. Chicago. This included a site reconnaissance (see Figure 1), a review of a recent dispersion model (Crowder et al., 1989), and a review of inventoried emissions (IEPA, 1987; Kong et al., 1990). Based on these reviews, local iron and steel and related industries were identified as major sources of airborne particulate matter, and based on dispersion model outputs, show localized impacts. A number of the mills and related industries were closed or at reduced operating levels during the study period, however, a number of fugitive dust sources were identified, including many of the roadways and raised structures (e.g.,Wisconsin Steel). For individual elements, inventoried emissions exceeding 100 tons/year are reported for S, Cl, Fe, Cu, Zn, and Pb.
Box Model
A simple box model was applied to these emission factors to estimate the average contribution of various sources to the overall ambient PM10 concentrations. In this model (Figure 3), the airspace 800 meters (m) above the study area (the average of winter and summer mixing heights) is ventilated at the average wind speed (12 kilometers per hour (km/hr)). The local emissions diluted by this volume of air estimate the contribution of local sources to average ambient levels of PM10. The emission inventories, used to calculate emissions rates within the box model, are TSP values. PM10 emissions are estimated at 60 percent of TSP emissions (Kolaz et al., 1986).
Looking at total PM10 emissions within the study area, a rate of 4.11 * 1012 micrograms per day (μg/day) (60% of TSP) contributions from local industry sources account for an estimated 2.4μg/m3 of ambient PM10. Average annual PM10 concentrations within the study airshed are 41 μg/m3 (this study). Therefore, inventoried sources account for only 6 percent of the annual average PM10. While this calculated concentration seems small, it is similar to receptor modeling estimates of industrial (predominately stack) sources of airborne particulates in other industrialized cities (Table 2). On days with low ventilation (calm conditions, low wind speeds or reduced mixing heights), inventoried emissions account for 68 μg/m3 or 57 percent of the worst case PM10 measured in S.E. Chicago. This percent contribution compares well with industrial worst case TSP concentrations (55 percent of ambient TSP) as determined by Lucas and Casuccio (1987) for the city of East Chicago. Based on the box model output and agreement with the literature, the PM10 not accounted for in the inventoried emissions most probably comes from a combination of uninventoried or underestimated sources. This PM10 is most likely attributed to fugitive dust sources, as well as PM10 already present in the air entering the study area.
The State of Illinois, including the city of Chicago, is the focus of an Illinois Department of Energy and Natural Resources (ILENR) project to develop a complete, accurate emission
11

Figure 3. Southeast Chicago airshed box model.
12

Table 2. Receptor Modeling Estimates of Industrial Primary Emissions
Industry City Contribution Authors
Industrial Philadelphiaa <5% of PM10 Dzubay et al. (1988)
Industrial Newark 7% of PM15 Morandi et al. (1987)
Industrial Portland 5% of TSP Cooper and Watson (1979)
Steel Detroit 12% of CPMb Wolff and Korsog (1985)
Steel Chicagoc 4% of TSP Gatz (1975)
Steel N/A 3% to 18% of TSP Lucas and Casuccio (1987)
aPrimary emissions from five major stationary sources. bCPM = particles ranging in size from 2.5 μm to 10 μm. cSampling sites were located upwind (prevailing direction) from steel mill sources.
inventory for toxic air pollutants (Kong et al., 1990). The inventory identifies four source types: process, combustion, incineration, and fugitive emissions. This inventory builds on the Total Air System (TAS) file maintained by the IEPA, determining elemental specific TSP from both reported emissions and sources with a potential to emit particles. This approach is a conservative one, to develop the best possible estimates for directing resources and activities to reduce air toxic emissions. Using this approach, TSP emissions estimated for all potential sources are 3.3 times greater than the TSP emissions estimated for permitted sources that have reported that emissions in the TAS file. The increase is particularly notable for fugitive sources that are 9 times greater than the TAS value. The ILENR emission inventory is the most up-to-date and the higher estimates of TSP emissions suggest it to be the most accurate.
The application of the simple box model to the revised emission inventory (PM10 at 60 percent of TSP) would account for approximately 18 percent of the ambient PM10. In Table 3, the model results for 17 elements (where ambient data are available) are reported. Most of the elements, from inventoried sources, account for over 50 percent of the ambient concentrations. These values reflect a high fugitive dust contribution. The box model greatly
13

Table 3. Contribution of Inventoried Sources to S.E. Chicago Average Ambient Trace Element Concentrations
PM10 Element Inventoried Modeled Ambient Percentc
Emissions* Concentrationsb Concentrations (tons/yr) (ng/m3) (ng/m3)
Al 257-429 329-548 496 66-110 Si n.a. n.a. n.a. n.a. P 38-63 58-96 100 58-96 S 563-939 719-1199 2273 32-53 CI 255-425 326-543 582 56-93 K n.a n.a. 232 n.a. Ca n.a. n.a. 1097 n.a. Ti 15-25 19-32 38 50-84 V 12-20 16-26 7 229-371 Cr 55-92 71-118 11 645-1073 Mn 49-82 62 - 104 86 72 - 121 Fe 485 - 809 632 - 1053 1233 51-85 Ni 22-36 28-46 5 560-920 Cu 320-533 409-681 15 2727-4540 As 201-335 257-428 3 8567-14267 Zn 206 - 343 263 - 438 166 158 - 264 Se 5 - 9 7-12 3 233-400 Cd 60-100 77-128 6 1283-2133 Sn 14-24 19-31 11 173-282 Sb 55-92 71-118 11 645-1073 Ba 10-16 13 - 21 10 130 - 210 Br 8-14 11-18 11 100-164 Rb n.a. n.a. n.a. n.a. Sr 2 - 4 3 - 5 5 60-100 Pb 349-581 445-742 127 350-584
Notes: a Calculated PM10 inventory ranges from 60-100 percent TSP inventoried emissions, as reported by Kong et al. (1990). b Modeled PM10 concentrations calculated from the PM10 inventory range. c Percent of average ambient concentration explained by inventoried emissions. n.a. not available
14
overpredicts some of the elements (As, V, Cr, Cu, Ni, Se, and Pb). It is interesting to note that a dispersion model study (Crowder et al.,1989) using specific elemental source emissions (point sources only) greatly overpredicted airborne concentrations of the two metals studied (As and Cr).
PM10 Mass Loadings
Prior to the analysis of the elemental data, the examination of particulate mass offers useful insights in identifying sources of PM10. Particulate mass has a mode between 40 and SO Mg/m3 and a mean concentration of 41 Mg/m3. This compares with a mode of 20-30 μg/m3
and a mean of 27 Mg/m3 at the regional site. In relation to the regional site, particulate mass in S.E. Chicago is greater by a factor of two. The urban study area has contributed toward a doubling of PM10 mass. This doubling has not violated the 24-hour PM10 standard (highest mass concentration < 90 μg/m3) but does approach the annual PM10 standard of 50 Mg/m3
(Figure 4),
Figure 5 plots the variability of filter masses by season for 1986. Examining the winter season first, no correlation is exhibited between fine and coarse PM10 (r2 = 0.04). The fine particles dominate winter PM10 mass and follow a cyclical pattern much like the other seasons. Fluctuations in mass concentrations between filters are due to differences in meteorology (variations in wind speed, ceiling heights, etc.). The coarse PM10 shows less variation in mass concentrations. The decoupling of the two fractions suggests two different sources. Snow cover and general wet conditions in the winter may serve to bind local surface material thereby preventing easy suspension into the airshed. The fine PM10 may be contributed from combustion processes that are not expected to vary with season, nor be influenced by ground cover.
In the summer and autumn, good correlations are exhibited between fine and coarse PM10 (r2 = 0.73 and 0.72, respectively). The correlation is due to meteorology but also demonstrates an active source for coarse PM10 not observed during the winter. The coarse PM10 mass equals that of the fine PM10 mass in the summer, while in the autumn the fine fraction dominates PM10. If as in the winter, coarse PM10 can be attributed to the suspension of surface materials, then it is apparent that suspended surface materials during the summer represent 50 percent of the PM10 mass. Mass concentrations in the spring appear to be a combination of summer and autumn patterns. Figure 6 presents a summary plot for the entire database.
15

PM-10 CONCENTRATIONS (ug/m3)
Figure 4. Range of PM10 mass concentrations: comparison of a regional site with S.E. Chicago.
16

WINTER R-Square = 0.04
Filter Samples
SUMMER R-Square = 0.73
Filter Samples
Figure 5. Individual fine and coarse PM10 mass concentrations by season.
17

Figure 6. Variability of fine and coarse PM10 mass concentrations by season.
18

Average Trace Element Concentrations
The trace element database used in this work consists of weather data and analytical results from 104 pairs of fine and coarse dichotomous filters. Filter samples were collected between September 1985 and June 1988. Those selected for analysis generally coincided with steady wind direction (standard deviation ≤ 20o). However, it was attempted to include a representative sample of all wind directions and meteorological conditions in the database. Figures 7 and 8 break down the analyzed filter samples by wind direction and season. The distribution of the analyzed filters closely reflects average wind directions for S.E. Chicago. Table 4 provides a statistical summary of the concentrations of PM10 mass and 25 elements, giving averages and standard deviations.
Comparisons of the mass concentrations found at the regional site (Bondville, IL) to those measured in S.E. Chicago provide an estimate of the contribution of regional pollution to urban air quality. The average PM10 mass is 50 percent higher in S.E. Chicago than at the regional site well removed from any substantial local sources. Mass concentrations at a rural site closer to Chicago (Gatz, 1989) show similar values (24 μg/m3) to those measured at the regional site.
Comparisons of individual elements show, in most cases, concentrations three to ten times higher in S.E. Chicago than at the regional site. For the fine particles, all elements are statistically higher (90 percent confidence level) in S.E. Chicago. The elements Cl, V, Cr, Mn, Fe, Cu, Zn, Sn, Sb, Rb, and Pb, for which significant local sources are present, are measured at concentrations ≥ 3 times the regional concentrations. It is interesting to note that Ni concentrations were higher at the regional site. For the coarse particles, most elements are statistically higher in S.E. Chicago (90 percent confidence level). The elements Cl, V, Cr, Mn, Fe, Ni, Zn, Cd, Sb, Ba, and Pb, for which significant local sources are present, are measured at concentrations ≥ 3 times the regional concentrations. Of the coarse particles, the elements Al, Si, P, and K are not significantly different between sites, suggesting a regional source.
By assuming that fine particles are predominately attributed to combustion sources and coarse particles, to mechanical sources, differences in the average concentrations of the fine and coarse particles provide an insight as to source types. For S.E. Chicago, the elements P, S, Cl, Cu, K, Ni, Zn, Se, Cd, Sn, Sb, Br, Rb, and Pb are predominately attributed to combustion sources, and Al, Si, Ca, Ti, V, Cr, Fe, and Sr, to mechanical sources. The elements As, Ba, and Mn show equal contributions from combustion and mechanical sources. A useful exercise is to recognize those elements in which the source types have switched between the regional and the S.E. Chicago sites. The elements Cl (see Seasonal Trends Section), K, Cu, Mn, and Rb have switched from a predominately mechanical source at the regional site to a predominately combustion source at the S.E. Chicago site.
19

Figure 7. Southeast Chicago Alter samples by season
20

Figure 8. Southeast Chicago filter samples by wind direction (A) and compared with an annual wind rose (B).
21

Table 4. Average Concentrations of PM10 Mass and Trace Elements1
Element Regional2 S.E. Chicago Fine Coarse Fine Coarse
Notes: For each row, values with different superscripts are statistically different from each other at the 90 percent confidence level using a one-tailed T-test. n.d. not determined. 1 PM10 in μg/m3, elements in nanograms per cubic meter (ng/m3). 2 Filters collected at a rural site near Champaign, IL (September 1985 to September 1987).
22

Carbon Determinations
No carbon determinations were made for filters collected at the Bright School site, but sampling at the Washington School site included airborne carbon measurements. The glass fiber filters were collected in sequence with the TeflonR filters. As a percentage of aerosol mass, total carbon varied from 14.5 to 53.0percent, averaging 25.2percent (Figure 9). There appears to be no significant difference between fine and coarse filters, averaging 24.0 and 26.5 percent, respectively. Within S.E. Chicago, two major sources of carbon are diesel exhaust and coal.
Seasonal Trends
The elemental data were examined for seasonal, weekly, and diurnal trends. No clear trends could be found with the exception of a few elements. This is consistent with the fact that urban sources of airborne particles such as industrial stack emissions and vehicular traffic are fairly constant. An interesting pattern was notable for two elements. The seasonal variation of fine chloride (Cl) shows high levels coinciding almost exactly with the snow season and road salt application (Figure 10). Road dust samples from Buffalo, NY, show a similar seasonal pattern for Cl (Vermette et al., 1991). This illustrates the potential for resuspension of fine particles by vehicular traffic. A second pattern was observed for airborne Si and Ti, with higher concentrations present during the spring (Figure 11). These particles presumably come from uncontaminated wind-blown dust from the surrounding region.
Wind Trajectory Analysis
Analysis of the data, based on wind direction, yields information on the sources and the types of emissions. Several steel mills are near the Bright School site. The data for this site were divided into four groups on the basis of wind direction. Tables 5 and 6 show the average concentrations of elements for the four wind directions. Different sources contribute airborne particles in each of these sectors. The northeast, southeast, and southwest sectors have most of the nearby steel industry while wind from the northwest passes over a long fetch of urban area with no heavy industry nearby.
Mass concentrations measured from a southeast fetch (active steel mills and related industries) average 61 μg/m3 (well above the PM10 annual standard), while concentrations from the northwest average 31 μg/m3 (only slightly above regional values). The difference in PM10 concentrations suggests that local steel mills and their related industries could have a significant impact on PM10 concentrations in S.E. Chicago.
The steel-related elements (Cr, Mn, and Fe) are higher when the wind is from the southeast and northeast, the direction of steel mills. Of the existing steel mills, those to the east and southeast had active blast furnace operations during the sampling period. The other mills in the area were either closed or operated at a low level. The steel-related elements (Cr,
23

Filter Samples
Figure 9. Carbon mass expressed as a percent of PM10 mass.
24

CHLORIDE
Figure 10. Seasonal variability of fine airborne chloride (Cl) concentrations.
25

Figure 11. Seasonal variability of coarse airborne silicon (Si) concentrations.
26
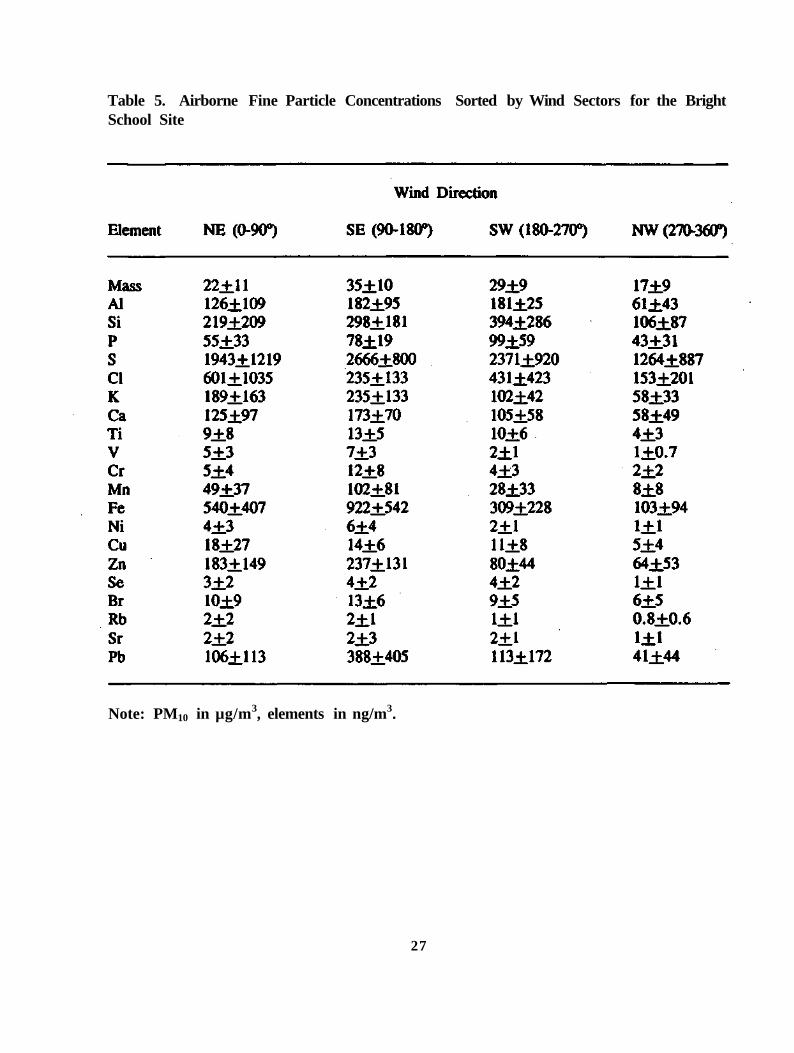
Table 5. Airborne Fine Particle Concentrations Sorted by Wind Sectors for the Bright School Site
Note: PM10 in μg/m3, elements in ng/m3.
27

Table 6. Airborne Coarse Particle Concentrations Sorted by Wind Sectors for the Bright School Site
Note: PM10 in μg/m3, elements in ng/m3.
28

Fe, and Mn) are significantly higher in the fine fraction only when the wind is from the southeast, the direction of active blast furnace operations. In contrast, the concentrations of these elements in the coarse fraction are similar when the wind is blowing from either active or inoperative steel mills. Presumably Cr and Mn from slag piles, contaminated soils, and urban dust are resuspended and contribute to the airborne concentrations of Cr and Mn. When the wind is from the southwest or northwest, the concentrations are lower because steel-related industries are much farther away or absent and thus exert much less or no influence on air quality. Other elements (e.g.,Zn and Pb) are also elevated when the wind is from the industrial southeast sector. Both of these elements are normally associated with the fine fraction indicating high temperature sources. However, the presence of elevated concentrations of these elements in the coarse fraction with southeast winds indicates that they are present in fugitive emissions from this area as well. The soil-related elements (Al, Si, and Ti) exhibit highest concentrations from a southeast and southwest fetch. Areas to the northeast and northwest pass over Lake Michigan and urban areas in Chicago. In general, elemental concentrations can be ranked from highest to lowest as: SE > NE > SW > NW.
The high levels of steel-related elements, as well as other elements, in fine particles collected during northeast winds is somewhat puzzling. Very little active steelmaking occurred at the mill located in this direction during the sampling period, and there are no other sources northeast of the site. The explanation may be related to lake-land breeze effects. In areas near large bodies of water, winds can shift rapidly as the land cools at night and heats up during the day relative to the water. These effects plus the "heat island" effects of a large city can cause pollutants to circulate and refumigate the source areas (Lyons, 1970). Alternatively, complex curved wind trajectories may be bringing in steel-related elements from plants in northwestern Indiana. Samples taken during northeast wind flows therefore may not always be representative of sources in that direction.
The Washington School data were also divided into four groups based on wind direction. The Washington School site is near steel mills (the opposite side of the mills from the Bright School site). Tables 7 and 8 show the average concentrations of elements for the four wind directions. The position of the Washington School site places it between active and inactive steel mills in S.E. Chicago and those mills located in northwest Indiana. Wind trajectory analysis of the Washington School data, in conjunction with data from the Bright School site, provides a means to identify those elements attributed to S.E. Chicago steel mills. Elemental concentrations for Mn, Fe, Cr, Pb, Zn, Cu, Ni, and V exhibit higher concentrations at both sites with winds passing over local mills. Similarly, high concentrations are attributed to winds from northwest Indiana, thus implicating the Indiana steel mills.
Enrichment Factor Calculations
Enrichment factor (EF) calculations are used in receptor modeling as a screening method to separate a reference source from all other sources. For example, to separate soil sources of airborne particles from all other sources, EF values are calculated as follows:
29

Table 7. Airborne Fine Particle Concentrations Sorted by Wind Sectors for the Washington School Site
Note: PM10 in μg/m3, elements in ng/m3.
30

Table 8. Airborne Coarse Particle Concentrations Sorted by Wind Sectors for the Washington School Site
Note: PM10 in μg/m3, elements in ng/m3.
3 1
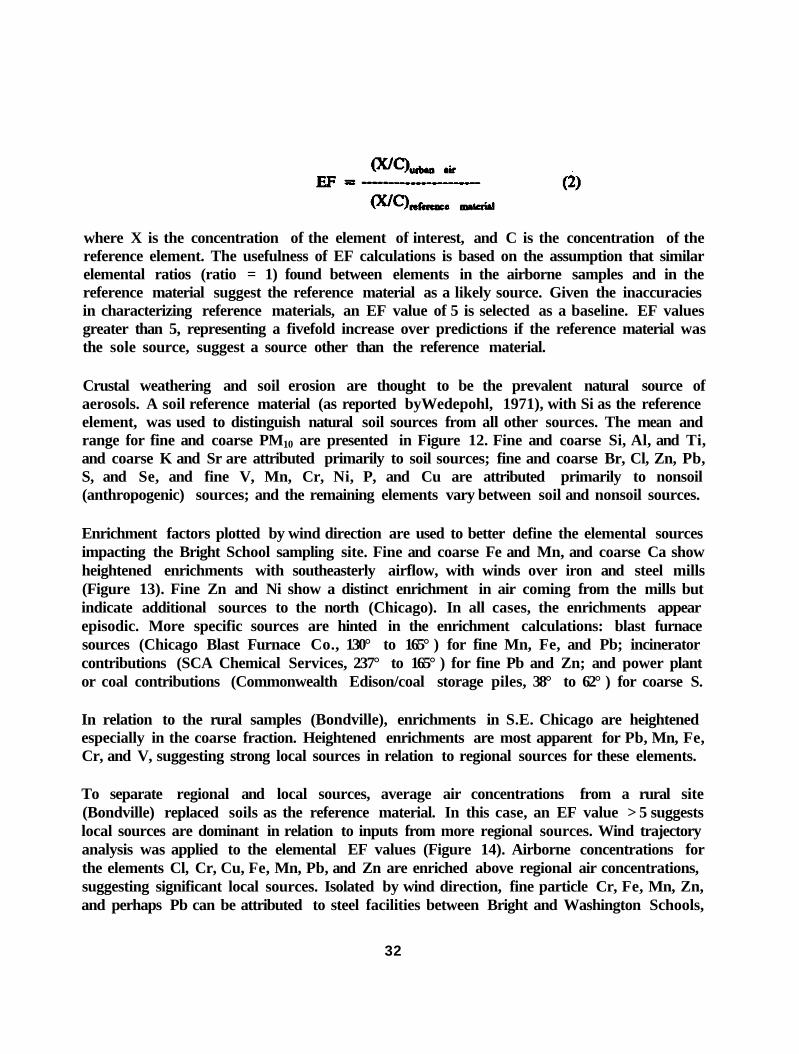
where X is the concentration of the element of interest, and C is the concentration of the reference element. The usefulness of EF calculations is based on the assumption that similar elemental ratios (ratio = 1) found between elements in the airborne samples and in the reference material suggest the reference material as a likely source. Given the inaccuracies in characterizing reference materials, an EF value of 5 is selected as a baseline. EF values greater than 5, representing a fivefold increase over predictions if the reference material was the sole source, suggest a source other than the reference material.
Crustal weathering and soil erosion are thought to be the prevalent natural source of aerosols. A soil reference material (as reported byWedepohl, 1971), with Si as the reference element, was used to distinguish natural soil sources from all other sources. The mean and range for fine and coarse PM10 are presented in Figure 12. Fine and coarse Si, Al, and Ti, and coarse K and Sr are attributed primarily to soil sources; fine and coarse Br, Cl, Zn, Pb, S, and Se, and fine V, Mn, Cr, Ni, P, and Cu are attributed primarily to nonsoil (anthropogenic) sources; and the remaining elements vary between soil and nonsoil sources.
Enrichment factors plotted by wind direction are used to better define the elemental sources impacting the Bright School sampling site. Fine and coarse Fe and Mn, and coarse Ca show heightened enrichments with southeasterly airflow, with winds over iron and steel mills (Figure 13). Fine Zn and Ni show a distinct enrichment in air coming from the mills but indicate additional sources to the north (Chicago). In all cases, the enrichments appear episodic. More specific sources are hinted in the enrichment calculations: blast furnace sources (Chicago Blast Furnace Co., 130° to 165°) for fine Mn, Fe, and Pb; incinerator contributions (SCA Chemical Services, 237° to 165°) for fine Pb and Zn; and power plant or coal contributions (Commonwealth Edison/coal storage piles, 38° to 62°) for coarse S.
In relation to the rural samples (Bondville), enrichments in S.E. Chicago are heightened especially in the coarse fraction. Heightened enrichments are most apparent for Pb, Mn, Fe, Cr, and V, suggesting strong local sources in relation to regional sources for these elements.
To separate regional and local sources, average air concentrations from a rural site (Bondville) replaced soils as the reference material. In this case, an EF value > 5 suggests local sources are dominant in relation to inputs from more regional sources. Wind trajectory analysis was applied to the elemental EF values (Figure 14). Airborne concentrations for the elements Cl, Cr, Cu, Fe, Mn, Pb, and Zn are enriched above regional air concentrations, suggesting significant local sources. Isolated by wind direction, fine particle Cr, Fe, Mn, Zn, and perhaps Pb can be attributed to steel facilities between Bright and Washington Schools,
32

Figure 12. Average enrichment factors for S.E. Chicago using a crustal reference material.

Figure 13. Enrichment factors for S.E. Chicago plotted by wind direction using a crustal reference material.
34

Figure 13. Concluded.
35

FINE PARTICLES
Figure 14. Enriched (EF>5) elements plotted by wind sector using regional air concentrations as a reference material.
36
but also to other steel industry sources (including facilities to the north and the mills in northwestern Indiana). The enrichment of many of the coarse fractions, with a steel mill fetch, suggests a strong fugitive dust source. Impacts from the incinerator, landfills and the Riverdale plant appear minimal. Fine Cl, previously attributed to road salt resuspension, is enriched from most wind directions. The nonenrichment of Al, Br, Ca, P, K, Ni, Rb, S, Se, Sr, and Ti for the industrial and urban fetches suggests a dominant regional source, one no different from regional sources. The elements As, Ba, Cd, Sb, and Sn were not examined.
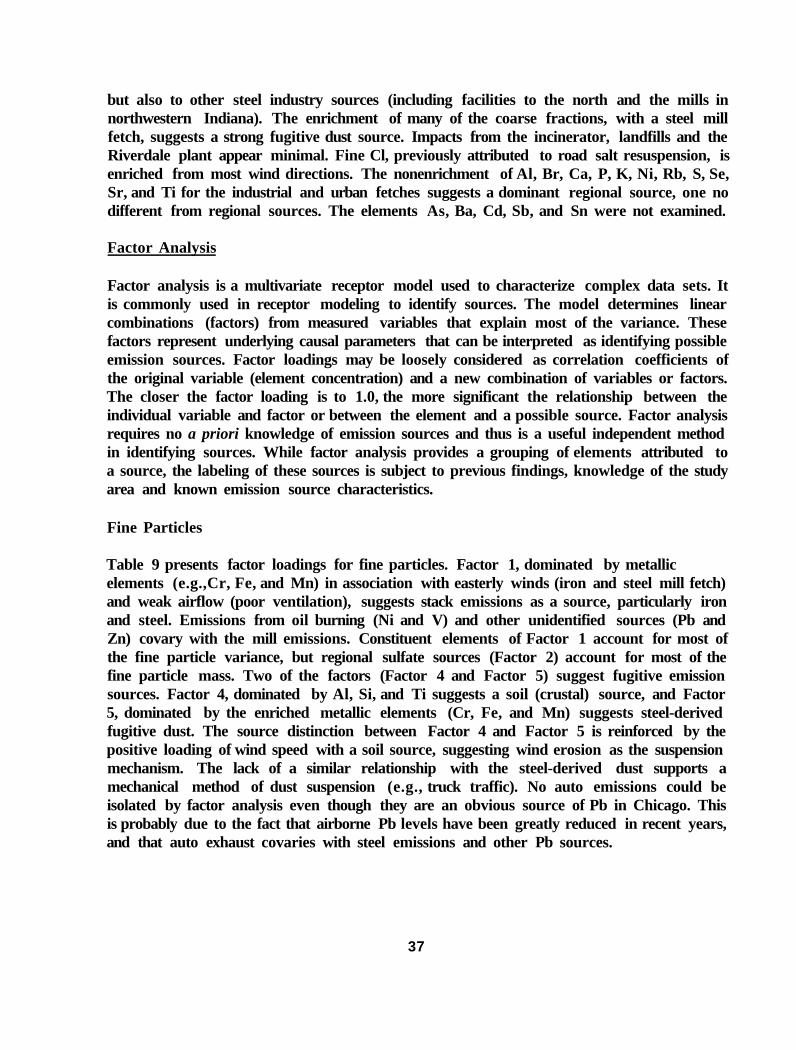
Factor Analysis
Factor analysis is a multivariate receptor model used to characterize complex data sets. It is commonly used in receptor modeling to identify sources. The model determines linear combinations (factors) from measured variables that explain most of the variance. These factors represent underlying causal parameters that can be interpreted as identifying possible emission sources. Factor loadings may be loosely considered as correlation coefficients of the original variable (element concentration) and a new combination of variables or factors. The closer the factor loading is to 1.0, the more significant the relationship between the individual variable and factor or between the element and a possible source. Factor analysis requires no a priori knowledge of emission sources and thus is a useful independent method in identifying sources. While factor analysis provides a grouping of elements attributed to a source, the labeling of these sources is subject to previous findings, knowledge of the study area and known emission source characteristics.
Fine Particles
Table 9 presents factor loadings for fine particles. Factor 1, dominated by metallic elements (e.g.,Cr, Fe, and Mn) in association with easterly winds (iron and steel mill fetch) and weak airflow (poor ventilation), suggests stack emissions as a source, particularly iron and steel. Emissions from oil burning (Ni and V) and other unidentified sources (Pb and Zn) covary with the mill emissions. Constituent elements of Factor 1 account for most of the fine particle variance, but regional sulfate sources (Factor 2) account for most of the fine particle mass. Two of the factors (Factor 4 and Factor 5) suggest fugitive emission sources. Factor 4, dominated by Al, Si, and Ti suggests a soil (crustal) source, and Factor 5, dominated by the enriched metallic elements (Cr, Fe, and Mn) suggests steel-derived fugitive dust. The source distinction between Factor 4 and Factor 5 is reinforced by the positive loading of wind speed with a soil source, suggesting wind erosion as the suspension mechanism. The lack of a similar relationship with the steel-derived dust supports a mechanical method of dust suspension (e.g., truck traffic). No auto emissions could be isolated by factor analysis even though they are an obvious source of Pb in Chicago. This is probably due to the fact that airborne Pb levels have been greatly reduced in recent years, and that auto exhaust covaries with steel emissions and other Pb sources.
37

Table 9 . Fine Particle Factor Loadings for S.E. Chicagoa
Elements Identified Sources Factor Loadingsb Percent Variancec
FACTOR 1 Steel industry stack 39.2 Ni 0.90 Zn 0.85 V 0.80 Mn 0.78 Cr 0.75 Fe 0.68 Pb 0.61 Ca 0.40 Wind direction -0.40
FACTOR 2 Regional sulfate and coal 13.4 Mass 0.90 Br 0.70 Se 0.69 P 0.65 S 0.62 Cl 0.50 K 0.40
FACTOR 3 Unknown 8.9 Fe 0.40 Br 0.56 Cl 0.68 Rb 0.75 K 0.72 Cu 0.40 Wind direction -0.60
FACTOR 4 Soil 7.7 Si 0.82 Al 0.81 Ti 0.72 Cu 0.52 Ca 0.40 Wind speed 0.50
FACTOR 5 Steel industry dust 5.0 Mn 0.58 Cr 0.55 Fe 0.40 Rb 0.41 Sr 0.79 Ca 0.50
Note: a Varimax rotation (percent of variance explained by factor analysis) = 74.2%. b Only factor loadings ≥ 0.4 are included. c Percent of the variance explained by the factor.
38

Coarse Particles
Fugitive emission sources account for nearly all of the coarse PM10 variability and coarse PM10 mass (Table 10). Factor 1, dominated by Al, Si, and Ti, suggests a crustal soil source and accounts for most of the coarse PM10 mass. Fugitive dust sources, related to the iron and steel mills are identified as road dust contamination from steel-related sources (Factor 2) where Pb and Br covary; dust entrainment from iron and steel industry properties (Factor 3), associated with winds blowing across the steel mills; and coal dust (Factor 4) where S and Se are associated. Some uncertainty exists in the labeling of Factor 2 and Factor 3, however, it is apparent that a number of steel-related sources (enriched Cr, Fe, and Mn) affect the coarse PM10.
SOURCE APPORTIONMENT
Chemical Mass Balance
The final output in our receptor modeling approach is the source apportionment of the trace elements. Source profiles were developed for the identified sources, and air pollutant apportionment was determined from chemical mass balance (CMB) statistics (Axetell and Watson, 1987). The CMB model, using a calculation known as least-square estimates, "sorts out" the contributions of emission source categories to the ambient air sample. Mass balance equations are written for each element. Source contribution estimates (by element) are calculated for the period represented by the ambient data. The CMB model generates two statistics used to evaluate the "fit" between the model and data. The first, r2 (r-square) should be at least 0.8 and as close to one as possible. The second statistic, X2 (chi-squared), should be less than four and as close to one as possible. The model also predicts the total airborne mass resulting from the modeled emission sources. The model should generally predict a mass within 20 percent of the measured value. The degrees of freedom are needed to evaluate the X2 statistic.
Normally, CMB is carried out on single filters. The advantage of this approach is that it minimizes the number of sources that need to be considered. If the wind direction is constant during the sampling period, only upwind sources affect the sampling site. The major disadvantage is that a single filter represents only the time period sampled, not average conditions. In order to reflect average conditions, CMB would have to be done on a very large number of filters representing all meteorological conditions in proportion to their actual occurrence throughout the year. Even then, some filters representing calm or variable wind conditions with high airborne element concentrations would not be represented. In addition, CMB analysis of single filters can easily be distorted by analytical or weighing errors.
CMB was performed on the average results reported earlier (Table 1). These results have already been shown to reflect average conditions at the sites, and analytical or weighing
39

Table 10. Coarse Particle Factor Loadings for S.E. Chicagoa
Elements Identified Sources Factor Loadingsb Percent Variancec
FACTOR 1 Soil 46.5 K 0.92 Si 0.91 Al 0.91 Ti 0.80 Ca 0.68 Sr 0.67 Mass 0.61 P 0.61 V 0.50 Fe 0.50 Rb 0.49 FACTOR 2 Road dust 11.9 Mass 0.42 Zn 0.80 Ni 0.80 Pb 0.65 Cu 0.64 V 0.60 Br 0.52 Cr 0.50 Fe 0.50 S 0.40 FACTOR 3 Industrial yards 6.7 Ca 0.55 Sr 0.45 Mass 0.44 Ni 0.44 Cu 0.44 V 0.50 Br 0.44 Mn 0.65 Cr 0.55 Fe 0.55 Se 0.45 Rb 0.45 S 0.50 Wind direction -0.80 FACTOR 4 Coal dust 6.0 Se 0.70 Wind speed 0.60 Rb 0.58 Br 0.50 S 0.45
Notes: aVarimax rotation (percent of variance explained by factor analysis) = 74.2%. b Only factor loadings ≥ 0.4 are included. c Percent of the variance explained by the factor.
40

errors in a few individual filters will not be as significant when averaged into a large database. Although all sources with an impact on the sites need to be considered, the list has already been narrowed considerably by using wind trajectory analysis and factor analysis. As a check on the average results, CMB was also run on typical filters representing high impact from major pollution sources at the various sites.
To carry out CMB analysis, source profiles are selected from a database that has been compiled from the literature and from direct measurements. The selection of sources is based on the emissions' inventories, wind trajectory analysis of ambient measurements, and factor analysis results. Combinations of these sources are then analyzed until a statistically reasonable fit is obtained that reflects known major sources. The distribution of elements among the source categories can then be calculated. Generally, all detectable elements were used as fitting species. In a few cases, however, particular elements were deleted because they were not included in available source profiles or were below detection limits in the ambient data. There are many uncertainties in CMB analysis so these results should be regarded as only an approximation of the actual distribution of elements among sources.
Those sources identified in previous sections of this report were used for the model runs. The chemical signatures for emission sources were obtained from the scientific literature and from profiles developed as part of this work (Table 11). Based on the literature values, the interim report (Vermette et al., 1988) attributed a large proportion of PM10 in S.E. Chicago to fugitive dust sources and recommended a better characterization of site-specific source profiles for surface dust sources. The results of this work are presented as a complementary report (Vermette et al. 1990), and the methodology is briefly described in Appendix A. With the exception of the surface dust source signatures for S.E. Chicago, the emission source signatures used in the CMB model were not sampled from the study areas. Because sources are often site-specific, source apportionment numbers based on generic source profiles should be viewed with caution. In addition, the source profiles used varied between specific batch processes to overall industrial composites, which may or may not have been best suited for the identified source.
Coarse Particle CMB
Modeled results are presented as source contribution estimates (Figures 15-17) and as elemental contribution estimates (Tables 12-14). Both source and elemental contribution estimates are reported as a percent of calculated mass. Model statistics show good general agreement between measured and calculated coarse PM10 and elemental concentrations.
Average CMB results for coarse particles (Figure 15) indicate that regional sources account for the largest single fraction of the coarse PM10 in S.E. Chicago. A breakdown by element (Table 12) attributes most of this mass to soil-related elements (e.g.,Al, Si, and Ti) as well as from regional anthropogenic sources (e.g.,Se and Zn). The PM10 mass attributed to the regional source is the PM10 concentration to be expected if local sources were absent. This compares well with the differences in measured mass between the regional site (11 μg/m3)
4 1
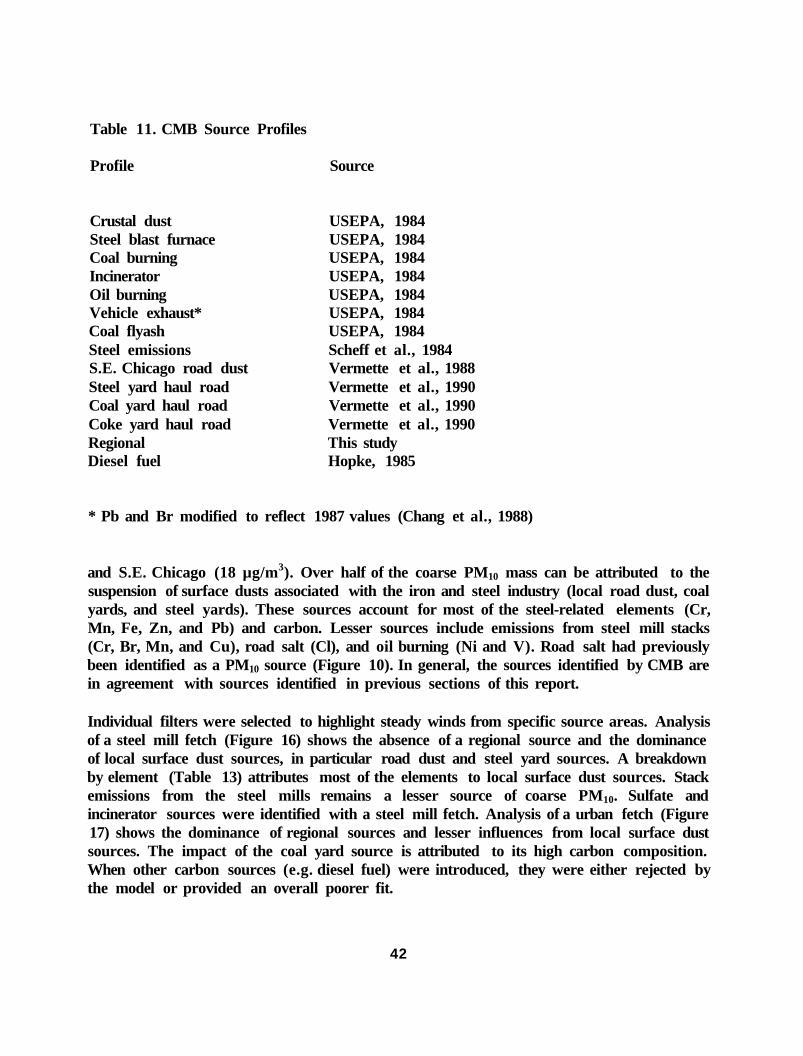
Table 11. CMB Source Profiles
Profile Source
Crustal dust USEPA, 1984 Steel blast furnace USEPA, 1984 Coal burning USEPA, 1984 Incinerator USEPA, 1984 Oil burning USEPA, 1984 Vehicle exhaust* USEPA, 1984 Coal flyash USEPA, 1984 Steel emissions Scheff et al., 1984 S.E. Chicago road dust Vermette et al., 1988 Steel yard haul road Vermette et al., 1990 Coal yard haul road Vermette et al., 1990 Coke yard haul road Vermette et al., 1990 Regional This study Diesel fuel Hopke, 1985
* Pb and Br modified to reflect 1987 values (Chang et al., 1988)
and S.E. Chicago (18 μg/m3). Over half of the coarse PM10 mass can be attributed to the suspension of surface dusts associated with the iron and steel industry (local road dust, coal yards, and steel yards). These sources account for most of the steel-related elements (Cr, Mn, Fe, Zn, and Pb) and carbon. Lesser sources include emissions from steel mill stacks (Cr, Br, Mn, and Cu), road salt (Cl), and oil burning (Ni and V). Road salt had previously been identified as a PM10 source (Figure 10). In general, the sources identified by CMB are in agreement with sources identified in previous sections of this report.
Individual filters were selected to highlight steady winds from specific source areas. Analysis of a steel mill fetch (Figure 16) shows the absence of a regional source and the dominance of local surface dust sources, in particular road dust and steel yard sources. A breakdown by element (Table 13) attributes most of the elements to local surface dust sources. Stack emissions from the steel mills remains a lesser source of coarse PM10. Sulfate and incinerator sources were identified with a steel mill fetch. Analysis of a urban fetch (Figure 17) shows the dominance of regional sources and lesser influences from local surface dust sources. The impact of the coal yard source is attributed to its high carbon composition. When other carbon sources (e.g. diesel fuel) were introduced, they were either rejected by the model or provided an overall poorer fit.
42
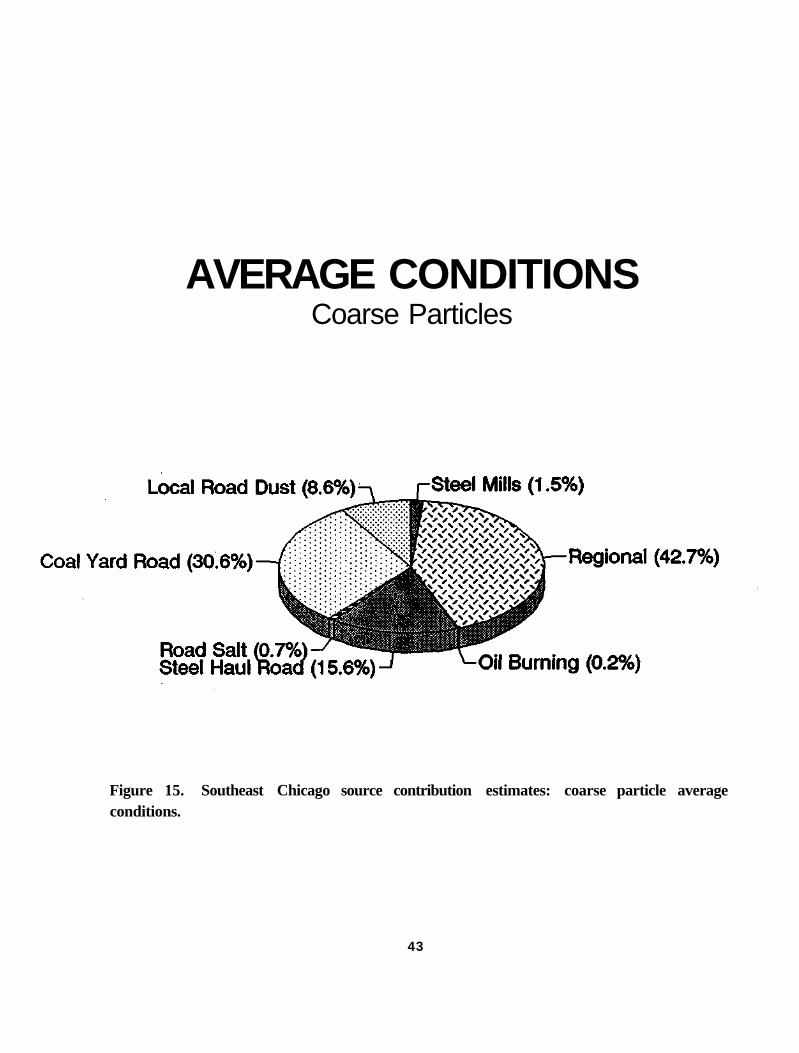
AVERAGE CONDITIONS Coarse Particles
Figure 15. Southeast Chicago source contribution estimates: coarse particle average conditions.
43

Table 12. Southeast Chicago Elemental Source Contributions — Coarse Particle Mean Conditions
Percent
Element C* Regional Coal Steel Road Steel Road Oil M Yard Yard Dust Mills Salt Burning
Al 1.18 62 16 14 7 1 0 0 Si 1.23 72 10 10 6 0 0 0 S 0.78 75 12 2 8 1 0 2 Cl 1.00 17 1 0 11 1 69 0 K 1.08 77 7 10 4 1 0 0 Ca 0.93 34 2 44 19 1 0 0 Ti 0.85 63 19 7 9 1 0 0 V 0.78 33 10 6 8 6 0 38 Cr 0.68 21 6 12 30 31 0 0 Mn 1.04 10 3 31 35 20 0 0 Fe 1.08 16 9 57 8 11 0 0 Ni 1.42 19 4 11 5 5 0 57 Cu 1.12 44 21 2 5 28 0 0 Zn 0.66 32 0 49 6 6 0 0 Se 1.14 53 0 0 18 30 0 0 Br 1.15 26 0 3 5 69 0 0 Pb 1.21 15 0 31 47 8 0 0 C 1.00 0 83 7 7 3 0 0
Notes: * Calculated/measured R-square = 0.96 Chi-square = 4.02 Percent mass = 106.3
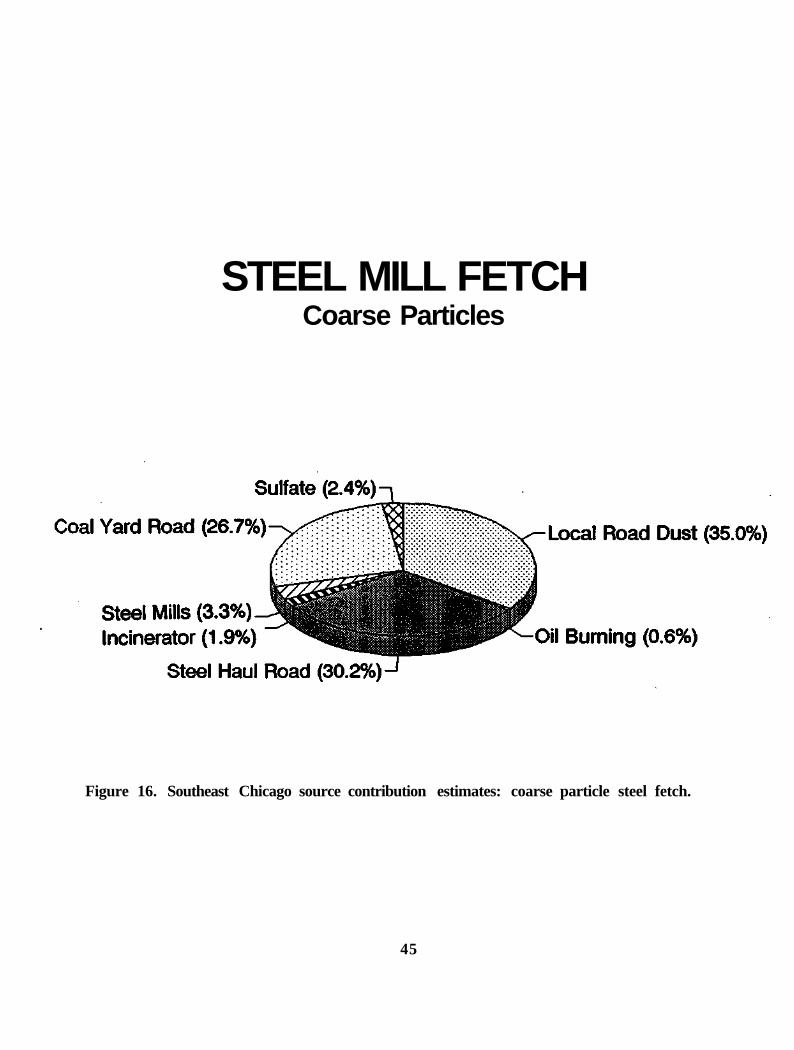
STEEL MILL FETCH Coarse Particles
Figure 16. Southeast Chicago source contribution estimates: coarse particle steel fetch.
45

Table 13. Southeast Chicago Elemental Source Contribution - Coarse Particle Steel Fetch
Percent
Element C* Sulfate Coal Steel Road Steel Oil Incinerator M Yard Yard Dust Mills Burning
Al 1.31 0 19 35 36 4 0 6 Si 1.12 0 15 34 45 2 0 4 S 1.00 51 8 3 '27 2 5 4 Cl 1.12 0 1 0 58 3 0 37 K 0.74 0 10 32 29 4 0 24 Ca 1.04 0 1 50 46 2 0 1 Ti 0.71 0 19 16 44 3 0 18 V 0.61 0 4 6 16 6 66 1 Cr 0.93 0 2 10 53 30 0 4 Mn 0.91 0 1 24 57 18 0 0 Fe 1.01 0 4 63 18 14 0 0 Ni 1.87 0 1 8 8 4 75 4 Cu 1.31 0 17 3 19 56 2 4 Zn 0.99 0 0 44 18 10 0 28 Se 0.31 0 0 0 51 47 0 0 Br 1.21 0 0 2 4 67 0 27 Pb 1.31 0 0 20 63 6 0 12 C 1.02 0 61 11 25 5 0 0
Notes: * Calculated/measured R-square =0.97 Chi-square =4.15 Percent mass = 102.3

URBAN FETCH Coarse Particles
Figure 17. Southeast Chicago source contribution estimates: coarse particle urban fetch.
47
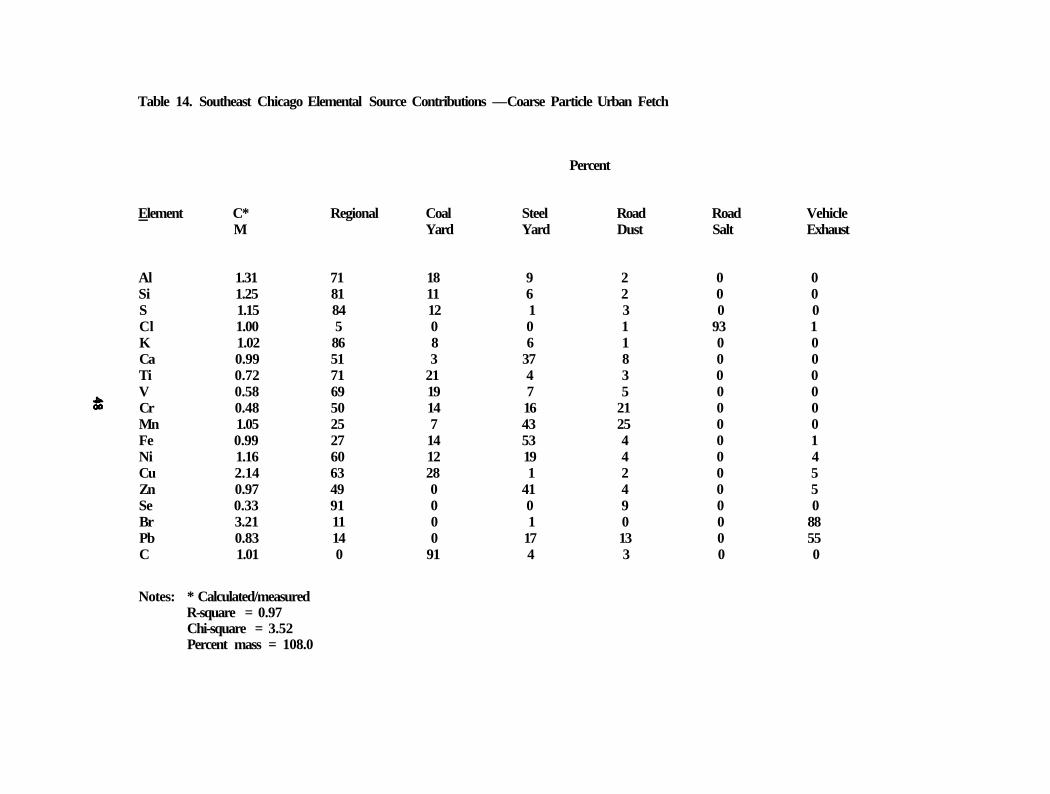
Table 14. Southeast Chicago Elemental Source Contributions — Coarse Particle Urban Fetch
Percent
Element C* Regional Coal Steel Road Road Vehicle M Yard Yard Dust Salt Exhaust
Al 1.31 71 18 9 2 0 0 Si 1.25 81 11 6 2 0 0 S 1.15 84 12 1 3 0 0 Cl 1.00 5 0 0 1 93 1 K 1.02 86 8 6 1 0 0 Ca 0.99 51 3 37 8 0 0 Ti 0.72 71 21 4 3 0 0 V 0.58 69 19 7 5 0 0 Cr 0.48 50 14 16 21 0 0 Mn 1.05 25 7 43 25 0 0 Fe 0.99 27 14 53 4 0 1 Ni 1.16 60 12 19 4 0 4 Cu 2.14 63 28 1 2 0 5 Zn 0.97 49 0 41 4 0 5 Se 0.33 91 0 0 9 0 0 Br 3.21 11 0 1 0 0 88 Pb 0.83 14 0 17 13 0 55 C 1.01 0 91 4 3 0 0
Notes: * Calculated/measured R-square = 0.97 Chi-square = 3.52 Percent mass = 108.0
A sensitivity test was conducted, removing carbon from both the coal yard and diesel sources, and only the coal yard source was accepted by CMB. The identification of a vehicle exhaust source in only the urban fetch may be attributed to controls on leaded fuels and the relative increased influence of other Pb sources (e.g., steel industry). Table 14 presents a breakdown by element for the urban fetch.
Fine Particle CMB
Modeled results are presented as source contribution estimates (Figures 18-20) and as elemental contribution estimates (Tables 15-17). Both source and elemental contribution estimates are reported as a percent of calculated mass. Model statistics show a poorer agreement between measured and calculated coarse PM10, underpredicting mass by 30 percent. This may be attributed to the absence of important modeled elements/compounds (e.g.,N03) and the lack of site-specific profiles.
Average CMB results for fine particles (Figure 18) indicate two major sources, sulfate and carbon (coal yard). Lesser sources include incinerators, diesel fuel, steel mills, steel yards, selenium, road salt, and oil burning. Of particular interest is the minimal impact of steel mill stack emissions on fine PM10. A breakdown by element (Table 15) shows steel mills account for most of the fine Cr and Mn. The dual sources of the steel-related elements -- coarse particles attributed to surface dust, and fine particles attributed to stack emissions — is in agreement with previous findings by wind trajectory and enrichment factor analysis. Other elements previously associated with steel mills (Zn, Pb, Ni, and V) can be attributed to incineration and oil-burning sources.
As with the coarse particles, individual filters were selected to highlight steady winds from specific source areas. Analysis of a steel mill fetch (Figure 16) shows the dominance of steel mill stack emissions, accounting for the largest source of fine PM10 and for most of the Cr, Mn, Fe, and Cu, as well as Ca, Cl, Ti, and carbon (Table 16). Given the dominance of the steel stacks, poor model fits for Zn, K, Br, and Pb may be attributed to an inaccurate source profile. Sulfate and carbon sources account for most of the remaining mass. Analysis of an urban fetch (Figure 20) retains the dominant sulfur and carbon sources and re-establishes the incinerator and diesel sources and the minimal impact of steel stack emissions. A breakdown by element is presented in Table 17.
49
AVERAGE CONDITIONS Fine Particles
Figure 18. Southeast Chicago source contribution estimates: fine particle average conditions.
50

Table 15. Southeast Chicago Elemental Source Contributions — Fine Particle Mean Conditions
Percent
Element C* Sulfate Coal Incin- Diesel Steel Steel Se Road Oil M Yard erator Mills Yard Salt Burning
Notes: * Calculated/measured R-square = 0.97 Chi-square = 3.00 Percent mass = 66.1%

STEEL MILL FETCH Fine Particles
Figure 19. Southeast Chicago source contribution estimates: fine particle steel fetch.
52

Table 16. Southeast Chicago Elemental Source Contributions — Fine Particle Steel Fetch
Percent
Element C* Sulfate Coal Steel Steel Oil M Yard Mills Yard Burning
Al 1.00 0 43 39 17 1 Si 1.13 0 35 48 16 1 S 1.00 88 2 8 0 2 Cl 1.23 0 0 100 0 0 Ca 1.24 0 4 74 20 1 Ti 0.87 0 23 72 4 1 V 0.86 0 2 31 1 67 Cr 1.01 0 1 99 0 0 Mn 0.79 0 1 97 2 0 Fe 0.47 0 9 80 12 1 Ni 1.95 0 1 19 0 79 Cu 0.37 0 21 72 4 4 C 1.01 0 48 51 3 0
Notes: * Calculated/measured R-square = 0.98 Chi-square = 4.40 Percent mass = 71.5
K, Zn, Se, Br and Pb were omitted as fitting species because they provided a poor fit. Given the dominance of the steel mill stack emissions, the omitted species are likely incorrectly defined in that profile.

URBAN FETCH Fine Particles
Figure 20. Southeast Chicago source contribution estimates: fine particle urban fetch.
54
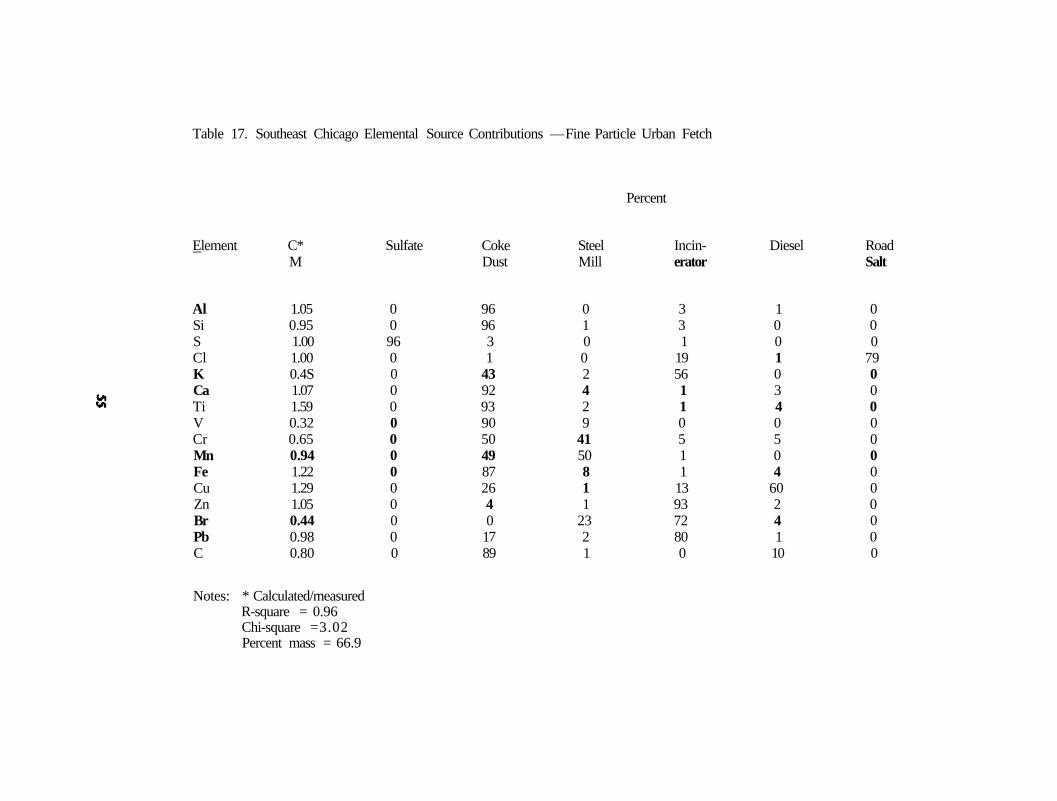
Table 17. Southeast Chicago Elemental Source Contributions — Fine Particle Urban Fetch
Percent
Element C* Sulfate Coke Steel Incin- Diesel Road M Dust Mill erator Salt
Al 1.05 0 96 0 3 1 0 Si 0.95 0 96 1 3 0 0 S 1.00 96 3 0 1 0 0 Cl 1.00 0 1 0 19 1 79 K 0.4S 0 43 2 56 0 0 Ca 1.07 0 92 4 1 3 0 Ti 1.59 0 93 2 1 4 0 V 0.32 0 90 9 0 0 0 Cr 0.65 0 50 41 5 5 0 Mn 0.94 0 49 50 1 0 0 Fe 1.22 0 87 8 1 4 0 Cu 1.29 0 26 1 13 60 0 Zn 1.05 0 4 1 93 2 0 Br 0.44 0 0 23 72 4 0 Pb 0.98 0 17 2 80 1 0 C 0.80 0 89 1 0 10 0
Notes: * Calculated/measured R-square = 0.96 Chi-square =3.02 Percent mass = 66.9

CONCLUSION AND RECOMMENDATIONS
Source identification of PM10 in a complex urban airshed requires the use of a variety of analytical and analysis techniques. The approach taken in this study was to compile a large chemical and meteorological database, and to undergo a number of receptor modeling analyses. The chemical database contains information on PM10 mass and 26 elements, collected from October 1985 to June 1988. In addition, numerous surface dust samples were collected and suspended to develop source profiles for CMB analysis.
Particle concentrations have remained in compliance of the PM10 NAAQS throughout the study period. In S.E. Chicago, mean PM10 mass concentrations were 41 μg/m3, approximately two times greater than regional values. Seasonal variations in PM10 were apparent between fine and coarse particles where the coarse fraction equals, and on an event basis dominates, the fine fraction in the summer months. The fine fraction dominates the coarse fraction at other times, especially in the winter months.
Receptor modeling analysis established the importance of steel and steel-related industries as a substantial source of airborne PM10, however, the impact of stack emissions are lesser in comparison to surface dust emissions — road dust, coal yards and steel yards. Under mean conditions stack emissions account for only 2 percent of fine PM10 (not including incinerator and oil-burning sources, which may be associated with the steel industry), but 70 percent of fine particle Cr and Mn. Local surface dust emissions account for over half of the coarse PM10. The impact of both steel industry stack and surface dust emissions increases considerably (30 and 90 percent, respectively) when winds blow from the direction of steel mills. While local steel mill sources are implicated in this study, steel mills from northwestern Indiana also contribute to airborne PM10 in S.E. Chicago.
Based on receptor modeling results, the recommended control strategy for the reduction of airborne PM10 is to supress local surface dust emissions from road dust and industrial yards. Anticipated reductions in airborne PM10 will depend on the efficiencies of various control strategies, however, a greater percent reduction in airborne PM10 will be possible than new controls on stack emissions — and with less impact on industrial production. Available control strategies include the paving of haul roads, speed controls, spraying of dust retardants (e.g. soil stabilizing chemicals), street sweeping, avoidance of track-on, and functional landscaping designed to restrict wind erosion around industrial complexes. The efficiencies of various surface dust control methods need to be evaluated for S.E.Chicago.
Industrial surface dust emissions carry a large amount of toxic elements (e.g.,Cr, Mn, Pb, and Zn), and the levels of airborne toxic elements in suspended dust may not always reflect current industrial activity or stack emissions. Existing air quality regulations only cover the total mass of airborne particles (Pb being the exception). But the suppression of local surface dust, to reduce PM10 mass concentrations, will also reduce airborne concentrations of toxic metals (e.g. Mn, Cd, Cr, Zn, and Pb) associated with industrial surface dust.
56

REFERENCES
Axetell, K.and J.G. Watson, 1987. "Receptor Model Technical Series, Volume III (Revised): CMB User's Manual (Version 6.0). "EPA-450/4-83-01R. Office of Air Quality Planning and Standards, U.S. Environmental Protection Agency, Research Triangle Park, NC.
Chang, S.N.,P.K.Hopke, G.E.Gordon, and S.W.Rheingrover, 1988."Target-Tranformation Factor Analysis of Airborne Particulate Samples Selected by Wind-Trajectory Analysis." Aerosol Science and Technology, 8: 63-80.
Colten, C.E., 1985. "Industrial Wastes in the Calumet Area, 1869-1970: An Historical Geography." Illinois Department of Energy and Natural Resources, Illinois Hazardous Waste Research and Information Center Research Report RR001, Champaign, IL.
Conley, F.W.and F.D. Buckman, 1987. "Verified Performance Improvements for the Sierra Model 245 Automatic Dichotomous Air Sampler." Presented at the 80th Annual Meeting of the Air Pollution Control Association, June 21-26, New York, NY.
Cooper, J.A. and J.G. Watson, 1979. "Portland Aerosol Characterization Study." Oregon State Department of Environmental Quality, Portland, OR.
Crowder, J.W.,F.T.DePaul, and J.T. Bowman, 1989. "An Air Monitoring Survey Design for Toxic Air Pollutants." Illinois Department of Energy and Natural Resources, Springfield, IL.
Dzubay, T.G., R.K. Stevens, G.E. Gordon, I.Olmez, and A.E.Sheffield, 1988. "AComposite Receptor Method Applied to Philadelphia Aerosol." Environmental Science and Technology, 22: 46-52.
Gatz, D.F., 1975. "Relative Contribution of Different Sources of Urban Aerosols: Applications of a New Estimation Method to Multiple Sites in Chicago." Atmospheric Environment, 9: 1-18.
Gatz, D.F., 1989. "Measurements of Airborne Particulate Matter (PM10) at the Proposed Illinois Superconducting Super Collider Site." Illinois State Water Survey Contract Report 464, Champaign, IL.
Hopke, P.K., 1985. Receptor Modeling in Environmental Chemistry. John Wiley & Sons, New York, NY.
Illinois Environmental Protection Agency (IEPA), 1987. "IEPA Surveillance Report Source Information." Unpublished data. Springfield, IL.
57

Illinois Environmental Protection Agency (IEPA), 1988. "Illinois Annual Air Quality Report." IEPA/APC/88-022, Division of Air Pollution Monitoring, Springfield, IL.
Kolaz, D.J., T.A. Sweitzer, and D.L. Bomke, 1986. "Illinois PM10 Measurements: Mass and Chemical Composition." Paper 86-57.4,presented at the 79th Annual Meeting, Air Pollution Control Association, June 23-27, Minneapolis, MN.
Kong, E.J., J.H. Turner, and K.R. Reddy, 1990. "A Toxic Air Pollutant Inventory for the State of Illinois." ILENR/RE-AQ90/06, Illinois Department of Energy and Natural Resources, Springfield, IL.
Lucas, J.H.,and G.S. Casuccio, 1987. "The Identification of Sources of Total Suspended Particulate Matter by Computer-Controlled Scanning Electron Microscopy and Receptor Modeling Techniques." Paper presented at the 80th Annual Meeting of the Air Pollution Control Association, June 21-26, New York, NY.
Lyons, W.A., 1970. "Mesoscale Transport of Pollutants in the Chicago Area as Affected by Land and Lake Breezes." Presented at the 2nd International Clean Air Congress of the International Union of the Air Pollution Prevention Association, December 6-11, Washington, D.C.
Morandi, M.T., J.M. Daisey, and P.J. Lioy, 1987. "Development of a Modified Factor Analysis/Multiple Regression Model to Apportion Suspended Particulate Matter in a Complex Urban Airshed." Atmospheric Environment, 21(8): 1821-1831.
Rodes, C.F.,D.M. Holland, L.J.Purdue, and K.A. Rehme, 1985. "A Field Comparison of PM10 Inlets at Four Locations." Journal of the Air Pollution Control Association, 35:345-354.
Scheff, P.A., R.A. Wadden and R.J. Allen, 1984. "Development and Validation of a Chemical Element Mass Balance for Chicago." Environmental Science and Technology, 18(12): 923-931.
Sweet, C.W., and D.F. Gatz, 1988. "Atmospheric Research and Monitoring Study of Hazardous Substances: Third Annual Report." Illinois Hazardous Waste Research and Information Research Report RR022, Champaign, IL.
Thompson, V.E., A. Jones, E. Haemisegger, and B. Steigerwald, 1985. "The Air Toxics Problems in the United States: An Analysis of Cancer Risks Posed by Selected Air Pollutants." Journal of the Air Pollution Control Association, 35:535-540.
U.S. Environmental Protection Agency (U.S. EPA), 1984. "Receptor Model Source Composition Library." EPA 450/4-85-002, Research Triangle Park, NC.
58
Vermette, S.J.,C.W. Sweet, and S. Landsberger, 1988. "Airborne Fine Particulate Matter (PM 1 0 ) in Southeast Chicago: Preliminary Report II." Illinois State Water Survey Contract Report 481, Champaign, IL.
Vermette, S.J.,and A.L. Williams, 1989a. "Surface Dust Elemental Profiles -Granite City." Illinois State Water Survey Contract Report 482, Champaign, IL.
Vermette, S.J.,and A.L. Williams, 1989b. "Surface Dust Elemental Profiles - Oglesby." Illinois State Water Survey Report 483, Champaign, IL.
Vermette, S.J.,A.L. Williams, and S. Landsberger, 1990. "Surface Dust Elemental Profiles -- Southeast Chicago." Illinois State Water Survey Contract Report 488, Champaign, IL.
Vermette, S.J.,K.N. Irvine, and J.J. Drake, 1991. "Temporal Variability of the Elemental Composition in Urban Street Dust." Environmental Monitoring & Assessment, 18:69-77.
Wedepohl, K.H., 1971. Geochemistry. Holt, Rinehart and Winston, New York, NY.
Wolff, G.T. and P.E. Korsog, 1985. "Estimate of the Contribution of Sources to Inhalable Particle Concentrations in Detroit." Atmospheric Environment, 19(9): 1399-1409.
59

APPENDIX A SURFACE DUST PROFILE: METHODOLOGIES
Introduction
Numerous receptor modeling studies have indicated the significance of fugitive dust sources to ambient PM10 loadings. The significance of surface dust as a source of PM10 has been reinforced in Southeast Chicago by the receptor modeling work of Vermette et al. (1988) and Sweet et al. (1990). Compliance monitoring by the Illinois Environmental Protection Agency (IEPA) has recorded annual average and 24-hour excursions of Total Suspended Particulates (TSP) and Particulate Matter ≤10 microns (PM10) which are above or approaching primary or secondary standards (IEPA, 1989).
While the referenced receptor modeling studies have indicated fugitive dust emissions as a substantial source of the ambient PM10 loading, the findings of these studies have been restricted by the absence of site-specific elemental profiles of potential fugitive dust sources. As a part of the study necessary to prepare an effective, efficient State Implementation Plan (SIP) for Southeast Chicago, dust samples were obtained from an earlier sampling survey conducted by the Midwest Research Institute (MRI) under contract with the IEPA (MSI, 1987a; 1987b; 1988). A subset of these samples was selected' for elemental analysis and will be incorporated in subsequent receptor modeling work.
Sample Collection
The dust samples obtained from the IEPA were from an earlier sampling survey conducted by MRI, under contract with the IEPA. The dust samples were collected by MRI to estimate PM10 emissions from several industrial facilities and municipal streets in Chicago's Lake Calumet area. The selection of the sampled dust sources was based on a data gap of fugitive dust emission inventories maintained by the IEPA and their potential for suspension into the atmosphere. Ten facilities and two roadways were sampled by MRI in August and November 1987. A detailed description of the facilities selected, the chosen sampling sites, and the calculated emission inventories for the MRI project is available (MRI, 1987a; 1987b; and 1988).
Of the approximately 275 dust samples collected by MRI, 32 were selected for elemental analysis in this study. The samples for this subset were taken from each of the facilities and streets sampled by MRI. A listing of the 32 dust samples (29 profiles because of some compositing) is shown in Table 1A, and their locations are shown in Figures 1A.
A description of the sampling protocol is reported by MRI, 1987a. In brief, samples were collected from three location types: 1) unpaved areas, 2) paved areas, and 3) storage piles. Unpaved areas were sampled with a hand broom and dustpan. The material collected was available for immediate suspension into the atmosphere. For unpaved areas that were roadways, samples were taken along a transverse strip across the travel lanes. Paved areas
60

Table 1A. MRI Dust Samples Selected for Suspension
Facility Sample Code* Description
Calumet Industrial Disposal 01U010 Unpaved Haul Road 01U004 & 01U013 Unpaved Haul Road
Paxton II Landfill 02U001# Unpaved Haul Road 02U002 Unpaved Haul Road
Land & Lakes No. 3 Landfill 03U004 Unpaved Haul Road 03S010 Clay Stockpile 03S011# Landfill Sample
Land & Lakes No. 1 ,2, & 04U007 Unpaved Haul Road Dolton Landfill 04S004 Flyash
04P184 Paved Haul Road Acme Steel Furnace Plant 0SU014 Unpaved Haul Road
05P014 Paved Haul Road 05S002 Tilden Pellets OSSOOS Wabash Pellets 0SS101 Flue Dust
Acme Steel Coke Plant 06U004# Coal Yard Road 06S003 Coal 06P001 Paved Haul Road
Acme Steel Riverdale Plant 07P008 Paved Haul Road 07S301 Limedust 07S302# BOF Dust
Hechett Riverdale Plant 08U003 Slag Haul Road 08S202# Coarse Mill Scale 08S206 Refuse Slag
Hechett 112th St. Plant 09U005 Unpaved Haul Road 09S002 Slag Stockpile
Stony Island Ave. 11U005 & 11U006# Unpaved Roadway 122nd Street 12P001 & 12P002 Paved Roadway
12P003
Notes: * Sample Code: XX-T-YYY XX-Facility Code, T-Sample Type (U=unpaved, P=paved, S=stockpile), YYY-sample identification. # Selected for bulk elemental analysis.
61

Figure 1A. Lake Calumet study area showing locations of sampled facilities and other industries.
62

were sampled along a transverse strip with a Hoover Model S vacuum fitted with a tare-weighed vacuum bag. Storage piles were sampled with a pointed shovel to a nominal depth of 15 cm.
The 29 profiles represent suspected sources of fugitive dust in the Lake Calumet and McCook areas. However, the analyzed samples represent only 13 percent of the collected samples, and thus an important dust source may have inadvertently been omitted. It should also be noted that the elemental profiles reported from this project represent concentrations at the time of collection and that many industrial facilities use chemical dust suppressants (especially in the dust control season March-October), which may or may not be reflected in the elemental profiles.
Suspension
The surface dust samples were sieved to < S3 μm to be used as the bulk material for suspension and deposit onto filters. The suspension chamber consists of a swirl chamber where the dust was suspended by a continuous supply of filtered compressed air (see Figure 2A). The compressed air and suspended dust were forced into a circular air motion (swirl) about the axis of the chamber where the particles are mixed and disaggregated. The disaggregation removes possible elemental inhomogeneity between filters due to fractionation effects (e.g. coarse particles are truly coarse particles, not aggregates) and assures true particle sizes for techniques requiring particle standards and corrections (e.g., XRF). The flow was exhausted into a 225 L sampling chamber for dichotomous and PMS sampling (the box was replaced for each dust sample).
Particle samples were collected within the cardboard box using an automatic dichotomous virtual impactor fitted with a PM10 inlet made by Anderson, Inc., Atlanta, GA (Series 245). The sampler is designed to collect particulate matter with an aerodynamic size cut off of 10 μm and to further separate particles into two size fractions: a fine particle fraction (<2.5μm) and a coarse particle fraction (2.5-10 μm). The fine and coarse deposits were collected on 37-mm diameter TeflonR disks with a polyethylene support ring (for elemental analyses) and on 37-mm diameter glass fiber disks (for carbon analysis). Both filter types are made by Gelman Science, Ann Arbor, MI. Two PM10 inlets within the box allow for the simultaneous sampling on TeflonR and glass fiber filters. The similarity in particle size composition of loaded filters (disaggregation) was ensured by the continuous monitoring of particle size distribution using a PMS laser probe particle counter (Model CSAS-100-HV).
Elemental and Carbon Analyses
The suspended filter deposits (fine and coarse) on TeflonR were subjected to elemental analysis by X-ray fluorescence (NEA, Inc.,Beaverton, OR) and neutron activation analysis (Department of Nuclear Engineering, University of Illinois). The method of XRF
63

Figure 2A. Schematic of the dust suspension apparatus.
64

is based on the atomic excitation of electrons with the subsequent emissions of characteristic x-rays when electrons from higher levels fill the void spaces. The method of NAA is based on the measurement of induced radioactivity where the radioactive decay of each element emits a characteristic gamma-ray energy spectrum.
Filters were equilibrated for 24 hours at 50% relative humidity before weighing. Loaded filters were weighed prior to XRF analysis and then reweighed prior to NAA analysis. All filter handling and weighing was done in a clean room with a laminar flow clean bench. Using a Cahn microbalance, the precision (standard deviation) of duplicate weighings under these conditions is ± 5 ug.
Fine and coarse deposits have been corrected for fine particles collected on the coarse filter (sampler correction), as outlined in the automatic dichotomous sampler instruction manual (Anderson Bulletin No. 1079-245-IM).
A subset of the collected samples was analyzed in bulk form (< 53 μm material prior to suspension) by NAA.
Total carbon analysis (total elemental and organic carbon - TOC) was carried out by the Office of Analytical Services & Institutional Water Treatment of the Illinois State Water Survey. Suspended filter deposits on the glass fiber filters were first treated with HCL acid to remove carbonate. Carbonate removal was essential to obtain a TOC value as a number of the dust samples were collected from a dolomite quarry and from roadways. The effectiveness of carbonate removal is demonstrated in Table 2A.
Table 2A. Effectiveness of Filter HCL Treatment
Sample Carbonate from Carbon on Untreated Carbon on HCL Type Bulk Sample Filter Treated Filter
Quarry Dust 53% 51% 1% Roadway n.a. 31% 3%
n.a. = not available
The treated filters were combusted at 800°C for TOC determinations by a Dohrmann carbon analyzer.
65

The dust profiles presented in this report are predominantly from XRF determinations. Important inputs were made by NAA for element determinations not provided by XRF (Na, Mg, and Sm) or determinations at or below XRF detection limits (As, V, Sb, and La). Total C values were provided from the Dohrmann analyzer.
Quality Assurance
Both XRF and NAA techniques were used in the development of elemental profiles. Each laboratory was asked to run filter blanks and standards with the sample runs. In addition, the use of XRF and NAA provided for a number of redundant measurements which served as an additional quality check for a number of the reported concentrations.
The XRF standards provided for only 11 of the 34 sample elemental concentrations reported (Al, Si, K, Ca, Ti, V, Mn, Fe, Cu, Zn, and Pb). Agreement between the certified values and XRF determinations were within standard uncertainties. However, it should be noted that the standard concentrations for Ti, V, Mn, Cu, Zn, and Pb were well above the typical concentration measured from the dust samples.
The standards for NAA (filters and bulk samples) provide for all elemental concentrations reported for dust samples. Agreement between the certified values and NAA determinations is within standard uncertainties, with the exception of Cu and Mg which were not detected. The standard concentrations were at or below the typical concentrations measured from the dust samples.
Redundant measurements by XRF and NAA provides for a comparison of Al, Ca, Mn, Ti, K, Cl, V, Cu, Sb, La, and As concentrations for each of the dust samples. The elements Sb, La, and As were below detection limits for XRF and thus the NAA values were used in the dust sample profiles. The elements Cu, V, and Cl were below or approaching detection limits for either XRF or NAA and thus exhibit cases of both good (within analytical errors) and poor (outside analytical errors) agreement. The technique showing the lower detection limit was used in the dust sample profiles (XRF - Cu; NAA -V and Cl). The remaining elements (Al, Ca, Mn, Ti, and K) are above detection limits and exhibit agreement within analytical errors. A review of Appendix B allows for comparisons between individual filter samples.
A final quality check was to screen the elemental profiles to see if the concentrations for particular sample types 'made sense'. The approach used was to examine a subset of sample types that would be expected to exhibit heightened concentrations for particular elements (characterizing elements). The concentrations of the characterizing elements were then compared to values found in the literature for comparable materials (Table 3A).
The profiles exhibit heightened concentrations from the appropriate characterizing elements and show reasonable agreement with comparisons from the literature.
66
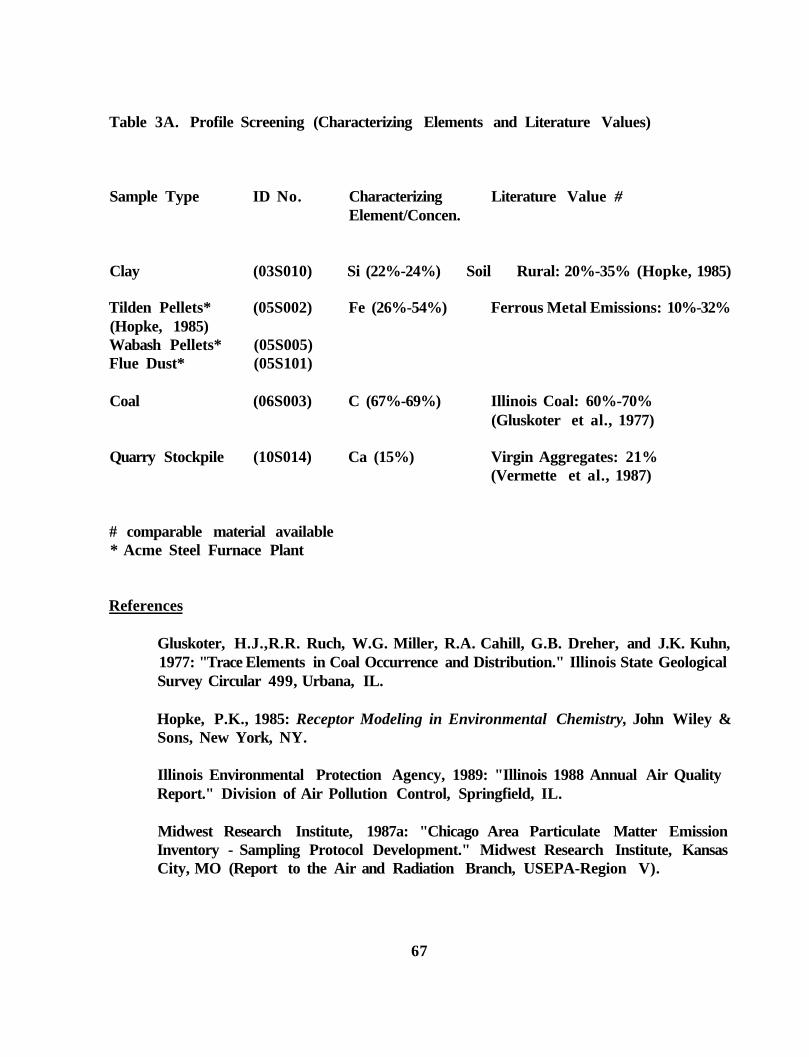
Table 3A. Profile Screening (Characterizing Elements and Literature Values)
Sample Type ID No. Characterizing Literature Value # Element/Concen.
Clay (03S010) Si (22%-24%) Soil Rural: 20%-35% (Hopke, 1985)
Tilden Pellets* (05S002) Fe (26%-54%) Ferrous Metal Emissions: 10%-32% (Hopke, 1985) Wabash Pellets* (05S005) Flue Dust* (05S101)
Coal (06S003) C (67%-69%) Illinois Coal: 60%-70% (Gluskoter et al., 1977)
Quarry Stockpile (10S014) Ca (15%) Virgin Aggregates: 21% (Vermette et al., 1987)
# comparable material available * Acme Steel Furnace Plant
References
Gluskoter, H.J.,R.R. Ruch, W.G. Miller, R.A. Cahill, G.B. Dreher, and J.K. Kuhn, 1977: "Trace Elements in Coal Occurrence and Distribution." Illinois State Geological Survey Circular 499, Urbana, IL.
Hopke, P.K., 1985: Receptor Modeling in Environmental Chemistry, John Wiley & Sons, New York, NY.
Illinois Environmental Protection Agency, 1989: "Illinois 1988 Annual Air Quality Report." Division of Air Pollution Control, Springfield, IL.
Midwest Research Institute, 1987a: "Chicago Area Particulate Matter Emission Inventory - Sampling Protocol Development." Midwest Research Institute, Kansas City, MO (Report to the Air and Radiation Branch, USEPA-Region V).
67

Midwest Research Institute, 1987b: "PM10 Emission Inventory of Landfills in the Lake Calumet Area."Midwest Research Institute, Kansas City, MO (Report to the Air and Radiation Branch, USEPA-Region V).
Midwest Research Institute, 1988: "Chicago Area Particulate Matter Emission Inventory -Sampling and Analysis." Midwest Research Institute, Kansas City, MO (Report to the Air and Radiation Branch, USEPA-Region V).
Sweet, C.W.,S.J. Vermette, and D.F. Gatz, 1990: "Toxic Trace Elements in Urban Air in Illinois."Hazardous Waste Research and Information Center Report RR-042, Champaign, IL.
Vermette, S.J., K.N. Irvine, and J.J. Drake, 1987: "Elemental and Size Distribution Characteristics of Urban Sediments: Hamilton Canada." Environmental Technology Letters, 8, 619-634.
Vermette, S.J., C.W. Sweet, and S. Landsberger, 1988: "Airborne Fine Particulate Matter (PM-10) in Southeast Chicago: Preliminary Report II." Illinois State Water Survey Contract Report 481, Champaign, IL.
68