airBaltic and SMS - Transportstyrelsen100 flight hours exceeded in 28 day period High (more than 10...
33
10 April, 2013 airBaltic and SMS Lauris Mikelsons VP Quality Assurance
Transcript of airBaltic and SMS - Transportstyrelsen100 flight hours exceeded in 28 day period High (more than 10...

10 April, 2013
airBalticand SMS
Lauris Mikelsons
VP Quality Assurance

10 April, 2013
BT & RIX development
Quality & Safety management
Summary & Way forward
Overview

10 April, 2013
airBaltic & RIX Development
10 April, 2013
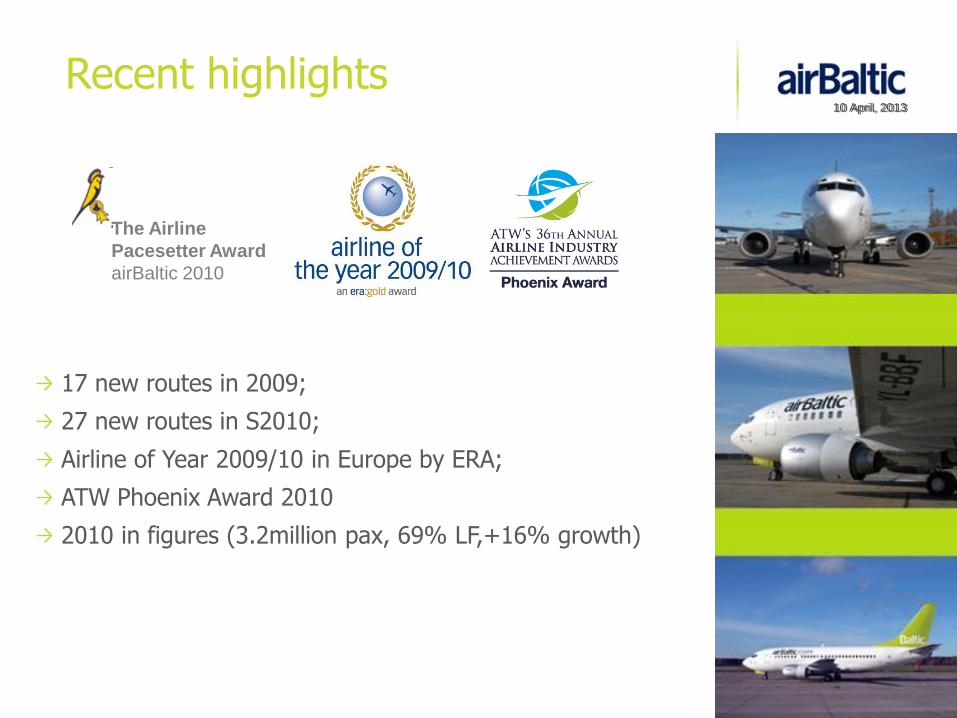
Recent highlights
17 new routes in 2009;
27 new routes in S2010;
Airline of Year 2009/10 in Europe by ERA;
ATW Phoenix Award 2010
2010 in figures (3.2million pax, 69% LF,+16% growth)
The Airline
Pacesetter Award
airBaltic 2010
10 April, 2013

10 April, 2013
Direct flights from Riga in 199010 April, 2013
10 April, 2013
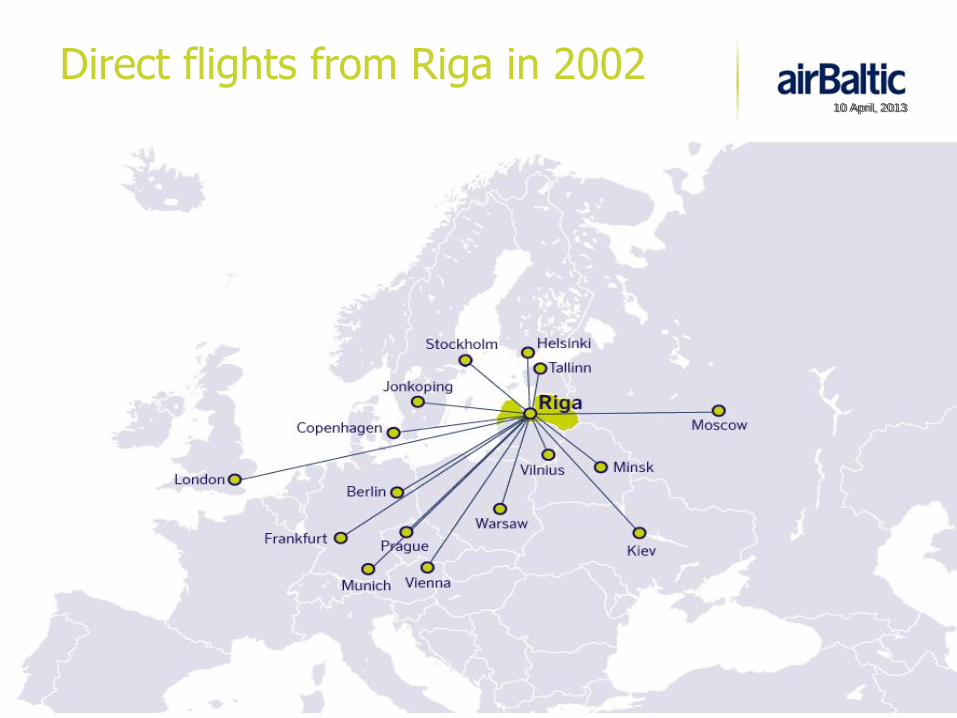
Direct flights from Riga in 200210 April, 2013

10 April, 2013
airBaltic flights from Riga 201110 April, 2013

10 April, 2013
airBaltic passenger flows 2010, total growth +16%
10 April, 2013

10 April, 2013
airBaltic passenger growth
336 367
589 229
1 037 925
1 425 277
2 008 522
2 590 357
2 757 404
3 206 735
3527409
12 8
06 262
212
248
710
218
270
194
224
173
652
151
385
106
127
0
500 000
1 000 000
1 500 000
2 000 000
2 500 000
3 000 000
3 500 000
4 000 000
1995
1996
1997
1998
1999
2000
2001
2002
2003
2004
2005
2006
2007
2008
2009
2010
2011
E
10 April, 2013

10 April, 2013
airBaltic transfer share Riga
Changes in BT's Traffic Mix at RIX
88,0%
68,7%
56,1%49,1% 50,0%
43,0%
12,0%
31,3%
43,9%50,9% 50,0%
57,0%
0%
10%
20%
30%
40%
50%
60%
70%
80%
90%
100%
Feb.08 Sep-08 Feb-09 Sep-09 Feb-10 Jul-10
Calendar Month
% o
f O
ve
rall
Tra
ffic
Local BT:BT Transfer
10 April, 2013

10 April, 2013
airBaltic fleet 1995-2009
3 3 3 3 3 3 3 3 3
3 3 3 35 6
9 8 810 11
22
1
1
6 7 8
13
16
18
2
2
11
10
5
10
15
20
25
30
35
1995 1996 1997 1998 1999 2000 2001 2002 2003 2004 2005 2006 2007 2008 2009
Avro RJ70 F50 SF 340 Boeing 737-500 Boeing 757-200
10 April, 2013
10 April, 2013
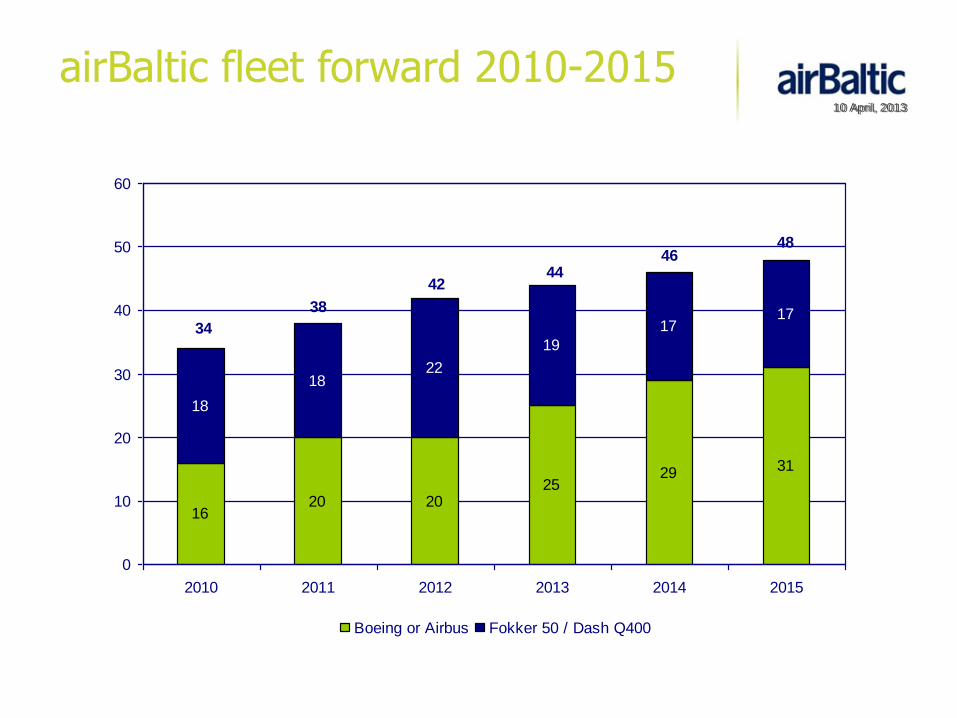
airBaltic fleet forward 2010-2015
1620 20
2529 31
18
1822
19
1717
0
10
20
30
40
50
60
2010 2011 2012 2013 2014 2015
Boeing or Airbus Fokker 50 / Dash Q400
34
38
4244
4648
10 April, 2013

10 April, 2013
Quality & Safety Management

10 April, 2013
Education:
Riga Aviation University, (93-98)B.Sc.Ing. Aircraft and Power plant Mechanics
UNO Aviation Institute, NE, USA (94-95; 2001) General aviation studies & GA maintenance internship
Cranfield University, UK (03-04)M.Sc. Air Transport Management
Experience:
CAA of Latvia, Airworthiness inspector (95-98)
airBaltic airline
Flight Standards admin, auditor (98-03)
Engineering Manager, auditor (04-05)
Quality Manager, auditor (07- present)
easyJet airline
Engineering Quality & Safety Manager, auditor (05–07)
My background

10 April, 2013
“Human beings by their very nature make mistakes; therefore, it is unreasonable to expect error-free human performance.” Shappell & Wiegmann, 1997

10 April, 2013
Our Business = People & Aircraft

10 April, 2013Operational considerations
• Most of Equipment is very mature and reliable;
• Human behind ~ 95% of causal factors in all occurrences;
• Incidents and Accidents are rare and unpredictable with
little learning for daily routines;
• Ground incidents / damages are frequent front-line
indicators of airline organisational incidents;
• Errors and slips are evident in most regulated processes;
• Need to separate the Ants from Elephants…
…. to maintain the control & develop safely.

10 April, 2013
Quality & Safety roles
airline processes
Safety monitoring of
100% system outputQuality monitoring of
0.1-100% of system inputs
Cooperate on evolution of audit methodology and scope;
sharing the workload of investigations

10 April, 2013
Safety Information Sources
Automated
Flight Data Monitoring
Technical Log
Voluntary
Reporting
Line Management
Instructions & guidance
for daily operations
(Risk assessment &
Change Mngmnt)
Mandatory
Reporting
Airworthiness
Review
ATC /
Airport /
Supplier
Reports
Oversight
Industry Studies
and Researches
Quality
AuditingInspections

10 April, 2013
Convenient management of:
All incoming reports
Audit schedule and follow-up
Review of timely responses
Various data analysis
ISO 9000 compliant Quality Management System
Results and Trends

10 April, 2013
Reporting
Flight Safety reports
Cabin Safety reports
Voyage reports
Technical reports & investigations
Employee feedback
Suppliers / Oversight
Customer complaints

10 April, 2013
1,18
2,85
0
1
2
3
4
5
6
Sep.0
6
Nov
.06
Jan.
07
Mar
.07
Mai
.07
Jūl.07
Sep.0
7
Nov
.07
Jan.
08
Mar
.08
Mai
.08
Jūl.08
Sep.0
8
Nov
.08
Jan.
09
Mar
.09
Mai
.09
Jūl.09
Sep.0
9
Per 1000 12 months AVG
Statistical Monitoring of Safety Events(reportable events equalized per 1000 sectors flown)

10 April, 2013
Risk Categories
Category If the event should recur, the probability of a major accident is…
R1 high
R2 increased under any circumstances
R3 increased under adverse circumstances that occasionally prevail
R4 not increased or increased only under extreme circumstances
R5 not increased as the occurrence is not related to flight safety

10 April, 2013
0
5
10
15
20
Sep Nov Jan Mar Mai Jūl Sep Nov Jan Mar May Jul Sep
R3 R4 R5 R2
Categories of Reported events
Assessment of events carried out by Flight Safety Office and
Post Holder of the respective Operating department.
All events reported to the State Aviation Authority and investigated.

0,33
0
1
2
3
Jan Feb Mar Apr May Jun Jul Aug Sep Oct Nov Dec
ARI 2009 ARI 2007
ARI 2006 ARI 2008
Airline Risk Index (reportable events x severity, equalized per 1000 sectors)

10 April, 2013
So What?
1 x High
100 x Medium
2000 x Low
Not all threat combinations are visible,
tangible, nor predictable
Staff on duty shall have clear
understanding of potential risks and
safety impact of own activities
Safety monitoring & evidence recording
shall become part of daily routines
and decision-making

Sample of Self-Monitoring
100 flight hours exceeded in 28 day period
High (more than 10 cases per 1000 cycles)
Medium (2-10 cases per 1000 cycles)
Low (less than 1 case per 1000 cycles)
High (more than 3 flight hours exceeded)
0.05 (pilots)
0.79 (cabin crew)
Medium (1-3 flight hours exceeded)
0.35 (pilots)
0.89 (cabin crew)
Low (less than 1 flight hour exceeded)
1.14 (cabin crew) 0.35 (pilots)
Minimum Rest Time reduced
High (more than 10 cases per 1000 cycles)
Medium (2-10 cases per 1000 cycles)
Low (less than 1 case per 1000 cycles)
High (more than 45min. short to minimum rest
period) 0.2 (pilots)
0.45 (cabin crew)
Medium (15 till 45 min. short to minimum rest
period) 0.2 (pilots)
0.35 (cabin crew)
Low (less than 15 min short to minimum rest
period)
100h/28d FDT & Minimum Rest time monitoring (1 calendar month)

10 April, 2013
Sample of Self-Monitoring
Dry Operating Index discrepancies
Dry Operating Weight discrepancies
DOW&DOI accuracy assessment (1 calendar month)

10 April, 2013
Potential Benefits
– Creating risk-controlled operating environment
– Identifying areas for continuous safety improvement
– Reducing occurrence numbers & severity
– Improving a/c availability
– Streamlining interfaces amongst operating units
– Becoming management tool for balanced decision making
Providing clear safety margins to the individuals will contribute towards improved safety & business integrity, by:

Flight Safety Assessment
Unique Threats Additional Defences
Crew experience
For first two months operations line captains (LCP) and experienced
FO (over X00h on type) authorized to operate.
After gaining operational experience, Captains with no LCP can
operate to XXX following familiarization flight.
Captains and FO with experience less than X00h on type not
authorized to operate. Ground School Familiarization required before
flight to XXX. Familiarization valid for 6 months.
High terrain, Some obstacles not equipped with
obstacle lights
EGPWS data base shall be maintained updated.
On approach Terrain mode selected on ND.
Non-standard glide path angle – 4
degreesFlaps 40 before entering GS, No Autoland. 3 degree PAPI visual GS.
Remote Alternates (closer aerodromes are
either complicated, requiring special permits, or closed
during airBaltic night-stop flights
ALT1, ALT2, ALT3 designated as alternates, requires consideration
for extra alternate fuel
Frequent turbulence & severe icingEngine Anti/Ice On, when in clouds. Additional crosswind limits set
(reduced by 5 kts compared to OM B 1.3.1)
Relatively Short RWY & LDA– 2000 m,
landing performance limitations likely
Flaps 40 landing, Low Friction or Contaminated RWY Landing Field
Limit Weight for <=FC0.4 to be checked (OMB 4.A4) Autobrake
MAX, after landing apply MAX manual brakes (allows to benefit from
reverse thrust).
Intolerable Tolerable Acceptable
Change Management –Formalised Risk assessment & Mitigation(Sample B3 Aerodrome assessment)

10 April, 2013
Cooperation through regulatory evolution:
Timely notification of safety related occurrences
References to the list of reportable occurrences
Details of preliminary risk assessment
Automated notification on the investigation closure
Support with cross-border investigations and
resolution of SAFA disputes
Interaction with the CAA

10 April, 2013
Investment:
• Committed staff with suitable tools, training &
procedures
• Slight increase in formalising investigations,
recommendations and management decisions
Benefits to the Airline:
Increased safety awareness & participation
Transparent safety risks & safeguards towards
management, CAA and public benefit
Summary of SMS implementation

10 April, 2013
Thank you!
Your Questions & Comments