Air University Sampling and Surveying · PDF fileSampling and Surveying Handbook i FOREWORD...
102
Air University Sampling and Surveying Handbook Guidelines for planning, organizing, and conducting surveys
Transcript of Air University Sampling and Surveying · PDF fileSampling and Surveying Handbook i FOREWORD...

Air UniversitySampling and Surveying
Handbook
Guidelines for planning, organizing, and conducting surveys


The views and opinions expressed
represent the personal views of the
author and editor only and should not
in any way be construed to reflect any
endorsement or confirmation by the
Department of Defense, the
Department of the Air Force, or any
other agency of the United States
Government.
Revised (PDF) Edition: May 2002
Previous Editions: 1996, 1993, 1988, 1985


Sampling and Surveying Handbook i
FOREWORDThis handbook contains guidelines for planning, organizing, and
conducting surveys. It should be useful to anyone embarking on a projectrequiring the gathering of data through the medium of the questionnaire.The text is designed to be easily readable, even for someone with a limitedbackground on the subject.
The book is the product of the efforts of several people. MajorKeith C. Ross did the majority of the work in fulfillment of his researchrequirements while a student at the Air Command and Staff College, AirUniversity, Maxwell Air Force Base, Alabama in 1977. Lt Col LawrenceD. Clark was the research advisor for the project, and Major Thomas C.Padgett did the final editing and assembling on the original edition. Dr.Thomas R. Renckly, Air University Curriculum Coordinator, edited the1988 reprint of the first edition, the 1993 second edition, and the 1996Internet edition, in addition to providing supplemental information on biasin survey research (Chapter 5) and common statistical analysis errors(Chapter 6). If you have any questions about the book, Dr. Renckly canbe reached at:
HQ AU/CFA55 LeMay Plaza South
Maxwell AFB, AL 36112-6335(334) 953-2989 or DSN 493-2989

ii Sampling and Surveying Handbook
PREFACETo say that people's opinions and attitudes are more important now
than ever before is very nearly an understatement. More and more we areseeing individuals and groups relying heavily on the opinions and attitudesof customers, constituents, concerned citizens, focus groups, etc., toprovide information for decision making. It is also obvious even to thecasual observer that surveys (including paper-based questionnaires,personal interviews, and telephone polls) play a crucial role in gatheringthese opinions and attitudes.
Surveys are also used as evaluation and control devices. They canbe used to measure the effectiveness of an ongoing project, such as aninformation program, for example. By surveying the participants in aprogram, the effectiveness of the program can be determined. Also,management can use surveying as an aid to control, by finding newproblem areas and insuring that old problem areas have been corrected(which is, for instance, one of the fundamental premises of total qualitymanagement).
The need for accurate information to fuel the decision-makingprocess exists at all levels of management. This has created a trend forsurveys to be generated at lower management levels by staff officers,many of whom are not experienced in survey development oradministration. The growing necessity to survey and the relative lack ofknowledge on surveying methodology leads to a significant demand forinformation on the subject. The primary purpose of this guide is to supplythis information in simple, non-technical language.
An equally important purpose of this guide is to identify problemsthat may arise during development of a survey and to provide techniquesand guidance for solving these problems. The procedures presented in thisguide are designed to help you develop valid and useful surveys.
The steps in surveying are varied and complex. Therefore, thisguide only highlights the major information, techniques, and proceduresavailable to the surveyor. References offering more detailed treatments ofthese subjects are provided in the bibliography and appendices. Since the

Sampling and Surveying Handbook iii
surveyor frequently is unable to reach the entire group in which he isinterested, this guide explains sampling techniques. To use thesetechniques necessitates only a rudimentary knowledge of statistics.Finally, although many of the techniques and procedures covered hereapply equally well to the personal or telephone interview survey, theprimary focus is on the self-administered and group-administered surveys.
One word of caution: Because the steps in survey preparation areclosely interrelated, you should study this entire guide beforebeginning an initial survey effort.

iv Sampling and Surveying Handbook
TABLE OF CONTENTSFOREWORD ....................................................................................................................... i
PREFACE........................................................................................................................... ii
CHAPTER 1 ....................................................................................................................... 1
INTRODUCTION TO SURVEYING ........................................................................................ 1Types of Surveys.......................................................................................................... 1Advantages & Disadvantages of Two Types of Surveys............................................. 1To Survey or Not to Survey ......................................................................................... 3Guide Outline ............................................................................................................... 4
CHAPTER 2 ....................................................................................................................... 7
THE AIR FORCE PERSONNEL SURVEY PROGRAM.............................................................. 7
CHAPTER 3 ....................................................................................................................... 9
DEVELOPING THE PURPOSE, HYPOTHESIS, & SURVEY PLAN............................................ 9The Purpose.................................................................................................................. 9The Hypothesis, Objective, or Research Question..................................................... 10The Survey Plan ......................................................................................................... 11The Data Collection Plan ........................................................................................... 11The Data Reduction and Reformatting Plan .............................................................. 12Open- and Closed-Ended Questions .......................................................................... 12The Analysis Plan ...................................................................................................... 13
CHAPTER 4 ..................................................................................................................... 15
SAMPLING TECHNIQUES AND RELATED STATISTICAL CONCEPTS ................................... 15Sampling Methods...................................................................................................... 15Simple Random Sampling.......................................................................................... 19Stratified Random Sampling ...................................................................................... 20Systematic Sampling .................................................................................................. 22Judgment Sampling .................................................................................................... 23Purposive Sampling.................................................................................................... 23Representative Sampling............................................................................................ 24Factors Influencing Sample Size................................................................................ 24Confidence Level and Precision................................................................................. 25

Sampling and Surveying Handbook v
Determining the Size of the Sample........................................................................... 25
CHAPTER 5 ..................................................................................................................... 29
THE QUESTIONNAIRE...................................................................................................... 29Pros and Cons............................................................................................................. 29The Contents .............................................................................................................. 31Types of Questions..................................................................................................... 33Questionnaire Construction........................................................................................ 33Intensity Questions and the Likert Scale.................................................................... 37Bias and How to Combat It ........................................................................................ 39Bias Involving Volunteer Samples............................................................................. 41
Conclusions Warranting Maximum Confidence..................................................... 42Conclusions Warranting Considerable Confidence ............................................... 42Conclusions Warranting Some Confidence ............................................................ 43Conclusions Warranting Minimum Confidence ..................................................... 44
Summary .................................................................................................................... 45
CHAPTER 6 ..................................................................................................................... 47
COMMON STATISTICAL ANALYSIS ERRORS .................................................................... 47
APPENDIX A................................................................................................................... 51
STEPS IN SURVEYING...................................................................................................... 51
APPENDIX B ................................................................................................................... 53
SURVEY DEVELOPMENT TIMETABLES ............................................................................ 53
APPENDIX C ................................................................................................................... 55
SURVEY DATA SOURCES ................................................................................................ 55
APPENDIX D................................................................................................................... 57
HOW TO USE A RANDOM NUMBER TABLE...................................................................... 57TABLE OF RANDOM NUMBERS........................................................................................ 58
APPENDIX E ................................................................................................................... 59
TABLE OF Z VALUES ...................................................................................................... 59
APPENDIX F.................................................................................................................... 61
SAMPLES ........................................................................................................................ 61Cover Letter ............................................................................................................... 61Privacy Act Statement................................................................................................ 62Survey Instructions..................................................................................................... 63
APPENDIX G................................................................................................................... 65

vi Sampling and Surveying Handbook
RATING OR INTENSITY SCALES....................................................................................... 65TABLE VIII-E-1 -- ACCEPTABILITY PHRASES .............................................................. 65TABLE VIII-E-2 -- DEGREES OF EXCELLENCE: FIRST SET .......................................... 67TABLE VIII-E-3 -- DEGREES OF EXCELLENCE: SECOND SET ...................................... 68TABLE VIII-E-4 -- DEGREES OF LIKE AND DISLIKE ..................................................... 69TABLE VIII-E-5 -- DEGREES OF GOOD AND POOR ....................................................... 70TABLE VIII-E-6 -- DEGREES OF GOOD AND BAD ......................................................... 71TABLE VIII-E-7 -- DEGREES OF AGREE AND DISAGREE............................................... 72TABLE VIII-E-8 -- DEGREES OF MORE AND LESS ........................................................ 73TABLE VIII-E-9 -- DEGREES OF ADEQUATE AND INADEQUATE ................................... 74TABLE VIII-E-10 -- DEGREES OF ACCEPTABLE AND UNACCEPTABLE.......................... 75TABLE VIII-E-11 -- COMPARISON PHRASES.................................................................. 76TABLE VIII-E-12 -- DEGREES OF SATISFACTORY AND UNSATISFACTORY ................... 77TABLE VIII-E-13 -- DEGREES OF UNSATISFACTORY.................................................... 77TABLE VIII-E-14 -- DEGREES OF PLEASANT................................................................ 77TABLE VIII-E-15 -- DEGREES OF AGREEABLE ............................................................. 78TABLE VIII-E-16 -- DEGREES OF DESIRABLE .............................................................. 78TABLE VIII-E-17 -- DEGREES OF NICE......................................................................... 79TABLE VIII-E-18 -- DEGREES OF ADEQUATE............................................................... 79TABLE VIII-E-19 -- DEGREES OF ORDINARY ............................................................... 79TABLE VIII-E-20 -- DEGREES OF AVERAGE................................................................. 81TABLE VIII-E-21 -- DEGREES OF HESITATION ............................................................. 81TABLE VIII-E-22 -- DEGREES OF INFERIOR.................................................................. 82TABLE VIII-E-23 -- DEGREES OF POOR........................................................................ 82TABLE VIII-E-24 -- DESCRIPTIVE PHRASES ................................................................. 83
APPENDIX H................................................................................................................... 83
SAMPLE SETS OF RESPONSE ALTERNATIVES .................................................................. 83Table VIII-F-1 -- Phrases at Least One Standard Deviation Apart with ParallelWording...................................................................................................................... 84Table VIII-F-2 -- Intervals Between Phrases Are as Nearly Equal as Possible....... 86Table VIII-F-3 -- Scale Value Intervals Between Phrases Are as Nearly Equal asPossible ...................................................................................................................... 87Table VIII-F-4 -- Sets Using Order-of-Merit Lists of Descriptors .......................... 88
BIBLIOGRAPHY............................................................................................................. 89

Sampling and Surveying Handbook 1
CHAPTER 1Introduction to Surveying
Webster defines a survey as “the action of ascertaining factsregarding conditions or the condition of something to provide exactinformation especially to persons responsible or interested” and as “asystematic collection and analysis of data on some aspect of an area orgroup.” A survey, then, is much more than the mere compiling of data.The data must be analyzed, interpreted, and evaluated. Only after thisprocessing can data become information. The "exactness" of theinformation is determined by the surveyor's methods. Unless he makes asystematic collection of data, followed by a careful analysis andevaluation with predefined objectives, his collection of data cannotbecome “exact” information.
TYPES OF SURVEYS
Surveys can be divided into two general categories on the basis oftheir extensiveness. A complete survey is called a “census.” It involvescontacting the entire group you are interested in -- the total population or“universe.” The other category is more common; it is a sample survey. Asample is a representative part of a whole group (universe). Thus asample survey involves examining only a portion of the total group inwhich you are interested, and from it, inferring information about thegroup as a whole.
ADVANTAGES & DISADVANTAGESOF THE TWO TYPES OF SURVEYS
One of the decisions to be made in surveying is whether or not tosample. Parten (1950, p 109) presents a list of advantages anddisadvantages of the sample survey. (These, in turn, imply the advantagesand disadvantages of the census.) The three most important

2 Sampling and Surveying Handbook
considerations for the surveyor are: speed, low cost, and increasedaccuracy and analysis of the data.
By sampling only a small portion of a large population, it ispossible to collect data in far less time than would be required to surveythe entire group. Not only is data collection quicker, but data processingand analysis also require less time because fewer pieces of data need to behandled. Rapidly changing conditions and the short turn-around timeimposed in many surveys make the efficient use of time a critical variable.If an accurate snapshot of the attitudes of a particular group is desired,currency is of paramount importance. Professional political pollstersmake their living by providing quick snapshots of the “political climate.”Results of such polls lose their accuracy very quickly (sometimes in aslittle as 24 hours--particularly in the days preceding a major election). So,for these pollsters, time is truly of the essence. It's probably a safe bet thatthose of you reading this guide will not need that degree of speed.Nevertheless, speed is essential to ensure the data are "fresh," especiallywhen it comes to assessing public opinion in a volatile or contentious areabefore they change appreciably.
The smaller amount of data gathered by sampling as opposed tosurveying an entire population can mean large cost savings. By limitingthe group to be surveyed, less time, hence less cost, are involved incollecting, formatting, and analyzing the data. In addition, if automateddata processing (ADP) equipment is being used to analyze data, youroverall time investment will be even less, as will be the overall cost.Sampling allows you to do a credible job for a smaller investment of timeand money.
Parten (1950) also notes that sampling enables the surveyor “togive more attention to each return received and to make certain that thedata are as accurate as possible” (p 110). This attention may lead to moreprecise information than would a less careful collection of data from theentire population. Nothing more than a rudimentary quality control ispossible for the great volume of raw data gathered in a census. The moredata collected, the greater the potential for making “accounting” errors.
The disadvantages of sampling are few, but important. The maindisadvantages stem from risk, lack of representativeness, and insufficientsample size, each of which can cause errors. Inattention to any of thesepotential flaws will invalidate survey results.

Sampling and Surveying Handbook 3
It is important to realize that using a sample from a population toinfer something about the entire population involves a risk. The riskresults from dealing with partial information. If risk is not acceptable inseeking the solution to a problem or the answer to a question, then acomplete survey or census, rather than a sample survey, must beconducted.
Determining the representativeness of the sample is the surveyor'sgreatest problem when sampling. By definition, "sample" means arepresentative part of an entire group. To avoid the charge of using“biased data,” it is necessary to obtain a sample that meets the requirementof representativeness, and this is not an easy task. Without arepresentative sample, a survey will, at best, produce results that aremisleading and potentially dangerous. Procedures for minimizing thepossibility of using a nonrepresentative sample are covered in Chapter 4.
The final major problem in sampling is to determine the size of thesample. The size of the sample you need for a valid survey depends onmany variables including the risk you are willing to accept and thecharacteristics of the population itself. The determination of sample sizeis discussed in Chapter 4. Here, it is sufficient to say that if samplingbecomes too complicated, or the required sample size becomes too large,the easiest solution may be to survey the entire population.
The decision as to whether to survey the entire population or onlya sample of it is not based on the above advantages and disadvantagesalone. It is affected by many other variables that are covered later in thisguide.
TO SURVEY OR NOT TO SURVEY
Before attempting a survey, you should investigate some basicfacts and answer some pertinent questions. The result of this investigationwill be a greater realization of the work involved in producing a survey.Perhaps it will lead to a decision not to survey.
Surveys demand time(maybe more time than you have available.The exact amount of time varies greatly from survey to survey dependingon the number of people to be surveyed and the content of the survey. Asurvey of a few questions administered to the people in your office maytake only a day or so, whereas a larger survey administered to a greatnumber of people located worldwide can take over three months from the

4 Sampling and Surveying Handbook
time the survey is delivered to the printer (see Appendix B). And thisdoes not include the time needed to design the survey and construct thequestionnaire. Moreover, coordination with officials and the customers ofthe survey takes additional time. If your estimate of the time needed toproduce the survey exceeds your deadline date, you are likely to decideyou do not have the time to conduct a survey. A hurried survey wastesboth your time and that of your respondents. The results of a hurriedeffort are questionable at best.
Surveys are expensive to produce. The solution to the problem orthe answer to the question may not be worth the cost to produce it. Evenif it would be worth the price, you may not be able to obtain the neededfunds, either from your own pocket or from your organizational budget.Although no standard estimates of survey cost are available, some of theitems of expense can be examined. The primary expense is in time andeffort; the time you spend producing the survey could be spent on othertasks. If other personnel are needed, they will have to be paid. Access totypewriters, word processors, and calculating machines (or computerresources) is a must. If you expect to gather a great deal of data, the costof renting ADP time and of purchasing ADP scanner sheets should beexamined. Surveys of more than 150-200 respondents cannot feasibly betabulated by hand. The same is true for groups of less than 150respondents if the survey questionnaire is lengthy. The final cost involvessupplies. At a minimum you will need paper and envelopes. You mayalso have to pay either the cost of printing the survey questionnaire or thepostage or both. Each of the above costs that applies to your surveyshould be estimated and the total cost measured against the surveyrequirement.
Since surveys are being used more and more, the information youwant may have already been gathered. A search of some of the surveydata sources listed in Appendix C might yield a solution to your problemor at least provide examples of how others have approached similarproblems. So before you undertake a survey, first make sure the answer toyour problem does not already exist. Next, evaluate the time you willneed and determine the cost involved to produce the survey results, andthen weigh these findings against the importance of the survey. Undertakea survey only if it is worth the time, effort, and cost to make it a good one.
GUIDE OUTLINE

Sampling and Surveying Handbook 5
The remaining chapters of this guide cover the various steps insurveying. Chapter 2 outlines the official policies and procedures withinthe Air Force for conducting surveys. Chapter 3 covers the determinationof the purpose, hypotheses, and survey plan. Chapter 4 deals with thedesign of a sample survey and the technique for determining the requiredsample size. The concepts presented in Chapter 4 will not apply to you, ofcourse, if you are conducting a full census rather than a sample survey.Chapter 5 outlines the construction of the survey questionnaire. Chapter 6discusses some of the more common statistical errors committed by noviceresearchers and ways to avoid them. The various appendices containchecklists and data sources useful in surveying. The bibliography listsinformative references on surveying.

6 Sampling and Surveying Handbook

Sampling and Surveying Handbook 7
CHAPTER 2The Air Force PersonnelSurvey ProgramThe purpose of the Air Force Personnel Survey Program is to
foster the development of compatible and effective surveys, and tominimize exposure of Air Force personnel to repeated or unwarrantedsurvey solicitations (Air Force Instruction (AFI) 36-2601, 1993; p 1).This instruction also describes the survey policy responsibilities andexplains how the survey program is conducted. This chapter willhighlight some of the important points covered in AFI 36-2601, but AirForce personnel who plan to conduct official surveys within the Air Forceshould become familiar with the entire instruction.
The instruction designates the Military Personnel Survey Branch,Air Force Military Personnel Center (AFMPC/DPMYAS), RandolphAFB, Texas 78150, as the controlling and approving agency for Air Forcemilitary personnel surveys. Any member of the Air Force wanting toconduct a survey covered by this instruction must submit a written requestthrough channels to AFMPC/DPMYAS for approval. “Any survey of AirForce civilian personnel must conform to the Air Force Labor RelationsProgram described in AFI 36-701.” (AFI 36-3601, paragraph 7.3).Surveys going to non-DOD civilians (e.g., dependents of militarypersonnel, government contractors, general public, etc.) are a specialconcern. These must be approved through the Office of Management andBudget (OMB), specifically the Office of the Administrative Assistant forthe Secretary of the Air Force, Information Management Policy Division(SAF/AAIA), 1600 Air Force Pentagon, Washington, DC 20330-1600.
The types of surveys requiring approval are defined in detail inparagraphs 2 and 3 of AFI 36-2601. In general, surveys covered by thisinstruction must be personnel surveys and not occupational surveys. Thelatter type, referred to as a job inventory, is used to identify the duties andtasks that comprise an Air Force career field.
It is especially important to note that this instruction does notapply to surveys that concern aspects of base activities that the base
8 Sampling and Surveying Handbook
commander is authorized to change (e.g., surveys of base conditions,commissary or hospital services, etc.). In such cases, the survey does notrequire approval under AFI 36-2601 (paragraph 7.8). These are the majorexclusions, but paragraphs 7.8 and 7.9 identify other less commonexclusions.
Paragraph 7.2 of AFI 36-2601 specifies in detail the informationthat must accompany the request for approval to conduct a survey. Youshould be sure that:
• available information is inadequate to satisfy your needs • currently programmed surveys cannot produce the required
information • the need for the data justifies the cost to obtain it • a survey will produce the best data with the minimum
inconvenience to the respondents.
The Air Force Personnel Survey Program specifies that all datacollected must be treated as privileged information and that respondentswill in no way suffer adverse actions as a result of their participation (ornon-participation). The introductory paragraphs of AFI 36-2601 specifythat all surveys subject to the provisions of AFI 37-132 (Air Force PrivacyAct Program) must contain a Privacy Act Statement. This requires allrespondents be advised of:
• the Federal statute or executive order that authorizes thesolicitation of the information
• the principal purpose(s) for which the data are to be used • the routine uses to be made of it • whether furnishing the information is mandatory or voluntary • the effects (if any) on the individual of not providing all or part
of the requested information.
Finally, AFI 36-2601, paragraph 9, specifies conditions underwhich release of survey results must be coordinated with HQAFMPC/DPMYAS. Every member of the Air Force who administers asurvey should be familiar with and follow the guidelines established bythis instruction and appropriate command/unit operating andimplementing instructions.

Sampling and Surveying Handbook 9
CHAPTER 3Developing the Purpose,Hypotheses, & SurveyPlan
The first steps in producing a survey are the most important. Theydetermine where you are going (the purpose), how you will know whenyour are there - or what you expect to find (the hypotheses, objectives, orresearch questions), and by what route you will go (the survey plan). Ifthese steps are not well planned, all the remaining steps will be wastedeffort.
THE PURPOSE
The first step in producing a survey is to define the purpose orobjective of the survey. “A clear statement of purpose is necessary notonly as a justification/explanation of the project, but also as a guideline todetermine if future actions in the project are in support of the originalpurpose” A Guide for Development..., 1974; p 2). Without knowledge ofthe exact nature of the problem (objective), you cannot decide exactlywhat kind of data to collect or what to do with it once you have it.Usually a staff officer is given a problem or objective; it seldom originateswith him. But this does not relieve the individual of responsibility forinsuring that:
• the problem is well stated • the surveyor understands exactly what the problem is • the stated problem is the real problem
The survey should be designed to answer only the stated problem.Adding additional interesting objectives will lengthen and complicate thesurvey while clouding the real issue.

10 Sampling and Surveying Handbook
THE HYPOTHESIS, OBJECTIVE,OR RESEARCH QUESTION
Once the problem has been clearly stated, the next step is to formone or more hypotheses. The hypothesis is actually your educated guessabout the answer to the problem. It should not be a capricious guess,however. It ought to be based on your prior experience related to theproblem, or perhaps any knowledge you may have of previous researchdone on the topic. Without such a framework in which to make aneducated guess, you really have no basis for making a guess at all. If youdo not have a clear basis for formulating an hypothesis, you should insteaddevelop one or more objectives or questions to frame the scope of yourquestionnaire.
For example, if a problem is identified on the base as declining useof the Officers' Club, an immediately obvious question comes to mind:“Are the officers on this base satisfied with the Officers' Club facilities?”This would be suitable as a research question. It is possible, thoughdoubtful, if you could come up with a supportable hypothesis, or educatedguess, as to the answer to the problem. You may, for instance, havegathered some anecdotal evidence (overhearing colleagues talking) ofdissatisfaction with the club's facilities. But, this may not be sufficient formaking an educated guess that this is the real reason for the decline in clubuse. The problem could be seasonal; it could be related to a decline in theofficer population on the base; or a number of other possibilities. Thepoint is that without some credible evidence to support an hypothesis, youshould probably not formulate one.
If you formulated an hypothesis for the current example on thebasis of the anecdotal evidence available to you, you would naturallyconstruct a questionnaire to survey the opinions of officers regarding theiruse, or lack thereof, of the Officers' Club and the reasons for it. Youmight never think to gather data from the base military personnel office tosee if the officer population is lower now than usual or if there areseasonal (cyclic) trends in the size of the officer population on the base.In other words, establishing the hypothesis may blind you to collectingdata on other possible causes of the problem. This is why all researchersare cautioned not to formulate hypotheses unless they have a solid base intheory or previously gathered evidence that suggests the hypothesis is, infact, probable.

Sampling and Surveying Handbook 11
Hypotheses must be carefully written. They should not containmoral judgments or biased statements such as “All pilots are goodleaders.” There are many ideas on what constitutes a good leader andyour idea may not be the same as those of the people you will contact.Avoid words like should, best, good, bad, and ought.
Hypotheses should be as specific as possible. Avoid words such asmost and some. If by most you mean a majority, then say majority. Asurvey can more easily be designed to test whether “more than 75 percentapprove” than whether “most approve.”
A well-formulated hypothesis, objective, or research questiontranslates the purpose into a statement that can be investigatedscientifically. The level of difficulty you will face in producing a validsurvey will increase dramatically if they are not well formulated. Takecare in doing this step, and it will save you much effort later in the surveydevelopment process.
THE SURVEY PLAN
The next step after determining the purpose and hypotheses isconstructing the survey plan. The purpose of the survey plan is to ensurethat the survey results will provide sufficient data to provide an answer(solution) to the problem you are investigating. The survey plan iscomprised of three different parts:
• data collection plan • data reduction and reformatting plan • analysis plan
None of these plans stands on its own. Decisions you make onhow you will analyze your data will affect your data collection plan. Thetype of data reduction you do will affect not only the types of analyses youcan do, but also the amount and types of data you need to collect. Becausethese plans are closely interrelated, they should be developedconcurrently.
THE DATA COLLECTION PLAN
The purpose of the data collection plan is to ensure that proper dataare collected in the right amounts. Your hypothesis and your data analysis

12 Sampling and Surveying Handbook
plan determine the appropriateness of the data. For example, if you planto analyze your results by age group to test a hypothesis, then you mustcollect data from each age group whose opinions you want to know. Theright amount applies to sample data. As pointed out earlier, the use ofsample data involves risk, and the amount of that risk is determined by thesize of your sample. The amount of risk you are willing or able to acceptshould be stated in your analysis plan. Proper and right come togetherwhen your analysis plan involves both sampling and analyzing data bygroups. You not only have to collect data from some members of eachgroup you plan to analyze, but you also have to see that each groupprovides a response rate that is high enough to ensure your meeting yourminimum risk level. The concept of the proper sample size is covered ingreater detail in Chapter 4.
THE DATA REDUCTION ANDREFORMATTING PLAN
The purpose of the data reduction and reformatting plan is toidentify up front and to decrease as much as possible the amount of datahandling (reduction and reformatting) you will have to do. This plan ishighly dependent on the other two plans. As previously mentioned, ifyour collection plan calls for a great deal of data, you should plan to use acomputer to analyze the data. If ADP scanner sheets are to be used torecord respondents' answers, include the sheets with the questionnaire sothe respondent can fill out the scanner sheet. This will save a great deal oftime that you would have to spend if you transferred the survey data to thescanner sheets yourself. It also eliminates the possibility of your makingerrors in transferring data. You should coordinate in advance with theADP personnel to make sure they will be able to scan your answer sheetsand, if necessary, analyze your data within your timeframe. ADP shopsare busy places. The prudent surveyor will “book” the scanning andanalysis jobs well in advance with ADP personnel to ensure theirresources are available when needed.
A strong potential for error and tedious corrective work lies in datareduction and reformatting. Proper care in developing this plan can save agreat deal of time later and preclude error.
OPEN- AND CLOSED-ENDEDQUESTIONS
Sampling and Surveying Handbook 13
The use of Automatic Data Processing (ADP) necessitates the useof closed-end questions -- a type of question you should consider even ifyou are hand-tabulating your data. A closed-end question lists possibleanswers from which the respondent picks the one he/she likes best. Anexample is the common multiple-choice question. The open-end questionis one to which the respondents write the answer out in their own words.At first glance, the open-end question seems superior since respondentssupply their answers rather than ones from your list of answers. But thewide variety of answers respondents generally provide to open-endquestions turns out to be a great handicap later. For every open-endquestion, there are virtually an infinite number of possible answers. Sinceyou cannot analyze an infinite number of answers, you must devise somemeans of categorizing this diversity of answers into a smaller, moremanageable group. You will find yourself spending a tremendous amountof time reading, comparing, categorizing, and recording each answer.Much of this time can be saved if you use care in developing thequestionnaire and constructing your own categories in advance. Constructeach question so that every possible major category of response iscontained in the answer list.
Then, later, all the computer will have to do is count the number ofanswers in each category. By having the survey respondent, not you,categorize the answer, you will collect data that is more valid, reliably,and accurate than if you did the categorizing yourself. Additionalinformation on closed-end questions is provided in Chapter 5.
THE ANALYSIS PLAN
Finally, an analysis plan ensures that the information produced bythe analysis will adequately address the originally stated hypotheses,objectives, or questions. It also ensures an analysis that is compatible withthe data collected during the survey. In the analysis plan, you determinewhich statistics you will use and how much risk you can take in statingyour conclusions. Each of these decisions will affect the amount and typeof data you collect and how you will reduce it. Novice researchers oftenmisuse statistical analyses out of ignorance of the assumptions on whichthe statistics are based. The most often committed error in statisticalanalysis by novices is using a statistical technique with inappropriate data.The results of such analyses appear to be legitimate, but are actuallyimpossible to interpret correctly. We will discuss some of these commonerrors and how to avoid them in Chapter 6.

14 Sampling and Surveying Handbook
CONCLUDING THOUGHTS
Oppenheim (1966) suggests that to make sure all these parts of thesurvey plan are correctly interlocked, you can simply approach the naturalsequence of survey operations in reverse order. First determine whatconclusions you are interested in; then decide what statistics and resultswill be needed to draw these conclusions. From this, the type of questionsneeded and the nature of the sample can be determined.
A conscientious survey plan will help you produce a well-designedsurvey. The proper data will be processed correctly and efficiently toproduce the information required to shed light on, and hopefully provide asolution to, the original problem.

Sampling and Surveying Handbook 15
CHAPTER 4Sampling Techniquesand Related StatisticalConcepts
Chapter 1 identified some of the problems associated withsampling:
• acceptance of a risk of error • choice of a representative sample • determination of the size of the sample
This chapter outlines procedures for dealing with these challenges.First, different techniques designed to produce a representative samplefrom different types of populations are explained. Next, the relationshipbetween risk and sample size is investigated. Finally, techniques arediscussed for quantifying the amount of risk present in your results and fordetermining the sample size necessary to achieve the confidence andreliability specified in your analysis plan.
SAMPLING METHODS
Your overarching goal in doing a survey is to determine what somegroup thinks or feels about some issue. If money, time, or other resourceswere not a concern, the most accurate data you could get would comefrom surveying the entire population of interest. Since limited resourcesare a reality we all have to deal with, however, we are often forced tosurvey the views of only a few members of the population. But never losesight of the fact that the real purpose is to discover the views of the entirepopulation. Obviously, then, we want to be able to say with as muchconfidence as possible that the views of the group we surveyed representsthe views of the entire population. Using a combination of powerfulstatistical tools, known as inferential statistics, and unbiased sampling

16 Sampling and Surveying Handbook
techniques, any surveyor can collect data that actually represent the viewsof the entire population from which the sample was taken. Two things areabsolutely necessary, however, to ensure a high level of confidence thatthe sample represents the population:
• an unbiased sample • a sufficiently large sample
Bias as a statistical term means error. To say that you want anunbiased sample may sound like you're trying to get a sample that is error-free. As appealing as this notion may be, it is impossible to achieve! Erroralways occurs -- even when using the most unbiased sampling techniques.One source of error is caused by the act of sampling itself. To understandit, consider the following example.
Let's say you have a bowl containing ten slips of paper. On eachslip is printed a number, one through ten. This is your “population.” Nowyou are going to select a sample. We will use a random method fordrawing the sample, which can be done easily by closing your eyes andreaching into the bowl and choosing one slip of paper. After choosing it,check the number on it and place it in the sample pile.
Now to determine if the sample is representative of the population,we must know what attribute(s) we wish to make representative. Sincethere are an infinite number of human attributes, we must preciselydetermine the one(s) we are interested in before choosing the sample.
In our example, the attribute of interest will be the averagenumerical value on the slips of paper. Since the “population” containedten slips numbered consecutively from one to ten, the average numericalvalue in the population is:
1 2 3 4 5 6 7 8 9 1010
5 5+ + + + + + + + +
= .
As you can see, no matter what slip of paper we draw as our firstsample selection, it's value will be either lower or higher than thepopulation average. Let's say the slip we choose first has a 9 on it. Thedifference between our sample (9) and the population (5.5) averages is+3.5 (plus signifies the sample average is larger than the populationaverage). The difference between the sample average and the populationaverage is known as sampling error. That is, the sample mean (average)

Sampling and Surveying Handbook 17
plus (or minus) the total amount of sampling error equals the populationmean.
On our second pick, we choose a slip that has a 1 on it. Now theaverage of sample values is:
9 12
5 0+
= .
The sampling error has shrunk from its previous value of + 3.5 toits new value of - 0.5 (minus signifies the sample mean is now smallerthan the population mean). Each time we choose a slip from thepopulation to include in the sample, one of three mutually exclusive thingscan occur -- the sample mean will become:
• larger than the population mean • smaller than the population mean • equal to the population mean
On average, each sampling brings the sample mean a bit closer tothe population mean. Ultimately, if we sampled everyone from thepopulation, the sample mean and the population mean would be equal.This is why a complete census is completely accurate - there is nosampling error. Yet, if we are forced to use only a sample from thepopulation, the larger the sample the less sampling error we will have,generally speaking.
Equally important to the size of the sample is the determination ofthe type of sampling to be done. In our example, we randomly (blindly)chose from the population. Random sampling always produces thesmallest possible sampling error. In a very real sense, the size of thesampling error in a random sample is affected only by random chance.The two most useful random sampling techniques are simple random andstratified random sampling methods. These will discussed shortly.
Because a random sample contains the least amount of samplingerror, we may say that it is an unbiased sample. Note that we are notsaying the sample contains no error, but rather the minimum possibleamount of error.
Nonrandom sampling techniques also exist, and are used morefrequently than you might imagine. As you can probably guess from ourprevious discussion, nonrandom sampling techniques will always produce

18 Sampling and Surveying Handbook
larger sampling errors (for the same sample size) than random techniques.The reason for this is that nonrandom techniques generate the expectedrandom sampling error on each selection plus additional error related tothe nonrandom nature of the selection process. To explain this, let's extendour sampling example from above.
Let's say we want to sample from a “population” of 1000consecutively numbered slips of paper. Because numbering these slips istime consuming, we have 10 people each number 100 slips and place all100 of them into our bowl when they finish. Let's also say that the lastperson to finish has slips numbered from 901 to 1000, and these are laidon top of all the other slips in the bowl. Now we are ready to select them.
If we wanted to make this a truly random sampling process, wewould have to mix the slips in the bowl thoroughly before selecting.Furthermore, we would want to reach into the bowl to different depths onsubsequent picks to make sure every slip had a fair chance of beingpicked.
But, let us say in this example that we forget to mix the slips in thebowl. Let's also say we only pick from the top layer of slips. It should beobvious what will occur. Because the top layer of slips is numbered 901through 1000, the mean of any sample (of 100 or less) we select will hoveraround 950.5 (the true mean of the numbers 901 through 1000). Clearly,this is not even close to the true population mean (500.5 -- the mean of thenumbers from 1 to 1000). Sampling error amounts to the differencebetween the true population mean and the sample mean. In this example,the sampling error can as large as 450 (950.5 - 500.5).
This was a simple, and somewhat absurd, example of nonrandomsampling. But, it makes the point. Nonrandom sampling methods usuallydo not produce samples that are representative of the general populationfrom which they are drawn. The greatest error occurs when the surveyorattempts to generalize the results of the survey obtained from the sampleto the entire population. Such an error is insidious because it is not at allobvious from merely looking at the data, or even from looking at thesample. The easiest way to recognize whether a sample is representativeor not is to determine if the sample was selected randomly. To be arandom sampling method, two conditions must be met. If both are met,the resulting sample is random. If not, it is a nonrandom samplingtechnique:

Sampling and Surveying Handbook 19
• every member in the population must have an equalopportunity of being selected,
• the selection of any member of the population must have noinfluence on the selection of any other member
All nonrandom sampling methods violate one or both of thesecriteria. The most commonly used nonrandom methods are:
• systematic sampling (selecting every nth person from a group)• cluster sampling (selecting groups of members rather than
single members)• convenience or incidental sampling (selecting only readily
available members)• judgment or purposive sampling (selecting members who are
judged to be appropriate for the study)
SIMPLE RANDOM SAMPLING
A simple random sample is one in which each member (person) inthe total population has an equal chance of being picked for the sample.In addition, the selection of one member should in no way influence theselection of another. Simple random sampling should be used with ahomogeneous population, that is, one composed of members who allpossess the same attribute you are interested in measuring. In identifyingthe population to be surveyed, homogeneity can be determined by askingthe question, “What is (are) the common characteristic(s) that are ofinterest?” These may include such characteristics as age, sex, rank/grade,position, income, religious or political affiliation, etc. -- whatever you areinterested in measuring.
The best way to choose a simple random sample is to use a randomnumber table (or let a computer generate a series of random numbersautomatically). In either case, you would assign each member of thepopulation a unique number (or perhaps use a number already assigned tothem such as SSAN, telephone number, zip code, etc.). The members ofthe population chosen for the sample will be those whose numbers areidentical to the ones extracted from the random number table (orcomputer) in succession until the desired sample size is reached. Anexample of a random number table and instructions for its use appear inAppendix D. Many statistical texts or mathematical tables treat randomnumber generation. A less rigorous procedure for determining randomnessis to write the name of each member of the population on a separate card,

20 Sampling and Surveying Handbook
and with continuous mixing, draw out cards until the sample size isreached.
The simple random sample requires less knowledge about thepopulation than other techniques, but it does have two major drawbacks.One is if the population is large, a great deal of time must be spent listingand numbering the members. The other is the fact that a simple randomsample will not adequately represent many population attributes(characteristics) unless the sample is relatively large. That is, if you areinterested if choosing a sample to be representative of a population on thebasis of the distribution in the population of gender, age, and economicstatus, a simple random sample will need to be very large to ensure allthese distributions are equivalent to (or representative of) the population.To obtain a representative sample across multiple population attributes,you should use the technique of stratified random sampling.
We made this point earlier in this chapter, but it's such animportant concept that it bears repeating. To determine if the samplingmethod you use is random or not, remember that true random samplingmethods must meet two criteria:
• Every member in the population must have an equalopportunity of being chosen for the sample (equality)
• The selection of one member is not affected by the selection ofprevious members (independence)
Both simple random and stratified random sampling methods meetthese two criteria. Nonrandom sampling methods lack one or both ofthese criteria. We discuss stratified random sampling next.
STRATIFIED RANDOM SAMPLING
This method is used when the population is heterogeneous ratherthan homogeneous (or as discussed above, when you want to obtain arepresentative sample across many population attributes). Aheterogeneous population is composed of unlike elements; such as,officers of different ranks, civilians and military personnel, or the patronsof a discount store (differing by gender or age).
A stratified random sample is defined as a combination ofindependent samples selected in proper proportions from homogeneousgroups within a heterogeneous population. The procedure calls forcategorizing the heterogeneous population into groups that are

Sampling and Surveying Handbook 21
homogeneous in themselves. If one group is proportionally larger thananother, its sample size should also be proportionally larger. The numberof groups to be considered is determined by the characteristics of thepopulation. Many times the survey plan will determine some or all of thegroups. For example, if you are comparing enlisted and officer segmentson your base, each of these will be a separate group.
After dividing the population into groups, you then sample eachhomogeneous group. Different sampling techniques can be used in eachof the different groups, but keep in mind that random techniques producethe minimum amount of sampling error. Finally, you should calculate thesample statistics for each group to determine how many members youneed from each subgroup.
We will discuss the calculations involved in determining the sizeof your sample later in this chapter. These calculations are designed todetermine the size of a simple random sample. Since the stratifiedsampling technique requires you to create simple, homogeneoussubgroups from a large heterogeneous group, think of the calculations fora stratified sample as a series of simple random sample size calculationsfor each homogeneous subgroup. The only other information you mustknow is the proportion of the population possessing the attribute containedin each homogeneous subgroup.
For example, let's say we want to draw a random sample from apopulation of military personnel to assess their opinions on some issue. Inaddition, we would like to determine if the opinions differ by officer-enlisted affiliation and gender of the individuals surveyed. We recognizethat the population we want to draw our sample from is heterogeneouswith respect to the two attributes of interest to us. So, we have to createhomogeneous subgroups (four to be exact):
• Enlisted, male • Enlisted, female • Officer, male • Officer, female
Now, each group is homogeneous on both attributes. To ensureeach subgroup in the sample will represent its counterpart subgroup in thepopulation, we must ensure each subgroup is represented in the sample inthe same proportion to the other subgroups as they are in the population.Let's assume that we know (or can estimate) the population of Air Forcemilitary personnel to be distributed as follows: 70 percent male, 30

22 Sampling and Surveying Handbook
percent female and 65 percent enlisted, 35 percent officer. With that, wecan determine the approximate proportions of our four homogeneoussubgroups in the population:
• Enlisted, male .65 x .70 = .455 • Enlisted, female .65 x .30 = .195 • Officer, male .35 x .70 = .245 • Officer, female .35 x .30 = .105
Thus, a representative sample of the Air Force population (by raceand enlisted-officer affiliation) would be composed of 45.5 percentenlisted males, 19.5 percent enlisted females, 24.5 percent officer males,and 10.5 percent officer females. Each percentage should be multiplied bythe total sample size needed to arrive at that actual number of personnelrequired from each subgroup or stratum.
As this example illustrates, stratified random sampling requires adetailed knowledge of the distribution of attributes or characteristics ofinterest in the population to determine the homogeneous groups that liewithin it. A stratified random sample is superior to a simple randomsample since the population is divided into smaller homogeneous groupsbefore sampling, and this yields less variation within the sample. Thismakes possible the desired degree of accuracy with a smaller sample size.But, if you cannot accurately identify the homogeneous groups, you arebetter off using the simple random sample since improper stratificationcan lead to serious error.
SYSTEMATIC SAMPLING
Sometimes it is more expeditious to collect a sample of surveyparticipants systematically. This is frequently done, for instance, in exitpolling of voters or store customers. It is a nonrandom samplingtechnique, but is used primarily for its ease and speed of identifyingparticipants.
To use the systematic approach, simply choose every Kth memberin the population where K is equal to the population size divided by therequired sample size. If this quotient has a remainder, ignore it (rounddown). For example, if you need 100 members in your sample and thepopulation consists of 1000 people, you need to sample every 1000/100(or 10th) member of the population. When using this method, some

Sampling and Surveying Handbook 23
suggest you should choose your starting point at random by choosing arandom number from 1 to K.
If you recall the characteristic requirements for a random samplediscussed above (equality and independence), you can see that systematicsampling methods lack both characteristics. Every member from thepopulation does not have a equal chance of being selected, and theselection of members for the sample depends on the initial selection.Regardless of how you select your starting point, once selected, everysubsequent member of the sample is automatically determined. Thismethod is clearly nonrandom.
Some suggest that by mixing the population well you can turn thisinto a random sampling technique. They are wrong. Regardless of howmuch you mix the population before selecting a starting point, the factremains that once that point is chosen, further selection of members for thesample is nonrandom (no independence).
Recognize the limitation of this type of sampling. Since it isnonrandom, the resulting sample will not necessarily be representative ofthe population from which it was drawn. This will affect your ability toconfidently generalize results of the survey since you may not be sure towhich segment of the population the results will apply. As a word ofadvice, unless you have experience in systematic sampling techniques, andhave full knowledge of the population to be sampled, you should avoidusing this method.
JUDGMENT SAMPLING
Judgment sampling involves asking an expert on an issue beinginvestigated to define the members that should comprise the sample. Therepresentativeness of the sample is determined solely by the judgment ofthe researcher. Since each member in the population does not have anequal chance of being chosen, a judgment sample is also a nonrandomsampling method. Since the sample does not meet the criterion ofrandomness - the basis for many statistical sampling applications ( ajudgment sample should never be used in a statistical evaluation effort.
PURPOSIVE SAMPLING

24 Sampling and Surveying Handbook
As the name implies, purposive sampling involves selectingmembers from the population to comprise a sample because theyspecifically meet some prescribed purpose of possess specific attributes ofinterest that address the purpose of a particular research problem underinvestigation. Purposive sampling is used primarily in causal-comparative(ex post facto) research where the researcher is interested in finding apossible cause-and-effect link between two variables, one of which hasalready occurred. The researcher intentionally selects the samples in sucha way that one possesses the causal (independent) variable and one doesnot. The purpose of the research governs the selection of the sample and,thus, excludes members of the population who do not contribute to thatpurpose.
REPRESENTATIVE SAMPLING
The types of sampling methods discussed above are only a few ofthe many available. You will find others in the references listed in thebibliography. Each type is designed to obtain the most representativesample possible from different kinds of populations. Before using anysampling method yourself, first think about the population to which youwant to generalize the results of your survey (which population do youwant to represent). If generalizing results is not your aim, any samplingmethod will do. If generalizing results is important, use a samplingmethod that will ensure your sample is representative of the populationfrom which you draw it. Random sampling methods typically ensure ahigh degree of confidence that the results do, in fact, represent those of thewhole population.
FACTORS INFLUENCING SAMPLE SIZE
As pointed out in Chapter 1, when you sample you are dealingwith only partial information. And you must accept a risk of being wrongwhen inferring something about the population on the basis of sampleinformation. In the analysis portion of your survey plan, you identify theamount of risk you are willing (or allowed) to take. This amount of riskrelates directly to the size of your sample. Simply stated, the less risk youare willing to take, the larger your sample must be. If you cannot acceptany risk, you should survey the entire population (take a census) and youneed not study this chapter any further.

Sampling and Surveying Handbook 25
When determining your risk level, keep in mind the time and costinvolved in obtaining the sample size sufficient to achieve the risk levelyou can accept. You may find it impossible to produce a sample largeenough to meet that risk level.
Another factor bearing on sample size is also obtained from youranalysis plan. It is the number of groups you are planning to examinewithin the population. For example, if you are planning to compare twogroups (enlisted and officer) on a base (your population), each of thegroups must be sampled and each of the samples must be large enough toensure satisfying your risk level.
CONFIDENCE LEVEL AND PRECISION
Risk, as it relates to sample size determination, is specifiedby two interrelated factors:
• the confidence level • the precision (or reliability) range.
To minimize risk, you should have a high confidence (say 95percent) that the true value you seek (the actual value in the population)lies somewhere within a small interval (say + or - 5 percent) around yoursample value (your precision). Sawyer (1971; p 49) uses a baseball gameanalogy to explain confidence level, precision range, and theirrelationship. A baseball pitcher may feel that he can get very few of hispitches (perhaps 10 percent) over the exact center (small precision range)of home plate. But since home plate is 17 inches wide, he may feel that hecan get 95 percent of his pitches over the center of the plate with aprecision of plus or minus 8 1/2 inches (a 95 percent confidence level). Ifthe plate is widened to 30 inches, he may feel 99 percent confident. Sowhen we widen the range of precision (or reliability), we increase ourconfidence level. Likewise, if we reduce the range, we reduce ourconfidence level. Most surveying organizations use a 95 percentconfidence level and a ± 5 percent precision level as the absoluteminimum.
DETERMINING THE SIZE OF THE SAMPLE
Once you determine your desired degree of precision and yourconfidence level, there are several formulas you can use to determine

26 Sampling and Surveying Handbook
sample size depending on how you plan to report the results of your study.We'll discuss three of them here. If you will be reporting results aspercentages (proportions) of the sample responding, use the followingformula:
If you will report results as means (averages) of the sampleresponding, use the following formula:
If you plan to report results in a variety of ways, or if you havedifficulty estimating percentage or standard deviation of the attribute ofinterest, the following formula may be more suitable for use:

Sampling and Surveying Handbook 27
We illustrate this formula with the following example. If the totalpopulation (N) is 10,000, and you wish a 95% confidence level and ± 5percent precision level (d = .05, Z = 1.96 from Appendix E), then:
So, a representative sample of 370 (369.98 rounded up) would besufficient to satisfy your risk level. Inspection of the formula shows thatthe required sample size will increase most rapidly if:
• the confidence level (Z factor) is increased, or• the precision level (d) is made smaller.
If you have stratified your population into more than one group,the size of each group will be its proportion (percentage) in the populationtimes the total sample size as computed above. To illustrate, recall ourearlier example of four stratified groups. Using the n of 370 calculatedabove, each of these strata should have the following sample sizes:
• Enlisted, male 370 x .455 = 168.35 = 168 • Enlisted, female 370 x .195 = 72.15 = 72 • Officer, male 370 x .245 = 90.65 = 91 • Officer, female 370 x .105 = 38.85 = 39

28 Sampling and Surveying Handbook
Finally, you should adjust the computed sample size (n) bydividing n by the expected response rate. For instance, if you expect 75
percent response rate, you should make your sample size equal n
0 75.. If
you can't anticipate a response rate, assume a 50 percent response rate(i.e., double the n value). This sort of adjustment should ensure you get asufficient number of responses regardless of return rate.

Sampling and Surveying Handbook 29
CHAPTER 5The Questionnaire
The final step in preparing the survey is developing the datacollection instrument. The most common means of collecting data are theinterview and the self- or group-administered questionnaire. In the past,the interview has been the most popular data-collecting instrument.Recently, the questionnaire has surpassed the interview in popularity,especially in the military. Due to this popularity, this chapter concentrateson the development of the questionnaire.
THE QUESTIONNAIRE PROS AND CONS
It is important to understand the advantages and disadvantages ofthe questionnaire as opposed to the personal interview. This knowledgewill allow you to maximize the strengths of the questionnaire whileminimizing its weaknesses. The advantages of administering aquestionnaire instead of conducting an interview are:
• lower costs • better samples • standardization • respondent privacy (anonymity)
The primary advantage is lower cost, in time as well as money.Not having to train interviewers eliminates a lengthy and expensiverequirement of interviewing. The questionnaire can be administeredsimultaneously to large groups whereas an interview requires eachindividual to be questioned separately. This allows the questions to reacha given number of respondents more efficiently than is possible with theinterview. Finally, the cost of postage should be less than that of travel ortelephone expenses.

30 Sampling and Surveying Handbook
Recent developments in the science of surveying have led toincorporating computers into the interview process, yielding what iscommonly known as computer automated telephone interview (or CATI)surveys. Advances in using this survey technique have dramaticallyreshaped our traditional views on the time-intensive nature and inherentunreliability of the interview technique. Yet, despite resurgence in theviability of survey interviews, instruction in the development and use ofthe CATI technique is well beyond the scope of this handbook.
Many surveys are constrained by a limited budget. Since a typicalquestionnaire usually has a lower cost per respondent, it can reach morepeople within a given budget (or time) limit. This can enhance theconduct of a larger and more representative sample.
The questionnaire provides a standardized data-gatheringprocedure. Using a well-constructed questionnaire can minimize theeffects of potential human errors (for example, altering the pattern ofquestion asking, calling at inconvenient times, and biasing by“explaining”. The use of a questionnaire also eliminates any biasintroduced by the feelings of the respondents towards the interviewer (orvice versa).
Although the point is debatable, most surveyors believe therespondent will answer a questionnaire more frankly than he wouldanswer an interviewer, because of a greater feeling of anonymity. Therespondent has no one to impress with his/her answers and need have nofear of anyone hearing them. To maximize this feeling of privacy, it isimportant to guard, and emphasize, the respondent's anonymity.
The primary disadvantages of the questionnaire are nonreturns,misinterpretation, and validity problems. Nonreturns are questionnaires orindividual questions that are not answered by the people to whom theywere sent. Oppenheim (1966) emphasizes that “the important point aboutthese low response rates is not the reduced size of the sample, which couldeasily be overcome by sending out more questionnaires, but the possibilityof bias. Nonresponse is not a random process; it has its own determinants,which vary from survey to survey” (p 34).
For example, you may be surveying to determine the attitude of agroup about a new policy. Some of those opposed to it might be afraid tospeak out, and they might comprise the majority of the nonreturns. Thiswould introduce non-random (or systematic) bias into your survey results,especially if you found only a small number of the returns were in favor of

Sampling and Surveying Handbook 31
the policy. Nonreturns cannot be overcome entirely. What we can do istry to minimize them. Techniques to accomplish this are covered later inthis chapter.
Misinterpretation occurs when the respondent does not understandeither the survey instructions or the survey questions. If respondentsbecome confused, they will either give up on the survey (becoming anonreturn) or answer questions in terms of the way they understand it, butnot necessarily the way you meant it. Some view the latter problem as amore dangerous occurrence than merely nonresponding. Thequestionnaire instructions and questions must be able to stand on theirown and must use terms that have commonly understood meaningsthroughout the population under study. If novel terms must be used, besure to define them so all respondents understand your meaning.
The third disadvantage of using a questionnaire is inability tocheck on the validity of the answer. Did the person you wanted to surveygive the questionnaire to a friend or complete it personally? Did theindividual respond indiscriminately? Did the respondent deliberatelychoose answers to mislead the surveyor? Without observing therespondent's reactions (as would be the case with an interview) whilecompleting the questionnaire, you have no way of knowing the trueanswers to these questions.
The secret in preparing a survey questionnaire is to take advantageof the strengths of questionnaires (lower costs, more representativesamples, standardization, and privacy) while minimizing the number ofnonreturns, misinterpretations, and validity problems. This is not alwaysas easy as it sounds. But an inventive surveyor can very often findlegitimate ways of overcoming the disadvantages. We provide somesuggestions below to help.
THE CONTENTS
The key to minimizing the disadvantages of the surveyquestionnaire lies in the construction of the questionnaire itself. A poorlydeveloped questionnaire contains the seeds of its own destruction. Eachof the three portions of the questionnaire - the cover letter, theinstructions, and the questions - must work together to have a positiveimpact on the success of the survey.

32 Sampling and Surveying Handbook
The cover letter should explain to the respondent the purpose ofthe survey and motivate him to reply truthfully and quickly. If possible, itshould explain why the survey is important to him, how he was chosen toparticipate, and who is sponsoring the survey (the higher the level ofsponsorship the better). Also the confidentiality of the results should bestrongly stressed. A well written cover letter can help minimize bothnonreturn and validity problems. An example is given in Appendix F. Insupport of the statement above regarding level of sponsorship, thesignature block on the letter should be as high level as you can getcommensurate with the topic being investigated. For instance, a surveyabout Air Force medical issues or policy should be signed by the AirForce Surgeon General or higher, a survey on religious issues by the AirForce Chief of Chaplains, etc. Another tip that seems to help improveresponse rate is to identify the survey as official. Even though the letter ison government stationery and is signed by an military official, it may helpto mark the survey itself with an OFFICIAL stamp of some sort. Ingeneral, the more official the survey appears, the less likely it is to bedisregarded.
The cover letter should be followed by a clear set of instructionsexplaining how to complete the survey and where to return it. If therespondents do not understand the mechanical procedures necessary torespond to the questions, their answers will be meaningless. Theinstructions substitute for your presence, so you must anticipate anyquestions or problems that may arise and attempt to prevent them fromoccurring. If you are using ADP scanner sheets, explain how you want therespondent to fill it in - what portions to use and what portions to leaveblank. Remember anonymity! If you do not want respondents to providetheir names or SSANs, say so explicitly in the instructions, and tell themto leave the NAME and SSAN portions of the scan sheets blank.
If you need respondents' SSAN and/or name included on thesurvey for tracking or analysis purposes, you will need to put a PrivacyAct Statement somewhere on the survey (refer to Chapter 2). The"Instructions" page is usually a good place for this statement. It places itin a prominent place where all respondents will see it, but does not clutterthe instrument itself or the cover letter.
The third and final part of the questionnaire is the set of questions.Since the questions are the means by which you are going to collect yourdata, they should be consistent with your survey plan. They should not beambiguous or encourage feelings of frustration or anger that will lead tononreturns or validity problems.

Sampling and Surveying Handbook 33
TYPES OF QUESTIONS
Before investigating the art of question writing, it will be useful toexamine the various types of questions. Cantelou (1964; p 57) identifiesfour types of questions used in surveying. The classifier or backgroundquestion is used to obtain demographic characteristics of the group beingstudied, such as age, sex, grade, level of assignment, and so forth. Thisinformation is used when you are categorizing your results by varioussubdivisions such as age or grade. Therefore, these questions should beconsistent with your data analysis plan. The second and most commontype of question
is the multiple choice or closed-end question. It is used todetermine feelings or opinions on certain issues by allowing therespondent to choose an answer from a list you have provided (seeChapter 3). The intensity question, a special form of the multiple-choicequestion, is used to measure the intensity of the respondent's feelings on asubject. These questions provide answers that cover a range of feelings.
The intensity question is covered in greater detail later in thischapter. The final type of question is the free response or open-endquestion. This type requires respondents to answer the question in theirown words (see Chapter 3). It can be used to gather opinions or tomeasure the intensity of feelings. Multiple-choice questions are the mostfrequently used types of questions in surveying today. It is prudent,therefore, to concentrate primarily on factors relating to their application.
QUESTIONNAIRE CONSTRUCTION
Many researchers have investigated the complex art of questionwriting. From their experiences, they offer valuable advice. Below aresome helpful hints typical of those that appear most often in texts onquestion construction.
1. Keep the language simple. Analyze your audience and writeon their level. Parten (1950; p 201) suggests that writing at the sixth-grade level may be appropriate. Avoid the use of technical terms orjargon. An appropriate corollary to Murphy's Law in this case would be:If someone can misunderstand something, they will.

34 Sampling and Surveying Handbook
2. Keep the questions short. Long questions tend to becomeambiguous and confusing. A respondent, in trying to comprehend a longquestion, may leave out a clause and thus change the meaning of thequestion.
3. Keep the number of questions to a minimum. There is nocommonly agreed on maximum number of questions that should be asked,but research suggests higher return rates correlate highly with shortersurveys. Ask only questions that will contribute to your survey. Applythe “So what?” and “Who cares?” tests to each question. “Nice-to-know”questions only add to the size of the questionnaire. Having said this, keepin mind that you should not leave out questions that would yield necessarydata simply because it will shorten your survey. If the information isnecessary, ask the question. With the availability of desktop publishing(DTP) software, it is often possible to give the perception of a smallersurvey (using smaller point/pitch typefaces, etc.) even though manyquestions are asked. A three-page type written survey can easily bereduced to a single page using DTP techniques.
4. Limit each question to one idea or concept. A questionconsisting of more than one idea may confuse the respondent and lead to ameaningless answer. Consider this question: “Are you in favor of raisingpay and lowering benefits?” What would a yes (or no) answer mean?
5. Do not ask leading questions. These questions are worded ina manner that suggests an answer. Some respondents may give the answeryou are looking for whether or not they think it is right. Such questionscan alienate the respondent and may open your questionnaire to criticism.A properly worded question gives no clue as to which answer you maybelieve to be the correct one.
6. Use subjective terms such as good, fair, and bad sparingly,if at all. These terms mean different things to different people. Oneperson's “fair” may be another person's “bad.” How much is “often” andhow little is “seldom?”
7. Allow for all possible answers. Respondents who cannot findtheir answer among your list will be forced to give an invalid reply or,possibly, become frustrated and refuse to complete the survey. Wordingthe question to reduce the number of possible answers is the first step.Avoid dichotomous (two-answer) questions (except for obviousdemographic questions such as gender). If you cannot avoid them, add athird option, such as no opinion, don't know, or other. These may not

Sampling and Surveying Handbook 35
get the answers you need but they will minimize the number of invalidresponses. A great number of “don't know” answers to a question in afact-finding survey can be a useful piece of information. But a majority of“other” answers may mean you have a poor question, and perhaps shouldbe cautious when analyzing the results.
8. Avoid emotional or morally charged questions. Therespondent may feel your survey is getting a bit too personal!
9. Understand the should-would question. Selltiz, et al. (1963,p 251) note that respondents answer “should” questions
from a social or moral point of view while answering “would”questions in terms of personal preference.
10. Formulate your questions and answers to obtain exactinformation and to minimize confusion. For example, does “How oldare you?” mean on your last or your nearest birthday? Does “What is your(military) grade?” mean permanent or temporary grade? As of what date?By including instructions like “Answer all questions as of (a certaindate)”, you can alleviate many such conflicts. (Refer to hint 13 below.)
11. Include a few questions that can serve as checks on theaccuracy and consistency of the answers as a whole. Have somequestions that are worded differently, but are soliciting the sameinformation, in different parts of the questionnaire. These questionsshould be designed to identify the respondents who are just markinganswers randomly or who are trying to game the survey (giving answersthey think you want to hear). If you find a respondent who answers thesequestions differently, you have reason to doubt the validity of their entireset of responses. For this reason, you may decide to exclude theirresponse sheet(s) from the analysis.
12. Organize the pattern of the questions:
• Place demographic questions at the end of the questionnaire. • Have your opening questions arouse interest. • Ask easier questions first. • To minimize conditioning, have general questions precede specific
ones. • Group similar questions together. • If you must use personal or emotional questions, place them at the end
of the questionnaire.
36 Sampling and Surveying Handbook
Note: The next two hints apply to the entire questionnaireincluding the cover letter, instructions, and question.
13. Pretest (pilot test) the questionnaire. This is the mostimportant step in preparing your questionnaire. The purpose of the pretestis to see just how well your cover letter motivates your respondents andhow clear your instructions, questions, and answers are. You shouldchoose a small group of people (from three to ten should be sufficient) youfeel are representative of the group you plan to survey. After explainingthe purpose of the pretest, let them read and answer the questions withoutinterruption. When they are through, ask them to critique the cover letter,instructions, and each of the questions and answers. Don't be satisfiedwith learning only what confused or alienated them. Question them tomake sure that what they thought something meant was really what youintended it to mean. Use the above 12 hints as a checklist, and go throughthem with your pilot test group to get their reactions on how well thequestionnaire satisfies these points. Finally, redo any parts of thequestionnaire that are weak.
14. Have your questionnaire neatly produced on qualitypaper. A professional looking product will increase your return rate. Asmentioned earlier, desktop publishing software can be used to add a veryprofessional touch to your questionnaire and improve the likelihood of itsbeing completed. But always remember the adage “You can't make a silkpurse out of a sow's ear.” A poorly designed survey that contains poorlywritten questions will yield useless data regardless of how “pretty” itlooks.
15. Finally, make your survey interesting!

Sampling and Surveying Handbook 37
INTENSITY QUESTIONS AND THE LIKERT SCALE
As mentioned previously, the intensity question is used to measurethe strength of a respondent's feeling or attitude on a particular topic.Such questions allow you to obtain more quantitative information aboutthe survey subject. Instead of a finding that 80 percent of the respondentsfavor a particular proposal or issue, you can obtain results that show 5percent of them are strongly in favor whereas 75 percent are mildly infavor. These findings are similar, but the second type of response suppliesmore useful information.
The most common and easily used intensity (or scaled) questioninvolves the use of the Likert-type answer scale. It allows the respondentto choose one of several (usually five) degrees of feeling about a statementfrom strong approval to strong disapproval. The “questions” are in theform of statements that seem either definitely favorable or definitelyunfavorable toward the matter under consideration. The answers are givenscores (or weights) ranging from one to the number of available answers,with the highest weight going to the answer showing the most favorableattitude toward the subject of the survey. The following questions fromthe Minnesota Survey of Opinions designed to measure the amount of“anti-US law” feelings illustrate this procedure:
1. Almost anything can be fixed up in the courts if you have enough money.
Strongly StronglyDisagree Disagree Undecided Agree Agree (1) (2) (3) (4) (5)
2. On the whole, judges are honest.
Strongly StronglyDisagree Disagree Undecided Agree Agree (1) (2) (3) (4) (5)
The weights (shown by the numbers below the answers) are notshown on the actual questionnaire and, therefore, are not seen by therespondents. A person who feels that US laws are unjust would scorelower than one who feels that they are just. The stronger the feeling, thehigher (or lower) the score. The scoring is consistent with the attitude
38 Sampling and Surveying Handbook
being measured. Whether “agree” or “disagree” gets the higher weightactually makes no difference. But for ease in interpreting the results of thequestionnaire, the weighting scheme should remain consistent throughoutthe survey.
One procedure for constructing Likert-type questions is as follows(adapted from Selltiz, et al., 1963; pp 367-368):
1. The investigator collects a large number of definitive statementsrelevant to the attitude being investigated.
2. Conduct and score a pretest of your survey. The most favorable
response to the attitude gets the highest score for each question.The respondent's total score is the sum of the scores on allquestions.
3. If you are investigating more than one attitude on your survey,
intermix the questions for each attitude. In this manner, therespondent will be less able to guess what you are doing and thusmore likely to answer honestly.
4. Randomly select some questions and flip-flop the Strongly Agree -
- Strongly Disagree scale to prevent the respondent from gettinginto a pattern of answering (often called a response set).
The intensity question, with its scaled answers and average scores,can supply quantitative information about your respondents' attitudestoward the subject of your survey. The interested reader is encouraged tolearn and use other scales, such as the Thurstone, Guttman, and SemanticDifferential scales, by studying some of the references in the bibliography.
A number of studies have been conducted over the yearsattempting to determine the limits of a person's ability to discriminatebetween words typically found on rating or intensity scales. The results ofthis research can be of considerable value when trying to decide on theright set of phrases to use in your rating or intensity scale. When selectingphrases for a 4-, 5-, 7-, or 9-point Likert scale, you should choose phrasesthat are far enough apart from one another to be easily discriminated,while, at the same time, keeping them close enough that you don't losepotential information. You should also try to gauge whether the phrasesyou are using are commonly understood so that different respondents willinterpret the meaning of the phrases in the same way. An obvious

Sampling and Surveying Handbook 39
example is shown with the following 3 phrases: Strongly Agree, Neutral,Strongly Disagree
These are easily discriminated, but the gap between each choice isvery large. How would a person respond on this three-point scale if theyonly agreed with the question being asked? There is no middle groundbetween Strongly Agree and Neutral. The same thing is true for someonewho wants to respond with a mere disagree. Your scales must haveenough choices to allow respondents to express a reasonable range ofattitudes on the topic in question, but there must not be so many choicesthat most respondents will be unable to consistently discriminate betweenthem. Appendix H provides several tables containing lists of phrasescommonly used in opinion surveys with associated “scale values” andstandard deviations (or inter-quartile range values). Also provided is ashort introduction describing how these lists can be used in selectingresponse alternatives for your opinion surveys. The information in thatappendix is derived from research done for the U.S. Army ResearchInstitute for the Behavioral and Social Services at Fort Hood, Texas.
BIAS AND HOW TO COMBAT IT
Like any scientist or experimenter, surveyors must be aware ofways their surveys might become biased and of the available means forcombating bias. The main sources of bias in a questionnaire are:
• a nonrepresentative sample • leading questions • question misinterpretation • untruthful answers
Surveyors can expose themselves to possible nonrepresentativesample bias in two ways. The first is to actually choose anonrepresentative sample. This bias can be eliminated by careful choiceof the sample as discussed earlier in Chapter 4. The second way is to havea large number of nonreturns.
The nonreturn bias (also called non-respondent bias) can affectboth the sample survey and the complete survey. The bias stems from thefact that the returned questionnaires are not necessarily evenly distributedthroughout the sample. The opinions or attitudes expressed by those whoreturned the survey may or may not represent the attitudes or opinions ofthose who did not return the survey. It is impossible to determine which is
40 Sampling and Surveying Handbook
true since the non-respondents remain an unknown quantity. Say, forexample, a survey shows that 60 percent of those returning questionnairesfavor a certain policy. If the survey had a 70 percent response rate (afairly high rate as voluntary surveys go), then the favorable replies areactually only 42 percent of those questioned (60 percent of the 70 percentwho replied), which is less than 50 percent! a minority response in termsof the whole sample.
Since little can be done to estimate the feelings of thenonreturnees, especially in a confidential survey, the only solution is tominimize the number of nonreturns. Miller (1970; p 81) and Selltiz et al.(1963; p 241) offer the following techniques to get people to reply tosurveys. Some of these have already been mentioned in earlier sections ofthis chapter.
1. Use follow-up letters. These letters are sent to the non-respondents after a period of a couple of weeks asking them again to fillout and return the questionnaire. The content of this letter is similar tothat of the cover letter. If you are conducting a volunteer survey, youshould anticipate the need for following up with non-respondents and codethe survey in some unobtrusive way to tell who has and who has not yetresponded. If you don't do that, but still need to get in touch with non-respondents, consider placing ads in local papers or base bulletins,announcements at commander's call, or notices posted in public places. Ifat all possible, provide a fresh copy of the survey with the follow- upletter. This often increases return rate over simply sending out a letteralone.
2. Use high-level sponsorship. This hint was mentioned in anearlier section. People tend to reply to surveys sponsored by organizationsthey know or respect. If you are running a military survey, obtain thehighest-ranking sponsorship you can. Effort spent in doing this will resultin a higher percentage of returns. If possible, use the letterhead of thesponsor on your cover letter.
3. Make your questionnaire attractive, simple to fill out, andeasy to read. A professional product usually gets professional results.
4. Keep the questionnaire as short as possible. You are askingfor a person's time, so make your request as small as possible.

Sampling and Surveying Handbook 41
5. Use your cover letter to motivate the person to return thequestionnaire. One form of motivation is the have the letter signed by anindividual known to be respected by the target audience for yourquestionnaire. In addition, make sure the individual will be perceived bythe audience as having a vested interest in the information needed.
6. Use inducements to encourage a reply. These can range froma small amount of money attached to the survey to an enclosed stampedenvelope. A promise to report the results to each respondent can behelpful. If you do promise a report, be sure to send it.
Proper use of these techniques can lower the nonreturn rate toacceptable levels. Keep in mind, though, that no matter what you do, therewill always be non-respondents to your surveys. Make sure the effort andresources you spend are in proportion with the return you expect to get.
The second source of bias is misinterpretations of questions. Wehave seen that these can be limited by clear instructions, well-constructedquestions, and through judicious pilot testing of the survey. Biasedquestions can also be eliminated by constructing the questions properlyand by using a pilot test. Finally, internal checks and a good motivationalcover letter can control bias introduced by untruthful answers. Althoughbias cannot be eliminated totally, proper construction of the questionnaire,a well-chosen sample, follow- up letters, and inducements can help controlit.
BIAS IN VOLUNTEER SAMPLES
This section illustrates the many diverse, and sometimes powerfulfactors that influence survey findings as a result of using volunteers in asurvey. The conclusions expressed here regarding volunteer samples areprovided to make the surveyor aware of the often profound effects of non-respondent bias on survey data.
The exclusive use of volunteers in survey research representsanother major source of bias to the surveyor -- especially the novice.Although it may not be immediately evident, it is nonetheless empiricallytrue that volunteers, as a group, possess characteristics quite different fromthose who do not generally volunteer. Unless the surveyor takes thesedifferences into consideration before choosing to use an exclusivelyvolunteer sample, the bias introduced into the data may be so great that the

42 Sampling and Surveying Handbook
surveyor can no longer confidently generalize the survey's findings to thepopulation at large, which is usually the goal of the survey.
Fortunately, research findings exist which describe several uniquecharacteristics of the volunteer subject. By using these characteristicsappropriately, the surveyor may avoid inadvertent biases and pitfallsusually associated with using and interpreting results from volunteersamples. The following list provides 22 conclusions about uniquecharacteristics of the volunteer. The list is subdivided into categoriesrepresenting the level of confidence to be placed in the findings. Withineach category, the conclusions are listed in order starting with thosehaving the strongest evidence supporting them. (from Rosenthall andRosnow, The Volunteer Subject, 1975; pp 195-196):
Conclusions Warranting Maximum Confidence
1. Volunteers tend to be better educated than nonvolunteers,especially when personal contact between investigator andrespondent is not required.
2. Volunteers tend to have higher social-class status than
nonvolunteers, especially when social class is defined byrespondents' own status rather than by parental status.
3. Volunteers tend to be more intelligent than nonvolunteers when
volunteering is for research in general, but not when volunteeringis for somewhat less typical types of research such as hypnosis,sensory isolation, sex research, small-group and personalityresearch.
4. Volunteers tend to be higher in need for social approval than
nonvolunteers. 5. Volunteers tend to be more sociable than nonvolunteers.
Conclusions Warranting Considerable Confidence

Sampling and Surveying Handbook 43
6. Volunteers tend to be more arousal seeking than nonvolunteers,especially when volunteering is for studies of stress, sensoryisolation, and hypnosis.
7. Volunteers tend to be more unconventional than nonvolunteers,
especially when volunteering is for studies of sex behavior. 8. Females are more likely than males to volunteer for research in
general, more likely than males to volunteer for physically andemotionally stressful research (e.g., electric shock, hightemperature, sensory deprivation, interviews about sex behavior).
9. Volunteers tend to be less authoritarian than nonvolunteers. 10. Jews are more likely to volunteer than Protestants, and Protestants
are more likely to volunteer than Roman Catholics. 11. Volunteers tend to be less conforming than nonvolunteers when
volunteering is for research in general, but not when subjects arefemale and the task is relatively “clinical” (e.g., hypnosis, sleep, orcounseling research).
Conclusions Warranting Some Confidence
12. Volunteers tend to be from smaller towns than nonvolunteers,especially when volunteering is for questionnaire studies.
13. Volunteers tend to be more interested in religion than
nonvolunteers, especially when volunteering is for questionnairestudies.
14. Volunteers tend to be more altruistic than nonvolunteers. 15. Volunteers tend to be more self-disclosing than nonvolunteers. 16. Volunteers tend to be more maladjusted than nonvolunteers,
especially when volunteering is for potentially unusual situations(e.g., drugs, hypnosis, high temperature, or vaguely describedexperiments) or for medical research employing clinical ratherthan psychometric definitions of psychopathology.

44 Sampling and Surveying Handbook
17. Volunteers tend to be younger than nonvolunteers, especially whenvolunteering is for laboratory research and especially if they arefemale.
Conclusions Warranting Minimum Confidence
18. Volunteers tend to be higher in need for achievement than non-volunteers, especially among American samples.
19. Volunteers are more likely to be married than nonvolunteers,
especially when volunteering is for studies requiring no personalcontact between investigator and respondent.
20. Firstborns are more likely than laterborns to volunteer, especially
when recruitment is personal and when the research requires groupinteraction and a low level of stress.
21. Volunteers tend to be more anxious than nonvolunteers, especially
when volunteering is for standard, nonstressful tasks andespecially if they are college students.
22. Volunteers tend to be more extroverted than nonvolunteers when
interaction with others is required by the nature of the research.
Borg and Gall (1979) have suggested how surveyors might use thislisting to combat the effects of bias in survey research. For example, theysuggest that:
The degree to which these characteristics of volunteersamples affect research results depends on the specificnature of the investigation. For example, a study of thelevel of intelligence of successful workers in differentoccupations would probably yield spuriously high results ifvolunteer subjects were studied, since volunteers tend to bemore intelligent than nonvolunteers. On the other hand, ina study concerned with the cooperative behavior of adultsin work-group situations, the tendency for volunteers to bemore intelligent may have no effect on the results, but thetendency for volunteers to be more sociable could have asignificant effect. It is apparent that the use of volunteersin research greatly complicates the interpretation ofresearch results and their generalizability to the target

Sampling and Surveying Handbook 45
population, which includes many individuals who wouldnot volunteer. (pp 190-191)
SUMMARY
The questionnaire is the means for collecting your survey data. Itshould be designed with your data collection plan in mind. Each of itsthree parts should take advantage of the strengths of questionnaires whileminimizing their weaknesses. Each of the different kinds of questions isuseful for eliciting different types of data, but each should be constructedcarefully with well- developed construction guidelines in mind. Properlyconstructed questions and well-followed survey procedures will allow youto obtain the data needed to check your hypothesis and, at the same time,minimize the chance that one of the many types of bias will invalidateyour survey results.

46 Sampling and Surveying Handbook
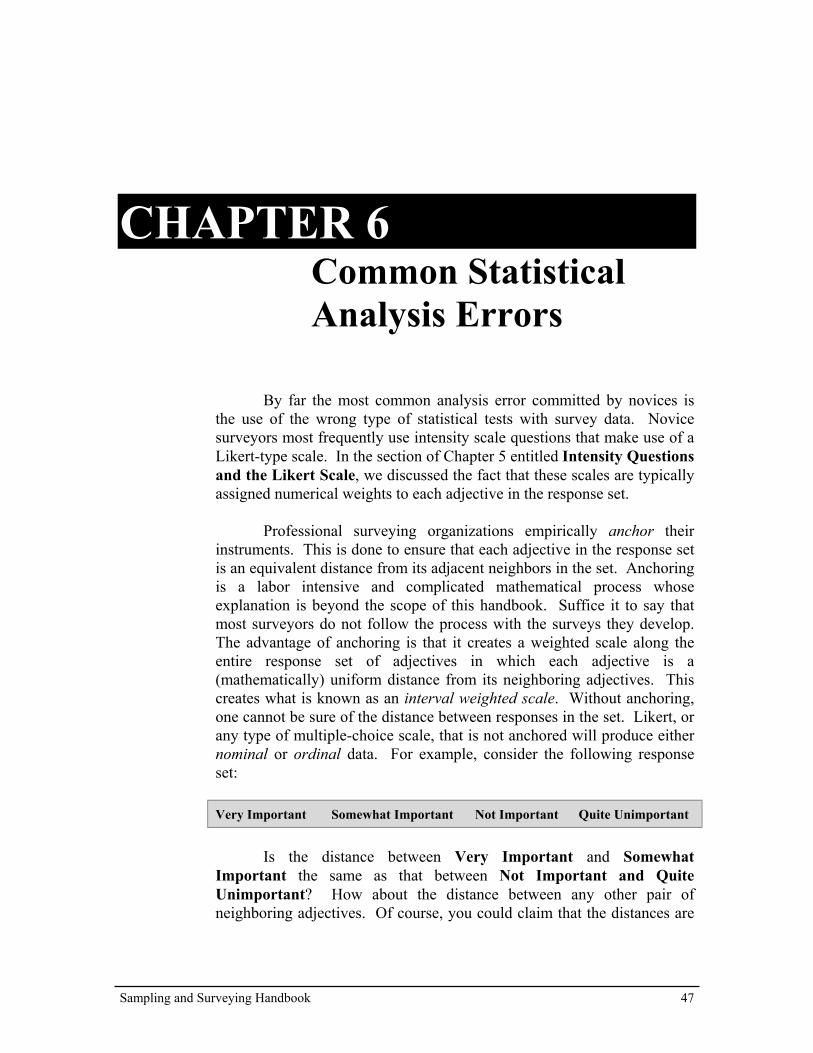
Sampling and Surveying Handbook 47
CHAPTER 6Common StatisticalAnalysis Errors
By far the most common analysis error committed by novices isthe use of the wrong type of statistical tests with survey data. Novicesurveyors most frequently use intensity scale questions that make use of aLikert-type scale. In the section of Chapter 5 entitled Intensity Questionsand the Likert Scale, we discussed the fact that these scales are typicallyassigned numerical weights to each adjective in the response set.
Professional surveying organizations empirically anchor theirinstruments. This is done to ensure that each adjective in the response setis an equivalent distance from its adjacent neighbors in the set. Anchoringis a labor intensive and complicated mathematical process whoseexplanation is beyond the scope of this handbook. Suffice it to say thatmost surveyors do not follow the process with the surveys they develop.The advantage of anchoring is that it creates a weighted scale along theentire response set of adjectives in which each adjective is a(mathematically) uniform distance from its neighboring adjectives. Thiscreates what is known as an interval weighted scale. Without anchoring,one cannot be sure of the distance between responses in the set. Likert, orany type of multiple-choice scale, that is not anchored will produce eithernominal or ordinal data. For example, consider the following responseset:
Very Important Somewhat Important Not Important Quite Unimportant
Is the distance between Very Important and SomewhatImportant the same as that between Not Important and QuiteUnimportant? How about the distance between any other pair ofneighboring adjectives. Of course, you could claim that the distances are
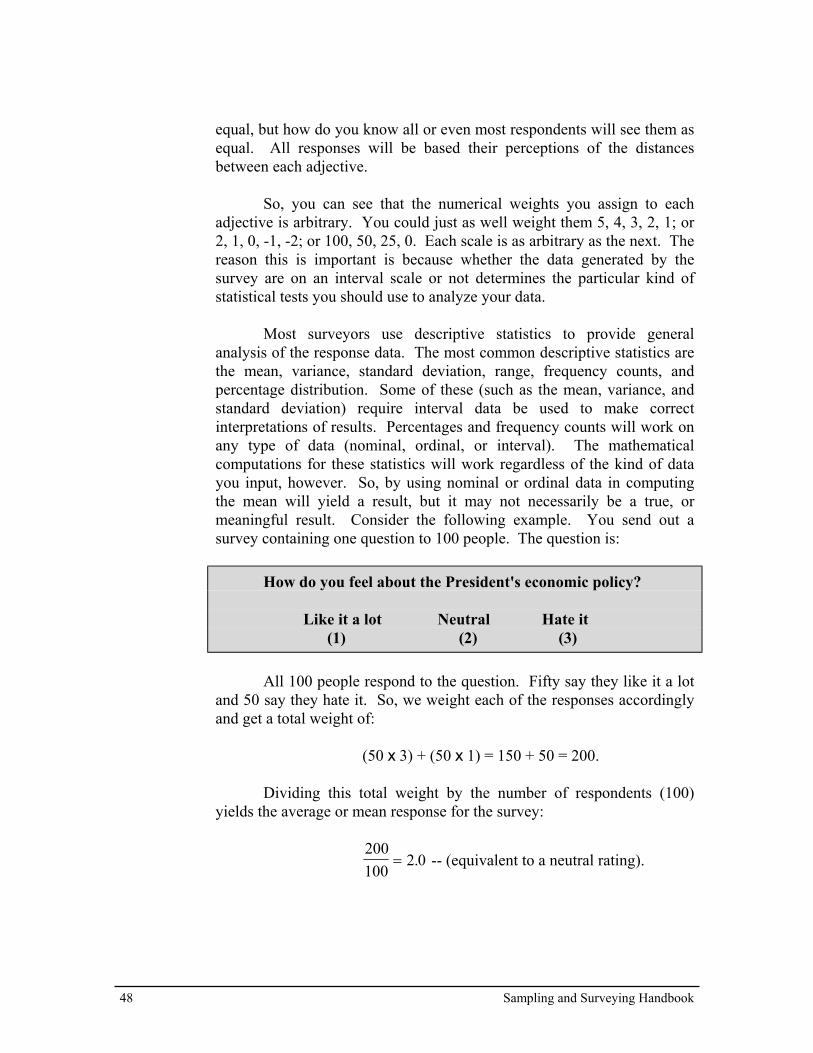
48 Sampling and Surveying Handbook
equal, but how do you know all or even most respondents will see them asequal. All responses will be based their perceptions of the distancesbetween each adjective.
So, you can see that the numerical weights you assign to eachadjective is arbitrary. You could just as well weight them 5, 4, 3, 2, 1; or2, 1, 0, -1, -2; or 100, 50, 25, 0. Each scale is as arbitrary as the next. Thereason this is important is because whether the data generated by thesurvey are on an interval scale or not determines the particular kind ofstatistical tests you should use to analyze your data.
Most surveyors use descriptive statistics to provide generalanalysis of the response data. The most common descriptive statistics arethe mean, variance, standard deviation, range, frequency counts, andpercentage distribution. Some of these (such as the mean, variance, andstandard deviation) require interval data be used to make correctinterpretations of results. Percentages and frequency counts will work onany type of data (nominal, ordinal, or interval). The mathematicalcomputations for these statistics will work regardless of the kind of datayou input, however. So, by using nominal or ordinal data in computingthe mean will yield a result, but it may not necessarily be a true, ormeaningful result. Consider the following example. You send out asurvey containing one question to 100 people. The question is:
How do you feel about the President's economic policy?
Like it a lot Neutral Hate it (1) (2) (3)
All 100 people respond to the question. Fifty say they like it a lotand 50 say they hate it. So, we weight each of the responses accordinglyand get a total weight of:
(50 x 3) + (50 x 1) = 150 + 50 = 200.
Dividing this total weight by the number of respondents (100)yields the average or mean response for the survey:
200100
2 0= . -- (equivalent to a neutral rating).

Sampling and Surveying Handbook 49
We interpret this to say that on average, people we surveyed areneutral toward the President's economic policy. Obviously, this is anerroneous interpretation of the actual results. Not one of the respondentswas neutral to the question, yet the average response is neutral.
The underlying problem is that the original data were not based onan interval scale. That is, our one-question survey did not have ananchored scale. Anchored scales display the desirable quality of havingequal intervals between each point along the scale. Without anchoring,you cannot be sure that scale points are equidistant from each other. Inour current example, interval data were not generated because the scalewas not anchored. Consequently, we should not have computed the meanin the first place, because we could not reliably interpret it. Of course, ifthe survey contained more questions and/or a diverse set of responsescales, the problem would only have been magnified.
The proper descriptive analysis for nominal or ordinal data isto report frequencies (or percentages) of responses per category. Inour example, it would have been most correct to simply report that 50percent of those responding indicated they like the President's economicpolicy and 50 percent indicated they hate it. Such a report is very easy tointerpret, and provides accurate, useful data for decision-makers.
Some surveyors are also interested in determining if responsesfrom different groups of respondents are statistically different or not.Similarly, some are interested to know if respondents' answers to certainquestions of the survey are related somehow either to their answers toother questions on the same survey or to some demographic characteristic(their gender, rank, age, race, etc.). To answer these types of questions,surveyors must use a class of statistics known as inferential statistics. Aswith the descriptive statistics discussed above, there are differentinferential statistics for use with interval data and with nominal or ordinaldata. The former are called parametric statistics, while the latter arecalled non-parametric statistics.
It is enough here to mention the names of the most basic statisticaltests used to answer questions about differences between respondentgroups and relationships between responses. On the parametric side, the t-test is a common test to determine if a statistically significant differenceexists between two (and only two) groups of respondents. To test forsignificant differences between three or more groups, the most commonparametric test used is Analysis of Variance (ANOVA). On the non-parametric side, one should use a Chi-Square test if the data are in the

50 Sampling and Surveying Handbook
form of frequencies or counts within categories, or a Mann-Whitney (U)test if the data are in the form of ranks. The Chi-Square (X2) test worksregardless of how many groups (categories) there are.
To determine relationships between responses, a useful parametrictest is the Pearson Product Moment Correlation Coefficient (also knownas the Pearson correlation coefficient or, simply, the Pearson r), while onthe non-parametric side, there is the Contingency Coefficient (C). A bookwritten by Bruning and Kintz (1973), entitled Computational Handbook ofStatistics, provides step-by-step procedures for manually calculating theseand many other useful statistics with the use of just a hand calculator.Their handbook is highly recommended as a basic resource text. Youshould be able to obtain a copy through your local library, or purchase onethrough a local bookstore.

Sampling and Surveying Handbook 51
APPENDIX ASteps in Surveying
1. Define the purpose. Be specific!
2. Review existing data. Is a survey needed?
3. Read applicable regulations.
4. Define the hypothesis.
5. Define the population.
6. Develop the survey (& sampling) plan.
7. Develop cover letter, instructions, & Privacy Act Statement.
8. Develop survey questions.
9. Pretest instrument.
10. Edit and revise questionnaire.
11. Obtain approvals as required.
12. Survey (gather data).
13. Quality control/data reduction.
14. Analysis and interpretation of results.
15. Prepare report for customer(s).

52 Sampling and Surveying Handbook

Sampling and Surveying Handbook 53
APPENDIX BSurvey DevelopmentTimetables
Timetable for Major Surveys
CalendarDay
1. Deliver to printer 1
2. Printing completed 14
3. Receipt of questionnaire by local surveying activities 24
4. Receipt of survey questionnaires by respondents 30
5. Six-week administration period ends 75
6. Answer sheets or completed questionnaires returned by respondents
80
7. Receive completed answer sheets by data reduction activity
90
8. Initial results available 100
Source: Guide for the Development of the Attitude and Opinion Survey, October 1974; pp. 16-17

54 Sampling and Surveying Handbook
Timetable for Surveys With ExpeditedPrinting and Direct Mailing to Respondents
CalendarDay
1. Printing completed 1
2. Receipt of survey questionnaires by respondents 17
3. First of questionnaires returned to surveyor 27
4. Follow-up letters sent 37
5. Final set of questionnaires returned to surveyor 50
Source: Guide for the Development of the Attitude and Opinion Survey, October 1974; pp. 16-17

Sampling and Surveying Handbook 55
APPENDIX CSurvey Data Sources
• Air University HQ AU/CFA 55 LeMay Plaza South Maxwell AFB AL 36112-6335 Attn: Survey Control Officer
Approval source for all Air University surveys.
• National Technical Information Service (NTIS) US Department of Commerce 5285 Port Royal Road Springfield VA 22161
Good source of published reports of Government agencies.

56 Sampling and Surveying Handbook

Sampling and Surveying Handbook 57
APPENDIX DHow to Use a RandomNumber Table
1. Number each member of the population.
2. Determine population size (N).
3. Determine sample size (M).
4. Determine starting point in table by randomly picking a page and droppingyour finger on the page with your eyes closed.
5. Choose a direction in which to read (up to down, left to right, or right to left).
6. Select the first M numbers read from the table whose last X digits are between
0 and N. (If N is a two digit number, then X would be 2; if it is a four digit number, X would be 4; etc.).
7. Once a number is chosen, do not use it again.
8. If you reach the end of the table before obtaining your M numbers, pick another starting point, read in a different direction, use the first X digits, and continue until done.
Example: N = 300; M = 50; starting point is column 3, row 2 on Random Number Table (next page); read down. You would select population numbers 43, 13, 122, 169, etc., until you had 50 unique numbers.
59468996991404315013 126003312294169etc......

58 Sampling and Surveying Handbook
TABLE of RANDOM NUMBERS
1 2 3 4 5 6 7 8 9 101 96268 11860 83699 38631 90045 69696 48572 05917 51905 100522 03550 59144 59468 37984 77892 89766 86489 46619 50236 911363 22188 81205 99699 84260 19693 36701 43233 62719 53117 711534 63759 61429 14043 44095 84746 22018 19014 76781 61086 902165 55006 17765 15013 77707 54317 48862 53823 52905 70754 68212
6 81972 45644 12600 01951 72166 52682 37598 11955 73018 235287 06344 50136 33122 31794 86723 58037 36065 32190 31367 960078 92363 99784 94169 03652 80824 33407 40837 97749 18361 726669 96083 16943 89916 55159 62184 86206 09764 20244 88388 9867510 92993 10747 08985 44999 35785 65036 05933 77378 92339 96151
11 95083 70292 50394 61947 65591 09774 16216 63561 59751 7877112 77308 60721 96057 86031 83148 34970 30892 53489 44999 1802113 11913 49624 28519 27311 61586 28576 43092 69971 44220 8041014 70648 47484 05095 92335 55299 27161 64486 71307 85883 6961015 92771 99203 37786 81142 44271 36433 31726 74879 89384 76886
16 78816 20975 13043 55921 82774 62745 48338 88348 61211 8807417 79934 35392 56097 87613 94627 63622 08110 16611 88599 0289018 64698 83376 87527 36897 17215 74339 69856 43622 22567 1151819 44212 12995 03581 37618 94851 63020 65348 55857 91742 7950820 89292 00204 00579 70630 37136 50922 83387 15014 51838 81760
21 08692 87237 87879 01629 72184 33853 95144 67943 19345 0346922 67927 76855 50702 78555 97442 78809 40575 79714 06201 3457623 62167 94213 52971 85794 68067 78814 40103 70759 92129 4671624 45828 45441 74220 84157 23241 49332 23646 09390 13031 5156925 01164 35307 26526 80335 58090 85871 07205 31749 40571 51755
26 29283 31581 04359 45538 41435 61103 32428 94042 39971 6367827 19868 49978 81699 84904 50163 22652 07845 71308 00859 8798428 14292 93587 55960 23159 07370 65065 06580 46285 07884 8392829 77410 52135 29495 23032 83242 89938 40516 27252 55565 6471430 36580 06921 35675 81645 60479 71035 99380 59759 42161 93440
31 07780 18093 31258 78156 07871 20369 53977 08534 39433 5721632 07548 08454 36674 46255 80541 42903 37366 21164 97516 6618133 22023 60448 69344 44260 90570 01632 21002 24413 04671 0566534 20827 37210 57797 34660 32510 71558 78228 42304 77197 7916835 47802 79270 48805 59480 88092 11441 96016 76091 51823 94442
36 76730 86591 18978 25479 77684 88439 34112 26052 57112 9165337 26439 02903 20935 76297 15290 84688 74002 09467 41111 1919438 32927 83426 07848 59372 44422 53372 27823 25417 27150 2175039 51484 05286 77103 47284 00578 88774 15293 50740 07932 8763340 45142 96804 92834 26886 70002 96643 36008 02239 93563 66429

Sampling and Surveying Handbook 59
APPENDIX ETable of Z Values
Confidence Level Z Factor99.9 3.290599.7 3.000099.5 2.807099.0 2.575898.0 2.326395.5 2.000095.0 1.960090.0 1.644985.0 1.439580.0 1.2816

60 Sampling and Surveying Handbook

Sampling and Surveying Handbook 61
APPENDIX FSample Cover Letter,Privacy Act Statement,And Instruction Sheet
SAMPLE COVER LETTER
(Letterhead)
FROM: EXO (Major Ross, 3-2044) {Date}
SUBJ: Survey On-Base Facilities
TO:
1. Periodically, this command surveys its personnel to determine theeffectiveness of base facilities and the desires of members concerning therequirements for any additional facilities. The attached questionnaire wasdeveloped to obtain this information. Results from this survey will beused to improve current facilities and to help plan for new ones.
2. This is your chance to express your opinions on current base facilitiesand to identify the need for additional ones. Please answer the questionsas candidly as possible to provide us a valid assessment regarding facilityimprovements and additions. Participation in this survey is voluntary, andno attempt will be made to attribute the answers with specific respondents.I solicit your prompt cooperation in this project and thank you for yourtime.
JOHN J. JONES, Col, USAFBase Commander
Attachment:Questionnaire

62 Sampling and Surveying Handbook
SAMPLE PRIVACY ACT STATEMENT
PRIVACY ACT STATEMENT FOR USAF-SCN XX-XXX
In accordance with AFR 12-35, paragraph 30, the followinginformation is provided as required by the Privacy Act of 1974:
a. Authority:
(1) 5 USC 301, Departmental Regulations; and/or
(2) 10 USC 8012, Secretary of the Air Force, Powers, Duties,Delegation by Compensation.
b. Principal Purpose: To sample Air Force officer opinion and attitudesconcerning base facilities.
c. Routine Uses: To provide data as part of a base facilities study.
d. Participation in this survey is voluntary and respondents will not beidentified.
e. No adverse action of any kind may be taken against any individual whoelects not to participate in any or all parts of this survey.

Sampling and Surveying Handbook 63
SAMPLE SURVEY INSTRUCTIONS(Designed for ADP Scanner Sheets)
SURVEY INSTRUCTIONS
1. Do not write your name or social security account number (SSAN) onthe answer sheet.
2. There are no right or wrong answers to the questions on this survey.
Select the or most appropriate response for each question. 3. Use a No. 2 pencil when marking your answers on the answer sheet.
DO NOT use pen or marker. 4. Be sure your answer marks blacken the entire rectangle on the answer
sheet. 5. Be sure to mark your answers carefully so that you enter them
opposite the same answer sheet number as survey question number. 6. Upon completion, please place your answer sheet in the attached
envelope and place the envelope in base distribution. 7. To help us ensure we meet our suspenses, please try to return your
completed answer sheet by (return date). 8. Thank you for your time and cooperation.

64 Sampling and Surveying Handbook

Sampling and Surveying Handbook 65
APPENDIX GRating or IntensityScales
Excerpted from ARI Technical Report #P-77-1, U.S. Army ResearchInstitute for the Behavioral Social Sciences, Fort Hood Field Unit, July1976, pp VIII-E-1 through VIII-E-24. (DTIC No. ADA037815)
Selection of Response Alternatives Using Scale Values and StandardDeviations
Using scale values and standard deviations to select responsealternatives will give a more refined set of phrases than using an order ofmerit list. In general, response alternatives selected from lists of phraseswith scale values should usually have the following characteristics:
• The scale values of the terms should be as far apart as possible.• The scale values of the terms should be as equally distant as possible.• The terms should have small variability (small standard deviations or
interquartile ranges).• Other things being equal, the terms should have parallel wording.
Tables VIII-E-1 through VIII-E-24 give lists of phrases which have scalevalues and, when possible, standard deviations or interquartile range.They are based on empirical evidence, and may be used to select responsealternatives. Bibliographic source information supporting the citations inthe heading of each table can be found in DTIC document ADA037815.
Table VIII-E-1 -- Acceptability Phrases (from: U.S. Army, 1973)

66 Sampling and Surveying Handbook
Phrase Average Std. Dev.Excellent 6.27 0.54Perfect in every respect 6.22 0.86Extremely good 5.74 0.81Very good 5.19 0.75Unusually good 5.03 0.98Very good in most respects 4.62 0.72Good 4.25 0.90Moderately good 3.58 0.77Could use some minor changes 3.28 1.09Not good enough for extreme conditions 3.10 1.30Not good for rough use 2.72 1.15Not very good 2.10 0.95Needs major changes 1.97 1.12Barely acceptable 1.79 0.90Not good enough for general use 1.76 1.21Better than nothing 1.22 1.08Poor 1.06 1.11Very poor 0.76 0.95Extremely poor 0.36 0.76
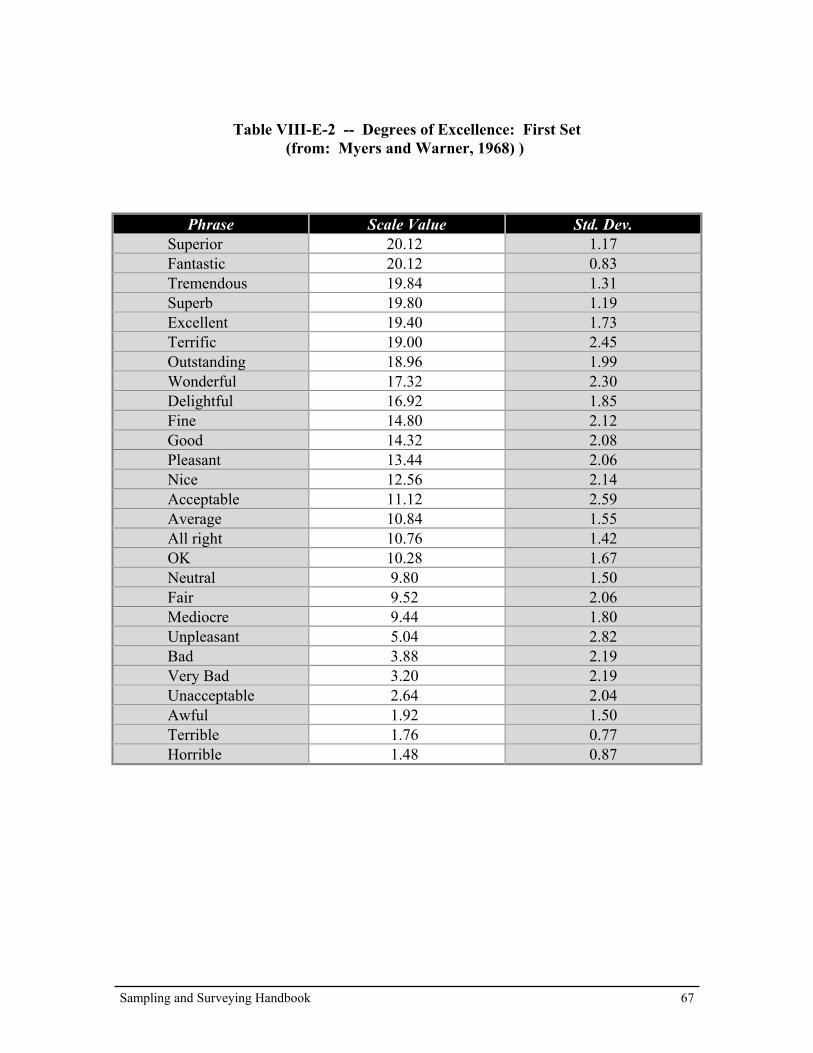
Sampling and Surveying Handbook 67
Table VIII-E-2 -- Degrees of Excellence: First Set(from: Myers and Warner, 1968) )
Phrase Scale Value Std. Dev.Superior 20.12 1.17Fantastic 20.12 0.83Tremendous 19.84 1.31Superb 19.80 1.19Excellent 19.40 1.73Terrific 19.00 2.45Outstanding 18.96 1.99Wonderful 17.32 2.30Delightful 16.92 1.85Fine 14.80 2.12Good 14.32 2.08Pleasant 13.44 2.06Nice 12.56 2.14Acceptable 11.12 2.59Average 10.84 1.55All right 10.76 1.42OK 10.28 1.67Neutral 9.80 1.50Fair 9.52 2.06Mediocre 9.44 1.80Unpleasant 5.04 2.82Bad 3.88 2.19Very Bad 3.20 2.19Unacceptable 2.64 2.04Awful 1.92 1.50Terrible 1.76 0.77Horrible 1.48 0.87

68 Sampling and Surveying Handbook
Table VIII-E-3 -- Degrees of Excellence: Second Set(from: Jones and Thurstone, 1955)
Phrase Scale Value Std. Dev.Best of all 6.15 2.43Excellent 3.71 1.01Wonderful 3.51 0.97Mighty fine 2.88 0.67Especially good 2.86 0.82Very good 2.55 0.87Good 1.91 0.76Pleasing 1.58 0.65OK 0.87 1.24Fair 0.78 0.85Only fair 0.71 0.64Not pleasing -0.83 0.67Poor -1.55 0.87Bad -2.02 0.80Very Bad -2.53 0.64Terrible -3.09 0.98

Sampling and Surveying Handbook 69
Table VIII-E-4 -- Degrees of Like and Dislike(from: Jones and Thurstone, 1955)
Phrase Scale Value Std. Dev.Like extremely 4.16 1.62Like intensely 4.05 1.59Strongly like 2.96 0.69Like very much 2.91 0.60Like very well 2.60 0.78Like quite a bit 2.32 0.52Like fairly well 1.51 0.59Like 1.35 0.77Like moderately 1.12 0.61Mildly like 0.85 0.47Like slightly 0.69 0.32Neutral 0.02 0.18Like not so well -0.30 1.07Like not so much -0.41 0.94Dislike slightly -0.59 0.27Mildly dislike -0.74 0.35Dislike moderately -1.20 0.41Dislike -1.58 0.94Don’t like -1.81 0.97Strongly dislike -2.37 0.53Dislike very much -2.49 0.64Dislike intensely -3.33 1.39Dislike extremely -4.32 1.86

70 Sampling and Surveying Handbook
Table VIII-E-5 -- Degrees of Good and Poor(from: Myers and Warner, 1968)
Phrase Scale Value Std. Dev.Exceptionally good 18.55 2.36Extremely good 18.44 1.61Unusually good 17.08 2.43Remarkably good 16.68 2.19Very good 15.44 2.75Quite good 14.44 2.76Good 14.32 2.08Moderately good 13.44 2.23Reasonably good 12.92 2.93Fairly good 11.96 2.42Slightly good 11.84 2.19So-so 10.08 1.87Not very much 6.72 2.82Moderately poor 6.44 1.64Reasonably poor 6.32 2.46Slightly poor 5.92 1.36Poor 5.72 2.09Fairly poor 5.64 1.68Quite poor 4.80 1.44Unusually poor 3.20 1.44Very poor 3.12 1.17Remarkably poor 2.88 1.74Exceptionally poor 2.52 1.19Extremely poor 2.08 1.19

Sampling and Surveying Handbook 71
Table VIII-E-6 -- Degrees of Good and Bad (from: Cliff, 1959)
Phrase Scale ValueExtremely good 3.449Very good 3.250Unusually good 3.243Decidedly good 3.024Quite good 2.880Rather good 2.755Good 2.712Pretty good 2.622Somewhat good 2.462Slightly good 2.417Slightly bad 1.497Somewhat bad 1.323Rather bad 1.232Bad 1.024Pretty bad 1.018Quite bad 0.924Decidedly bad 0.797Unusually bad 0.662Very bad 0.639Extremely bad 0.470

72 Sampling and Surveying Handbook
Table VIII-E-7 -- Degrees of Agree and Disagree(from: Altemeyer, 1970)
Phrase Mean Std. Dev.Decidedly agree 2.77 .41Quite agree 2.37 .49Considerably agree 2.21 .42Substantially agree 2.10 .50Moderately agree 1.47 .41Somewhat agree .94 .41Slightly agree .67 .36Perhaps agree .52 .46Perhaps disagree -.43 .45Slightly disagree -.64 .38Somewhat disagree -.98 .47Moderately disagree -1.35 .42Quite disagree -2.16 .57Substantially disagree -2.17 .51Considerably disagree -2.17 .45Decidedly disagree -2.76 .43

Sampling and Surveying Handbook 73
Table VIII-E-8 -- Degrees of More and Less(from: Dodd and Gerberick, 1960)
Phrase Scale Value Interquartile Range a
Very much more 8.02 0.61Much more 7.67 1.04A lot more 7.50 1.06A good deal more 7.29 0.98More 6.33 1.01Somewhat more 6.25 0.98A little more 6.00 0.58Slightly more 5.99 0.57Slightly less 3.97 0.56A little less 3.96 0.54Less 3.64 1.04Much less 2.55 1.06A good deal less 2.44 1.11A lot less 2.36 1.03Very much less 1.96 0.52
a Minimum = 0.05
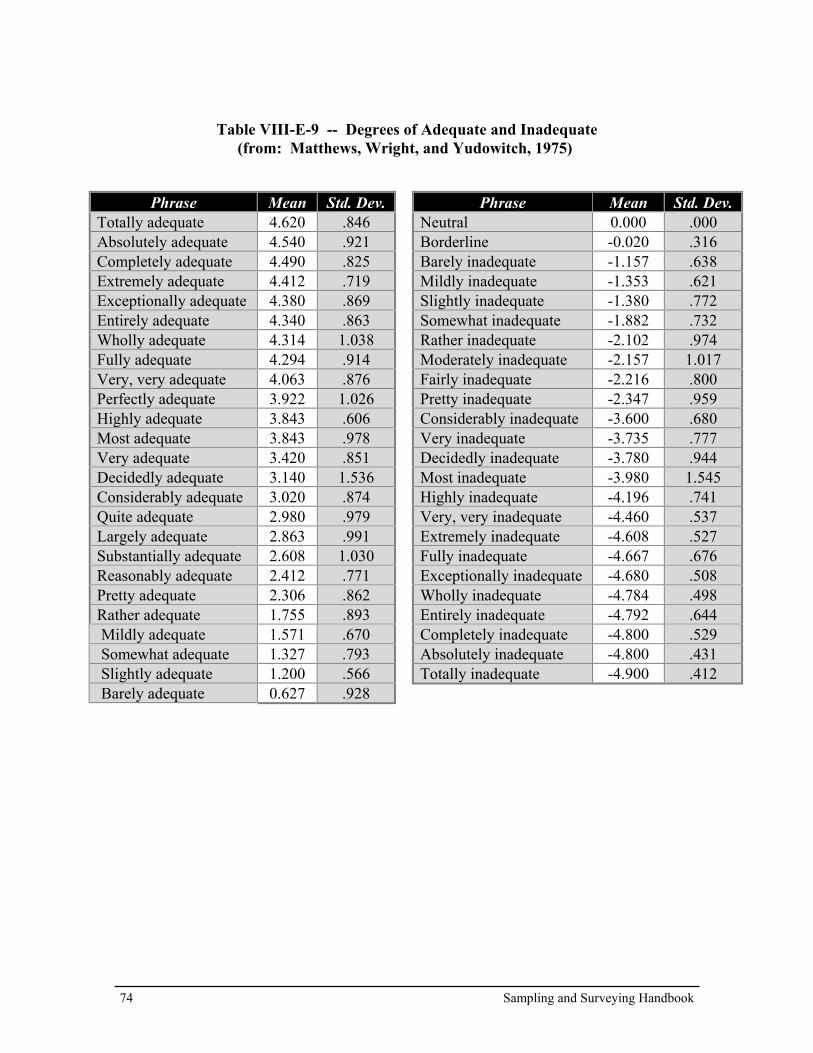
74 Sampling and Surveying Handbook
Table VIII-E-9 -- Degrees of Adequate and Inadequate(from: Matthews, Wright, and Yudowitch, 1975)
Phrase Mean Std. Dev.Totally adequate 4.620 .846Absolutely adequate 4.540 .921Completely adequate 4.490 .825Extremely adequate 4.412 .719Exceptionally adequate 4.380 .869Entirely adequate 4.340 .863Wholly adequate 4.314 1.038Fully adequate 4.294 .914Very, very adequate 4.063 .876Perfectly adequate 3.922 1.026Highly adequate 3.843 .606Most adequate 3.843 .978Very adequate 3.420 .851Decidedly adequate 3.140 1.536Considerably adequate 3.020 .874Quite adequate 2.980 .979Largely adequate 2.863 .991Substantially adequate 2.608 1.030Reasonably adequate 2.412 .771Pretty adequate 2.306 .862Rather adequate 1.755 .893Mildly adequate 1.571 .670Somewhat adequate 1.327 .793Slightly adequate 1.200 .566Barely adequate 0.627 .928
Phrase Mean Std. Dev.Neutral 0.000 .000Borderline -0.020 .316Barely inadequate -1.157 .638Mildly inadequate -1.353 .621Slightly inadequate -1.380 .772Somewhat inadequate -1.882 .732Rather inadequate -2.102 .974Moderately inadequate -2.157 1.017Fairly inadequate -2.216 .800Pretty inadequate -2.347 .959Considerably inadequate -3.600 .680Very inadequate -3.735 .777Decidedly inadequate -3.780 .944Most inadequate -3.980 1.545Highly inadequate -4.196 .741Very, very inadequate -4.460 .537Extremely inadequate -4.608 .527Fully inadequate -4.667 .676Exceptionally inadequate -4.680 .508Wholly inadequate -4.784 .498Entirely inadequate -4.792 .644Completely inadequate -4.800 .529Absolutely inadequate -4.800 .431Totally inadequate -4.900 .412

Sampling and Surveying Handbook 75
Table E VIII-E-10 -- Degrees of Acceptable and Unacceptable(from: Matthews, Wright, and Yudowitch (1975)
Phrase Mean Std. Dev.Wholly acceptable 4.725 .563Completely acceptable 4.686 .610Fully acceptable 4.412 .867Extremely acceptable 4.392 .716Most acceptable 4.157 .915Very, very acceptable 4.157 .825Highly acceptable 4.040 .631Quite acceptable 3.216 .956Largely acceptable 3.137 .991Acceptable 2.392 1.456Reasonably acceptable 2.294 .722Moderately acceptable 2.280 .722Pretty acceptable 2.000 1.125Rather acceptable 1.939 .818Fairly acceptable 1.840 .924Mildly acceptable 1.686 .700Somewhat acceptable 1.458 1.241Barely acceptable 1.078 .518Slightly acceptable 1.039 .522Sort of acceptable 0.940 .645Borderline 0.000 .200Neutral 0.000 0.000Marginal -0.120 .515Barely unacceptable -1.100 .300
Phrase Mean Std. Dev.Slightly unacceptable -1.255 .589Somewhat unacceptable -1.765 .674Rather unacceptable -2.020 .836Fairly unacceptable -2.160 .880Moderately unacceptable -2.340 .681Pretty unacceptable -2.412 .662Reasonably unacceptable -2.440 .753Unacceptable -2.667 1.381Substantially unacceptable -3.235 .899Quite unacceptable -3.388 1.066Largely unacceptable -3.392 .818Considerably unacceptable -3.440 .779Notably unacceptable -3.500 1.044Decidedly unacceptable -3.837 1.017Highly unacceptable -4.294 .535Most unacceptable -4.420 .724Very, very unacceptable -4.490 .500Exceptionally unacceptable -4.540 .607Extremely unacceptable -4.686 .464Completely unacceptable -4.900 .361Entirely unacceptable -4.900 .361Wholly unacceptable -4.922 .269Absolutely unacceptable -4.922 .334Totally unacceptable -4.941 .235

76 Sampling and Surveying Handbook
Table VIII-E-11 -- Comparison Phrases(from Matthews, Wright, and Yudowitch, 1975)
Phrase Mean Std. Dev.Best of all 4.896 .510Absolutely best 4.843 .459Truly best 4.600 .721Undoubtedly best t4.569 .823Decidedly best 4.373 .839Best 4.216 1.459Absolutely better 4.060 .988Extremely better 3.922 .882Substantially better 3.700 .922Decidedly better 3.412 .933Conspicuouslybetter
3.059 .802
Moderately better 2.255 .737Somewhat better 1.834 .801Rather better 1.816 .719Slightly better 1.157 .776Barely better 0.961 .656Absolutely alike 0.538 1.623Alike 0.216 .847The same 0.157 .801Neutral 0.000 0.000
Phrase Mean Std. Dev.Borderline -0.061 .314Marginal -0.184 .919Barely worse -1.039 .816Slightly worse -1.216 .498Somewhat worse -2.078 .860Moderately worse -2.220 .944Noticeably worse -2.529 1.030Worse -2.667 1.423Notably worse -3.020 1.038Largely worse -3.216 1.108Considerably worse -3.275 1.206Conspicuously worse -3.275 .887Much worse -3.286 .808Substantially worse -3.460 .899Decidedly worse -3.760 .907Very much worse -3.941 .752Absolutely worse -4.431 .823Decidedly worst -4.431 .748Undoubtedly worst -4.510 .872Absolutely worst -4.686 1.291Worst of all -4.776 1.298

Sampling and Surveying Handbook 77
Table VII-E-12 -- Degrees of Satisfactory and Unsatisfactory(from: U.S. Army, 1973)
Phrase Scale Value Std. Dev.Quite satisfactory 4.35 .95Satisfactory 3.69 .87Not very satisfactory 2.11 .76Unsatisfactory but usable 2.00 .87Very unsatisfactory 0.69 1.32
Table VIII-E-13 -- Degrees of Unsatisfactory (from: Mosier, 1941)
Phrase Scale ValueUnsatisfactory 1.47Quite unsatisfactory 1.00Very unsatisfactory 0.75Unusually unsatisfactory 0.75Highly unsatisfactory 0.71Very, very unsatisfactory 0.25Extremely unsatisfactory 0.10Completely unsatisfactory 0.00
Table VIII-E-14 -- Degrees of Pleasant (from: Cliff, 1959)
Phrase Scale ValueExtremely pleasant 3.490Very pleasant 3.174Unusually pleasant 3.107Decidedly pleasant 3.028Quite Pleasant 2.849Pleasant 2.770Rather pleasant 2.743Pretty pleasant 2.738Somewhat pleasant 2.505Slightly pleasant 2.440

78 Sampling and Surveying Handbook
Table VIII-E-15 -- Degrees of Agreeable (from: Mosier, 1941)
Phrase Scale ValueVery, very agreeable 5.34Extremely agreeable 5.10Highly agreeable 5.02Completely agreeable 4.96Unusually agreeable 4.86Very agreeable 4.82Quite agreeable 4.45Agreeable 4.19
Table VIII-E-16 -- Degrees of Desirable (from: Mosier, 1941)
Phrase Scale ValueVery, very desirable 5.66Extremely desirable 5.42Completely desirable 5.38Unusually desirable 5.23Highly desirable 5.25Very desirable 4.96Quite desirable 4.76Desirable 4.50

Sampling and Surveying Handbook 79
Table VIII-E-17 -- Degrees of Nice
Phrase Scale ValueExtremely nice 3.351Unusually nice 3.155Very nice 3.016Decidedly nice 2.969Pretty nice 2.767Quite nice 2.738Nice 2.636Rather nice 2.568Somewhat nice 2.488Slightly nice 2.286
Table VIII-E-18 -- Degrees of Adequate (from: U.S. Army, 1973)
Phrase Scale Value Std. Dev.More than adequate 4.13 1.11Adequate 3.39 .87Not quite adequate 2.40 .85Barely adequate 2.10 .84Not adequate 1.83 .98
Table VIII-E-19 -- Degrees of Ordinary (from: Cliff, 1959)
Phrase Scale ValueOrdinary 2.074Very ordinary 2.073Somewhat ordinary 2.038Rather ordinary 2.934Pretty ordinary 2.026Slightly ordinary 1.980Decidedly ordinary 1.949Extremely ordinary 1.936Unusually ordinary 1.875

80 Sampling and Surveying Handbook

Sampling and Surveying Handbook 81
Table VIII-E-20 -- Degrees of Average (from: Cliff, 1959)
Phrase Scale ValueRather average 2.172Average 2.145Quite average 2.101Pretty average 2.094Somewhat average 2.080Unusually average 2.062Extremely average 2.052Very average 2.039Slightly average 2.023Decidedly average 2.020
Table VIII-E-21 -- Degrees of Hesitation (from: Dodd and Gerberick, 1960)
Phrase Scale Value Interquartile Range a
Without hesitation 7.50 6.54With little hesitation 5.83 3.40Hesitant 4.77 1.06With some hesitation 4.38 1.60With considerablehesitation
3.29 3.39
With much hesitation 3.20 5.25With great hesitation 2.41 6.00
a Minimum = 0.5

82 Sampling and Surveying Handbook
Table VIII-E-22 -- Degrees of Inferior (from: Cliff, 1959)
Phrase Scale ValueSlightly inferior 1.520Somewhat inferior 1.516Inferior 1.323Rather inferior 1.295Pretty inferior 1.180Quite inferior 1.127Decidedly inferior 1.013Unusually inferior 0.963Very inferior 0.927Extremely inferior 0.705
Table VIII-E-23 -- Degrees of Poor (from: Mosier, 1941)
Phrase Scale ValuePoor 1.60Quite poor 1.30Very poor 1.18Unusually poor 0.95Extremely poor 0.95Completely poor 0.92Very, very poor 0.55
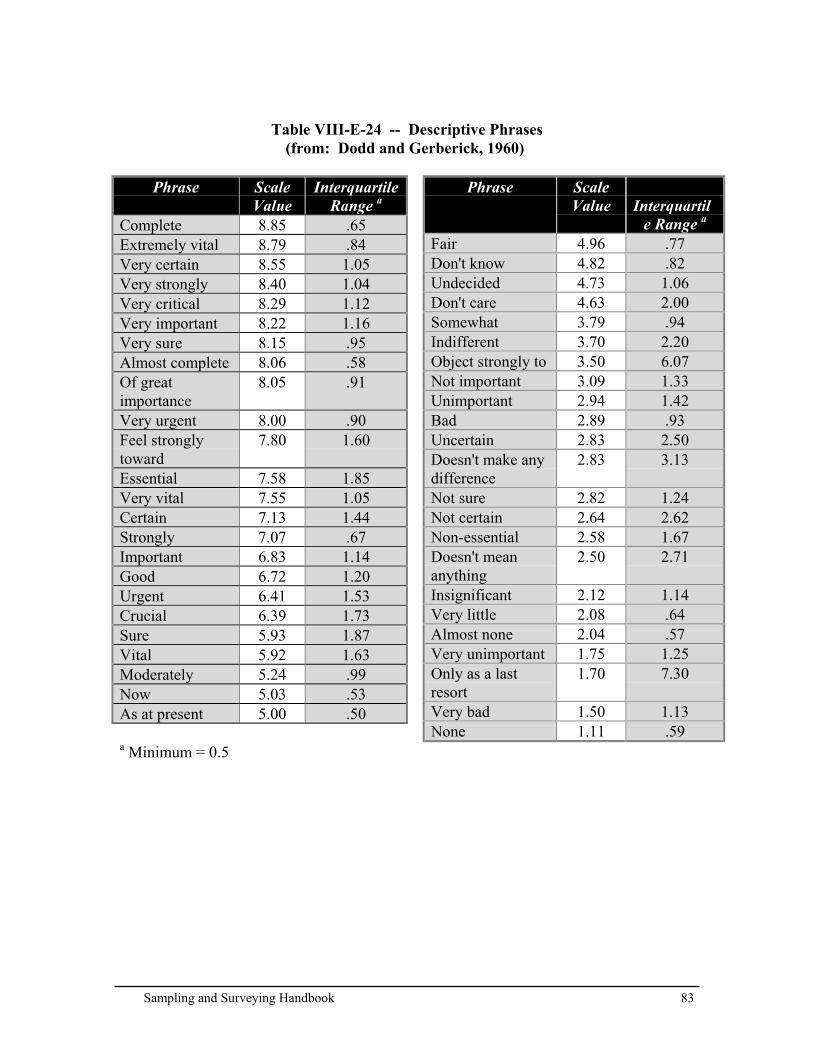
Sampling and Surveying Handbook 83
Table VIII-E-24 -- Descriptive Phrases(from: Dodd and Gerberick, 1960)
Phrase ScaleValue
InterquartileRange a
Complete 8.85 .65Extremely vital 8.79 .84Very certain 8.55 1.05Very strongly 8.40 1.04Very critical 8.29 1.12Very important 8.22 1.16Very sure 8.15 .95Almost complete 8.06 .58Of greatimportance
8.05 .91
Very urgent 8.00 .90Feel stronglytoward
7.80 1.60
Essential 7.58 1.85Very vital 7.55 1.05Certain 7.13 1.44Strongly 7.07 .67Important 6.83 1.14Good 6.72 1.20Urgent 6.41 1.53Crucial 6.39 1.73Sure 5.93 1.87Vital 5.92 1.63Moderately 5.24 .99Now 5.03 .53As at present 5.00 .50
Phrase ScaleValue Interquartil
e Range a
Fair 4.96 .77Don't know 4.82 .82Undecided 4.73 1.06Don't care 4.63 2.00Somewhat 3.79 .94Indifferent 3.70 2.20Object strongly to 3.50 6.07Not important 3.09 1.33Unimportant 2.94 1.42Bad 2.89 .93Uncertain 2.83 2.50Doesn't make anydifference
2.83 3.13
Not sure 2.82 1.24Not certain 2.64 2.62Non-essential 2.58 1.67Doesn't meananything
2.50 2.71
Insignificant 2.12 1.14Very little 2.08 .64Almost none 2.04 .57Very unimportant 1.75 1.25Only as a lastresort
1.70 7.30
Very bad 1.50 1.13None 1.11 .59
a Minimum = 0.5

Sampling and Surveying Handbook83
APPENDIX HSample Sets ofResponse Alternatives
Excerpted from Questionnaire Construction Manual, ARI TechnicalReport #P-77-1, U.S. Army Research Institute for the Behavioral andSocial Sciences, Fort Hood Field Unit, July 1976, ppVIII-F-1 throughVIII-F-4. (DTIC No. ADA037815)
It is sometimes valuable and is a time saver to have lists ofresponse alternatives available to use. The tables in this section give someexamples of response alternatives that have been selected on differentbases. These sets do not exhaust all possibilities.
The sets of response alternatives that appear in Table VIII-F-1were selected so that the phrases in each set would have means at least onestandard deviation away from each other and have parallel wording.Some of the sets of response alternatives have extreme end points; somedo not. The sets of response alternatives shown in Table VIII-F-2 wereselected so that the phrases in each set would be as nearly equally distantfrom each other as possible without regard to parallel wording. TableVIII-F-3 contains sets of response alternatives selected from lists ofdescriptors with only scale values given. The phrases were selected on thebases of equal appearing intervals. Table VIII-F-4 has sets of responsealternatives selected from order of merit lists of descriptors.

84 Sampling and Surveying Handbook
Table VIII-F-1Sets Selected So Phrases Are at Least One Standard
Deviation Apart and Have Parallel Wording (18 Sets)
Set # Response Alternatives
1 Completely acceptableReasonably acceptableBarely acceptableBorderlineBarely unacceptableReasonably unacceptableCompletely unacceptable
2 Wholly acceptableLargely acceptableBorderlineLargely unacceptableWholly unacceptable
3 Largely acceptableBarely acceptableBorderlineBarely unacceptableLargely unacceptable
4 Reasonably acceptableSlightly acceptableBorderlineSlightly unacceptableReasonably unacceptable
5 Totally adequateVery adequateBarely adequateBorderlineBarely inadequateVery inadequateTotally inadequate
6 Completely adequateConsiderably adequateBorderlineConsiderably inadequateCompletely inadequate
Set # Response Alternatives
7 Very adequateSlightly adequateBorderlineSlightly inadequateVery inadequate
8 Highly adequateMildly adequateBorderlineMildly inadequateHighly inadequate
9 Decidedly agreeSubstantially agreeSlightly agreeSlightly disagreeSubstantially disagreeDecidedly disagree
10 Moderately agreePerhaps agreeNeutralPerhaps disagreeModerately disagree
11 Undoubtedly bestConspicuously betterModerately betterAlikeModerately worseConspicuously worseUndoubtedly worst
12 Moderately betterBarely betterThe sameBarely worseModerately worse
Table VIII-F-1 (Cont’d)

86 Sampling and Surveying Handbook
Sets Selected So Phrases Are at Least One StandardDeviation Apart and Have Parallel Wording (18 Sets)
Set # Response Alternatives
13 Extremely goodRemarkably goodGoodSo-soPoorRemarkably poorExtremely poor
14 Exceptionally goodReasonably goodSo-soReasonably poorExceptionally poor
15 Very importantImportantNot importantVery unimportant
Set # Response Alternatives
16 Like extremelyLike moderatelyNeutralDislike moderatelyDislike extremely
17 Strongly likeLikeNeutralDon't likeStrongly dislike
18 Very much moreA good deal moreA little moreA little lessA good deal lessVery much less

86 Sampling and Surveying Handbook
Table VIII-F-2
Sets Selected So That Intervals Between PhrasesAre as Nearly Equal as Possible (15 Sets)
Set # Response Alternatives
1 Completely acceptableReasonably acceptableBorderlineModeratelyunacceptableExtremely unacceptable
2 Totally adequatePretty adequateBorderlinePretty inadequateExtremely inadequate
3 Highly adequateRather adequateBorderlineSomewhat inadequateDecidedly inadequate
4 Quite agreeModerately agreePerhaps agreePerhaps disagreeModerately disagreeSubstantially disagree
5 Undoubtedly bestModerately betterBorderlineNoticeably worseUndoubtedly worst
Set # Response Alternatives
6 FantasticDelightfulNiceMediocreUnpleasantHorrible
7 Perfect in every respectVery goodGoodCould use minor changesNot very goodBetter than nothingExtremely poor
8 ExcellentGoodOnly fairPoorTerrible
9 Extremely goodQuite goodSo-soSlightly poorExtremely poor
10 Remarkably goodModerately goodSo-soNot very goodUnusually poor
Set # Response Alternatives
11 Without hesitationWith little hesitationWith some hesitationWith great hesitation
12 Strongly likeLike quite a bitLikeNeutralMildly dislikeDislike very muchDislike extremely
13 Like quite a bitLikeLike slightlyBorderlineDislikeDislike moderatelyDon't like
14 Like quite a bitLike fairly wellBorderlineDislike moderatelyDislike very much
15 Very much moreA little moreSlightly lessVery much less

Sampling and Surveying Handbook87
Table VIII-F-3
Sets Selected From Lists Giving Scale Values OnlySo That Intervals Between Phrases Are as Nearly Equal as Possible (10 Sets)
Set # Response Alternatives
1 Very, very agreeableUsually agreeableQuite agreeableAgreeable
2 Rather averageQuite averageUnusually averageDecidedly average
3 Very, very desirableCompletely desirableVery desirableDesirable
4 Extremely goodSomewhat goodSlightly goodExtremely bad
5 Slightly inferiorRather inferiorUnusually inferiorExtremely inferior
Set # Response Alternatives
6 Extremely niceDecidedly niceNiceSlightly nice
7 OrdinarySlightly ordinaryUnusually ordinary
8 Extremely pleasantDecidedly pleasantSomewhat pleasant
9 PoorVery poorVery, very poor
10 Very, very agreeableExtremely agreeableVery agreeableQuite agreeableAgreeable

88 Sampling and Surveying Handbook
Table VIII-F-4
Sets Selected Using Order-of-Merit Lists of Descriptor Terms (4 Sets)
Set # Response Alternatives
1 Very goodGoodBorderlinePoorVery poor
2 Very satisfactorySatisfactoryBorderlineUnsatisfactoryVery unsatisfactory
3 Very superiorSuperiorBorderlinePoorVery poor
4 Extremely usefulOf considerable useOf useNot very usefulOf no use

Sampling and Surveying Handbook89
BIBLIOGRAPHYAir Force Instruction 36-2601. The Air Force Sample Survey Program.
Washington, D.C.: Department of the Air Force, PublicationPending (1993).
Altemeyer, R. A. (1970). Adverbs and Intervals: A Study of LikertScales. American Psychological Association, Proceedings of theAnnual Convention of 1970, S (pt. 1) pp 397-398.
Borg, Walter R. and Gall, Meredith Damien (1979). EducationalResearch. Third Edition. New York: Longman, Inc.
Bruning, James L. and Kintz, B. L. (1977). Computational Handbook ofStatistics. Second Edition. Glenview, IL: Scott, Foresman andCompany.
Cantelou, Louis W., Jr (1964). Opinion Research as a Managerial Toolfor Internal Public Relations: The USAF Sample Survey andInternal Information Program. Unpublished master’s thesis, Schoolof Public Relations and Communications, Boston, Mass.: BostonUniversity Press.
Cliff, N. (1959). Adverbs As Multipliers. Psychological Review,66, pp 27-44.
Cochran, W. G. (1963) Sampling Techniques. New York: Wileyand Sons, Inc.
Deming, William E. (1950) Some Theory of Sampling. New York: JohnWiley and Sons, Inc.
Department of the Air Force. (October 1974). A Guide for theDevelopment of the Attitude Opinion Survey. Washington, D.C.

90 Sampling and Surveying Handbook
Dodd, S. C., & Gerberick, T. R. (1960). Word Scales for Degrees ofOpinion. Language and Speech, 3, pp 18-31.
Dyer, Robert., Matthews, J. J., Stulac, J. F., Wright, C. E., Yudowitch,Kenneth (1976). Questionnaire Construction Manual. Palo Alto:Operations Research Associates (prepared for the U.S. ArmyResearch Institute for the Behavioral and Social Sciences, FortHood, Texas under Contract DAHC19-74-C-0032)
Huff, D. (1954). How to Lie with Statistics. New York: W. W. Nortonand Company, Inc.
Jones, L. V., & Thurstone, L. L. (1955). The Psychophysics ofSemantics: An Experimental Investigation. Journal of AppliedPsychology, 39, pp 31-36.
Kish, Leslie. (1965) Survey Sampling. New York: John Wiley andSons, Inc.
Matthews, J. J., Wright, C. E., & Yudowitch, K. L. (1975) Analysis ofthe Results of the Administration of Three Sets of DescriptiveAdjective Phrases. Palo Alto: Operations Research Associates(prepared for the U.S. Army Research Institute for the Behavioraland Social Sciences, Fort Hood, Texas under Contract DAHC19-74-C-0032)
Miller, Delbert C. (1970). Handbook of Research Design and SocialMeasurement. New York: David McKay Co., Inc.
Mosier, C. I. (1941). A Psychometric Study of Meaning. Journal ofSocial Psychology, 13, pp 123-140.
Myers, J. H., & Warner, W. G. (1968). Semantic Properties of SelectedEvaluation Adjectives. Journal of Marketing Research, 5, pp 409-412.
Oppenheim, A. N. (1966). Questionnaire Design and AttitudeMeasurement. New York: Basic Books, Inc.
Parten, M. (1950). Surveys, Polls, and Samples: Practical Procedures.New York: Harper and Brothers.

Sampling and Surveying Handbook91
Rosenthal, Robert and Rosnow, Ralph, L. (1975). The VolunteerSubject. New York: John Wiley.
Sawyer, Lawrence. (November-December 1971) Statistics Confuse Me,Grandfather, Internal Auditor, Vol. 28, No. 6, pp 49-52.
Selltiz, Claire, Marie Jahoda, Morton Deutsch, and Stuart W. Cook(1963). Research Methods in Social Relations. New York: Holt,Rinehart and Winston, Inc.
U.S. Army Test and Evaluation Command (1973). Development of aGuide and Checklist for Human Factors Evaluation of ArmyEquipment and Systems, U.S. Army Test and Evaluation Command(TECOM), Contract DAADO5-73-C-0388.
Young, Pauline V. (1959) Scientific Social Surveys and Research. NewYork: Prentice-Hall, Inc.