Air Service Assessment & Benchmarking Study … Summary Presentation.pdfAmerican Airlines results at...
23
September 2015 Air Service Assessment & Benchmarking Study Marquette, MI
Transcript of Air Service Assessment & Benchmarking Study … Summary Presentation.pdfAmerican Airlines results at...

September 2015
Air Service Assessment & Benchmarking Study
Marquette, MI

Historical Airline Industry Overview
• 1978-2009: Massive financial losses during a period of excess capacity
▫ Yields (Price): Fell over 70% after inflation – airlines were pricing seats below
cost, due to noted over capacity (capacity growth outpaced economic (GDP)
growth)
▫ Mostly during a period of tranquil oil prices
▫ Then oil prices spiked in the late 2000’s
• 2010-current: Most profitable period in U.S. airline history
▫ Example: Delta Air Lines expecting 15% operating margin for full year 2014
▫ Sharp capacity reductions, particularly in smaller, shorter-haul markets
▫ Result: Sharply higher yields (fares), driven by fare increases and ancillary
revenues
• Going forward: More of same expected
▫ Constrained capacity, resulting in continued higher fares and unit revenues
▫ Smaller markets will continue to take hits
2

Most of industry capacity (seat) reduction has been on
short-haul, small regional jet routes
3

These capacity (seat) reductions have typically hit smaller
markets hardest
-9%
-26%
-18%
-15%
-5%
-21%
-14%
-30%
-25%
-20%
-15%
-10%
-5%
0%
Seat Decline by Airport-size Since 2008
4
• Large Hub: Largest airports in the
U.S. Have to generate 1% or more of
U.S. enplanements
• Medium hub: Next largest tier of
airports. At least 0.25% of U.S.
enplaned, but less than 1%
• Small hub: At least .05% of U.S.
enplaned, but less than 0.25%
• Non-hub: At least 2,500 enplaned,
but not more than 10,000
• EAS: Essential Air Service airports;
these are subsidized by Federal
Government

Primary manufacturer forecasts a 70% decline in small jets
by 2032
• Bombardier expects <60-seat jets to decline
by 70% by 2032
▫ From 3,500 today to 1,050 by 2032
▫ It is expected that many of these 1,050 will
be in 3rd world countries
▫ Similar to Turboprop aircraft today
• 60-99 seat jets are expected to increase
significantly by 2032
▫ From 2,600 to 6,950 worldwide
▫ Biggest increase in U.S.
▫ Also ties to assumed improvements in Pilot
Scope Clauses
• Overall shift to larger aircraft; this also
assumes continued high oil prices
5

Recent pilot regulations further complicate fleet shifts
6
• Based on pilot retirements at the four largest US carriers (American, Delta,
Southwest and United), 14,000 aviators will be needed at those airlines by 2022
just to continue providing the same level of flying as today.
• If the regional industry is to be the primary supply for pilot labor to the network
carriers, there are only 18,000 pilots within the sector. If replacing retiring
mainline pilots is first and foremost, then the regional industry will be but a
fraction of itself by 2022.
• This doesn’t include the fast-growing LCC segment of the industry
• “All of our members, large and small, are having trouble finding qualified
1,500-hour pilots”, says Roger Cohen, president of the Regional Airline
Association. “Every community, large and small, if you’re not concerned about
losing some or all of your air service, should be”.

Growth options are limited, as 4 airlines control 83% of
U.S. airline capacity
DL 22%
UA 16%
AA 24%
WN 21%
AS 4%
G4 1%
F9 2%
HA 2%
B6 4%
NK 2%
Oher 2%
U.S. Airline Industry (June 2015) Share of Seats by Airline
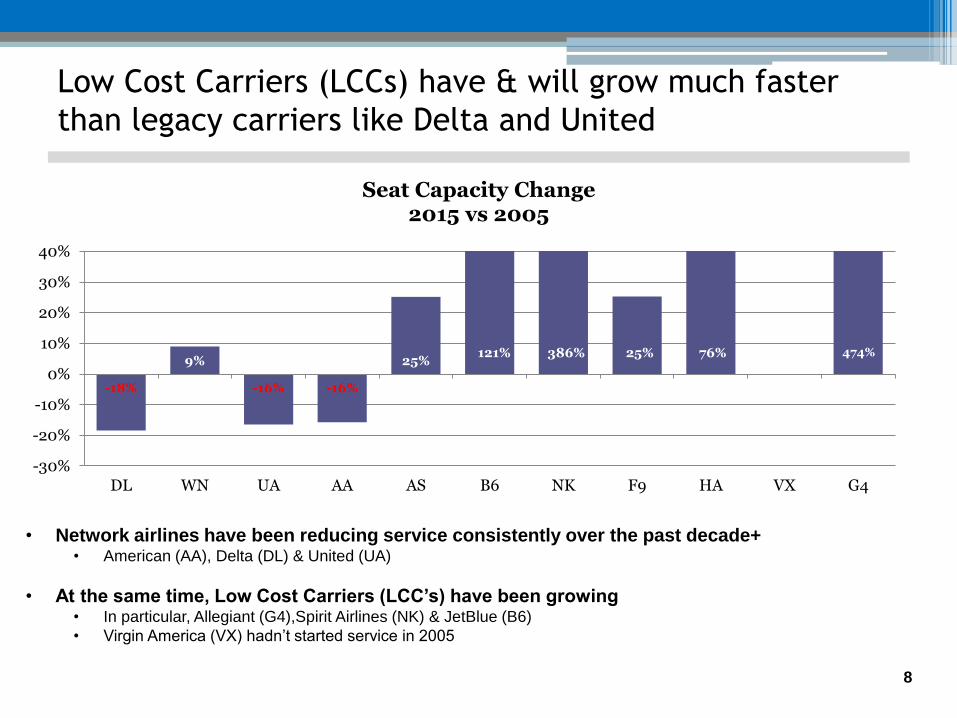
Low Cost Carriers (LCCs) have & will grow much faster
than legacy carriers like Delta and United
• Network airlines have been reducing service consistently over the past decade+ • American (AA), Delta (DL) & United (UA)
• At the same time, Low Cost Carriers (LCC’s) have been growing • In particular, Allegiant (G4),Spirit Airlines (NK) & JetBlue (B6)
• Virgin America (VX) hadn’t started service in 2005
8
-18%
9%
-16% -16%
25% 121% 386% 25% 76% 474%
-30%
-20%
-10%
0%
10%
20%
30%
40%
DL WN UA AA AS B6 NK F9 HA VX G4
Seat Capacity Change 2015 vs 2005

Benchmarking: MQT versus U.S. Trends
9

MQT vs U.S.: Passenger Trends
-45%
-35%
-25%
-15%
-5%
5%
15%
25%
35%
MQT vs U.S. Onboard Passengers Indexed to CY 2001
MQT US
• Passenger volume has fallen about
45% since 2006; at the same time,
U.S. passenger volumes are roughly
unchanged
• Since 2001 (13 years), MQT’s traffic
volume is down almost 40%, while
the U.S.’ is up about 22%
• During this same 13-year time
period, as will be shown shortly,
U.S. departing seats are essentially
unchanged, while MQT’s are down
over 50%
• As noted earlier, smaller airports in
general have suffered relatively
larger traffic losses as compared to
the U.S.
10

MQT vs U.S.: Load Factor Trends
50%
55%
60%
65%
70%
75%
80%
85%
90%
MQT vs U.S. Load Factor Trends Indexed to CY 2001
MQT US
• MQT Load Factors have been relatively
low through 2010-11, not seeing the
relative improvement experienced by
the broader U.S. market
• Then in 2012, MQT realized a sharp
Load Factor improvement to over 80%
• In 2013, MQT saw a 34% increase in
departing seats - during a time, AA
had 2 daily departures and DL 3
• Subsequently, both airlines reduced
capacity, with DL pulling back to 2
daily departures and AA 1 – and Load
Factors increased sharply
• 2013 results are likely making both
airlines skittish about again adding
capacity
11

Benchmarking: How MQT compares versus Peers
32%
58%
52%
57%
79% 76%
22% 20%
34%
46%
40%
21%
40%
48%
77%
0%
10%
20%
30%
40%
50%
60%
70%
80%
90%
Retention of Catchment Area Bookings CY 2014
• MQT’s relative leakage compares well
to other airports
• Leakage is largely due to air service
options nearby & relative air fares
• MQT benefits from relative isolation
and proximity to alternative air
service options
• Still, 24% are making the long drive
to MKE, GRB or DTW
• Additionally, opportunities may exist
to capture larger shares of other U.P.
markets, particularly if Essential Air
Service (EAS) program sees any major
modifications
12

MQT vs U.S.: Revenue & Departing Seat Trends
-20%
-10%
0%
10%
20%
30%
40%
50%
60%
70%
MQT Airline Revenue (in 000’s) Indexed to CY 2001
MQT U.S.
• MQT departing seats are down 54% since 2001, with most of the decline since the 2007-09
recession (particularly after 2009); U.S. departing seats are essentially unchanged since 2001
• MQT airline revenue outpaced U.S. trends until 2009-10, which corresponds to the height of the
recession and when MQT capacity was sharply being reduced. Since 2010, airline revenue is
roughly flat – not increasing during 2013 when capacity increased, but also not dropping during
capacity declines in 2012 & 2014
-60%
-50%
-40%
-30%
-20%
-10%
0%
10%
20%
30%
Departing Seats (Annualized) Indexed to 2001
U.S. MQT
13

MQT air fares have generally moved in line with U.S.
trends, although increasing more since 2011
$200
$250
$300
$350
$400
$450
$500
$550
$600
2001 2002 2003 2004 2005 2006 2007 2008 2009 2010 2011 2012 2013 2014
MQT vs U.S.: Average Paid Round-Trip Fare Including taxes & fees
MQT U.S.
$482
$536
14

MQT: Growth Opportunities
15

Current Carrier Results at MQT: Summary
• MQT’s current air service, at current capacity levels is performing well
▫ Delta’s RASM is well above mileage-adjusted averages, indicative of relative
profitability
▫ In addition, Delta’s Load Factor is well above system averages, particularly
seasonally
▫ American Airlines results at MQT are nearing system averages and improved
markedly in 2014 after capacity reductions (by both American and Delta)
• The big question: Can MQT profitably absorb more capacity?
▫ 2012 results were similar to 2014, then both AA & DL added capacity in 2013
▫ 2013 results dropped significantly, then capacity was reduced in 2014 and
results were materially better again
▫ While both AA & DL will likely be reluctant to add capacity (given 2013 results),
possibly the answer is somewhere in between?
16

Summary: MQT Growth Options
1. Additional capacity on Delta Air Lines to DTW; either in the form of additional
frequency or larger aircraft
2. Additional capacity on American Airlines to ORD, mostly likely in the form of a
second trip; also could approach SkyWest about flying as a pro-rate market,
stimulating local O&D traffic
3. New Delta Connection service, operated by SkyWest on a pro-rate basis, to
Minneapolis-St. Paul
4. New Allegiant Airlines service, 2x weekly, to Orlando-Sanford, using an Airbus
320; somewhat dependent on strength of the U.S. Dollar. Also, other Florida
markets could be options (Tampa-St. Petersburg & Punta Gorda)
Options #1-#3 could be in the form of additional seasonal (summer) capacity
initially.
17

Best near-term aircraft to grow from MQT: 50-seat RJs
18
< 650 80%
650-1000 15%
> 1000 5%
50-seat RJ Flights By Stagelength (June 2015)
• Matches to Delta policy of not flying
50-seat RJs over 650 miles
• Interpretation: MQT will need to
focus upon markets within 650
miles of MQT
• Although, selected aircraft upgrades
on DTW flying may be an option –
particularly seasonally (summer)

With one exception, this will mean additional/new service
to DTW, ORD or MSP (in the near-term)
19
UA, DL
789 miles
AA
770 miles
AA
854 miles
DL
905 miles
DL
363 miles
DL
592 miles
DL
1,280 miles
UA, AA, WN
315 miles
AA, WN
1,070 miles
UA, WN, F9
974 miles
AA, WN
1,570 miles

The exception: Allegiant Airlines service to Florida
• New market opportunities are identified
in yellow
• Allegiant’s focus is to Florida, Phoenix and
Las Vegas
• Florida would be focus for MQT
• Allegiant has and will be the fastest/2nd
fastest growing airline in the U.S. over the
next few years
• Allegiant has been very successful serving
markets on the U.S. – Canadian border,
although this has been tempered over the
past 18 months by the strength of the U.S.
Dollar
20
w/G4
Rank Dst Usage Leakage Booked Weekly Stimulation
1 DTW 4.9 6% 5.2
2 LAX 2.9 17% 3.5
3 LGA 2.7 18% 3.3
4 RSW 2.4 66% 7.1 50 297
5 ATL 2.3 39% 3.8
6 DCA 2.2 29% 3.1
7 DFW 2.1 14% 2.4
8 DEN 2.0 32% 3.0
9 SFO 2.0 37% 3.2
10 FLL 2.0 46% 3.7
11 SEA 2.0 24% 2.6
12 MCO 1.9 65% 5.5 39 233
13 LAS 1.7 15% 2.0
14 PHX 1.6 27% 2.2
15 BOS 1.6 10% 1.7
16 IAH 1.5 27% 2.1
17 TPA 1.4 65% 4.0 28 167
18 PHL 1.4 9% 1.5
19 STL 1.2 8% 1.3
20 SAN 1.0 23% 1.3
Daily, Directional
Top MQT O&D Markets

MQT: Among highest CRJ-200 Load Factor markets for
Delta out of DTW
• MQT is among Delta’s highest Load
Factor markets out of DTW
• Furthermore, most of markets on list
are flown multiple times per day with
larger aircraft and the CRJ-200 in
these markets is only a “filler” at off-
peak times
• Indicates potential spill on MQT flying
• Again, challenge will be explaining
what happened in 2013
• Time period: Year-ending May 2015
21
Rank Dest Deps/Day Onboards Load Factor
1 MKE 1.0 17,137 90%
2 GRR 2.1 33,618 89%
3 GSP 1.6 25,954 89%
4 MHT 1.0 13,896 88%
5 ALB 1.6 26,343 88%
6 MQT 1.7 26,835 88%
7 IND 1.3 21,617 88%
8 YUL 1.4 22,472 88%
9 DAY 1.3 20,688 87%
10 ERI 2.1 33,591 86%
11 YYZ 2.2 33,878 86%
12 BTV 2.5 39,289 86%
13 YOW 1.4 22,306 86%
14 RIC 0.6 9,527 85%
15 SWF 2.3 35,509 85%
16 BUF 0.5 7,188 85%
17 DSM 2.2 34,065 85%
18 AVP 2.1 32,177 84%
19 CAK 2.0 31,402 84%
20 IAD 1.6 23,856 84%
* Greater than 1.0 daily CRJ departures annually
Delta's CRJ Flying from DTW
Ranked by Load Factor (Descending Order)

MQT: Also among highest American Eagle Load Factor
markets out of ORD
• Similar story for American at ORD, as it
pertains to MQT
• MQT is one of top 50-seat RJ markets
out of ORD for AA
• Again, other markets are mostly those
that have more capacity on larger jets
• Again, indicative of the need for more
capacity
• Time period: Year-ending May 2015
22
Rank Dest. Deps/Day Onboards Load Factor
1 DTW 3.3 53,457 90%
2 SYR 1.6 25,733 89%
3 ROC 1.6 26,631 89%
4 CLE 2.1 32,539 88%
5 BNA 2.7 42,313 87%
6 CMH 5.3 79,510 87%
7 BWI 1.2 18,212 86%
8 OMA 1.9 29,786 86%
9 MQT 0.8 12,633 85%
10 SGF 3.6 55,213 85%
11 DSM 2.7 41,025 85%
12 BUF 1.3 20,542 85%
13 PIT 0.9 13,356 85%
14 CHO 1.9 29,864 84%
15 CHA 1.1 15,353 84%
16 CWA 1.9 27,872 84%
17 COU 1.2 17,407 84%
18 GRR 4.0 60,190 84%
19 YYZ 2.1 30,576 83%
20 RST 3.7 53,607 82%
American's ERJ/CRJ Flying from ORD
Ranked by Load Factor (Descending Order)

Potential MSP Service: MQT historically generated good MSP
O&D demand
23
17.4
9.4
12.0
7.6
5.3
11.1
9.1
0.0
2.0
4.0
6.0
8.0
10.0
12.0
14.0
16.0
18.0
20.0
1Q00
4Q00
3Q01
2Q02
1Q03
4Q03
3Q04
2Q05
1Q06
4Q06
3Q07
2Q08
1Q09
4Q09
3Q10
2Q11
Passengers Daily, Each Way • MQT-MSP has historically on many
occasions generated in excess of 10 O&D
daily passengers
• SkyWest under a pro-rate agreement,
would lower air fares and stimulate
demand
• Example: SkyWest entered the DLH-ORD
market a few years ago and stimulated
O&D demand from roughly 10 daily
passengers to 40, or a 4-fold increase
• Given historical demand, in conjunction
with potential stimulation, 1x or
possibly 2x daily MSP service is possible,
particularly seasonally