Air Quality Standards
4
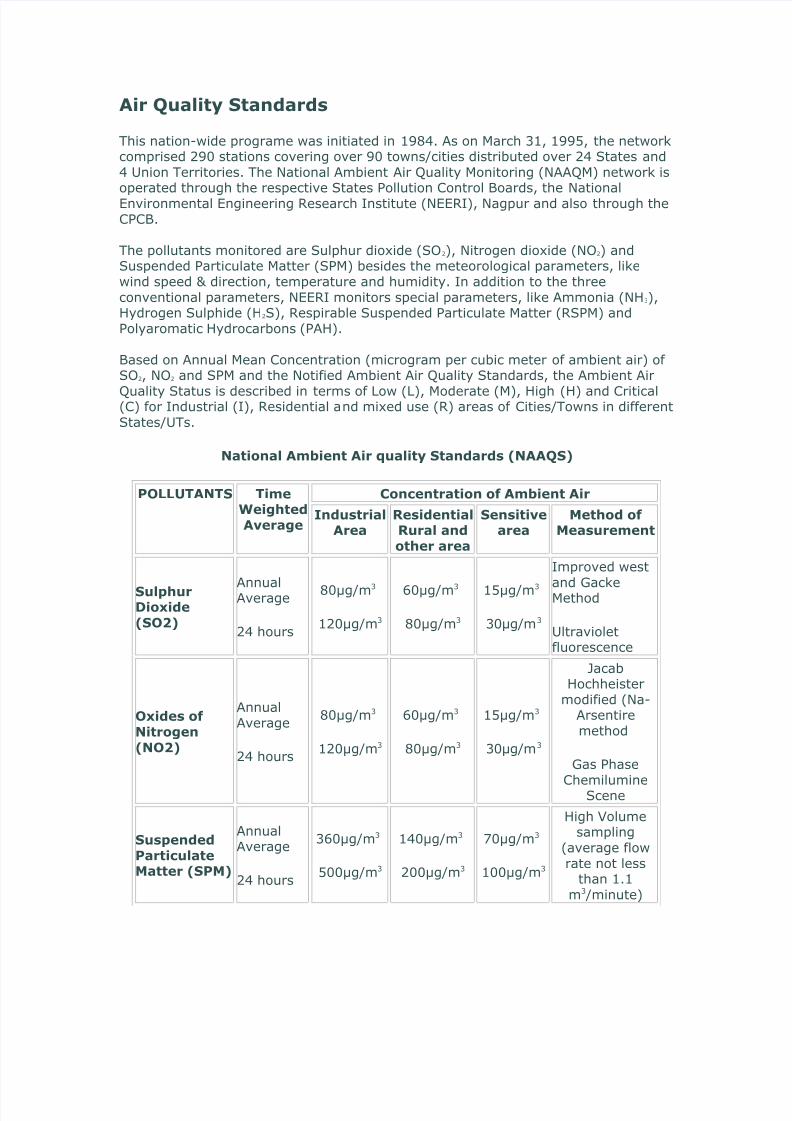
Air Quality Standards This nation-wide programe was initiated in 1984. As on March 31, 1995, the network comprised 290 stations covering over 90 towns/cities distributed over 24 States and 4 Union Territories. The National Ambient Air Quality Monitoring (NAAQM) network is operated through the respective States Pollution Control Boards, the National Environmental Engineering Research Institute (NEERI), Nagpur and also through the CPCB. The pollutants monitored are Sulphur dioxide (SO2), Nitrogen dioxide (NO2) and Suspended Particulate Matter (SPM) besides the meteorological parameters, like wind speed & direction, temperature and humidity. In addition to the three conventional parameters, NEERI monitors special parameters, like Ammonia (NH3), Hydrogen Sulphide (H2S), Respirable Suspended Particulate Matter (RSPM) and Polyaromatic Hydrocarbons (PAH). Based on Annual Mean Concentration (microgram per cubic meter of ambient air) of SO2, NO2 and SPM and the Notified Ambient Air Quality Standards, the Ambient Air Quality Status is described in terms of Low (L), Moderate (M), High (H) and Critical (C) for Industrial (I), Residential a nd mixed use (R) areas of Cities/Towns in different States/UTs. National Ambient Air quality Standards (NAAQS) POLLUTANTS Time Weighted Average Concentration of Ambient Air Industrial Area Residential Rural and other area Sensitive area Method of Measurement Sulphur Dioxide (SO2) Annual Average 24 hours 80µg/m 3 120µg/m 3 60µg/m 3 80µg/m 3 15µg/m 3 30µg/m 3 Improved west and Gacke Method Ultraviolet fluorescence Oxides of Nitrogen (NO2) Annual Average 24 hours 80µg/m 3 120µg/m 3 60µg/m 3 80µg/m 3 15µg/m 3 30µg/m 3 Jacab Hochheister modified (Na- Arsentire method Gas Phase Chemilumine Scene Suspended Particulate Matter (SPM) Annual Average 24 hours 360µg/m 3 500µg/m 3 140µg/m 3 200µg/m 3 70µg/m 3 100µg/m 3 High Volume sampling (average flow rate not less than 1.1 m 3 /minute)
-
Upload
nitika-jain -
Category
Documents
-
view
216 -
download
0
Transcript of Air Quality Standards
8/3/2019 Air Quality Standards
http://slidepdf.com/reader/full/air-quality-standards 1/4
Air Quality Standards
This nation-wide programe was initiated in 1984. As on March 31, 1995, the networkcomprised 290 stations covering over 90 towns/cities distributed over 24 States and
4 Union Territories. The National Ambient Air Quality Monitoring (NAAQM) network isoperated through the respective States Pollution Control Boards, the National
Environmental Engineering Research Institute (NEERI), Nagpur and also through the
CPCB.
The pollutants monitored are Sulphur dioxide (SO2), Nitrogen dioxide (NO2) andSuspended Particulate Matter (SPM) besides the meteorological parameters, like
wind speed & direction, temperature and humidity. In addition to the three
conventional parameters, NEERI monitors special parameters, like Ammonia (NH3),Hydrogen Sulphide (H2S), Respirable Suspended Particulate Matter (RSPM) and
Polyaromatic Hydrocarbons (PAH).
Based on Annual Mean Concentration (microgram per cubic meter of ambient air) of SO2, NO2 and SPM and the Notified Ambient Air Quality Standards, the Ambient Air
Quality Status is described in terms of Low (L), Moderate (M), High (H) and Critical(C) for Industrial (I), Residential and mixed use (R) areas of Cities/Towns in different
States/UTs.
National Ambient Air quality Standards (NAAQS)
POLLUTANTS TimeWeighted
Average
Concentration of Ambient Air
IndustrialArea
ResidentialRural and
other area
Sensitivearea
Method of Measurement
SulphurDioxide
(SO2)
AnnualAverage
24 hours
80µg/m3
120µg/m3
60µg/m3
80µg/m3
15µg/m3
30µg/m3
Improved west
and GackeMethod
Ultravioletfluorescence
Oxides of
Nitrogen
(NO2)
Annual
Average
24 hours
80µg/m3
120µg/m3
60µg/m3
80µg/m3
15µg/m3
30µg/m3
JacabHochheister
modified (Na-Arsentire
method
Gas Phase
ChemilumineScene
Suspended
ParticulateMatter (SPM)
AnnualAverage
24 hours
360µg/m3
500µg/m3
140µg/m3
200µg/m3
70µg/m3
100µg/m3
High Volumesampling
(average flow
rate not lessthan 1.1
m3 /minute)
8/3/2019 Air Quality Standards
http://slidepdf.com/reader/full/air-quality-standards 2/4
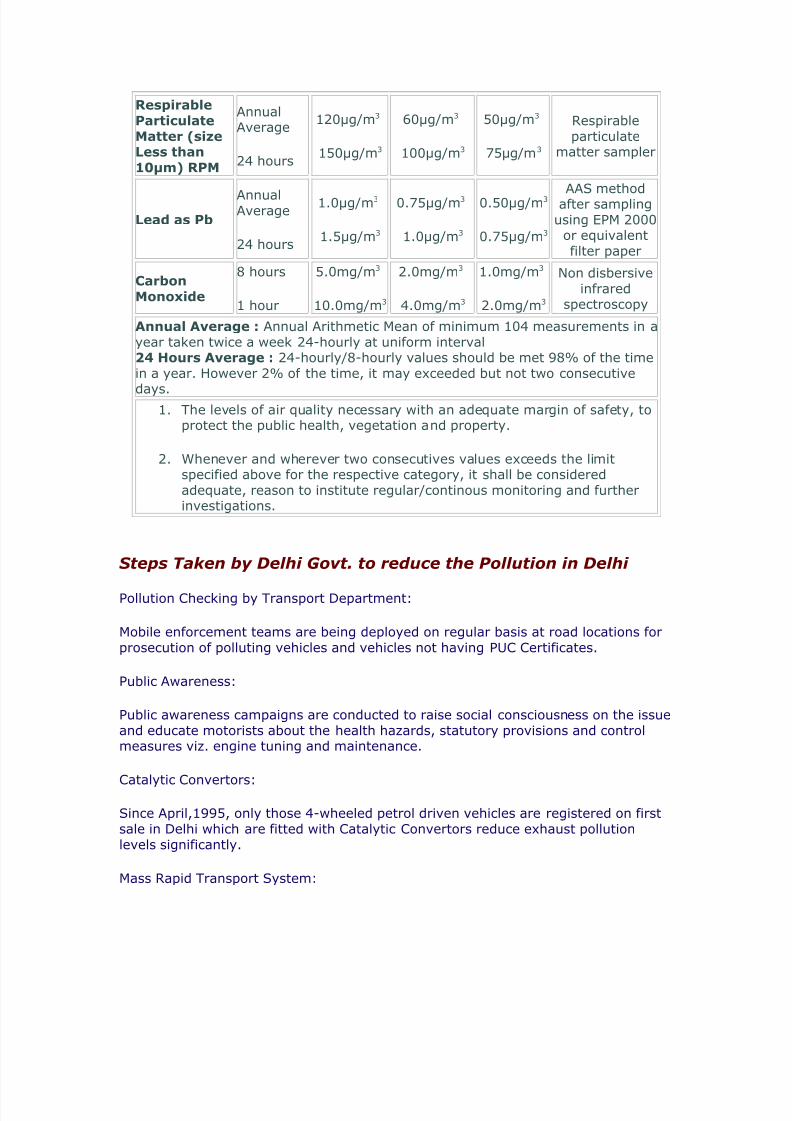
Respirable
Particulate
Matter (sizeLess than
10µm) RPM
AnnualAverage
24 hours
120µg/m3
150µg/m3
60µg/m3
100µg/m3
50µg/m3
75µg/m3
Respirable
particulatematter sampler
Lead as Pb
AnnualAverage
24 hours
1.0µg/m3
1.5µg/m3
0.75µg/m3
1.0µg/m3
0.50µg/m3
0.75µg/m3
AAS methodafter sampling
using EPM 2000or equivalent
filter paper
Carbon
Monoxide
8 hours
1 hour
5.0mg/m3
10.0mg/m3
2.0mg/m3
4.0mg/m3
1.0mg/m3
2.0mg/m3
Non disbersive
infraredspectroscopy
Annual Average : Annual Arithmetic Mean of minimum 104 measurements in a
year taken twice a week 24-hourly at uniform interval24 Hours Average : 24-hourly/8-hourly values should be met 98% of the time
in a year. However 2% of the time, it may exceeded but not two consecutive
days.1. The levels of air quality necessary with an adequate margin of safety, to
protect the public health, vegetation and property.
2. Whenever and wherever two consecutives values exceeds the limitspecified above for the respective category, it shall be considered
adequate, reason to institute regular/continous monitoring and furtherinvestigations.
Steps Taken by Delhi Govt. to reduce the Pollution in Delhi
Pollution Checking by Transport Department:
Mobile enforcement teams are being deployed on regular basis at road locations for
prosecution of polluting vehicles and vehicles not having PUC Certificates.
Public Awareness:
Public awareness campaigns are conducted to raise social consciousness on the issue
and educate motorists about the health hazards, statutory provisions and controlmeasures viz. engine tuning and maintenance.
Catalytic Convertors:
Since April,1995, only those 4-wheeled petrol driven vehicles are registered on first
sale in Delhi which are fitted with Catalytic Convertors reduce exhaust pollution
levels significantly.
Mass Rapid Transport System:
8/3/2019 Air Quality Standards
http://slidepdf.com/reader/full/air-quality-standards 3/4
Mass Rapid Transport System has been approved with the objective to place a non-polluting, efficient and affordable rail based mass rapid transit system for NCT of
Delhi, duly integrated with other modes of transport.
Phasing out of Old Commercial Vehicles:
With a view to reduce vehicular pollution in Delhi Hon'ble Supreme Court vide itsorders in CWP No. 13029 of 1985 has banned the plying of following categories of
vehicles in Delhi:-
1. More than 15 years old commercial/transport vehicles form 01-01-1999.
2. Pre-90 Autos & Taxis from 01-04-2000.3. More than 8 years old Buses from 01-02-2000 (except on clean fuels).
Transport Department is ensuring the effective compliance of these directionsthrough its enforcement teams. Govt. of Delhi is also providing fiscal incentives Sales
Tax Exemption and Interest subsidy on loans for purchase of new replacementvehicles.
Tightening of mass emission standards for new vehicles:
Mass emission norms for new vehicles were introduced in the year 1991. These
norms were progressively made stringent in the year 1996 and again in 2000. Since1.4.2000, non-commercial vehicles (Cars) complying with Bharat Stage II/Euro-II
emission norms are being registered in the Delhi.
Improvement in Fuel Quality:
The quality of the fuel being supplied in Delhi has been improved in last 3-4 years byway of :-
• Introduction of Unleaded petrol w.e.f April 1995 and subsquently, leaded
petrol has been completely phased out.
• Introduction of Low Sulphur diesel w.e.f August 1997 reducing Sulphurcontext from 0.8% gm/lt to 0.25% gm/lt. The sulphur content of diesel
supplied to NCT Delhi has been further reduced to 0.05% w.e.f. 28.2.2001.
• The quality of petrol being supplied to Delhi has been improved further byreduction of Sulphur content to 0.05% w.e.f 1.4.2000 & Benzene Content to
1% w.e.f. 1.11.2000.
8/3/2019 Air Quality Standards
http://slidepdf.com/reader/full/air-quality-standards 4/4
Compressed Natural Gas(CNG) as an alternate fuel to control the pollution:
CNG (short for Compressed Natural Gas) is emerging as an attractive alternative fueldue to its clean burning characteristic and very low amount of exhaust pollution. It is
a mizture of hudrocarbons consisting of approximatel 80 to 90 percent methane ingaseous form. It is compressed to a pressure of 200 to 250 Kg/Cm to enhance the
vehicle on-board storage in a cylinder. 81 CNG filling stations have been set up inDelhi by M/s. Indraprastha Gas Limited as in September, 2001. These are proposed
to be increased to around 94 by March 2002.
Salient Featurs of CNG Run vehicles:
Almost any petrol vehicle can be converted to operate on CNG. The conversion can
be done in a day.
• The cost of CNG kit and its installation in a car ranges between Rs.30,000/- to35,000/-.
• 1 Kg. of CNG is energy equivalent to 1.39 liters of petrol and 1.18 liters of
diesel.
• The price of CNG per Kg. is Rs.12.21 CNG prices equivalent to 1 ltr. of petrolare Rs.8.19 which is far less than that of petrol. There is about 65% saving on
fuel bill for a car operating on CNG fuel.
• An amount of 8/9/10 Kg. CNG is stored in 40/50/60 ltr. size cylinderrespectively which is equivalent to 11.2/12.5/14 ltr. of petrol