Air Quality Progress Report 2013 - Breckland
40
Transcript of Air Quality Progress Report 2013 - Breckland


Breckland Council
LAQM Progress Report 2013 1
Local Authority Officer
Zandra Waterford
Department Environmental Protection
Address Elizabeth House, Walpole Loke, Dereham, NR19 1EE Norfolk
Telephone 01365 656350
e-mail [email protected]
Report Reference number
PR2013
Date August 2013
Breckland Council
LAQM Progress Report 2013 2
Executive Summary
Breckland Council has considered all points required by the Progress Report. Air quality across most of the district is good and there was no exceedence of the annual objective for NO2 in Swaffham. Results show that NO2 concentrations are hovering around the 40ug/m3 and it is proposed to continue monitoring to assess the impact of the housing and retail developments, some of which have recently commenced building work, at opposite ends of the town. A Detailed Assessment was carried out in 2012 and concluded that the exceedence was not yet great enough to warrant the declaration of an Air Quality Management Area (AQMA) but that the situation should continue to be monitored.

Breckland Council
LAQM Progress Report 2013 3
Table of Contents
1 Introduction 5
1.1 Description of Local Authority Area 5
1.2 Purpose of Progress Report 6
1.3 Air Quality Objectives 6
1.4 Summary of Previous Review and Assessments 8
2 New Monitoring Data 9
2.1 Summary of Monitoring Undertaken 9
2.2 Comparison of Monitoring Results with Air Quality Objectives 13
3 New Local Developments 27
3.1 Road Traffic Sources 27
3.2 Other Transport Sources 27
3.3 Industrial Sources 27
3.4 Commercial and Domestic Sources 27
3.5 New Developments with Fugitive or Uncontrolled Sources 27
4 Local / Regional Air Quality Strategy 28
5 Conclusions and Proposed Actions 29
5.1 Conclusions from New Monitoring Data 29
5.2 Conclusions relating to New Local Developments 29
5.3 Proposed Actions 29
6 References 30
List of Tables
Table 1.1 Air Quality Objectives Included in Regulations 7
Table 1.2 Summary of Previous Reviews and Assessments 8
Table 2.1 Details of Automatic Monitoring Sites 10
Table 2.2 Details of Non Automatic Monitoring Sites 12
Table 2.3 Ratified Data for 2012 for Swaffham 13
Table 2.4 Ratified Data f or 2012 for East Wretham 14
Table 2.5 Results of Automatic Monitoring for NO2 annual means 16
Table 2.6 Results of Automatic Monitoring for NO2 1 hr means 17
Table 2.7 Results of NO2 Diffusion tubes 19

Breckland Council
LAQM Progress Report 2013 4
Table 2.8 Sites for Diffusion Tubes by Site Type 20
Table 2.9 Results of Diffusion Tubes 2008 – 2012 21
Table 2.10 Results of Automatic Monitoring for NO2 annual means 23
Table 2.11 Results of Automatic Monitoring for NO2 24hr means 24
List of Figures
Figure 1.Map to show locations of automatic monitoring stations. 5
Figure 2.1 WASP 2013 for Gradko 11
Appendices
Appendix A QA/QC data 32
Appendix B Map of Diffusion tubes in Attleborough 34
Appendix C Map of Diffusion tubes in Dereham 35
Appendix D Map of Diffusion Tubes in Swaffham 36
Appendix E Map of Diffusion Tubes in Thetford 37
Appendix F Map of Diffusion tubes in Watton 38
Appendix G map of Diffusion tubes at East Wretham 39

Breckland Council
LAQM Progress Report 2013 5
1 Introduction
1.1 Description of Local Authority Area
Breckland District covers an area of 1,305sq kilometres and is one the largest rural districts in England. Located on the Norfolk/Suffolk border, Breckland covers much of the south, west and central parts of Norfolk. With a population of 129,000 Breckland is centred round the five market towns of Attleborough, Dereham, Swaffham, Thetford and Watton. The largest of these is Thetford with a population of over 21,000 and the smallest Watton with a population of just over 6,000. Retail, distribution, catering, farming and manufacturing are key economic activities.
Figure 1 Map showing Automatic Monitoring Sites Automatic Monitoring Station
Market towns

Breckland Council
LAQM Progress Report 2013 6
1.2 Purpose of Progress Report
This report fulfils the requirements of the Local Air Quality Management (LAQM)
process as set out in Part IV of the Environment Act (1995), the Air Quality Strategy
for England, Scotland, Wales and Northern Ireland 2007 and the relevant Policy and
Technical Guidance documents. The LAQM process places an obligation on all local
authorities to regularly review and assess air quality in their areas, and to determine
whether or not the air quality objectives are likely to be achieved. Where
exceedences are considered likely, the local authority must then declare an Air
Quality Management Area (AQMA) and prepare an Air Quality Action Plan (AQAP)
setting out the measures it intends to put in place in pursuit of the objectives.
Progress Reports are required in the intervening years between the three-yearly
Updating and Screening Assessment reports. Their purpose is to maintain continuity
in the Local Air Quality Management process.
They are not intended to be as detailed as Updating and Screening Assessment
Reports, or to require as much effort. However, if the Progress Report identifies the
risk of exceedence of an Air Quality Objective, the Local Authority (LA) should
undertake a Detailed Assessment immediately, and not wait until the next round of
Review and Assessment.
1.3 Air Quality Objectives
The air quality objectives applicable to LAQM in England are set out in the Air
Quality (England) Regulations 2000 (SI 928), The Air Quality (England) (Amendment)
Regulations 2002 (SI 3043), and are shown in Table 1.1. This table shows the
objectives in units of microgrammes per cubic metre µg/m3 (milligrammes per cubic
metre, mg/m3 for carbon monoxide) with the number of exceedences in each year
that are permitted (where applicable).
Breckland Council
LAQM Progress Report 2013 7
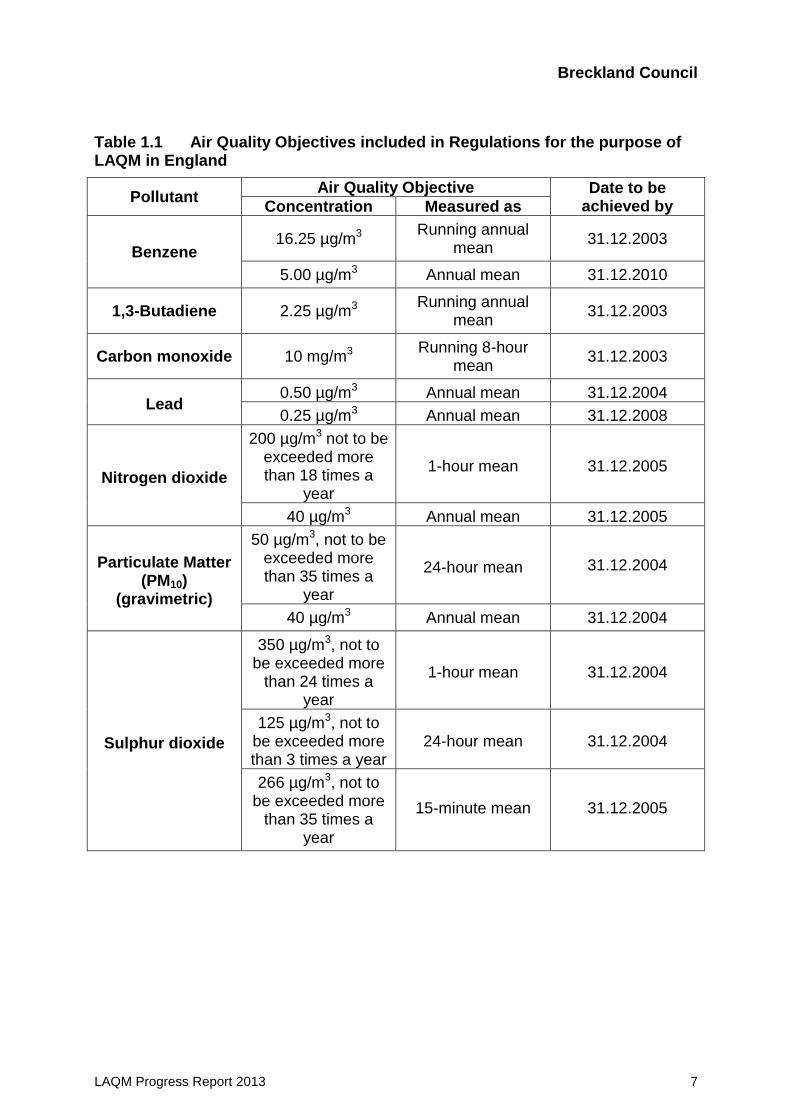
Table 1.1 Air Quality Objectives included in Regulations for the purpose of LAQM in England
Pollutant Air Quality Objective Date to be
achieved by Concentration Measured as
Benzene 16.25 µg/m3 Running annual
mean 31.12.2003
5.00 µg/m3 Annual mean 31.12.2010
1,3-Butadiene 2.25 µg/m3 Running annual
mean 31.12.2003
Carbon monoxide 10 mg/m3 Running 8-hour
mean 31.12.2003
Lead 0.50 µg/m3 Annual mean 31.12.2004
0.25 µg/m3 Annual mean 31.12.2008
Nitrogen dioxide
200 µg/m3 not to be exceeded more than 18 times a
year
1-hour mean 31.12.2005
40 µg/m3 Annual mean 31.12.2005
Particulate Matter (PM10)
(gravimetric)
50 µg/m3, not to be exceeded more than 35 times a
year
24-hour mean 31.12.2004
40 µg/m3 Annual mean 31.12.2004
Sulphur dioxide
350 µg/m3, not to be exceeded more
than 24 times a year
1-hour mean 31.12.2004
125 µg/m3, not to be exceeded more than 3 times a year
24-hour mean 31.12.2004
266 µg/m3, not to be exceeded more
than 35 times a year
15-minute mean 31.12.2005
Breckland Council
LAQM Progress Report 2013 8
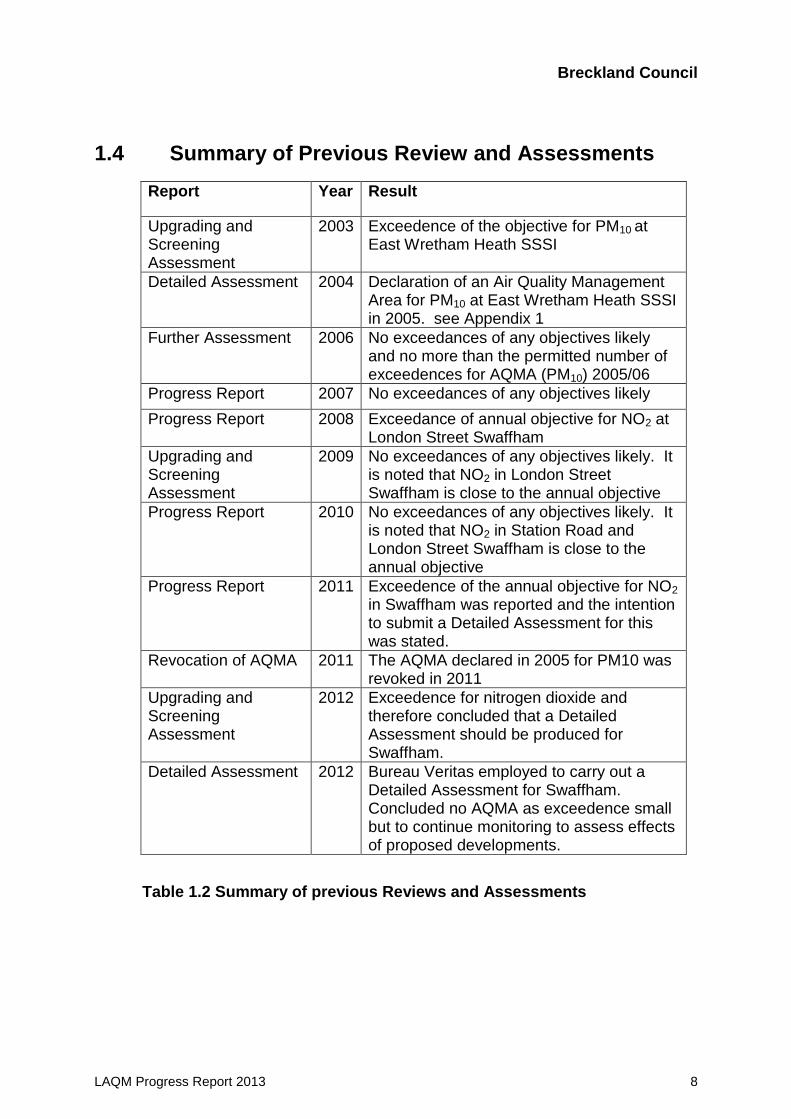
1.4 Summary of Previous Review and Assessments
Report Year Result
Upgrading and Screening Assessment
2003 Exceedence of the objective for PM10 at East Wretham Heath SSSI
Detailed Assessment 2004 Declaration of an Air Quality Management Area for PM10 at East Wretham Heath SSSI in 2005. see Appendix 1
Further Assessment 2006 No exceedances of any objectives likely and no more than the permitted number of exceedences for AQMA (PM10) 2005/06
Progress Report 2007 No exceedances of any objectives likely
Progress Report 2008 Exceedance of annual objective for NO2 at London Street Swaffham
Upgrading and Screening Assessment
2009 No exceedances of any objectives likely. It is noted that NO2 in London Street Swaffham is close to the annual objective
Progress Report 2010 No exceedances of any objectives likely. It is noted that NO2 in Station Road and London Street Swaffham is close to the annual objective
Progress Report 2011 Exceedence of the annual objective for NO2 in Swaffham was reported and the intention to submit a Detailed Assessment for this was stated.
Revocation of AQMA 2011 The AQMA declared in 2005 for PM10 was revoked in 2011
Upgrading and Screening Assessment
2012 Exceedence for nitrogen dioxide and therefore concluded that a Detailed Assessment should be produced for Swaffham.
Detailed Assessment 2012 Bureau Veritas employed to carry out a Detailed Assessment for Swaffham. Concluded no AQMA as exceedence small but to continue monitoring to assess effects of proposed developments.
Table 1.2 Summary of previous Reviews and Assessments

Breckland Council
LAQM Progress Report 2013 9
2 New Monitoring Data
2.1 Summary of Monitoring Undertaken
2.1.1 Automatic Monitoring Sites
2.1.2 Figure 1 above shows the locations of the five towns and the Automatic Monitoring Stations detailed in Table 2.1 below at Swaffham and Wretham. The Swaffham Automatic site was added in February 2009 to obtain information for a Detailed Assessment of NO2 that was to be required because diffusion tube results for 2007 showed an exceedence of the annual objective for NO2. The objective was met in subsequent years until 2010, when it was again exceeded, also in 2011 and was very close in 2012.
2.1.3 Appendix A contains the QA/QC data for the automatic monitoring sites and the diffusion tube locations. Automatic analyser calibrations are carried out at 4 weekly intervals by Breckland Council. An adapted Local Site Operators’ (LSO) manual is used at the automatic monitoring sites in Swaffham and Wretham. This is a 34 page document so is not included in the Appendix A, all information used in the Breckland version is found in http://www.airquality.co.uk/reports/empire/lsoman/lsoman.html . All principles are followed as far as possible and all equipment instructions that are not relevant are removed.
2.1.4 Servicing of all analysers was carried out by SupportingU with data handling, 6 monthly site audits and data ratification carried out by AEA for the Swaffham site and AQDM for data handling and ratification for the Wretham site.
2.1.5 Appendices B-H are the maps showing the diffusion tube locations. Loader and Targa 2008 have produced guidance on using the diffusion tubes with siting information that is followed by Breckland Council.
2.1.6 PM10 monitoring is carried out at the Wretham site using the R&P TEOM. The TEOM data is corrected using the Kings College VCM.

Breckland Council
LAQM Progress Report 2013 10
Table 2.1 Details of Automatic Monitoring Sites
Site Name Site Type
X OS GridRef
Y OS Grid Ref
Pollutants Monitored
In AQMA?
Monitoring Technique
Relevant Exposure? (Y/N with distance (m)
to relevant exposure)
Distance to kerb of
nearest road (N/A if not applicable)
Does this location
represent worst-case exposure?
East Wretham
Rural
background 591315, 288704
NO2 PM10
NO
Chemiluminescence TEOM
Y 50m
NO
Swaffham Urban Facade
582093, 308469 NO2 NO Chemiluminescence Y 2m YES

Breckland Council
LAQM Progress Report 2013 11
2.1.7 Non-Automatic Monitoring Sites
2.1.7.1 Appendix A shows the QA/QC and laboratory details for all data. Figure 2.1 Shows the results for the WASP 2013 for Gradko
Figure 2.1 WASP 2013 for Gradko
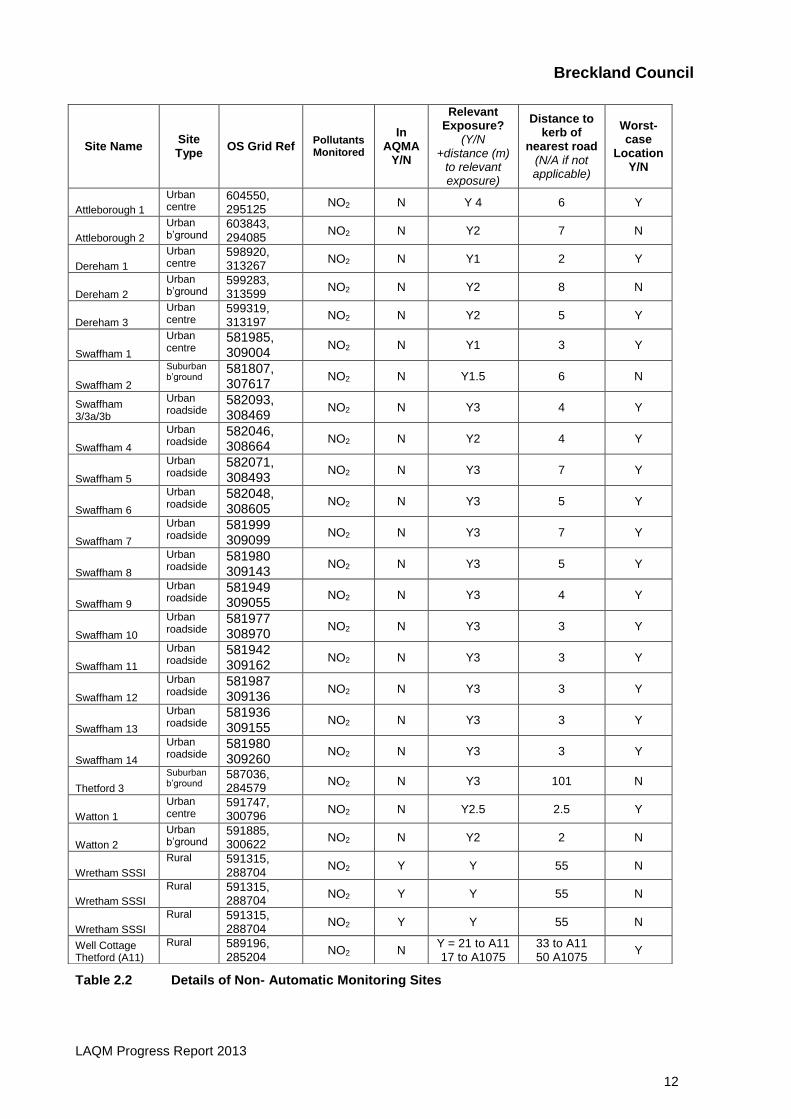
2.1.7.2 Table 2.2 below shows details of Non-Automatic Monitoring Sites and Table 2.7 shows the results for the diffusion tubes for the district. It can be seen that no location exceeded the annual mean of 40ug/m3 in 2012. Maps of monitoring sites are included in Appendices B-H.
2.1.7.3 Diffusion tube D1 was moved to a lamp post at façade of building in High
Street when 1st floor building became unavailable. Tube is now at 2m high on opposite side of road.
Breckland Council
LAQM Progress Report 2013 12
Table 2.2 Details of Non- Automatic Monitoring Sites
Site Name Site Type
OS Grid Ref Pollutants Monitored
In AQMA
Y/N
Relevant Exposure?
(Y/N +distance (m)
to relevant exposure)
Distance to kerb of
nearest road (N/A if not applicable)
Worst-case
LocationY/N
Attleborough 1
Urban centre
604550, 295125
NO2 N Y 4 6 Y
Attleborough 2
Urban b’ground
603843, 294085
NO2 N Y2 7 N
Dereham 1
Urban centre
598920, 313267
NO2 N Y1 2 Y
Dereham 2
Urban b’ground
599283, 313599
NO2 N Y2 8 N
Dereham 3
Urban centre
599319, 313197
NO2 N Y2 5 Y
Swaffham 1
Urban centre
581985, 309004
NO2 N Y1 3 Y
Swaffham 2
Suburban b’ground
581807, 307617
NO2 N Y1.5 6 N
Swaffham 3/3a/3b
Urban roadside
582093, 308469
NO2 N Y3 4 Y
Swaffham 4
Urban roadside
582046, 308664
NO2 N Y2 4 Y
Swaffham 5
Urban roadside
582071, 308493
NO2 N Y3 7 Y
Swaffham 6
Urban roadside
582048, 308605
NO2 N Y3 5 Y
Swaffham 7
Urban roadside
581999 309099
NO2 N Y3 7 Y
Swaffham 8
Urban roadside
581980 309143
NO2 N Y3 5 Y
Swaffham 9
Urban roadside
581949 309055
NO2 N Y3 4 Y
Swaffham 10
Urban roadside
581977 308970
NO2 N Y3 3 Y
Swaffham 11
Urban roadside
581942 309162
NO2 N Y3 3 Y
Swaffham 12
Urban roadside
581987 309136
NO2 N Y3 3 Y
Swaffham 13
Urban roadside
581936 309155
NO2 N Y3 3 Y
Swaffham 14
Urban roadside
581980 309260
NO2 N Y3 3 Y
Thetford 3
Suburban b’ground
587036, 284579
NO2 N Y3 101 N
Watton 1
Urban centre
591747, 300796
NO2 N Y2.5 2.5 Y
Watton 2
Urban b’ground
591885, 300622
NO2 N Y2 2 N
Wretham SSSI
Rural 591315, 288704
NO2 Y Y 55 N
Wretham SSSI
Rural 591315, 288704
NO2 Y Y 55 N
Wretham SSSI
Rural 591315, 288704
NO2 Y Y 55 N
Well Cottage Thetford (A11)
Rural 589196, 285204
NO2 N Y = 21 to A11 17 to A1075
33 to A11 50 A1075
Y

Breckland Council
LAQM Progress Report 2013 13
2.2 Comparison of Monitoring Results with Air Quality Objectives
2.2.1 Table 2.3 shows that there was no exceedence of the annual AQ Objective at the continuous monitoring site (S3) in Swaffham and one exceedence of the hourly objective.. This information was used to derive the bias adjustment factor for the whole of Swaffham. Bias adjusted figures are shown in Table 2.7 below and it is shown that there was no exceedence of the annual mean objective for nitrogen dioxide in Swaffham in 2012. A Detailed Assessment was produced for this area and the previous exceedences deemed minor and not appropriate to declare an AQMA but to continue monitoring.
Table 2.3 Ratified data for 2012 for Swaffham
Breckland Council
LAQM Progress Report 2013 14
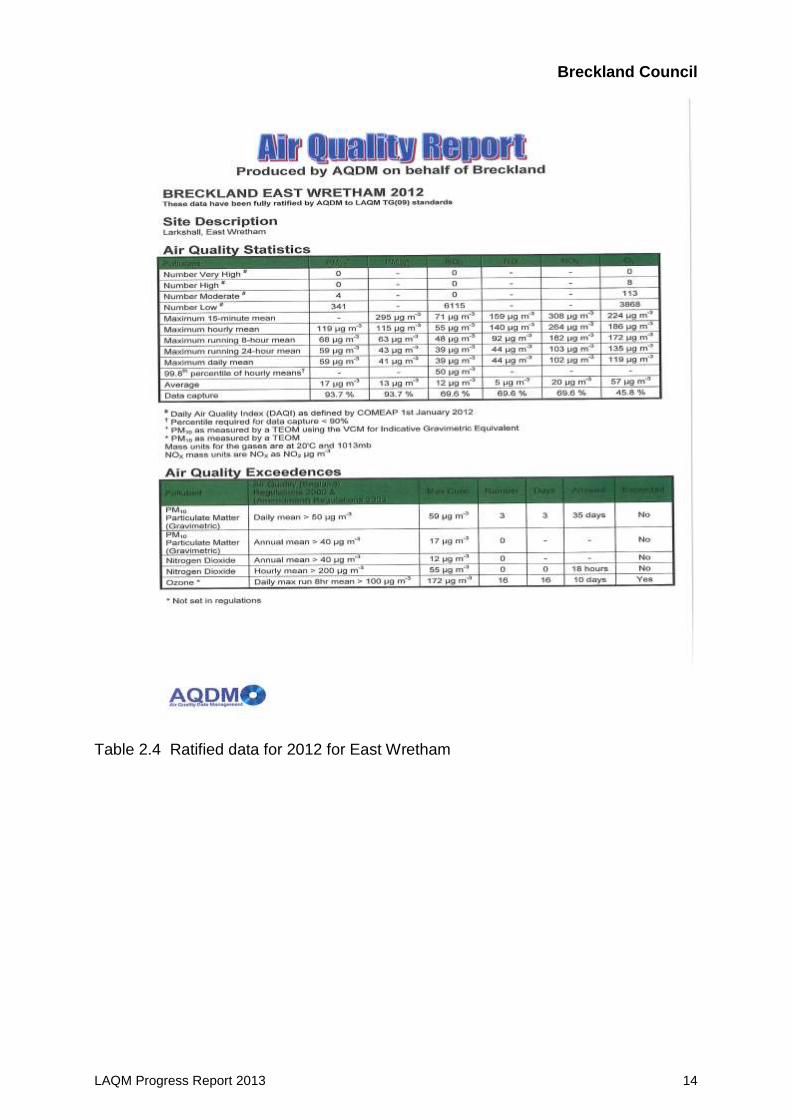
Table 2.4 Ratified data for 2012 for East Wretham

Breckland Council
LAQM Progress Report 2013 15
2.2.2 Nitrogen Dioxide (NO2)
No measured annual mean concentrations have exceeded 40ug/m3
No sites have recorded more than 18 one hour means above 200ug/m3…
Automatic Monitoring Data
Tables 2.3 and 2.4 show that there were no measured exceedences of the objectives
for NO2 at the automatic monitoring sites.

Breckland Council
LAQM Progress Report 2013 16
Table 2.5 Results of Automatic Monitoring for NO2: Comparison with Annual Mean Objective
Site ID Site Type Within
AQMA?
Valid Data Capture for Monitoring Period % a
Valid Data Capture 2012
% b
Annual Mean Concentration (µg/m3)
2008* c 2009* c 2010* c 2011* c 2012 c
20 rural back
ground
N
69.6 69.6 17 12 12 20 12
S3 Roadside N 95.5 95.5 32 35 35 31 31
In bold, exceedence of the NO2 annual mean AQS objective of 40µg/m3
a i.e. data capture for the monitoring period, in cases where monitoring was only carried out for part of the year
b i.e. data capture for the full calendar year (e.g. if monitoring was carried out for six months the maximum data capture for the full calendar year would be 50%)
c Means should be “annualised” as in Box 3.2 of TG(09) (http://laqm.defra.gov.uk/technical-guidance/index.html?d=page=38), if valid data capture is less than
75%
* Annual mean concentrations for previous years are optional

Breckland Council
LAQM Progress Report 2013 17
Table 2.6 Results of Automatic Monitoring for NO2: Comparison with 1-hour Mean Objective
Site ID Site Type Within
AQMA?
Valid Data Capture for Monitoring Period %
2012a
Valid Data Capture 2012
% b
Number of Hourly Means > 200µg/m3
2008* c 2009* c 2010* c 2011* c 2012 c
S3 Roadside N 95.5 95.5 0 0 0 1 1
20 Wretham
Rural background
N 69.6 69.6 0 0 0 18 0
In bold, exceedence of the NO2 hourly mean AQS objective (200µg/m3 – not to be exceeded more than 18 times per year)
a i.e. data capture for the monitoring period, in cases where monitoring was only carried out for part of the year
b i.e. data capture for the full calendar year (e.g. if monitoring was carried out for six months the maximum data capture for the full calendar year would be 50%)
c If the data capture for full calendar year is less than 90%, include the 99.8th percentile of hourly means in brackets
* Number of exceedences for previous years is optional
The 18 exceedences of the hourly mean at East Wretham which all occurred on one day have been explained in the Upgrading and
Screening Report for 2011 – it was thought to be due to a fire at the site.
Breckland Council
LAQM Progress Report 2013 18
Diffusion Tube Monitoring Data
There have been no annual means in excess of the annual mean NO2 objective.
Table 2.7 gives the bias adjusted results for the tubes – the bias adjustment factor
was taken from the tubes that were collocated at the Swaffham site and was 1.02 for
the year 2012. Collocated tubes are highlighted in grey and only the Swaffham site
was used for the local bias adjustment because, due to data logging failures and
faulty equipment, the data capture for the Wretham site was not good (69%)

Breckland Council
LAQM Progress Report 2013 19
Tab
le 2
.7
Re
sults
of N
O2 D
iffusio
n T
ub
es 2
01
2 s
how
ing b
ias a
dju
ste
d re
sults
.
Bla
nk s
pace
s s
ho
w m
issin
g tu
be
s a
nd
the J
uly
co
lum
n is
bla
nk d
ue
to a
pro
cessin
g
fault a
t Gra
dko
.
2012 January February March April May June July August September October November December
Annual mean
Bias Adjusted
A1 40.6 33.25 36.82 28.44 20.03 21.94 25.23 26.04 30.28 32.51 46.37 31.05 31.67
A2 18.03 16.58 15.66 9.42 5.52 6.15 8.32 8.91 9.73 14.47 21.66 12.22 12.47
D1 31.81 28.81 32.02 21.99 18.57 21.71 23.29 31.34 25.63 44.59 57.25 30.64 31.25
D2 19.83 19.94 15.94 10.28 6.06 7.49 31.87 14.33 21.69 31.05 17.85 18.20
D3 39.14 38.51 35.28 19.31 16.71 29.47 13.84 30.25 33.48 46.70 30.27 30.87
S1 31.16 29.5 25.91 21.05 19.48 22.38 23.95 20.65 25.55 26.15 29.11 24.99 25.49
S2 15.7 16.56 13.74 8.72 4.8 5.5 7.61 7.36 10.98 22 15.41 11.67 11.90
S3 36.24 35.07 38.06 27.74 23.05 28.4 32.8 25.22 11.00 33.92 34.49 29.64 30.23
S3a 29.16 32.8 38.94 32.19 22.78 25.8 35.64 25.69 32.16 37.99 37.03 31.83 32.47
S3b 36.71 33.99 37.79 30.9 20.97 27.06 35.09 28.26 30.81 37.14 34.92 32.15 32.79
S4 31.89 24.3 33.21 30.94 22.28 13.47 26.24 30.5 28.97 28.63 24.44 26.81 27.34
S5 32.97 34.97 38.98 29.22 21.82 22.89 26.39 26.43 24.92 33.19 36.89 29.88 30.48
S6 37.64 35.54 36.14 35.87 26.37 33.46 40.41 23.22 32.05 40.53 40.36 34.69 35.38
S7 35.52 34.52 39.51 33.7 29.3 29.49 41 31.36 35.60 40.9 37.57 35.32 36.02
S8 35.7 41.3 43.13 40.93 25.13 29.83 40.85 35.24 37.31 44.95 43.47 37.99 38.75
S9 32.99 30.9 29.55 26.88 20.23 20.5 23.81 36.8 21.25 33.31 32.46 28.06 28.62
S10 29.28 30.4 27.12 22.89 21.5 26.95 24.51 31.42 34.10 27.57 28.13
S11 35.92 36.3 40.17 32.84 28.98 30.69 39.51 22.98 35.39 40.04 36.36 34.47 35.16
S12 36.41 33.19 38.37 37.78 24.98 29.24 39.12 25.76 39.75 40.46 34.51 35.20
S13 40.84 41.5 38.94 38.53 25.52 39.06 25.51 31.47 30.30 34.63 35.32
S14 29.85 25.82 18.94 15.92 28.32 22.21 28.06 34.21 37.47 26.76 27.29
T1 36.23 37.29 36.04 25.62 21.21 13.66 13.99 32.46 36.40 28.10 28.66
T2 34.88 32.06 33.17 23.62 22.06 17.73 24.01 17.57 25.96 20.32 27.96 25.39 25.90
T3 24.05 22.83 23.14 13.21 9.28 8.03 11.82 23.59 14.31 31.96 32.52 19.52 19.91
W1 30.84 25.78 29.48 17.77 16.71 16.5 24.64 11.05 0.25 55.07 35.48 23.96 24.44
W2 20.91 19.9 21.36 8.07 9.95 7.1 10.57 20.56 12.45 19.32 25.51 15.97 16.29
20 13.68 14.08 14.46 7.39 6.43 5.96 8.11 7.64 10.06 13.81 14.58 10.56 10.78
20a 12.67 14.29 16.5 7.22 6.93 5.45 8.47 8.69 10.47 13.59 15.08 10.85 11.07
20b 14.37 14.25 14.94 7.83 6.24 5.73 8.76 8.47 9.92 14.55 14.29 10.85 11.07
30 24.92 20.89 26.25 31.43 34.45 25.04 24.75 40.26 28.14 34.75 29.09 29.67

Breckland Council
LAQM Progress Report 2013 20
Site ID/Location
Site Type Within AQMA? Triplicate & Co-located
Tube
Full Calendar Year Data Capture 2012 (Number of Months
or %) a
2012 Annual Mean Concentration (µg/m
3) - Bias
Adjustment factor = 1.02
b
A1 Urban centre N N 100 31.67
A2 Urban b’ground N N 100 12.47
D1 Urban centre N N 100 31.25
D2 Urban b’ground N N 83 18.20
D3 Urban centre N N 100 30.87
S1 Urban centre N N 100 25.49
S2 Suburban b’ground N N 100 11.90
S3 Urban roadside N Y 100 30.23
S3a Urban roadside N Y 100 32.47
S3b Urban roadside N Y 100 32.79
S4 Urban roadside N N 100 27.34
S5 Urban roadside N N 100 30.48
S6 Urban roadside N N 100 35.38
S7 Urban roadside N N 100 36.02
S8 Urban roadside N N 100 38.75
S9 Urban roadside N N 100 28.62
S10 Urban roadside N N 75 28.13
S11 Urban roadside N N 100 35.16
S12 Urban roadside N N 83 35.20
S13 Urban roadside N N 83 35.32
S14 Urban centre N N 83 27.29
T1 Urban roadside N N 75 28.66
T2 Urban roadside N N 100 25.90
T3 Rural N N 100 19.91
W1 Rural N N 100 24.44
W2 Rural N N 100 16.29
20 Rural N Y 100 10.78
20a Rural N Y 100 11.07
20b Rural N Y 100 11.07
30 Rural b’ground N N 100 29.67
Table 2.8 Sites by Type

Breckland Council
LAQM Progress Report 2013 21
Table 2.9 Results of NO2 Diffusion Tubes (2008 to 2012)
Site ID Site Type
Within AQMA?
Annual Mean Concentration (µg/m3) - Adjusted for Bias a
2009* (Bias Adjustment
Factor = 0.94)
2010* (Bias Adjustment
Factor = 1.04)
2011 (Bias Adjustment
Factor = 0.99)
2012 (Bias Adjustment Factor =
1.02)
S8 Roadside N 39.64 40.03 40.4 38.75
Breckland Council
LAQM Progress Report 2013 22
2.2.3 Particulate Matter (PM10)
Particulate monitoring is only carried out at the East Wretham site.
There has been no exceedence of the annual mean of 40ug/m3. There have been 3
exceedences of the daily objective of 50ug/m3 but 35 are permitted. All data has
been corrected using the Kings College Volatile Correction Model (VCM) as carried
out by Air Quality Data Management (AQDM).
The monitoring site is representative of public exposure with a house at the site and
walkers being present at the nearby National Nature Reserve and SSSI.
Breckland Council
LAQM Progress Report 2013 23
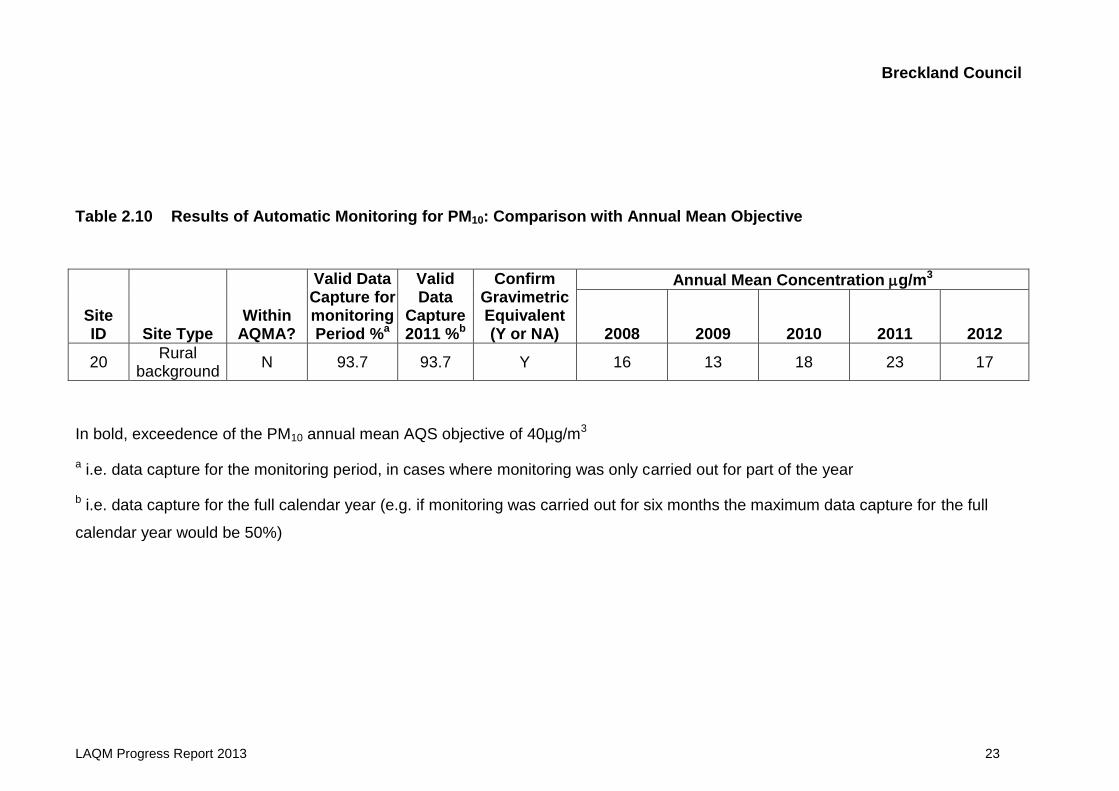
Table 2.10 Results of Automatic Monitoring for PM10: Comparison with Annual Mean Objective
Site ID Site Type
Within AQMA?
Valid Data Capture for monitoring Period %a
Valid Data
Capture 2011 %b
Confirm Gravimetric Equivalent (Y or NA)
Annual Mean Concentration g/m3
2008 2009 2010 2011 2012
20 Rural
background N 93.7 93.7 Y 16 13 18 23 17
In bold, exceedence of the PM10 annual mean AQS objective of 40µg/m3
a i.e. data capture for the monitoring period, in cases where monitoring was only carried out for part of the year
b i.e. data capture for the full calendar year (e.g. if monitoring was carried out for six months the maximum data capture for the full
calendar year would be 50%)
Breckland Council
LAQM Progress Report 2013 24
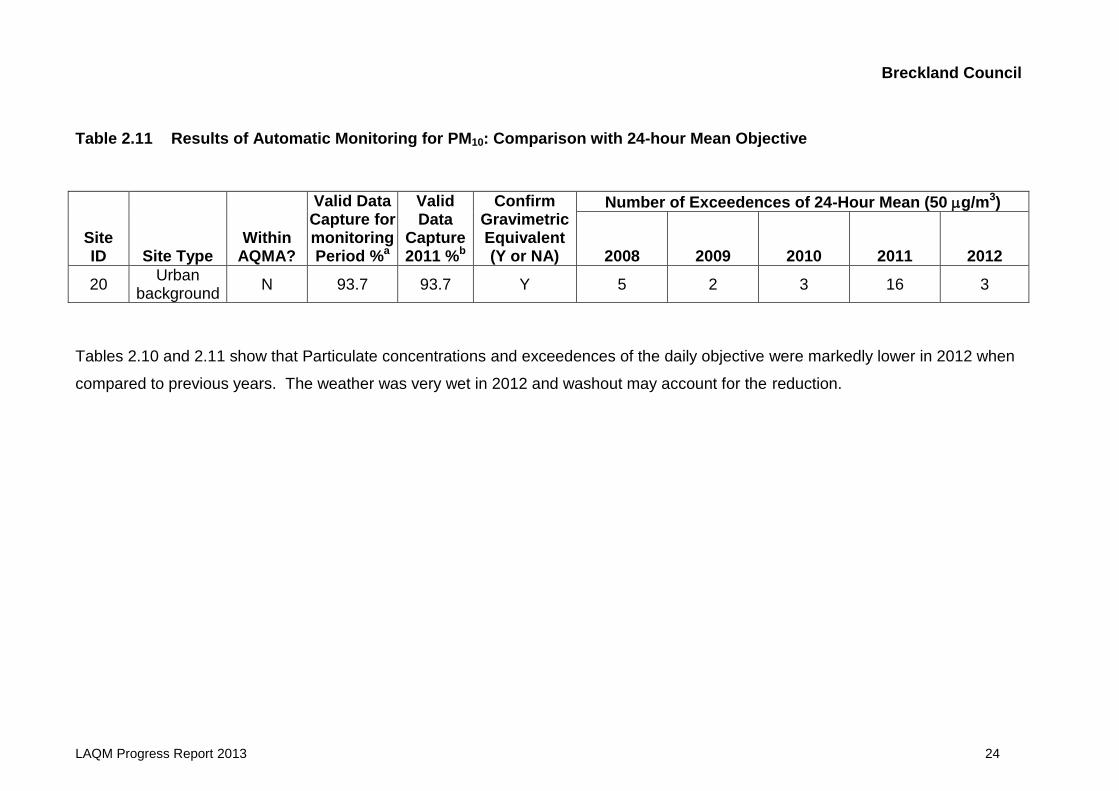
Table 2.11 Results of Automatic Monitoring for PM10: Comparison with 24-hour Mean Objective
Site ID Site Type
Within AQMA?
Valid Data Capture for monitoring Period %a
Valid Data
Capture 2011 %b
Confirm Gravimetric Equivalent (Y or NA)
Number of Exceedences of 24-Hour Mean (50 g/m3)
2008 2009 2010 2011 2012
20 Urban
background N 93.7 93.7 Y 5 2 3 16 3
Tables 2.10 and 2.11 show that Particulate concentrations and exceedences of the daily objective were markedly lower in 2012 when
compared to previous years. The weather was very wet in 2012 and washout may account for the reduction.

Breckland Council
LAQM Progress Report 2013 25
2.2.4 Sulphur Dioxide (SO2)
There is no monitoring of sulphur dioxide undertaken in Breckland …
2.2.5 Benzene
There is no benzene monitoring carried out in Breckland.
2.2.6 Other Pollutants Monitored
Breckland Council carries out monitoring of ozone and the results are as set out in
the Air Quality Report carried out by AQDM in Table 2.3 above. The data capture in
2012 was not good due to data logging issues. The period of monitoring shows that
there were 16 exceedences of the daily maximum running mean of >100ug/m3.
Although not set in the UK regulations there is an EU target of 100 μg/m3 8 hour
mean not to be exceeded more than 10 times per year.
Tropospheric, or ground level ozone, is not emitted directly into the air, but is created
by chemical reactions between oxides of nitrogen (NOx) and volatile organic
compounds (VOC). Ozone can be transported long distances by wind and this
means that even rural areas can experience high ozone levels that we see at East
Wretham.

Breckland Council
LAQM Progress Report 2013 26
2.2.7 Summary of Compliance with AQS Objectives
Breckland Council has examined the results from monitoring in the district.
Concentrations are all below the objectives, therefore there is no need to proceed to
a Detailed Assessment.
Breckland Council
LAQM Progress Report 2013 27
3 New Local Developments
There are no new local developments that have not been considered in earlier
reports.
3.1 Road Traffic Sources
There are no new road traffic sources in Breckland.
3.2 Other Transport Sources
There are no new non-road transport sources in Breckland. In the previous assessment it was reported that a diffusion tube for NO2 had been sited near the Mid Norfolk Railway yard. Table 2.5 shows that the annual mean for site D2 is 18.2ug/m3
and is not likely to be of concern for NO2.
3.3 Industrial Sources
There are no new or proposed Industrial installations for which an air quality assessment has been carried out or existing installations where emissions have increased substantially or new relevant exposure has been introduced.
3.4 Commercial and Domestic Sources
In 2012 and 2013 there have been several planning applications for larger biomass combustion plant and for sites where there will be multiple units aggregating to more that 1 MW . These are noted and monitoring of NO2 is proposed for these sites as well as particulate matter. Progress will be reported in the next assessment.
3.5 New Developments with Fugitive or Uncontrolled Sources
There are no new sources of uncontrolled or fugitive emissions of particulate matter in locations that have relevant receptors.
Breckland Council confirms that there are no new or newly identified local developments which may have an impact on air quality within the Local Authority area. Breckland Council confirms that all the following have been considered:
Road traffic sources
Other transport sources
Industrial sources
Commercial and domestic sources
New developments with fugitive or uncontrolled sources.

Breckland Council
LAQM Progress Report 2013 28
4 Local / Regional Air Quality Strategy
Information is being submitted to the Council in order that a decision can be made on
the direction it wishes to pursue on Air Quality in future. The decision will be made
when the result of the consultation on the future of the LAQM regime is announced.

Breckland Council
LAQM Progress Report 2013 29
5 Conclusions and Proposed Actions
5.1 Conclusions from New Monitoring Data
New monitoring data has been obtained in Dereham with regard to the railway and
stationary engines. It has shown that this is not likely to lead to an exceedence of
either the hourly or annual NO2 objective.
5.2 Conclusions relating to New Local Developments
There are new local developments in progress in Swaffham that are likely to impact
on air quality in the town. It is proposed to continue monitoring until the
developments are completed so that the impact can be measured. There are similar
proposals for Attleborough and the diffusion tube network is hoped to be expanded to
assess the impact of traffic in the town.
Where appropriate, any new development is subject to an air quality assessment so
that the impact can be considered and mitigation measure implemented where
possible.
5.3 Proposed Actions
The Detailed Assessment for Swaffham showed that there was an exceedence in
2011 and the 2012 results showed a small decrease and no exceedence. It is
possible that the slow upward trend, outlined in the 2012 USA, has been affected by
weather (washout of pollutants in the extremely wet summer) and the loss of one
month of data in July. One year of a slightly lower result is not enough to cease
monitoring so it is proposed to continue until the new developments are completed.
Breckland will continue to work with other Local Authorities and external agencies to
ensure that any opportunity to improve air quality is taken.

Breckland Council
LAQM Progress Report 2013 30
6 References
LAQM TG(09) (2009), Local Air Quality Management Technical Guidance LAQM.TG(09). DEFRA publications London
Breckland Council, (1999) Stage One air quality review and assessment. Breckland Council technical library - Dereham office
Breckland Council, (2000) Stage two air quality review and assessment. Breckland Council technical library – Breckland Council Website
Breckland Council, (2004) Detailed Assessment for PM10. Breckland Council Website
Breckland Council, (2007) Progress Report. Breckland Council Website
Breckland (2009) Site Operator’s Manual for the Breckland Air Quality Monitoring Sites February 2009 Breckland Council Website
Breckland Council, (2010) Progress Report. Breckland Council Website
Breckland Council, (2011) Progress Report. Breckland Council Website
Breckland Council, (2012) Upgrading and Screening Assessment. Breckland Council Website
Bureau Veritas, (2012) Detailed Assessment for Swaffham. Breckland Council Website
DEFRA (2003) The Air Quality Strategy for England, Scotland, Wales and Northern Ireland: Addendum. Defra Publications: London
Defra and the Devolved Administrations 2009 Site Operators Manual Automatic Urban and Rural Network Report No: AEAT/ENV/R2750 March 2009 viewed at http://www.airquality.co.uk/reports/empire/lsoman/lsoman.html
Loader, A., and Targa, J., (2008) Diffusion Tubes for Ambient NO2 Monitoring: Practical Guidance for Laboratories and Users. AEAT/ENV/R/2504 - Issue 1a
Wood, C., (2010) Air Quality in Swaffham May 2010 (updated June 2010)

Breckland Council
LAQM Progress Report 2013 31
Appendices
Appendix A: QA:QC Data
Diffusion Tube Bias Adjustment Factors Tubes supplied by Gradko International Ltd using 20% TEA in water.
East Wretham Collocation
Swaffham Collocation
Factor from Local Collocation Studies Bias factor used is 1.02 based on 12 months of ratified data for Swaffham site.
Breckland Council
LAQM Progress Report 2013 32
PM Monitoring Adjustment Kings College VCM model used. QA/QC of diffusion tube monitoring Quality Control Procedures for Monitoring NO2 1 Diffusion Tube Monitoring
The diffusion tube network exposes each set of diffusion tubes to the atmosphere for approximately 4 weeks. Care is taken with the storage, handling and analysis of the tubes. All the diffusion tubes are stored in air tight bags under refrigerated conditions prior to use and used within the expiry date. Upon collection, the date, site and times are recorded. These tubes are then individually stored in sealed bags.
On the day of collection, the tubes are sent to Gradko International Limited for analysis, together with an unexposed tube as a blank ‘control’. The tubes are then collected and analysed by Gradko International Limited, in accordance with a quality control procedure.
Gradko adopt the following procedures, to ensure the results of the analysis are within the accepted accuracy range:-
Prior to each tube analysis undertaken, nitrite solutions ranging from 1-2ppm made up from a standard stock solution are run and checked against a calibration graph.
Every month a full range of nitrite standard solutions ranging from 0.5-4ppm are measured and compared against the instrument calibration graph.
Periodically, samples of tubes prepared for exposure are spiked with known concentrations of nitrite solution and measured. Blank tube values are also monitored from each new batch of tubes prepared.
Once per month, a stock solution containing a known amount of nitrite, is received from AEA Technology Environment and measured. The results are used as part of the UK NO2 Survey QA/QC Scheme. This stock solution is then used by Gradko to check the u.v. spectrophotometer calibration graph.
The accuracy of the measurements made by Gradko are also monitored by participation in an external laboratory measurement proficiency scheme, the ‘Workplace Analysis Scheme For Proficiency’ (WASP), implemented by the Health and Safety Laboratory, Sheffield. The current limit of detection is quoted as 0.004μg with an uncertainty of measurement of +/- 3.69%. The analysis is carried out in accordance with Gradko International Ltd, Internal Laboratory Quality Procedure GLM 5, and within their U.K.A.S.Accreditation Schedule.

Breckland Council
LAQM Progress Report 2013 33
The values are blank corrected, using blank “control” diffusion tubes provided by Breckland Council.
2 Data Ratification
All diffusion tube data is checked on a monthly basis to identify any spurious data and compared with other local monitoring sites to further identify any suspect data.
3 NOx Continuous Analyser
Data is downloaded each 4 hours from the Wretham and Swaffham analysers and checked daily for any spurious or missing data. Data for Wretham is rescaled from the generated raw data from the analyser, using calculated instrument span factors:
Instrument sensitivity, F=c/(Vs-Vz) Where c is the concentration of the calibration span gas, Vs is the span response and Vz the zero response.
The pollutant concentration is then calculated as follows: Pollutant concentration = F(Va-Vz). Where Va is the instrument ambient air response. The final NO2 concentration = NOx concentration - NO concentration.
3.1 Data Handling and Ratification
Data handling Raw data is downloaded via a modem connection and Envidas software into an Envidas database or excel files. This is checked daily by AQDM
Data ratification The raw data set is retained and the rescaled data is examined for suspicious
and spurious data. Data is also checked for reliability and consistency and any suspect data is deleted.
All LSO work is carried out in-house. Ratification and scaling for the
Swaffham and Wretham site is carried out by AQDM. AEAT, carry out the 6 monthly site audit for Swaffham.
Breckland Council
LAQM Progress Report 2013 34
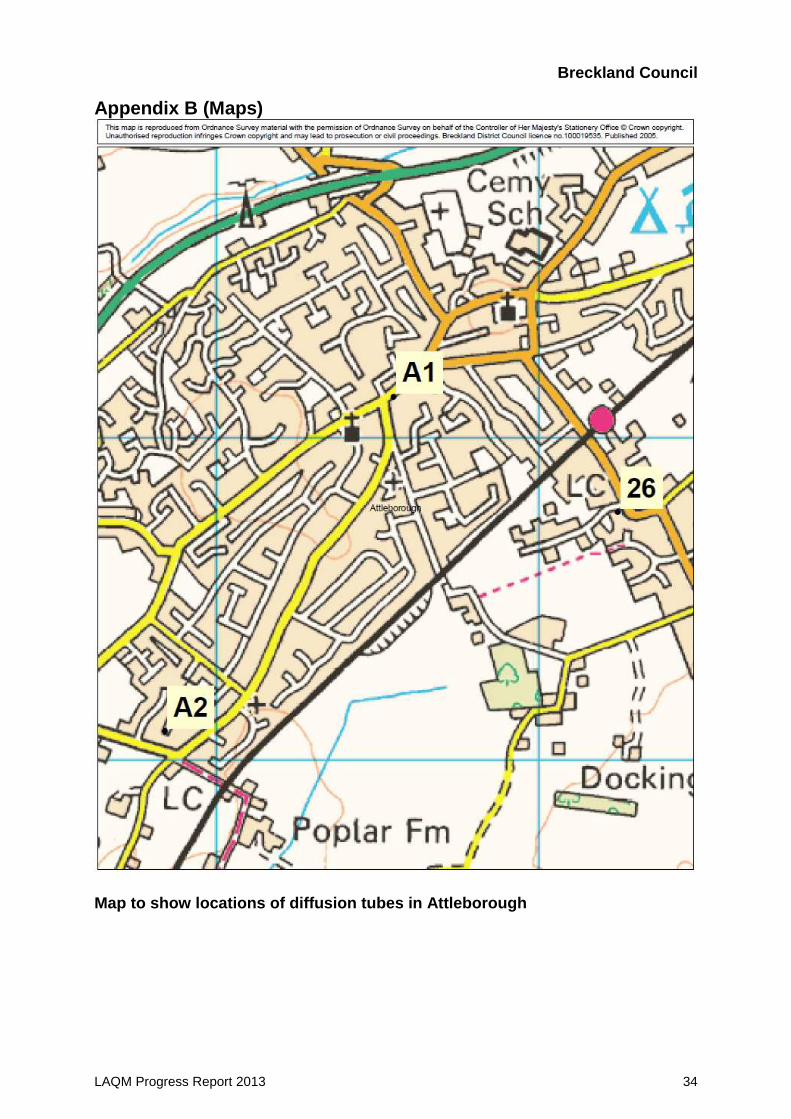
Appendix B (Maps)
Map to show locations of diffusion tubes in Attleborough

Breckland Council
LAQM Progress Report 2013 35
Appendix C
Map to show locations of diffusion tubes in Dereham

Breckland Council
LAQM Progress Report 2013 36
Appendix D

Breckland Council
LAQM Progress Report 2013 37
Appendix E
Map to show locations of diffusion tubes in Thetford
Breckland Council
LAQM Progress Report 2013 38
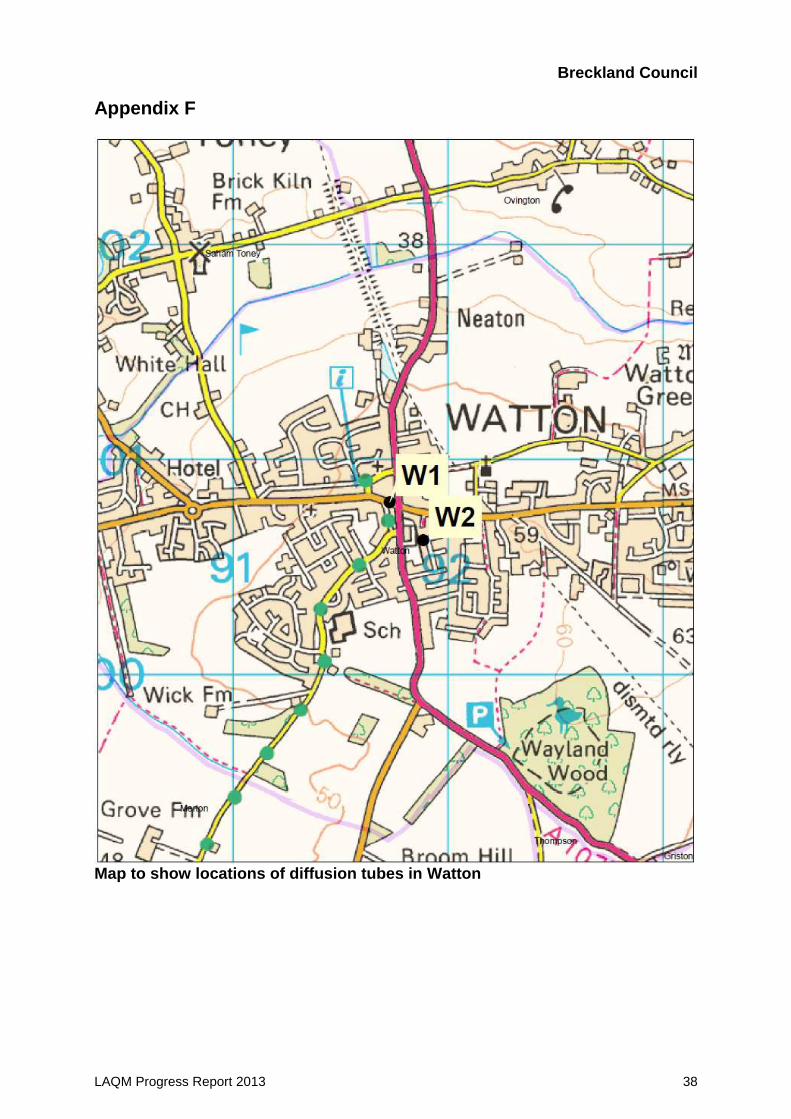
Appendix F
Map to show locations of diffusion tubes in Watton

Breckland Council
LAQM Progress Report 2013 39
Appendix G
Map to show locations of diffusion tubes and continuous analysers in East Wretham
Location of diffusion tubes 20/20a/20b and continuous
analysers