AIR QUALITY IN BENGALORE - cdn.cseindia.orgcdn.cseindia.org/userfiles/kspcb-presentation.pdf · AIR...
39
KARNATAKA STATE POLLUTION CONTROL BOARD B.M. Prakash, BE,ME, (Phd) Environmental Officer AIR QUALITY IN BENGALORE M.N.Yoganand, BE,MTec. Environmental Officer
Transcript of AIR QUALITY IN BENGALORE - cdn.cseindia.orgcdn.cseindia.org/userfiles/kspcb-presentation.pdf · AIR...

KARNATAKA STATE POLLUTION CONTROL BOARD
B.M. Prakash, BE,ME, (Phd)
Environmental Officer
AIR QUALITY IN BENGALORE
M.N.Yoganand, BE,MTec.
Environmental Officer

AIR QUALITY MONITORING
• AAQM is required to determine
– Existing quality of air.
– Evaluation of the effectiveness of control program.
– To Identify areas in need of restoration and their prioritization

Objectives of AQM
• Background data.
• Status & trend Evaluation.
• Environment exposure level determination.
• Scavenging Behavior of Environment.
• Air quality management.

Karnataka Scenario
• AAQM started in the year 1983 with 2 stations.
• 30 NAMP stations in the state ( 09 in Bangalore)
• 5 AQM stations under Board Programme
• 2 CAAQM by KSPCB and 3 CAAQM stations by CPCB in Bangalore.
• 17 cities under AAQM Programme.
• Monitoring involving PM10, PM2.5,NOx, Sox, NH3 & Lead.

National Ambient Air Quality Standards
Sl No.
Pollutant
Time Weighted
average
Concentration in Ambient Air
Methods of Measurement
Industrial,
Residential,
Rural and other
area
Ecologically
Sensitive area
(notified by
Central
Government)
1 Sulphur Dioxide (SO2), µg/m3 Annual
24 hours 50 80
20 80
-Improved West and Gaeke -Ultraviolet Fluorescence
2 Nitrogen Dioxide (NO2), µg/m3 Annual
24 hours 40 80
30 80
-Modified Jacob and Hochheiser (Na-
Arsenite)
-Chemiluminescence
3 Particulate Matter (size less
than 10µm) or PM10, µg/m3
Annual 24 hours
60 100
60 100
-Gravimetric
-TOEM
-Beta attenuation
4 Particulate Matter (size less
than 2.5µm) or PM2.5, µg/m3
Annual 24 hours
40 60
40 60
-Gravimetric
-TOEM
-Beta attenuation
5 Ozone (O3), µg/m3 8 hours 1 hour
100 180
100 180
-UV Photometric
-Chemiluminescence
-Chemical method
6 Lead (Pb), µg/m3 Annual
24 hours 0.5 1.0
0.5 1.0
-AAS/ICP method after sampling on
EPM 2000 or equivalent filter paper
-ED-XRF using Teflon filter

Sl No.
Pollutant
Time Weighted
average
Concentration in Ambient Air
Methods of Measurement
Industrial,
Residential,
Rural and other
area
Ecologically
Sensitive area
(notified by
Central
Government)
7 Carbon monoxide (CO),
mg/m3
8 hours
1 hour
02
04
02
04
-Non-Dispersive Infra-Red (NDIR)
8 Ammonia (NH3), µg/m3 Annual
24 hours
100
400
100
400
-Chemiluminescence
-Indophenol blue method
9 Benzene (C6H6), µg/m3 Annual 05 05
-Gas chromatography based
continuous analyzer
-Adsorption and Desorption
followed by GC analysis
10 Benzo(a) Pyrene (BaP)-
particulate phase only, ng/m3
Annual
01 01
-Solvent extraction followed by
HPLC/GC analysis
11 Arsenic (As), ng/m3 Annual 06 06
-AAS/ICP method after
sampling on EPM 2000 or
equivalent filter paper
12 Nickel (Ni), ng/m3 Annual 20 20
-AAS/ICP method after
sampling on EPM 2000 or
equivalent filter paper
Cont.
Source: CPCB, 2009

1 TERRI Office, Domlur, Bangalore
2 Amco Batteries (Admin Block), Mysore Rd, Bangalore
3 Victoria Hospital (On Roof top of Plastic Surgery Ward - 1st Floor)
4 Yeshwanthpur Police Station, Bangalore
5 Graphite India Ltd., Mahadevapura Main Road, Bangalore
6 Jnana Bharathi Campus, Environment Science Dept. University of Bangalore
7 RV College of Engineering, Bangalore
8 RO Building, Urban Eco Park, Peenya Industrial Area, Bangalore
9 KHB Industrial Area, Yelahanka (RR Foundries Premises), Bangalore
10 KSPCB Building, Tumkur
11 Regional Office, Kolar
12 Intake well of HPF, Harihar
13 Moti Talkies, Gandhi Circle, Davanagere
14 Regional Office, Davanagere
15 Regional Office, Dharawad
16 Gokul Road, Opp. New Bus stop, Hubli
17 KSPCB Building, Hebbal Industrial Area, Mysore
18 KSRTC Bus Stand, KR Circle, Mysore
19 Regional Office, Bagalkote
20 Regional Office, Belagaum
21 Regional Office, Bidar
22 Regional Office, Chitradurga
23 Govt. Hospital, Gulbarga
24 Regional Office, Hassan
25 Karwar Post Office, Baithkol, Karwar
26 Regional Office, Mandya
27 M/s Segment Scientific Ltd., (Bulk Drug Unit) Baikampady Industrial Area, Mangalore
28 Regional Office, Raichur
29 Visvesvaraya Iron and Steel Plant Ltd., (Oxygen Plant) Bhadravathi Shimoga
30 KSPCB Building, Bijapur
National Air Monitoring Programme (NAMP) in Karnataka

Board’s Ambient Air Quality Monitoring Programme
Sl. No. Name of the Board Station
1 Banasawadi Police Station
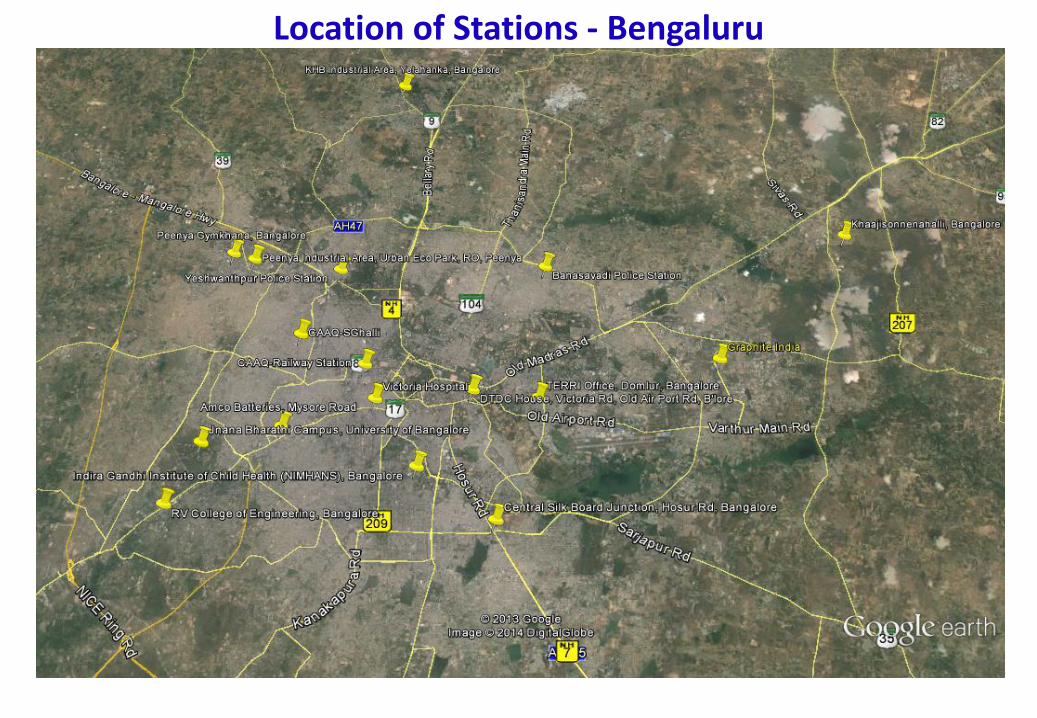
2 DTDC House, Victoria Road, Old Air Port Road, Bangalore
3 Central Silk Board Junction, Hosur Road, Bangalore
4 Indira Gandhi Institute of Child Health (NIMHANS), Bangalore
5 Kaji Sonnenahalli, B'lore
6 Peenya Gymkhana , Peenya, Bangalore
7 City Corporation office Building, Bellary
8 Regional Office, Bellary
9 Regional Office, Chamarajanagara
Sl.
No. Name of the CAAQM Station
1 City Railway Station, Bangalore
2 Regional Office Complex, KSPCB, SG Halli, Bangalore
Continuous Ambient Air Quality Monitoring Stations (CAAQMS)
Location of Stations - Bengaluru

Industrial Zone of Bangalore city

Industrial Zone of Bangalore city

Industrial Zone of Bangalore city

Residential, Rural & Other areas of Bangalore city

Residential, Rural & Other areas of Bangalore city

Residential, Rural & Other areas of Bangalore city
Residential, Rural & Other areas of Bangalore city

Residential, Rural & Other areas of Bangalore city

Residential, Rural & Other areas of Bangalore city

Residential, Rural & Other areas of Bangalore city

CAAQMS at City Railway station
Pollutants: SO2, NOX, CO and RSPM


PM10 %
Contribution NOx
%
Contribution SO2
%
Contribution
Transport 22.4 42 146.4 67.4 2.31 15.8
Road dust 10.9 20 0.0 - 0.0 -
Domestic 1.8 3 2.73 1.2 0.68 4.6
DG Set 3.6 7 50.96 23.3 3.35 23.0
Industry 7.8 14 17.19 7.9 8.21 56.2
Hotel 0.1 - 0.20 0.09 0.02 0.01
Construction 7.7 14 0.0 - 0.0 -
Total 54.4 100 217.4 100 14.6 100
Source Apportionment Study: Total Emission Loads (TPD)
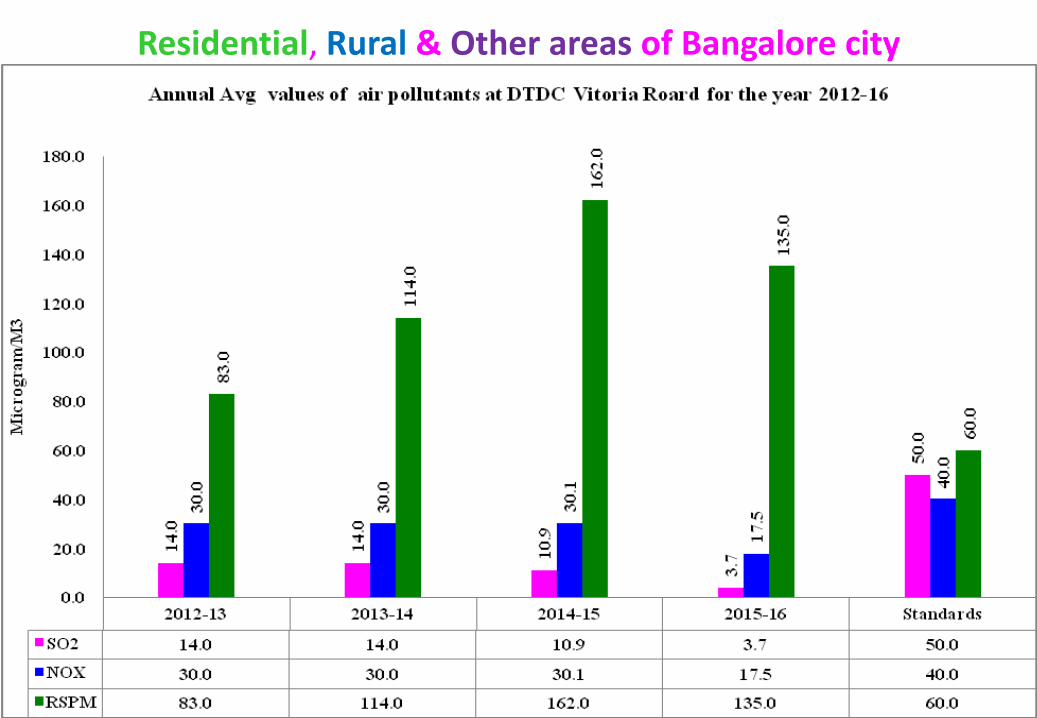
Emission Factors for Indian Vehicles
Sl.
No
Type of
vehicle
Emission factor : Grams/KM
CO HC NOx CO2 PM
1 Scooter 3.02 2.02 0.03 29.62 0.046
2 Three wheeler
(diesel ) 2.09 0.16 0.69 173.8 0.34
3 Cars 0.06 0.08 0.28 148.7 0.15
4 HCV Diesel Bus 3.97 0.26 6.77 735.5 1.075
0.4 g*35 lakhs vehicle- 1.4 ton

Time Series Trends : Sulphur Reduction Programme of India
SO2 Concentration in
µg/M3 at AMCO Batteries , Mysore Road
1998-99 38.0
1999-00 32.0
2000-01 26.0
2001-02 27.0
2002-03 16.0
2003-04 16.7
2004-05 17.6
2005-06 21.2
2006-07 15.3
2007-08 15.9
2008-09 14.9
2014=15 9.0
Standards 60
Aug 1997
0.25 %
1998 0.25 in Metro cities
2000 0.25 in Entire country
2000-04 0.05 % in 11 cities
2005 0.035 % in 11 cities
April 2010
0.005 % in 11 cities and 0.035 % entire country
130117104917865523926131
50
40
30
20
10
0
Month
SO
2 (
mic
ro
gm
/ c
um
)
MAPE 51.1664
MAD 6.2566
MSD 86.4139
Accuracy Measures
Actual
Fits
Trend
Forecasts
Variable
AMCO BATTERIES SO2 (48)Multiplicative Model
Concentration of SO2 showing an decreasing trend by 15 -20 % over 10 years due to
implementation of Sulphur reduction programme of Govt of India ( Green Fuel concept).
130117104917865523926131
80
70
60
50
40
30
20
10
0
Month
NO
x (
mic
ro g
m/
cu
m)
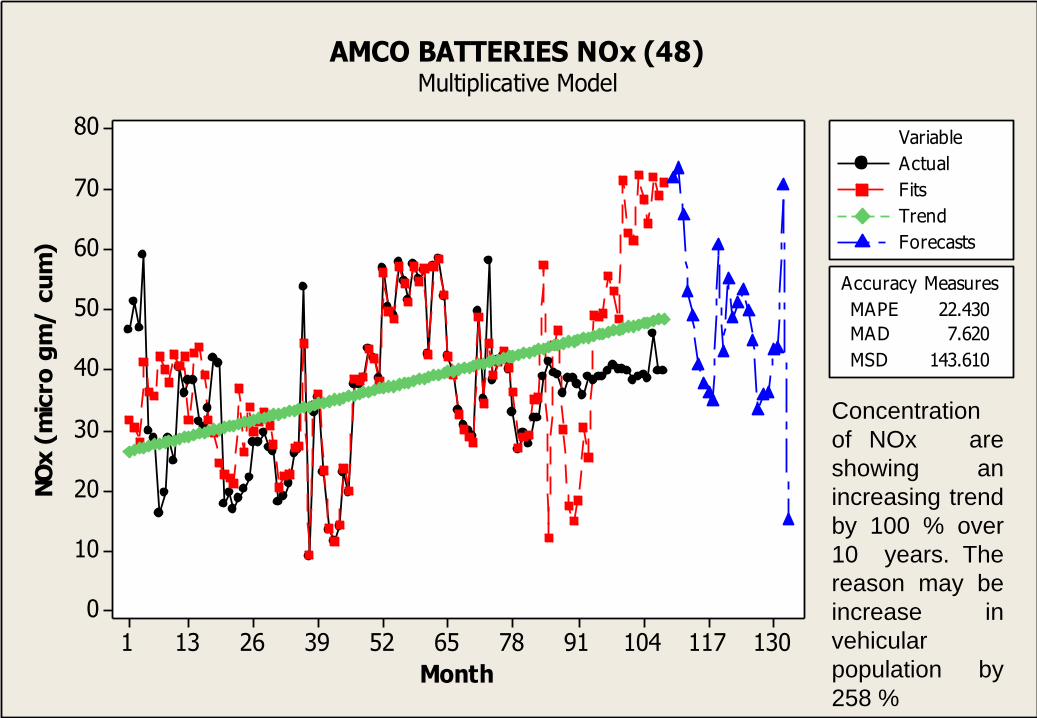
MAPE 22.430
MAD 7.620
MSD 143.610
Accuracy Measures
Actual
Fits
Trend
Forecasts
Variable
AMCO BATTERIES NOx (48)Multiplicative Model
Concentration
of NOx are
showing an
increasing trend
by 100 % over
10 years. The
reason may be
increase in
vehicular
population by
258 %

130117104917865523926131
160
140
120
100
80
60
40
20
Month
RS
PM
(m
icro
gm
/ c
um
)
MAPE 24.489
MAD 13.618
MSD 390.993
Accuracy Measures
Actual
Fits
Trend
Forecasts
Variable
AMCO BATTERIES RSPM (48)Multiplicative Model
Concentration of
RSPM for this site
is showing a
moderate 16-20%
increase in trend
over 10 years. The
reason might be
resuspension of
road dust,
vehicular traffic,
etc.

Action taken

PIL in Hon’ble High Court of Karnataka
• Suo-Moto Public Interest Litigation WP No. 39432/2013.
• Board issued direction under Section 31(A) of the Air (Prevention and Control of Pollution ) Act, 1981 to BBMP, Traffic Police, Transport Commissioner and BDA to take steps to control air pollution and reduce noise levels in Bangalore

Directions to Transport Department • To restrict registration of new vehicles
• To ban the entry of Heavy Motor Vehicles (HMVs)
• To ban the use of two stroke vehicles within BBMP area.
• To ban auto rickshaws in central business district
• To ban use of more than 15 years old HMVs
• No PUC – no fuel
• To impose heavy fine and confiscate shrill/ Air horns not confirming to MV Act.
• To plan for traffic regulation.
• Testing of Vehicular emission as well as emission testing centres.
• To convert to CNG
• Create mass awareness .

Directions to BBMP
To plan comprehensive parking management programme To remove dust/silt accumulated on roadside, storm water drain and to transport the silt removed. To fill portholes and road cutting To evacuate non-parking activities in area earmarked for parking To Remove encroachments of footpaths

Directions to Police Department:
• To strictly enforce the provisions of the Noise (Regulation & Control) Rules, 2000 & the Orders issued by State Government of the No. FEE 46 ENV 2000, dated 13.8.2002.
• To plan for regulating the traffic.
• To coordinate with BBMP and Transport department
• To remove encroachment of footpaths.
• To introduce dedicated bus lanes
• To conduct awareness programmes regarding “No honking”.
Directions to BDA:
• To take up massive afforestation

Recommended Minimum Number of Stations
Pollutant Population of evaluation Area Minimum No. Of AAQM Station
PM
< 1,00, 000 4
1,00,000 – 10,00,000 4 + 0.6 per 1,00,000 Population
10,00,000 – 50,00,000 7.5 + 0.25 per 1,00,000 Population
> 50,00,000 12 + 0.16 per 1,00,000 Population
SO2
< 100 000 3
100 000 – 1000 000 2.5 + 0.5 per 100 000 Population
1000 000 – 10 000 000 6 + 0.15 per 100 000 Population
> 10 000 000 20
NO2
< 100 000 4
100 000 – 1000 000 4 + 0.6 per 100 000 Population
> 1000 000 10
CO
< 100 000 1
100 000 – 5 000 000 1 + 0.15 per 100 000 Population
> 5 000 000 6 + 0.05 per 100 000 Population
Oxidants -do- -do-
(Source: IS : 5182 (Part 14), 2000)

Distribution of Sampling Station
Source – WHO, 1977

Scope for New stations - Bengaluru

Way Forward
Installation and Collection of Metrological DATA Use of Air Quality Modeling to assess the Pollutants Establishment of New AAQM Stations based on Population in phase
manner. Establishment of Continuous AAQM at Mysore, Mangalore,
Dharward, Bellary, Gulbarga, Shimoga, Tumkur & other cities. Establishment of AAQM Stations at Industrialized Towns such as
Nanjanagud, Hassan, Udupi, Bhadravathi, Sandur, Hospet, Hoskote, Dabaspet, Dodballapur, Anekal etc.,
Strengthening of all the laboratory. Strengthening AAQM Cell .

THANK YOU….