Air Quality and Greenhouse Gas Assessment · Proprietary information for Evolution Mining (Cowal)...
96
APPENDIX F Air Quality and Greenhouse Gas Assessment COWAL GOLD OPERATIONS PROCESSING RATE MODIFICATION Environmental Assessment 2018
Transcript of Air Quality and Greenhouse Gas Assessment · Proprietary information for Evolution Mining (Cowal)...

APPENDIX FAir Quality and Greenhouse Gas Assessment
COWAL GOLD OPERATIONS
PROCESSING RATE MODIFICATION
Environmental Assessment
2018
www.pacific-environment.com
Report
Cowal Gold Operations Modification 14 –
Air Quality & Greenhouse Gas Assessment
Document Control Number: AQU-NW-005-21396C
Date: 26 March 2018

Evolution Mining (Cowal) Pty Limited
Document Control Number: AQU-NW-005-21396C
00904218-009
Proprietary information for Evolution Mining (Cowal) Pty Limited only. Property of Pacific Environment Limited.
i
Project Name: Cowal Gold Operations Modification 14 –
Air Quality & Greenhouse Gas
Assessment
Document Control Number: AQU-NW-005-21396C
Prepared For: Evolution Mining (Cowal) Pty Limited
Approved For Release By: Jane Barnett
Disclaimer & Copyright: This report is subject to the copyright
statement located at www.pacific-
environment.com © Pacific Environment
Pty Ltd ABN 86 127 101 642
Version Date Comment Prepared by Reviewed by
Draft 01 02/02/2018 Draft 1 Russ Francis Jane Barnett
Draft 02 14/02/2018 Draft 2 Russ Francis Jane Barnett
Draft 03 09/03/2018 Draft 3 Russ Francis Jane Barnett
Final 26/03/2018 Final Russ Francis Jane Barnett
Adelaide
The Hub, 5 Peel Street
Adelaide SA 5000
Ph: +61 8 8332 0960
Brisbane
Level 4, 201 Leichhardt Street,
Spring Hill, Qld 4000
Ph: +61 7 3004 6400
Melbourne
Level 6, 99 King Street
Melbourne, VIC 3000
Ph: +61 3 9111 0021
Perth
Level 18, 140 St Georges Terrace
Perth WA 6000
Ph: +61 8 9481 4961
Sydney Head Office
Level 15, 309 Kent Street
Sydney, NSW 2000
Ph: +61 2 8584 8888

Evolution Mining (Cowal) Pty Limited
Document Control Number: AQU-NW-005-21396C
00904218-009
Proprietary information for Evolution Mining (Cowal) Pty Limited only. Property of Pacific Environment Limited.
ii
Executive summary
Pacific Environment Limited has been engaged by Evolution Mining (Cowal) Pty Limited (Evolution), to complete
an Air Quality and Greenhouse Gas Assessment for the Cowal Gold Operations (CGO) Modification 14 (the
Modification). The Modification involves increasing the ore processing rate from 7.5 million tonnes per annum
(Mtpa) to 9.8 Mtpa, modifying the design of the two tailings storage facilities (TSFs) to form one larger TSF, which
would also accommodate mine waste rock, relocation of water management infrastructure and other ancillary
infrastructure and installation of a second crushing circuit within the existing process plant area.
Existing Environment
The CGO currently operates an air quality network consisting of 19 deposition gauges and a high volume air
sampler (HVAS) measuring total suspended particulates (TSP). These data were analysed to determine existing
air quality in the immediate vicinity of the CGO. There are currently no direct measurements made for either
particulate matter with an aerodynamic diameter of 10 micrometres (µm) or less (PM10) or particulate matter with
an aerodynamic diameter of 2.5 µm or less (PM2.5), so assumptions were made from the TSP data to estimate
these concentrations. The following background values were established and applied to the annual average
cumulative assessment:
Annual average PM2.5 concentration 5.3 micrograms per cubic metre (µg/m3)
Annual average PM10 concentration 17 µg/m3
Annual average TSP concentration 41 µg/m3
Annual average dust deposition level 2.5 grams per square metre per month (g/m2/month)
Meteorological data and models used
The assessment is based on the use of a three-dimensional computer-based dispersion model to predict
ground-level dust concentrations at the nearest sensitive receptors (residences). To assess the effect that
emissions would have on existing air quality, the dispersion model predictions have been compared against the
relevant air quality criteria.
Modelling of local meteorology was undertaken using a combination of the TAPM and CALMET models.
CALMET is a meteorological pre-processor endorsed by the United States Environmental Protection Agency
(US EPA) and recommended by the New South Wales (NSW) Environment Protection Authority (EPA) for use in
complex terrain and was used to compile a representative meteorological dataset suitable for use in the plume
dispersion model CALPUFF.
Emissions
Two operating scenarios over the life of the Modification, Year 16 (2020) and Year 20 (2024), have been
assessed to represent the potential worst case air quality impacts that the Modification would have on private
residences surrounding the mine. Detailed emission inventories were prepared for the two operating scenarios
for TSP, PM10 and PM2.5, using emission factors developed by the US EPA, and consistent with the NSW EPA’s
guidance document titled Approved Methods for the Modelling and Assessment of Air Pollutants in New South
Wales (EPA, 2016) (the Approved Methods), to estimate the amount of particulate matter produced by each
activity. The emission estimates were based on the type of equipment to be used, volumes of material handled
and locations of potential wind erosion areas, and take into account information on the material properties such
as the silt and moisture contents of various materials and active haul roads between the extraction area,
stockpiles and the processing plant.

Evolution Mining (Cowal) Pty Limited
Document Control Number: AQU-NW-005-21396C
00904218-009
Proprietary information for Evolution Mining (Cowal) Pty Limited only. Property of Pacific Environment Limited.
iii
Assessment criteria
Predicted pollutant concentrations and dust deposition levels as a result of the Modification have been
determined following the Approved Methods, which also specifies the impact assessment criteria against which
these have been compared.
The assessment criteria are based on considerations of possible nuisance and health effects and provide
benchmarks, which are intended to protect the community against the adverse effects of air pollutants.
Impact assessment
Predictions were made for all private and Evolution-owned sensitive receptors within the modelling domain. No
exceedances of the incremental or annual cumulative assessment criteria were predicted at any of these
receptors.
No additional exceedances of the short-term cumulative PM10 and PM2.5 criterion are likely to occur due to the
Modification.
Construction assessment
Dust emissions from construction of the Lake Cowal Road realignment and pipeline duplication would be
effectively managed through commonly applied mitigation measures and would not be expected to generate any
significant off-site concentrations.
Greenhouse gas assessment
A greenhouse gas assessment indicates that average annual Scope 1 and 2 emissions from the Modification
(0.29 million tonnes carbon dioxide equivalent [Mt CO2-e]) would represent approximately 0.049 percent of
Australia’s commitment under the Kyoto Protocol (591.5 Mt CO2-e) and a very small proportion of global
greenhouse emissions.

Evolution Mining (Cowal) Pty Limited
Document Control Number: AQU-NW-005-21396C
00904218-009
Proprietary information for Evolution Mining (Cowal) Pty Limited only. Property of Pacific Environment Limited.
iv
Table of contents
Executive summary ................................................................................... ii
1. Introduction .......................................................................................... 1
2. Modification description ........................................................................ 1
2.1 Approved CGO ..................................................................................................... 1
2.2 The proposed Modification ................................................................................... 5
2.3 Mine schedule and modelling scenarios .............................................................. 6
3. Air quality issues and effects .............................................................. 10
4. Air quality criteria ................................................................................ 12
4.1 Impact assessment criteria ................................................................................. 12
4.2 Voluntary land acquisition and mitigation policy ................................................. 13
5. Existing environment .......................................................................... 14
5.1 Meteorology ........................................................................................................ 16
5.1.1 Representative meteorological data ............................................................ 16
5.1.2 Wind speed and direction ............................................................................ 20
5.2 Existing air quality .............................................................................................. 22
5.2.1 Dust concentration ...................................................................................... 22
5.2.2 Dust deposition ............................................................................................ 27
5.2.3 Background values ...................................................................................... 28
6. Methodology ...................................................................................... 29
6.1 Approach to assessment .................................................................................... 29
6.2 TAPM .................................................................................................................. 31
6.3 CALMET ............................................................................................................. 31
6.4 CALPUFF ........................................................................................................... 31
7. Emissions to air .................................................................................. 33
7.1 Construction emissions ...................................................................................... 33
7.2 Operational emissions ........................................................................................ 33
8. Modelling results ................................................................................ 36
8.1 Introduction ......................................................................................................... 36
8.2 Modification only ................................................................................................. 36
8.2.1 Year 16 (2020) ............................................................................................ 36
8.2.2 Year 20 (2024) ............................................................................................ 44
8.3 Cumulative annual average ................................................................................ 52
8.3.1 Year 16 (2020) ............................................................................................ 52
8.3.2 Year 20 (2024) ............................................................................................ 58
8.4 Cumulative 24-hour average .............................................................................. 64
Evolution Mining (Cowal) Pty Limited
Document Control Number: AQU-NW-005-21396C
00904218-009
Proprietary information for Evolution Mining (Cowal) Pty Limited only. Property of Pacific Environment Limited.
v
9. Greenhouse gas assessment ............................................................ 67
9.1 Introduction ......................................................................................................... 67
9.2 Methodology ....................................................................................................... 68
9.3 Greenhouse gas emission estimates ................................................................. 68
10. Monitoring and mitigation measures ................................................ 70
10.1 Monitoring ......................................................................................................... 70
10.2 Mitigation measures ......................................................................................... 70
11. Conclusions ..................................................................................... 73
12. References ....................................................................................... 74
Appendix A ............................................................................................ A-1
Appendix B ............................................................................................ B-1
Diesel ....................................................................................................................... B-2
Unleaded petrol ....................................................................................................... B-3
Propane (used as LPG) ........................................................................................... B-4
Explosives use ......................................................................................................... B-5
Electricity consumption ............................................................................................ B-6
List of Figures
Figure 2.1: Location of study area and relevant land ownership ...................................... 3
Figure 2.2: Landholder key ............................................................................................... 4
Figure 2.3: Pseudo three dimensional representation of local terrain .............................. 5
Figure 2.4: Variations in extraction rates for the life of the proposed Modification .......... 7
Figure 2.5: Conceptual general arrangement Year 16 (2020) ......................................... 8
Figure 2.6: Conceptual general arrangement Year 20 (2024) ......................................... 9
Figure 3.1: Particle deposition within the respiratory tract ............................................. 11
Figure 5.1: Locations of the CGO dust and meteorological monitoring sites ................. 15
Figure 5.2: Annual windroses for CGO from 2011 – 2016 ............................................. 17
Figure 5.3: Distribution of wind speeds for each calendar year at CGO ........................ 18
Figure 5.4: Humidity, wind speed, temperature and rainfall at CGO from 2011 – 2016 19
Figure 5.5: Annual and seasonal windroses for CGO 2015 ........................................... 21
Figure 5.6: Measured TSP and inferred PM10 data from 2005 – 2016........................... 23
Figure 5.7: Ranked inferred 24-hour average PM10 concentrations from 2005
onwards .......................................................................................................................... 24
Figure 5.8: Annual average PM2.5 and PM10 data from co-located OEH TEOMs in
NSW ............................................................................................................................... 26
Figure 6.1: Overview of modelling methodology ............................................................ 30
Figure 6.2: Landuse categories used for meteorological modelling ............................... 32
Figure 8.1: Predicted maximum 24-hour average PM2.5 concentrations in Year 16
(2020) – Modification Only .............................................................................................. 38
Figure 8.2: Predicted maximum 24-hour average PM10 concentrations in Year 16
(2020) – Modification Only .............................................................................................. 39

Evolution Mining (Cowal) Pty Limited
Document Control Number: AQU-NW-005-21396C
00904218-009
Proprietary information for Evolution Mining (Cowal) Pty Limited only. Property of Pacific Environment Limited.
vi
Figure 8.3: Predicted annual average PM2.5 concentrations in Year 16 (2020) –
Modification Only ............................................................................................................ 40
Figure 8.4: Predicted annual average PM10 concentrations in Year 16 (2020) –
Modification Only ............................................................................................................ 41
Figure 8.5: Predicted annual average TSP concentrations in Year 16 (2020) –
Modification Only ............................................................................................................ 42
Figure 8.6: Predicted annual average dust deposition in Year 16 (2020) –
Modification Only ............................................................................................................ 43
Figure 8.7: Predicted maximum 24-hour average PM2.5 concentrations in Year 20
(2024) – Modification Only .............................................................................................. 46
Figure 8.8: Predicted maximum 24-hour average PM10 concentrations in Year 20
(2024) – Modification Only .............................................................................................. 47
Figure 8.9: Predicted annual average PM2.5 concentrations in Year 20 (2024) –
Modification Only ............................................................................................................ 48
Figure 8.10: Predicted annual average PM10 concentrations in Year 20 (2024) –
Modification Only ............................................................................................................ 49
Figure 8.11: Predicted annual average TSP concentrations in Year 20 (2024) –
Modification Only ............................................................................................................ 50
Figure 8.12: Predicted annual average dust deposition in Year 20 (2024) –
Modification Only ............................................................................................................ 51
Figure 8.13: Predicted annual average PM2.5 concentrations in Year 16 (2020) –
Cumulative ...................................................................................................................... 54
Figure 8.14: Predicted annual average PM10 concentrations in Year 16 (2020) –
Cumulative ...................................................................................................................... 55
Figure 8.15: Predicted annual average TSP concentrations in Year 16 (2020) –
Cumulative ...................................................................................................................... 56
Figure 8.16: Predicted annual average dust deposition in Year 16 (2020) –
Cumulative ...................................................................................................................... 57
Figure 8.17: Predicted annual average PM2.5 concentrations in Year 20 (2024) –
Cumulative ...................................................................................................................... 60
Figure 8.18: Predicted annual average PM10 concentrations in Year 20 (2024) –
Cumulative ...................................................................................................................... 61
Figure 8.19: Predicted annual average TSP concentrations in Year 20 (2024) –
Cumulative ...................................................................................................................... 62
Figure 8.20: Predicted annual average dust deposition in Year 20 (2024) –
Cumulative ...................................................................................................................... 63
Figure 8.21: Daily predicted 24-hour average PM10 concentrations at Residence 42 ... 65
Figure 8.22: Predicted 24-hour average PM10 concentrations at Residence 42,
ranked from highest to lowest ......................................................................................... 65
Figure 8.23: Daily predicted 24-hour average PM2.5 concentrations at Residence 42 .. 66
Figure 8.24: Predicted 24-hour average PM2.5 concentrations at Residence 42,
ranked from highest to lowest ......................................................................................... 66
Figure 9.1: Overview of scopes and emissions across a reporting entity ...................... 67

Evolution Mining (Cowal) Pty Limited
Document Control Number: AQU-NW-005-21396C
00904218-009
Proprietary information for Evolution Mining (Cowal) Pty Limited only. Property of Pacific Environment Limited.
vii
List of Tables
Table 2.1: Mine schedule for the Modification .................................................................. 6
Table 4.1: NSW EPA air quality criteria for particulate matter concentrations ............... 12
Table 4.2: NSW criteria for dust deposition (insoluble solids) ........................................ 12
Table 4.3: DP&E particulate matter mitigation criteria.................................................... 13
Table 4.4: DP&E particulate matter acquisition criteria .................................................. 13
Table 5.1: Annual statistics from data collected at the CGO meteorological station ..... 20
Table 5.2: Annual average TSP and inferred PM10 concentrations from 2005 – 2016 .. 25
Table 5.3: Annual average dust deposition results from 2008 – 2016 (g/m2/month) ..... 27
Table 7.1: Estimated emissions for Year 16 (2020) ....................................................... 34
Table 7.2: Estimated emissions for Year 20 (2024) ....................................................... 35
Table 8.1: Predicted concentrations and dust deposition levels at individual
residences for Year 16 (2020) – Modification only ......................................................... 37
Table 8.2: Predicted concentrations and dust deposition levels at individual
residences for Year 20 (2024) – Modification only ......................................................... 45
Table 8.3: Predicted concentrations and dust deposition levels at individual
residences for Year 16 (2020) – Cumulative .................................................................. 53
Table 8.4: Predicted concentrations and dust deposition levels at individual
residences for Year 20 (2024) – Cumulative .................................................................. 59
Table 9.1: Summary of estimated annual average CO2-e (tonnes) ............................... 69
Table 10.1: Management methods for exposed areas dust sources ............................. 71
Table 10.2: Management measures for mining generated dust sources ....................... 72
Table B1: Estimated scope 1 CO2-e (tonnes) for diesel consumption .......................... B-2
Table B2: Estimated scope 1 CO2-e (tonnes) for unleaded petrol consumption ........... B-3
Table B3: Estimated scope 1 CO2-e (tonnes) for propane consumption ...................... B-4
Table B4: Estimated scope 1 CO2-e (tonnes) for explosive use ................................... B-5
Table B5: Estimated scope 2 CO2-e (tonnes) for electricity consumption .................... B-6

Evolution Mining (Cowal) Pty Limited
Document Control Number: AQU-NW-005-21396C
00904218-009
Proprietary information for Evolution Mining (Cowal) Pty Limited only. Property of Pacific Environment Limited.
1
1. Introduction
Pacific Environment Limited has been commissioned by Evolution Mining (Cowal) Pty Limited (Evolution), to
complete an Air Quality and Greenhouse Gas Assessment for the Cowal Gold Operations (CGO)
Modification 14 (the Modification). The purpose of this assessment is to assess potential air quality impacts and
greenhouse gas (GHG) emissions associated with Modification 14 for inclusion in the Environmental
Assessment. This assessment has been carried out to satisfy the Secretary’s Environmental Assessment
Requirements (SEARs), issued on 17 November 2017 and which reference the following guidance and policy
documents:
Approved Methods and Guidance for the Modelling and Assessment of Air Pollutants in NSW (NSW
Environment Protection Authority [EPA], 2016) (hereafter referred to as the ‘Approved Methods’).
Approved Methods for the Sampling and Analysis of Air Pollutants in NSW (NSW Department of
Environmental and Conservation [DEC], 2005).
Generic Guidance and Optimum Model Settings for the CALPUFF Modelling System for Inclusion in the
Approved Methods for the Modelling and Assessment of Air Pollutants in NSW (NSW Office of
Environment and Heritage [OEH], 2014).
Voluntary Land Acquisition and Mitigation Policy (NSW Department of Planning and Environment [DP&E],
2014).
National Greenhouse Accounts (NGA) Factors (Commonwealth Department of Environment and Energy
[DEE], 2017).
2. Modification description
The CGO is located approximately 38 kilometres (km) north-east of West Wyalong in central New South Wales
(NSW). Figure 2.1 shows the location of the CGO and nearest receptors and the list of landholders is shown in
Figure 2.2. The area is sparsely populated with the closest residence located approximately 2 km south-west of
the Mining Lease (ML) 1535 boundary. Figure 2.3 shows the local topography, which is generally flat with some
low isolated hills.
Mining operations at the CGO are approved to 31 December 2032 and are carried out in accordance with
Development Consent DA 14/98 (as modified).
Evolution proposes to modify Development Consent DA 14/98 under section 75W of the NSW Environmental
Planning and Assessment Act, 1979 (EP&A Act) to facilitate a number of changes to the CGO, including
increasing the processing rate and consolidating the two tailings storage facilities (TSFs) to form one larger
TSF.
2.1 Approved CGO
The CGO is an existing open pit gold mine that commenced in 2004 in accordance with Development Consent
DA 14/98. The major components of the CGO include an open pit, a process plant to extract gold from ore,
mine waste rock emplacement areas and two TSFs. Gold is extracted from the ore using a conventional
carbon-in-leach cyanide leaching circuit. The CGO is currently approved to produce up to approximately
5.5 million ounces of gold. Up to 7.5 million tonnes (Mt) of ore is processed per year.

Evolution Mining (Cowal) Pty Limited
Document Control Number: AQU-NW-005-21396C
00904218-009
Proprietary information for Evolution Mining (Cowal) Pty Limited only. Property of Pacific Environment Limited.
2
The CGO adopts conventional open pit mining methods using excavators, off road haul trucks and wheel and
track dozers. Blasting is generally approved for a maximum of one blast per day, although only required
approximately once every second day. Mining activities are approved to occur 24-hours per day, seven days
per week.

vv
vv
vv
vv
"
"
" "
"
"
"
"
""
"
"
"" "
"
"
"
"
"
"
"
"
"
"
"
"
"
"
"
"
"
"
"
""
"
"
"
"
"
"
"
"
"
"
"
"
"
#
#
#
###
!
NEW
ELL H
IGHW
AY
Lows Road
Edol
s Roa
d
West Plains Road
Wes
ts La
ne
Blow Clear Road
Clear
Rid
ge R
oad
Lake Cowal Road
Bewleys Road
Lake
Roa
d
Campbells Lane
Webster
s Road
Fitzger
ald Road
Bonehams Lane
Kurb
oo R
oad
Wilsons Lane
Wennings
Road
Lonergans Lane
treet
Buttenshaws Lane
Uncle Bills Road
Bogies Island Road
Corringle Lane
Stan
iforth
s Lan
e
Cadalgulee Lane
Sinc
lair
Lane
Lake Cowal Road
Lows Road
Lake Cowal Road
Sand
y Cre
ek
Jemalong No 2 Channel
Bland Creek
Manna Creek
CreekBillys
Lookout
WEST W
YALONG BURCHER RAILWAY
CORRINGLESTATE FOREST
LAKE VIEWSTATE FOREST
CLEAR RIDGESTATE FOREST
WAMBOYNE
Lakeside
Coniston
HillgroveLake Cowal(Evolution)
Fuge
Noble
Domco
Ridley
Morton
Koobah
Harmer
Dalton
Westlea
Peasley
Melrose
Maguire
Grinter
Caloola
Westella
The Glen
Lakeview
w
Gumbelah
Goodwood
Blampied
Bristowes
Bramboyne
Boongarry
Billabong
Wilga Vale
Peasley II
Fitzgerald
Bungabulla
Thistleview
Laurel Park
Lakeview II
Cowal North
Baaloo Park
Lakeview III
Foxman Downs
Mattiske (DB)
Gould (KM&LR)
Foxman Downs II
Mattiske II (RA)
Wamboyne (Grinter)
Mangelsdorf (BE&H)
Wamboyne II (Noble)
Mangelsdorf II (NA&DJ)
Lake Cowal II (Leppington)
Superb Developments Pty Ltd
1
122
1
6
33
4
6
60
36
78
31
5
5
43
1
8
93
90
73
1
62
34
36
1
43
1
1
10
32
8
59
8
107
1
66
43
66
6
1
105
4
29
28
80
22
80
42
38
24
24
43
12
89
61
15
12
52
89
8
36
25
22
1
5
20
57
93
1
22
43
21
25
62
43
12
1
28
59
50
64
109
11
21
91
64
68
109
38
83
8
1
43
5
102
92
59
30
10
43
61
64
97
43
59
95
79
68
15
109
82 59
67
97
56
43
114
72
63
58
23
12
100
119
43
63
3028
91
42
63
25
79
13
20
15
91
415
10
107
30
28
107
25
43
107
105
42
107
43
114
79
106
67
59
12
63
12
25
28
29
36
101
24
107
122
15
15
12
49
59
101
29
36
105
107
24
59
20
80
59
106
62
20
113
121
114
50101
107
106
20
49
49
72 60
Cowal GoldOperations LAKE COWAL
NERANG COWAL
BOGEYS ISLAND
BILLYS LOOKOUT
WAMBOYNE MOUNTAIN
540000
5400
00
6280000 6280000
HAL-16-41_Mod14_PRM_AppAQ_201A
Land Tenure
Figure 2-1
LEGENDMining Lease Boundary (ML 1535)Mining Lease Application (MLA 1)Evolution Mining (Cowal) Pty LimitedCrown LandLocal GovernmentPrivate LandholderState Forest
" Company-owned Dwelling" Privately-owned Dwelling
Railwayv Electricity Transmission Line
Pipeline
Refer to Figure 2-2 for Landholder Key
±GDA 1994 MGA Zone 55
0 5
Kilometres
CGO PROCESSING RATE MODIF ICAT ION
Source: Evolution (2018); © NSW Department of Finance,Services and Innovation (2017)

Source: Evolution 17 and Land and Property Information (2017)(20 )
1 Evolution Mining (Cowal) Pty Limited2 Bland Shire Council3 Graincorp Operations Limited4 BE Mattiske5 DB Mattiske6 IW Low8 PG Hammond10 SL Peasley11 RG Hammond12 The State of New South Wales13 West Plains (Forbes) Pty Limited15 HJ & WJ Buttenshaw20 WJ Buttenshaw21 AJ McClintock22 The West Pastoral Company Pty Limited23 EA & M Mangelsdorf24 BE & H Mangelsdorf25 NA & DJ Mangelsdorf27 State Rail Authority of New South Wales28 Bristowes Pastoral Pty Ltd29 NJ Fuge30 SK & RC Grinter31 JA Duff32 HE & AJ Duff33 AJ Duff34 HE Duff36 Corrie Vale Pastoral Company Pty Limited38 BR Dent42 GJ Davies43 Leppington Pastoral Co Pty Limited44 MH Duff49 CL Lee50 GF Carnegie51 HC & GK West52 HJ Buttenshaw56 RA Mattiske57 RF Harmer58 Twynam Pastoral Co Pty Limited59 Wyalong Rural Investments Pty Limited60 SJ & EP Mickan61 ML Dent62 WR Low63 Domco Trading Pty Limited64 Superb Developments Pty Ltd66 BV Tooth67 HWR McDonald68 AJR McDonald69 GLR McDonald70 KA Maguire
71 LM & TJ Mackay and LJ & RP Grayson72 KM & LR Gould73 CI Ridley74 HM Corliss and JA & FG Ridley75 The Grain Handling Authority Of New South Wales77 Country Rail Infrastructure Authority78 CF Fuller79 IO Ridley80 TG & JM Dalton81 West Wyalong Local Aboriginal Land Council82 LJ Doecke83 RJ Moore85 JM Ridley89 GM & BM Morton90 Boltefam Pty Ltd91 Zillo Investments Pty Ltd92 KA Lindner & GP Lindner93 EJ McCarthy95 JD & VH Boneham96 BY & IG Boyd97 Clevedon Properties Pty Ltd98 MM Rees100 AJ & LF Blampied101 MM & MD Carnegie102 W Goodwin103 LR Martin104 MM & MD Carnegie105 MK & RT Coles106 FR Maslin107 Marsden Minoru Pty Limited109 EH & JW Maslin113 BC & DW Rogers114 WJ Worner116 IJ Ridley118 AB & KM Maslin119 ML & CI Ridley120 Forbes Shire Council121 BJ & RK Gould122 DG Fitzgerald123 Telstra Corporation Limited124 AGL Pipelines (NSW) Pty Limited126 D Williams130 N.S.W. Grain Corporation Limited131 IH Shephard132 CR & RD McManus133 MA Squier134 JT Gray135 NA Wilson
Landholder LandholderReference
NoReference
No
CGO PROCESSING RATE MODIFICATION
Landholder Key
Figure 2-2
HAL-
16-4
1_M
od14
_PRM
_App
AQ_0
01A

Evolution Mining (Cowal) Pty Limited
Document Control Number: AQU-NW-005-21396C
00904218-009
Proprietary information for Evolution Mining (Cowal) Pty Limited only. Property of Pacific Environment Limited.
5
Figure 2.3: Pseudo three dimensional representation of local terrain
2.2 The proposed Modification
The main activities associated with the development of the Modification (and relative to air quality) include:
increasing the ore processing rate from 7.5 million tonnes per annum (Mtpa) to 9.8 Mtpa;
modification of the existing TSFs to form one larger TSF, which would also accommodate mine waste rock
(herein referred to as the Integrated Waste Landform [IWL]);
relocation of water management infrastructure (i.e. the Up-Catchment Diversion System and approved
location for contained water storage D10) and other ancillary infrastructure (e.g. internal roads and soil and
ore stockpiles) elsewhere within ML 1535 and Mining Lease Application (MLA) 1;
duplication of the existing water supply pipeline across Lake Cowal;
relocation of a travelling stock reserve (TSR) and Lake Cowal Road; and
installation of a secondary crushing circuit within the existing process plant area.

Evolution Mining (Cowal) Pty Limited
Document Control Number: AQU-NW-005-21396C
00904218-009
Proprietary information for Evolution Mining (Cowal) Pty Limited only. Property of Pacific Environment Limited.
6
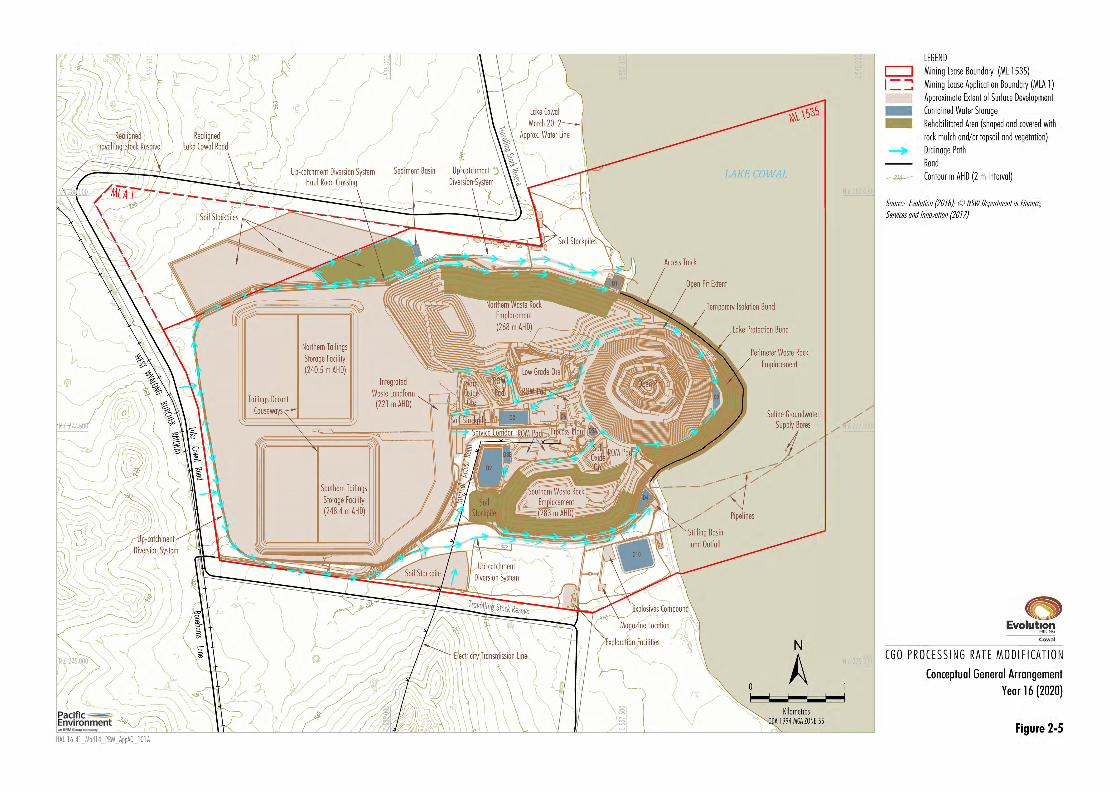
2.3 Mine schedule and modelling scenarios
A mining and processing schedule for the Modification is provided in Table 2.1. Based on this schedule, two
modelling scenarios have been developed. Year 16 (2020) was chosen as it is the year with the most activity
around the building of the IWL. Year 20 (2024) was chosen as this is the last year that both waste rock and ore
will be mined. The variations in waste rock and ore extraction rates can be seen from year to year in Figure 2.4.
Figure 2.5 and Figure 2.6 show the Year 16 (2020) and Year 20 (2024) general arrangements for the
Modification, respectively. It is noted that although Year 14 has the highest waste excavation rate, there is little
activity around the IWL and is consistent with the previously modelled Modification 13 operations.
Table 2.1: Mine schedule for the Modification
Year CGO Year Waste Rock Mined (Mt)
Ore Mined (Mt) Total Mined (Mt) Ore Processed
(Mt)
2018 14 21.3 9.5 30.8 7.4
2019 15 18.4 6.5 24.9 7.8
2020 16 20.4 5.0 25.4 7.9
2021 17 12.1 11.6 23.7 8.6
2022 18 7.3 18.2 25.5 9.4
2023 19 2.4 11.0 13.4 9.5
2024 20 0.6 12.8 13.4 9.8
2025 21 - 1.4 1.4 9.7
2026 22 - - - 9.5
2027 23 - - - 7.7
2028 24 - - - 7.7
2029 25 - - - 7.7
2030 26 - - - 9.5
2031 27 - - - 8.8
2032 28 - - - 3.3

Evolution Mining (Cowal) Pty Limited
Document Control Number: AQU-NW-005-21396C
00904218-009
Proprietary information for Evolution Mining (Cowal) Pty Limited only. Property of Pacific Environment Limited.
7
Figure 2.4: Variations in extraction rates for the life of the proposed Modification


Evolution Mining (Cowal) Pty Limited
Document Control Number: AQU-NW-005-21396C
00904218-009
Proprietary information for Evolution Mining (Cowal) Pty Limited only. Property of Pacific Environment Limited.
10
3. Air quality issues and effects
From an air quality perspective, it is important to consider the potential emissions that would occur during the
operation of the Modification. The key pollutants will be those associated with the extractive activities and will
include particulate matter.
Particulate matter has the capacity to affect health and to cause nuisance effects, and is categorised by size
and/or by chemical composition. The potential for harmful effects depends on both. The particulate size ranges
are commonly described as:
Total Suspended Particulate (TSP) – refers to all suspended particles in the air. The upper size range is
typically 30 micrometres (µm).
PM10 – refers to all particles with equivalent aerodynamic diameters of less than 10 µm, that is, all particles
that behave aerodynamically in the same way as spherical particles with diameters less than 10 µm and
with a unit density. PM10 are a sub-component of TSP.
PM2.5 – refers to all particles with equivalent aerodynamic diameters of less than 2.5 µm. These are often
referred to as the fine particles and are a sub-component of PM10.
PM2.5-10 – defined as the difference between PM10 and PM2.5 mass concentrations. These are often
referred to as coarse particles.
Evidence suggests that health effects from exposure to airborne particulate matter are predominantly related to
the respiratory and cardiovascular systems (World Health Organization, 2011). The human respiratory system
has in-built defensive systems that prevent larger particles from reaching the more sensitive parts of the
respiratory system. Particles larger than 10 µm, while not able to affect health, can soil materials and generally
degrade aesthetic elements of the environment. For this reason, air quality goals also make reference to TSP. In
practice particles larger than 30 to 50 µm settle out of the atmosphere too quickly to be regarded as air pollutants.
Both natural and anthropogenic processes contribute to the atmospheric load of particulate matter. Coarse
particles (PM2.5-10) are derived primarily from mechanical processes resulting in the suspension of dust, soil, or
other crustal materials from roads, farming, mining and dust storms. Coarse particles also include sea salts,
pollen, mould, spores, and other plant parts. Mining dust is likely to be composed of predominantly coarse
particulate matter (and larger).
Fine particles, or PM2.5, are derived primarily from combustion processes, such as vehicle emissions, wood
burning, coal burning for power generation and natural processes such as bush fires. Fine particles also consist
of transformation products, including sulphate and nitrate particles, and secondary organic aerosol from volatile
organic compound emissions. PM2.5 may penetrate beyond the larynx and into the thoracic respiratory tract and
evidence suggests that particles in this size range are more harmful than the coarser component of PM10.
The size of particles determine their behaviour in the respiratory system, including how far the particles are able
to penetrate, where they deposit, and how effective the body's clearance mechanisms are in removing them.
This is demonstrated in Figure 3.1, which shows the relative deposition by particle size within various regions of
the respiratory tract. Additionally, particle size is an important parameter in determining the residence time and
spatial distribution of particles in ambient air and is a key consideration in assessing exposure.

Evolution Mining (Cowal) Pty Limited
Document Control Number: AQU-NW-005-21396C
00904218-009
Proprietary information for Evolution Mining (Cowal) Pty Limited only. Property of Pacific Environment Limited.
11
The health-based assessment criteria used by the NSW EPA have, to a large extent, been developed by
reference to epidemiological studies undertaken in urban areas with large populations where the primary
pollutants are the products of combustion (National Environment Protection Council [NEPC], 1998a; NEPC,
1998b). This means that, in contrast to dust of crustal origin, the particulate matter from urban areas would be
composed of smaller particles and would generally contain substances that are associated with combustion.
Source: Chow, 1995
Figure 3.1: Particle deposition within the respiratory tract

Evolution Mining (Cowal) Pty Limited
Document Control Number: AQU-NW-005-21396C
00904218-009
Proprietary information for Evolution Mining (Cowal) Pty Limited only. Property of Pacific Environment Limited.
12
4. Air quality criteria
4.1 Impact assessment criteria
The Approved Methods specify air quality assessment criteria relevant for assessing impacts from air pollution.
The air quality criteria relate to the total dust burden in the air and not just the dust from proposed activities such
as mining. In other words, consideration of background dust levels needs to be made when using these criteria to
assess potential impacts.
Table 4.1 presents the air quality criteria for concentrations of particulate matter that are relevant to this study.
For PM10 and PM2.5, these are consistent with the revised National Environment Protection Measure for Ambient
Air Quality (referred to as the Ambient Air-NEPM) (NEPC, 2016). However, the NSW EPA’s criteria include
averaging periods which are not included in the Ambient Air-NEPM, and also reference other measures of air
quality, namely TSP.
Table 4.1: NSW EPA air quality criteria for particulate matter concentrations
Pollutant Standard Averaging Period Source
PM10 50 µg/m3 25 µg/m3
24-Hour Annual
EPA (2016)
PM2.5 25 µg/m3 8 µg/m3
24-Hour Annual
EPA (2016)
TSP 90 µg/m3 Annual EPA (2016)
µg/m3 = micrograms per cubic metre
In addition to health impacts, airborne dust also has the potential to cause nuisance effects by depositing on
surfaces, including native vegetation and crops. Larger particles do not tend to remain suspended in the
atmosphere for long periods of time and will fall out relatively close to source. Dust fallout can soil materials and
generally degrade aesthetic elements of the environment, and are assessed for nuisance or amenity impacts.
Table 4.2 shows the maximum acceptable increase in dust deposition over the existing dust levels from an
amenity perspective, as well as the maximum total overall dust deposition. These criteria for dust fallout levels are
set to protect against nuisance impacts (EPA, 2016).
Table 4.2: NSW criteria for dust deposition (insoluble solids)
Pollutant Averaging period Maximum increase Maximum total
Deposited dust Annual 2 g/m2/month 4 g/m2/month
g/m2/month = grams per square metre per month

Evolution Mining (Cowal) Pty Limited
Document Control Number: AQU-NW-005-21396C
00904218-009
Proprietary information for Evolution Mining (Cowal) Pty Limited only. Property of Pacific Environment Limited.
13
4.2 Voluntary land acquisition and mitigation policy
In December 2014, the DP&E released a policy relating to voluntary mitigation and land acquisition criteria for air
quality and noise (NSW Government, 2014). The policy sets out voluntary mitigation and land acquisition rights
where it is not possible to comply with the EPA impact assessment criteria, even with the implementation of all
reasonable and feasible avoidance and/or mitigation measures.
The DP&E voluntary mitigation and acquisition criteria are summarised in Table 4.3 and Table 4.4, respectively.
The Modification has been assessed against these criteria, in addition to the EPA impact assessment criteria
discussed in Section 4.1.
An updated draft version of this policy (NSW Government, 2017) was released in November 2017 with the annual
average PM10 criterion reduced to 25 µg/m3. Given the policy is still in draft form, the revised criteria have not
been considered in this assessment.
Total impact includes the impact of the modified CGO and all other sources, whilst incremental impact refers to
the impact of the modified CGO considered in isolation.
Table 4.3: DP&E particulate matter mitigation criteria
Pollutant Standard Averaging Period Application
PM10 50 µg/m3 30 µg/m3
24-Hour Annual
Incremental impact(a) Cumulative impact(b)
TSP 90 µg/m3 Annual Cumulative impact(b)
Deposited dust 2 g/m2/month 4 g/m2/month
Annual Incremental impact(a) Cumulative impact(b)
(a) increase due to the project alone with zero allowable exceedances of the criterion over the life of the development.
(b) increase in concentrations due to the development plus background from all other sources.
Table 4.4: DP&E particulate matter acquisition criteria
Pollutant Standard Averaging Period Application(a)
PM10 50 µg/m3 30 µg/m3
24-Hour Annual
Incremental impact(b) Total impact(c)
TSP 90 µg/m3 Annual Cumulative impact
Deposited dust 2 g/m2/month 4 g/m2/month
Annual Incremental impact(b) Cumulative impact(c)
(a) voluntary acquisition rights apply where the project contributes to exceedances of the acquisition criteria at any
residence or workplace on privately-owned land or, on more than 25% of any privately-owned land, and a dwelling could
be built on that land under exiting planning controls.
(b) increase due to the project alone with up to five allowable exceedances of the criterion over the life of the development.
(c) increase in concentrations due to the development plus background from all other sources.

Evolution Mining (Cowal) Pty Limited
Document Control Number: AQU-NW-005-21396C
00904218-009
Proprietary information for Evolution Mining (Cowal) Pty Limited only. Property of Pacific Environment Limited.
14
5. Existing environment
The CGO air quality monitoring network currently consists of an array of dust deposition gauges, a TSP high
volume air sampler (HVAS) and a meteorological station. The locations of these are shown in Figure 5.1, and
data collected from each site are described in the following sections.
Dust monitoring forms part of the Air Quality Management Plan (AQMP), required under Development Consent
Condition (DCC) 6.1(c), and results are published every 12 months in the Annual Review required under
DCC 9.1(b). Results of dust monitoring at a number of monitors located around the CGO are also published
monthly in accordance with Environmental Protection Licence (EPL) 11912.
The Annual Review also notes any dust-related complaints that have been received in that period. In the latest
Annual Review (Evolution, 2017), it is noted that there were no complaints received relating to dust at the CGO
during the reporting period. A review of all Annual Reviews since 2011 indicates that there have been no dust
related complaints for a period of at least five years.

Evolution Mining (Cowal) Pty Limited
Document Control Number: AQU-NW-005-21396C
00904218-009
Proprietary information for Evolution Mining (Cowal) Pty Limited only. Property of Pacific Environment Limited.
15
Figure 5.1: Locations of the CGO dust and meteorological monitoring sites
Evolution Mining (Cowal) Pty Limited
Document Control Number: AQU-NW-005-21396C
00904218-009
Proprietary information for Evolution Mining (Cowal) Pty Limited only. Property of Pacific Environment Limited.
16
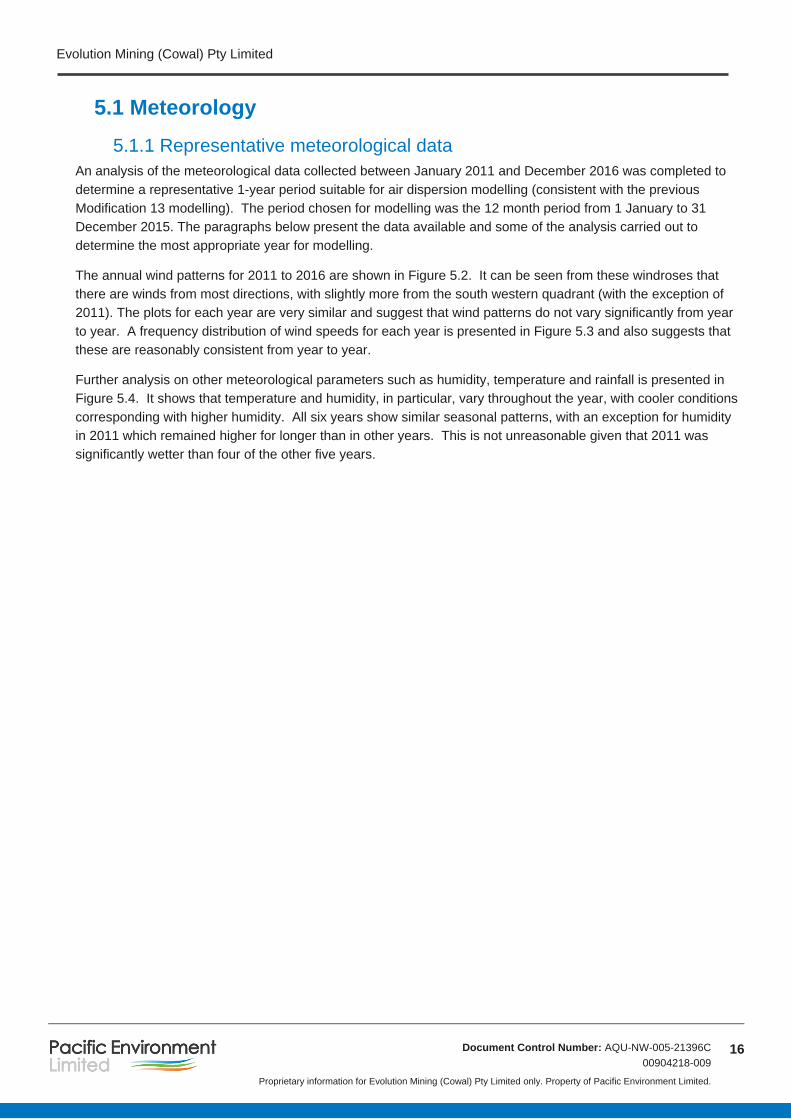
5.1 Meteorology
5.1.1 Representative meteorological data
An analysis of the meteorological data collected between January 2011 and December 2016 was completed to
determine a representative 1-year period suitable for air dispersion modelling (consistent with the previous
Modification 13 modelling). The period chosen for modelling was the 12 month period from 1 January to 31
December 2015. The paragraphs below present the data available and some of the analysis carried out to
determine the most appropriate year for modelling.
The annual wind patterns for 2011 to 2016 are shown in Figure 5.2. It can be seen from these windroses that
there are winds from most directions, with slightly more from the south western quadrant (with the exception of
2011). The plots for each year are very similar and suggest that wind patterns do not vary significantly from year
to year. A frequency distribution of wind speeds for each year is presented in Figure 5.3 and also suggests that
these are reasonably consistent from year to year.
Further analysis on other meteorological parameters such as humidity, temperature and rainfall is presented in
Figure 5.4. It shows that temperature and humidity, in particular, vary throughout the year, with cooler conditions
corresponding with higher humidity. All six years show similar seasonal patterns, with an exception for humidity
in 2011 which remained higher for longer than in other years. This is not unreasonable given that 2011 was
significantly wetter than four of the other five years.

Evolution Mining (Cowal) Pty Limited
Document Control Number: AQU-NW-005-21396C
00904218-009
Proprietary information for Evolution Mining (Cowal) Pty Limited only. Property of Pacific Environment Limited.
17
Figure 5.2: Annual windroses for CGO from 2011 – 2016

Evolution Mining (Cowal) Pty Limited
Document Control Number: AQU-NW-005-21396C
00904218-009
Proprietary information for Evolution Mining (Cowal) Pty Limited only. Property of Pacific Environment Limited.
18
Figure 5.3: Distribution of wind speeds for each calendar year at CGO

Evolution Mining (Cowal) Pty Limited
Document Control Number: AQU-NW-005-21396C
00904218-009
Proprietary information for Evolution Mining (Cowal) Pty Limited only. Property of Pacific Environment Limited.
19
Figure 5.4: Humidity, wind speed, temperature and rainfall at CGO from 2011 – 2016

Evolution Mining (Cowal) Pty Limited
Document Control Number: AQU-NW-005-21396C
00904218-009
Proprietary information for Evolution Mining (Cowal) Pty Limited only. Property of Pacific Environment Limited.
20
The identification of a representative meteorological year has been investigated by examining the statistics for
the six years from 2011 to 2016, shown in Table 5.1.
Table 5.1: Annual statistics from data collected at the CGO meteorological station
Statistic 2011 2012 2013 2014 2015 2016
Mean wind speed (metres per second [m/s])
3.2 3.2 3.2 3.1 3.0 3.1
Percentage of calms (%) 1.7 2.6 2.2 3.0 2.9 3.0
Total rainfall (millimetres [mm]) 682 550 342 329 415 628
Percentage data capture (%) 100 100 100 92 100 100
With the exception of the notably higher rainfall in 2011 and 2016 (and to a lesser extent, 2012), none of these
years appear to be significantly different to the other years. For this assessment the 2015 calendar year has
been selected as the meteorological modelling year, based on:
Similar wind patterns to other years.
Rainfall was neither the highest nor the lowest, but slightly lower than the long term average for the area of
479 mm (Bureau of Meteorology, 2016).
Air quality conditions showed similarities to other recent years and were not adversely influenced by
significant regional dust events (shown in Section 5.2.1).
Methods for incorporating the 2015 data into the meteorological model (CALMET) and dispersion model
(CALPUFF) are discussed in Section 6.
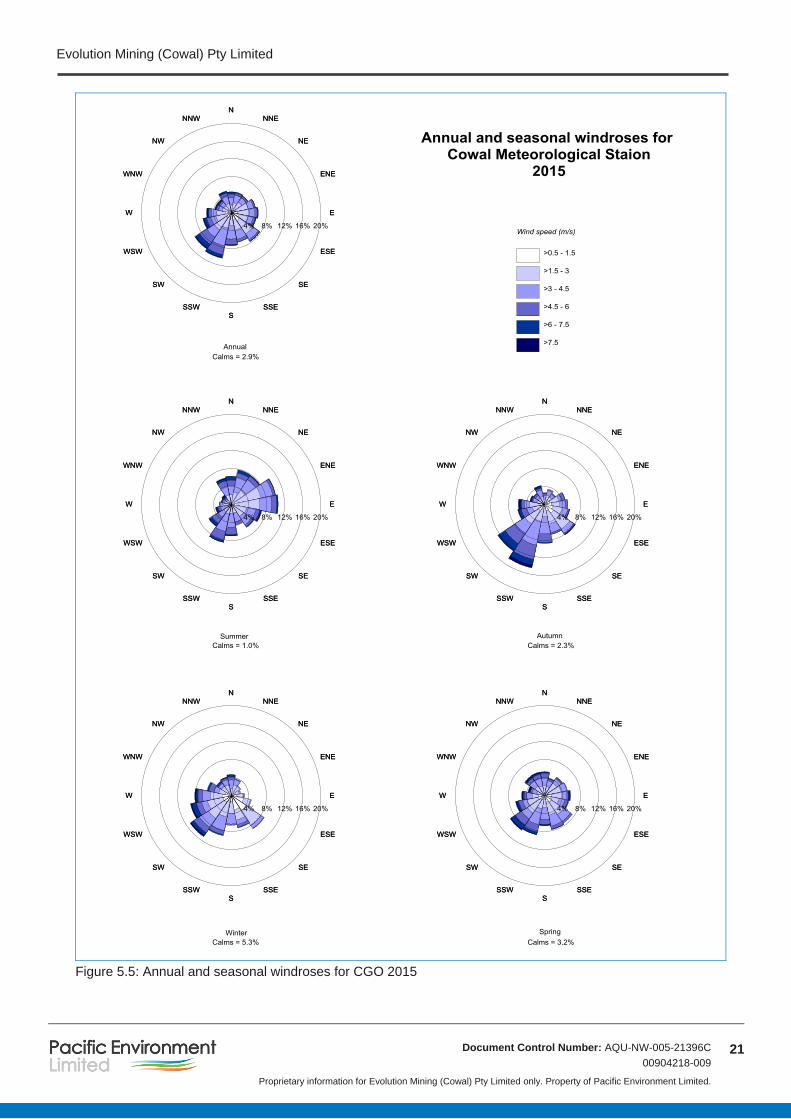
5.1.2 Wind speed and direction
Having determined that 2015 is a representative year for the area, further analysis of the wind patterns in this
year was carried out. Figure 5.5 presents the annual and seasonal windroses for 2015. The annual pattern is
similar to that seen in spring. In autumn and winter winds are predominantly from the south-western quadrant
while in summer they are generally from the north-east.
There are calm conditions for approximately 2.9% of the time, and most of these occur in winter.
Evolution Mining (Cowal) Pty Limited
Document Control Number: AQU-NW-005-21396C
00904218-009
Proprietary information for Evolution Mining (Cowal) Pty Limited only. Property of Pacific Environment Limited.
21
Figure 5.5: Annual and seasonal windroses for CGO 2015
Evolution Mining (Cowal) Pty Limited
Document Control Number: AQU-NW-005-21396C
00904218-009
Proprietary information for Evolution Mining (Cowal) Pty Limited only. Property of Pacific Environment Limited.
22
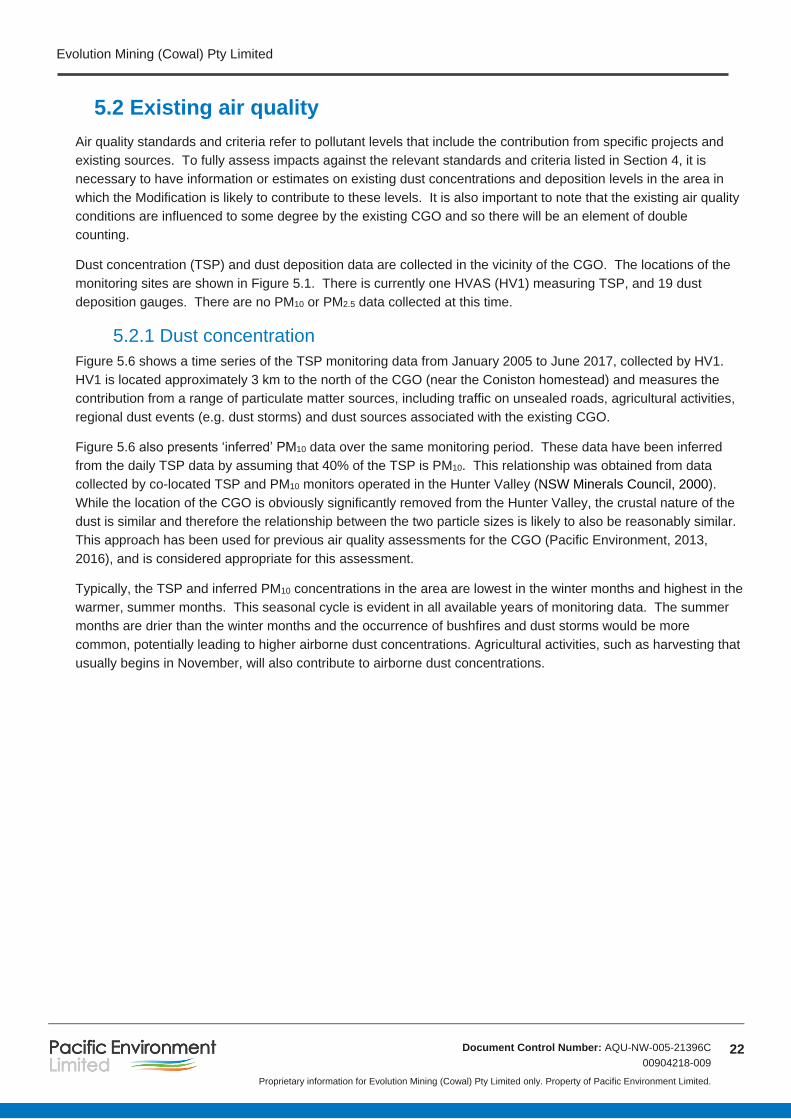
5.2 Existing air quality
Air quality standards and criteria refer to pollutant levels that include the contribution from specific projects and
existing sources. To fully assess impacts against the relevant standards and criteria listed in Section 4, it is
necessary to have information or estimates on existing dust concentrations and deposition levels in the area in
which the Modification is likely to contribute to these levels. It is also important to note that the existing air quality
conditions are influenced to some degree by the existing CGO and so there will be an element of double
counting.
Dust concentration (TSP) and dust deposition data are collected in the vicinity of the CGO. The locations of the
monitoring sites are shown in Figure 5.1. There is currently one HVAS (HV1) measuring TSP, and 19 dust
deposition gauges. There are no PM10 or PM2.5 data collected at this time.
5.2.1 Dust concentration
Figure 5.6 shows a time series of the TSP monitoring data from January 2005 to June 2017, collected by HV1.
HV1 is located approximately 3 km to the north of the CGO (near the Coniston homestead) and measures the
contribution from a range of particulate matter sources, including traffic on unsealed roads, agricultural activities,
regional dust events (e.g. dust storms) and dust sources associated with the existing CGO.
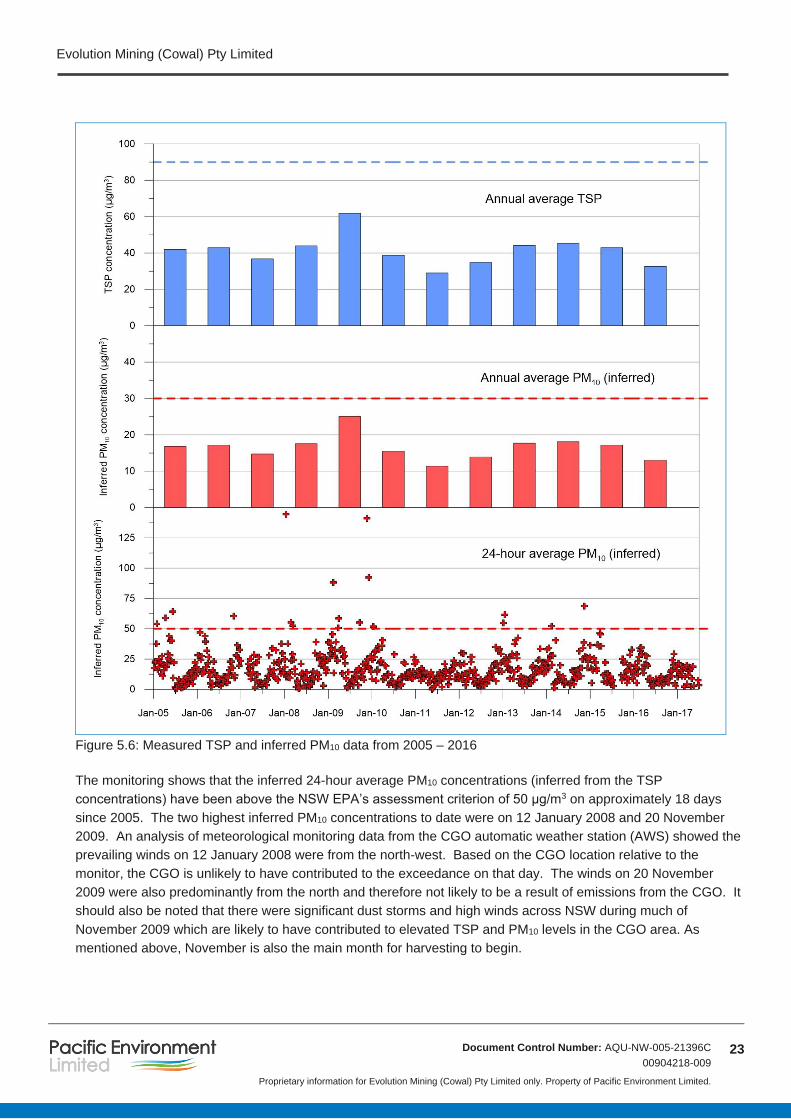
Figure 5.6 also presents ‘inferred’ PM10 data over the same monitoring period. These data have been inferred
from the daily TSP data by assuming that 40% of the TSP is PM10. This relationship was obtained from data
collected by co-located TSP and PM10 monitors operated in the Hunter Valley (NSW Minerals Council, 2000).
While the location of the CGO is obviously significantly removed from the Hunter Valley, the crustal nature of the
dust is similar and therefore the relationship between the two particle sizes is likely to also be reasonably similar.
This approach has been used for previous air quality assessments for the CGO (Pacific Environment, 2013,
2016), and is considered appropriate for this assessment.
Typically, the TSP and inferred PM10 concentrations in the area are lowest in the winter months and highest in the
warmer, summer months. This seasonal cycle is evident in all available years of monitoring data. The summer
months are drier than the winter months and the occurrence of bushfires and dust storms would be more
common, potentially leading to higher airborne dust concentrations. Agricultural activities, such as harvesting that
usually begins in November, will also contribute to airborne dust concentrations.
Evolution Mining (Cowal) Pty Limited
Document Control Number: AQU-NW-005-21396C
00904218-009
Proprietary information for Evolution Mining (Cowal) Pty Limited only. Property of Pacific Environment Limited.
23
Figure 5.6: Measured TSP and inferred PM10 data from 2005 – 2016
The monitoring shows that the inferred 24-hour average PM10 concentrations (inferred from the TSP
concentrations) have been above the NSW EPA’s assessment criterion of 50 µg/m3 on approximately 18 days
since 2005. The two highest inferred PM10 concentrations to date were on 12 January 2008 and 20 November
2009. An analysis of meteorological monitoring data from the CGO automatic weather station (AWS) showed the
prevailing winds on 12 January 2008 were from the north-west. Based on the CGO location relative to the
monitor, the CGO is unlikely to have contributed to the exceedance on that day. The winds on 20 November
2009 were also predominantly from the north and therefore not likely to be a result of emissions from the CGO. It
should also be noted that there were significant dust storms and high winds across NSW during much of
November 2009 which are likely to have contributed to elevated TSP and PM10 levels in the CGO area. As
mentioned above, November is also the main month for harvesting to begin.

Evolution Mining (Cowal) Pty Limited
Document Control Number: AQU-NW-005-21396C
00904218-009
Proprietary information for Evolution Mining (Cowal) Pty Limited only. Property of Pacific Environment Limited.
24
In NSW, it is quite common to measure 24-hour average PM10 concentrations above the NSW EPA 50 µg/m3
criterion on occasions. Events such as bushfires or dust storms are often the cause of elevated PM10
concentrations, which can be observed over large geographical areas.
Figure 5.7 shows the inferred PM10 data from the measured TSP data, ranked from highest to lowest for all data
collected for the last 11 years. The 95th and 90th percentile values are also plotted showing that for 95% of the
time the 24-hour average is less than 38 µg/m3 and for 90% of the time it is less than 31 µg/m3.
Figure 5.7: Ranked inferred 24-hour average PM10 concentrations from 2005 onwards
The annual average TSP and inferred PM10 concentrations are shown in Figure 5.6 and are also summarised in
Table 5.2. The inferred annual average PM10 concentrations have ranged between 11 µg/m3, in 2011, and
25 µg/m3 in 2009, when there was significant bushfire and dust storm activity across NSW. These levels are
below or equal to the NSW EPA’s annual average criterion of 25 µg/m3. Measured TSP concentrations have
remained below the NSW EPA annual average criterion of 90 µg/m3.
The inferred annual average PM10 concentration of 17 µg/m3 in 2015 was equal to the average over the previous
10 years, further confirming this as a representative year.

Evolution Mining (Cowal) Pty Limited
Document Control Number: AQU-NW-005-21396C
00904218-009
Proprietary information for Evolution Mining (Cowal) Pty Limited only. Property of Pacific Environment Limited.
25
Table 5.2: Annual average TSP and inferred PM10 concentrations from 2005 – 2016
Year Annual average TSP
(µg/m³) Inferred annual
average PM10 (µg/m³)
Impact Assessment Criteria
90 25
2005 42 17
2006 43 17
2007 37 15
2008 44 18
2009 62 25
2010 38 16
2011 29 11
2012 35 14
2013 44 18
2014 45 18
2015 43 17
2016 33 13
Average 41 17
An estimate of the annual average background value for PM2.5 has also been inferred, as there are no direct
measurements in the area. Annual average data from a number of NSW OEH sites with co-located PM10 and
PM2.5 measurements were analysed. These data are plotted in Figure 5.8, showing a relationship between the
two particle size groups. Applying the same regression function to the inferred annual average PM10
concentration of 17 µg/m3, presented in Table 5.2, gives an estimated annual average PM2.5 concentration of
approximately 5.3 µg/m3. This value has been used to represent the annual average PM2.5 background for this
assessment.
It should be noted that the locations of NSW OEH monitoring sites with co-located PM10 and PM2.5 monitors are
generally close to regional centres (towns), rather than less populated rural areas. As such, PM2.5 concentrations
could be expected to be lower at the CGO than the inferred values (i.e. the NSW EPA monitoring sites would
likely be closer to significant anthropogenic combustion emissions than the CGO).
The background level adopted is therefore considered to be a reasonable (yet conservative) representation of
background PM2.5 levels based on analysis of similar areas and comparison with Pacific Environment
Limited (2013).

Evolution Mining (Cowal) Pty Limited
Document Control Number: AQU-NW-005-21396C
00904218-009
Proprietary information for Evolution Mining (Cowal) Pty Limited only. Property of Pacific Environment Limited.
26
Figure 5.8: Annual average PM2.5 and PM10 data from co-located OEH TEOMs in NSW

Evolution Mining (Cowal) Pty Limited
Document Control Number: AQU-NW-005-21396C
00904218-009
Proprietary information for Evolution Mining (Cowal) Pty Limited only. Property of Pacific Environment Limited.
27
5.2.2 Dust deposition
Prior to the development of the CGO, monthly dust deposition was measured at three locations for a one year
period (1993 to 1994). All three sites were located within ML 1535 and annual average dust deposition ranged
between 1.0 and 1.6 g/m2/month (Barrick, 2003), well below the 4 g/m2/month NSW EPA annual average
criterion.
The current dust deposition monitoring includes gauges at various locations in the vicinity of the CGO (refer
Figure 5.1). Annual averages from data collected over the nine year period from 2008 to 2016 (inclusive) are
presented in Table 5.3.
Table 5.3: Annual average dust deposition results from 2008 – 2016 (g/m2/month)
Site 2008 2009 2010 2011 2012 2013 2014 2015 2016(1) Avg
McClintocks 4.3 4.0 7.4 3.2 17.3 3.1 3.9 3.7 4.8 4.32
Lakeside 6.0 6.4 2.1 2.0 6.9 2.5 1.7 4.8 4.6 4.1
I5 3.4 4.8 5.8 4.4 3.6 6.1 2.9 3.5 3.7 4.2
DG1 2.5 2.7 1.2 1.2 1.8 1.7 1.0 0.9 1.9 1.7
DG2 2.6 3.2 3.1 1.5 1.2 0.7 1.9 0.9 5.4 2.3
DG3 4.0 2.7 6.3 1.2 1.9 2.0 1.9 1.4 0.8 2.5
DG4 3.6 3.1 4.8 0.9 1.9 0.8 2.8 2.4 1.5 2.4
DG5 20.9 11.5 6.1 1.2 6.9 1.7 0.6 3.8 3.9 4.53
DG6 8.4 4.8 5.6 1.9 6.1 2.2 3.4 1.2 4.3 4.2
DG7 6.7 5.4 6.6 3.2 4.7 4.0 6.4 1.9 2.6 4.6
DG8(7) 4.7 3.6 1.4 0.8 2.3 2.7 - - - 2.6
DG9 3.2 3.9 1.5 1.2 1.6 1.1 4.0 2.5 2.3 2.4
DG10 3.9 3.8 1.2 3.4 1.9 2.2 1.0 0.8 1.2 2.2
DG11(5) 4.9 6.9 2.4 3.7 3.0 2.3 4.1 4.7 18.3 4.04
DG12(5) 6.5 10.7 5.3 11.1 6.1 4.1 5.4 4.9 5.4 6.6
DG13(5) 10.0 5.2 4.2 1.4 3.4 1.2 2.2 4.2 5.0 4.1
DG14(6) - - - - - 1.1 0.7 2.1 2.1 1.5
Site Office 12.2 12.5 12.8 5.5 2.5 2.9 3.3 3.2 2.9 6.4
Site 52(5) 4.1 4.2 3.0 3.1 4.0 2.9 2.7 2.0 2.3 3.1
(1) Average values taken from the 2016 Annual Review exclude records contaminated by inundation.
(2) Excludes the 2012 average, which is an outlier (i.e. significantly greater than the next highest recorded level).
(3) Excludes the 2008 average, which is an outlier (i.e. significantly greater than the next highest recorded level).
(4) Excludes the 2016 average, which is an outlier (i.e. significantly greater than the next highest recorded level).
(5) These sites are inside the ML1535 boundary.
(6) This gauge was established in August 2013.
(7) This gauge was decommissioned in August 2013.

Evolution Mining (Cowal) Pty Limited
Document Control Number: AQU-NW-005-21396C
00904218-009
Proprietary information for Evolution Mining (Cowal) Pty Limited only. Property of Pacific Environment Limited.
28
The monitoring results presented in Table 5.3 show that dust deposition levels above 4 g/m2/month were
measured at several locations. In the case of the McClintocks gauge, which measured an average of
4.3 g/m2/month, the on-site DG11, which is in the same direction as McClintocks, yet much closer to mining
activities, measured an average of 4.0 g/m2/month. Hence, the dust deposition at McClintocks is most likely due
to localised sources to that gauge.
Likewise, the Lakeside gauge measured an average of 4.1 g/m2/month, while DG1, which is located closer to the
CGO, measured an average of only 1.7 g/m2/month. Gauge I5 measured an average of 4.2 g/m2/month,
compared with DG4, in the same direction as I5, yet much closer to mining activities, which measured an average
of 2.4 g/m2/month over the same period. Also, DG3, which is closely located to I5, measured an average dust
deposition of 2.5 g/m2/month. This would indicate that the exceedance of the 4 g/m2/month criterion at these
gauges is due to localised activities (very close to the gauge) and unlikely to be due to the mining activity at the
CGO.
Similarly, gauges DG6 and DG7 returned averages above 4 g/m2/month. These gauges are distant from mining
activities (some 7 km and 6 km away, respectively) and are most likely influenced by other more localised dust
sources.
Excluding the levels from the gauges likely being influenced by non-mining localised dust sources
(i.e. McClintocks, Lakeside, I5, DG6 and DG7), the average annual average dust deposition is approximately
2.9 g/m2/month.
5.2.3 Background values
In summary, the following values have been used as representative background levels for the annual average
cumulative assessment:
Annual average PM2.5 concentration 5.3 µg/m3
Annual average PM10 concentration 17 µg/m3
Annual average TSP concentration 41 µg/m3
Annual average dust deposition level 2.9 g/m2/month
These background levels are considered to be conservative for the purposes of impact assessment for the
Modification. They include any existing contributions of the CGO, therefore resulting in double counting when
these adopted background levels are considered cumulatively with modelled impacts from the CGO incorporating
the Modification.

Evolution Mining (Cowal) Pty Limited
Document Control Number: AQU-NW-005-21396C
00904218-009
Proprietary information for Evolution Mining (Cowal) Pty Limited only. Property of Pacific Environment Limited.
29
6. Methodology
6.1 Approach to assessment
The overall approach to the assessment follows the Approved Methods using the Level 2 assessment
methodology. The Approved Methods specify how assessments based on the use of air dispersion models
should be completed. They include guidelines for the preparation of meteorological data to be used in dispersion
models and the relevant air quality criteria for assessing the significance of predicted concentration and
deposition rates from the Modification.
The air dispersion modelling conducted for this assessment is based on an advanced modelling system using the
models TAPM and CALMET/CALPUFF.
The modelling system works as follows:
TAPM is a prognostic meteorological model that generates gridded three-dimensional meteorological data
for each hour of the model run period.
CALMET, the meteorological pre-processor for the dispersion model CALPUFF, calculates fine resolution
three-dimensional meteorological data based upon observed ground and upper level meteorological data,
as well as observed or modelled upper air data generated, for example, by TAPM.
CALPUFF then calculates the dispersion of plumes within this three-dimensional meteorological field.
Output from TAPM, plus local observational weather station data, were entered into CALMET, a meteorological
pre-processor endorsed by the United States Environmental Protection Agency (US EPA) and recommended by
the NSW EPA for use in complex terrain and non-steady state conditions (that is, conditions that change in time
and space). From this, a 1-year representative meteorological dataset suitable for use in the 3-dimensional
plume dispersion model, CALPUFF, was compiled. Figure 6.1 presents an overview of the modelling system and
the details on the model configuration and data inputs are provided in the following sections.

Evolution Mining (Cowal) Pty Limited
Document Control Number: AQU-NW-005-21396C
00904218-009
Proprietary information for Evolution Mining (Cowal) Pty Limited only. Property of Pacific Environment Limited.
30
Figure 6.1: Overview of modelling methodology

Evolution Mining (Cowal) Pty Limited
Document Control Number: AQU-NW-005-21396C
00904218-009
Proprietary information for Evolution Mining (Cowal) Pty Limited only. Property of Pacific Environment Limited.
31
6.2 TAPM
The Air Pollution Model, or TAPM, is a three dimensional meteorological and air pollution model developed by the
Commonwealth Scientific and Industrial Research Organisation Division of Atmospheric Research. Detailed
description of the TAPM model and its performance is provided in Hurley (2008) and Hurley et al. (2009).
TAPM solves the fundamental fluid dynamics and scalar transport equations to predict meteorology and pollutant
concentrations. It consists of coupled prognostic meteorological and air pollution concentration components. The
model predicts airflow important to local scale air pollution, such as sea breezes and terrain induced flows,
against a background of larger scale meteorology provided by synoptic analyses.
For this project, TAPM was set up with three domains, composed of 25 grid points along both the x and the y
axes, centred on -33˚38’ Latitude and 147˚24’ Longitude. Each nested domain had a grid resolution of 30 km, 10
km and 3 km respectively.
6.3 CALMET
CALMET is a meteorological pre-processor that includes a wind field generator containing objective analysis and
parameterised treatments of slope flows, terrain effects and terrain blocking effects. The pre-processor produces
fields of wind components, air temperature, relative humidity, mixing height and other micro-meteorological
variables to produce the three-dimensional meteorological fields that are utilised in the CALPUFF dispersion
model (i.e. the CALPUFF dispersion model requires meteorological data in three dimensions). CALMET uses the
meteorological inputs in combination with land use and geophysical information for the modelling domain to
predict gridded meteorological fields for the region.
Terrain for this area was principally derived from 90 metres (m) NASA SRTM (Shuttle Radar Topography
Mission) data. Finer resolution terrain data from Light Detection and Ranging (LiDAR) was used to represent the
Modification, and combined with the NASA SRTM data to represent the entire modelling domain. Land use for
the domain was determined from Google Earth aerial photography.
There are four main land uses represented across the modelling domain. The dominant land use is agricultural
land, with the barren land category used to represent the active mining areas. Figure 6.2 presents this
information across the domain.
Meteorological parameters such as wind speed, wind direction, temperature and relative humidity were sourced
from the on-site station. Upper air information was incorporated through the use of prognostic three-dimensional
data extracted from TAPM. The CALMET model generated meteorological parameters across the grid domain of
40 km x 40 km with a 250 m resolution, centred on the CGO.
6.4 CALPUFF
CALPUFF is the dispersion module of the CALMET/CALPUFF suite of models. It is a multi-layer, multi species,
non-steady-state puff dispersion model that can simulate the effects of time-varying and space-varying
meteorological conditions on pollutant transport, transformation and removal. The model contains algorithms for
near-source effects such as building downwash, partial plume penetration, sub-grid scale interactions as well as
longer range effects such as pollutant removal, chemical transformation, vertical wind shear and coastal
interaction effects. The model employs dispersion equations based on a Gaussian distribution of pollutants
across released puffs and takes into account the complex arrangement of emissions from point, area, volume and
line sources (Scire et al., 2000).

Evolution Mining (Cowal) Pty Limited
Document Control Number: AQU-NW-005-21396C
00904218-009
Proprietary information for Evolution Mining (Cowal) Pty Limited only. Property of Pacific Environment Limited.
32
Each dust generating activity was represented by a series of volume sources situated according to their location,
as shown in Section 7. Model predictions were made across the domain at gridded receptors at a spacing of
1 km x 1 km, as well as at 40 discrete receptors representing private and Evolution-owned residences.
Figure 6.2: Landuse categories used for meteorological modelling

Evolution Mining (Cowal) Pty Limited
Document Control Number: AQU-NW-005-21396C
00904218-009
Proprietary information for Evolution Mining (Cowal) Pty Limited only. Property of Pacific Environment Limited.
33
7. Emissions to air
7.1 Construction emissions
Construction activities typically generate dust from a number of different, short duration activities within a
relatively small area. This is true even for linear infrastructure development such as the Lake Cowal Road
realignment and the pipeline duplication. While the linear infrastructure may cover a large, elongated area,
construction work typically takes place progressively.
Dust emissions from construction activities can be effectively managed with commonly applied mitigation
measures, such as minimising disturbance and the application of water (e.g. the use of water carts).
Dust emissions from construction activities would therefore be too low (particularly relative to those of the CGO)
to generate any significant off-site concentrations.
Linear infrastructure construction emissions have therefore not been quantified or assessed further.
The AQMP would be updated to include mitigation and management measures associated with the Modification
construction activities.
7.2 Operational emissions
Estimates of emissions for each source were developed on an hourly time step taking into account the activities
that would take place at that location. Thus, for each source, for each hour, an emission rate was determined
which depended on the level of activity and the wind speed. Dust generating activities were represented by a
series of volume sources situated according to the location of activities for the modelled scenarios.
Not every activity will occur at each source location and some source locations would see significantly more
activities than others. For example, in the active pit area a variety of activities will be taking place simultaneously,
such as drilling, blasting, loading to trucks, haulage and wind erosion. The source locations in the pit would
therefore include a proportion of emissions from some, or all, of these activities.
The operations were analysed and estimates of dust emissions for the key dust generating activities were made.
Emission factors developed by the US EPA were applied to estimate the amount of dust produced by each
activity. The emission factors applied are considered to be the most reliable, contemporary methods for
determining dust generation rates.
Detailed emissions inventories were prepared for the two key operating scenarios determined in Section 2.3.
Table 7.1 and Table 7.2 list all activities that have been modelled for these scenarios and their corresponding
estimated annual emissions for TSP, PM10 and PM2.5. It should be noted that Evolution has agreed to employ
additional watering during the construction of the IWL in order to reduce emissions in Year 16.
Further detail on the emission factors and calculations is provided in Appendix A.
To model the effect of pit retention for emissions for the Modification, detailed mine plan terrain data has been
incorporated into the modelling. All activities except blasting (which are restricted to daytime hours) have been
modelled as potentially occurring 24-hours per day.

Evolution Mining (Cowal) Pty Limited
Document Control Number: AQU-NW-005-21396C
00904218-009
Proprietary information for Evolution Mining (Cowal) Pty Limited only. Property of Pacific Environment Limited.
34
Table 7.1: Estimated emissions for Year 16 (2020)
Activity TSP (kg) PM10 (kg) PM2.5 (kg)
Drilling 8,098 4,211 243
Blasting 28,808 14,980 864
Waste - Excavators loading haul trucks 39,658 18,757 2,840
Waste - Hauling to IWL construction area 1,633,326 419,687 41,969
Waste - Hauling stripped IWL material to northern stockpiles 55,767 14,329 1,433
Waste - Unloading at IWL construction area 39,658 18,757 2,840
Waste - Unloading stripped material at northern stockpiles 4,687 2,217 336
Waste - Loading trucks with clay at Hardstand area for IWL 2,459 1,163 176
Waste - Loading trucks with clay at Hardstand area for STSF 381 180 27
Waste - Hauling clay from Hardstand to IWL construction area 102,260 26,276 2,628
Waste - Hauling clay from Hardstand to STSF 15,828 5,423 542
Waste - Unloading clay at IWL construction area 2,459 1,163 176
Waste - Unloading clay at STSF 381 180 27
Waste - Dozers in pit 20,819 4,086 2,186
Waste - Dozers on IWL construction area 35,894 7,046 3,769
Waste - Dozers on STSF area 35,894 7,046 3,769
Ore - Loading mineral waste ore to haul trucks 4,471 2,115 320
Ore - Hauling mineral waste ore to northern dump 160,642 41,277 4,128
Ore - Unloading mineral waste ore to northern dump 4,471 2,115 320
Ore - Loading ore to haul trucks 5,249 2,483 376
Ore - Hauling ore to ROM pad 165,008 42,399 4,240
Ore - Unloading ore to ROM pad 1,575 745 113
Ore - Rehandling ore 945 447 68
Ore - Crushing and screening 4,590 1,728 203
Ore - Loading to coarse ore stockpile 4,607 2,179 330
Gravel - loading to trucks in pit 292 138 21
Gravel - Hauling from pit to mobile crusher 12,659 3,253 325
Gravel - unloading at crusher 87 41 6
Gravel - crushing 255 96 11
Grading roads 10,783 377 334
Wind erosion - Open pit 93,500 46,750 7,013
Wind erosion - Northern dump 102,850 51,425 7,714
Wind erosion - Stockpiles and exposed areas 65,450 32,725 4,909
Wind erosion - Northern stockpiles 92,650 46,325 6,949
Wind erosion - IWL construction area 87,550 43,775 6,566
Total 2,820,847 852,956 105,898
Note: kg = kilograms.
STSF-Southern Tailings Storage Facility
ROM = Run of Mine

Evolution Mining (Cowal) Pty Limited
Document Control Number: AQU-NW-005-21396C
00904218-009
Proprietary information for Evolution Mining (Cowal) Pty Limited only. Property of Pacific Environment Limited.
35
Table 7.2: Estimated emissions for Year 20 (2024)
Activity TSP (kg) PM10 (kg) PM2.5 (kg)
Drilling 8,098 4,211 243
Blasting 28,808 14,980 864
Waste - Excavators loading haul trucks 1,166 552 84
Waste - Hauling to northern waste dump 46,260 11,887 1,189
Waste - Unloading at northern waste dump 1,166 552 84
Waste - Loading trucks with clay at Hardstand area for IWL 1,788 846 128
Waste - Hauling clay from Hardstand to IWL construction area 99,162 25,480 2,548
Waste - Unloading clay at IWL construction area 1,788 846 128
Waste - Dozers in pit 20,819 4,086 2,186
Waste - Dozers on IWL construction area 35,894 7,046 3,769
Waste - Dozers on STSF area 35,894 7,046 3,769
Ore - Loading mineral waste ore to haul trucks 6,610 3,126 473
Ore - Hauling mineral waste ore to northern dump 237,471 61,019 6,102
Ore - Unloading mineral waste ore to northern dump 6,610 3,126 473
Ore - Loading ore to haul trucks 18,274 8,643 1,309
Ore - Hauling ore to ROM pad 574,471 147,612 14,761
Ore - Unloading ore to ROM pad 5,482 2,593 393
Ore - Rehandling ore 3,289 1,556 236
Ore - Crushing and screening 15,980 6,016 705
Ore - Loading to coarse ore stockpile 5,715 2,703 409
Gravel - loading to trucks in pit 292 138 21
Gravel - Hauling from pit to mobile crusher 12,659 3,253 325
Gravel - unloading at crusher 87 41 6
Gravel - crushing 255 96 11
Grading roads 10,783 377 334
Wind erosion - Open pit 93,500 46,750 7,013
Wind erosion - Northern dump 76,500 38,250 5,738
Wind erosion - Stockpiles and exposed areas 65,450 32,725 4,909
Wind erosion - Northern stockpiles 85,000 42,500 6,375
Wind erosion - Dry TSF and IWL construction area 232,050 116,025 17,404
Total 1,731,322 594,078 81,987
Note: kg = kilograms.
STSF-Southern Tailings Storage Facility
ROM = Run of Mine

Evolution Mining (Cowal) Pty Limited
Document Control Number: AQU-NW-005-21396C
00904218-009
Proprietary information for Evolution Mining (Cowal) Pty Limited only. Property of Pacific Environment Limited.
36
8. Modelling results
8.1 Introduction
The NSW EPA air quality assessment criteria used for identifying which properties are likely to experience air
quality impacts are summarised in Section 4 and have been applied in this assessment. The predictions are
focussed on inhabited residential properties.
Dispersion model predictions have been made for Years 16 (2020) and 20 (2024). These modelled years were
selected as representative, worst case years for the life of the project.
Contour plots of particulate concentrations and deposition levels show the areas that are predicted to be affected
by dust at different levels. These contour figures are presented to provide a visual representation of the predicted
impacts. To produce the contours it is necessary to make interpolations, and as a result the contours will not
always match exactly with predicted impacts at any specific location. The actual predicted particulate
concentrations/levels at nearby residences are presented in tabular form.
Section 8.2 presents results for the Modification alone and Section 8.3 presents an annual average cumulative
assessment. A separate cumulative assessment of 24-hour average PM10 and PM2.5 is provided in Section 8.4.
8.2 Modification only
8.2.1 Year 16 (2020)
A summary of the predicted concentration and deposition levels at all sensitive receptors (that is residences both
private and Evolution-owned) due to the operations of the Modification alone in Year 16 is presented in Table 8.1.
Figure 8.1 to Figure 8.6 show these predictions across the modelling domain.
With the exception of dust deposition, predictions are not compared to EPA impact assessment criteria, as these
criteria are cumulative. However, for individual residences the maximum 24-hour average PM10 predictions can
be compared to the NSW DP&E voluntary acquisition incremental criterion of 50 µg/m3 and 25 µg/m3,
respectively.
Figure 8.2 shows that there are no predicted exceedances of the incremental maximum 24-hour average PM10
criterion of 50 µg/m3 as a result of the Modification in Year 16. The predicted dust deposition levels are also well
below the incremental criterion of 2 g/m2/month at all residential receptors (Figure 8.6). These results include
consideration of the extent of the 50 µg/m3 PM10 and 2 g/m2/month dust deposition contours in relation to
privately-owned land (i.e. assessment against the voluntary acquisition criteria described in Table 4.4 applicable
to 25% of land).

Evolution Mining (Cowal) Pty Limited
Document Control Number: AQU-NW-005-21396C
00904218-009
Proprietary information for Evolution Mining (Cowal) Pty Limited only. Property of Pacific Environment Limited.
37
Table 8.1: Predicted concentrations and dust deposition levels at individual residences for Year 16 (2020) –
Modification only
Receptor ID
24-hour average Annual average
PM2.5
(µg/m³) PM10
(µg/m³) PM2.5
(µg/m³) PM10
(µg/m³) TSP
(µg/m³)
Dust deposition
(g/m2/month)
Assessment criteria
N/A 50 N/A N/A N/A 2
1a 3 21 0.3 2.5 6 0.12
1b 3 22 0.4 2.6 6 0.11
1c 3 22 0.3 1.9 5 0.10
1d 2 15 0.1 0.7 2 0.03
4 3 23 0.2 1.1 2 0.05
6 1 9 0.1 0.6 1 0.02
15 1 9 0.1 0.9 2 0.04
20 2 11 0.1 1.0 2 0.04
21 6 42 0.5 3.5 9 0.13
22a 3 22 0.3 1.7 4 0.06
22b 3 22 0.3 1.7 4 0.06
22c 4 25 0.3 2.0 5 0.07
22d 3 18 0.2 1.6 3 0.06
24 2 15 0.2 1.1 3 0.05
25 2 12 0.1 0.9 2 0.04
28 1 9 0.1 0.7 1 0.03
30a 1 4 0.1 0.3 1 0.01
30b 1 4 0.1 0.3 1 0.01
31a 2 10 0.1 0.4 1 0.01
36a 2 14 0.2 1.4 3 0.07
36b 1 5 0.1 0.4 1 0.02
38 3 19 0.2 1.0 2 0.04
42 7 44 0.6 3.9 10 0.17
43a 2 15 0.1 0.5 1 0.01
43b 1 8 0.0 0.3 1 0.01
49a 2 13 0.2 1.2 3 0.06
49b 2 15 0.2 1.5 4 0.07
56 2 11 0.1 0.6 1 0.02
57 1 9 0.1 0.6 1 0.03
61a 3 21 0.1 1.0 2 0.04
62 3 23 0.4 2.5 6 0.08
79 0 3 0.0 0.3 1 0.01
89 2 11 0.1 0.9 2 0.05
90 1 10 0.1 0.6 1 0.03
100 1 7 0.1 0.6 1 0.03
122 1 4 0.1 0.4 1 0.02
126 1 4 0.1 0.3 1 0.01

Evolution Mining (Cowal) Pty Limited
Document Control Number: AQU-NW-005-21396C
00904218-009
Proprietary information for Evolution Mining (Cowal) Pty Limited only. Property of Pacific Environment Limited.
38
Pollutant: PM2.5
Location: Cowal
Scenario: Year 16 – Modification
Percentile: 100th
Averaging Time: 24-hour
Model: CALPUFF
Units: µg/m3
Assessment criterion: N/A
Met Data: 2015
Plot: J. Barnett
Figure 8.1: Predicted maximum 24-hour average PM2.5 concentrations in Year 16 (2020) – Modification Only

Evolution Mining (Cowal) Pty Limited
Document Control Number: AQU-NW-005-21396C
00904218-009
Proprietary information for Evolution Mining (Cowal) Pty Limited only. Property of Pacific Environment Limited.
39
Pollutant: PM10
Location: Cowal
Scenario: Year 16 – Modification
Percentile: 100th
Averaging Time: 24-hour
Model: CALPUFF
Units: µg/m3
Assessment criterion: 50
Met Data: 2015
Plot: J. Barnett
Figure 8.2: Predicted maximum 24-hour average PM10 concentrations in Year 16 (2020) – Modification Only

Evolution Mining (Cowal) Pty Limited
Document Control Number: AQU-NW-005-21396C
00904218-009
Proprietary information for Evolution Mining (Cowal) Pty Limited only. Property of Pacific Environment Limited.
40
Pollutant: PM2.5
Location: Cowal
Scenario: Year 16 – Modification
Percentile: 100th
Averaging Time: Annual
Model: CALPUFF
Units: µg/m3
Assessment criterion: N/A
Met Data: 2015
Plot: J. Barnett
Figure 8.3: Predicted annual average PM2.5 concentrations in Year 16 (2020) – Modification Only

Evolution Mining (Cowal) Pty Limited
Document Control Number: AQU-NW-005-21396C
00904218-009
Proprietary information for Evolution Mining (Cowal) Pty Limited only. Property of Pacific Environment Limited.
41
Pollutant: PM10
Location: Cowal
Scenario: Year 16 – Modification
Percentile: 100th
Averaging Time: Annual
Model: CALPUFF
Units: µg/m3
Assessment criterion: N/A
Met Data: 2015
Plot: J. Barnett
Figure 8.4: Predicted annual average PM10 concentrations in Year 16 (2020) – Modification Only
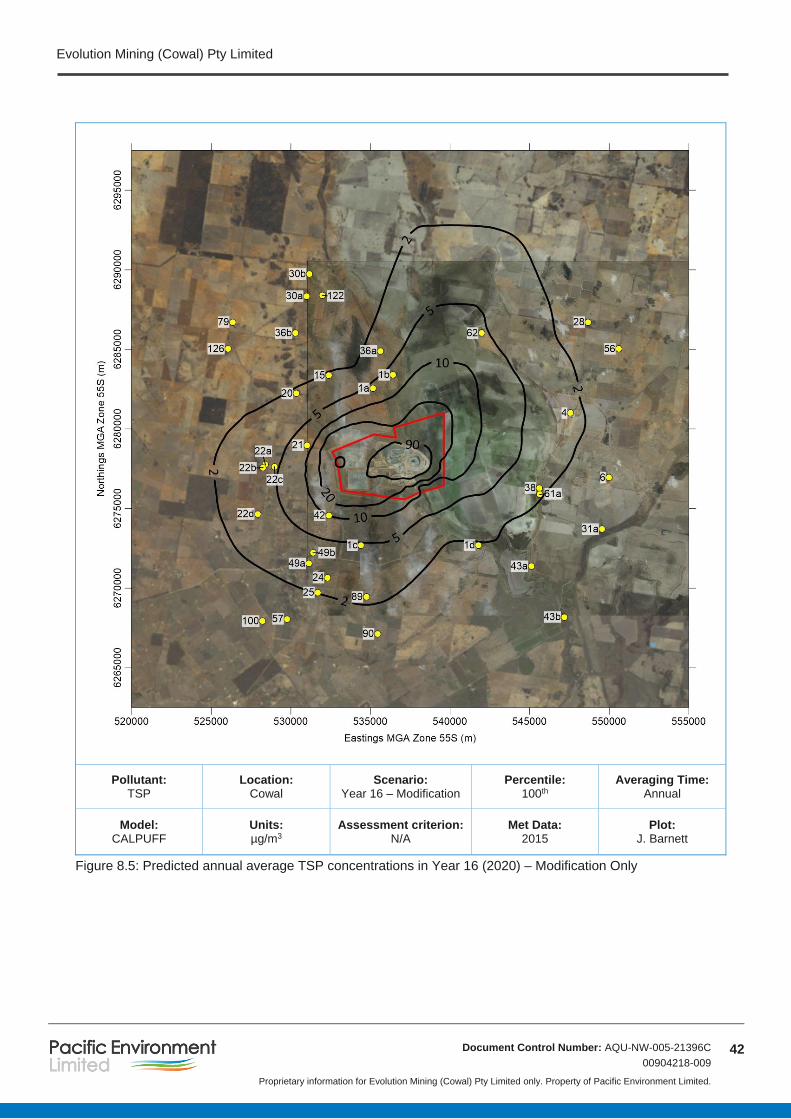
Evolution Mining (Cowal) Pty Limited
Document Control Number: AQU-NW-005-21396C
00904218-009
Proprietary information for Evolution Mining (Cowal) Pty Limited only. Property of Pacific Environment Limited.
42
Pollutant: TSP
Location: Cowal
Scenario: Year 16 – Modification
Percentile: 100th
Averaging Time: Annual
Model: CALPUFF
Units: µg/m3
Assessment criterion: N/A
Met Data: 2015
Plot: J. Barnett
Figure 8.5: Predicted annual average TSP concentrations in Year 16 (2020) – Modification Only

Evolution Mining (Cowal) Pty Limited
Document Control Number: AQU-NW-005-21396C
00904218-009
Proprietary information for Evolution Mining (Cowal) Pty Limited only. Property of Pacific Environment Limited.
43
Pollutant: Deposition
Location: Cowal
Scenario: Year 16 – Modification
Percentile: 100th
Averaging Time: Annual
Model: CALPUFF
Units: g/m2/month
Assessment criterion: 2
Met Data: 2015
Plot: J. Barnett
Figure 8.6: Predicted annual average dust deposition in Year 16 (2020) – Modification Only

Evolution Mining (Cowal) Pty Limited
Document Control Number: AQU-NW-005-21396C
00904218-009
Proprietary information for Evolution Mining (Cowal) Pty Limited only. Property of Pacific Environment Limited.
44
8.2.2 Year 20 (2024)
A summary of the predicted concentration and deposition levels at all sensitive receptors (that is residences both
private and Evolution-owned) due to the operations of the Modification alone in Year 20 is presented in Table 8.2.
Figure 8.7 to Figure 8.12 show these predictions across the modelling domain.
Figure 8.8 shows that there are no predicted exceedances of the incremental maximum 24-hour average PM10
criterion of 50 µg/m3 as a result of the Modification in Year 20. The predicted dust deposition levels are also well
below the incremental criterion of 2 g/m2/month at all residential receptors (Figure 8.12). These results include
consideration of the extent of the 50 µg/m3 PM10 and 2 g/m2/month dust deposition contours in relation to
privately-owned land (i.e. assessment against the voluntary acquisition criteria described in Table 4.4 applicable
to 25% of land).

Evolution Mining (Cowal) Pty Limited
Document Control Number: AQU-NW-005-21396C
00904218-009
Proprietary information for Evolution Mining (Cowal) Pty Limited only. Property of Pacific Environment Limited.
45
Table 8.2: Predicted concentrations and dust deposition levels at individual residences for Year 20 (2024) –
Modification only
Receptor ID
24-hour average Annual average
PM2.5
(µg/m³) PM10
(µg/m³) PM2.5
(µg/m³) PM10
(µg/m³) TSP
(µg/m³)
Dust deposition
(g/m2/month)
Assessment criteria
N/A 50 N/A N/A N/A 2
1a 2 10 0.2 1.2 3 0.07
1b 2 11 0.2 1.4 3 0.07
1c 2 11 0.2 1.0 2 0.06
1d 1 9 0.1 0.5 1 0.02
4 3 17 0.1 0.7 1 0.03
6 1 6 0.1 0.3 1 0.02
15 1 7 0.1 0.4 1 0.02
20 1 7 0.1 0.4 1 0.02
21 2 15 0.2 1.3 3 0.05
22a 2 10 0.1 0.8 2 0.03
22b 2 9 0.1 0.7 2 0.03
22c 2 11 0.2 0.8 2 0.03
22d 1 8 0.1 0.7 1 0.03
24 1 7 0.1 0.6 1 0.03
25 1 6 0.1 0.5 1 0.03
28 2 10 0.1 0.5 1 0.02
30a 0 2 0.0 0.2 0 0.01
30b 0 2 0.0 0.2 0 0.01
31a 1 5 0.0 0.2 1 0.01
36a 1 7 0.1 0.8 2 0.05
36b 0 3 0.0 0.2 0 0.01
38 2 15 0.1 0.6 1 0.03
42 3 14 0.3 1.8 4 0.08
43a 1 9 0.0 0.3 1 0.01
43b 1 7 0.0 0.2 0 0.01
49a 1 6 0.1 0.7 1 0.03
49b 1 7 0.1 0.8 2 0.04
56 1 7 0.1 0.4 1 0.02
57 1 4 0.1 0.3 1 0.02
61a 2 14 0.1 0.6 1 0.03
62 2 16 0.2 1.7 4 0.06
79 0 3 0.0 0.1 0 0.01
89 1 7 0.1 0.5 1 0.03
90 1 5 0.1 0.4 1 0.02
100 1 3 0.1 0.3 1 0.01
122 0 2 0.0 0.2 0 0.01
126 0 3 0.0 0.2 0 0.01

Evolution Mining (Cowal) Pty Limited
Document Control Number: AQU-NW-005-21396C
00904218-009
Proprietary information for Evolution Mining (Cowal) Pty Limited only. Property of Pacific Environment Limited.
46
Pollutant: PM2.5
Location: Cowal
Scenario: Year 20 – Modification
Percentile: 100th
Averaging Time: 24-hour
Model: CALPUFF
Units: µg/m3
Assessment criterion: N/A
Met Data: 2015
Plot: J. Barnett
Figure 8.7: Predicted maximum 24-hour average PM2.5 concentrations in Year 20 (2024) – Modification Only

Evolution Mining (Cowal) Pty Limited
Document Control Number: AQU-NW-005-21396C
00904218-009
Proprietary information for Evolution Mining (Cowal) Pty Limited only. Property of Pacific Environment Limited.
47
Pollutant: PM10
Location: Cowal
Scenario: Year 20 – Modification
Percentile: 100th
Averaging Time: 24-hour
Model: CALPUFF
Units: µg/m3
Assessment criterion: 50
Met Data: 2015
Plot: J. Barnett
Figure 8.8: Predicted maximum 24-hour average PM10 concentrations in Year 20 (2024) – Modification Only

Evolution Mining (Cowal) Pty Limited
Document Control Number: AQU-NW-005-21396C
00904218-009
Proprietary information for Evolution Mining (Cowal) Pty Limited only. Property of Pacific Environment Limited.
48
Pollutant: PM2.5
Location: Cowal
Scenario: Year 20 – Modification
Percentile: 100th
Averaging Time: Annual
Model: CALPUFF
Units: µg/m3
Assessment criterion: N/A
Met Data: 2015
Plot: J. Barnett
Figure 8.9: Predicted annual average PM2.5 concentrations in Year 20 (2024) – Modification Only

Evolution Mining (Cowal) Pty Limited
Document Control Number: AQU-NW-005-21396C
00904218-009
Proprietary information for Evolution Mining (Cowal) Pty Limited only. Property of Pacific Environment Limited.
49
Pollutant: PM10
Location: Cowal
Scenario: Year 20 – Modification
Percentile: 100th
Averaging Time: Annual
Model: CALPUFF
Units: µg/m3
Assessment criterion: N/A
Met Data: 2015
Plot: J. Barnett
Figure 8.10: Predicted annual average PM10 concentrations in Year 20 (2024) – Modification Only

Evolution Mining (Cowal) Pty Limited
Document Control Number: AQU-NW-005-21396C
00904218-009
Proprietary information for Evolution Mining (Cowal) Pty Limited only. Property of Pacific Environment Limited.
50
Pollutant: TSP
Location: Cowal
Scenario: Year 20 – Modification
Percentile: 100th
Averaging Time: Annual
Model: CALPUFF
Units: µg/m3
Assessment criterion: N/A
Met Data: 2015
Plot: J. Barnett
Figure 8.11: Predicted annual average TSP concentrations in Year 20 (2024) – Modification Only

Evolution Mining (Cowal) Pty Limited
Document Control Number: AQU-NW-005-21396C
00904218-009
Proprietary information for Evolution Mining (Cowal) Pty Limited only. Property of Pacific Environment Limited.
51
Pollutant: Deposition
Location: Cowal
Scenario: Year 20 – Modification
Percentile: 100th
Averaging Time: Annual
Model: CALPUFF
Units: g/m2/month
Assessment criterion: 2
Met Data: 2015
Plot: J. Barnett
Figure 8.12: Predicted annual average dust deposition in Year 20 (2024) – Modification Only

Evolution Mining (Cowal) Pty Limited
Document Control Number: AQU-NW-005-21396C
00904218-009
Proprietary information for Evolution Mining (Cowal) Pty Limited only. Property of Pacific Environment Limited.
52
8.3 Cumulative annual average
8.3.1 Year 16 (2020)
A summary of the predicted concentration and deposition levels due to the operations of the Modification in
Year 16 combined with the estimated background levels (as per Section 0) is presented in Table 8.3. The
contour plots across the modelling domain are presented in Figure 8.13 to Figure 8.16.
There are no predicted exceedances of the relevant standards/criteria at any of the private or Evolution-owned
residential properties. These results include consideration of the extent of the 30 µg/m3 PM10, 90 µg/m3 TSP and
4 g/m2/month dust deposition contours in relation to privately-owned land (i.e. assessment against the voluntary
acquisition criteria described in Table 4.4 applicable to 25% of land).

Evolution Mining (Cowal) Pty Limited
Document Control Number: AQU-NW-005-21396C
00904218-009
Proprietary information for Evolution Mining (Cowal) Pty Limited only. Property of Pacific Environment Limited.
53
Table 8.3: Predicted concentrations and dust deposition levels at individual residences for Year 16 (2020) –
Cumulative
Receptor ID
Annual average
PM2.5 (µg/m³) PM10 (µg/m³) TSP
(µg/m³) Dust deposition
(g/m²/month)
Assessment criteria
8 25 90 4
1a 5.6 19.5 47.1 3.0
1b 5.7 19.6 47.2 3.0
1c 5.6 18.9 45.7 3.0
1d 5.4 17.7 42.8 2.9
4 5.5 18.1 43.3 2.9
6 5.4 17.6 42.2 2.9
15 5.4 17.9 43.2 2.9
20 5.4 18.0 43.3 2.9
21 5.8 20.5 49.7 3.0
22a 5.6 18.7 44.9 3.0
22b 5.6 18.7 44.8 3.0
22c 5.6 19.0 45.6 3.0
22d 5.5 18.6 44.5 3.0
24 5.5 18.1 43.5 3.0
25 5.4 17.9 43.0 2.9
28 5.4 17.7 42.5 2.9
30a 5.4 17.3 41.8 2.9
30b 5.4 17.3 41.7 2.9
31a 5.4 17.4 41.9 2.9
36a 5.5 18.4 44.3 3.0
36b 5.4 17.4 41.9 2.9
38 5.5 18.0 43.3 2.9
42 5.9 20.9 50.9 3.1
43a 5.4 17.5 42.1 2.9
43b 5.3 17.3 41.6 2.9
49a 5.5 18.2 43.9 3.0
49b 5.5 18.5 44.6 3.0
56 5.4 17.6 42.3 2.9
57 5.4 17.6 42.4 2.9
61a 5.4 18.0 43.1 2.9
62 5.7 19.5 46.6 3.0
79 5.3 17.3 41.6 2.9
89 5.4 17.9 43.2 2.9
90 5.4 17.6 42.5 2.9
100 5.4 17.6 42.2 2.9
122 5.4 17.4 41.9 2.9
126 5.4 17.3 41.7 2.9

Evolution Mining (Cowal) Pty Limited
Document Control Number: AQU-NW-005-21396C
00904218-009
Proprietary information for Evolution Mining (Cowal) Pty Limited only. Property of Pacific Environment Limited.
54
Pollutant: PM2.5
Location: Cowal
Scenario: Year 16 – Cumulative
Percentile: 100th
Averaging Time: Annual
Model: CALPUFF
Units: µg/m3
Assessment criterion: 8
Met Data: 2015
Plot: J. Barnett
Figure 8.13: Predicted annual average PM2.5 concentrations in Year 16 (2020) – Cumulative

Evolution Mining (Cowal) Pty Limited
Document Control Number: AQU-NW-005-21396C
00904218-009
Proprietary information for Evolution Mining (Cowal) Pty Limited only. Property of Pacific Environment Limited.
55
Pollutant: PM10
Location: Cowal
Scenario: Year 16 – Cumulative
Percentile: 100th
Averaging Time: Annual
Model: CALPUFF
Units: µg/m3
Assessment criterion: 25
Met Data: 2015
Plot: J. Barnett
Figure 8.14: Predicted annual average PM10 concentrations in Year 16 (2020) – Cumulative

Evolution Mining (Cowal) Pty Limited
Document Control Number: AQU-NW-005-21396C
00904218-009
Proprietary information for Evolution Mining (Cowal) Pty Limited only. Property of Pacific Environment Limited.
56
Pollutant: TSP
Location: Cowal
Scenario: Year 16 – Cumulative
Percentile: 100th
Averaging Time: Annual
Model: CALPUFF
Units: µg/m3
Assessment criterion: 90
Met Data: 2015
Plot: J. Barnett
Figure 8.15: Predicted annual average TSP concentrations in Year 16 (2020) – Cumulative

Evolution Mining (Cowal) Pty Limited
Document Control Number: AQU-NW-005-21396C
00904218-009
Proprietary information for Evolution Mining (Cowal) Pty Limited only. Property of Pacific Environment Limited.
57
Pollutant: Deposition
Location: Cowal
Scenario: Year 16 – Cumulative
Percentile: 100th
Averaging Time: Annual
Model: CALPUFF
Units: g/m2/month
Assessment criterion: 4
Met Data: 2015
Plot: J. Barnett
Figure 8.16: Predicted annual average dust deposition in Year 16 (2020) – Cumulative

Evolution Mining (Cowal) Pty Limited
Document Control Number: AQU-NW-005-21396C
00904218-009
Proprietary information for Evolution Mining (Cowal) Pty Limited only. Property of Pacific Environment Limited.
58
8.3.2 Year 20 (2024) A summary of the predicted concentration and deposition levels due to the operations of the Modification in
Year 20 combined with the estimated background levels (as per Section 0) is presented in Table 8.4. The
contour plots across the modelling domain are presented in Figure 8.17 to Figure 8.20.
There are no predicted exceedances of the relevant standards/criteria at any of the private or Evolution-owned
residential properties. These results include consideration of the extent of the 30 µg/m3 PM10, 90 µg/m3 TSP and
4 g/m2/month dust deposition contours in relation to privately-owned land (i.e. assessment against the voluntary
acquisition criteria described in Table 4.4 applicable to 25% of land).

Evolution Mining (Cowal) Pty Limited
Document Control Number: AQU-NW-005-21396C
00904218-009
Proprietary information for Evolution Mining (Cowal) Pty Limited only. Property of Pacific Environment Limited.
59
Table 8.4: Predicted concentrations and dust deposition levels at individual residences for Year 20 (2024) –
Cumulative
Receptor ID
Annual average
PM2.5 (µg/m³) PM10 (µg/m³) TSP
(µg/m³) Dust deposition
(g/m2/month
Assessment criteria
8 25 90 4
1a 5.5 18.2 43.6 3.0
1b 5.5 18.4 44.1 3.0
1c 5.5 18.0 43.4 3.0
1d 5.4 17.5 42.1 2.9
4 5.4 17.7 42.4 2.9
6 5.4 17.3 41.7 2.9
15 5.4 17.4 42.0 2.9
20 5.4 17.4 41.9 2.9
21 5.5 18.3 43.9 3.0
22a 5.4 17.8 42.6 2.9
22b 5.4 17.7 42.6 2.9
22c 5.5 17.8 42.8 2.9
22d 5.4 17.7 42.5 2.9
24 5.4 17.6 42.3 2.9
25 5.4 17.5 42.0 2.9
28 5.4 17.5 41.9 2.9
30a 5.3 17.2 41.4 2.9
30b 5.3 17.2 41.4 2.9
31a 5.3 17.2 41.5 2.9
36a 5.4 17.8 42.7 2.9
36b 5.3 17.2 41.4 2.9
38 5.4 17.6 42.4 2.9
42 5.6 18.8 45.1 3.0
43a 5.3 17.3 41.7 2.9
43b 5.3 17.2 41.3 2.9
49a 5.4 17.7 42.4 2.9
49b 5.4 17.8 42.7 2.9
56 5.4 17.4 41.8 2.9
57 5.4 17.3 41.7 2.9
61a 5.4 17.6 42.3 2.9
62 5.5 18.7 44.6 3.0
79 5.3 17.1 41.3 2.9
89 5.4 17.5 42.2 2.9
90 5.4 17.4 41.8 2.9
100 5.4 17.3 41.6 2.9
122 5.3 17.2 41.4 2.9
126 5.3 17.2 41.3 2.9

Evolution Mining (Cowal) Pty Limited
Document Control Number: AQU-NW-005-21396C
00904218-009
Proprietary information for Evolution Mining (Cowal) Pty Limited only. Property of Pacific Environment Limited.
60
Pollutant: PM2.5
Location: Cowal
Scenario: Year 20 – Cumulative
Percentile: 100th
Averaging Time: Annual
Model: CALPUFF
Units: µg/m3
Assessment criterion: 8
Met Data: 2015
Plot: J. Barnett
Figure 8.17: Predicted annual average PM2.5 concentrations in Year 20 (2024) – Cumulative

Evolution Mining (Cowal) Pty Limited
Document Control Number: AQU-NW-005-21396C
00904218-009
Proprietary information for Evolution Mining (Cowal) Pty Limited only. Property of Pacific Environment Limited.
61
Pollutant: PM10
Location: Cowal
Scenario: Year 20 – Cumulative
Percentile: 100th
Averaging Time: Annual
Model: CALPUFF
Units: µg/m3
Assessment criterion: 25
Met Data: 2015
Plot: J. Barnett
Figure 8.18: Predicted annual average PM10 concentrations in Year 20 (2024) – Cumulative

Evolution Mining (Cowal) Pty Limited
Document Control Number: AQU-NW-005-21396C
00904218-009
Proprietary information for Evolution Mining (Cowal) Pty Limited only. Property of Pacific Environment Limited.
62
Pollutant: TSP
Location: Cowal
Scenario: Year 20 – Cumulative
Percentile: 100th
Averaging Time: Annual
Model: CALPUFF
Units: µg/m3
Assessment criterion: 90
Met Data: 2015
Plot: J. Barnett
Figure 8.19: Predicted annual average TSP concentrations in Year 20 (2024) – Cumulative

Evolution Mining (Cowal) Pty Limited
Document Control Number: AQU-NW-005-21396C
00904218-009
Proprietary information for Evolution Mining (Cowal) Pty Limited only. Property of Pacific Environment Limited.
63
Pollutant: Deposition
Location: Cowal
Scenario: Year 20 – Cumulative
Percentile: 100th
Averaging Time: Annual
Model: CALPUFF
Units: g/m2/month
Assessment criterion: 4
Met Data: 2015
Plot: J. Barnett
Figure 8.20: Predicted annual average dust deposition in Year 20 (2024) – Cumulative

Evolution Mining (Cowal) Pty Limited
Document Control Number: AQU-NW-005-21396C
00904218-009
Proprietary information for Evolution Mining (Cowal) Pty Limited only. Property of Pacific Environment Limited.
64
8.4 Cumulative 24-hour average
Difficulties in predicting cumulative 24-hour impacts are compounded by the day-to-day variability in ambient dust
levels and the spatial and temporal variation in any other anthropogenic activity and natural events (for example
agricultural activity, dust storms, bushfires etc., and including mining in the future). Monitoring data (presented in
Section 5.2) show that in many cases the worst-case inferred 24-hour average PM10 concentrations are strongly
influenced by other sources in an area, which are essentially unpredictable. Mining operations also contribute to
elevated inferred 24-hour average PM10 concentrations, however, they are likely to be more localised. This would
also be the case for 24-hour average PM2.5. The variability in inferred 24-hour average PM10 concentrations can
be clearly seen in the data collected at the HVAS monitor shown in Figure 5.6.
It is not expected that the CGO contribution to cumulative 24-hour PM10 and PM2.5 concentrations would increase
materially due to the Modification, given the following:
While the Modification would increase the ore processing rate, ore processing emissions are a small
subset of total emissions from the CGO and given the central location of the ore processing sources, are
unlikely to contribute materially to particulate matter concentrations at private receivers.
While development of the IWL would move some sources of dust emissions closer to private receivers,
Evolution has agreed to employ additional watering to reduce emissions during construction of the IWL.
In addition, there are no other existing or known proposed industrial sources of dust emissions in the vicinity of
the CGO.
Given the above, no additional potential 24-hour PM10 impacts are expected during the life of the Modification
(i.e. in addition to the existing approved operations).
The existing CGO has been operating since 2004 and monitoring indicates that the inferred 24-hour average
PM10 concentrations (inferred from the TSP concentrations) are generally below the NSW EPA’s assessment
criterion of 50 µg/m3 (Section 5.2.1).
Notwithstanding the above, this assessment considered the potential 24-hour PM10 and PM2.5 impacts associated
with the Modification consistent with the methodologies presented in the Approved Methods (i.e. the Level 1 and
Level 2 approaches). However, these involve the use of measured contemporaneous concentrations (i.e. daily
measured concentrations with corresponding meteorological data). No suitable data is currently available near
the site. Any monitored background levels would also include contributions from the existing operations at the
CGO, which when added to the predicted concentrations for the Modification would result in double counting.
As such, neither the Level 1 nor Level 2 approach is considered to be appropriate or representative of potential
cumulative 24-hour impacts for the Modification.
In lieu of a contemporaneous assessment, a simple analysis of the daily predictions has been carried out using
the available modelling data. Figure 8.21 shows a time series of the predicted 24-hour average PM10
concentrations at the most affected private residence (Residence 42) for modelled years 16 and 20. The
maximum prediction is 44 µg/m3 in Year 16, decreasing to 15 µg/m3 in Year 20. For the majority of the time in
Year 16, the predicted levels are well below 20 µg/m3. This can be seen more clearly when the values are
ranked from highest to lowest as shown in Figure 8.22, showing that predictions due to the Modification are less
than 1 µg/m3 for more than half of the time.
The same analysis is presented for 24-hour average PM2.5 predictions in Figure 8.23 and Figure 8.24. It is
unlikely that there would be any exceedances of the assessment criterion in either Year 16 or Year 20 as a result
of the Modification.

Evolution Mining (Cowal) Pty Limited
Document Control Number: AQU-NW-005-21396C
00904218-009
Proprietary information for Evolution Mining (Cowal) Pty Limited only. Property of Pacific Environment Limited.
65
Figure 8.21: Daily predicted 24-hour average PM10 concentrations at Residence 42
Figure 8.22: Predicted 24-hour average PM10 concentrations at Residence 42, ranked from highest to lowest

Evolution Mining (Cowal) Pty Limited
Document Control Number: AQU-NW-005-21396C
00904218-009
Proprietary information for Evolution Mining (Cowal) Pty Limited only. Property of Pacific Environment Limited.
66
Figure 8.23: Daily predicted 24-hour average PM2.5 concentrations at Residence 42
Figure 8.24: Predicted 24-hour average PM2.5 concentrations at Residence 42, ranked from highest to lowest

Evolution Mining (Cowal) Pty Limited
Document Control Number: AQU-NW-005-21396C
00904218-009
Proprietary information for Evolution Mining (Cowal) Pty Limited only. Property of Pacific Environment Limited.
67
9. Greenhouse gas assessment
9.1 Introduction
GHG emissions have been estimated based on the methods outlined in the following documents:
The World Resources Institute/World Business Council for Sustainable Development (WRI/WBCSD) The
Greenhouse Gas Protocol – A Corporate Accounting and Reporting Standard Revised Edition (“the GHG
Protocol”) (WRI/WBCSD, 2004).
The National Greenhouse and Energy Reporting (Measurement) Determination 2008.
The NGA Factors July 2017 (DEE, 2017).
The GHG Protocol establishes an international standard for accounting and reporting of GHG emissions. The
GHG Protocol has been adopted by the International Standard Organisation, endorsed by GHG initiatives (such
as the Carbon Disclosure Proposal) and is compatible with existing GHG trading schemes.
Three ‘scopes’ of emissions (scope 1, scope 2 and scope 3) are defined for GHG accounting and reporting
purposes, as described below and summarised in Figure 9.1. This terminology has been adopted in Australian
GHG reporting and measurement methods and has been employed in this assessment.
Figure 9.1: Overview of scopes and emissions across a reporting entity

Evolution Mining (Cowal) Pty Limited
Document Control Number: AQU-NW-005-21396C
00904218-009
Proprietary information for Evolution Mining (Cowal) Pty Limited only. Property of Pacific Environment Limited.
68
9.2 Methodology
1) Scope 1: Direct Greenhouse Gas Emissions
Direct GHG emissions are defined as those emissions that occur from sources that are owned or controlled by
the reporting entity. Direct GHG emissions are those emissions that are principally the result of the following
types of activities undertaken by an entity:
Generation of electricity, heat or steam.
Physical or chemical processing.
Transportation of materials, products, waste and employees.
Fugitive emissions.
2) Scope 2: Energy Product Use Indirect Greenhouse Gas Emissions
Scope 2 emissions are a category of indirect emissions that account for GHG emissions from the generation of
purchased energy products (principally, electricity, steam/heat and reduction materials used for smelting) by the
entity. Scope 2 in relation to the Modification covers purchased electricity, defined as electricity that is purchased
or otherwise brought into the organisational boundary of the entity.
3) Scope 3: Other Indirect Greenhouse Gas Emissions
Scope 3 emissions are defined as those emissions that are a consequence of the activities of an entity, but which
arise from sources not owned or controlled by that entity. Some examples of scope 3 activities provided in the
GHG Protocol are extraction and production of purchased materials, transportation of purchased fuels, and use of
sold products and services.
The GHG Protocol provides that reporting scope 3 emissions is optional. If an organisation believes that scope 3
emissions are a significant component of the total emissions inventory, these can be reported along with scope 1
and scope 2. However, the GHG Protocol notes that reporting scope 3 emissions can result in double counting of
emissions and can also make comparisons between organisations and/or products difficult because reporting is
voluntary. Double counting needs to be avoided when compiling national inventories under the Kyoto Protocol.
The GHG Protocol also recognises that compliance regimes are more likely to focus on the “point of release” of
emissions (i.e. direct emissions) and/or indirect emissions from the purchase of electricity.
Scope 3 emissions have not been included in this assessment.
9.3 Greenhouse gas emission estimates
Inventories of GHG emissions can be calculated using published emission factors. Different gases have different
greenhouse warming effects (referred to as global warming potentials) and emission factors take into account the
global warming potentials of the gases created during combustion. The estimated emissions are referred to in
terms of carbon dioxide equivalent, or CO2-e, emissions by applying the relevant global warming potential. The
GHG assessment has been conducted using the NGA Factors, published by the DEE (2017).
Modification-related GHG sources included in the assessment are as follows:
Fuel consumption (diesel, unleaded petrol [ULP], liquid petroleum gas [LPG] and explosives) during
extraction and processing – scope 1.
Indirect emissions associated with on-site electricity use – scope 2.

Evolution Mining (Cowal) Pty Limited
Document Control Number: AQU-NW-005-21396C
00904218-009
Proprietary information for Evolution Mining (Cowal) Pty Limited only. Property of Pacific Environment Limited.
69
The remainder of the CGO mine life including the Modification is 15 years (2018 – 2032). Diesel and electricity
usage values have been provided by Evolution. It is assumed that LPG, ULP and explosive usage would vary
between years of operation relative to extraction and production rates.
A summary of annual GHG emissions is provided in Table 9.1. Detailed information on the calculation of GHG
emissions from the Modification are provided in Appendix B.
Table 9.1: Summary of estimated annual average CO2-e (tonnes)
Type of fuel Scope 1 Scope 2 Total
Diesel 37,836 - 37,836
Unleaded petrol 22 - 22
Propane (used as LPG) 811 - 811
Explosives 454 - 454
Electricity - 250,100 250,100
Total 39,123 250,100 289,223
The Modification’s contribution to projected climate change, and the associated impacts, would be in proportion
with its contribution to global GHG emissions. Average annual scope 1 and scope 2 emissions from the
Modification (approximately 0.29 Mt CO2-e) would represent approximately 0.049% of Australia’s commitment for
annual emissions under the Kyoto Protocol (591.5 Mt carbon dioxide equivalent per annum [CO2-e/annum]) and a
very small portion of global GHG emissions, given that Australia contributed approximately 1.15% of global GHG
emissions in 2014 (PBL Netherlands Environmental Assessment Agency, 2015).

Evolution Mining (Cowal) Pty Limited
Document Control Number: AQU-NW-005-21396C
00904218-009
Proprietary information for Evolution Mining (Cowal) Pty Limited only. Property of Pacific Environment Limited.
70
10. Monitoring and mitigation measures
10.1 Monitoring
The existing CGO air quality monitoring program includes:
an on-site meteorological station;
a network of static dust gauges within and surrounding the CGO area (including gauges proximal to nearby
residences, bird breeding areas, native flora areas and Lake Cowal);
TSP monitoring to the north of the CGO; and
an air quality monitoring review program as part of the AQMP.
The existing air quality monitoring review program would be continued for the Modification.
10.2 Mitigation measures
Emissions associated with the operation of the Modification would be generated from two primary sources as
follows:
wind blown dust from exposed areas and from disturbed locations where there is no vegetation cover; and
dust generated by mining activities including the mechanical disturbance of soils, waste rock and ore when
using conventional mining equipment, including the haulage of materials within ML 1535.
Air quality management and mitigation measures are currently implemented at the CGO in accordance with the
CGO AQMP (Evolution, 2015a) to control windblown and mine generated dust. These management and
mitigation measures include the procedures outlined in Table 10.1 and Table 10.2. These measures would
continue to be implemented for the Modification, but should be updated to account for the IWL construction phase
as well as construction of the Lake Cowal Road realignment and the pipeline duplication.
If excessive visible dust is observed in association with IWL construction activities following implementation of the
proposed dust mitigation measures, additional mitigation measures would be considered by Evolution.

Evolution Mining (Cowal) Pty Limited
Document Control Number: AQU-NW-005-21396C
00904218-009
Proprietary information for Evolution Mining (Cowal) Pty Limited only. Property of Pacific Environment Limited.
71
Table 10.1: Management methods for exposed areas dust sources
Source Mitigation measures
General areas disturbed by mining
Only the minimum area necessary for mining will be disturbed.
Exposed areas will be reshaped, topsoiled and revegetated as soon as practicable in accordance with DCC 2.4(b), to minimise the generation of wind erosion dust.
Waste emplacement areas
Exposed active work areas on waste emplacement surfaces will be watered to suppress dust where practicable.
Rehabilitation (i.e. reshaping, topsoil placement and revegetation) of waste emplacement areas will be conducted progressively, as soon as practicable following completion of landform, in accordance with DCC 2.4(b).
Tailings storage facilities
During non-operational periods, dust suppression measures will be undertaken to minimise dust emissions from dry exposed areas on the surface of the tailings storage facilities.
Soil stockpiles Long-term soil stockpiles will be revegetated with a cover crop.
Material handling and ore stockpiles
Prevention of truck overloading to reduce spillage during ore loading/unloading and hauling.
The coarse ore stockpile will be protected by a hood to prevent wind erosion of its surface.
The surface of all stockpiles will be sufficiently treated to minimise dust emissions. Such treatment may include application of a dust suppressant, regular dust suppression watering or establishment of vegetation on longer term stockpiles (e.g. the low grade ore stockpile).
Source: Evolution (2015a).

Evolution Mining (Cowal) Pty Limited
Document Control Number: AQU-NW-005-21396C
00904218-009
Proprietary information for Evolution Mining (Cowal) Pty Limited only. Property of Pacific Environment Limited.
72
Table 10.2: Management measures for mining generated dust sources
Source Mitigation measures
Haul roads All roads and trafficked areas will be watered and/or treated with an alternative dust suppressant (using water trucks or other methods) and regularly maintained (using graders) to minimise the generation of dust.
Routes will be clearly marked.
Obsolete roads will be ripped and re-vegetated.
Minor roads Development of minor roads will be limited and the locations of these will be clearly defined and within approved surface disturbance areas.
Regularly used minor roads will be watered and/or treated with an alternative dust suppressant (using water trucks or other methods) and regularly maintained.
Obsolete minor roads will be ripped and re-vegetated.
Materials handling Prevention of truck overloading to reduce spillage during ore loading/unloading and hauling.
A water spray dust suppression system will be used at the primary crusher bin during truck dumping of raw ore.
Freefall height during ore/waste stockpiling will be limited.
Soil stripping Soil stripping will be limited to areas required for mining operations.
Drilling Dust aprons will be lowered during drilling for collection of fine dust.
Water injection or dust suppression sprays will be used when high levels of dust are being generated.
Blasting Fine material collected during drilling will not be used for blast stemming.
Adequate stemming will be used at all times.
Blasting will only occur following an assessment of weather conditions by the Environmental Manager to ensure that wind speed and direction will not result in excess dust emissions from the site towards adjacent residences (refer to the Blast Management Plan [Evolution, 2015b] for further information).
Equipment maintenance
Emissions from mobile equipment exhausts will be minimised by the implementation of a maintenance programme to service equipment in accordance with the equipment manufacturer specifications
Source: Evolution (2015a).

Evolution Mining (Cowal) Pty Limited
Document Control Number: AQU-NW-005-21396C
00904218-009
Proprietary information for Evolution Mining (Cowal) Pty Limited only. Property of Pacific Environment Limited.
73
11. Conclusions
This report has assessed the potential impacts on air quality from operations at the CGO associated with the
Modification. Dispersion modelling was conducted to predict ground level dust concentration and deposition
levels due to the dust generating activities that would occur for the representative ‘worst case’ impacts years as
part of the Modification.
Predictions were made at the nearest residential receptors surrounding the mine and compared with the relevant
air quality assessment criteria. Cumulative impacts were also considered, taking into account the effects of other
non-mining sources of dust.
Dispersion modelling results indicated that predicted emissions for operations at the CGO incorporating the
Modification would comply with all relevant PM2.5, PM10, TSP and dust deposition assessment criteria (both
short-term and long-term) at all nearby residential properties.
The assessment has taken a conservative approach by considering the worst case operating conditions. The
predicted concentrations and deposition levels due to the proposed activities are therefore likely to be higher than
measured concentrations and deposition levels in practice. Notwithstanding, dust control would be a key part of
the operation. Day-to-day dust management and best practice control measures would be part of the standard
operating procedures to keep both emissions and resulting ground level concentrations as low as possible.
Dust emissions from construction of the Lake Cowal Road realignment and pipeline duplication would be
effectively managed through commonly applied mitigation measures and would not be expected to generate any
significant off-site concentrations.
Evolution would continue to manage potential impacts associated with the CGO through a range of dust controls
in accordance with the AQMP, which would be revised and updated for the Modification as required, particularly
in relation to the IWL construction and construction of the Lake Cowal Road realignment and pipeline duplication.
GHG emissions for the CGO including the Modification, as a result of fuel use, explosives use and electricity
consumption, have been estimated. Evolution would continue to calculate and report annual GHG emissions and
energy consumption from the CGO in accordance with existing regulatory requirements.

Evolution Mining (Cowal) Pty Limited
Document Control Number: AQU-NW-005-21396C
00904218-009
Proprietary information for Evolution Mining (Cowal) Pty Limited only. Property of Pacific Environment Limited.
74
12. References
Barrick (2003), “Cowal Gold Project Dust Management Plan”, August 2003.
Bureau of Meteorology (2016), Climatic Averages Australia, Bureau of Meteorology website, www.bom.gov.au.
Chow, J.C. (1995), “Measurement methods to determine compliance with ambient air quality standards for
suspended particles”, J. Air & Waste Manage. Assoc. 45, 320-382, May 1995.
Department of Environment and Conservation (2005), “Approved Methods for the Sampling and Analysis of Air
Pollutants in NSW”, August 2005.
Department of the Environment and Energy (2017), “National Greenhouse Account (NGA) Factors”. Published by
the Department of Environment and Energy, July 2017. http://www.environment.gov.au/climate-change/climate-
science-data/greenhouse-gas-measurement/publications/national-greenhouse-accounts-factors-july-2017
Evolution Mining (Cowal) Pty Ltd (2015a), “Cowal Gold Operations – Air Quality Management Plan”, prepared in
February 2015.
Evolution Mining (Cowal) Pty Ltd (2015b), “Cowal Gold Operation – Blast Management Plan”, prepared in
January 2015.
Evolution Mining (Cowal) Pty Ltd (2017), “Cowal Gold Operations – 2016 Annual Review”, prepared in July 2017.
Hurley, P. (2008), “TAPM V4. Part 1: Technical Description, CSIRO Marine and Atmospheric Research Paper”.
Hurley, P., Edwards, M. and Luhar, A. (2009), "Evaluation of TAPM V4 for Several Meteorological and Air
Pollution Datasets." Air Quality and Climate Change 43(3): 19.
National Environment Protection Council (1998a), “Ambient Air – National Environment Protection Measures for
Ambient Air Quality” National Environment Protection Council, Canberra.
National Environment Protection Council (1998b), “National Environmental Protection Measure and Impact
Statement for Ambient Air Quality”. National Environment Protection Council Service Corporation, Level 5,
81 Flinders Street, Adelaide SA 5000.
National Environment Protection Council (2016), “National Environment Protection (Ambient Air Quality)
Measure” as amended. 25 February 2016. National Environment Protection Council.
NSW Environment Protection Authority (2016), “Approved Methods for the Modelling and Assessment of Air
Pollutants in NSW”, November 2016.
NSW Government (2014), Voluntary Land Acquisition and Mitigation Policy for State Significant Mining,
Petroleum and Extractive Industry Development. NSW Government 15 December 2014. NSW Department of
Planning and Environment.
NSW Minerals Council (2000), “Technical Paper – Particulate Matter and Mining Interim Report”.
Office of Environment and Heritage (2011), Generic Guidance and Optimum Model Settings for the CALPUFF
Modelling System for Inclusion in the Approved Methods for the Modelling and Assessment of Air Pollutants in
NSW
Pacific Environment (2013), “Cowal Gold Mine Extension Modification – Air Quality Impact Assessment”.

Evolution Mining (Cowal) Pty Limited
Document Control Number: AQU-NW-005-21396C
00904218-009
Proprietary information for Evolution Mining (Cowal) Pty Limited only. Property of Pacific Environment Limited.
75
Pacific Environment (2016), “Cowal Gold Operations Modification 13 – Air Quality & Greenhouse Gas
Assessment”, 8 November 2016
PBL Netherlands Environmental Assessment Agency (2015), “Trends in Global CO2 Emissions. 2015 Report”.
Available from http://edgar.jrc.ec.europa.eu/news_docs/jrc-2015-trends-in-global-co2-emissions-2015-report-
98184.pdf.
Scire, J.S., Strimaitis, D.G. & Yamartino, R.J. (2000), “A User’s Guide for the CALPUFF Dispersion Model
(Version 5)”, Earth Tech, Inc., Concord.
United States Environment Protection Agency (1985 and updates), “Compilation of Air Pollutant Emission
Factors”, AP-42, Fourth Edition United States Environmental Protection Agency, Office of Air and Radiation Office
of Air Quality Planning and Standards, Research Triangle Park, North Carolina 27711.
World Health Organisation (2011), “World Health Organization Air Quality and Health Fact Sheet Number 313”.
http://www.who.int/mediacentre/factsheets/fs313/en/index.html (accessed 19 May 2016).
World Resources Institute/World Business Council for Sustainable Development (2004), “The World Resources
Institute/World Business Council for Sustainable Development Greenhouse Gas Protocol The Greenhouse Gas
Protocol – A Corporate Accounting and Reporting Standard Revised Edition”.

Evolution Mining (Cowal) Pty Limited
Document Control Number: AQU-NW-005-21396C
00904218-009
Proprietary information for Evolution Mining (Cowal) Pty Limited only. Property of Pacific Environment Limited.
A-1
Appendix A
Emission estimation

Evolution Mining (Cowal) Pty Limited
Document Control Number: AQU-NW-005-21396C
00904218-009
Proprietary information for Evolution Mining (Cowal) Pty Limited only. Property of Pacific Environment Limited.
A-2
The dust emission inventories have been prepared for each modelling year using the operational description of
the proposed modification.
Estimated emissions are presented for all significant dust generating activities associated with the operations.
The relevant emission factors used for the study are described below. With the exception of blasting and
activities on the TSF lifts, activities have been modelled for 24-hours per day.
Dust from wind erosion is assumed to occur over 24-hours per day, however, wind erosion is also assumed to be
proportional to the third power of wind speed. This will mean that most wind erosion occurs during the day when
wind speeds are highest.
Drilling
Emissions from drilling for each particle size fraction were estimated using the US EPA AP42 emission factors
given below.
ETSP = 0.59 kg/blast
EPM10 = 0.52 x ETSP kg/blast
EPM2.5 = 0.03 x ETSP kg/blast
Blasting
Emissions from blasting for each particle size fraction were estimated using the US EPA AP42 emission factors
given below.
ETSP = 0.00022 x A1.5 kg/blast
EPM10 = 0.52 x 0.00022 x A1.5 kg/blast
EPM2.5 = 0.03 x 0.00022 x A1.5 kg/blast
Where:
A = area to be blasted in square metres (m2)
Loading material / dumping overburden
Each tonne of material loaded will generate a quantity of dust that will depend on the wind speed and the
moisture content. The equation below shows the relationship between these variables and the appropriate
k-factor for each particle size fraction.
E = k × 0.0016 × ((U/2.2)1.3/(M/2)1.4) kg/t
Where:
k = 0.74 for TSP
k = 0.35 for PM10
k = 0.053 for PM2.5
U = wind speed (m/s)
M = moisture content (%)
kg/t = kilograms per tonne
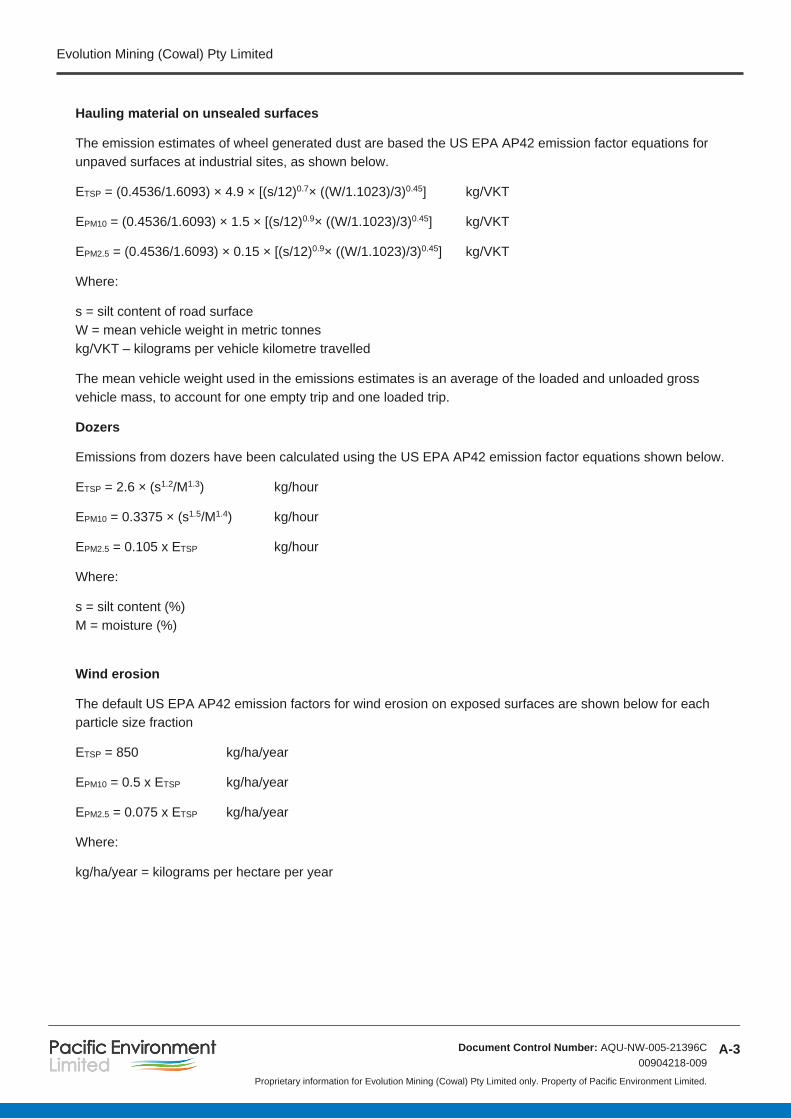
Evolution Mining (Cowal) Pty Limited
Document Control Number: AQU-NW-005-21396C
00904218-009
Proprietary information for Evolution Mining (Cowal) Pty Limited only. Property of Pacific Environment Limited.
A-3
Hauling material on unsealed surfaces
The emission estimates of wheel generated dust are based the US EPA AP42 emission factor equations for
unpaved surfaces at industrial sites, as shown below.
ETSP = (0.4536/1.6093) × 4.9 × [(s/12)0.7× ((W/1.1023)/3)0.45] kg/VKT
EPM10 = (0.4536/1.6093) × 1.5 × [(s/12)0.9× ((W/1.1023)/3)0.45] kg/VKT
EPM2.5 = (0.4536/1.6093) × 0.15 × [(s/12)0.9× ((W/1.1023)/3)0.45] kg/VKT
Where:
s = silt content of road surface
W = mean vehicle weight in metric tonnes
kg/VKT – kilograms per vehicle kilometre travelled
The mean vehicle weight used in the emissions estimates is an average of the loaded and unloaded gross
vehicle mass, to account for one empty trip and one loaded trip.
Dozers
Emissions from dozers have been calculated using the US EPA AP42 emission factor equations shown below.
ETSP = 2.6 × (s1.2/M1.3) kg/hour
EPM10 = 0.3375 × (s1.5/M1.4) kg/hour
EPM2.5 = 0.105 x ETSP kg/hour
Where:
s = silt content (%)
M = moisture (%)
Wind erosion
The default US EPA AP42 emission factors for wind erosion on exposed surfaces are shown below for each
particle size fraction
ETSP = 850 kg/ha/year
EPM10 = 0.5 x ETSP kg/ha/year
EPM2.5 = 0.075 x ETSP kg/ha/year
Where:
kg/ha/year = kilograms per hectare per year

Evolution Mining (Cowal) Pty Limited
Document Control Number: AQU-NW-005-21396C
00904218-009
Proprietary information for Evolution Mining (Cowal) Pty Limited only. Property of Pacific Environment Limited.
A-4
Grading roads
Estimates of emissions from grading roads have been made using the US EPA AP42 emission factor equations
for each particle size fraction, as shown below.
ETSP = 0.0034 x S2.5 kg/km
EPM10 = 0.00336 x S2 kg/km
EPM2.5 = 0.0001054 x S2.5 kg/km
Where:
S = speed of the grader in km/h (taken to be 8 km/h)
The following tables provide a summary of the variables used to calculate TSP emissions for each modelling
year. These variables include such things as haul road distances, silt and moisture contents vehicle payloads,
vehicle weights and the volumes of material handled. Similar tables for PM10 and PM2.5 can be provided if
required, but will include the same variables. The differences between the particle size fractions are in the
emission equations themselves which have been provided above.

Evolution Mining (Cowal) Pty Limited
Document Control Number: AQU-NW-005-21396C
00904218-009
Proprietary information for Evolution Mining (Cowal) Pty Limited only. Property of Pacific Environment Limited.
A-5
Estimated emissions for Year 16 (2020)
ACTIVITYTSP emission
(kg/y)Intensity units
Emission
factorunits
Variable
1units
Variable
2units
Variable
3units
Variable
4units
Variable
5units
Variable
6units
2020
Drilling 8,098 45,750 holes/y 0.590 kg/hole 70 % control
Blasting 28,808 183 blasts/y 157 kg/blast 8,000 Area of blast in square metres
Waste - Excavators loading haul trucks 39,658 20,400,000 t/y 0.00194 kg/t 1.642 average of (wind speed/2.2)̂ 1.3 in m/s 2.0 moisture content in %
Waste - Hauling to IWL construction area 1,633,326 20,400,000 t/y 0.5338 kg/t 184 payload (tonnes) 225 Average vehicle mass (tonnes) 18.0 km/return trip 5.46 kg/VKT 5 % silt content 85 % control
Waste - Hauling stripped IWL material to northern stockpiles 55,767 2,411,033 t/y 0.1542 kg/t 184 payload (tonnes) 225 Average vehicle mass (tonnes) 5.2 km/return trip 5.46 kg/VKT 5 % silt content 85 % control
Waste - Unloading at IWL construction area 39,658 20,400,000 t/y 0.00194 kg/t 1.642 average of (wind speed/2.2)̂ 1.3 in m/s 2.0 moisture content in %
Waste - Unloading stripped material at northern stockpiles 4,687 2,411,033 t/y 0.00194 kg/t 1.642 average of (wind speed/2.2)̂ 1.3 in m/s 2.0 moisture content in %
Waste - Loading trucks with clay at Hardstand area for IWL 2,459 1,265,000 t/y 0.00194 kg/t 1.642 average of (wind speed/2.2)̂ 1.3 in m/s 2.0 moisture content in %
Waste - Loading trucks with clay at Hardstand area for STSF 381 195,794 t/y 0.00194 kg/t 1.642 average of (wind speed/2.2)̂ 1.3 in m/s 2.0 moisture content in %
Waste - Hauling clay from Hardstand to IWL construction area 102,260 1,265,000 t/y 0.5389 kg/t 45 payload (tonnes) 52 Average vehicle mass (tonnes) 8.6 km/return trip 2.82 kg/VKT 5 % silt content 85 % control
Waste - Hauling clay from Hardstand to STSF 15,828 195,794 t/y 0.5389 kg/t 45 payload (tonnes) 52 Average vehicle mass (tonnes) 8.6 km/return trip 2.82 kg/VKT 5 % silt content 85 % control
Waste - Unloading clay at IWL construction area 2,459 1,265,000 t/y 0.00194 kg/t 1.642 average of (wind speed/2.2)̂ 1.3 in m/s 2.0 moisture content in %
Waste - Unloading clay at STSF 381 195,794 t/y 0.00194 kg/t 1.642 average of (wind speed/2.2)̂ 1.3 in m/s 2.0 moisture content in %
Waste - Dozers in pit 20,819 5,716 h/y 7.28 kg/h 2.0 moisture content in % 5.0 silt content 50 % control
Waste - Dozers on IWL construction area 35,894 9,855 h/y 7.28 kg/h 2.0 moisture content in % 5.0 silt content 50 % control
Waste - Dozers on STSF area 35,894 9,855 h/y 7.28 kg/h 2.0 moisture content in % 5.0 silt content 50 % control
Ore - Loading mineral waste ore to haul trucks 4,471 2,300,000 t/y 0.00194 kg/t 1.642 average of (wind speed/2.2)̂ 1.3 in m/s 2.0 moisture content in %
Ore - Hauling mineral waste ore to northern dump 160,642 2,300,000 t/y 0.3492 kg/t 136 payload (tonnes) 181.0 Average vehicle mass (tonnes) 9.6 km/return trip 4.95 kg/VKT 5 % silt content 80 % control
Ore - Unloading mineral waste ore to northern dump 4,471 2,300,000 t/y 0.00194 kg/t 1.642 average of (wind speed/2.2)̂ 1.3 in m/s 2.0 moisture content in %
Ore - Loading ore to haul trucks 5,249 2,700,000 t/y 0.00194 kg/t 1.642 average of (wind speed/2.2)̂ 1.3 in m/s 2.0 moisture content in %
Ore - Hauling ore to ROM pad 165,008 2,700,000 t/y 0.3056 kg/t 136 payload (tonnes) 181.0 Average vehicle mass (tonnes) 8.4 km/return trip 4.95 kg/VKT 5 % silt content 80 % control
Ore - Unloading ore to ROM pad 1,575 2,700,000 t/y 0.00194 kg/t 1.642 average of (wind speed/2.2)̂ 1.3 in m/s 2.0 moisture content in % 70 % control
Ore - Rehandling ore 945 1,620,000 t/y 0.00194 kg/t 1.642 average of (wind speed/2.2)̂ 1.3 in m/s 2.0 moisture content in % 70 % control
Ore - Crushing and screening 4,590 2,700,000 t/y 0.00170 kg/t
Ore - Loading to coarse ore stockpile 4,607 7,900,000 t/y 0.00194 kg/t 1.642 average of (wind speed/2.2)̂ 1.3 in m/s 2.0 moisture content in % 70 % control
Gravel - loading to trucks in pit 292 150,000 t/y 0.00194 kg/t 1.642 average of (wind speed/2.2)̂ 1.3 in m/s 2.0 moisture content in %
Gravel - Hauling from pit to mobile crusher 12,659 150,000 t/y 0.4220 kg/t 136 payload (tonnes) 181.0 Average vehicle mass (tonnes) 11.6 km/return trip 4.95 kg/VKT 5 % silt content 80 % control
Gravel - unloading at crusher 87 150,000 t/y 0.00194 kg/t 1.642 average of (wind speed/2.2)̂ 1.3 in m/s 2.0 moisture content in % 70 % control
Gravel - crushing 255 150,000 t/y 0.00170 kg/t
Grading roads 10,783 35,040 km/y 0.62 kg/km 4,380 h/y 8 speed of graders in km/h 50 % control
Wind erosion - Open pit 93,500 110 ha 850 kg/ha/y
Wind erosion - Northern dump 102,850 121 ha 850 kg/ha/y
Wind erosion - Stockpiles and exposed areas 65,450 77 ha 850 kg/ha/y
Wind erosion - Northern stockpiles 69,488 109 ha 850 kg/ha/y 25 % control
Wind erosion - IWL construction area 87,550 206 ha 850 kg/ha/y 50 % control

Evolution Mining (Cowal) Pty Limited
Document Control Number: AQU-NW-005-21396C
00904218-009
Proprietary information for Evolution Mining (Cowal) Pty Limited only. Property of Pacific Environment Limited.
A-6
Estimated emissions for Year 20 (2024)
ACTIVITYTSP emission
(kg/y)Intensity units
Emission
factorunits
Variable
1units
Variable
2units
Variable
3units
Variable
4units
Variable
5units
Variable
6units
2024
Drilling 8,098 45,750 holes/y 0.590 kg/hole 70 % control
Blasting 28,808 183 blasts/y 157 kg/blast 8,000 Area of blast in square metres
Waste - Excavators loading haul trucks 1,166 600,000 t/y 0.00194 kg/t 1.642 average of (wind speed/2.2)̂ 1.3 in m/s 2.0 moisture content in %
Waste - Hauling to northern waste dump 46,260 600,000 t/y 0.3855 kg/t 184 payload (tonnes) 225 Average vehicle mass (tonnes) 13.0 km/return trip 5.46 kg/VKT 5 % silt content 80 % control
Waste - Unloading at northern waste dump 1,166 600,000 t/y 0.00194 kg/t 1.642 average of (wind speed/2.2)̂ 1.3 in m/s 2.0 moisture content in %
Waste - Loading trucks with clay at Hardstand area for IWL 1,788 920,000 t/y 0.00194 kg/t 1.642 average of (wind speed/2.2)̂ 1.3 in m/s 2.0 moisture content in %
Waste - Hauling clay from Hardstand to IWL construction area 99,162 920,000 t/y 0.5389 kg/t 45 payload (tonnes) 52 Average vehicle mass (tonnes) 8.6 km/return trip 2.82 kg/VKT 5 % silt content 80 % control
Waste - Unloading clay at IWL construction area 1,788 920,000 t/y 0.00194 kg/t 1.642 average of (wind speed/2.2)̂ 1.3 in m/s 2.0 moisture content in %
Waste - Dozers in pit 20,819 5,716 h/y 7.28 kg/h 2.0 moisture content in % 5.0 silt content 50 % control
Waste - Dozers on IWL construction area 35,894 9,855 h/y 7.28 kg/h 2.0 moisture content in % 5.0 silt content 50 % control
Waste - Dozers on STSF area 35,894 9,855 h/y 7.28 kg/h 2.0 moisture content in % 5.0 silt content 50 % control
Ore - Loading mineral waste ore to haul trucks 6,610 3,400,000 t/y 0.00194 kg/t 1.642 average of (wind speed/2.2)̂ 1.3 in m/s 2.0 moisture content in %
Ore - Hauling mineral waste ore to northern dump 237,471 3,400,000 t/y 0.3492 kg/t 136 payload (tonnes) 181.0 Average vehicle mass (tonnes) 9.6 km/return trip 4.95 kg/VKT 5 % silt content 80 % control
Ore - Unloading mineral waste ore to northern dump 6,610 3,400,000 t/y 0.00194 kg/t 1.642 average of (wind speed/2.2)̂ 1.3 in m/s 2.0 moisture content in %
Ore - Loading ore to haul trucks 18,274 9,400,000 t/y 0.00194 kg/t 1.642 average of (wind speed/2.2)̂ 1.3 in m/s 2.0 moisture content in %
Ore - Hauling ore to ROM pad 574,471 9,400,000 t/y 0.3056 kg/t 136 payload (tonnes) 181.0 Average vehicle mass (tonnes) 8.4 km/return trip 4.95 kg/VKT 5 % silt content 80 % control
Ore - Unloading ore to ROM pad 5,482 9,400,000 t/y 0.00194 kg/t 1.642 average of (wind speed/2.2)̂ 1.3 in m/s 2.0 moisture content in % 70 % control
Ore - Rehandling ore 3,289 5,640,000 t/y 0.00194 kg/t 1.642 average of (wind speed/2.2)̂ 1.3 in m/s 2.0 moisture content in % 70 % control
Ore - Crushing and screening 15,980 9,400,000 t/y 0.00170 kg/t
Ore - Loading to coarse ore stockpile 5,715 9,800,000 t/y 0.00194 kg/t 1.642 average of (wind speed/2.2)̂ 1.3 in m/s 2.0 moisture content in % 70 % control
Gravel - loading to trucks in pit 292 150,000 t/y 0.00194 kg/t 1.642 average of (wind speed/2.2)̂ 1.3 in m/s 2.0 moisture content in %
Gravel - Hauling from pit to mobile crusher 12,659 150,000 t/y 0.4220 kg/t 136 payload (tonnes) 181.0 Average vehicle mass (tonnes) 11.6 km/return trip 4.95 kg/VKT 5 % silt content 80 % control
Gravel - unloading at crusher 87 150,000 t/y 0.00194 kg/t 1.642 average of (wind speed/2.2)̂ 1.3 in m/s 2.0 moisture content in % 70 % control
Gravel - crushing 255 150,000 t/y 0.00170 kg/t
Grading roads 10,783 35,040 km/y 0.62 kg/km 4,380 h/y 8 speed of graders in km/h 50 % control
Wind erosion - Open pit 93,500 110 ha 850 kg/ha/y
Wind erosion - Northern dump 76,500 90 ha 850 kg/ha/y
Wind erosion - Stockpiles and exposed areas 65,450 77 ha 850 kg/ha/y
Wind erosion - Northern stockpiles 85,000 100 ha 850 kg/ha/y
Wind erosion - Dry TSF and IWL construction area 232,050 273 ha 850 kg/ha/y

Evolution Mining (Cowal) Pty Limited
Document Control Number: AQU-NW-005-21396C
00904218-009
Proprietary information for Evolution Mining (Cowal) Pty Limited only. Property of Pacific Environment Limited.
B-1
Appendix B
Greenhouse gas emission calculations

Evolution Mining (Cowal) Pty Limited
Document Control Number: AQU-NW-005-21396C
00904218-009
Proprietary information for Evolution Mining (Cowal) Pty Limited only. Property of Pacific Environment Limited.
B-2
Fuel consumption
Diesel
GHG emissions from diesel consumption were estimated using the following equation:
Equation 1:
𝐸𝐶𝑂2−𝑒 =𝑄 × 𝐸𝐹
1000
Where:
ECO2-e Emissions of GHG from diesel combustion (t CO2-e)1
Q Estimated combustion of diesel (GJ)2
EF Emission factor (scope 1) for diesel combustion (kg CO2-e/GJ)3
1 t CO2-e = tonnes of carbon dioxide equivalent 2 GJ = gigajoules 3 kg CO2-e/GJ = kilograms of carbon dioxide equivalents per gigajoule
The quantity of diesel consumed (Q) each year is based on usage numbers provided by Evolution. The quantity
of diesel consumed in GJ is calculated using an energy content factor for diesel of 38.6 gigajoules per kilolitre
(GJ/kL). The Scope 1 emission factor is 69.9 kg CO2 e/GJ (DEE, 2017). The estimated annual and total life of
mine GHG emissions from diesel usage are presented in Table B1 below.
Table B1: Estimated scope 1 CO2-e (tonnes) for diesel consumption
Year Usage (kilolitres [kL]) Emissions (t CO2-e)
2018 31,915 86,850
2019 30,703 83,553
2020 27,629 75,186
2021 29,342 79,848
2022 23,735 64,591
2023 18,516 50,388
2024 8,654 23,551
2025 5,526 15,039
2026 5,446 14,819
2027 5,056 13,758
2028 5,480 14,914
2029 4,895 13,320
2030 5,970 16,246
2031 4,837 13,164
2032 849 2,310
Total 208,554 567,538

Evolution Mining (Cowal) Pty Limited
Document Control Number: AQU-NW-005-21396C
00904218-009
Proprietary information for Evolution Mining (Cowal) Pty Limited only. Property of Pacific Environment Limited.
B-3
Unleaded petrol
GHG emissions from ULP consumption were estimated using Equation 1 as above.
The quantity of ULP consumed (Q) each year is based on usage numbers provided by Evolution. The quantity of
ULP consumed in GJ is calculated using an energy content factor for gasoline (ULP) of 34.2 GJ/kL. The Scope 1
emission factor is 67.4 kg CO2 e/GJ (DEE, 2017). The estimated annual and total life of mine GHG emissions
from ULP usage are presented in Table B2 below.
Table B2: Estimated scope 1 CO2-e (tonnes) for unleaded petrol consumption
Year Usage (kL) Emissions (t CO2-e)
2018 20 48
2019 17 41
2020 15 37
2021 17 40
2022 17 42
2023 11 26
2024 11 27
2025 5 12
2026 4 10
2027 4 10
2028 4 10
2029 4 10
2030 5 13
2031 4 9
2032 1 2
Total 139 334

Evolution Mining (Cowal) Pty Limited
Document Control Number: AQU-NW-005-21396C
00904218-009
Proprietary information for Evolution Mining (Cowal) Pty Limited only. Property of Pacific Environment Limited.
B-4
Propane (used as LPG)
GHG emissions from propane consumption were estimated using Equation 1 as above.
The quantity of propane consumed (Q) each year is based on usage numbers provided by Evolution. The
quantity of propane consumed in GJ is calculated using an energy content factor for propane (as LPG) of
25.7 GJ/kL. The Scope 1 emission factor is 60.2 kg CO2 e/GJ (DEE, 2017). The estimated annual and total life
of mine GHG emissions from propane usage are presented in Table B3 below.
Table B3: Estimated scope 1 CO2-e (tonnes) for propane consumption
Year Usage (kL) Emissions (t CO2-e)
2018 1,121 1,746
2019 952 1,483
2020 864 1,345
2021 928 1,445
2022 975 1,518
2023 619 964
2024 623 971
2025 273 424
2026 232 361
2027 232 361
2028 232 361
2029 232 361
2030 298 464
2031 199 310
2032 35 54
Total 7,778 12,168

Evolution Mining (Cowal) Pty Limited
Document Control Number: AQU-NW-005-21396C
00904218-009
Proprietary information for Evolution Mining (Cowal) Pty Limited only. Property of Pacific Environment Limited.
B-5
Explosives use
GHG emissions from explosives usage were estimated using the following equation:
Equation 2:
𝐸𝑐𝑜2−𝑒 = 𝑄 × 𝐸𝐹
Where:
ECO2-e Emissions of GHG from explosives (t CO2-e/annum)1
Q Estimated combustion of explosives (t)
EF Emission factor (scope 1) for explosive combustion (t CO2-e/tonne explosive)2
1. t CO2-e/annum = tonnes of carbon dioxide equivalent per annum
2. t CO2-e/tonne explosive = tonnes of carbon dioxide equivalent per tonne of explosive
Greenhouse gas emission factors were sourced from the NGA Factors February 2008. It is noted that the AGO
Factors and Methods were replaced by the NGA Factors, however the emission factor for explosives was
excluded from the latest version. Emissions from explosives do not have to be reported under the National
Greenhouse and Energy Reporting System (NGERS).
The quantity of explosives consumed in each year is based on an explosives intensity rate (t explosives/waste
rock), calculated from usage numbers provided by Evolution.
The scope 1 emission factor is 0.167 t CO2-e/GJ. The estimated annual and total life of mine GHG emissions
from explosive usage are presented in Table 4 below.
Table B4: Estimated scope 1 CO2-e (tonnes) for explosive use
Year Usage (t) Emissions (t CO2-e)
2018 7,941 1,326
2019 6,374 1,064
2020 6,528 1,090
2021 6,117 1,021
2022 6,554 1,094
2023 3,444 575
2024 3,444 575
2025 360 60
2026 0 0
2027 0 0
2028 0 0
2029 0 0
2030 0 0
2031 0 0
2032 0 0
Total 40,760 6,807
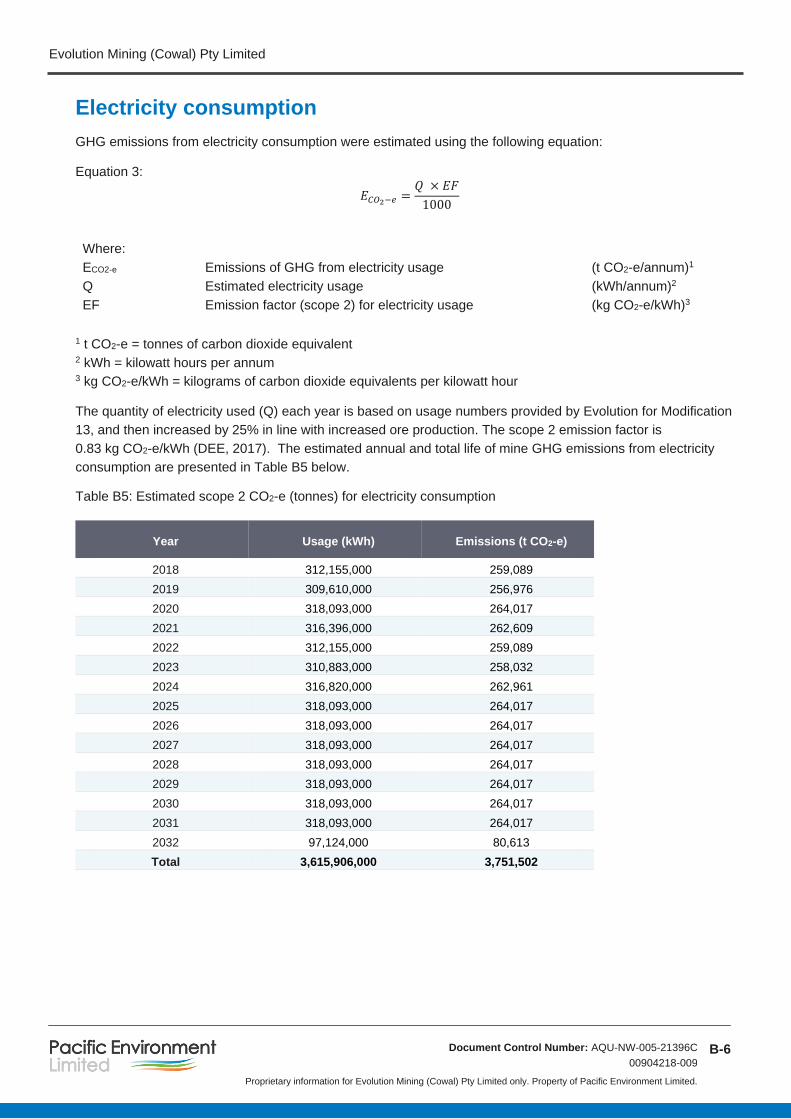
Evolution Mining (Cowal) Pty Limited
Document Control Number: AQU-NW-005-21396C
00904218-009
Proprietary information for Evolution Mining (Cowal) Pty Limited only. Property of Pacific Environment Limited.
B-6
Electricity consumption
GHG emissions from electricity consumption were estimated using the following equation:
Equation 3:
𝐸𝐶𝑂2−𝑒 =𝑄 × 𝐸𝐹
1000
Where:
ECO2-e Emissions of GHG from electricity usage (t CO2-e/annum)1
Q Estimated electricity usage (kWh/annum)2
EF Emission factor (scope 2) for electricity usage (kg CO2-e/kWh)3
1 t CO2-e = tonnes of carbon dioxide equivalent 2 kWh = kilowatt hours per annum 3 kg CO2-e/kWh = kilograms of carbon dioxide equivalents per kilowatt hour
The quantity of electricity used (Q) each year is based on usage numbers provided by Evolution for Modification
13, and then increased by 25% in line with increased ore production. The scope 2 emission factor is
0.83 kg CO2-e/kWh (DEE, 2017). The estimated annual and total life of mine GHG emissions from electricity
consumption are presented in Table B5 below.
Table B5: Estimated scope 2 CO2-e (tonnes) for electricity consumption
Year Usage (kWh) Emissions (t CO2-e)
2018 312,155,000 259,089
2019 309,610,000 256,976
2020 318,093,000 264,017
2021 316,396,000 262,609
2022 312,155,000 259,089
2023 310,883,000 258,032
2024 316,820,000 262,961
2025 318,093,000 264,017
2026 318,093,000 264,017
2027 318,093,000 264,017
2028 318,093,000 264,017
2029 318,093,000 264,017
2030 318,093,000 264,017
2031 318,093,000 264,017
2032 97,124,000 80,613
Total 3,615,906,000 3,751,502