Air Pollution in the UK 2015 · PDF fileAn ‘air pollution episode’ means a period...
124
Air Pollution in the UK 2015 September 2016
Transcript of Air Pollution in the UK 2015 · PDF fileAn ‘air pollution episode’ means a period...

Air Pollution in the UK 2015
September 2016

ii
© Crown copyright 2016
You may re-use this information (excluding logos) free of charge in any format or medium,
under the terms of the Open Government Licence v.3. To view this licence visit
www.nationalarchives.gov.uk/doc/open-government-licence/version/3/ or email
This publication is available at https://uk-air.defra.gov.uk/library/annualreport/index
Any enquiries regarding this publication should be sent to us at

iii
Executive Summary The UK is currently required to report air quality data on an annual basis under the following European Directives:
The Council Directive on ambient air quality and cleaner air for Europe (2008/50/EC).
The Fourth Daughter Directive (2004/107/EC) under the Air Quality Framework Directive (1996/62/EC).
This report provides background information on the pollutants covered by these Directives and the UK’s Air Quality Strategy; their sources and effects, the UK’s statutory monitoring networks, and the UK’s modelling methodology. The report then summarises the UK’s 2015 submission on ambient air quality to the European Commission, presenting air quality modelling data and measurements from national air pollution monitoring networks. The pollutants covered in this report are:
Sulphur dioxide (SO2)
Nitrogen oxides (NOx) comprising NO and NO2
PM10 and PM2.5 particles
Benzene
1,3-Butadiene
Carbon Monoxide (CO)
Metallic Pollutants
Polycyclic aromatic hydrocarbons (PAH)
Ozone (O3) These data are reported on behalf of Defra (the Department for Environment, Food and Rural Affairs) and the Devolved Administrations of Scotland, Wales and Northern Ireland. For the purposes of air quality monitoring, the UK is divided into 43 zones. Overall, the latest data show an improving picture compared to the previous year’s data. The 2015 results are detailed in section 4 of this report and summarised below:
The UK met the limit value for hourly mean nitrogen dioxide (NO2) in all but two zones.
Six zones were compliant with the limit value for annual mean NO2. The remaining 37 exceeded this limit value.
Five zones exceeded the target value for benzo[a]pyrene in 2015.
Two zones exceeded the target value for nickel in 2015.
All zones met both the target values for ozone; the target value based on the maximum daily eight-hour mean, and the target value based on the AOT40 statistic.

iv
All zones exceeded the long-term objective for ozone, set for the protection of human health. This is based on the maximum daily eight-hour mean.
One zone exceeded the long-term objective for ozone, set for the protection of vegetation. This is based on the AOT40 statistic.
After subtraction of the contribution from natural sources all zones met the limit value for daily mean concentration of PM10 particulate matter.
All zones met the limit value for annual mean concentration of PM10 particulate matter.
All zones met the target value for annual mean concentration of PM2.5 particulate matter, the Stage 1 limit value, which came into force on 1st January 2015, and the Stage 2 limit value which must be met by 2020.
All zones met the EU limit values for sulphur dioxide, carbon monoxide, lead and benzene.
A summary of the air quality assessment for 2015 with a comparison of the submissions carried out in the previous years (since 2008 when the Air Quality Directive came into force) can be found in section 4.3 of this report. Copies of those previous annual submissions can be found on the Commission website: http://cdr.eionet.europa.eu/gb/eu/annualair. For more information on air quality in the UK visit the Defra website at www.gov.uk/defra and the UK Air Quality websites at http://uk-air.defra.gov.uk/, www.scottishairquality.co.uk, www.welshairquality.co.uk and www.airqualityni.co.uk.

v
Glossary Air Quality Directive. The European Union’s Directive 2008/50/EC of 21st May 2008, on Ambient Air Quality and Cleaner Air for Europe is often – as in this report - referred to as ‘the Air Quality Directive’. Air Quality Strategy. The United Kingdom’s own National Air Quality Strategy, containing policies for assessment and management of air quality in the UK. This was first published in 1997, as a requirement of The Environment Act 1995. Air Quality Strategy Objective. The Air Quality Strategy sets objectives for the maximum concentrations of eight pollutants. These are at least as stringent as the limit values of the Air Quality Directive. Ambient Air. Outdoor air. Benzene. A chemical compound that is harmful to human health. As an air pollutant, benzene can be emitted from domestic and industrial combustion processes, and road vehicles. Its chemical formula is C6 H6. Benzo [a] Pyrene. One of a group of compounds called polycyclic aromatic hydrocarbons (PAHs) that can be air pollutants. The main sources of B[a]P in the UK are domestic coal and wood burning, fires, and industrial processes such as coke production. 1,3-Butadiene. This is an organic compound emitted into the atmosphere mainly from fuel combustion e.g. petrol and diesel vehicles. 1,3-butadiene is also an important chemical in certain industrial processes, particularly the manufacture of synthetic rubber. 1,3-butadiene is known to cause cancer in humans. Carbon Monoxide (CO) a pollutant gas found released in road vehicle exhausts. When breathed in, carbon monoxide affects the blood’s ability to carry oxygen around the body. Episode (Air Pollution Episode). An ‘air pollution episode’ means a period of time (usually a day or several days) when air pollution is high (air quality is poor). FDMS. This stands for ‘Filter Dynamic Measurement System’ and refers to a type of instrument for monitoring concentrations of particulate matter. The FDMS is a modified form of TEOM. Fourth Daughter Directive. The European Union’s Directive 2004/107/EC, which covers the four metallic elements cadmium, arsenic, nickel and mercury together with polycyclic aromatic hydrocarbons (PAH). (Its name comes from its origin as one of four so-called Daughter Directives set up under an overarching ‘framework Directive’.)

vi
Limit value. The Air Quality Directive sets ‘limit values’ for ambient concentrations of pollutants. Limit values are legally binding and must not be exceeded. All Member States of the EU must make the limit values part of their own air quality legislation. Long-Term Objectives. As well as limit values and target values, the Air Quality Directive sets ‘long-term objectives’ for ozone concentration. These are similar to limit values but are not legally mandatory. Member States must take all necessary measures not entailing disproportionate costs to meet the target values and long-term objectives. Member States. Countries that are part of the European Union. Microgramme per cubic metre (µg m-3). Unit often used to express concentration of a pollutant in air. 1 µg = 1 millionth of a gramme or 1 x 10⁻⁶ g. Micrometre (µm). Unit of length often used for the size of particulate pollutants. 1 µm = 1 millionth of a metre (1 x 10⁻⁶ m) or one thousandth of a millimetre. Milligramme per cubic metre (mg m-3). Unit often used to express concentration of carbon monoxide in air. 1 mg = 1 thousandth of a gramme or 1 x 10⁻³ g. Nickel (Ni) A toxic metallic element found in ambient air as a result of releases from oil and coal combustion, metal processes, manufacturing and other sources Nitric oxide (NO). One of the oxides of nitrogen formed in combustion processes. NO is not harmful to human health but combines with oxygen to form nitrogen dioxide. Nitrogen Dioxide (NO2) One of the oxides of nitrogen formed in combustion processes. At high concentrations NO2 is an irritant to the airways. NO2 can also make people more likely to catch respiratory infections (such as flu), and to react to allergens. Nitrogen Oxides. Compounds formed when nitrogen and oxygen combine. NOx, which comprises nitric oxide (NO) and nitrogen dioxide (NO2), is emitted from combustion processes. Main sources include power generation, industrial combustion and road transport. Ozone (O3). A pollutant gas which is not emitted directly from any source in significant quantities, but is produced by reactions between other pollutants in the presence of sunlight. (This is what is known as a ‘secondary pollutant’.) Ozone concentrations are greatest in the summer. O3 can travel long distances and reach high concentrations far away from the original pollutant sources. Ozone is an irritant to the airways of the lungs, throat and eyes: it can also harm vegetation. Particulate Matter (PM). Small airborne particles. PM may contain many different materials such as soot, wind-blown dust or secondary components, which are formed

vii
within the atmosphere as a result of chemical reactions. Some PM is natural and some is man-made. Particulate matter can be harmful to human health when inhaled, and research shows a range of health effects associated with PM. In general, the smaller the particle the deeper it can be inhaled into the lung. PM10. Particles which pass through a size-selective inlet with a 50 % efficiency cut-off at 10 μm aerodynamic diameter, as defined in ISO 7708:1995, Clause 6. This size fraction is important in the context of human health, as these particles are small enough to be inhaled into the airways of the lung – described as the ‘thoracic convention’ in the above ISO standard. PM10 is often described as ‘particles of less than 10 micrometres in diameter’ though this is not strictly correct. PM2.5. Particles which pass through a size-selective inlet with a 50 % efficiency cut-off at 2.5 μm aerodynamic diameter, as defined in ISO 7708:1995, Clause 7.1. This size fraction is important in the context of human health, as these particles are small enough to be inhaled very deep into the lung – described as the ‘high risk respirable convention’ in the above ISO standard. PM2.5 is often described as ‘particles of less than 2.5 micrometres in diameter’ though this is not strictly correct. Polycyclic Aromatic Hydrocarbons (PAH). PAHs are a large group of chemical compounds that are toxic and carcinogenic. Once formed, they can remain in the environment for a long time, and can be passed up the food chain. The main sources are domestic coal and wood burning, outdoor fires, and some industrial processes. The pollutant benzo [a] pyrene is a PAH, and because it is one of the more toxic PAH compounds it is measured as a ‘marker’ for this group of pollutants. Secondary pollutant. A pollutant which is formed by chemical reactions from other pollutants in the atmosphere. Ozone, for example, is a secondary pollutant. Sulphur dioxide (SO2). An acid gas formed when fuels containing sulphur impurities are burned. SO2 irritates the airways of the lung. Target Value. As well as limit values, the Air Quality Directive and Fourth Daughter Directive set target values for some pollutants. These are similar to limit values but are not legally mandatory. Member States must take all necessary measures not entailing disproportionate costs to meet the target values. TEOM. This stands for ‘Tapered Element Oscillating Microbalance’. This is a type of instrument used to monitor concentrations of particulate matter. TOMPs. This stands for ‘Toxic Organic Micropollutants’. These are compounds that are present in the environment at very low concentrations, but are highly toxic and persistent. They include dioxins and dibenzofurans.

viii
Contents
1 Introduction ................................................................................................................... 1
2 Legislative and Policy Framework ................................................................................ 3
2.1 European and International Background .................................................................. 3
2.2 The UK Perspective ................................................................................................. 7
2.3 Local Authority Air Quality Management ................................................................ 12
3 The Evidence Base ..................................................................................................... 17
3.1 Pollutants of Concern ............................................................................................. 17
3.2 Assessment of Air Quality in the UK ...................................................................... 26
3.3 Current UK Air Quality Monitoring .......................................................................... 26
3.4 Quality Assurance and Quality Control .................................................................. 33
3.5 Modelling ............................................................................................................... 35
3.6 Access to Assessment Data .................................................................................. 37
4 Assessment of Compliance ........................................................................................ 38
4.1 Definition of Zones ................................................................................................. 38
4.2 Air Quality Assessment for 2015 ............................................................................ 40
4.3 Comparison with Previous Years ........................................................................... 50
5 Spatial Variation and Changes Over Time .................................................................. 54
5.1 Sulphur Dioxide ...................................................................................................... 55
5.2 Nitrogen Dioxide .................................................................................................... 59
5.3 PM10 Particulate Matter .......................................................................................... 64
5.4 PM2.5 Particulate Matter ......................................................................................... 69

ix
5.5 Benzene ................................................................................................................. 73
5.6 1,3-Butadiene......................................................................................................... 76
5.7 Carbon Monoxide ................................................................................................... 78
5.8 Ozone .................................................................................................................... 81
5.9 Metallic Elements ................................................................................................... 85
5.10 Benzo [a] Pyrene ................................................................................................ 93
6 Pollution Events in 2015 ............................................................................................. 97
6.1 Spring Particulate Pollution Episodes .................................................................... 97
6.2 Summer Ozone Events ........................................................................................ 100
6.3 Bonfire Night Particulate Pollution ........................................................................ 102
6.4 Winter Saharan Dust Episodes ............................................................................ 104
7 Where to Find Out More ........................................................................................... 107
References ...................................................................................................................... 109

1
1 Introduction
A cleaner, healthier environment benefits people and the economy. Clean air is vital
for people’s health and the environment, essential for making sure our cities are
welcoming places for people to live and work now and in the future, and to our
prosperity. It is therefore important to monitor levels of air pollution. The broad
objectives of monitoring air pollution in the UK are:
To fulfil statutory air quality reporting requirements.
To provide a sound scientific basis for the development of cost-effective
control policies.
To provide the public with open, reliable and up-to-date information on air
pollution, enabling them to take appropriate action to minimise health
impacts.
To evaluate potential impacts on population, ecosystems and our natural
environment.
Air quality standards are set in European Union (EU) Directive 2008/50/EC on
Ambient Air Quality and Cleaner Air for Europe1 and the Fourth Daughter Directive2
(2004/107/EC). These Directives require all Member States to undertake air quality
assessment, and to report the findings to the European Commission on an annual
basis.
The UK has statutory monitoring networks in place to meet the requirements of these
Directives, with air quality modelling used to supplement the monitored data. The
results must be submitted to the European Commission each year. As of 2013, the
air quality compliance assessment has been submitted to the Commission via e-
Reporting (see Section 2.1.2). The UK’s annual submission for 2015 can be found
on the Commission website at http://cdr.eionet.europa.eu/gb/eu/aqd. All the
compliance results are reported under ‘Information on the Attainment of
Environmental Objectives’ in e-Reporting Data Flow G. Submissions for years up to
and including 2012 (which were in the form of a standard questionnaire) can be
found at http://cdr.eionet.europa.eu/gb/eu/annualair.
As well as reporting air quality data to the European Commission, the UK must also
make the information available to the public. One way in which this is done is by the
series of annual ‘Air Pollution in the UK’ reports. ‘Air Pollution in the UK 2015’
continues this series, and this report has two aims:
To provide a summary of the UK’s 2015 air quality report to the
Commission. A separate Compliance Assessment Summary document,

2
based upon Section 4 of this report, accompanies the UK’s 2015 data
submission to the Commission. This provides a concise summary aimed at
the public.
To act as a State of the Environment report, making information on the
ambient air quality evidence base for the year publically available. This
includes an assessment of trends and spatial distribution, together with
information on pollution events during the year.
This report:
Outlines the air quality legislative and policy framework in Europe and the
UK (Section 2).
Describes the evidence base underpinning the UK’s air quality
assessment: the pollutants of concern, and where and how air pollution is
measured and modelled (Section 3).
Presents an assessment of the UK’s compliance with the limit values,
target values and long term objectives set out in the Air Quality Directive
and the Fourth Daughter Directive for 2015, and compares this with
previous recent years. (Section 4).
Explains the spatial distribution of the main pollutants of concern within the
UK during 2015, and looks at how ambient concentrations have changed
in recent years (Section 5).
Explains pollution events – ‘episodes’ of high pollution – that occurred
during 2015, (Section 6).
Further information on air quality in the UK can be found on Defra’s online UK Air
Information Resource (UK-AIR), at http://uk-air.defra.gov.uk/.

3
2 Legislative and Policy Framework
The UK air quality framework is derived from a mixture of domestic, EU and
international legislation and consists of three main strands:
1) Legislation regulating total emissions of air pollutants – the UK is bound by
both EU law (the National Emission Ceilings Directive) and international law
(the Gothenburg Protocol to the UNECE Convention on Long-range
Transboundary Air Pollution to which both the UK and the EU are parties);
2) Legislation regulating concentrations of pollutants in the air – implementing
the EU Air Quality Directive; and
3) Legislation regulating emissions from specific sources such as legislation
implementing the Industrial Emissions Directive and the Clean Air Act.
Reducing air pollution requires action to reduce domestic emissions as well as
working closely with international partners to reduce transboundary emissions
(pollutants blown over from other countries) which, at times, can account for a
significant proportion of pollutant concentrations experienced in the UK (for example,
it is estimated that sources outside of the UK account for 35-50% of measured
ambient particulate matter concentrations).
2.1 European and International Background
European Union (EU) air pollution legislation follows two complementary
approaches;
(i) controlling emissions at source, and
(ii) setting of ambient air quality standards and long-term objectives.
All Member States must incorporate - or ‘transpose’ - the provisions of EU Directives
into their own national law by a specified date and comply with legally binding
implementing rules set out in the Decisions. The main Directives and Decisions are
described below.
At the time of publication (September 2016), the UK has voted (in the referendum of
23rd June 2016) to leave the European Union. The UK is preparing to begin the
formal process of leaving the European Union. Until that process is complete, all
relevant EU Directives and Decisions will continue to apply in the UK, as they have
throughout the period covered by the present report, calendar year 2015.

4
2.1.1 The Air Quality Directive and Fourth Daughter Directive
Directive 2008/50/EC of 21st May 2008, on Ambient Air Quality and Cleaner Air for
Europe – referred to in this report as ‘the Air Quality Directive’1 - covers the following
pollutants; sulphur dioxide, nitrogen oxides, particulate matter (as PM10 and PM2.5),
lead, benzene, carbon monoxide and ozone. It revised and consolidated existing EU
air quality legislation relating to the above pollutants.
Directive 2004/107/EC of 15th December 2004, relating to arsenic, cadmium,
mercury, nickel and polycyclic aromatic hydrocarbons in ambient air - referred to in
this report as ‘the Fourth Daughter Directive’2 - covers the four elements cadmium,
arsenic, nickel and mercury, together with polycyclic aromatic hydrocarbons (PAH).
These two Directives set ‘limit values’, ‘target values’ and ‘long-term objectives’ for
ambient concentrations of pollutants.
Limit values are legally binding and must not be exceeded. They are set for
individual pollutants and comprise a concentration value, an averaging period for the
concentration value, a number of exceedances allowed (per year) and a date by
which it must be achieved. Some pollutants have more than one limit value, for
example relating to short-term average concentrations (such as the hourly mean)
and long-term average concentrations (such as the annual mean).
Target values and long-term objectives are set for some pollutants and are
configured in the same way as limit values. Member States must take all necessary
measures not entailing disproportionate costs to meet the target values and long-
term objectives.
The Air Quality Directive and Fourth Daughter Directive include detailed provisions
on monitoring and reporting air quality, including:
The division of the UK into zones for the purposes of compliance reporting.
The location and number of sampling points.
The measurement methods to be used.
Data quality objectives.
Criteria each monitoring station must meet.
Provision for reporting compliance.
Provision of information to the public.
The Air Quality Directive also made provision for adapting standardised procedures
to streamline the data provision, assessment and reporting of air quality, to
electronically release information in line with the INSPIRE Directive (2007/2/EC).
This led to the adoption of new implementing provisions for reporting (IPR) (Decision

5
2011/850/EC, referred to in this report as the Air Quality e-Reporting IPR). Section
2.1.2 provides a detailed description of the Air Quality e-Reporting IPR. The report of
2013 was the first in which e-Reporting was used to report emissions.
The provisions of the Air Quality Directive and Fourth Daughter Directive were
transposed by the Air Quality Standards Regulations 20103 in England, the Air
Quality Standards (Scotland) Regulations 20104 in Scotland, the Air Quality
Standards (Wales) Regulations 2010 in Wales5 and the Air Quality Standards
Regulations (Northern Ireland) 20106. All the provisions made by the Directives are
therefore incorporated into UK legislation.
2.1.2 Air Quality e-Reporting
Defra is committed to the principles of Open Data. Air Quality e-Reporting is a
process, developed by the European Commission, for reporting of compliance and
provision of data under the Air Quality Directive. The development has been driven
by the requirements of the INSPIRE Directive (which is concerned with the sharing of
spatial data across EU Member States in a consistent and computer-readable
format). Air Quality e-Reporting is a key tool to help ensure UK air quality data
systems comply with the INSPIRE Directive and are available across Europe in a
comparable form with other Member States. Operational Air Quality e-Reporting
started on 1st January 2014; as of 21st October 2015, newly collected and
extensively restructured spatial data sets must be available in INSPIRE conformant
formats, and as of 10th December 2015 web based spatial data download services
are required to conform to INSPIRE Regulations.
European Commission Implementing Decision 2011/850/EU7 was introduced on 12th
December 2011. This Decision laid down rules for the reciprocal exchange of
information, and reporting on ambient air quality, in relation to the Air Quality
Directive. The Decision provided an opportunity to modernise data reporting,
improve data quality, facilitate information sharing and reduce the administrative
burden of reporting. In adapting the procedures, Air Quality e-Reporting has
embraced digital formats for reporting, and the internet as the core medium for
reporting. Air Quality e-Reporting extends the core requirements of the INSPIRE
Directive to meet the particular requirements of regulatory and informative air quality
reporting.
The European Commission developed the new procedures with assistance from the
European Topic Centre on Air and Climate Change Mitigation and the European
Environment Agency (EEA), and in close liaison with the European Environment
Information and Observation Network (EIONET) air quality community. The new
reporting system covers all regulatory and information reporting agreements set out

6
by the Exchange of Information Decision (EoI) (Council Decision 97/101/EC8), the
Air Quality Directive and the 4th Daughter Directive. By adopting data modelling
approaches prescribed by INSPIRE, the new e-Reporting data model is streamlined,
internally consistent and meets modern standards for data encoding and data
sharing. The data model is now organised into eight broad air quality data themes
that service all reporting and information sharing needs of the air quality community.
2.1.3 The National Emission Ceilings Directive
The National Emission Ceilings Directive9 (2001/81/EC) came into force in 2001, and
has been transposed into UK legislation by the National Emission Ceilings
Regulations 2002. The Directive sets national emission limits or ‘ceilings’ for the four
main air pollutants responsible for the acidification and eutrophication (nutrient
enrichment) of the natural environment, and the formation of ground level ozone
which impacts both human health and the environment. The ceilings had to be met
by 2010. They reflect the ceilings agreed internationally in the Gothenburg Protocol
to the Convention on Long Range Transboundary Air Pollution (CLRTAP). Emissions
of these pollutants can impact either locally or across national borders. The latter is
known as transboundary air pollution. The four pollutants for which national
emission ceilings are set are:
sulphur dioxide,
oxides of nitrogen,
volatile organic compounds,
ammonia.
The UK meets all the ceilings set under the National Emission Ceilings Directive for
2010. The National Emission Ceilings Directive report is available at
http://www.eea.europa.eu/publications/nec-directive-status-report-2014 .
The Gothenburg Protocol was revised in May 2012 to set ceilings for emissions in
2020 for the same four pollutants and PM2.5. The European Commission published a
proposal to revise the National Emission Ceilings Directive in December 2013, to
implement the new 2020 ceilings in the Protocol, and to set further ceilings for 2030.
The proposal must be agreed by the Council and the Parliament before it can
become law. It is expected that the new National Emission Ceilings Directive will be
agreed and published in autumn 2016.
2.1.4 The Industrial Emissions Directive
The Industrial Emissions Directive (Directive 2010/75/EU) sets stringent provisions to
reduce the emissions of pollutants from a diverse range of industrial sources - from

7
intensive pig and poultry farms to chemical manufacturing sites and power stations –
with the aim of achieving the environmental and human health benefits associated
with a reduction in pollution. Under the Directive, industries must use best available
techniques (BAT) to reduce their emissions. These techniques, and the emissions
limits associated with the use of those techniques, are set out in best available
technique reference documents (known as BREFs). BREFs are reviewed regularly,
which will ensure an ongoing process of improvement to EU air quality achieved
through the continuous reduction of pollution. In addition, the Directive sets emission
limits for the emission of pollutants from particular sectors
2.2 The UK Perspective
Domestic, EU and internationally-driven environmental legislation introduced over
the past seventy years has provided a strong impetus to reduce the levels of harmful
pollutants in the UK; as a result, current concentrations of many recognised
pollutants are now at the lowest they have been since measurements began.
Following the UK’s Clean Air Act, the city smogs of the 1950s, caused by domestic
and industrial coal burning, have now gone for good and significant progress has
been made in improving air quality throughout recent decades. Between 2010 and
2014 emissions of nitrogen oxides fell by 17%, while particulate emissions, for both
PM10 and PM2.5, have reduced by 24% and 19% (respectively) since 2000.
Medical evidence shows that many thousands of people still die prematurely every
year because of the effects of air pollution. Air pollution from man-made particles is
currently estimated to reduce average UK life expectancy (from birth) by six
months10. Moreover, it is now firmly established that air pollution (particulate matter,
sulphur dioxide and ozone) contributes to thousands of hospital admissions per
year11.
Recently, evidence on the health impact of exposure to nitrogen dioxide (NO2) has
strengthened significantly12. It is well established that exposure to high
concentrations of NO2 causes inflammation of the airways, decreased lung function
and respiratory symptoms. However more recently evidence has been released
directly linking NO2 exposure to mortality. Applying this evidence to the exposure
levels across the UK suggests that exposure to NO2 is increasing mortality by the
equivalent of 23,500 deaths per year (within the range of 9,500 to 38,000 deaths).
Additionally, many of the sources of NOx are also sources of particulate matter (PM).
The impact of exposure to particulate matter pollution (PM2.5) is estimated to have an
effect on mortality equivalent to nearly 29,000 deaths in the UK13. There may be
overlap between these two estimates of mortality, but the combined impact of these
two pollutants is a significant challenge to public health.

8
2.2.1 The UK Air Quality Strategy
The Environment Act 1995 required that a National Air Quality Strategy be
published, containing policies for assessment and management of air quality. The Air
Quality Strategy14 for England, Scotland, Wales and Northern Ireland was first
published in March 1997. The overall objectives of the Strategy are to:
Map out future ambient air quality policy in the United Kingdom in the
medium term.
Provide best practicable protection to human health by setting health-
based objectives for air pollutants.
Contribute to the protection of the natural environment through objectives
for the protection of vegetation and ecosystems.
Describe current and future levels of air pollution.
Establish a framework to help identify what we all can do to improve air
quality.
The Strategy has established objectives for eight key air pollutants, based on the
best available medical and scientific understanding of their effects on health, as well
as taking into account relevant developments in Europe and the World Health
Organisation. These Air Quality Objectives15 are at least as stringent as the limit
values of the relevant EU Directives – in some cases, more so. The most recent
review of the Strategy was carried out in 2007.
2.2.2 National Air Quality Statistics and Indicators
The UK reports on the following two indicators as National Air Quality Statistics for
ambient air:
Annual average concentrations of particles and ozone. These two types
of air pollution are believed to have a significant impact on public health.
Number of days in the year when air pollution is ‘Moderate’ or higher.
This may relate to any one of five key air pollutants and is based on the UK’s
Daily Air Quality Index (see Section 2.2.4). From the 1st January 2012, PM2.5
particles replaced carbon monoxide in this suite of pollutants. The thresholds
used to define ‘Moderate’ and higher pollution levels in the air quality index
were also revised at the beginning of 2012.
The National Air Quality Statistics summary for 2015 was released on 21st April 2016
and is available from the Defra website16.

9
In August 2016, Defra published a revised edition of the England Natural
Environment Indicators17. Indicator 11 for Environmental Quality and Health relates
to air quality. These are:
The average number of days per site when air pollution is ‘Moderate’ or higher
– for urban and for rural sites,
Regional mortality due to anthropogenic particulate air pollution, compared to
the England national average (5.6% in 2010, which is being taken as the
baseline year for this indicator).
The UK Government’s Public Health Outcomes Framework for England (published in
2012) recognises the burden of ill-health resulting from poor air quality as well as
other public health concerns. This Framework sets out 60 health outcome indicators
for England, and includes as an indicator:
The fraction of annual all-cause adult mortality attributable to long-term
exposure to current levels of anthropogenic particulate air pollution
(measured as fine particulate matter, PM2.5)18.
This indicator is intended to enable Directors of Public Health to appropriately
prioritise action on air quality in their local area. The indicator is calculated for each
local authority in England based on modelled concentrations of fine particulate air
pollution (PM2.5). Estimates of the percentage of mortality attributable to long term
exposure to particulate air pollution in local authority areas are available from the
Public Health Outcomes Framework data tool at http://www.phoutcomes.info/.
Current estimates at the time of writing, which are based on year 2013, range from
around 3% in some rural areas to more around 8% in some areas of London where
pollution levels are highest.
The Defra document ‘Air Quality: Public Health Impacts and Local Actions’ can be
found at http://laqm.defra.gov.uk/documents/air_quality_note_v7a-(3).pdf and a
toolkit aimed at helping public health professionals appropriately prioritise
assessment and action on PM2.5 on a local level is available here:
http://randd.defra.gov.uk/Default.aspx?Menu=Menu&Module=More&Location=None
&Completed=0&ProjectID=18580 .
Northern Ireland has a similar Public Health Strategy: ‘Making Life Better – A Whole
System Framework for Public Health 2013-2023’. This document can be found at
https://www.health-ni.gov.uk/topics/public-health-policy-and-advice/making-life-
better-whole-system-strategic-framework-public, and also includes an air quality
indicator.

10
Wales has a new national indicator under the Well-being of Future Generations
(Wales) Act 2015 and the Welsh Public Health Outcomes Framework, which has
now been published on StatsWales at
(https://statswales.gov.wales/Catalogue/Environment-and-Countryside/Air-Quality).
In 2015 the Scottish Government published ‘Cleaner Air for Scotland – The Road to
a Healthier Future’, Scotland’s first separate air quality strategy. The strategy sets
out a comprehensive list of actions, one of which is to develop a Scottish Air Quality
Indicator. Work on developing the indicator is underway and is expected to be
completed by the end of 2016. Cleaner Air for Scotland is available at:
http://www.gov.scot/Resource/0048/00488493.pdf
2.2.3 National Emissions Statistics
The UK reports annual emissions of the following pollutants via an annual National
Statistics Release, available at https://www.gov.uk/government/statistics/emissions-
of-air-pollutants :
sulphur dioxide,
oxides of nitrogen,
non-methane volatile organic compounds (NMVOCs),
ammonia (NH3),
particulate matter (as PM10 and PM2.5).
The most recent National Statistics Release covers 1970 to 2014 (the most recent
year for which emission statistics are available). The main conclusions are as
follows:
‘There has been a long term decrease in the emissions of all of the air
pollutants covered by this statistical release (ammonia, nitrogen oxides, non-
methane volatile organic compounds, particulate matter (PM10, PM2.5) and
sulphur dioxide).
Emissions of sulphur dioxide decreased in 2014 compared to 2013 by 20.3
per cent, dropping to the lowest level in the time series. The rate of reduction
has slowed since the large decreases seen in the 1990s and emissions have
remained fairly level since 2009, around an average of 0.39 million tonnes.
Emissions of nitrogen oxides decreased in 2014 compared to 2013 by 8.4 per
cent, dropping to the lowest level in the time series.
Although emissions of particulate matter (PM10 and PM2.5) and non-methane
volatile organic compounds are continuing to decline (by 2, 3.1 and 0.4 per
11
cent respectively between 2013 and 2014), the rate of decline was most
pronounced in the 1990s, and has slowed in recent years.
There was an increase of 3.3 per cent in emissions of ammonia between
2013 and 2014. This goes against the recent trend of reductions.
The UK continues to meet international and EU ceilings for emissions of
ammonia, nitrogen oxides, non-methane volatile organic compounds and
sulphur dioxide. The Gothenburg Protocol under the UNECE Convention on
Long-range Transboundary Air Pollution was revised in 2012 to set new
emission ceilings to apply from 2020. These new ceilings are indicated in the
charts of the results.’
New emission statistics for 2015 will be available in December 2016.
2.2.4 The Air Pollution Forecasting System
Daily UK air pollution forecasts are produced for five pollutants; nitrogen dioxide,
sulphur dioxide, ozone, PM10 particles and PM2.5 particles. The forecasts are
communicated using the Daily Air Quality Index (http://uk-air.defra.gov.uk/air-
pollution/daqi) which is a scale of one to ten divided into four bands. This allows the
public to see at a glance whether the air pollution is low, moderate, high or very high
and to look up any recommended actions to take.
The group of pollutants covered, and the thresholds between the various index
bands, were updated by Defra as of 1st January 2012, in the light of
recommendations by the Committee on the Medical Effects of Air Pollutants
(COMEAP) in their 2011 review of the UK air quality index19.
The daily forecast is provided by the Met Office and is available from UK-AIR and
from the Scottish, Welsh and Northern Ireland air quality websites (see Section 7),
and is further disseminated via e-mail, Twitter and RSS feeds. Anyone may
subscribe to the free air pollution bulletins at: http://uk-air.defra.gov.uk/subscribe
Latest forecasts are issued daily, at: http://uk-air.defra.gov.uk/forecasting/. Defra also
provide automated updates on current and forecast air quality via Twitter
@DefraUKAIR– see http://uk-air.defra.gov.uk/twitter.
2.2.5 The NO2 Air Quality Plans
On 17 December 2015, the UK government and the devolved governments
published the national air quality plan for nitrogen dioxide.

12
The plan sets out how the UK will achieve compliance with EU limit values for NO2 in
the shortest possible time. This will be achieved in a number of ways, including
through:
exploiting new, clean technologies, such as electric and ultra low emission
vehicles
spurring innovation by continuing to make our data more openly available, so
that the whole country – people, businesses and the public sector – can use
them to take better decisions and action
a new programme of Clean Air Zones to tackle those areas with the most
persistent pollution problems.
Compliance is forecast to be achieved in all areas outside London by 2020, and in
London by 2025.
The national air quality plan is available at https://uk-air.defra.gov.uk/library/no2-
consultation-documents-2015 .
2.2.6 Measures to Address Target Value Exceedances of B[a]P and Nickel
EU Directive (2004/107/EC) sets target values for a number of metals and
benzo[a]pyrene. During 2015 the UK exceeded target values for two pollutants B[a]P
and nickel. These were reported in September 2014 as part of the UK’s annual
compliance assessment20.
The UK published reports at the end of 2015, providing details of the assessment of
these exceedances and reporting the actions and measures that have already been
taken or are planned that will help the UK meet these target values. An overview
report will be provided for each pollutant followed by more detailed information on
any exceedances by zone. The reports on the 2014 exceedances of the target
values for B[a]P and nickel are available at: Fourth Daughter Directive - Reports on
Measures - Defra, UK
2.3 Local Authority Air Quality Management
Requirements for local air quality management are set out in Part IV of the
Environment Act 1995, and the Environment (Northern Ireland) Order 200221.
Authorities are required to carry out regular ‘Review and Assessments’ of air quality
in their area and take action to improve air quality when the objectives set out in
regulation cannot be met by the specified dates.

13
Local Authorities in England, Scotland, Wales and Northern Ireland have completed
five rounds of review and assessment against the Strategy’s objectives prescribed in
the Air Quality (England) Regulations 200022, Air Quality (Scotland) Regulations
200023, Air Quality (Wales) Regulations 200024 and Air Quality (Northern Ireland)
Regulations 200325, together with subsequent amendments26,27,28,29. The sixth round
began in 2015.
The Review and Assessment process was streamlined in England following a
consultation in 2015, and in 2016 a new format, the Assessment Summary Review,
has been adopted. Wales launched their consultation in September 2016 and the
changes are anticipated to be in place by 2017.
When the Assessment Summary Review process identifies an exceedance of an Air
Quality Strategy objective, the Local Authority must declare an ‘Air Quality
Management Area’ (AQMA) and develop an Action Plan to tackle problems in the
affected areas. Action Plans formally set out the measures the Local Authority
proposes to take to work towards meeting the air quality objectives. They may
include a variety of measures such as congestion charging, traffic management,
planning and financial incentives. Advice for Local Authorities preparing an Action
Plan is available from the Defra LAQM web pages at http://laqm.defra.gov.uk/action-
planning/aqap-supporting-guidance.html.
Information on the UK’s AQMAs is summarised in Table 2-1 below. At present, 259
Local Authorities – roughly 66.5% of those in the UK – have one or more AQMAs.
Some AQMAs are for more than one pollutant, and many Local Authorities have
more than one AQMA. Table 2-1 shows that a total of 232 Local Authorities have
now submitted Action Plans, and that 27 Local Authorities are in the process of
preparing them. For these 27 Authorities, it may not be their first Action Plan; they
may have already submitted one or more, for a different area or pollutant. In the
table below, these Local Authorities are only counted once. Hence these two totals in
Table 2-1 add up to 259 (the total number of Local Authorities with AQMAs).

14
Table 2-1 Current UK-wide status of Air Quality Management Areas (AQMAs)
and Action Plans (as of September 2016.)
Region Total
LAs
LAs with
AQMAs
AQMAs
for NO2
AQMAs
for PM10
AQMAs
f or SO2
LA’s with
Action
Plans
Submitted
LA’s with
Action
Plans
Pending
England
(outside
London) 291 193 498 38 6 171 22
London 33 33 33 29 0 32 1
Scotland 32 14 25 21 1 12 2
Wales 22 10 37 1 0 8 2
Northern
Ireland 11 9 20 7 0 9 0
TOTAL 389 259 613 96 7 232 27
(Note: there are no longer any AQMAs for benzene).
Most Air Quality Management Areas in the UK are in urban areas and have been
established to address the contribution to air pollution from traffic emissions of
nitrogen dioxide or PM10. Road transport is specified as the main source in 96% of
the AQMAs declared for NO2. Just under 2% of NO2 AQMAs result from road
transport mixed with either domestic or industrial sources, with the remaining 2%
made up of non-traffic and unspecified sources.
Figure 2-1 shows the numbers of AQMAs in the UK declared as a result of various
sources of pollutant emissions.

15
Figure 2-1 Number of Air Quality Management Areas Resulting from Various
Sources
The locations of the UK’s AQMAs are shown in Figure 2-2. Information on the UK’s
Air Quality Management Areas is published on the Defra LAQM web pages (link
above). Information is provided on each AQMA, together with a map of the area,
where available.
0
100
200
300
400
500
600
700
Nitrogen DioxidePM10
Sulphur Dioxide
Nu
mb
er
of
AQ
MA
's
Industry
Domestic
Road Transport
Road Transport & Industry
Road Transport, Industry & Domestic
Other/unspecified

16
Figure 2-2 Air Quality Management Areas in the UK, as of the end of 2015

17
3 The Evidence Base
A programme of air quality assessment and research is in place in the UK which
delivers the evidential needs of Defra, associated with compliance with a range of
European Directives, as well as the means to assess the effectiveness of air
pollution mitigation policies.
This section explains Defra and the Devolved Administrations’ evidence base for the
annual assessment of compliance with the EU Directives on ambient air quality. It
describes the air pollutants which are of concern and how these are monitored and
modelled in the UK.
3.1 Pollutants of Concern
Table 3-1 below summarises the sources, effects and typical UK concentrations of
the pollutants being assessed in relation to the Air Quality Directive and 4th Daughter
Directive.
The information on sources has largely been summarised from the National
Atmospheric Emission Inventory (NAEI) pollutant information pages30 together with
Table 1 of the Air Quality Strategy31.
Information on health effects is summarised (and further information can be sought)
from the following sources:
The World Health Organization’s Air Quality Guidelines Global Update
(2005)32 (which covers particulate matter, sulphur dioxide, nitrogen dioxide
and ozone).
The World Health Organization’s ‘Air Quality and Health’ factsheet (factsheet
313) at http://www.who.int/mediacentre/factsheets/fs313/en/index.html.
Committee on the Medical Effects of Air Pollution – COMEAP’s “Statement on
the Evidence for the Effects of Nitrogen Dioxide on Health” (COMEAP 2015)33
(referred to in the table as COMEAP 2015a).
Reports by the Committee on the Medical Effects of Air Pollution (COMEAP):
o COMEAP’s 2011 review of the air quality index34,
o COMEAP’s 2009 report on long-term exposure to air pollution and its
effect on mortality35 (referred to in the table below as COMEAP 2009),
o COMEAP’s 2010 report on the mortality effects of long-term exposure
to particulate air pollution in the United Kingdom36 (referred to in the
table as COMEAP 2010),

18
o COMEAP’s 2015 report on quantification of effects associated with
ozone37 (referred to in the table as COMEAP 2015b)
o Expert Panel on Air Quality Standards (EPAQS) report ‘Metals and
Metalloids38 (referred to as EPAQS 2009 in the table below).
Public Health England’s Compendium of Chemical Hazards web pages at
http://www.hpa.org.uk/Topics/ChemicalsAndPoisons/CompendiumOfChemica
lHazards/
World Health Organization’s 2013 ‘Review of Evidence on Health Aspects of
Air Pollution’ (REVIHAAP) report39.
The Air Quality Strategy.
Information on typical ambient concentrations in the UK has been summarised from
the Defra online air information resource, UK-AIR at http://uk-air.defra.gov.uk/ , and a
2011 study by King’s College London, the University of Leeds and AEA (now
Ricardo Energy & Environment), which investigated the reasons why ambient
concentrations of NOx and NO2 have decreased less than predicted on the basis of
emissions estimates40.

19
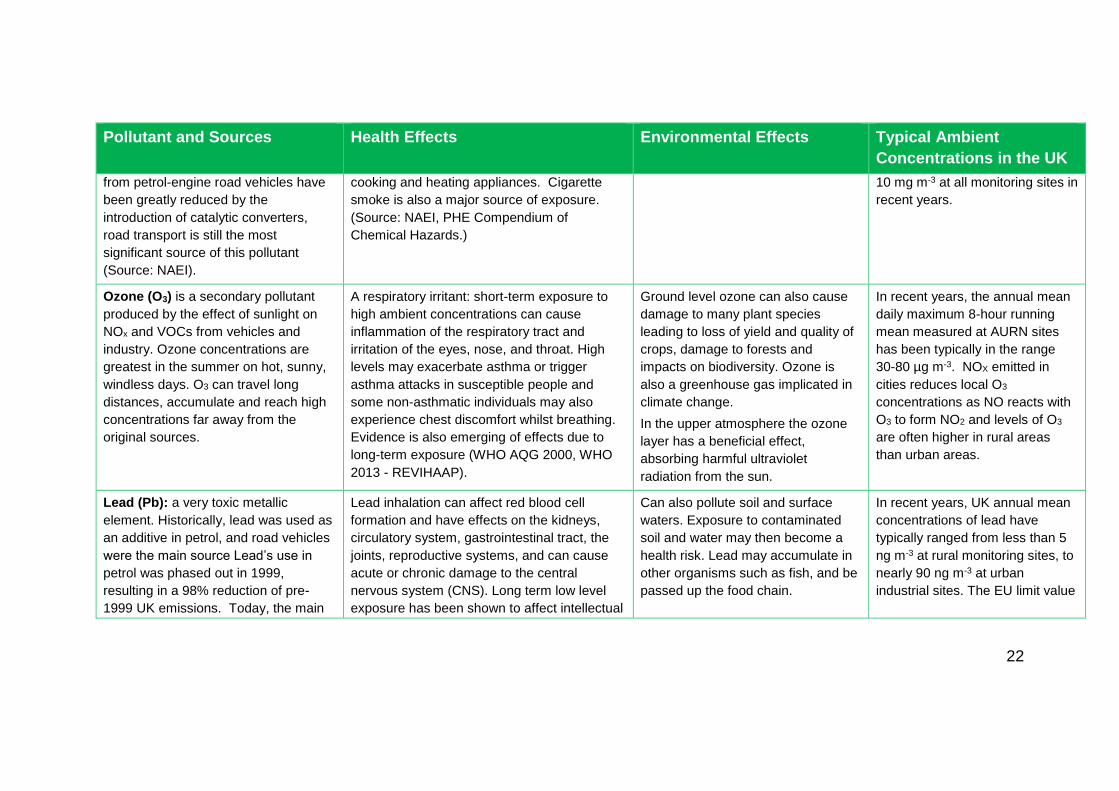
Table 3-1 Sources, Effects and Typical UK Concentrations
Pollutant and Sources Health Effects Environmental Effects Typical Ambient
Concentrations in the UK
Sulphur Dioxide (SO2): an acid gas
formed when fuels containing sulphur
impurities are burned. The largest UK
source is currently power generation.
Other important sources include
industry, commercial fuel use, and
residential fuel use in some areas.
A respiratory irritant that can cause
constriction of the airways. People with
asthma are considered to be particularly
sensitive. Health effects can occur very
rapidly, making short-term exposure to peak
concentrations important. (Source: WHO AQG
2005)
Harmful to plants at high
concentrations. Contributes to
acidification of terrestrial and aquatic
ecosystems, damaging habitats and
leading to biodiversity loss. SO2 is
also a precursor to the formation of
secondary sulphate particles in the
atmosphere.
Annual mean concentrations are
typically less than 5 µg m-3 except
at sites in industrial locations or in
residential areas with high use of
solid fuel for heating.
Nitrogen Oxides (NOx): NOx, which
comprises nitric oxide (NO) and
nitrogen dioxide (NO2), is emitted from
combustion processes. Main sources
include power generation, industrial
combustion and road transport.
According to the NAEI, road transport
is now the largest single UK source of
NOx, accounting for almost one third of
UK emissions.
Short-term exposure to concentrations of NO2
higher than 200 µg m-3 can cause
inflammation of the airways. NO2 can also
increase susceptibility to respiratory infections
and to allergens.
It has been difficult to identify the direct health
effects of NO2 at ambient concentrations
because it is emitted from the same sources
as other pollutants such as particulate matter
(PM). Studies have found that both day-to-
day variations and long-term exposure to NO2
are associated with mortality and morbidity.
Evidence from studies that have corrected for
the effects of PM is suggestive of a causal
In the presence of sunlight, nitrogen
oxides can react with Volatile
Organic Compounds to produce
photochemical pollutants including
ozone.
NOX contributes to the formation of
secondary nitrate particles in the
atmosphere. High levels of NOx can
harm plants. NOx also contributes to
acidification and eutrophication of
terrestrial and aquatic ecosystems,
damaging habitats and leading to
biodiversity loss.
Annual mean concentrations of
NO2 beside busy roads frequently
exceed 40 µg m-3. This is not a
UK-specific problem and is
common in many other European
countries. The main reasons why
roadside NO2 concentrations have
not decreased as expected is
believed to be the failure of Euro
vehicle emission standards for
diesel vehicles to deliver the
anticipated reductions in NOx
emissions in real world driving
conditions. At urban background
locations, annual mean NO2

20
Pollutant and Sources Health Effects Environmental Effects Typical Ambient
Concentrations in the UK
relationship, particularly for respiratory
outcomes (Source: WHO 2013 REVIHAAP
report, COMEAP 2015).
concentrations are lower, typically
15-40 µg m-3. Peak hourly mean
concentrations exceed 100 µg m-3
at most urban locations, and
occasionally exceed 300 µg m-3 at
congested urban roadside sites.
Particulate Matter: PM10. This can be
primary (emitted directly to the
atmosphere) or secondary (formed by
the chemical reaction of other
pollutants in the air such as SO2 or
NO2). The main source is combustion,
e.g. vehicles, domestic burning and
power stations. Other man-made
sources include quarrying and mining,
industrial processes and tyre and brake
wear. Natural sources include wind-
blown dust, sea salt, pollens and soil
particles.
Research shows a range of health effects
(including respiratory and cardiovascular
illness and mortality) associated with PM10. No
threshold has been identified below which no
adverse health effects occur. (Source: WHO
AQG 2000)
Black carbon in PM is implicated in
climate change. Secondary PM
includes sulphate, nitrate and
ammonium, formed from SO2, NOx
and NH3 which are the main drivers
for acidification and eutrophication.
Annual mean PM10 concentrations
for urban AURN monitoring sites
have been typically in the range
10-30 µg m-3 in recent years.
Particulate Matter: PM2.5. Like PM10,
the finer size fraction PM2.5 can be
primary or secondary, and has the
same sources. Road transport
Fine particulate matter can penetrate deep
into the lungs and research in recent years
has strengthened the evidence that both short-
term and long-term exposure to PM2.5 are
linked with a range of health outcomes
Secondary PM includes sulphate,
nitrate and ammonium, formed from
SO2, NOx and NH3 which are the
main drivers for acidification and
eutrophication.
Annual mean urban PM2.5
concentrations in the UK are
typically in the low teens of µg m-3
but exceed 20 µg m-3 at a few
urban roadside locations.

21
Pollutant and Sources Health Effects Environmental Effects Typical Ambient
Concentrations in the UK
becomes an increasingly important
sector as the particle size decreases.
including (but not restricted to) respiratory and
cardiovascular effects. COMEAP estimated
that the burden of anthropogenic particulate
air pollution in the UK in 2008 was an effect on
mortality equivalent to nearly 29,000 deaths at
typical ages and an associated loss of life
across the population of 340,000 years. The
burden can also be represented as a loss of
life expectancy from birth of approximately six
months. (Source: COMEAP 2010.)
Benzene: (C6 H6) is an organic
chemical compound. Ambient benzene
concentrations arise from domestic and
industrial combustion processes, in
addition to road transport. (Source: Air
Quality Strategy).
Benzene is a recognised human carcinogen
which causes changes in the genetic material
(mutagenic effect) of the circulatory and
immune systems. No absolutely safe level can
be specified in ambient air.
Acute exposure to high concentrations affects
the central nervous system. (Source: WHO
AQG 2000, PHE Compendium of Chemical
Hazards)
Can also pollute soil and water,
leading to exposure via these routes.
Annual mean concentrations of
benzene are now low
(consistently below 2 µg m-3) due
to the introduction of catalytic
converters on car exhausts. The
UK meets the benzene limit value
of 5 µg m-3.
Carbon Monoxide (CO) is produced
when fuels containing carbon are
burned with insufficient oxygen to
convert all carbon inputs to carbon
dioxide (CO2). Although CO emissions
CO affects the ability of the blood to take up
oxygen from the lungs, and can lead to a
range of symptoms. People are more likely to
be exposed to dangerous concentrations of
CO indoors, due to faulty or poorly ventilated
Can contribute to the formation of
ground-level ozone.
The UK is compliant with the
European limit value for CO, with
the 8-hour running mean
concentration consistently below
22
Pollutant and Sources Health Effects Environmental Effects Typical Ambient
Concentrations in the UK
from petrol-engine road vehicles have
been greatly reduced by the
introduction of catalytic converters,
road transport is still the most
significant source of this pollutant
(Source: NAEI).
cooking and heating appliances. Cigarette
smoke is also a major source of exposure.
(Source: NAEI, PHE Compendium of
Chemical Hazards.)
10 mg m-3 at all monitoring sites in
recent years.
Ozone (O3) is a secondary pollutant
produced by the effect of sunlight on
NOx and VOCs from vehicles and
industry. Ozone concentrations are
greatest in the summer on hot, sunny,
windless days. O3 can travel long
distances, accumulate and reach high
concentrations far away from the
original sources.
A respiratory irritant: short-term exposure to
high ambient concentrations can cause
inflammation of the respiratory tract and
irritation of the eyes, nose, and throat. High
levels may exacerbate asthma or trigger
asthma attacks in susceptible people and
some non-asthmatic individuals may also
experience chest discomfort whilst breathing.
Evidence is also emerging of effects due to
long-term exposure (WHO AQG 2000, WHO
2013 - REVIHAAP).
Ground level ozone can also cause
damage to many plant species
leading to loss of yield and quality of
crops, damage to forests and
impacts on biodiversity. Ozone is
also a greenhouse gas implicated in
climate change.
In the upper atmosphere the ozone
layer has a beneficial effect,
absorbing harmful ultraviolet
radiation from the sun.
In recent years, the annual mean
daily maximum 8-hour running
mean measured at AURN sites
has been typically in the range
30-80 µg m-3. NOX emitted in
cities reduces local O3
concentrations as NO reacts with
O3 to form NO2 and levels of O3
are often higher in rural areas
than urban areas.
Lead (Pb): a very toxic metallic
element. Historically, lead was used as
an additive in petrol, and road vehicles
were the main source Lead’s use in
petrol was phased out in 1999,
resulting in a 98% reduction of pre-
1999 UK emissions. Today, the main
Lead inhalation can affect red blood cell
formation and have effects on the kidneys,
circulatory system, gastrointestinal tract, the
joints, reproductive systems, and can cause
acute or chronic damage to the central
nervous system (CNS). Long term low level
exposure has been shown to affect intellectual
Can also pollute soil and surface
waters. Exposure to contaminated
soil and water may then become a
health risk. Lead may accumulate in
other organisms such as fish, and be
passed up the food chain.
In recent years, UK annual mean
concentrations of lead have
typically ranged from less than 5
ng m-3 at rural monitoring sites, to
nearly 90 ng m-3 at urban
industrial sites. The EU limit value

23
Pollutant and Sources Health Effects Environmental Effects Typical Ambient
Concentrations in the UK
sources are metal production and
industrial combustion of lubricants
containing small amounts of lead.
(Source: NAEI.)
development in young children (Source:
EPAQS 2009).
A threshold, below which the adverse effects
of lead are not anticipated, has not been
established (source: WHO AQG 2000, PHE
Compendium of Chemical Hazards).
for Pb (0.5 µg m-3 or 500 ng m-3)
is met throughout the UK.
Nickel (Ni) is a toxic metallic element
found in ambient air as a result of
releases from oil and coal combustion,
metal processes, manufacturing and
other sources. Currently the main
source is the combustion of heavy fuel
oil, the use of coal having declined.
(Source: NAEI.)
Nickel compounds are human carcinogens by
inhalation exposure. Can cause irritation to
the nose and sinuses and allergic responses
and can lead to the loss of the sense of smell.
Long-term exposure may lead to respiratory
diseases and cancers. (Source: WHO AQG
2000, EPAQS 2009, PHE Compendium of
Chemical Hazards.)
Can also pollute soil and water,
leading to exposure via these routes.
Annual mean ambient particulate
phase concentrations in the urban
environment are typically of the
order of 1 ng m-3 with the
exception of a few industrial
areas, where higher annual
means may occur, in some
locations exceeding the 4th
Daughter Directive target value of
20 ng m-3.
Arsenic (As) is a toxic element emitted
into the atmosphere in the form of
particulate matter. Historically the
largest source was coal combustion,
but as this has declined, the use of
wood treated with preservatives
containing As has become the most
Acute inhalation exposure to high levels of
arsenic primarily affects the respiratory system
and can cause coughs, sore throat,
breathlessness and wheezing. Long term
inhalation exposure is associated with toxic
effects on the respiratory tract and can cause
lung cancer. (Source: WHO AQG 2000,
Can also pollute soil and water,
leading to exposure via these routes.
Arsenic in water or soil can be taken
up by plants or fish.
Measured UK annual mean
concentrations in the particulate
phase are now typically less than
1 ng m-3, meeting the 4th Daughter
Directive target value of 6 ng m-3.

24
Pollutant and Sources Health Effects Environmental Effects Typical Ambient
Concentrations in the UK
significant component of As emissions.
(Source: NAEI.)
EPAQS 2009, PHE Compendium of Chemical
Hazards.)
Cadmium (Cd): a toxic metallic
element whose main sources are
energy production, non-ferrous metal
production, iron and steel manufacture
(as well as other forms of industrial
combustion). (Source: NAEI.)
Acute inhalation exposure to cadmium causes
effects on the lung such as pulmonary
irritation. Chronic effects via inhalation can
cause a build-up of cadmium in the kidneys
that can lead to kidney disease and long term
inhalation can lead to lung cancer. (Source:
WHO AQG 2000, EPAQS 2009, PHE
Compendium of Chemical Hazards.)
Can also pollute soil and water,
leading to exposure via these routes.
Annual mean particulate phase
concentrations in the UK in recent
years are now typically < 2 ng m-3,
and meet the 4th Daughter
Directive target value of 5 ng m-3.
Mercury (Hg): released to the air by
human activities, such as fossil fuel
combustion, iron and steel production
processes, waste incineration, the
manufacture of chlorine in mercury
cells, and coal combustion. Emissions
have declined in recent years as a
result of improved controls on mercury
cells, the reduction in coal use, and
improved controls on waste
incineration processes from 1997
onwards. (Source: NAEI.)
Acute exposure to high levels of Hg can cause
chest pain and shortness of breath, and affect
the central nervous system (CNS) and
kidneys. Chronic exposure leads to CNS
disorders, kidney damage and stomach
upsets. (Source: WHO AQG 2000, PHE
Compendium of Chemical Hazards.)
Can also pollute soil, fresh water and
sea water. Exposure to contaminated
soil and water may then become a
health risk. Mercury may accumulate
in other organisms such as fish, and
be passed up the food chain.
There is no target value for
mercury. Annual mean ambient
concentrations (total of vapour
and particulate phases) are
typically in the range 1-3 ng m-3,
although higher concentrations
(over 20 ng m-3) have been
measured at industrial sites in
recent years.
Benzo[a]pyrene (B[a]P) is used as a
‘marker’ for a group of compounds
PAHs are a large group of persistent, bio-
accumulative, organic compounds with toxic
PAHs can bio-accumulate and be
passed up the food chain.
Annual mean concentrations in
most urban areas are below the

25
Pollutant and Sources Health Effects Environmental Effects Typical Ambient
Concentrations in the UK
known as polycyclic aromatic
hydrocarbons (PAHs). The main
sources of B[a]P in the UK are
domestic coal and wood burning, fires
(e.g. accidental fires, bonfires, forest
fires, etc.), and industrial processes
such as coke production. (Source: Air
Quality Strategy).
and carcinogenic effects. Lung cancer is most
obviously linked to exposure to PAHs through
inhaled air. (Source: WHO AQG 2000, PHE
Compendium of Chemical Hazards)
EU target value of 1 ng m-3: the
only exceptions are areas with
specific local sources – such as
industrial installations or domestic
solid fuel burning.

26
3.2 Assessment of Air Quality in the UK
The evidence base for the annual assessment of compliance is based on a
combination of information from the UK national monitoring networks and the results
of modelling assessments. The use of models reduces the number of monitoring
stations required. It has the added benefits of enabling air quality to be assessed at
locations without monitoring sites and providing additional information on source
apportionment and projections required for the development and implementation of
air quality plans.
UK compliance assessment modelling is undertaken using national models known
as the Pollution Climate Mapping (PCM) models. The PCM models have been
designed to assess compliance with the limit values at locations defined within the
Directives. Modelled compliance assessments are undertaken for 11 air pollutants
each year. This assessment needs to be completed each year in the relatively short
period between the time when the input data (including ratified monitoring data and
emission inventories) become available and the reporting deadline at the end of
September.
It is important to understand the differences between modelling carried out for
compliance assessment purposes, and that carried out for Local Air Quality
Management. National air quality modelling for the UK focuses on two components:
pollutant concentrations at background locations, on a 1x1km grid square basis, and
roadside pollutant concentrations, at four metres from the kerb of urban major road
links. By contrast, Local Air Quality Management (LAQM) modelling is different in
scope, purpose and methodology from the national modelling and will usually output
contour plots showing dispersion away from the source, on a fine resolution grid. The
level of detail and resolution of LAQM modelling is therefore much greater in order to
focus on local exposure and hotspots. See Section 3.5 for more details on the
modelling carried out for compliance assessment.
3.3 Current UK Air Quality Monitoring
During 2015 there were 267 national air quality monitoring sites across the UK,
comprising several networks, each with different objectives, scope and coverage.
This section provides a brief description of those used to monitor compliance with
the Air Quality Directive and the 4th Daughter Directive. A summary of the UK
national networks is provided in Table 3-2 (the numbers of sites shown in this table
add up to considerably more than 267 because some sites belong to more than one
network). This table shows the numbers of sites in operation during part or all of
2015.

27
Table 3-2 The UK’s Air Quality Monitoring Networks in 2015
Network Pollutants Number
of Sites
operating
in 2015
Automatic Urban and Rural
Network (AURN)
CO, NOx, NO2, SO2, O3, PM10, PM2.5. 147
UK Metals Network
Metals in PM10. Including: As, Cd, Co, Cr, Cu, Fe, Mn,
Ni, Pb, Se, V, Zn.
Measured deposition. Including: Al, As, Ba, Be, Cd,
Co, Cr, Cs, Cu, Fe, Li, Mn, Mo, Ni, Pb, Rb, Sb, Sc,
Se, Sn, Sr, Ti, U, V, W, Zn.
Hg deposition
Total gaseous mercury
24
5
4
2
Non-Automatic Hydrocarbon Benzene 34
Automatic Hydrocarbon Range of volatile organic compounds (VOCs) 4
Polycyclic Aromatic
Hydrocarbons (PAH).
21 PAH species including benzo[a]pyrene 31
European Monitoring and
Evaluation Programme
(EMEP)
Wide range of parameters relating to air quality,
precipitation, meteorology and composition of
aerosol in PM10 and PM2.5.
2
Particle Concentrations and
Numbers
Total particle number, concentration, size distribution,
anions, EC/OC, speciation of PM10, PM2.5 and PM1.
5
Toxic Organic Micropollutants Range of toxic organics including dioxins and
dibenzofurans.
6
UK Eutrophying and Acidifying
Pollutants: NO2Net (rural
diffusion tubes)
NO2 (rural) 24
UK Eutrophying and Acidifying
Pollutants: AGANet
NO3, HCl, HNO3, HONO, SO2, SO4 32
UK Eutrophying and Acidifying
Pollutants: NAMN
NH3 and/or NH4 88
UK Eutrophying and Acidifying
Pollutants: PrecipNet
Major ions in rain water 39
Black Carbon Black Carbon 14
Upland Waters Monitoring
Network
Chemical and biological species in water 24
Rural Mercury Network Tekran analyser used to measure mercury in PM2.5,
reactive mercury and elemental mercury at
Auchencorth Moss, and total gaseous mercury at
Harwell.
2

28
3.3.1 The Automatic Urban and Rural Network (AURN)
The AURN is currently the largest automatic monitoring network in the UK and forms
the bulk of the UK’s statutory compliance monitoring evidence base. Data from the
AURN are available on Defra’s online UK Air Information Resource, UK-AIR at
http://uk-air.defra.gov.uk/.
The techniques used for monitoring gaseous pollutants within the AURN are the
reference measurement methods defined in the relevant EU Directives. For
particulate matter the AURN uses methods which have demonstrated equivalence to
the reference method, but which (unlike the reference method) allow continuous on-
line monitoring. Details are provided in Table 3-3.
Table 3-3 AURN Measurement Techniques
Pollutant Method used, including details of CEN Standard Methods
O3 EN 14625:2012 ‘Ambient air quality – standard method for the
measurement of the concentration of ozone by ultraviolet photometry’41
NO2/NOx EN 14211:2012 ‘Ambient air quality - Standard method for the
measurement of the concentration of nitrogen dioxide and nitrogen
monoxide by chemiluminescence’42
SO2 EN 14212:2012 ‘Ambient air quality – Standard method for the
measurement of the concentration of sulphur dioxide by UV
fluorescence’43
CO EN 14626:2012 ‘Ambient air quality - Standard method for the
measurement of the concentration of carbon monoxide by non-dispersive
infrared spectroscopy’44
PM10 and
PM2.5
EN 12341:1998 ‘Air quality. Determination of the PM10 fraction of
suspended particulate matter. Reference method and field test procedure
to demonstrate reference equivalence of measurement methods.’45
EN 14907:2005 ‘Ambient air quality - Standard gravimetric measurement
method for the determination of the PM2.5 mass fraction of suspended
particulate matter’46
The AURN uses three methods which are equivalent for one or both
pollutants: the Filter Dynamic Measurement System (FDMS), which
determines particulate concentration by continuously weighing particles
deposited on a filter: the Beta-Attenuation Monitor (BAM) which
measures the attenuation of beta rays passing through a paper filter on
which particulate matter from sampled air has been collected, and the
Partisol – a gravimetric sampler that collects daily samples onto a filter for
subsequent weighing.
29
3.3.2 The UK Metals Network
The UK Metals Network forms the basis of the UK’s compliance monitoring for:
The Air Quality Directive (for lead).
The 4th Daughter Directive (for arsenic, cadmium, nickel and mercury).
At the end of 2013 Defra merged the existing Urban and Industrial Network with the
Rural Network to form the UK Metals Network. The merged network monitors a
range of metallic elements at urban, industrial and rural sites, using a method
equivalent to the CEN standard method47. Metals (As, Cd, Co, Cr, Cu, Fe, Mn, Ni,
Pb, Se, V and Zn) in PM10 are measured at 24 sites. (The network stopped
measuring mercury in PM10 as of 2014.)
Metal deposition (Al, As, Ba, Be, Cd, Co, Cr, Cs, Cu, Fe, Li, Mn, Mo, Ni, Pb, Rb, Sb,
Sc, Se, Sn, Sr, Ti, U, V, W and Zn) was measured at the following sites:
Auchencorth Moss, Harwell, Heigham Holmes, Lough Navar and Yarner Wood. Hg
deposition was measured at Auchencorth Moss, Harwell, Heigham Holmes and
Yarner Wood. (The Harwell monitoring station closed at the end of 2015 and was
relocated to Chilbolton Observatory at the start of 2016.)
Within the Metals Network total gaseous mercury is measured at London
Westminster and Runcorn Weston Point.
3.3.3 Non-Automatic Hydrocarbon Network
In this network of 34 sites, ambient concentrations of benzene are measured by the
CEN standard method48. This involves pumping air through an adsorption tube to
trap the compound, which is later analysed in a laboratory. There were no changes
in terms of site closures or additional sites being added to the network during the
year. This network monitors compliance with the Air Quality Directive’s limit value for
benzene. All sites in the Non-Automatic Hydrocarbon Network are co-located with
AURN sites.
3.3.4 Automatic Hydrocarbon Network
The Air Quality Directive also requires measurement and reporting of ozone
precursor substances (29 species), which include volatile organic compounds
(VOCs). Annex X (ten) of the Directive provides a list of compounds recommended
for measurement. Ozone precursor measurement is carried out by the Automatic
Hydrocarbon Network.
Automatic hourly measurements of a range of hydrocarbon species (including all
those specified in Annex X of the Directive except formaldehyde and total non-
methane hydrocarbons), are made using automated pumped sampling with in-situ

30
gas chromatography, at four sites in the UK. The VOCs monitored include benzene,
which is covered by the Air Quality Directive as a pollutant in its own right.
3.3.5 PAH Network
The PAH Network monitors compliance with the 4th Daughter Directive, which
includes a target value of 1 ng m-3 for the annual mean concentration of
benzo[a]pyrene as a representative PAH, not to be exceeded after 31st December
2012. This network uses the PM10 ‘Digitel’ sampler. Ambient air is sampled through
quartz micro-fibre filters, which capture the PAH compounds for later analysis in a
laboratory. During 2015, there were 31 sites in this network measuring 22 PAH
compounds.
3.3.6 EMEP
EMEP (European Monitoring and Evaluation Programme) is a programme set up to
provide governments with qualified scientific information on air pollutants, under the
UNECE Convention on Long-range Transboundary Air Pollution. In 2015 there were
two EMEP ‘supersites’, at Auchencorth Moss in Lothian (representing the north of
the UK) and at Harwell in Oxfordshire (representing the south). However, due to a
proposed change in land use at the Harwell site it was necessary to relocate the site.
After a review of possible alternatives, a decision was made to relocate the site to
Chilbolton Laboratory, Stockbridge, Hampshire, some 31 miles to the south. A
representativeness analyses was undertaken and showed that the site was
considered a rural background similar to Harwell. The relocation happened at the
beginning of 2016.
A very wide range of measurements are taken at EMEP sites, supplemented by data
from other UK networks which are co-located.
Monitoring includes:
Hourly meteorological data,
Soil and vegetation measurements,
Metallic elements in PM10 and precipitation,
Deposition of inorganic ions,
Major ions in PM2.5 and PM10, as well as HCl, HNO2, HNO3, NH3 and SO2,
Trace gases (ozone, NOx and SO2),
Black carbon, organic carbon (OC) and elemental carbon (EC),
Ammonia (monthly),
Daily and hourly PM10 and PM2.5 mass,
Volatile Organic Compounds,
Carbonyls,
CH4 and N2O fluxes.

31
3.3.7 Particle Concentrations and Numbers
The Air Quality Directive requires that the chemical composition of PM2.5 is
characterised at background locations in the United Kingdom. The Particle
Concentrations and Numbers Network contribute to this statutory requirement.
During 2015, the network consisted of five measurement sites; two rural sites at
Auchencorth Moss and Harwell, two in London, and one in Birmingham. As
discussed above the Harwell site was closed down at the end of 2015 and moved to
Chilbolton at the start of 2016.
Among the parameters measured are:
Total particle numbers per cubic centimetre of ambient air,
Particle numbers in different particle size fractions,
Major ions in PM10,
Cl, NH4, NO3, OC, SO4 and OC in PM1
Organic carbon (OC) and elemental carbon (EC) concentrations in PM2.5.
As well as its statutory function, this network provides data on the chemical
composition of particulate matter, primarily for the use of researchers of atmospheric
processes, epidemiology and toxicology.
Monitoring of the major ions in PM2.5 began in 2006 and 2009 at Auchencorth Moss
and Harwell, respectively. Measurements of elemental carbon (EC) and organic
carbon (OC) began at both stations at the start of 2011. At both stations EC and OC
measurements were made in 2015 using a thermal/optical method involving both
reflectance and transmission correction methods. Comparing both correction
methods aims to provide valuable understanding of the measurement process for EC
and OC.
3.3.8 TOMPs Network
This research-based network monitors a range of toxic organic micropollutants
(compounds that are present in the environment at very low concentrations, but are
highly toxic and persistent). These include dioxins, dibenzofurans and
polychlorinated biphenyls. The TOMPs Network consists of six sites: Auchencorth
Moss, Hazelrigg, High Muffles, London Nobel House, Manchester Law Courts and
Weybourne.
The purpose of the TOMPs Network is to provide data on these air pollutants, and to
support the development of policy to protect the environment and human health.
Further information on the TOMPs Network can be found within UK-AIR at http://uk-
air.defra.gov.uk/networks/network-info?view=tomps. However, it is not used for
compliance monitoring and will not be discussed further in subsequent sections of
the report.

32
3.3.9 UK Eutrophying and Acidifying Pollutants Network
The UK Eutrophying and Acidifying Atmospheric Pollutants (UKEAP) network
provides information on deposition of eutrophying and acidifying compounds in the
UK and assessment of their potential impacts on ecosystems. The UKEAP network
is an ‘umbrella’ project covering four groups of sites:
The UKEAP rural NO2 diffusion tube network (NO2Net), which measures
NO2 at 24 rural sites.
In 2015, the Acid Gas and Aerosol Network (AGANet) comprised a total of
32 sites. However, the site at Halladale was replaced very early in the year
by RSPB Forsinard, while the site at Rum was replaced by Pollach. The
network measures a range of gases and aerosol components. Samples
are collected monthly and are analysed by either Inductive coupled plasma
optical emission spectrometry (ICP-OES) or ion chromatography.
The National Ammonia Monitoring Network (NAMN) which characterizes
ammonia and ammonium concentrations using both passive samplers
(Alpha Samplers) and low volume denuders (Delta Samplers) at up to 88
locations in 2015.
The Precipitation Network (PrecipNet) consisted of 39 sites in 2015 and
monitors the chemical composition of rainwater. The network allows
estimates of sulphur and nitrogen deposition. Samples are collected
fortnightly at all sites and daily at 2 sites.
3.3.10 Black Carbon Network
Black carbon is fine, dark carbonaceous particulate matter produced from the
incomplete combustion of materials containing carbon (such as coal, oil, and
biomass such as wood). It is of concern due to health effects, and also as a
suspected contributor to climate change.
In 2015, the Black Carbon Network measured black carbon at 14 sites using an
automatic instrument called an AethalometerTM. New sites opened up at Cardiff
Centre and Glasgow High Street during March 2015. The AethalometerTM measures
black carbon directly, using a real-time optical transmission technique. The
objectives of the network as set out in the report reviewing the network are as
follows:
To maintain coverage of black carbon measurements across the whole
UK;
To maintain continuity of historic datasets;
To gather data for epidemiological studies of black carbon and health
effects
To gather information about black carbon PM sources in the UK;

33
To assess PM reductions from air quality management interventions;
To quantify the contribution of wood burning to black carbon and ambient
PM in the UK; and
To gather data to address future policy considerations including black
carbon and climate change.
3.3.11 UK Uplands Waters Monitoring Network (UKUWMN)
The UK Acid Waters Monitoring Network (AWMN) was set up in 1988 (then called
the Acid Waters Network) to assess the chemical and biological response of acidified
lakes and streams in the UK to the planned reduction in emissions. It provides
chemical and biological data on the extent and degree of surface water acidification
in the UK uplands, in particular to underpin the science linking acid deposition to
water quality and to monitor the response of aquatic ecosystems to reductions in air
pollution. The sites making up the network were selected on the basis of acid
deposition inputs being the only major sources of pollution, i.e. with no point sources
of pollution or direct catchment disturbances other than traditional upland land use
practices such as sheep grazing or forestry. There are 24 primary monitoring sites
including 11 lakes and 13 streams across the UK, and a series of secondary sites,
monitoring a range of parameters including, water chemistry, algae and higher
aquatic plants, invertebrates, fish, water temperature and sediment biology and
chemistry.
3.3.12 Rural Mercury Monitoring
During 2015, in addition to the weekly monitoring of total gaseous mercury carried
out London Westminster and Runcorn Weston Point, and the monthly mercury
deposition measurements at Auchencorth Moss, Harwell, Heigham Holmes and
Yarner Wood as described in Section 3.3.2, speciated mercury monitoring is carried
out using the Tekran automatic instrument. The Tekran instrument at Auchencorth
Moss measures the mercury composition of PM2.5 as well as mercury in its elemental
and reactive forms, whereas at Harwell it measured just total gaseous mercury. The
Harwell monitoring station closed at the end of 2015 and was relocated to Chilbolton
Observatory at the start of 2016.
3.4 Quality Assurance and Quality Control
Air quality monitoring in the UK is subject to rigorous procedures of validation and
ratification. The well-established monitoring networks each have a robust and
documented Quality Assurance and Quality Control (QA/QC) programme designed
to ensure that measurements meet the defined standards of quality with a stated
level of confidence. Essentially, each programme serves to ensure that the data
obtained are:
34
Representative of ambient concentrations existing in the various areas
under investigation.
Sufficiently accurate and precise to meet specified monitoring objectives.
Comparable and reproducible. Results must be internally consistent and
comparable with international or other accepted standards, if these exist.
Consistent over time. This is particularly important if long-term trend
analysis of the data is to be undertaken.
Representative over the period of measurement; for most purposes, a
yearly data capture rate of not less than 90% is usually required for
determining compliance with EU limit values where applicable. An
allowance of 5% is made in some cases for planned maintenance.
Consistent with Data Quality Objectives49. The uncertainty requirements of
the EU Directives are specified as data quality objectives. In the UK, all air
quality data meet the data quality requirements of the EU Directives in
relation to uncertainty.
Consistent with methodology guidance defined in EU Directives for
relevant pollutants and measurement techniques. The use of tested and
approved analysers that conform to Standard Method (or equivalent)
requirements and harmonised on-going QA/QC procedures allows a
reliable and consistent quantification of the uncertainties associated with
measurements of air pollution.
Most UK networks use a system of regular detailed audits of all monitoring
equipment at every site. These audits supplement more regular calibrations and filter
changes and test all critical parameters of the measuring equipment including, where
appropriate, linearity, converter efficiency (in the case of NOx analysers) response
time, flow rate etc.
Data ratification is the process of checking and validating the data. Data entered on
the Defra Air Information Resource (UK-AIR at http://uk-air.defra.gov.uk) in near real
time are provided as provisional data. All these data are then carefully screened and
checked via the ratification process. The ratified data then overwrite the provisional
data on the website. It should however be noted that there are occasionally
circumstances where data which have been flagged as ‘Ratified’ could be subject to
further revision. This may be for example where:
A QA/QC audit has detected a problem which affects data back into an
earlier ratification period.
Long-term analysis has detected an anomaly between expected and
measured trends which requires further investigation and possible data
correction. This was the case with 2000-2008 particulate monitoring data
in the UK national network.

35
Further research comes to light which indicates that new or tighter QA/QC
criteria are required to meet the data quality objectives. This may require
review and revision of historical data by applying the new criteria.
Only ratified data are provided to the Commission in compliance with EU Directives.
Further details on the QA/QC procedures appropriate to each network can be
obtained from the annual reports of the monitoring networks, and (in the case of the
AURN) from the report ‘QA/QC Procedures for the UK Automatic Urban and Rural
Air Quality Monitoring Network (AURN)’50 available from Defra’s air quality web
pages.
3.5 Modelling
3.5.1 Why Do Modelling?
The UK’s monitoring programmes are supplemented by air quality modelling. There
are several benefits of using modelling to complement the monitoring data gathered
across the UK national monitoring networks:
A reduction in the number of fixed continuous monitoring locations
required for compliance with European air quality Directives – freeing up
resources and ensuring value for money.
Coverage of the whole UK rather than specific locations where there is a
monitoring site. A monitoring site might not fully represent the wider region
in which it is located due to local characteristics such as buildings affecting
dispersion, localised or temporary sources.
Providing a framework within which to assess different air quality
scenarios – for example projecting concentrations forward to assess levels
in future years, representing potential changes to emissions in order to
assess the impact of policy initiatives on air quality.
3.5.2 How the Models Work
The national modelling methodology varies between pollutants. The detailed
methodology is explained in a technical report51 (the latest versions of these can be
found in the Library section of Defra’s UK-AIR website52).
Defra’s air quality national modelling assessment for the UK consists of two
components:
Background concentrations – on a 1x1km resolution, representing ambient
air quality concentrations at background locations.

36
Roadside concentrations – concentrations at the roadside of urban major
road links throughout the UK (i.e. motorways and major A-roads). There
are approximately 10,000 of these urban major road links.
Roadside concentrations are not modelled for CO, SO2, ozone, benzo[a]pyrene and
metals as these are deemed not to have significant traffic-related sources.
The models have been designed to assess compliance at locations defined by the
Directives as relevant for air quality assessment.
3.5.3 Background Air Quality
The 1x1 km background maps are made up of several components which are
modelled separately and then added together to make the final grid. These individual
components (supplemented by some additional components for various pollutants)
are:
Large point sources (e.g. power stations, steel works and oil refineries),
Small point sources (e.g. boilers in town halls, schools or hospitals and
crematoria),
Distant sources (characterised by the rural background concentration),
Local area sources (e.g. road traffic, domestic and commercial combustion
and agriculture).
In order to ensure that these ambient concentrations from area sources are
representative of the real world situation, they are validated against measurements
taken from the national networks (including the AURN). After the validation has been
completed the large points, small points, distant sources and area source
components are added together to provide the final background map.
3.5.4 Roadside Air Quality
Roadside concentrations are determined by using a roadside increment model which
attempts to estimate the contribution from road traffic sources and adds this on top of
the modelled background concentrations discussed above.
For each of the road links that are modelled, there are emission estimates from the
National Atmospheric Emissions Inventory53 (NAEI) for each pollutant and road
traffic counts. A roadside increment is calculated for road links with a roadside
monitoring station on them by taking the link’s modelled background concentration
(from the 1x1 km modelled maps) away from the relevant measured roadside
concentration. The emission for the road link is scaled according to annual average
daily traffic flow for that link and then this is compared to the roadside increment to
establish a relationship. This relationship is then used to scale the link emission for

37
different ranges of traffic flow and added to the modelled background concentration
to calculate an estimated roadside concentration.
3.6 Access to Assessment Data
Data from the UK’s air quality monitoring networks and annual compliance modelling
is available under the Open Government Licence
http://www.nationalarchives.gov.uk/doc/open-government-licence/version/2/ from
UK-AIR.
Defra has produced a searchable online catalogue of air quality and emissions
datasets which allows people to browse the extent of data available and access key
metadata. This is available at http://uk-air.defra.gov.uk/data/data-catalogue.
Historical monitoring data can be accessed through the data selector tools in UK-
AIR, at http://uk-air.defra.gov.uk/data/. Modelled data from the Pollution Climate
Mapping model are available as .csv files for download from the modelled air quality
data pages at http://uk-air.defra.gov.uk/data/modelling-data or can be accessed
through the Ambient Air Quality Interactive Map at http://uk-air.defra.gov.uk/data/gis-
mapping - a GIS tool which provides enhanced visualisation capability and access to
roadside concentration data.

38
4 Assessment of Compliance
4.1 Definition of Zones
The UK is divided into 43 zones for air quality assessment. There are 28
agglomeration zones (large urban areas) and 15 non-agglomeration zones. Each
zone has an identification code (Table 4-1). Zones are shown in Figure 4-1.
Table 4-1 UK Zones and Agglomerations for Ambient Air Quality Reporting 2015
Zone Zone code Zone type
Greater London Urban Area UK0001 Agglomeration
West Midlands Urban Area UK0002 Agglomeration
Greater Manchester Urban Area UK0003 Agglomeration
West Yorkshire Urban Area UK0004 Agglomeration
Tyneside UK0005 Agglomeration
Liverpool Urban Area UK0006 Agglomeration
Sheffield Urban Area UK0007 Agglomeration
Nottingham Urban Area UK0008 Agglomeration
Bristol Urban Area UK0009 Agglomeration
Brighton/Worthing/Littlehampton UK0010 Agglomeration
Leicester Urban Area UK0011 Agglomeration
Portsmouth Urban Area UK0012 Agglomeration
Teesside Urban Area UK0013 Agglomeration
The Potteries UK0014 Agglomeration
Bournemouth Urban Area UK0015 Agglomeration
Reading/Wokingham Urban Area UK0016 Agglomeration
Coventry/Bedworth UK0017 Agglomeration
Kingston upon Hull UK0018 Agglomeration
Southampton Urban Area UK0019 Agglomeration
Birkenhead Urban Area UK0020 Agglomeration
Southend Urban Area UK0021 Agglomeration
Blackpool Urban Area UK0022 Agglomeration
Preston Urban Area UK0023 Agglomeration
Glasgow Urban Area UK0024 Agglomeration
Edinburgh Urban Area UK0025 Agglomeration
Cardiff Urban Area UK0026 Agglomeration
Swansea Urban Area UK0027 Agglomeration
Belfast Metropolitan Urban Area UK0028 Agglomeration
Eastern UK0029 Non-agglomeration
South West UK0030 Non-agglomeration
South East UK0031 Non-agglomeration
East Midlands UK0032 Non-agglomeration
North West & Merseyside UK0033 Non-agglomeration
Yorkshire & Humberside UK0034 Non-agglomeration
West Midlands UK0035 Non-agglomeration
North East UK0036 Non-agglomeration
Central Scotland UK0037 Non-agglomeration
North East Scotland UK0038 Non-agglomeration
Highland UK0039 Non-agglomeration
Scottish Borders UK0040 Non-agglomeration
South Wales UK0041 Non-agglomeration
North Wales UK0042 Non-agglomeration
Northern Ireland UK0043 Non-agglomeration

39
Figure 4-1 UK Zones and Agglomerations for Ambient Air Quality Reporting
2015
Agglomeration zones in purple; non-agglomeration zones in blue.
© Crown copyright. All rights reserved Defra, Licence number 100022861 [2016]

40
4.2 Air Quality Assessment for 2015
The air quality assessment for each pollutant is derived from a combination of
measured and modelled concentrations. Where both measurements and model
results are available the assessment of compliance for each zone is based on the
higher concentration of the two.
The air quality compliance assessment is submitted to the European Commission via
e-Reporting. All the compliance results come under ‘Information on the Attainment of
Environmental Objectives’ in e-Reporting Data Flow G.
The results of the air quality assessment submitted to the European Commission for
2015 are summarised in the tables below. The tables have been completed as
follows:
Where all measurements were within the relevant limit values in 2015, the
table shows this as ‘OK’.
In the above cases, where compliance was determined by modelling or
supplementary assessment, this is indicated by ‘(m)’ – i.e. ‘OK (m)’.
Where locations were identified as exceeding a limit value, target value or
long-term objective, this is identified as ‘>LV’, '>TV’ or ‘>LTO’ as
applicable.
Where a non-compliance was determined by modelling or supplementary
assessment, this is indicated by (m), as above.
The abbreviation ‘n/a’ (not applicable) means that an assessment is not
relevant for this zone, such as for the NOX vegetation critical level in
agglomeration zones.
Zones that complied with the relevant limit values, targets or long-term
objectives are shaded blue, while those that did not are shaded red. For
ozone, zones that met the relevant target value but not the long-term
objective are shaded purple.
There are no longer any zones where margins of tolerance apply.
4.2.1 Directive 2008/50/EC on Ambient Air Quality and Cleaner Air for Europe
Sulphur dioxide (SO2): In 2015, all zones and agglomerations within the UK
complied with the limit values for 1-hour mean and 24-hour mean SO2 concentration,
set for protection of human health.
All non-agglomeration zones within the UK also complied with the critical levels for
annual mean and winter mean SO2 concentration, set for protection of ecosystems.
(These are not applicable to built-up areas).

41
Carbon monoxide (CO), benzene and lead: all zones and agglomerations were
compliant with the limit values for these three pollutants in 2015. The 2015
compliance assessment for CO has been based on objective estimation (explained
in Defra’s technical report on UK air quality assessment54), underpinned by NAEI
emission trends, AURN measurement trends and historical modelling assessments.
Nitrogen dioxide (NO2): In 2015 not all zones and agglomerations were compliant
with the limit values. The results of the air quality assessment for nitrogen dioxide for
each zone are summarised in Table 4-2.
Two zones had locations where the 1-hour limit value (200 µg m-3) was exceeded on
more than the permitted 18 occasions during 2015: Greater London Urban Area
(UK0001) and South Wales (UK0041). The remaining 41 zones and agglomerations
complied with the 1-hour mean NO2 limit value.
Six zones met the annual mean limit value for NO2 in 2015:
Brighton/Worthing/Littlehampton (UK0010),
Blackpool Urban Area (UK0022),
Preston Urban Area (UK0023),
Highland (UK0039)
Scottish Borders (UK0040)
Northern Ireland (UK0043).
The remaining 37 zones had locations with measured or modelled annual mean NO2
concentrations higher than the annual mean limit value (40 µg m-3).
The UK was originally granted a time extension for compliance with the NO2 annual
mean limit value in the following 13 zones and agglomerations; Nottingham Urban
Area (UK0008), Leicester Urban Area (UK0011), Portsmouth Urban Area (UK0012),
Reading/Wokingham Urban Area (UK0016), Birkenhead Urban Area (UK0020),
Southend Urban Area (UK0021), Preston Urban Area (UK0023, Edinburgh Urban
Area (UK0025), Cardiff Urban Area (UK0026), Swansea Urban Area (UK0027,
Central Scotland zone (UK0037), North Wales zone (UK0042), and Northern Ireland
zone (UK0043). All these time extensions ended on 1st January 2015.
Although the total number of legally non-compliant zones increased from 30 in 2014
to 37 in 2015 this apparent increase is a reflection of the time extensions ending.
Comparison of the two years based on whether they met the limit value alone shows
an improvement in 2015 with 6 compliant zones compared with only 5 in 2014
(Brighton/Worthing/Littlehampton (UK0010)).
All non-agglomeration zones within the UK complied with the critical level for annual
mean NOX concentration, set for protection of vegetation.

42
Table 4-2 Results of Air Quality Assessment for Nitrogen Dioxide in 2015
Zone
Zone code NO2 LV for
health (1hr
mean)
NO2 LV for
health (annual
mean)
NOx critical
level for
vegetation
(annual mean)
Greater London Urban Area UK0001 > LV > LV n/a
West Midlands Urban Area UK0002 OK > LV n/a
Greater Manchester Urban Area UK0003 OK > LV (m) n/a
West Yorkshire Urban Area UK0004 OK > LV (m) n/a
Tyneside UK0005 OK > LV (m) n/a
Liverpool Urban Area UK0006 OK > LV (m) n/a
Sheffield Urban Area UK0007 OK > LV (m) n/a
Nottingham Urban Area UK0008 OK > LV (m) n/a
Bristol Urban Area UK0009 OK > LV (m) n/a
Brighton/Worthing/Littlehampton UK0010 OK OK n/a
Leicester Urban Area UK0011 OK > LV (m) n/a
Portsmouth Urban Area UK0012 OK > LV (m) n/a
Teesside Urban Area UK0013 OK > LV (m) n/a
The Potteries UK0014 OK > LV (m) n/a
Bournemouth Urban Area UK0015 OK > LV (m) n/a
Reading/Wokingham Urban Area UK0016 OK > LV (m) n/a
Coventry/Bedworth UK0017 OK > LV (m) n/a
Kingston upon Hull UK0018 OK > LV (m) n/a
Southampton Urban Area UK0019 OK > LV (m) n/a
Birkenhead Urban Area UK0020 OK > LV (m) n/a
Southend Urban Area UK0021 OK > LV (m) n/a
Blackpool Urban Area UK0022 OK OK n/a
Preston Urban Area UK0023 OK OK n/a
Glasgow Urban Area UK0024 OK > LV n/a
Edinburgh Urban Area UK0025 OK (m) > LV (m) n/a
Cardiff Urban Area UK0026 OK > LV (m) n/a
Swansea Urban Area UK0027 OK > LV (m) n/a
Belfast Urban Area UK0028 OK > LV n/a
Eastern UK0029 OK > LV OK
South West UK0030 OK > LV OK
South East UK0031 OK > LV OK
East Midlands UK0032 OK > LV (m) OK
North West & Merseyside UK0033 OK > LV (m) OK (m)
Yorkshire & Humberside UK0034 OK > LV (m) OK
West Midlands UK0035 OK > LV (m) OK (m)
North East UK0036 OK > LV (m) OK (m)
Central Scotland UK0037 OK > LV (m) OK (m)
North East Scotland UK0038 OK > LV OK (m)
Highland UK0039 OK OK OK (m)
Scottish Borders UK0040 OK OK OK
South Wales UK0041 > LV > LV OK
North Wales UK0042 OK > LV (m) OK
Northern Ireland UK0043 OK OK OK (m)
LV = limit value, (m) indicates that the compliance or exceedance was determined by modelling.

43
PM10 Particulate matter: all zones and agglomerations were compliant with the
annual mean limit value of 40 µg m-3 for PM10. After subtraction of the natural source
contribution, all zones and agglomerations were compliant with the daily mean limit
value. The results of the air quality assessment for PM10 for each zone, with respect
to the daily mean and annual mean limit values, are summarised in Table 4-3.
Under Section 20 of the Air Quality Directive, Member States are required to inform
the Commission where exceedances of PM10 limit values are due to natural sources,
and where this is the case, the exceedance does not count as non-compliance. Prior
to subtraction of contributions from natural sources, Swansea Urban Area (UK0027)
exceeded the daily limit value (50 µg m-3) on more than the permitted 35 occasions
in 2015 (as assessed by modelling). Following subtraction of the natural source
contribution (sea salt), the number of exceedances was reduced from 38 to 26 days.
Therefore, all zones were compliant with the daily mean limit value. In Table 4-3,
natural source contribution has only been subtracted for Swansea Urban Area
(UK0027).
Table 4-3 Results of Air Quality Assessment for PM10 in 2015 (after subtraction
of contribution from natural sources where applicable*).
Zone Zone code
PM10 LV
(daily mean)
PM10 LV
(annual mean)
Greater London Urban Area UK0001 OK OK
West Midlands Urban Area UK0002 OK OK
Greater Manchester Urban Area UK0003 OK OK
West Yorkshire Urban Area UK0004 OK OK
Tyneside UK0005 OK OK
Liverpool Urban Area UK0006 OK OK
Sheffield Urban Area UK0007 OK (m) OK (m)
Nottingham Urban Area UK0008 OK OK
Bristol Urban Area UK0009 OK OK
Brighton/Worthing/Littlehampton UK0010 OK (m) OK (m)
Leicester Urban Area UK0011 OK (m) OK (m)
Portsmouth Urban Area UK0012 OK (m) OK (m)
Teesside Urban Area UK0013 OK OK
The Potteries UK0014 OK (m) OK (m)
Bournemouth Urban Area UK0015 OK (m) OK (m)
Reading/Wokingham Urban Area UK0016 OK OK
Coventry/Bedworth UK0017 OK (m) OK (m)
Kingston upon Hull UK0018 OK OK
Southampton Urban Area UK0019 OK OK
Birkenhead Urban Area UK0020 OK (m) OK (m)
Southend Urban Area UK0021 OK (m) OK (m)
Blackpool Urban Area UK0022 OK (m) OK (m)
Preston Urban Area UK0023 OK (m) OK (m)
Glasgow Urban Area UK0024 OK OK
Edinburgh Urban Area UK0025 OK OK

44
Zone Zone code
PM10 LV
(daily mean)
PM10 LV
(annual mean)
Cardiff Urban Area UK0026 OK OK
Swansea Urban Area UK0027 OK OK
Belfast Metropolitan Urban Area UK0028 OK OK
Eastern UK0029 OK OK
South West UK0030 OK OK
South East UK0031 OK OK
East Midlands UK0032 OK OK
North West & Merseyside UK0033 OK OK
Yorkshire & Humberside UK0034 OK OK
West Midlands UK0035 OK OK
North East UK0036 OK OK
Central Scotland UK0037 OK OK
North East Scotland UK0038 OK OK
Highland UK0039 OK OK
Scottish Borders UK0040 OK (m) OK (m)
South Wales UK0041 OK OK
North Wales UK0042 OK OK
Northern Ireland UK0043 OK OK
*Footnote to Table 4-3: Prior to the subtraction of natural source contribution Swansea Urban Area (UK0027)
exceeded the daily mean limit value on more than the permitted 35 occasions (based upon the modelling
assessment only). However, subtraction of the contribution from natural sources reduced the number of
exceedances of this limit value from 38 to 26. Natural sources have only been subtracted for zone UK0027 in this
table and only for the daily mean limit value.
In Table 4-3, LV = limit value, (m) indicates that the compliance or exceedance was determined by modelling.
PM2.5 Particulate matter: All zones met the target value for annual mean
concentration of PM2.5 particulate matter (25 µg m-3 to be achieved by 1st Jan 2010),
the Stage 1 limit value (25 µg m-3 to be achieved by 1st Jan 2015), which came into
force on 1st January 2015, and the Stage 2 limit value (20 µg m-3 to be achieved by
1st Jan 2020). All three apply to the calendar year mean.
The results of the air quality assessment for PM2.5 for each zone are summarised in
Table 4-4. Subtraction of PM2.5 contributions due to natural events (1999/30/EC
Article 5(4)) or natural contributions (2008/50/EC Article 20) was not necessary for
any zone.
Under the Air Quality Directive, Member States will be required to achieve a national
exposure reduction target for PM2.5, over the period 2010 to 2020. This is based on
the Average Exposure Indicator (AEI) statistic. The AEI for the UK is calculated as
follows: the arithmetic mean PM2.5 concentration at appropriate UK urban
background sites only is calculated for three consecutive calendar years, and the
mean of these values taken as the AEI.

45
The AEI for the reference year (2010) was used to determine the National Exposure
Reduction Target (NERT), to be achieved by 2020 (see Annex XIV of the Air Quality
Directive). The UK’s reference year AEI was 13 µg m-3; on this basis, the Air Quality
Directive sets an exposure reduction target of 15%. This equates to reducing the AEI
to 11 µg m-3 by 2020. (The detailed methodology and results of this calculation are
presented in Defra’s technical report on UK air quality assessment54.)
The AEI for the reference year 2015 is set at 20 µg m-3 as an Exposure
Concentration Obligation (ECO) in the Air Quality Directive. The UK already meets
this obligation. There are no obligations or target values for the years between 2010,
2015 and 2020, but the running AEIs for these intervening years give an indication of
progress towards the 2020 target. The running year AEI for 2015 was calculated as
follows:
2013: 12 µg m-3
2014: 12 µg m-3
2015: 10 µg m-3
The mean of these three values (to the nearest integer) is 11 µg m-3.
Ozone: all zones and agglomerations met the target values but all exceeded the
long-term objective for health, and one exceeded the long-term objective for
vegetation. The results of the air quality assessment for ozone are summarised in
Table 4-5.
For ozone, there is a target value based on the maximum daily 8-hour mean. All 43
zones and agglomerations were compliant with this target value. There is also a
long-term objective for protection of human health, based on the maximum daily 8-
hour mean. All of the 43 zones and agglomerations were above the long-term
objective (LTO) for health in 2015. (This is more than in 2014: however, ozone
concentrations – and hence the number of zones exceeding the LTO - fluctuate from
year to year as ozone is a transboundary pollutant and its formation is influenced by
meteorological factors).
There is also a target value based on the AOT40 statistic. The AOT40 statistic
(expressed in µg m-3.hours) is the sum of the difference between hourly
concentrations greater than 80 µg m-3 (= 40 ppb) and 80 µg m-3 over a given period
using only the hourly mean values measured between 08:00 and 20:00 Central
European Time each day. All 43 zones and agglomerations met the target value
based on the AOT40 statistic. There is also a long-term objective, for protection of
vegetation, based on this statistic. One zone, Eastern (UK0029) was above the long-
term objective for vegetation in 2015.

46
Table 4-4 Results of Air Quality Assessment for PM2.5 in 2015.
Zone Zone code
PM2.5 target
value (annual
mean, for 1st
Jan 2010)
PM2.5 Stage 1
limit value
(annual mean,
for 1st Jan
2015)
PM2.5 Stage 2
limit value
(annual
mean, for 1st
Jan 2020)
Greater London Urban Area UK0001 OK OK OK
West Midlands Urban Area UK0002 OK OK OK
Greater Manchester Urban Area UK0003 OK OK OK
West Yorkshire Urban Area UK0004 OK OK OK
Tyneside UK0005 OK (m) OK (m) OK (m)
Liverpool Urban Area UK0006 OK OK OK
Sheffield Urban Area UK0007 OK (m) OK (m) OK (m)
Nottingham Urban Area UK0008 OK OK OK
Bristol Urban Area UK0009 OK OK OK
Brighton/Worthing/Littlehampton UK0010 OK OK OK
Leicester Urban Area UK0011 OK OK OK
Portsmouth Urban Area UK0012 OK OK OK
Teesside Urban Area UK0013 OK OK OK
The Potteries UK0014 OK OK OK
Bournemouth Urban Area UK0015 OK OK OK
Reading/Wokingham Urban Area UK0016 OK OK OK
Coventry/Bedworth UK0017 OK OK OK
Kingston upon Hull UK0018 OK OK OK
Southampton Urban Area UK0019 OK OK OK
Birkenhead Urban Area UK0020 OK OK OK
Southend Urban Area UK0021 OK OK OK
Blackpool Urban Area UK0022 OK OK OK
Preston Urban Area UK0023 OK OK OK
Glasgow Urban Area UK0024 OK OK OK
Edinburgh Urban Area UK0025 OK OK OK
Cardiff Urban Area UK0026 OK OK OK
Swansea Urban Area UK0027 OK OK OK
Belfast Metropolitan Urban Area UK0028 OK OK OK
Eastern UK0029 OK OK OK
South West UK0030 OK OK OK
South East UK0031 OK OK OK
East Midlands UK0032 OK OK OK
North West & Merseyside UK0033 OK OK OK
Yorkshire & Humberside UK0034 OK OK OK
West Midlands UK0035 OK OK OK
North East UK0036 OK OK OK
Central Scotland UK0037 OK OK OK
North East Scotland UK0038 OK OK OK
Highland UK0039 OK OK OK
Scottish Borders UK0040 OK (m) OK (m) OK (m)
South Wales UK0041 OK OK OK
North Wales UK0042 OK OK OK
Northern Ireland UK0043 OK OK OK
Subtraction of natural source contribution was not carried out for any zones in 2015.
LV = limit value, (m) indicates that the compliance or exceedance was determined by modelling.

47
Table 4-5 Results of Air Quality Assessment for Ozone in 2015
Zone
Zone code
O3 TV and LTO for health
(8hr mean)
O3 TV and LTO for
vegetation (AOT40)
Greater London Urban Area UK0001 Met TV, > LTO OK
West Midlands Urban Area UK0002 Met TV, > LTO OK
Greater Manchester Urban Area UK0003 Met TV, > LTO OK
West Yorkshire Urban Area UK0004 Met TV, > LTO OK
Tyneside UK0005 Met TV, > LTO OK
Liverpool Urban Area UK0006 Met TV, > LTO (m) OK
Sheffield Urban Area UK0007 Met TV, > LTO OK (m)
Nottingham Urban Area UK0008 Met TV, > LTO OK
Bristol Urban Area UK0009 Met TV, > LTO (m) OK
Brighton/Worthing/Littlehampton UK0010 Met TV, > LTO OK
Leicester Urban Area UK0011 Met TV, > LTO OK
Portsmouth Urban Area UK0012 Met TV, > LTO OK
Teesside Urban Area UK0013 Met TV, > LTO OK
The Potteries UK0014 Met TV, > LTO OK
Bournemouth Urban Area UK0015 Met TV, > LTO OK
Reading/Wokingham Urban Area UK0016 Met TV, > LTO OK
Coventry/Bedworth UK0017 Met TV, > LTO OK
Kingston upon Hull UK0018 Met TV, > LTO (m) OK
Southampton Urban Area UK0019 Met TV, > LTO (m) OK
Birkenhead Urban Area UK0020 Met TV, > LTO (m) OK (m)
Southend Urban Area UK0021 Met TV, > LTO OK
Blackpool Urban Area UK0022 Met TV, > LTO OK
Preston Urban Area UK0023 Met TV, > LTO OK
Glasgow Urban Area UK0024 Met TV, > LTO (m) OK
Edinburgh Urban Area UK0025 Met TV, > LTO (m) OK
Cardiff Urban Area UK0026 Met TV, > LTO (m) OK
Swansea Urban Area UK0027 Met TV, > LTO OK
Belfast Metropolitan Urban Area UK0028 Met TV, > LTO (m) OK
Eastern UK0029 Met TV, > LTO Met TV, > LTO
South West UK0030 Met TV, > LTO OK
South East UK0031 Met TV, > LTO OK
East Midlands UK0032 Met TV, > LTO OK
North West & Merseyside UK0033 Met TV, > LTO OK
Yorkshire & Humberside UK0034 Met TV, > LTO OK
West Midlands UK0035 Met TV, > LTO OK
North East UK0036 Met TV, > LTO OK
Central Scotland UK0037 Met TV, > LTO OK
North East Scotland UK0038 Met TV, > LTO (m) OK
Highland UK0039 Met TV, > LTO OK
Scottish Borders UK0040 Met TV, > LTO OK
South Wales UK0041 Met TV, > LTO OK
North Wales UK0042 Met TV, > LTO OK
Northern Ireland UK0043 Met TV, > LTO OK
Footnote to Table 4-5: TV = target value, LTO = long-term objective, (m) indicates that the compliance or
exceedance was determined by modelling.

48
In 2015 there were 35 measured exceedances of the ozone information thresholds
(at 10 sites) but no exceedances of the alert threshold. The information threshold
exceedances are detailed in Table 4-6. All occurred between 13:00 and 24:00 on the
same day: 1st July 2015.
Table 4-6 Measured Exceedances of the Ozone Information Threshold Value in
2015
Site name Zone
code
Number of 1-hour
exceedances of
information threshold
Maximum 1-hour
concentration (µg m-3)
Weybourne UK0029 9 224
Sibton UK0029 7 221
Wicken Fen UK0029 5 207
High Muffles UK0034 4 197
Northampton Kingsthorpe UK0032 3 200
London Teddington UK0001 2 185
Sheffield Devonshire Green UK0007 2 185
Brighton Preston Park UK0010 1 181
Canterbury UK0031 1 185
Preston UK0023 1 181
4.2.2 Fourth Daughter Directive 2004/107/EC
All zones met target values for arsenic and cadmium but some zones exceeded
target values for nickel and benzo[a]pyrene. The results of the air quality assessment
for arsenic (As), cadmium (Cd), nickel (Ni) and benzo[a]pyrene (B[a]P) for each zone
are summarised in Table 4-7.
All zones and agglomerations met the target values for arsenic and cadmium. Two
zones (Swansea Urban Area and South Wales) exceeded the target value for nickel.
In these zones, the exceedance has been attributed to industrial sources.
Concentrations of B[a]P were above the target value in five zones; Teesside Urban
Area, Swansea Urban Area, Yorkshire and Humberside, the North East, and South
Wales. In Teesside, Swansea and the North East, the exceedances are attributed to
emissions from industrial sources. In South Wales, the exceedance results from a
combination of industrial sources and domestic solid fuel use, while in Yorkshire and
Humberside it is predominantly due to industrial emissions with some contribution
from domestic sources. The remaining 38 zones were compliant with the target value
for B[a]P, as shown in Table 4-7.

49
Table 4-7 Results of Air Quality Assessment for As, Cd, Ni and B[a]P in 2015
Zone Zone code As TV Cd TV Ni TV B[a]P TV
Greater London Urban Area UK0001 OK OK OK OK
West Midlands Urban Area UK0002 OK (m) OK (m) OK (m) OK
Greater Manchester Urban Area UK0003 OK (m) OK (m) OK (m) OK
West Yorkshire Urban Area UK0004 OK (m) OK (m) OK (m) OK
Tyneside UK0005 OK (m) OK (m) OK (m) OK
Liverpool Urban Area UK0006 OK (m) OK (m) OK (m) OK
Sheffield Urban Area UK0007 OK OK OK OK (m)
Nottingham Urban Area UK0008 OK (m) OK (m) OK (m) OK (m)
Bristol Urban Area UK0009 OK (m) OK (m) OK (m) OK (m)
Brighton/Worthing/Littlehampton UK0010 OK (m) OK (m) OK (m) OK
Leicester Urban Area UK0011 OK (m) OK (m) OK (m) OK (m)
Portsmouth Urban Area UK0012 OK (m) OK (m) OK (m) OK (m)
Teesside Urban Area UK0013 OK (m) OK (m) OK (m) > TV (m)
The Potteries UK0014 OK (m) OK (m) OK (m) OK (m)
Bournemouth Urban Area UK0015 OK (m) OK (m) OK (m) OK (m)
Reading/Wokingham Urban Area UK0016 OK (m) OK (m) OK (m) OK (m)
Coventry/Bedworth UK0017 OK (m) OK (m) OK (m) OK (m)
Kingston upon Hull UK0018 OK (m) OK (m) OK (m) OK (m)
Southampton Urban Area UK0019 OK (m) OK (m) OK (m) OK (m)
Birkenhead Urban Area UK0020 OK (m) OK (m) OK (m) OK (m)
Southend Urban Area UK0021 OK (m) OK (m) OK (m) OK (m)
Blackpool Urban Area UK0022 OK (m) OK (m) OK (m) OK (m)
Preston Urban Area UK0023 OK (m) OK (m) OK (m) OK (m)
Glasgow Urban Area UK0024 OK (m) OK (m) OK (m) OK
Edinburgh Urban Area UK0025 OK (m) OK (m) OK (m) OK
Cardiff Urban Area UK0026 OK (m) OK (m) OK (m) OK
Swansea Urban Area UK0027 OK OK > TV > TV (m)
Belfast Urban Area UK0028 OK OK OK OK
Eastern UK0029 OK OK OK OK
South West UK0030 OK OK OK OK (m)
South East UK0031 OK OK OK OK
East Midlands UK0032 OK (m) OK (m) OK (m) OK
North West & Merseyside UK0033 OK OK OK OK
Yorkshire & Humberside UK0034 OK OK OK > TV
West Midlands UK0035 OK OK OK OK (m)
North East UK0036 OK (m) OK (m) OK (m) > TV (m)
Central Scotland UK0037 OK OK OK OK
North East Scotland UK0038 OK (m) OK (m) OK (m) OK (m)
Highland UK0039 OK (m) OK (m) OK (m) OK
Scottish Borders UK0040 OK OK OK OK (m)
South Wales UK0041 OK OK > TV (m) > TV (m)
North Wales UK0042 OK (m) OK (m) OK (m) OK (m)
Northern Ireland UK0043 OK (m) OK (m) OK (m) OK
TV = target value, (m) indicates that the compliance or exceedance was determined by modelling.

50
4.3 Comparison with Previous Years
Table 4-8 to Table 4-12 summarise the results of the air quality assessment for 2015 and provide a comparison with the results of
the assessments carried out in previous years since 2008 (the year in which the Air Quality Directive came into force). For
information on compliance with the 1st and 2nd Daughter Directives in earlier years, please see the 2012 or earlier reports in this
series. Table 4-8 shows the number of zones exceeding the limit value plus any agreed margin of tolerance applicable in the
relevant year (i.e. the numbers of zones that were non-compliant). If any additional zones were within the limit value plus an agreed
MOT (and therefore compliant), for example for NO2, this is shown in the footnotes. As explained in section 4.2.1 above, there are
no longer any margins of tolerance (MOT) in force for these or any other pollutants.
Table 4-8 Non-Compliances with the Limit Values of the Air Quality Directive
Pollutant Avg.
time 2008 2009 2010 2011 2012 2013 2014 2015
SO2 1-hour None None None None None None None None
SO2 24-hour None None None None None None None None
SO2 Annuali None None None None None None None None
SO2 Winteri None None None None None None None None
NO2 1-hourii 3 zones
(London,
Glasgow, NE
Scotland)
2 zones
(London,
Glasgow)
3 zones
(London,
Teesside,
Glasgow)
3 zones
(London,
Glasgow, South
East)
2 zones
(London, South
East)
1 zone
(London)
2 zones
(London, South
Wales)
2 zones
(London, South
Wales)
NO2 Annual 40 zones 40 zones 40 zones 35 zonesiii 34 zonesiv 31 zones v 30 zones vi 37 zones vii
NOx Annuali None None None None None None None None
PM10 Daily 2 zones (1
zone after
subtraction of
natural
contribution)
3 zones (1
zone after
subtraction of
natural
contribution)
None (after
subtraction of
natural
contribution)viii
None (after
subtraction of
natural
contribution)ix
None (after
subtraction of
natural
contribution. No
time extension.)
None (after
subtraction of
natural
contribution. No
time extension.)
None (after
subtraction of
natural
contribution. No
time extension.)
None (after
subtraction of
natural
contribution. No
time extension.)

51
Pollutant Avg.
time 2008 2009 2010 2011 2012 2013 2014 2015
PM10 Annual None None None None None None None None
Lead Annual None None None None None None None None
Benzene Annual None None None None None None None None
CO 8-hour None None None None None None None None
Footnotes to Table 4-8:
i Applies to vegetation and ecosystem areas only. Critical Levels are already in force, no MOT.
ii No modelling for 1-hour LV.
iii A further five zones exceeded the annual mean NO2 LV in 2011 but were covered by time extensions and within the LV+ MOT, therefore compliant.
iv A further four zones exceeded the annual mean NO2 LV in 2012 but were covered by time extensions and within the LV+ MOT, therefore compliant.
v A further seven zones exceeded the annual mean NO2 LV in 2013 but were covered by time extensions and within the LV+ MOT, therefore compliant.
vi A further eight zones exceeded the annual mean NO2 LV in 2014 but were covered by time extensions and within the LV+ MOT, therefore compliant.
vii 2015 was the first year with no time extensions for NO2: this is the reason for the apparent increase in zones exceeding between 2014 and 2015.In 2014, 5 zones met the
limit value and a further 8 zones were legally compliant due to the time extension. The time extensions ended on 1 January 2015. In 2015, 6 zones met the limit value, but the
remaining zones were no longer covered by the time extension, bringing the total number of non-compliant zones from 30 in 2014 to 37 in 2015
viii One zone exceeded the daily mean PM10 limit value more than the permitted 35 times in 2010, after subtraction of natural contribution. This zone was covered by a time
extension, and was within the LV+MOT so was therefore compliant.
ix One zone exceeded the daily mean PM10 limit value more than the permitted 35 times in 2011, after subtraction of natural contribution. This zone was covered by a time
extension, and was within the LV+MOT so was therefore compliant.
The UK has been compliant with the limit values for both lead and CO since 2003, and for benzene since 2007: these limit values
are the same as those contained in the 1st and 2nd Daughter Directives, which the Air Quality Directive superseded.

52
Table 4-9 Exceedances of Air Quality Directive Target Values for Ozone (Health)
Pollutant Averaging
time
2008 2009 2010 2011 2012 2013 2014 2015
O3 8-hour 1 zone
measured
(Eastern)
None None None None None None None
O3 AOT40 None None None None None None None None
Table 4-10 Exceedances of Air Quality Directive Long Term Objectives for Ozone
Pollutant Averaging
time
2008 2009 2010 2011 2012 2013 2014 2015
O3 8-hour 43 zones 39 zones 41 zones 43 zones 41 zones 33 zones 32 zones 43 zones
O3 AOT40 41 zones 10 zones 6 zones 3 zones 3 zones 8 zones 3 zones 1 zone

53
Table 4-11 Exceedances of 4th Daughter Directive Target Values
Pollu-
tant
Averaging
time
2007 2008 2009 2010 2011 2012 2013 2014 2015
As Annual None None None None None None None None None
Cd Annual None None None None None None None None None
Ni Annual
1 zone
(Swansea
Urban area)
2 zones
(Swansea, S
Wales)
2 zones
(Swansea, S
Wales)
2 zones
(Swansea, S
Wales)
2 zones,
(Swansea, S
Wales)
2 zones,
(Swansea, S
Wales)
2 zones,
(Swansea, S
Wales)
3 zones,
(Sheffield,
Swansea, S
Wales)
2 zones,
(Swansea,
S Wales)
B[a]P Annual
1 zone
(Yorkshire &
Humberside)
6 zones
(Yorkshire &
Humberside,
Teesside, N
Ireland,
Swansea, S
Wales,
Belfast)
6 zones
(Yorkshire &
Humberside,
N Ireland,
Teesside,
Swansea,
North East, S
Wales)
8 zones,
(Yorkshire &
Humberside,
N Ireland,
Teesside,
Belfast, W
Midlands,
North East, S
Wales, N
Wales.)
7 zones
(Yorkshire &
Humberside,
N Ireland,
Teesside,
Swansea,
Belfast, North
East, South
Wales)
8 zones
(Yorkshire &
Humberside,
Teesside,
Swansea,
Belfast, the
North East,
South Wales,
North Wales,
Northern
Ireland.)
6 zones
(Yorkshire &
Humberside,
Teesside,
Swansea, the
East
Midlands, the
North East,
South
Wales.)
6 zones
(Yorkshire &
Humberside,
Teesside,
Swansea, the
East
Midlands, the
North East
and South
Wales).
5 zones
(Yorkshire
& Humber-
side,
Teesside,
Swansea,
the North
East and
South
Wales).
Table 4-12 Exceedances of Ambient Air Quality Directive Target Value for PM2.5
Pollutant Ave. time 2009 2010 2011 2012 2013 2014 2015
PM2.5 Annual None None None None None None None

54
5 Spatial Variation and Changes Over Time
This section looks at the spatial distribution of pollutants across the UK, based upon
the modelled maps of ambient pollutant concentration discussed in Section 3.5 of
this report, “Modelling”. In the case of traffic-related pollutants such as NO2, roadside
and background concentrations are discussed separately.
For each pollutant, this section also discusses how ambient concentrations have
changed over time, using data from the relevant ambient air quality monitoring
networks: the Automatic Urban and Rural Network (AURN), the Automatic
Hydrocarbon Network, the Non-Automatic Hydrocarbon Network, the UK Metals
Network, and the PAH Network.
The AURN has been in operation since 1992. Since that time it has grown
considerably in size, and the proportion of urban traffic (‘roadside’) monitoring sites
has increased. Therefore, we have in some cases based our investigation of trends
on data from sub-sets of long-running AURN monitoring sites, rather than the whole
network. This is intended to show changes over time, without introducing any
spurious effects due to changes in the number and distribution of the sites.
For pollutants monitored using continuous automatic techniques, trend analysis has
been carried out using Openair: a free, open-source software package of tools for
analysis of air pollution data. Openair was developed by King’s College London with
the University of Leeds. The Openair project is currently led by Dr David Carslaw, of
Ricardo Energy & Environment and the University of York. A range of Openair tools
are available on UK-AIR: for more information on the tools and how to use them,
please refer to: https://uk-air.defra.gov.uk/data/openair.
The Openair ‘TheilSen’ tool has been used here. This uses the Theil-Sen statistical
method to determine trends in pollutant concentrations over several years. The trend
analysis is based on monthly mean pollutant concentrations. (At least 75% data
capture is required for a valid monthly mean.) Openair includes an option to ‘de-
seasonalise’ the data (i.e. statistically modify the plotted data to remove the influence
of seasonal cycles, thus providing a clearer indication of the overall trend). The de-
seasonalise option has been used for some strongly seasonal pollutants; SO2,
particulate matter and CO - but not the generally traffic-related ones or ozone.
Where the ‘de-seasonalise’ option has been used here, this is indicated in the graph
title. In these trend graphs, the trend line is shown by a solid red line, with 95%
confidence intervals for the trend shown by dotted red lines. The trend is given at the
top of the graph in green, with confidence intervals shown in square brackets. The
trend is given as units (e.g. µg m-3) per year, over the period shown. This may be
followed by a number of symbols, with + indicating that the trend is significant at the

55
0.1 level, * indicating that the trend is statistically significant at the 0.05 level, **
indicating significance at the 0.01 level and *** indicating significance at the 0.001
level.
These changes over time are compared to changes in estimated total UK emissions
where appropriate. Estimated UK emissions data are taken from the National
Atmospheric Emissions Inventory (NAEI) website29 at
http://naei.defra.gov.uk/index.php. (The most recent year for which NAEI emission
estimates are available is 2014). For some pollutants, the NAEI website allows bar
charts to be created, showing emissions over a selected period of years, split
between various emission source categories.
Please note that this section only aims to provide a general indication of changes in
pollutant concentration over time, based in most cases on averages from groups of
long-running sites. Patterns in specific regions or individual sites may be different.
5.1 Sulphur Dioxide
5.1.1 SO2: Spatial Distribution in the UK
Figure 5-1 shows how the modelled 99.73rd percentilea of hourly mean sulphur
dioxide concentration varied across the UK during 2015. This statistic corresponds
approximately to the 25th highest hourly mean (in the case of a full year’s data); if
greater than the hourly mean limit value it indicates that the limit value was exceeded
on more than the 24 permitted occasions. There were no areas in which this statistic
exceeded the limit value of 350 µg m-3.
Figure 5-2 shows the modelled 99.18th percentile of 24-hour means (which
corresponds to the 4th highest day in a full year). If greater than the 24-hourly mean
limit value of 125 µg m-3, this would indicate that there were more than the permitted
three exceedances in the year. There were no areas of the UK where this was the
case in 2015.
5.1.2 SO2: Changes Over Time
Figure 5-3 shows how ambient concentrations have changed over the period 1992
to 2015, at the seven AURN monitoring stations that have monitored this pollutant for
the longest time, and have remained in operation in 2015. All seven stations show a
downward trend that is statistically significant at the 0.001 level - highly significant –
as denoted by the three asterisks (***) on the plots.
a Where the Directive allows exceedances on a number of occasions (i.e. limit value not to be exceeded more than a specified number of times per year), percentiles are used to illustrate this. These are simply the xth highest hourly mean divided by the number of hours in a year, or yth highest daily mean divided by the days in a year, expressed as a percentage.

56
However, the decrease has not been linear. At most of these sites, the downward
trend is steepest for the 1990s and early 2000s: there is a clear flattening-off in more
recent years from around 2010.
The pattern observed in ambient SO2 concentrations appears to reflect changes in
national emissions. Figure 5-4 is taken from the NAEI and shows the UK’s
estimated annual emissions of sulphur dioxide from 1992 (the first year of operation
of the AURN) to 2014. The main source of this pollutant is fossil fuel combustion.
SO2 emissions in the UK have decreased substantially since 1992, due to reductions
in the use of coal, gas and oil, and also to reductions in the sulphur content of fuel
oils and DERV (diesel fuel used for road vehicles). The decrease in emissions over
time shown here is the continuation of an on-going trend observed by the NAEI
throughout the 1970s and 1980s, partly due to the decline of the UK’s heavy
industry.
However, around 2009, the graph flattens off, and shows a slight upturn in total SO2
emissions in 2012. The NAEI pollutant information page for SO2 (at
http://naei.defra.gov.uk/overview/pollutants?pollutant_id=8 ) explains this as follows:
“As a result of the economic downturn the drive to cut energy costs has resulted in
an increase in solid fuel use, particularly in 2012 some coal-sensitive pollutants have
seen a significant rise in coal burning emissions.”

57
Figure 5-1 99.73rd percentile of 1-hour mean SO2
concentration, 2015 (µg m-3)
Figure 5-2 99.18th percentile of 24-hour mean SO2 concentration,
2015 (µg m-3)

58
Figure 5-3 De-seasonalised trends in SO2 concentration, 1992-2015 at 7 Long-
running AURN Sites
Figure 5-4 Estimated Annual UK Emissions of SO2 (kt), 1992 – 2014 Source:
NAEI

59
5.2 Nitrogen Dioxide
5.2.1 NO2: Spatial Distribution in the UK
Figure 5-5 shows the modelled annual mean NO2 concentrations for 2015, at urban
roadside locations only. Although not every road link is clearly visible, it is possible to
see that many are shaded yellow, orange and red - indicating that they had annual
mean NO2 concentrations above the limit value of 40 µg m-3. These locations are
widespread in London and also visible in urban areas elsewhere in the UK.
Figure 5-6 shows the modelled annual mean background NO2 concentrations for
2015. Most background locations were within the limit value of 40 µg m-3, but some
small areas were not. These are shaded yellow, orange and red. These were largely
confined to the major urban areas, and principal road links.
5.2.2 NO2: Changes Over Time
Figure 5-7 and Figure 5-8 show how ambient concentrations of nitrogen dioxide (as
measured by the AURN) have decreased since 1992 (the Network’s first year of
operation). Time series of annual mean NO2 concentrations are shown for the
following sub-sets of long-running sites:
Eight urban background sites operating since 1995 or earlier (Figure 5-7); Belfast Centre, Cardiff Centre, Leeds Centre, London Bloomsbury, Middlesbrough, Newcastle Centre, Sheffield Tinsley and Southampton Centre.
Eight urban traffic sites operating since 1998 or earlier (Figure 5-8); Camden Kerbside, Exeter Roadside, Bath Roadside, Haringey Roadside, Glasgow Kerbside, Tower Hamlets Roadside, London Marylebone Road and Oxford Centre Roadside.
(As explained above, the use of sub-sets of long-running monitoring sites is intended
to show changes over time, without introducing any spurious effects due to changes
in the number and distribution of the sites.)

60
Figure 5-5 Urban major roads, annual mean roadside NO2
concentration, 2015 (µg m-3)
Figure 5-6 Annual mean background NO2 concentration,
2015 (µg m-3)

61
Figure 5-7 NO2 concentration: Trend Analysis for 8 Long-Running Urban
Background AURN sites 1992 – 2015 (not de-seasonalised)
All eight long-running urban non-roadside sites in Figure 5-7 above show a
decreasing trend in NO2; while the magnitude of the year-on year decrease varies
(ranging from -0.5 µg m-3 to -1.1 µg m-3 per year), the trend is statistically significant
at the 0.001 level for all eight sites.
For the urban traffic sites in Figure 5-8 below, (for which the dataset is slightly
shorter), the pattern of trends is less consistent. Only four of the eight sites show a
statistically significant downward trend, and the others show no significant trend.

62
Figure 5-8 NO2 concentration: Trend Analysis for 8 Long-Running Urban
Traffic AURN sites 1998 – 2015 (not de-seasonalised)
Figure 5-9 shows the estimated total UK annual emission of oxides of nitrogen, from
the NAEI, in kilotonnes. Total NOx emissions have decreased substantially over the
period shown. While long-running urban background sites show a general decrease
in NO2 concentration as might be expected from the national emissions estimates,
the same is not consistently true of urban traffic sites. It is likely that the trend in
ambient NO2 concentration at each individual site depends, at least in part, on the
quantity and type of traffic on the adjacent road.
In December 2015 the Government published its national air quality plan for nitrogen
dioxide which sets out how the UK will achieve compliance with EU limit values for
NO2. (See section 2.2.5 for more information on this.) The UK’s draft Air Quality
Plans are available at https://uk-air.defra.gov.uk/library/no2-consultation-documents-
2015 .

63
Figure 5-9 Estimated Annual UK Emissions of Nitrogen Oxides (kt), 1992 –
2014 Source: NAEI

64
5.3 PM10 Particulate Matter
5.3.1 PM10: Spatial Distribution
Figure 5-10 shows modelled annual mean urban roadside PM10 concentrations in
2015. No roadside locations had an annual mean concentration greater than 40 µg
m-3. This is consistent with the compliance assessment reported in Section 4.
Figure 5-11 shows annual mean background PM10 concentrations in 2015.
Background concentrations are higher in the southern and eastern parts of the
country, because these regions receive a larger transboundary contribution of
particulate pollution from mainland Europe. The elevated levels of PM10 associated
with urban areas and major roads can also be seen. Natural source contribution has
not been subtracted from these maps.
The concentration bands used in the above figures include the ranges >30.1-30.5 µg
m-3, and >30.6-40 µg m-3. The significance of the division at 30.5 µg m-3 is that where
the annual mean PM10 concentration exceeds this value, it is likely also that the 24-
hour mean has exceeded the daily mean limit value of 50 µg m-3 on more than the
permitted 35 occasions. (Note: this value is calculated each year on the basis of the
measured data. It may therefore change from year to year.)
Road links with annual mean concentrations greater than 30.5 µg m-3 would be
shaded red in Figure 5-10. No red shaded road links are visible on the map;
although as reported in Section 4, Swansea Urban Area exceeded the 24-hour limit
value (before subtraction of natural source contribution) this was a measured
exceedance at a non-traffic-related monitoring site, rather than a modelled roadside
exceedance.

65
Figure 5-10 Urban major roads, annual mean
roadside PM10 concentration, 2015 (µg m-3)
Figure 5-11 Annual mean background PM10
concentration, 2015 (µg m-3)

66
5.3.2 PM10 Changes Over Time
Figure 5-12 shows de-seasonalised trends in ambient PM10 concentration, based on
11 urban background AURN sites, all of which have been operating since at least
1996. The sites are; Belfast Centre, Cardiff Centre, Leamington Spa, Leeds Centre,
London Bloomsbury, London North Kensington, Middlesbrough, Newcastle Centre,
Nottingham Centre, Southampton Centre and Thurrock. All 11 sites show a
downward trend for PM10 over their period of operation, highly statistically significant
(at the 0.001 confidence level).
Figure 5-13 shows de-seasonalised trends in ambient PM10 concentration, based on
11 urban traffic AURN sites. There are fewer very long-running urban traffic sites
than urban background sites: only three began operation before 2008. The sites
shown here are the 11 that have been operating since the start of 2009 or earlier.
The sites are; Armagh Roadside, Camden Kerbside, Carlisle Roadside, Chepstow
A48, Leeds Headingley Kerbside, London Marylebone Road, Sandy Roadside,
Stanford-le-Hope Roadside, Stockton-on-Tees Eaglescliffe, Swansea Roadside and
York Fishergate.
Although most of these sites show a statistically significant downward trend in PM10
concentration over this period, not all do: Stockton-on-Tees Eaglescliffe shows no
significant trend, and Swansea Roadside shows a statistically significant increase.
As in the case of NO2, it is possible that trends at urban traffic sites are influenced by
changes in the volume and type of traffic on the adjacent road.
Figure 5-14 shows how the UK’s total emissions of PM10 have decreased over the
years in which the AURN has been in operation. Total PM10 emissions have steadily
decreased over all this period, although in more recent years the rate of decrease
has slowed, flattening off after around 2009. However, estimated emissions from
road traffic alone have continued to decrease (Figure 5-15).

67
Figure 5-12 Trends in ambient PM10, 11 Long-Running Urban Background Sites

68
Figure 5-13 Trends in ambient PM10, 11 Urban Traffic Sites 2009 - 2015
Figure 5-14 Estimated Annual UK Emissions of PM10 (kt), 1992 – 2014 Source:
NAEI

69
Figure 5-15 Estimated Annual UK Emissions of PM10 from Road Transport (kt),
2009 – 2014 Source: NAEI
(Please note, the colours used in these bar charts are selected automatically and the colour used for
road transport here is different from that in the previous graph).
5.4 PM2.5 Particulate Matter
5.4.1 PM2.5: Spatial Distribution
Figure 5-16 shows the modelled annual mean urban roadside PM2.5 concentrations
in 2015. No roadside locations had annual means greater than the target value of 25
µg m-3; even in London, the highest were in the range 15 - 20 µg m-3.
Figure 5-17 shows modelled annual mean background PM2.5 concentrations in
2015. The pattern shows some similarities to that observed for PM10, in that levels
are higher in the southern and eastern areas, due to the contribution of particulate
matter from mainland Europe. Whilst the 2014 map showed a substantial part of
eastern England as having modelled background annual mean PM2.5 concentrations
greater than 10 µg m-3, in 2015 this was not the case. Only major urban areas and
locations near major routes have modelled background PM2.5 concentrations above
this level: this reflects primary emissions from these sources.

70
Figure 5-16 Urban major roads, annual mean roadside
PM2.5 concentration, 2015 (µg m-3)
Figure 5-17 Annual mean background PM2.5 concentration,
2015 (µg m-3)

71
5.4.2 PM2.5: Changes Over Time
Until 2008, routine monitoring of PM2.5 within the AURN was confined to a
small number of sites in London. Therefore, in this report, trend analysis for
PM2.5 concentrates on years 2009 onwards, during which PM2.5 monitoring
has been widespread.
Figure 5-18 shows trends in PM2.5 concentration at 12 long-running urban
background AURN sites, 2009-2015. While the majority (eight out of the 12)
show a statistically significant downward trend, the other four do not show any
significant trend.
Figure 5-18 Trends in ambient PM2.5 concentration, 12 Long-Running
Urban Background AURN Sites 2009-2015

72
Figure 5-19 shows trends over the same period for PM2.5 at 12 urban traffic
AURN sites. While the majority (nine out of the 12 sites) show a significant
decreasing trend over the period, three do not. Swansea Roadside is notable
as it has a highly significant increasing trend in PM2.5 concentration.
Figure 5-19 Trends in ambient PM2.5 concentration, 12 Long-Running Urban Traffic AURN Sites 2009-2015
Finally, Figure 5-20 shows the estimated annual emission of PM2.5, from 1992
to 2014. The graph shows that emissions have decreased in a similar manner
to emissions of PM10, with a steady decrease from the early 1990s, a clear
levelling off, and no further consistent decrease after around 2009.

73
Figure 5-20 Estimated Annual UK Emissions of PM2.5 (kt), 1992 – 2014. Source: NAEI
5.5 Benzene
5.5.1 Benzene: Spatial Distribution
Benzene is found in petrol and in vehicle emissions, therefore elevated levels
may be expected at roadside locations.
Figure 5-21 shows modelled annual mean benzene concentrations at
roadside locations in 2015. Figure 5-22 shows the modelled annual mean
background concentrations of benzene in 2015. Modelled background
concentrations were below 0.5 µg m-3 over most of the UK, with marginally
higher concentrations for most urban areas. A few small areas, for example in
the Midlands and Humberside, had concentrations in excess of 1 µg m-3.
However, background concentrations everywhere are well below the limit
value of 5 µg m-3 for benzene.

74
Figure 5-21 Urban major roads, annual mean roadside
benzene concentration, 2015 (µg m-3)
Figure 5-22 Annual mean background benzene
concentration, 2015 (µg m-3)

75
5.5.2 Benzene: Changes Over Time
Figure 5-23 shows a smoothed trend plot based on the combined dataset
from 15 long-running sites in the Non-Automatic Hydrocarbon Network, which
have operated since 2002. These are: Barnsley Gawber, Belfast Centre,
Grangemouth, Haringey Roadside, Leamington Spa, Leeds Centre, Liverpool
Speke, London Bloomsbury, Manchester Piccadilly, Middlesbrough,
Newcastle Centre, Nottingham Centre, Oxford Centre Roadside,
Southampton Centre and Stoke on Trent Centre.
The smoothed trend plot for these 15 sites shows a slight increase from 2002
to 2004, followed by a steep decrease between 2004 and 2008. From then
on, the graph is much flatter, showing little further fall in ambient
concentrations of benzene until 2014. In the past two years there is some
indication of a further decrease.
Figure 5-23 Smoothed Trend Plot of Ambient Benzene Concentration, 15
Long-Running Non-Automatic Sites

76
Figure 5-24 shows the estimated total annual UK emission of benzene (in
kilotonnes). The data have been taken from the NAEI (which does not provide
a bar chart for benzene). The estimated annual emissions also appear to
have decreased over period shown – although more steadily than the average
measured ambient concentration.
Figure 5-24 Estimated Annual UK Emissions of Benzene (kt), 2002 –
2014 (data from NAEI)
5.6 1,3-Butadiene
5.6.1 1,3-Butadiene: Compliance with AQS Objective
The ambient concentration of 1,3-butadiene is not covered by any EU
Directives so modelled maps are not routinely produced for this pollutant.
However, it is the subject of a UK Air Quality Strategy objective of 2.25 µg m-3,
as a maximum running annual mean, to have been achieved by 31st
December 2003. This objective was met throughout the UK by the due date.
The Automatic Hydrocarbon Network monitors ambient concentrations of 1,3-
butadiene at its four sites. There are two rural sites (Auchencorth Moss and
0
2
4
6
8
10
12
14
16
18
20
2002 2003 2004 2005 2006 2007 2008 2009 2010 2011 2012 2013 2014
Esti
mat
ed
to
tal U
K A
nn
ual
em
issi
on
of b
en
zen
e, k
t
Year

77
Harwell), one urban background site (London Eltham) and one urban traffic
site (London Marylebone Road). At the two rural sites, concentrations are low:
annual means from 2012 onwards have been less than 0.1 µg m-3, and
individual measurements are frequently close to, or less than, the detection
limit of 0.02 µg m-3. The running annual means at all four sites were within the
Air Quality Strategy objective in 2015.
5.6.2 1,3-Butadiene: Changes Over Time
Figure 5-25 shows trends in ambient 1,3-butadiene concentration at the two
London sites only, between 2000 and 2015. Concentrations are higher at
London Marylebone Road, reflecting its roadside location. Both the London
sites show a highly significant downward trend in this pollutant. (The two rural
sites – not plotted – do not show any significant trend).
Figure 5-25 Trends in Urban 1,3-butadiene concentration, 2000-2015
Figure 5-26 shows the total estimated UK annual emission of this compound,
in kilotonnes. This appears to have decreased steadily since 2000. The main
source of 1,3-butadiene is vehicle emissions, and the use of catalytic

78
converters since the early 1990s has substantially reduced emissions from
this source.
Figure 5-26 Estimated Annual UK Emissions of 1,3-Butadiene (kt), 2000 –
2014 (data from NAEI)
5.7 Carbon Monoxide
5.7.1 CO: Spatial Distribution
Ambient concentrations of CO throughout the UK have been well within the
limit value for many years, Therefore, since 2010, maps have no longer been
routinely produced for CO.
5.7.2 CO: Changes over time
Because concentrations of CO are well within the limit value, relatively few
monitoring sites are required. Seven urban AURN sites currently monitor this
pollutant, of which six (Belfast Centre, Cardiff Centre, Edinburgh St Leonards,
Leeds Centre, London Marylebone Road and London North Kensington) have
operated for at least 10 years.
0
1
2
3
4
5
6
2000 2001 2002 2003 2004 2005 2006 2007 2008 2009 2010 2011 2012 2013 2014
Esti
mat
ed
to
tal U
K A
nn
ual
em
issi
on
of 1
,3-b
uta
die
ne
, kt
Year

79
Figure 5-27 shows de-seasonalised trends at these six long-running AURN
sites, from 1992 to 2015. All six show a highly significant downward trend over
the period. Figure 5-28 shows the estimated annual emissions of CO over the
same period: a steady, almost linear year-on-year decrease to 2011 is
followed by three years in which estimated emissions increased very slightly.
The decreasing ambient concentrations reflect declining emissions over the
last two decades. UK emissions of this pollutant have decreased substantially
over recent decades. The NAEI attributes this decrease to “significant
reductions in emissions from road transport, iron and steel production and the
domestic sector”.55
Figure 5-27 Trends in CO concentration, 1992-2015, AURN Sites

80
Figure 5-28 Estimated Annual UK Emissions of CO (kt), 1992 – 2014
Source: NAEI

81
5.8 Ozone
5.8.1 O3: Spatial Distribution
Figure 5-29 shows the average number of days per year with ozone
concentration > 120 µg m-3, over the three years 2013-2015. This was less
than five days everywhere apart from a small area of East Anglia. Figure 5-30
shows the same statistic, for 2015 only (i.e. not averaged over three years).
Most of the UK had less than five days above 120 µg m-3 in 2015, apart from
part of East Anglia.
Figure 5-31 shows the AOT40 statistic, averaged over the past five complete
years, 2011-2015. The AOT40 statistic (expressed in µg m-3.hours) is the sum
of the difference between hourly concentrations greater than 80 µg m-3 (= 40
ppb) and 80 µg m-3 over a given period using only the one-hour values
measured between 0800 and 2000 Central European Time each day. Highest
AOT40 values are seen in the east of England (a typical pattern in many
years) and the South West (the latter reflects the fact that the highest
concentrations in 2013 were mainly in the South West).
Figure 5-32 shows the same statistic, for 2015 only. The pattern for 2015
shows the highest concentrations in two areas: East Anglia and the South
West.

82
Figure 5-29 Average no. of days with ozone concentration
> 120 µg m-3 2013-2015
Figure 5-30 Days with ozone concentration > 120 µg m-3 in
2015

83
Figure 5-31 Average AOT40, 2011-2015 (µg m-3.hours)
Figure 5-32 Average AOT40, 2015 (µg m-3.hours)

84
5.8.2 O3: Changes Over Time
Figure 5-33 shows a trend plot of ozone concentrations at 12 long-running rural
AURN sites (Aston Hill, Bush Estate, Eskdalemuir, Great Dun Fell, Harwell, High
Muffles, Ladybower, Lough Navar, Lullington Heath, Sibton, Strathvaich and Yarner
Wood). Rural sites have been chosen because concentrations of ozone are typically
highest in rural areas.
Three sites show a positive trend over this period, two show a negative trend, and
the remaining seven show no trend. There is therefore no consistent pattern of
upward or downward trends at these rural sites.
Figure 5-33 Trends in ozone concentration at 12 Long-Running Rural AURN
sites, 1992 - 2015.
Ozone is not emitted in significant quantities directly from any source in the UK
(instead, it is formed from reactions involving other pollutants). Ozone is therefore
not included in the NAEI, and trends in ozone emissions are not covered by this
report.

85
5.9 Metallic Elements
5.9.1 Metallic Elements: Spatial Distribution
Figure 5-34, Figure 5-35, Figure 5-36 and Figure 5-37 show modelled annual
mean concentrations of lead (Pb), arsenic (As), cadmium (Cd) and nickel (Ni)
respectively in 2015. The spatial distribution patterns are discussed below.
Pb: background concentrations were less than 10 ng m-3 (0.01 µg m-3) over most of
the UK. Higher levels are visible in urban areas (particularly industrial areas). Higher
concentrations are also clearly visible along major routes; this is not caused by
vehicle emissions (leaded petrol having been banned within the EU from January
2000), but by re-suspended road dust.
As: this is not strictly a metal but is measured by the UK Metals Network.
Background concentrations were less than 6.0 ng m-3 over the whole UK, and less
than 1.8 ng m-3 over most of the country. However, concentrations of 1.8 ng m-3 and
above occurred in some areas – particularly the north eastern part of England,
Yorkshire and Humberside. This pattern reflects the natural sources of airborne
arsenic, particularly wind-blown dust. Modelled concentrations are therefore highest
in areas where agricultural practices give rise to wind-blown dust (such as parts of
eastern England) and where the natural arsenic content of the soil is relatively high
(such as parts of Cornwall).
Cd: background concentrations were less than 0.2 ng m-3 over almost all of the UK.
Some major road routes are visible: this is due to re-suspended road dust. Also there
are some small areas with concentrations in the range 0.5 – 5.0 ng m-3, relating to
specific point sources. Please note that the scale used for Cd concentrations was
changed in the 2010 report in this series, reflecting the decrease observed in
ambient concentrations over recent years.
Ni: background concentrations of Ni were typically less than 2 ng m-3 (well away from
urban areas, usually less than 1 ng m-3). Some major road routes are visible in the
map; like lead, nickel is found in suspended road dust. There are also some small
areas with higher concentrations due to industrial activity. One monitoring site (in
Swansea Urban Area) reported an annual mean higher than the target value of 20
ng m-3 in 2015 but this is not captured in this background modelling.

86
Figure 5-34 Annual mean background Lead concentration,
2015 (µg m-3)
Figure 5-35 Annual mean background Arsenic
concentration, 2015 (ng m-3)

87
Figure 5-36 Annual mean background Cadmium
concentration, 2015 (ng m-3)
Figure 5-37 Annual mean background Nickel concentration,
2015 (ng m-3)

88
5.9.2 Lead: Changes Over Time
Figure 5-38 shows a time series of annual mean concentration of Pb in the PM10
particulate fraction, as measured from 2004 by urban sites in the UK Metals Network
and its predecessors, as described in Section 3.3.2. (Prior to 2004, Pb in the
particulate phase was measured by the six sites comprising the former Multi-Element
Network. For further information on this, please see earlier reports in this series.
However please note that the sampling method used by the Multi-Element Network
was not size-selective).
The annual mean of all urban sites in the UK Metals Network is shown: rural sites
are not included. In 2015 there were 16 urban sites. The mean for all sites is well
below the Air Quality Directive limit value for annual mean Pb, of 500 ng m-3.
Figure 5-38 also shows NAEI estimated total annual UK emissions of this metal
(plotted as a dotted line, against the right-hand y-axis). Measured ambient
concentrations follow the same pattern, generally decreasing (though there is some
year-to-year variation) until around 2012 when there appears to be some levelling off
of the downward slope.
Figure 5-38 Ambient Urban Concentrations of Pb in PM10, and Total Estimated
UK Emissions
0
0.02
0.04
0.06
0.08
0.1
0.12
0.14
0
5
10
15
20
25
30
2004 2005 2006 2007 2008 2009 2010 2011 2012 2013 2014 2015
Tota
l UK
an
nu
al e
mis
sio
n o
f Pb
, kt
An
nu
al M
ean
Pb
, ng
m-3
Mean Urban Pb
Pb, UK emissions (kt, from NAEI)
Note: concentrations (in ng m-3) are shown as solid lines plotted against the primary axis, emissions (in kt) are shown by the dotted line plotted against the secondary axis.

89
5.9.3 Arsenic: Changes Over Time
Figure 5-39 shows a time series of annual mean concentrations of arsenic (As) in
the PM10 fraction, as measured by the urban sites in UK Metals Network and its
predecessors, described in Section 3.3.2. (For earlier, non-size selective
measurements by the smaller Multi-Element Network, please see previous reports in
this series.) The annual mean of all urban sites (of which there were 16 in 2015) is
shown – rural sites are not included. This parameter is well within the Fourth
Daughter Directive target value of 6 ng m-3.
Also shown is the UK’s estimated total annual emission of As (from the NAEI), in
kilotonnes. This is plotted as a dotted line, against the right-hand y-axis. There
appears to have been a slight increase in As emissions in 2012 and 2013, which
may be reflected in measured ambient concentrations.
Figure 5-39 Ambient Urban Concentrations of As in PM10, and Total Estimated
UK Emissions
5.9.4 Cadmium: Changes Over Time
Figure 5-40 shows a time series of annual mean concentration of cadmium (Cd) in
the PM10 fraction as measured by the UK Metals Network and its predecessors,
described in Section 3.3.2. (For earlier, non-size selective measurements from the
0
0.002
0.004
0.006
0.008
0.01
0.012
0.014
0.016
0.018
0.02
0
0.2
0.4
0.6
0.8
1
1.2
1.4
1.6
1.8
2004 2005 2006 2007 2008 2009 2010 2011 2012 2013 2014 2015
Tota
l UK
an
nu
al e
mis
sio
n o
f As,
kt
An
nu
al M
ean
As,
ng
m-3 Mean Urban As
As, UK Emissions (kt, from NAEI)
Note: concentrations (in ng m-3) are shown as solid lines plotted against the primary axis, emissions (in kt) are shown by the dotted line plotted against the secondary axis.

90
Multi-Element Network, please see previous reports in this series.) The annual mean
of all 16 urban sites only is shown.
Figure 5-40 Ambient Urban Concentrations of Cd in PM10, and Total Estimated
UK Emissions
Also shown (plotted as a dotted line, against the right-hand y-axis) is the UK’s
estimated total annual emission of Cd (in kilotonnes), from the NAEI. The variation in
emissions appears to be reflected in the variation in measured ambient
concentrations from year to year. In 2011, there was an increase in both the
estimated total emission and in the average ambient Cd concentration. The ambient
concentration also shows an even larger peak in 2014: although the emission
estimates for that year do show some increase, it does not appear to be large
enough to be consistent with the peak in ambient Cd.
However, despite the 2014 peak, ambient cadmium concentrations are very low, and
well within the Fourth Daughter Directive target value of 5 ng m-3 at all sites.
5.9.5 Nickel: Changes Over Time
Figure 5-41 shows a time series of annual mean concentrations of nickel (Ni) in
PM10, as measured by urban sites in the UK Metals Network (15 such sites in 2015).
As with the other metals, information on non-size selective measurements from the
older Multi-Element Network can be found in previous reports in this series.
0
0.0005
0.001
0.0015
0.002
0.0025
0.003
0.0035
0.004
0.0045
0.0
0.1
0.2
0.3
0.4
0.5
0.6
0.7
0.8
2004 2005 2006 2007 2008 2009 2010 2011 2012 2013 2014 2015
Tota
l UK
an
nu
al e
mis
sio
n o
f Cd
, kt
An
nu
al M
ean
Cd
, ng
m-3
Mean Urban Cd
Cd, UK emissions (kt, from NAEI)
Note: concentrations (in ng m-3) are shown as solid lines plotted against the primary axis, emissions (in kt) are shown by the dotted line plotted against the secondary axis.

91
Figure 5-41 Ambient Urban Concentrations of Ni in PM10, and Total Estimated
UK Emissions
The graph is based on the average annual mean for all urban sites measuring Ni,
except one. Pontardawe Tawe Terrace (which began operation in 2011) has been
excluded, as it measures ambient nickel concentrations very much higher than the
other sites, and if included will dominate the mean for years 2011 onwards. (This site
has measured exceedances of the Fourth Daughter Directive target value of 20 ng
m-3 each year since it started up, in 2011.) Pontardawe Tawe Terrace was the
source of the measured exceedance in the Swansea Urban Area, highlighted in
Table 4-7: the measured annual mean Ni concentration at this site was 28 ng m-3.
There was also a modelled exceedance reported for the South Wales zone.
Figure 5-41 also shows total estimated annual UK emissions of Ni, from the NAEI
(as a dotted line, plotted against the right-hand axis). The average measured
ambient concentrations appear to generally reflect the year to year variation in
estimated total emissions, though 2014 and 2015 show a substantial increase in the
measured average.
5.9.6 Mercury: Changes Over Time
At the end of 2013, the UK Metals Network ceased measurement of mercury in PM10
particulate matter at all sites. This decision was taken because the majority of
0
0.02
0.04
0.06
0.08
0.1
0.12
0.14
0
1
2
3
4
5
6
2004 2005 2006 2007 2008 2009 2010 2011 2012 2013 2014 2015
Tota
l UK
an
nu
al e
mis
sio
n o
f Ni,
kt
An
nu
al M
ean
Ni,
ng
m-3
Mean Urban Ni, excluding Pontardawe TaweTerrace
Ni, UK emissions (kt, from NAEI)
Note: concentrations (in ng m-3) are shown as solid lines plotted against the primary axis, emissions (in kt) are shown by the dotted line plotted against the secondary axis.

92
ambient Hg is in the vapour phase. Monitoring of Total Gaseous Mercury (TGM) was
also scaled down, continuing at just two of the original sites: Runcorn Weston Point
and London Westminster. Runcorn Weston Point is near an industrial installation (a
chlor-alkali plant) that used mercury in the past, and measures ambient Hg
concentrations an order of magnitude greater than any other sites in the network.
London Westminster is an urban background site in central London. Mercury in the
vapour phase was also measured during 2015 using the Tekran instrument (see
section 3) at two rural sites: Harwell in Oxfordshire and Auchencorth Moss in
Lothian.
Measurement of TGM therefore continued at four sites: two where it is likely to be
highest (Runcorn Weston Point and London Westminster) and two rural background
sites (Harwell and Auchencorth Moss), for the purpose of understanding
transboundary contribution to ambient Hg concentration.
For information on the measurements of total mercury (TGM plus particulate phase)
taken at urban sites in the UK Metals Network and its predecessors from 2004 to
2013, please refer to “Air Pollution in the UK 2014” and earlier reports in this series.
The present report, and future reports in this series, will focus only on TGM, and on
the four sites which have continued monitoring this element through 2015 and
beyond: Auchencorth Moss, Harwell, London Westminster and Runcorn Weston
Point. (Harwell closed at the end of 2015 and the monitoring station was relocated to
Chilbolton Observatory in Hampshire.)
Figure 5-42 shows annual mean concentrations of TGM at the four monitoring sites,
from 2004 (when the UK Metals Network began operation) to 2015. It can clearly be
seen that the measured annual mean concentrations of Hg at Runcorn Weston Point
are an order of magnitude higher than those measured at the two rural sites.
However, Hg concentrations at this industrial site appear to have decreased over the
past 10 years (though not consistently or steadily). Mercury concentrations at
London Westminster do not appear to have decreased: by contrast, they have been
slightly higher in recent years than they were a decade ago. Neither of the two rural
sites show any consistent pattern of increase or decrease.

93
Figure 5-42 Measured Urban Concentrations of Total Gaseous Hg, and Total
Estimated UK Emissions
5.10 Benzo [a] Pyrene
5.10.1 B[a]P: Spatial Distribution
Figure 5-43 shows the modelled annual mean background concentration of B[a]P.
The areas of highest concentration reflect the distribution of industrial sources, and
also areas where there is widespread domestic use of oil and solid fuels for heating.
This has previously included the Belfast area and other urban parts of Northern
Ireland: also parts of Yorkshire, Humberside and South Wales.
However, these areas have reduced in recent years, and the 2015 map indicates
further reductions. The areas with modelled annual mean concentrations greater
than 0.2 ng m-3 have been greatly reduced since 2014, and for the second
consecutive year there are no longer any areas in Northern Ireland with modelled
annual mean B[a]P concentrations in excess of 1 ng m-3.
0
0.001
0.002
0.003
0.004
0.005
0.006
0.007
0.008
0
5
10
15
20
25
30
35
40
45
2004 2005 2006 2007 2008 2009 2010 2011 2012 2013 2014 2015
Tota
l UK
an
nu
al e
mis
sio
n o
f H
g, k
t
An
nu
al M
ean
Hg,
ng
m-3
Runcorn Weston Point TGM
London Westminster TGM
Auchencorth Moss (elemental Hg)
Harwell TGM
Hg, UK Emissions (kt, from NAEI)
Note: Concentrations (in ng m-3) are shown as solid lines with markers, plotted against the primary axis, emissions (in kt) are shown by the dotted line plotted against the secondary axis.

94
Figure 5-43 Annual mean background B[a]P concentration, 2015 (ng m-3)
5.10.2 B[a]P: Changes Over Time
The PAH monitoring network began operation in 1991, comprising a small number of
sites, and was increased to over 20 in the late 1990s. However, during the years
2007-2008, the network underwent a further major expansion and re-organisation,
including a change of sampling technique.
The newer sampling technique used at most sites from 2008 onwards (the “Digitel”
PM10 sampler) has been found to give higher results than the older method. The
reason for this is likely to be due to a number of factors, predominantly the fact that
the new samplers have a shorter collection period. The shorter collection period is
likely to decrease the degradation of the PAHs by ozone or other oxidative species56.
Because of these changes in the composition of the network, and in particular the
techniques used, temporal variation in PAH concentrations has only been analysed
from 2008 in this report.
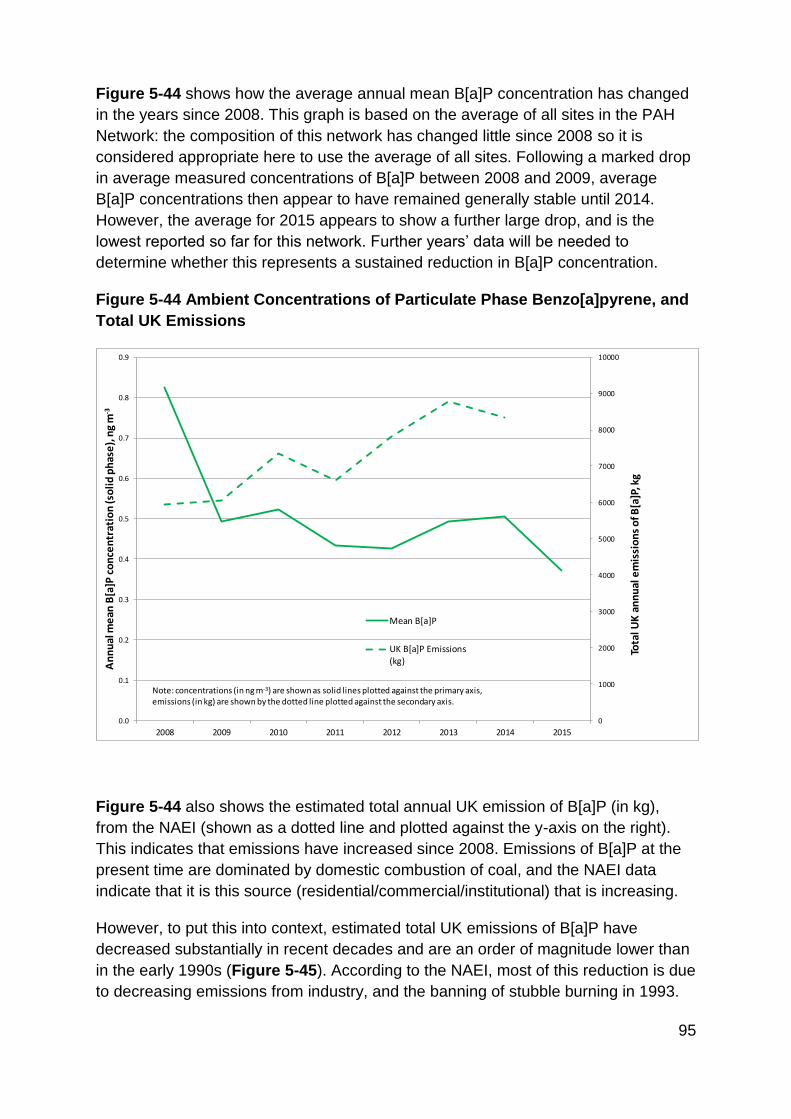
95
Figure 5-44 shows how the average annual mean B[a]P concentration has changed
in the years since 2008. This graph is based on the average of all sites in the PAH
Network: the composition of this network has changed little since 2008 so it is
considered appropriate here to use the average of all sites. Following a marked drop
in average measured concentrations of B[a]P between 2008 and 2009, average
B[a]P concentrations then appear to have remained generally stable until 2014.
However, the average for 2015 appears to show a further large drop, and is the
lowest reported so far for this network. Further years’ data will be needed to
determine whether this represents a sustained reduction in B[a]P concentration.
Figure 5-44 Ambient Concentrations of Particulate Phase Benzo[a]pyrene, and
Total UK Emissions
Figure 5-44 also shows the estimated total annual UK emission of B[a]P (in kg),
from the NAEI (shown as a dotted line and plotted against the y-axis on the right).
This indicates that emissions have increased since 2008. Emissions of B[a]P at the
present time are dominated by domestic combustion of coal, and the NAEI data
indicate that it is this source (residential/commercial/institutional) that is increasing.
However, to put this into context, estimated total UK emissions of B[a]P have
decreased substantially in recent decades and are an order of magnitude lower than
in the early 1990s (Figure 5-45). According to the NAEI, most of this reduction is due
to decreasing emissions from industry, and the banning of stubble burning in 1993.
0
1000
2000
3000
4000
5000
6000
7000
8000
9000
10000
0.0
0.1
0.2
0.3
0.4
0.5
0.6
0.7
0.8
0.9
2008 2009 2010 2011 2012 2013 2014 2015
Tota
l UK
an
nu
al e
mis
sio
ns
of B
[a]P
, kg
An
nu
al m
ean
B[a
]P c
on
cen
trat
ion
(so
lid
ph
ase
), n
g m
-3
Mean B[a]P
UK B[a]P Emissions(kg)
Note: concentrations (in ng m-3) are shown as solid lines plotted against the primary axis, emissions (in kg) are shown by the dotted line plotted against the secondary axis.

96
Figure 5-45 Estimated Annual UK Emissions of Benzo[a]Pyrene (kg), 1992 –
2014 Source: NAEI

97
6 Pollution Events in 2015
6.1 Spring Particulate Pollution Episodes
Particulate pollution episodes are common during spring in the UK. In 2015, there
were two spring particulate episodes; the first during mid- to late March and the
second in early April.
6.1.1 Mid to late March 2015
Between 16th until 20th March 2015, there was widespread poor air quality measured
by the Automatic Urban and Rural Monitoring Network (AURN) throughout the UK.
This affected the south-east of England most severely, but also spread throughout
the rest of England and South Wales, as shown in Figure 6-1.
Figure 6-1 Maps showing the Daily Air Quality Index (DAQI) between 15th and
21st March 2015 (Source: UK-AIR)
Between Tuesday 17th and Friday 20th March, a high pressure system centred over
Scandinavia resulted in settled conditions throughout south-east England along with
light easterly to south-easterly winds. Consequently, air arriving from the north of
continental Europe mixed with local emissions to produce a widespread particulate
episode across the south of England and Wales (London Air57). Using air mass

98
tracking techniques, it is possible to model the paths taken by air masses arriving
over the UK at a particular time; these are known as ‘back trajectories’ and are
shown on a map. Figure 6-2 shows 96-hour back trajectories for 20th March when
the path of air arriving in the UK can clearly be tracked back to the north of
continental Europe. The data for Figure 6-2 are sourced from the NOAA website;
http://ready.arl.noaa.gov/HYSPLIT.php .
Figure 6-2 Back trajectories showing air masses arriving in the UK on 20th
March 2015
The peak of this pollution event was the first day, Tuesday 17th March; this is evident
in Figure 6-1 (which shows that the highest DAQI value occurred on this day), also
Figure 6-3 and Figure 6-4, which show peaks on 17th March. On 19th March, a
change in wind direction, bringing ‘cleaner’ air from over the North Sea, combined
with slightly increased wind speeds, weakening and dispersing the episode.

99
Figure 6-3 Daily Mean PM10 Concentrations in the UK between 12th March and
26th March 2015
Figure 6-4 Hourly Mean PM2.5 Concentrations in the UK between 12th March
and 26th March 2015

100
6.1.2 Early April 2015
A particulate pollution episode was also measured by the AURN during early April
2015, specifically between the 8th and 11th April. Pollution levels reached ‘moderate’
throughout the UK, with some areas, specifically Yorkshire & Humberside and
Eastern England, reaching ‘High’ levels of pollution (Figure 6-5). This episode was
cause by a high pressure system over southern England and the northern part of
continental Europe, on the 8th and 9th April, which resulted in low wind speeds and
led to the accumulation of pollutants. By 11th April, pollution began to clear with a
change to cooler conditions and stronger south-westerly winds.
Figure 6-5 Maps showing the Daily Air Quality Index (DAQI) between 7th and
12th April 2015 (Source: UK-AIR) (See Figure 6-1 for Index Bands)
6.2 Summer Ozone Events
Air pollution episodes due to ozone commonly occur in the UK during late spring and
summer. In 2015, such ozone pollution episodes occurred from the end of June to
beginning of July, and at the beginning of August.
6.2.1 Late June / Early July 2015
Elevated ozone levels were measured by the AURN between the 30th June and the
2nd July 2015 (Figure 6-6). This ozone episode was caused by a combination of
strong sunshine which lasted throughout the day, high ambient temperatures, and air
arriving in the UK from continental Europe; this air had passed over industrialised
areas and therefore contained the ‘precursor pollutants’ required for the
photochemical reaction to produce ozone.

101
Figure 6-6 Ozone daily max 8-hour running mean concentrations from 26th
June to 6th July 2015
This event proved interesting and unusual in that ozone levels at many sites peaked
during the mid-evening (Figure 6-7); this is unusual as at this time of the day
temperatures and solar radiation are decreasing, so the reaction to produce ozone
would usually be slowing.

102
Figure 6-7 Ozone concentration variation throughout the day from 30th June to
2nd July 2015
6.2.2 Early August 2015
A similar ozone event occurred, predominantly in London, around 2nd August. This
was caused again by warm temperatures and high solar radiation. The episode
subsided on 3rd August as air from the Atlantic increased cloud cover and therefore
conditions for producing ozone became less favourable.
An animation of this event, based on monitoring data in London during the episode
on August 2nd 2015, is available here: https://vimeo.com/135335742 (Source:
London Air58)
6.3 Bonfire Night Particulate Pollution
Bonfire Night can often produce a significant short term particulate pollution episode
as a result of bonfires and firework displays. These pollution episodes critically
depend on weather conditions, and whether Bonfire Night falls on a weekday or a
weekend. Therefore, they vary significantly from year to year. Wet, windy or
unsettled conditions are more likely to result in low concentrations; cold and still
weather are more likely to result in elevated levels of PM10 particles and other
pollutants as emissions are not effectively dispersed. In recent years, Bonfire Night

103
particulate episodes have been noticeable but small (the exception being 2014,
when the UK had its most significant Bonfire Night episode since 2006). The 2015
Bonfire Night particulate episode was again noticeable but small (Figure 6-8 and
Figure 6-9). Much of the UK experienced rain on 5th November which meant that
conditions were good for dispersing emissions, and hence concentrations were kept
low.
Figure 6-8 Hourly PM10 concentrations in the UK between 1st and 9th November
2015

104
Figure 6-9 Hourly PM2.5 concentrations in the UK between 1st and 9th November
2015
6.4 Winter Saharan Dust Episodes
6.4.1 Mid-December 2015 The UK experienced ‘moderate’ levels of particulate pollution on 17th December 2015 (Figure 6-10). This was attributed to a dust storm that travelled to the UK from the Sahara. Using air mass tracking techniques to track the paths of air masses, it is likely that air arriving in the UK on 17th December came from the African continent (Figure 6-11, which shows 24-hour back trajectories for 17th December 2015 using data sourced from the NOAA website).

105
Figure 6-10 Hourly PM10 concentrations in the UK between 15th and 29th
December 2015

106
Figure 6-11 Back trajectories showing air masses arriving in the UK on 17th
December 2015
6.4.2 Late December 2015
Between Christmas and New Year, air pollution is usually lower than normal due to
there being less traffic on the roads; however, in recent years, there have been
pollution problems during this period due to increased domestic wood burning in
open fires. On 27th December 2015, this pattern was observed, with a peak in PM10
concentrations (clearly visible in Figure 6-10), for several reasons. Analysis of
particle size and composition of air measured in London (by King’s College London,
the managers of the London Air Quality Network) showed it was not dominated by
pollution from London nor from European traffic or industrial sources. The analysis
suggested that the episode was “most likely due to an influx in Saharan dust”, similar
to the mid-December episode, but with additional pollution from local wood burning59.
107
7 Where to Find Out More
Defra’s web pages relating to air quality can be found at
https://www.gov.uk/government/policies/protecting-and-enhancing-our-urban-and-
natural-environment-to-improve-public-health-and-wellbeing/supporting-
pages/international-european-and-national-standards-for-air-quality
These provide details of what the UK is doing to tackle air pollution, and the science
and research programmes in place.
Also, Defra has published a Guide to Air Pollution Information Resources, detailing
the types of information that are made available and this can be found at http://uk-
air.defra.gov.uk/reports/cat14/1307241318_Guide_to_UK_Air_Pollution_Information
_Resources.pdf.
Information on the UK’s air quality, now and in the past, is available on UK-AIR, the
Defra online air quality resource at http://uk-air.defra.gov.uk/. UK-AIR is the national
repository for historical ambient air quality data. It contains measurements from
automatic measurement programmes, some dating back to 1972, together with non-
automatic sampler measurements dating back to the 1960s. The data archive brings
together into one coherent database both data and information from all the UK’s
measurement networks. New tools recently added to UK-AIR include the UK
Ambient Air Quality Interactive Map at http://uk-air.defra.gov.uk/data/gis-mapping
that allows you to look at outputs for the national modelling conducted for
compliance assessment, based on pollutant, background or roadside and
geographical location.
Similar national online air quality resources have also been developed for Scotland,
Wales and Northern Ireland:
The Welsh Air Quality Archive at www.welshairquality.co.uk
The Scottish Air Quality Archive at www.scottishairquality.co.uk
The Northern Ireland Archive at www.airqualityni.co.uk
Together, these four national websites provide a comprehensive resource for data
and analyses covering all aspects of air quality throughout the UK and all its regions.
The Devolved Administrations each produce their own short annual report, providing
more specific information on air quality in their regions. These reports are available
from the above websites.
UK-AIR also provides a daily air quality forecast, which is further disseminated via e-
mail, RSS feeds and Twitter (see http://uk-air.defra.gov.uk/twitter). Latest forecasts
are issued daily, at http://uk-air.defra.gov.uk/forecasting/.

108
Detailed pollutant emission data for the UK are available from the National
Atmospheric Emissions Inventory (NAEI) at www.naei.org.uk.
Additional information from the Devolved Administrations of Scotland, Wales and
Northern Ireland can be found at:
The Scottish Government Air Quality web page at
http://www.scotland.gov.uk/Topics/Environment/waste-and-
pollution/Pollution-1/16215
The Welsh Government Environment Air Quality web page at
http://gov.wales/topics/environmentcountryside/epq/airqualitypollution/airq
uality/?lang=en
The Northern Ireland Department of Agriculture, Environment and Rural
Affairs (DAERA) web page at https://www.daera-ni.gov.uk/

109
References
Section 1
1 European Parliament and Council of the European Union (2008) ‘Council Directive on ambient air quality and cleaner air for Europe (2008/50/EC)’. [online]. Available at http://eur-lex.europa.eu/LexUriServ/LexUriServ.do?uri=CELEX:32008L0050:EN:NOT (Accessed 05 Sep 2016). 2 European Parliament and Council of the European Union (2004) ‘Directive 2004/107/EC of the European Parliament and of the Council of 15 December 2004 relating to arsenic, cadmium, mercury, nickel and polycyclic aromatic hydrocarbons in ambient air’. [online]. Available at http://eur-lex.europa.eu/LexUriServ/LexUriServ.do?uri=CELEX:32004L0107:EN:NOT, (Accessed 05 Sep 2016). Section 2 3 UK Government ‘UK Air Quality Standards Regulations 2010’. [online]. Available at http://www.legislation.gov.uk/uksi/2010/1001/contents/made (Accessed 05 Sep 2016). 4 Scottish Government ‘The Air Quality Standards (Scotland) Regulations (2010)’. [online]. Available at http://www.legislation.gov.uk/ssi/2010/204/made . (Accessed 05 Sep 2016). 5 Welsh Government ‘The Air Quality Standards (Wales) Regulations 2010’ [online]. Available at http://www.legislation.gov.uk/wsi/2010/1433/contents/made (Accessed 05 Sep 2016). 6 Department of Environment, Northern Ireland ‘The Air Quality Standards Regulations (Northern Ireland) 2010’. [online]. Available at http://www.legislation.gov.uk/nisr/2010/188/contents/made (Accessed 05 Sep 2016). 7 European Parliament and Council of the European Union (2011) ‘Commission Implementing Decision of 12 December 2011 laying down rules for Directives 2004/107/EC and 2008/50/EC of the European Parliament and of the Council as regards the reciprocal exchange of information and reporting on ambient air quality (2011/850/EU)’ [online]. Available at http://eur-lex.europa.eu/LexUriServ/LexUriServ.do?uri=OJ:L:2011:335:0086:0106:EN:PDF (Accessed 05 Sep 2016). 8 European Parliament and Council of the European Union (1997) ‘Council Decision of 27 January 1997 establishing a reciprocal exchange of information and data from networks and individual stations measuring ambient air pollution within the Member States (97/101/EC)’ [online]. Available at http://eur-

110
lex.europa.eu/LexUriServ/LexUriServ.do?uri=OJ:L:1997:035:0014:0022:EN:PDF (Accessed 05 Sep 2016). 9 European Parliament and Council of the European Union (2001) ‘Directive 2001/81/EC of the European Parliament and of the Council of 23 October 2001on national emission ceilings for certain atmospheric pollutants.’ [online]. Available at http://eur-lex.europa.eu/LexUriServ/LexUriServ.do?uri=OJ:L:2001:309:0022:0030:EN:PDF (Accessed 05 Sep 2016). 10 Committee on the Medical Effects of Exposure to Air Pollutants (2010) ‘The Mortality Effects of Long-Term Exposure to Particulate Air Pollution in the United Kingdom’ [online]. Available at https://www.gov.uk/government/publications/comeap-mortality-effects-of-long-term-exposure-to-particulate-air-pollution-in-the-uk . (Accessed 05 Sep 2016). 11 Committee on the Medical Effects of Exposure to Air Pollutants (1998) ‘Quantification of the Effects of Air Pollution on Health in the United Kingdom’ [online]. Available (Archived) at http://webarchive.nationalarchives.gov.uk/20130107105354/http://www.dh.gov.uk/prod_consum_dh/groups/dh_digitalassets/@dh/@ab/documents/digitalasset/dh_118120.pdf . (Accessed 05 Sep 2016). 12 The Committee on the Medical Effects of Air Pollutants (COMEAP), (2015) ‘Statement on the Evidence for the Effects of Nitrogen Dioxide on Health’ [online]. Available at https://www.gov.uk/government/publications/nitrogen-dioxide-health-effects-of-exposure. (Accessed 05 Sep 2016). 13 Committee on the Medical Effects of Exposure to Air Pollutants (2009) The Mortality Effects of Long-Term Exposure to Particulate Air Pollution in the United Kingdom Available at https://www.gov.uk/government/uploads/system/uploads/attachment_data/file/304641/COMEAP_mortality_effects_of_long_term_exposure.pdf (Accessed 26 Sep 2016).
14 Department for Environment, Food and Rural Affairs in partnership with the
Scottish Executive, Welsh Assembly Government and Department of the
Environment Northern Ireland. ‘The Air Quality Strategy for England, Scotland,
Wales and Northern Ireland (Volume 1)’, July 2007. [online]. Available at
https://www.gov.uk/government/publications/the-air-quality-strategy-for-england-
scotland-wales-and-northern-ireland-volume-1 . (Accessed 05 Sep 2016).
15 Department for Environment, Food and Rural Affairs. ‘National Air Quality
Objectives and European Directive Limit and Target Values for the Protection of
Human Health’. [online]. Available at http://uk-
air.defra.gov.uk/documents/National_air_quality_objectives.pdf (Accessed 05 Sep
2016).

111
16 Department for Environment, Food and Rural Affairs, 2016, ‘Air Quality Statistics’ [online]. Available at https://www.gov.uk/government/publications/air-quality-statistics (Accessed 26 Aug 2016). 17 Department for Environment, Food and Rural Affairs, 2016 [online]. Available at https://www.gov.uk/government/uploads/system/uploads/attachment_data/file/547759/ENEI_16_final.pdf (Accessed 26 Aug 2016). 18 Department of Health, 2012 ‘Improving outcomes and supporting transparency Part 2: Summary technical specifications of public health indicators, updated November 2013’. Available at https://www.gov.uk/government/uploads/system/uploads/attachment_data/file/382115/PHOF_Part_2_Technical_Specifications_Autumn_2014_refresh_02.12.2014_FINAL.pdf (Accessed 05 Sep 2016). 19 The Committee on the Medical Effects of Air Pollutants (COMEAP), (2011), ‘Review of the UK Air Quality Index’. ISBN 978-0-85951-699-0 [online]. Available at http://webarchive.nationalarchives.gov.uk/20140505104700/http://comeap.org.uk/images/stories/Documents/Reports/comeap%20review%20of%20the%20uk%20air%20quality%20index.pdf . (Accessed 05 Sep 2016). 20 Department for Environment, Food and Rural Affairs (2014) ‘Air Pollution in the UK 2013’ [online]. Available at https://uk-air.defra.gov.uk/library/annualreport/viewonline?year=2013_issue_1 (Accessed 13 Sep 2016) 21 The Environment (Northern Ireland) Order 2002 (Amendment) Regulations (Northern Ireland) 2010. Available at http://www.legislation.gov.uk/nisr/2010/92/contents/made (05 Sep 2016).
22 The Air Quality (England) Regulations 2000. (SI 2000 No.928). Available at
http://www.legislation.gov.uk/uksi/2000/928/introduction/made (Accessed 05 Sep
2016).
23 The Air Quality (Scotland) Regulations 2000. (SI 2000 No. 97). Available at http://www.legislation.gov.uk/ssi/2000/97/contents/made (Accessed 05 Sep 2016). 24 The Air Quality (Wales) Regulations 2000. (SI No. 1940 W. 138). Available at http://www.legislation.gov.uk/wsi/2000/1940/contents/made (Accessed 05 Sep 2016). 25 The Air Quality Regulations (Northern Ireland) 2003 (SI No. 342) Available at http://www.legislation.gov.uk/nisr/2003/342/contents/made (Accessed 05 Sep 2016). 26 The Air Quality (England) (Amendment) Regulations 2002 (SI No. 3043). Available at http://www.legislation.gov.uk/uksi/2002/3043/contents/made (Accessed 05 Sep 2016).

112
27 The Air Quality (Amendment) (Wales) Regulations 2002 (SI No. 3182 W. 298). Available at http://www.legislation.gov.uk/wsi/2002/3182/contents/made (Accessed 05 Sep 2016).
28 The Environment (Northern Ireland) Order 2002 (SI No. 3153 (N.I. 7) Available at
http://www.legislation.gov.uk/nisi/2002/3153/contents (Accessed 05 Sep 2016).
29 The Air Quality (Scotland) Amendment Regulations 2002. (SI No. 297) Available at
http://www.legislation.gov.uk/ssi/2002/297/contents/made (Accessed 05 Sep 2016).
Section 3
30 National Atmospheric Emissions Inventory (2014), ‘Pollutant Information’ Available at http://naei.defra.gov.uk/overview/pollutants (Accessed 05 Sep 2016). 31 Department for Environment, Food and Rural Affairs in partnership with the Scottish Executive, Welsh Assembly Government and Department of the Environment Northern Ireland (2007) ‘The Air Quality Strategy for England, Scotland, Wales and Northern Ireland’ Available at https://www.gov.uk/government/uploads/system/uploads/attachment_data/file/69336/pb12654-air-quality-strategy-vol1-070712.pdf (Accessed 05 Sep 2016). 32World Health Organization (2005) ‘Air quality guidelines. Global update 2005. Particulate matter, ozone, nitrogen dioxide and sulfur dioxide’ (ISBN 92 890 2192 6). Available at http://www.euro.who.int/en/what-we-do/health-topics/environment-and-health/air-quality/publications/pre2009/air-quality-guidelines.-global-update-2005.-particulate-matter,-ozone,-nitrogen-dioxide-and-sulfur-dioxide . (Accessed 05 Sep 2016). 33 The Committee on the Medical Effects of Air Pollutants (COMEAP), (2015) ‘Statement on the Evidence for the Effects of Nitrogen Dioxide on Health’ [online]. Available at https://www.gov.uk/government/publications/nitrogen-dioxide-health-effects-of-exposure. (Accessed 05 Sep 2016). 34 The Committee on the Medical Effects of Air Pollutants (COMEAP), (2011) ‘Review of the UK air quality Index’ (ISBN 978-0-85951-699-0). Available at https://www.gov.uk/government/publications/comeap-review-of-the-uk-air-quality-index (Accessed 04 Aug 2016) 35 The Committee on the Medical Effects of Air Pollutants (COMEAP), (2009) ‘Long-Term Exposure to Air Pollution: Effect on Mortality’ (ISBN 978-0-85951-640-2). Available at https://www.gov.uk/government/publications/comeap-long-term-exposure-to-air-pollution-effect-on-mortality (Accessed 05 Sep 2016). 36 The Committee on the Medical Effects of Air Pollutants (COMEAP), (2010) ‘The Mortality Effects of Long-Term Exposure to Particulate Air Pollution in the United

113
Kingdom’ (ISBN 978-0-85951-685-3) Available at https://www.gov.uk/government/uploads/system/uploads/attachment_data/file/304641/COMEAP_mortality_effects_of_long_term_exposure.pdf . (Accessed 05 Sep 2016). 37 The Committee on the Medical Effects of Air Pollutants (COMEAP), (2015) ‘Quantification of Mortality and Hospital Admissions Associated with Ground-Level Ozone’ (ISBN 978-0-85951-776-8). Available at https://www.gov.uk/government/publications/comeap-quantification-of-mortality-and-hospital-admissions-associated-with-ground-level-ozone (Accessed 05 Sep 2016). 38 Defra and the Devolved Administrations’ Expert Panel on Air Quality Standards (2009) ‘Metals and Metalloids’. Available at http://webarchive.nationalarchives.gov.uk/20130402151656/http://archive.defra.gov.uk/environment/quality/air/airquality/panels/aqs/documents/metals-and-metalloids.pdf (Accessed 05 Sep 2016). 39 World Health Organization (2013) ‘Review of Evidence on Health Aspects of Air Pollution – REVIHAAP Project’ Available at http://www.euro.who.int/__data/assets/pdf_file/0004/193108/REVIHAAP-Final-technical-report-final-version.pdf , (Accessed 05 Sep 2016).
40 Carslaw, D., Beevers, S. Westmoreland, E. Williams, M. Tate, J. Murrells, T.
Stedman, J. Li, Y., Grice, S., Kent, A. and I. Tsagatakis (2011). ‘Trends in NOx and
NO2 emissions and ambient measurements in the UK. Version: 18th July 2011’.
[online]. Available at https://uk-
air.defra.gov.uk/assets/documents/reports/cat05/1108251149_110718_AQ0724_Fin
al_report.pdf (Accessed 05 Sep 2016).
41 CEN ‘EN 14625:2005 Ambient air quality – standard method for the measurement
of the concentration of ozone by ultraviolet photometry’. 2005
42 CEN ‘EN 14211:2005 Ambient air quality - Standard method for the measurement
of the concentration of nitrogen dioxide and nitrogen monoxide by
Chemiluminescence’. 2005
43 CEN ‘EN 14212:2005 Ambient air quality – Standard method for the measurement
of the concentration of sulphur dioxide by UV fluorescence’. 2005
44 CEN ‘EN 14626:2005 Ambient air quality - Standard method for the measurement
of the concentration of carbon monoxide by non-dispersive infrared spectroscopy’.
2005
https://uk-air.defra.gov.uk/assets/documents/reports/cat05/1108251149_110718_AQ0724_Final_report.pdf
114
45 CEN ‘EN 12341:1999 Air quality. Determination of the PM10 fraction of suspended
particulate matter. Reference method and field test procedure to demonstrate
reference equivalence of measurement methods’. 1999
46 CEN ‘EN 14907:2005 Ambient air quality - Standard gravimetric measurement
method for the determination of the PM2.5 mass fraction of suspended particulate
matter’. 2005
47 CEN ‘EN 14902:2005 Reference method for determination of Pb/Cd/As/Ni in
ambient air’. 2005
48 CEN ‘EN 14662-1:2005 Ambient air quality - Standard method for measurement of
benzene concentrations - Part 1: Pumped sampling followed by thermal desorption
and gas chromatography’. 2005
49 European Parliament and Council of the European Union (2008) ‘Council Directive on ambient air quality and cleaner air for Europe (2008/50/EC)’. [online]. Available at http://eur-lex.europa.eu/LexUriServ/LexUriServ.do?uri=CELEX:32008L0050:EN:NOT (Accessed 05 Sep 2016). 50 AEA Group (2009) ‘QA/QC Procedures for the UK Automatic Urban and Rural Air Quality Monitoring Network (AURN)’ Report number AEAT/ENV/R/2837, produced for Defra and the Devolved Administrations. Available at https://uk-air.defra.gov.uk/assets/documents/reports/cat13/0910081142_AURN_QA_QC_Manual_Sep_09_FINAL.pdf (Accessed 05 Sep 2016). 51 Brookes, D. M. et al. (2013) ‘Technical report on UK supplementary assessment under the Air Quality Directive (2008/50/EC), the Air Quality Framework Directive (96/62/EC) and Fourth Daughter Directive (2004/107/EC) for 2012’. Ricardo-AEA report number AEA/ENV/R/3380 [online]. Available at http://ukair.defra.gov.uk/assets/documents/reports/cat09/1312231525_AQD_DD4_2012mapsrepv0.pdf (Accessed 05 Sep 2016).
52 Defra UK-AIR website. Available at http://uk-air.defra.gov.uk/ (Accessed 05 Sep
2016).
53 UK National Atmospheric Emissions Inventory. Available at http://www.naei.org.uk (Accessed 05 Sep 2016). Section 4 54 Brookes, D. M. et al. (2013) “Technical report on UK supplementary assessment under the Air Quality Directive (2008/50/EC), the Air Quality Framework Directive (96/62/EC) and Fourth Daughter Directive (2004/107/EC) for 2012”. Ricardo-AEA report number AEA/ENV/R/3380, pp101-102 [online]. Available at https://uk-

115
air.defra.gov.uk/assets/documents/reports/cat09/1312231525_AQD_DD4_2012mapsrepv0.pdf (Accessed 05 Sep 2016). Section 5 55 NAEI “Pollutant Information: Carbon Monoxide” [online]. Available at http://naei.defra.gov.uk/overview/pollutants?pollutant_id=4. (Accessed 08 Aug 2016). 56 Sarantaridis, D et al (2014) “Annual Report for 2012 on the UK PAH Monitoring and Analysis Network” Report produced by NPL for Defra and the Devolved Administrations [online]. Available at http://uk-air.defra.gov.uk/assets/documents/reports/cat05/1402041506_Defra_PAH_Network_2012_annual_report_FINAL_v2.pdf (Accessed 08 Aug 2016). Section 6
57 London Air (2015a). LAQN Pollution Episodes; Pollution notification released on
24/03/2015. Available at:
https://www.londonair.org.uk/london/asp/publicepisodes.asp?species=All®ion=0&
site=&postcode=&la_id=&level=All&bulletindate=19%2F07%2F2016&MapType=Goo
gle&zoom=9&lat=51.4750&lon=-
0.119824&VenueCode=&bulletin=explanation&episodeID=PM10PM25midMarch201
5 (Accessed 05 Sep 2016).
58 London Air (2015b). Ozone August 2 2015, Vimeo Animation. Available at:
https://vimeo.com/135335742 . (Accessed 05 Sep 2016).
59 London Air (2015c). LAQN Pollution Episodes, Pollution notification released on
06/01/2016. Available at:
https://www.londonair.org.uk/london/asp/publicepisodes.asp?species=All®ion=0&
site=&postcode=&la_id=&level=All&bulletindate=19%2F07%2F2016&MapType=Goo
gle&zoom=9&lat=51.4750&lon=-
0.119824&VenueCode=&bulletin=explanation&episodeID=PM10endDec2015
(Accessed 05 Sep 2016).
Section 7 None.