Air Pollution in the UK 2011 · Greater London Urban Area UK0001 Ag West Midlands Urban Area UK0002...
24
www.defra.gov.uk Air Pollution in the UK 2011 – Compliance Assessment Summary
Transcript of Air Pollution in the UK 2011 · Greater London Urban Area UK0001 Ag West Midlands Urban Area UK0002...

www.defra.gov.uk
Air Pollution in the UK 2011 –Compliance Assessment Summary
Air Pollution in the UK 2011 – Compliance Assessment Summary
ii
A report prepared by AEA for Defra and the Devolved Administrations. Title Air Pollution in the UK 2011 – Compliance Assessment Summary
Authors AEA: Sarah Choudrie, Andrew Kent, Rebecca King, Alison Loader, Carlos Martinez, John Stedman, Paul Willis.
Defra: Emily Connolly
Published by the Department for Environment, Food and Rural Affairs, September 2012
Department for Environment, Food and Rural Affairs Nobel House 17 Smith Square London SW1P 3JR Telephone 020 7238 6000
Website: www.defra.gov.uk
© Crown copyright 2012 Copyright in the typographical arrangement and design rests with the Crown. This publication (excluding the Royal Arms and departmental logos) may be re-used free of charge in any format or medium for research for non-commercial purposes, private study or for internal
circulation within an organisation. This is subject to it being re-used accurately and not used in a misleading context. The material must be acknowledged as Crown copyright and the title of the publication specified.
For any other use of this material please apply for a Click-Use Licence for Public Sector Information (PSI) or core material at:
http://www.opsi.gov.uk/click-use/system/licenceterms/CCWPS03-00.pdf
or by writing to:
Office of Public Sector Information Information Policy Team
St Clements House 2-16 Colegate Norwich NR3 1BQ Fax: 01603 723000 Email: [email protected]

Air Pollution in the UK 2011 – Compliance Assessment Summary
iii
Executive Summary
The UK is required to report air quality data on an annual basis under the following European Directives:
The Council Directive on ambient air quality and cleaner air for Europe (2008/50/EC). The Fourth Daughter Directive 2004/107/EC under the Air Quality Framework Directive
(1996/62/EC). This document has been prepared to accompany and summarise the UK’s 2011 submission on air quality to the EU Commission, presenting a summary of the UK’s compliance with the above directives, based upon measurements from national air pollution monitoring networks and air
pollution modelling. This includes details of the exceedances reported in 2011. This document is an extract from a larger report, “Air Pollution in the UK 2011”, which, in addition to the compliance summary also provides background information on the pollutants covered by these Directives and the UK’s own Air Quality Strategy, their sources, effects, how they are
measured and modelled in the UK, and details of their spatial distribution and changes over time.
These data are produced on behalf of Defra (the Department for Environment, Food and Rural Affairs) and the Devolved Administrations of Scotland, Wales and Northern Ireland. The 2011 results can be summarised as follows:
There were no exceedances of any EU limit values for SO2.
The UK exceeded the limit value for hourly mean nitrogen dioxide in three zones (out of the total of 43).
The UK exceeded the limit value for annual mean nitrogen dioxide in 40 zones. Of these 40 zones, nine were covered by a time extension during 2011; in these cases, the
limit value plus a margin of tolerance applied. Five of the nine zones were within the margin of tolerance. Therefore, the number of zones that exceeded the limit value for annual mean NO2, plus margin of tolerance where applicable, was 35.
One zone (Greater London Urban Area) exceeded the daily limit value for PM10 during the year, after subtraction of the contribution from natural sources. A time extension has been
granted in respect of this zone and limit value and a margin of tolerance is in force. The limit value plus margin of tolerance was not exceeded in 2011.
All zones met the limit value for annual mean concentration of PM10 particulate matter. All zones met the target value for annual mean concentration of PM2.5 particulate matter,
and the Stage 1 limit value, which comes into force in 2015. After subtraction of the natural contribution, two zones did not meet the Stage 2 limit value which must be met by 2020.
Exceedances were reported for the long term ozone objective for human health in all 43 zones, and exceedances were reported for the long term ozone objective for vegetation in three zones.
Two zones exceeded the target value for nickel in 2011, as was the case in years 2008 to
2010. Seven zones exceeded the target value for benzo[a]pyrene in 2011 (compared with eight
in 2010). Copies of previous annual submissions can be found on the Commission website: http://cdr.eionet.europa.eu/gb/eu/annualair. For more information on air quality in the UK visit
the Defra website at www.defra.gov.uk/environment/quality/air/index.htm and the UK Air Quality
websites at http://uk-air.defra.gov.uk, www.scottishairquality.co.uk, www.welshairquality.co.uk and www.airqualityni.co.uk.

Air Pollution in the UK 2011 – Compliance Assessment Summary
iv
Table of contents
1 Introduction ............................................................................ 1
2 Definition of Zones .................................................................. 2
3 Air Quality Assessment for 2011 ............................................. 4
3.1 Directive 2008/50/EC on Ambient Air Quality and Cleaner Air for Europe ................. 4
3.2 Fourth Daughter Directive 2004/107/EC ............................................................ 13
4 Comparison with Previous Years ........................................... 15
References .................................................................................. 20

Air Pollution in the UK 2011 – Compliance Assessment Summary
1
1 Introduction
All Member States of the European Union must comply with Directive 2008/50/EC on Ambient Air Quality and Cleaner Air for Europe1 and the Fourth Air Quality Daughter Directive2 (2004/107/EC). These Directives require all Member States, including the UK, to undertake air quality assessment, and to report the findings to the European Commission on an annual basis. Directive 2008/50/EC was adopted in June 2008. This directive (referred to as the Air Quality Directive) substantially revised and merged four previous directives and one Decision:
Directive 1996/62/EC on Ambient Air Quality Assessment and Management (the
Framework Directive)3, which established a framework under which the EU agreed air quality limit values for pollutants specified in a series of Daughter Directives.
The First Daughter Directive4 (1999/30/EC), which set limit values for sulphur dioxide, oxides of nitrogen, particulate matter as PM10, and lead.
The Second Daughter Directive5 (2000/69/EC), which set limit values for carbon monoxide (CO) and benzene.
The Third Daughter Directive6 (or Ozone Directive, 2002/3/EC), which set target values for the protection of human health and vegetation.
Council Decision 97/101/EC7, which established a reciprocal exchange of air quality monitoring information and data, between the Member States.
The Fourth Daughter Directive, which covers the four metallic elements cadmium, arsenic, nickel and mercury together with polycyclic aromatic hydrocarbons (PAH), remains in force alongside the Air Quality Directive and is expected to be merged with the Air Quality Directive in the future. The UK has statutory monitoring networks in place to meet the requirements of these Directives, with air quality modelling used to supplement the monitored data.
The results are submitted to the European Commission each year, in the form of a standard questionnaire which each Member State must complete. The UK’s annual submission, together with those from previous years, can be found on the Commission website: http://cdr.eionet.europa.eu/gb/eu/annualair.
This document presents an assessment of the UK’s compliance with the limit values, target values and long term objectives set out in the Air Quality Directive and the 4th Daughter Directive, and compares this with recent years. This is based upon the data submitted to the European Commission.
Links to the EU Directives on ambient air quality are provided on Defra’s web pages at www.defra.gov.uk/environment/quality/air/air-quality/eu/. The Air Quality Directive itself can also
be found at http://eur-lex.europa.eu/LexUriServ/LexUriServ.do?uri=OJ:L:2008:152:0001:0044:EN:PDF. Further information on air quality in the UK can be found on Defra’s online UK Air Information Resource (UK-AIR), at http://uk-air.defra.gov.uk/.

Air Pollution in the UK 2011 – Compliance Assessment Summary
2
2 Definition of Zones
The UK is divided into 43 zones for air quality assessment. There are 28 agglomeration zones (large urban areas) and 15 non-agglomeration zones. Details are included in Form 2 of the Questionnaire (the annual compliance assessment report to the European Commission). Each zone is assigned an identification code. Zones are listed in Table 2-1 and shown in Figure 2-1.
Table 2-1 UK Zones and Agglomerations for Ambient Air Quality Reporting 2011
Zone Zone code Ag or Non-ag*
Greater London Urban Area UK0001 Ag
West Midlands Urban Area UK0002 Ag
Greater Manchester Urban Area UK0003 Ag
West Yorkshire Urban Area UK0004 Ag
Tyneside UK0005 Ag
Liverpool Urban Area UK0006 Ag
Sheffield Urban Area UK0007 Ag
Nottingham Urban Area UK0008 Ag
Bristol Urban Area UK0009 Ag
Brighton/Worthing/Littlehampton UK0010 Ag
Leicester Urban Area UK0011 Ag
Portsmouth Urban Area UK0012 Ag
Teesside Urban Area UK0013 Ag
The Potteries UK0014 Ag
Bournemouth Urban Area UK0015 Ag
Reading/Wokingham Urban Area UK0016 Ag
Coventry/Bedworth UK0017 Ag
Kingston upon Hull UK0018 Ag
Southampton Urban Area UK0019 Ag
Birkenhead Urban Area UK0020 Ag
Southend Urban Area UK0021 Ag
Blackpool Urban Area UK0022 Ag
Preston Urban Area UK0023 Ag
Glasgow Urban Area UK0024 Ag
Edinburgh Urban Area UK0025 Ag
Cardiff Urban Area UK0026 Ag
Swansea Urban Area UK0027 Ag
Belfast Metropolitan Urban Area UK0028 Ag
Eastern UK0029 Non-ag
South West UK0030 Non-ag
South East UK0031 Non-ag
East Midlands UK0032 Non-ag
North West & Merseyside UK0033 Non-ag
Yorkshire & Humberside UK0034 Non-ag
West Midlands UK0035 Non-ag
North East UK0036 Non-ag
Central Scotland UK0037 Non-ag
North East Scotland UK0038 Non-ag
Highland UK0039 Non-ag
Scottish Borders UK0040 Non-ag
South Wales UK0041 Non-ag
North Wales UK0042 Non-ag
Northern Ireland UK0043 Non-ag
Ag = agglomeration zone, Non-ag = non-agglomeration zone

Air Pollution in the UK 2011 – Compliance Assessment Summary
3
Figure 2-1 UK zones and agglomerations for ambient air quality reporting 2011
Agglomeration zones (red)
Non-agglomeration zones (blue/green) © Crown copyright. All rights reserved Defra, Licence number 100022861 [2012]

Air Pollution in the UK 2011 – Compliance Assessment Summary
4
3 Air Quality Assessment for 2011
The air quality assessment for each pollutant is derived from a combination of measured and modelled concentrations. Where both measurements and model results are available the assessment of compliance for each zone is based on the higher concentration of the two. The results of the air quality assessment submitted to the European Commission are summarised in the tables below. The tables have been completed as follows:
Where all measurements were within the relevant limit values in 2011, the table shows this as “OK”.
Where a margin of tolerance is applicable, if some or all measurements were above the limit value, but within the limit value plus margin of tolerance, the table shows this as “≤LV +MOT”.
In the above cases, where compliance was determined by modelling or supplementary
assessment, this is indicated by “(m)” – i.e. “OK (m)” or “≤LV +MOT (m)” as appropriate. Where locations were identified as exceeding a limit value, limit value plus margin of
tolerance, target value, long-term objective, this is identified as “>LV”, “>LV+MOT”, “>TV” or “>LTO” as applicable.
Where an exceedance was determined by modelling or supplementary assessment, this is indicated by (m), as above.
Zones that complied with the relevant limit values, targets or long-term objectives are shaded blue, while those that did not are shaded red. Where a time extension has been granted, and a margin of tolerance applies, zones that exceeded the relevant limit value but not the limit value plus margin of tolerance are shaded orange. The abbreviation “n/a” (not applicable) means that an assessment is not relevant for this zone,
such as for the NOX vegetation critical level in agglomeration zones.
3.1 Directive 2008/50/EC on Ambient Air
Quality and Cleaner Air for Europe
Sulphur dioxide: the results of the air quality assessment for sulphur dioxide are presented in Form 8a of the Questionnaire. In 2011, all zones and agglomerations within the UK complied with the limit values for 1-hour
mean and 24-hour mean SO2 concentration, set for protection of human health. All non-agglomeration zones within the UK also complied with the critical levels for annual mean and winter mean SO2 concentration, set for protection of ecosystems. (These are not applicable to built-up areas). Nitrogen dioxide: the results of the air quality assessment for nitrogen dioxide for each zone are
presented in Form 8b of the Questionnaire, and summarised in Table 3-1. Three agglomeration zones - Greater London Urban Area (UK0001), Glasgow Urban Area
(UK0024) and the South East (UK0031) had locations which exceeded the 1-hour limit value (200 µg m-3) on more than the permitted 18 occasions during 2011.
The majority of zones and agglomerations in the UK had locations with measured or modelled annual mean NO2 concentrations higher than the annual mean limit value (40 µg m-3). This was the case in 40 out of the 43 zones. The following three zones met the annual mean limit value in 2011:
Blackpool Urban Area (UK0022)
Highland (UK0039)
Scottish Borders (UK0040)

Air Pollution in the UK 2011 – Compliance Assessment Summary
5
The UK has been granted a time extension for compliance with the NO2 annual limit value in the following zones and agglomerations;
Nottingham Urban Area,
Leicester Urban Area,
Portsmouth Urban Area,
Reading/Wokingham Urban Area,
Southend Urban Area,
Edinburgh Urban Area,
Cardiff Urban Area,
Central Scotland zone, and
North Wales zone.
This exemption applies until 1st January 2015 for all but Reading/Wokingham Urban Area, for which it applies until 1st January 2013. Article 2 of the Commission Decision of 26th June 2012 requires the UK to provide the Commission with data indicating that the concentration levels in
these zones remain below the annual limit value plus the maximum margin of tolerance (60 µg m-3) specified in Annex XI to Directive 2008/50/EC. The following zones exceeded the annual
mean limit value, but were within the annual mean limit value plus margin of tolerance in 2011:
Reading/Wokingham Urban Area,
Southend Urban Area,
Edinburgh Urban Area,
Cardiff Urban Area, and
Central Scotland.
All other 35 zones and agglomerations exceeded the annual mean limit value, or annual mean limit value plus margin of tolerance. All non-agglomeration zones within the UK complied with the critical level for annual mean NOX concentration, set for protection of vegetation.
Annual mean concentrations of NO2 were typically lower in 2011 than in 2010. 2010 was a relatively high year for this pollutant; cold winter weather increased fuel use and therefore
emissions. PM10 Particulate matter: the results of the air quality assessment for PM10 for each zone are presented in Form 8c of the Questionnaire, and summarised in Table 3-2.
The UK has been granted a time extension for compliance with the 24-hour PM10 limit value in the Greater London Urban Area (UK0001). This exemption applies for the period from 11th June 2008 to 10th June 2011. Article 2 of the Commission Decision of 11th March 2011 requires the UK to provide the Commission with data indicating that the concentration levels in this zone have remained below the daily limit value plus the maximum margin of tolerance specified in Annex XI to Directive 2008/50/EC (daily mean of 75 µg m-3, not to be exceeded more than 35 times per
calendar year). As a result, for the UK 2011 compliance assessment, the PM10 time extension decision for the Greater London Urban Area requires assessment against the maximum margin of tolerance (MOT) of 75 µg m-3 as a daily mean between 1st January 2011 and 10th June 2011 and the limit value (LV) of 50 µg m-3 as a daily mean between 11th June 2011 and 31st December 2011. In order to be compliant with the requirements of the time extension the total of these two numbers of exceedance days should not exceed 35.
The daily limit value was exceeded in this zone in 2011 but the Greater London Urban Area is classified as compliant due to the maximum MOT in place until 10th June - there were a total of 26 measured exceedances in 2011 (combining exceedances of 75 µg m-3 until 10th June and exceedances of 50 µg m-3 thereafter). The daily limit value plus the maximum margin of tolerance was also not exceeded during the period from 11th June 2008 to 31st December 2008 nor in 2009, nor in 2010.
Provision is made in EU legislation for Member States to subtract the PM10 contribution due to natural contributions (2008/50/EC Article 20), and this has been carried out where it is required.

Air Pollution in the UK 2011 – Compliance Assessment Summary
6
Prior to the subtraction of natural sources, the West Midlands agglomeration exceeded the 24-hour PM10 limit value on more than 35 occasions in 2011: no time extension is in force for this zone.
However, subtraction of the contribution from natural sources as is required by the Directive, reduced the number of exceedances from 37 to 31, which is within the permitted maximum.
All zones and agglomerations complied with the annual mean limit value of 40 µg m-3 for PM10. PM2.5 Particulate matter: the results of the air quality assessment for PM2.5 for each zone are presented in Form 9c of the Questionnaire, and summarised in Table 3-3. This table includes the target value (25 µg m-3 to be achieved by 1st Jan 2010) the Stage 1 limit value (25 µg m-3 to be achieved by 1st Jan 2015) and the Stage 2 limit value (20 µg m-3 to be achieved by 1st Jan 2020).
All three apply to the calendar year mean. Natural contributions have been removed from PM2.5 exceedances listed in Table 3-3. Exceedance of limit values of PM2.5 due to natural events (1999/30/EC Article 5(4)) or natural contributions (2008/50/EC Article 20) are as follows:
The modelled exceedance of the Stage 2 limit value in zone UK0002 (West Midlands) is removed by the subtraction of the natural contribution (sea salt).
The measured exceedances of the Stage 2 limit value in zone UK0001 (site: Marylebone Road, annual mean: 24 µg m-3) and zone UK0024 (site: Glasgow Kerbside, annual mean: 22 µg m-3) remain even if the natural contribution (sea salt) is subtracted.
Annual mean concentrations of PM2.5 were within the target value of 25 µg m-3 in all zones and agglomerations. Under the Air Quality Directive, Member States will be required to achieve a national exposure reduction target for PM2.5, over the period 2010 to 2020. This is based on the Average Exposure Indicator statistic. The Average Exposure Indicator (AEI) for the UK has been calculated as follows: the mean PM2.5 concentration at appropriate UK background urban sites only was calculated for three consecutive calendar years 2009, 2010 and 2011. The values obtained
were as follows:
2009: 13 µg m-3
2010: 13 µg m-3
2011: 14 µg m-3.
The mean of these three values (to the nearest integer) is 13 µg m-3. This is taken as the AEI for
the reference year of 2010. The AEI for the reference year 2010 determines the National Exposure Reduction Target (NERT), to be achieved by 2020 (see Annex XIV of the Air Quality Directive). With a reference year AEI of 13 µg m-3, the Air Quality Directive sets an exposure reduction target of 15%. The detailed methodology and results of this calculation are presented in Defra’s technical report on UK air quality assessment.8
Carbon monoxide, benzene and lead: the results of the air quality assessment for lead, benzene and CO are presented in Forms 8d, 8e and 8f of the Questionnaire respectively. All zones or agglomerations were compliant with the limit values for these three pollutants in 2011. Ozone: the results of the air quality assessment for ozone for each zone are presented in Form 9a of the Questionnaire, and summarised in Table 3-4.
For ozone, there is a target value based on the maximum daily 8-hour mean. There is also a long-term objective for protection of human health, based on the maximum daily 8-hour mean. All 43 zones and agglomerations were compliant with this target value. However, all 43 zones and agglomerations were above the long-term objective (LTO) for health.
There is also a target value based on the AOT40 statistic1. The AOT40 statistic (expressed in
µg m-3 .hours) is the sum of the difference between hourly concentrations greater than 80 µg m-3 (= 40 ppb) and 80 µg m-3 over a given period using only the one-hour values measured between 0800 and 2000 Central European Time each day. All 43 zones and agglomerations met the target value based on the AOT40 statistic. There is also a long-term objective, for protection of vegetation, based on this statistic. Three zones were above the long-term objective for vegetation: Greater London, Eastern and East Midlands.

Air Pollution in the UK 2011 – Compliance Assessment Summary
7
Table 3-1 Results of Air Quality Assessment for Nitrogen Dioxide in 2011
Zone Zone code
NO2 LV for health (1hr mean)
NO2 LV for health (annual mean)
NOx critical level for
vegetation (annual mean)
Greater London Urban Area UK0001 >LV >LV n/a
West Midlands Urban Area UK0002 OK >LV n/a
Greater Manchester Urban Area UK0003 OK >LV n/a
West Yorkshire Urban Area UK0004 OK >LV n/a
Tyneside UK0005 OK >LV (m) n/a
Liverpool Urban Area UK0006 OK >LV (m) n/a
Sheffield Urban Area UK0007 OK >LV (m) n/a
Nottingham Urban Area * UK0008 OK >LV +MOT (m) n/a
Bristol Urban Area UK0009 OK >LV (m) n/a
Brighton/Worthing/Littlehampton UK0010 OK (m) >LV (m) n/a
Leicester Urban Area * UK0011 OK (m) >LV +MOT (m) n/a
Portsmouth Urban Area * UK0012 OK >LV +MOT (m) n/a
Teesside Urban Area UK0013 OK >LV (m) n/a
The Potteries UK0014 OK >LV (m) n/a
Bournemouth Urban Area UK0015 OK >LV (m) n/a
Reading/Wokingham Urban Area * UK0016 OK ≤LV +MOT (m) n/a
Coventry/Bedworth UK0017 OK >LV (m) n/a
Kingston upon Hull UK0018 OK >LV (m) n/a
Southampton Urban Area UK0019 OK >LV (m) n/a
Birkenhead Urban Area UK0020 OK >LV (m) n/a
Southend Urban Area * UK0021 OK (m) ≤LV +MOT (m) n/a
Blackpool Urban Area UK0022 OK OK n/a
Preston Urban Area UK0023 OK >LV (m) n/a
Glasgow Urban Area UK0024 >LV >LV n/a
Edinburgh Urban Area * UK0025 OK ≤LV +MOT (m) n/a
Cardiff Urban Area * UK0026 OK ≤LV +MOT (m) n/a
Swansea Urban Area UK0027 OK >LV (m) n/a
Belfast Urban Area UK0028 OK >LV (m) n/a
Eastern UK0029 OK >LV (m) OK
South West UK0030 OK >LV OK
South East UK0031 >LV >LV OK
East Midlands UK0032 OK >LV (m) OK
North West & Merseyside UK0033 OK >LV (m) OK (m)
Yorkshire & Humberside UK0034 OK >LV (m) OK
West Midlands UK0035 OK >LV (m) OK (m)
North East UK0036 OK >LV (m) OK (m)
Central Scotland * UK0037 OK ≤LV +MOT (m) OK (m)
North East Scotland UK0038 OK >LV OK (m)
Highland UK0039 OK OK OK (m)
Scottish Borders UK0040 OK OK OK
South Wales UK0041 OK >LV (m) OK
North Wales * UK0042 OK >LV +MOT (m) OK
Northern Ireland UK0043 OK >LV (m) OK (m)
LV = limit value, MOT = margin of tolerance, (m) indicates that the compliance or exceedance was
determined by modelling. Asterisk (*) indicates a time extension granted.

Air Pollution in the UK 2011 – Compliance Assessment Summary
8
Table 3-2 Results of Air Quality Assessment for PM10 in 2011 After Subtraction of Contribution from Natural Sources.
Zone Zone code PM10 LV (daily mean)
PM10 LV (annual
mean)
Greater London Urban Area UK0001 ≤ LV +MOT OK
West Midlands Urban Area UK0002 OK (m) OK
Greater Manchester Urban Area UK0003 OK OK
West Yorkshire Urban Area UK0004 OK OK
Tyneside UK0005 OK OK
Liverpool Urban Area UK0006 OK OK
Sheffield Urban Area UK0007 OK OK
Nottingham Urban Area UK0008 OK OK
Bristol Urban Area UK0009 OK (m) OK (m)
Brighton/Worthing/Littlehampton UK0010 OK (m) OK (m)
Leicester Urban Area UK0011 OK OK
Portsmouth Urban Area UK0012 OK (m) OK (m)
Teesside Urban Area UK0013 OK OK
The Potteries UK0014 OK OK
Bournemouth Urban Area UK0015 OK (m) OK (m)
Reading/Wokingham Urban Area UK0016 OK OK
Coventry/Bedworth UK0017 OK (m) OK (m)
Kingston upon Hull UK0018 OK OK
Southampton Urban Area UK0019 OK OK
Birkenhead Urban Area UK0020 OK (m) OK (m)
Southend Urban Area UK0021 OK (m) OK (m)
Blackpool Urban Area UK0022 OK (m) OK (m)
Preston Urban Area UK0023 OK (m) OK (m)
Glasgow Urban Area UK0024 OK OK
Edinburgh Urban Area UK0025 OK OK
Cardiff Urban Area UK0026 OK (m) OK (m)
Swansea Urban Area UK0027 OK OK
Belfast Urban Area UK0028 OK (m) OK (m)
Eastern UK0029 OK OK
South West UK0030 OK OK
South East UK0031 OK OK
East Midlands UK0032 OK OK
North West & Merseyside UK0033 OK OK
Yorkshire & Humberside UK0034 OK OK
West Midlands UK0035 OK (m) OK (m)
North East UK0036 OK OK
Central Scotland UK0037 OK OK
North East Scotland UK0038 OK OK
Highland UK0039 OK OK
Scottish Borders UK0040 OK (m) OK (m)
South Wales UK0041 OK OK
North Wales UK0042 OK OK
Northern Ireland UK0043 OK OK
*Note: The UK has been granted a time extension to achieve compliance with the daily mean limit
value for PM10 in Greater London Urban Area. Consequently, the maximum margin of tolerance is
in force for the duration of the extension. Prior to the subtraction of natural source contribution the West Midlands (UK0002) exceeded the daily mean limit value on more than the permitted 35 occasions: no time extension is in force. However, subtraction of the contribution from natural sources reduced the number of exceedances
of this limit value from 37 to 31 which is within the permitted maximum. Natural sources have only been subtracted for zones UK0001 and UK0002 in this table. LV = limit value, MOT = margin of tolerance, (m) indicates that the compliance or exceedance was determined by modelling.

Air Pollution in the UK 2011 – Compliance Assessment Summary
9
Table 3-3 Results of Air Quality Assessment for PM2.5 in 2011 After Subtraction of Contribution from Natural Sources.
Zone Zone code
PM2.5 target value (annual mean)
PM2.5 Stage 1 limit value
(annual mean, for 1st Jan 2015)
PM2.5 Stage 2 limit value
(annual mean, for 1st Jan 2020)
Greater London Urban Area UK0001 OK OK > LV
West Midlands Urban Area UK0002 OK OK OK (m)
Greater Manchester Urban Area UK0003 OK OK OK
West Yorkshire Urban Area UK0004 OK OK OK
Tyneside UK0005 OK OK OK
Liverpool Urban Area UK0006 OK OK OK
Sheffield Urban Area UK0007 OK OK OK
Nottingham Urban Area UK0008 OK OK OK
Bristol Urban Area UK0009 OK OK OK
Brighton/Worthing/Littlehampton UK0010 OK OK OK
Leicester Urban Area UK0011 OK OK OK
Portsmouth Urban Area UK0012 OK OK OK
Teesside Urban Area UK0013 OK OK OK
The Potteries UK0014 OK OK OK
Bournemouth Urban Area UK0015 OK OK OK
Reading/Wokingham Urban Area UK0016 OK OK OK
Coventry/Bedworth UK0017 OK (m) OK (m) OK (m)
Kingston upon Hull UK0018 OK OK OK
Southampton Urban Area UK0019 OK OK OK
Birkenhead Urban Area UK0020 OK OK OK
Southend Urban Area UK0021 OK (m) OK (m) OK (m)
Blackpool Urban Area UK0022 OK (m) OK (m) OK (m)
Preston Urban Area UK0023 OK OK OK
Glasgow Urban Area UK0024 OK OK > LV
Edinburgh Urban Area UK0025 OK OK OK
Cardiff Urban Area UK0026 OK (m) OK (m) OK (m)
Swansea Urban Area UK0027 OK OK OK
Belfast Urban Area UK0028 OK OK OK
Eastern UK0029 OK OK OK
South West UK0030 OK OK OK
South East UK0031 OK OK OK
East Midlands UK0032 OK OK OK
North West & Merseyside UK0033 OK OK OK
Yorkshire & Humberside UK0034 OK (m) OK (m) OK (m)
West Midlands UK0035 OK (m) OK (m) OK (m)
North East UK0036 OK OK OK
Central Scotland UK0037 OK OK OK
North East Scotland UK0038 OK OK OK
Highland UK0039 OK OK OK
Scottish Borders UK0040 OK (m) OK (m) OK (m)
South Wales UK0041 OK OK OK
North Wales UK0042 OK OK OK
Northern Ireland UK0043 OK (m) OK (m) OK (m)
Prior to subtraction of natural source contribution, the West Midlands Urban Area exceeded the Stage 2 limit value (to be met by 1st Jan 2020). Subtraction of natural PM2.5 reduced the (modelled) annual mean PM2.5 concentration to within the stage 2 limit value. Natural sources have only been subtracted for zones UK0001, UK0002 and UK0024 in this table. LV = limit value, (m) indicates that the compliance or exceedance was determined by modelling.

Air Pollution in the UK 2011 – Compliance Assessment Summary
10
Table 3-4 Results of Air Quality Assessment for Ozone in 2011
Zone Zone code
O3 TV and LTO for health (8hr mean)
O3 TV and LTO for vegetation
(AOT40)
Greater London Urban Area UK0001 Met TV, >LTO Met TV, >LTO
West Midlands Urban Area UK0002 Met TV, >LTO OK
Greater Manchester Urban Area UK0003 Met TV, >LTO OK
West Yorkshire Urban Area UK0004 Met TV, >LTO (m) OK
Tyneside UK0005 Met TV, >LTO (m) OK
Liverpool Urban Area UK0006 Met TV, >LTO OK
Sheffield Urban Area UK0007 Met TV, >LTO (m) OK
Nottingham Urban Area UK0008 Met TV, >LTO (m) OK
Bristol Urban Area UK0009 Met TV, >LTO OK
Brighton/Worthing/Littlehampton UK0010 Met TV, >LTO OK (m)
Leicester Urban Area UK0011 Met TV, >LTO OK
Portsmouth Urban Area UK0012 Met TV, >LTO OK
Teesside Urban Area UK0013 Met TV, >LTO (m) OK
The Potteries UK0014 Met TV, >LTO OK
Bournemouth Urban Area UK0015 Met TV, >LTO OK
Reading/Wokingham Urban Area UK0016 Met TV, >LTO OK
Coventry/Bedworth UK0017 Met TV, >LTO OK
Kingston upon Hull UK0018 Met TV, >LTO (m) OK
Southampton Urban Area UK0019 Met TV, >LTO (m) OK
Birkenhead Urban Area UK0020 Met TV, >LTO OK
Southend Urban Area UK0021 Met TV, >LTO (m) OK (m)
Blackpool Urban Area UK0022 Met TV, >LTO OK
Preston Urban Area UK0023 Met TV, >LTO OK
Glasgow Urban Area UK0024 Met TV, >LTO (m) OK
Edinburgh Urban Area UK0025 Met TV, >LTO (m) OK
Cardiff Urban Area UK0026 Met TV, >LTO (m) OK
Swansea Urban Area UK0027 Met TV, >LTO OK
Belfast Urban Area UK0028 Met TV, >LTO (m) OK
Eastern UK0029 Met TV, >LTO Met TV, >LTO
South West UK0030 Met TV, >LTO OK
South East UK0031 Met TV, >LTO OK
East Midlands UK0032 Met TV, >LTO Met TV, >LTO (m)
North West & Merseyside UK0033 Met TV, >LTO OK
Yorkshire & Humberside UK0034 Met TV, >LTO OK
West Midlands UK0035 Met TV, >LTO OK
North East UK0036 Met TV, >LTO OK
Central Scotland UK0037 Met TV, >LTO OK
North East Scotland UK0038 Met TV, >LTO OK
Highland UK0039 Met TV, >LTO OK
Scottish Borders UK0040 Met TV, >LTO OK
South Wales UK0041 Met TV, >LTO OK
North Wales UK0042 Met TV, >LTO OK
Northern Ireland UK0043 Met TV, >LTO OK
TV = target value, LTO = long-term objective. (m) indicates that the compliance or exceedance was determined by modelling.
Measured exceedances of limit values, target values, long term objectives, information thresholds and alert thresholds are also listed within the annual air quality assessment questionnaire. Summary statistics for the exceedances identified at specific monitoring sites are provided in Table
3-5 to Table 3-9.

Air Pollution in the UK 2011 – Compliance Assessment Summary
11
Table 3-5 Measured Exceedances of the NO2 Limit Value for Health (1 hour mean)
Site name Zone code
Number of 1-hour exceedances of LV
Maximum 1-hour concentration (g m-3)
Camden Kerbside UK0001 77 342
London Marylebone Road UK0001 229 304
Glasgow Kerbside UK0024 31 260
Oxford Centre Roadside UK0031 35 279
Table 3-6 Measured Exceedances of the NO2 Limit Value for Health (annual mean)
Site name Zone code
Annual mean concentration (g m-3)
Camden Kerbside UK0001 72
London Bloomsbury UK0001 50
London Cromwell Road 2 UK0001 66
London Hillingdon UK0001 55
London Marylebone Road UK0001 97
London Westminster UK0001 41
Tower Hamlets Roadside UK0001 57
Birmingham Tyburn Roadside UK0002 45
Manchester Piccadilly UK0003 44
Leeds Headingley Kerbside UK0004 44
Glasgow Kerbside UK0024 72
Bath Roadside UK0030 57
Oxford Centre Roadside UK0031 61
Aberdeen Union Street Roadside UK0038 44
Table 3-7 Measured Exceedances of the Ozone Information Threshold Value
Site name Zone code
Number of 1-hour
exceedances of alert threshold
Maximum 1-hour concentration (g m-3)
No exceedances - - -
Table 3-8 Measured Exceedances of the Ozone Alert Threshold Value
Site name Zone code
Number of 1-hour exceedances of information threshold
Maximum 1-hour concentration (g m-3)
No exceedances - - -
Air Pollution in the UK 2011 – Compliance Assessment Summary
12
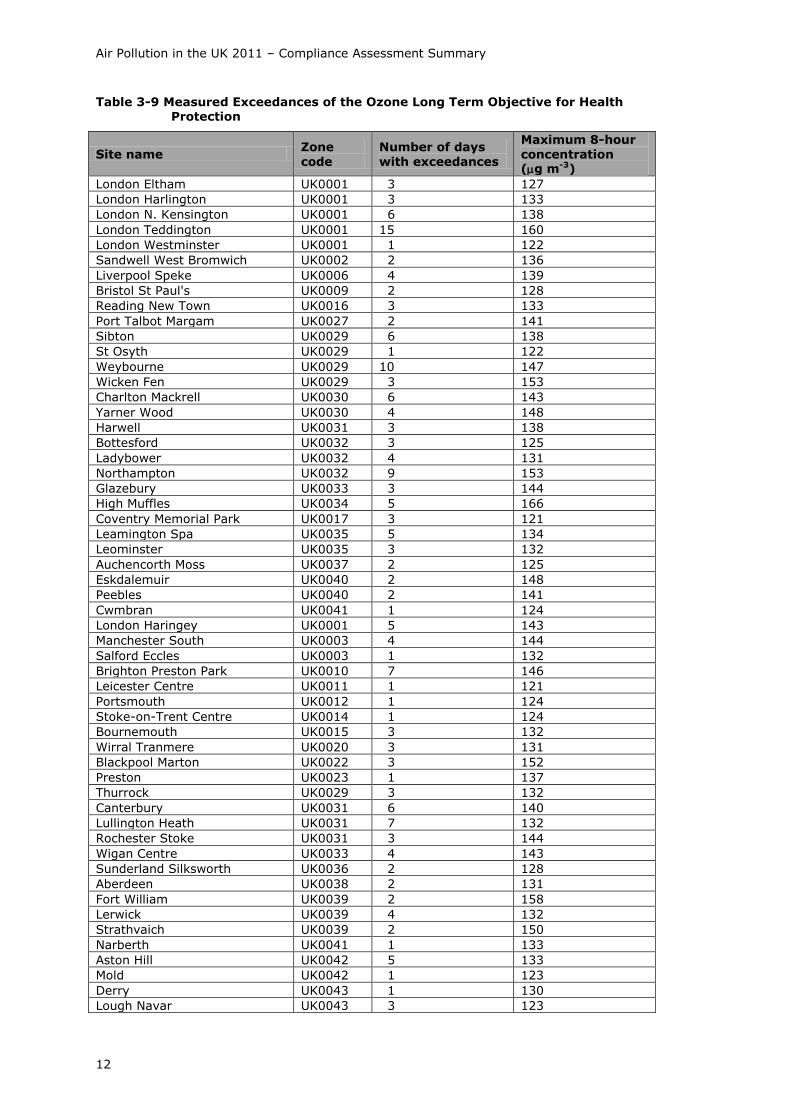
Table 3-9 Measured Exceedances of the Ozone Long Term Objective for Health Protection
Site name Zone
code
Number of days
with exceedances
Maximum 8-hour
concentration (g m-3)
London Eltham UK0001 3 127
London Harlington UK0001 3 133
London N. Kensington UK0001 6 138
London Teddington UK0001 15 160
London Westminster UK0001 1 122
Sandwell West Bromwich UK0002 2 136
Liverpool Speke UK0006 4 139
Bristol St Paul's UK0009 2 128
Reading New Town UK0016 3 133
Port Talbot Margam UK0027 2 141
Sibton UK0029 6 138
St Osyth UK0029 1 122
Weybourne UK0029 10 147
Wicken Fen UK0029 3 153
Charlton Mackrell UK0030 6 143
Yarner Wood UK0030 4 148
Harwell UK0031 3 138
Bottesford UK0032 3 125
Ladybower UK0032 4 131
Northampton UK0032 9 153
Glazebury UK0033 3 144
High Muffles UK0034 5 166
Coventry Memorial Park UK0017 3 121
Leamington Spa UK0035 5 134
Leominster UK0035 3 132
Auchencorth Moss UK0037 2 125
Eskdalemuir UK0040 2 148
Peebles UK0040 2 141
Cwmbran UK0041 1 124
London Haringey UK0001 5 143
Manchester South UK0003 4 144
Salford Eccles UK0003 1 132
Brighton Preston Park UK0010 7 146
Leicester Centre UK0011 1 121
Portsmouth UK0012 1 124
Stoke-on-Trent Centre UK0014 1 124
Bournemouth UK0015 3 132
Wirral Tranmere UK0020 3 131
Blackpool Marton UK0022 3 152
Preston UK0023 1 137
Thurrock UK0029 3 132
Canterbury UK0031 6 140
Lullington Heath UK0031 7 132
Rochester Stoke UK0031 3 144
Wigan Centre UK0033 4 143
Sunderland Silksworth UK0036 2 128
Aberdeen UK0038 2 131
Fort William UK0039 2 158
Lerwick UK0039 4 132
Strathvaich UK0039 2 150
Narberth UK0041 1 133
Aston Hill UK0042 5 133
Mold UK0042 1 123
Derry UK0043 1 130
Lough Navar UK0043 3 123

Air Pollution in the UK 2011 – Compliance Assessment Summary
13
3.2 Fourth Daughter Directive 2004/107/EC
The results of the air quality assessment for arsenic (As), cadmium (Cd), nickel (Ni) and benzo[a]pyrene (B[a]P) for each zone are presented in Form 9b of the Questionnaire, and illustrated in Table 3-10.
All zones and agglomerations met the target values for arsenic and cadmium. Two zones (Swansea Urban Area and the South Wales zone) exceeded the target value for nickel. Concentrations of B[a]P were above the target value in seven zones (Teesside Urban Area, Swansea Urban Area, Belfast Urban Area, Yorkshire and Humberside, the North East, South Wales and Northern Ireland). All the remaining zones were compliant with the target value for B[a]P.

Air Pollution in the UK 2011 – Compliance Assessment Summary
14
Table 3-10 Results of Air Quality Assessment for As, Cd, Ni and benzo[a]pyrene in 2011
Zone Zone code
As TV Cd TV Ni TV B[a]P TV
Greater London Urban Area UK0001 OK OK OK OK
West Midlands Urban Area UK0002 OK OK OK OK
Greater Manchester Urban Area UK0003 OK OK OK OK
West Yorkshire Urban Area UK0004 OK (m) OK (m) OK (m) OK
Tyneside UK0005 OK (m) OK (m) OK (m) OK
Liverpool Urban Area UK0006 OK (m) OK (m) OK (m) OK
Sheffield Urban Area UK0007 OK OK OK OK (m)
Nottingham Urban Area UK0008 OK (m) OK (m) OK (m) OK (m)
Bristol Urban Area UK0009 OK (m) OK (m) OK (m) OK (m)
Brighton/Worthing/Littlehampton UK0010 OK (m) OK (m) OK (m) OK
Leicester Urban Area UK0011 OK (m) OK (m) OK (m) OK (m)
Portsmouth Urban Area UK0012 OK (m) OK (m) OK (m) OK (m)
Teesside Urban Area UK0013 OK OK OK > TV (m)
The Potteries UK0014 OK (m) OK (m) OK (m) OK (m)
Bournemouth Urban Area UK0015 OK (m) OK (m) OK (m) OK (m)
Reading/Wokingham Urban Area UK0016 OK (m) OK (m) OK (m) OK (m)
Coventry/Bedworth UK0017 OK (m) OK (m) OK (m) OK (m)
Kingston upon Hull UK0018 OK (m) OK (m) OK (m) OK (m)
Southampton Urban Area UK0019 OK (m) OK (m) OK (m) OK (m)
Birkenhead Urban Area UK0020 OK (m) OK (m) OK (m) OK (m)
Southend Urban Area UK0021 OK (m) OK (m) OK (m) OK (m)
Blackpool Urban Area UK0022 OK (m) OK (m) OK (m) OK (m)
Preston Urban Area UK0023 OK (m) OK (m) OK (m) OK (m)
Glasgow Urban Area UK0024 OK OK OK OK
Edinburgh Urban Area UK0025 OK (m) OK (m) OK (m) OK
Cardiff Urban Area UK0026 OK OK OK OK
Swansea Urban Area UK0027 OK OK > TV > TV (m)
Belfast Urban Area UK0028 OK OK OK > TV (m)
Eastern UK0029 OK OK OK OK
South West UK0030 OK OK OK OK (m)
South East UK0031 OK OK OK OK
East Midlands UK0032 OK (m) OK (m) OK (m) OK
North West & Merseyside UK0033 OK OK OK OK
Yorkshire & Humberside UK0034 OK OK OK > TV
West Midlands UK0035 OK (m) OK (m) OK (m) OK (m)
North East UK0036 OK OK OK > TV (m)
Central Scotland UK0037 OK OK OK OK
North East Scotland UK0038 OK OK OK OK (m)
Highland UK0039 OK (m) OK (m) OK (m) OK
Scottish Borders UK0040 OK OK OK OK (m)
South Wales UK0041 OK OK > TV (m) > TV (m)
North Wales UK0042 OK (m) OK (m) OK (m) OK (m)
Northern Ireland UK0043 OK (m) OK (m) OK (m) > TV
TV = Target Value, (m) indicates that the compliance or exceedance was determined by modelling.

Air Pollution in the UK 2011 – Compliance Assessment Summary
15
4 Comparison with Previous Years
Table 4-1 to Table 4-6 summarise the results of the air quality assessment for 2011 and provide a comparison with the results of the assessments carried out in previous years. In Table 4-2, “n/a” (not applicable) indicates that there was no applicable margin of tolerance for the specified year.
Table 4-1 (Part 1 of 2) Exceedances of Limit Values for Ambient Air Quality Directive (1st and 2nd Daughter Directives prior to 2008) Pollut-ant
Averag-ing time
2011 2010 2009 2008 2007 2006 2005 2004 2003 2002 2001
SO2 1-hour None None None None None 1 zone modelled (Eastern)
1 zone modelled (Eastern)
1 zone modelled (Eastern)
1 zone modelled (Eastern)
None None
SO2 24-houri None None None None None 1 zone modelled (Eastern)
1 zone modelled (Eastern)
None 1 zone modelled (Eastern)
None 1 Zone measured (Belfast Urban Area)
SO2 Annualii None None None None None None None None None None None
SO2 Winterii None None None None None None None None None None not assessed
NO2 1-houriii 3 zones measured (London, Glasgow, South East)
3 zones measured (London, Teesside, Glasgow)
2 zones measured (London, Glasgow)
3 zones measured (London, Glasgow, NE Scotland)
2 zones measured (London, Glasgow)
1 zone measured (Greater London Urban Area)
2 zones measured (London, Bristol)
1 zone measured (Greater London Urban Area)
3 zones measured (London, Glasgow, South East)
1 zone measured (Glasgow Urban Area)
4 zones measured
NO2 Annuali 40 zones (8
measured, + 32 modelled)
40 zones
(11 measured + 29 modelled)
40 zones (9
measured + 31 modelled)
40 zones
(10 measured + 30 modelled)
41 zones (8
measured + 33 modelled)
39 zones (7
measured + 32 modelled)
38 zones (8
measured + 30 modelled)
39 zones (9
measured + 30 modelled)
42 zones
(10 measured + 32 modelled)
36 zones (6
measured + 30 modelled)
38 zones (6
measured + 32 modelled)
NOx Annualii None None None None None None None None None None None i No MOT defined except where a time extension has been granted, LV + MOT = LV ii Applies to vegetation and ecosystem areas only. Critical Levels are already in force, no MOT. iii No modelling for 1-hour LV.
Table 4-1 is continued on next page.

Air Pollution in the UK 2011 – Compliance Assessment Summary
16
Table 4-1 (Part 2 of 2) Exceedances of Limit Values for Ambient Air Quality Directive (1st and 2nd Daughter Directives prior to 2008) Pollut-ant
Averag-ing time
2011 2010 2009 2008 2007 2006 2005 2004 2003 2002 2001
PM10 Daily 1 (modelled, after subtraction of natural contrib.: time ext. granted.)
1 (modelled, after subtraction of natural contrib.: time ext. granted.)
3 zones (1 measured + 2 modelled) 1 zone modelled after subtraction of natural contribution
2 zones (1 measured + 1 modelled) 1 zone measured after subtraction of natural contribution
6 zones (3 measured + 3 modelled)
30 zones (5 measured + 25 modelled)
29 zones (3 measured + 26 modelled)
27 zones (2 measured + 25 modelled)
33 zones (10 measured + 23 modelled)
18 zones (1 measured + 17 modelled)
26 zones (5 measured + 21 modelled)
PM10 Annual None None None None 1 zone measured (Greater London Urban Area)
2 zones (1 measured + 1 modelled)
4 zones (1 measured + 3 modelled)
2 zones (1 measured, London + 1 modelled, West Midlands Urban Area)
15 zones (1 measured + 14 modelled)
2 zones (Greater London Urban Area measured, Eastern modelled)
2 zones (London measured, Manchester modelled)
Lead Annual None None None None None None None None None None None
Benz-ene
Annual None None None None None 1 zone modelled (Yorkshire & H’side)
2 zones modelled (Yorkshire & H’side, Central Scotland)
None 1 zone modelled (Greater London Urban Area)
not assessed
not assessed
CO 8-hour None None None None None None None None None not
assessed
not
assessed
The UK has been compliant with the limit values for both lead and CO since 2003, and for benzene since 2007.

Air Pollution in the UK 2011 – Compliance Assessment Summary
17
Table 4-2 Exceedances of Limit Values plus Margins Of Tolerance (where applicable) for Ambient Air Quality Directive (1st and 2nd Daughter Directives prior to 2008). (This table only shows limit values that have been exceeded during 2001-2011).
Pollutant Averaging time
2011 2010 2009 2008 2007 2006 2005 2004
2003 2002 2001
SO2 1-hour n/a n/a n/a n/a n/a n/a n/a 1 zone modelled (Eastern)
1 zone modelled (Eastern)
None None
SO2 24-hour n/a n/a n/a n/a n/a n/a n/a None 1 zone modelled (Eastern)
None 1 zone measured (Belfast Urban Area)
NO2 1-houri n/a n/a 2 zones measured (London, Glasgow)
2 zones measured (London, Glasgow)
1 zone measured (Greater London Urban Area)
1 zone measured (Greater London Urban Area)
1 zone measured (Greater London Urban Area)
1 zone measured (Greater London Urban Area)
1 zone measured (Greater London Urban Area)
None None
NO2 Annual 4, all
modelled (MOT in place due to TEN).
n/a 40 zones
(9 measured + 31 modelled)
40 zones
(7 measured + 33 modelled)
39 zones
(6 measured + 33 modelled)
38 zones
(6 measured + 32 modelled)
35 zones
(6 measured + 29 modelled)
34 zones
(6 measured + 28 modelled)
35 zones
(5 measured + 30 modelled)
19 Zones
(5 measured + 14 modelled)
21 Zones
(4 measured + 17 modelled)
PM10 Daily None None None None None None None 19 zones (1 measured + 18 modelled)
18 zones (2 measured + 16 modelled)
1 zone modelled (Greater London Urban Area)
1 zone modelled (Greater London Urban Area)
PM10 Annual n/a n/a n/a n/a n/a n/a n/a 1 zone modelled (Gr. London Urban Area)
10 zones (1 measured + 9 modelled)
1 zone modelled (Gr. London Urban Area)
1 zone modelled (Gr.London Urban Area)
Benzene Annual n/a n/a None None None None None None None not assessed
not assessed
i No modelling for 1-hour LV

Air Pollution in the UK 2011 – Compliance Assessment Summary
18
Table 4-3 Ambient Air Quality Directive (3rd Daughter Directive prior to 2008) Target Values
Pollutant Averaging time
2011 2010 2009 2008 2007 2006 2005 2004
O3 8-hour None None None 1 zone measured (Eastern)
None None None None
O3 AOT40 None None None None None None None None
Table 4-4 Ambient Air Quality Directive (3rd Daughter Directive prior to 2008) Long Term Objectives
Pollutant Averaging
time
2011 2010 2009 2008 2007 2006 2005 2004
O3 8-hour 43 zones (31 measured + 12 modelled)
41 zones (19 measured + 22 modelled)
39 zones (25 measured + 14 modelled)
43 zones (35 measured + 8 modelled)
41 zones (24 measured + 17 modelled)
43 zones (41 measured + 2 modelled)
37 zones (22 measured + 15 modelled)
43 zones (36 measured + 7 modelled)
O3 AOT40 3 zones (2
measured + 1 modelled)
6 zones (3
measured + 3 modelled)
10 zones (8
measured + 2 modelled)
41 zones (25
measured + 16 modelled)
3 zones (1
measured + 2 modelled)
41 zones (32
measured + 9 modelled)
16 zones (9
measured + 7 modelled)
7 zones (5
measured + 2 modelled)

Air Pollution in the UK 2011 – Compliance Assessment Summary
19
Table 4-5 4th Daughter Directive Target Values
Pollutant Averaging time
2011 2010 2009 2008 2007
As Annual None None None None None
Cd Annual None None None None None
Ni Annual 2 zones, 1 measured 1 modelled (Swansea, S Wales)
2 zones modelled (Swansea, S Wales)
2 zones modelled (Swansea, S Wales)
2 zones modelled (Swansea, S Wales, measured at non-
network site, so
reported as m)
1 zone (Swansea Urban area, measured but low data capture,
so reported as m)
B[a]P Annual 7 zones (2 measured; Yorkshire & Humberside, N Ireland,
+ 5 modelled; Teesside, Swansea, Belfast, North East, South Wales)
8 zones, (2 zones measured: Yorkshire & Humberside, N Ireland
+ 6 zones modelled; Teesside, Belfast, W Midlands, North East, S Wales, N Wales.)
6 zones, (2 zones measured Yorkshire & Humberside, N Ireland
+ 4 zones modelled Teesside, Swansea, North East, S Wales)
6 zones, (3 zones measured Yorkshire & Humberside, Teesside,
N Ireland + 3 zones modelled Swansea, S Wales, Belfast)
1 zone measured (Yorkshire & Humberside)
Table 4-6 Ambient Air Quality Directive Target Value for PM2.5
Pollutant Averaging
time
2011 2010 2009
PM2.5 Annual None None None

20
References
1 European Parliament and Council of the European Union (2008) “Council Directive on ambient air quality and cleaner air for Europe (2008/50/EC)”. [online]. Available at http://eur-lex.europa.eu/LexUriServ/LexUriServ.do?uri=CELEX:32008L0050:EN:NOT (Accessed 31 July 2012)
2 European Parliament and Council of the European Union (2004) “Directive 2004/107/EC of the European Parliament and of the Council of 15 December 2004 relating to arsenic, cadmium, mercury, nickel and polycyclic aromatic hydrocarbons in ambient air”. [online]. Available at http://eur-lex.europa.eu/LexUriServ/LexUriServ.do?uri=CELEX:32004L0107:EN:NOT, (Accessed 31 Jul 2012)
3 European Parliament and Council of the European Union (1996) “Directive 96/62/EC on Ambient
Air Quality Assessment and Management”. [online]. Available at http://eur-lex.europa.eu/LexUriServ/LexUriServ.do?uri=CELEX:31996L0062:EN:NOT (Accessed 31 July 2012) 4 European Parliament and Council of the European Union (1999) “Council Directive 1999/30/EC of 22 April 1999 relating to limit values for sulphur dioxide, nitrogen dioxide and oxides of nitrogen,
particulate matter and lead in ambient air”. [online]. Available at http://eur-lex.europa.eu/LexUriServ/LexUriServ.do?uri=CELEX:31999L0030:EN:NOT (Accessed 31 July 2012) 5 European Parliament and Council of the European Union (2000) “Directive 2000/69/EC of the European Parliament and of the Council of 16 November 2000 relating to limit values for benzene and carbon monoxide in ambient air”. [online]. Available at http://eur-lex.europa.eu/LexUriServ/LexUriServ.do?uri=CELEX:32000L0069:EN:NOT (Accessed 31 July 2012)
6 European Parliament and Council of the European Union (2002) “Directive 2002/3/EC of the European Parliament and of the Council of 12 February 2002 relating to ozone in ambient air”. [online]. Available at http://eur-lex.europa.eu/LexUriServ/LexUriServ.do?uri=CELEX:32002L0003:EN:NOT (Accessed 31 July 2012) 7 European Parliament and Council of the European Union (1997) “Council Decision 97/101/EC”. [online]. Available at http://eur-lex.europa.eu/LexUriServ/LexUriServ.do?uri=CELEX:31997D0101:EN:NOT (Accessed 18 Jul 2012). 8 Brookes, D. M. et al., (in preparation) “Technical report on UK supplementary assessment under the Air Quality Directive (2008/50/EC), the Air Quality Framework Directive (96/62/EC) and Fourth Daughter Directive (2004/107/EC) for 2011”. AEA report number AEA/ENV/R/3316. (To be made
available on UK-AIR at http://uk-air.defra.gov.uk/library )