Air Pollution Components - Murdoch University
9
Journal of the Royal Society of Western Australia, Vol. 69, Part I, 1986, p. 19-27. ------------------------- Air pollution components in Perth by Franz Lax, William A. Robertson and B. Valda Garkaklis School of Environmental Science, Murdoch University South Street, Murdoch WA. 6150 Manuscript received and accepted 11 February 1986 Abstract High volume dust sampling, S0 2 , NOx, and fine particle mass concentration (FPMC) measurements were performed at 23 sites around the city of Perth. The dust samples were analyzed by atomic absorption techniques for the elements Ca, Cu, Pb, and Zn; flame photometry was used for Na and K. The emissions from possible sources of pollution, such as petrol engines, coal furnaces, hospital incinerators, cement works and bush fires were analyzed for the same elements. Results show that the strong lead (Pb) peak in the city centre is related to high density car traffic, as the combustion of petrol is the dominant source oflead. The levels for S0 2 and NOx were generally low but showed some increase in the central business district. Comparatively higher calcium peaks in the south west and north west of the area may be associated with cement works and brickworks respectively. The concentrations did not reach levels considered as being harmful to man and his environment, but meteorological patterns and traffic conditions in Perth indicate that it is necessary to monitor the contamination in the air now. This would enable appropriate controls to be developed for implementation before the effects resulting from a growing population push pollution to unacceptable levels. Introduction As cities grow, so does air pollution for many reasons (Williams et a!. 1981 ). Petrol and diesel vehicles are major contributors; in addition there is power generation from coal and wood and industrial wastes. Furthermore incinerator burning, bush fires and burning off, all increase the level of air pollution. A general increase in the number of suspended inorganic particles may be caused by increased construction activity. Perth, on the western seaboard of Australia, is no exception and with a population now topping the million mark, air pollution could eventually become a serious problem, unless steps are taken to control the most serious sources. Situated as it is on the coastal plain beneath the Darling Scarp, early morning temperature inversions make it possible for the Perth haze to become clearly visible. Fortunately, the city is commonly ventilated by sea breezes later in the day. No studies have been undertaken on the problem of air pollution as a whole in Perth, although a number of projects have investigated particular aspects of it. Bottomley and Boujois (1975) examined the amount of lead in the soil of Heirisson Island, and found that the concentration decreased with distance from the highway. Bottomley and Cattell (1975) also studied the nitrogen oxide levels in the Perth suburbs and observed peaks that were related to car traffic. They were also able to observe a mild formation of photochemical smog. Pb concentrations monitored over a three year period (O'Connor and Allen 1980) indicated that the change in mean seasonal levels was similar for a central and a 19 suburban site. The amount of airborne lead correlated well with ventilation parameters over quarterly periods. Maximum Pb values occurred in winter. Low levels of paticulate matter were found by O'Connor eta!. (1981) in two suburban stations, whereas the measurements were definitely higher near Kwinana. A major research project, the Kwinana Air Modelling Study (1982), detailed the effect of Perth's industrial complex on the air pollution of the surrounding area, and developed models relating pollution levels to different meteorological conditions and source emissions. More recently Watson ( 1984) investigated the buildup of carbon monoxide aside the Kwinana Freeway and showed the important effect of atmospheric stability in the dispersion of pollutants. An attempt to study variations in the quality of the air in Perth was undertaken by Robertson eta!. (1985). The relation of pollution to sources was considered using elements as fingerprints. Relatively high lead levels were measured in the central business districts. The mass of particles was low in the suburbs and semi-industrial areas sampled. The possibility of tracing sources using fingerprint- elements has been shown by the work ofGatz (1975) in Chicago. It is noteworthy that tracer influences can be complex and variable. The present work was designed to assess the variability of the sources, such as petrol engines and bush fires, as well as to monitor the extent of the dispersion of the pollution to the surrounding environment.
Transcript of Air Pollution Components - Murdoch University

Journal of the Royal Society of Western Australia, Vol. 69, Part I, 1986, p. 19-27. -------------------------
Air pollution components in Perth
by Franz Lax, William A. Robertson and B. Valda Garkaklis
School of Environmental Science, Murdoch University South Street, Murdoch WA. 6150
Manuscript received and accepted 11 February 1986
Abstract
High volume dust sampling, S02, NOx, and fine particle mass concentration (FPMC) measurements were performed at 23 sites around the city of Perth. The dust samples were analyzed by atomic absorption techniques for the elements Ca, Cu, Pb, and Zn; flame photometry was used for Na and K. The emissions from possible sources of pollution, such as petrol engines, coal furnaces, hospital incinerators, cement works and bush fires were analyzed for the same elements. Results show that the strong lead (Pb) peak in the city centre is related to high density car traffic, as the combustion of petrol is the dominant source oflead. The levels for S02 and NOx were generally low but showed some increase in the central business district. Comparatively higher calcium peaks in the south west and north west of the area may be associated with cement works and brickworks respectively.
The concentrations did not reach levels considered as being harmful to man and his environment, but meteorological patterns and traffic conditions in Perth indicate that it is necessary to monitor the contamination in the air now. This would enable appropriate controls to be developed for implementation before the effects resulting from a growing population push pollution to unacceptable levels.
Introduction
As cities grow, so does air pollution for many reasons (Williams et a!. 1981 ). Petrol and diesel vehicles are major contributors; in addition there is power generation from coal and wood and industrial wastes. Furthermore incinerator burning, bush fires and burning off, all increase the level of air pollution. A general increase in the number of suspended inorganic particles may be caused by increased construction activity.
Perth, on the western seaboard of Australia, is no exception and with a population now topping the million mark, air pollution could eventually become a serious problem, unless steps are taken to control the most serious sources. Situated as it is on the coastal plain beneath the Darling Scarp, early morning temperature inversions make it possible for the Perth haze to become clearly visible. Fortunately, the city is commonly ventilated by sea breezes later in the day.
No studies have been undertaken on the problem of air pollution as a whole in Perth, although a number of projects have investigated particular aspects of it. Bottomley and Boujois (1975) examined the amount of lead in the soil of Heirisson Island, and found that the concentration decreased with distance from the highway. Bottomley and Cattell (1975) also studied the nitrogen oxide levels in the Perth suburbs and observed peaks that were related to car traffic. They were also able to observe a mild formation of photochemical smog. Pb concentrations monitored over a three year period (O'Connor and Allen 1980) indicated that the change in mean seasonal levels was similar for a central and a
19
suburban site. The amount of airborne lead correlated well with ventilation parameters over quarterly periods. Maximum Pb values occurred in winter. Low levels of paticulate matter were found by O'Connor eta!. (1981) in two suburban stations, whereas the measurements were definitely higher near Kwinana. A major research project, the Kwinana Air Modelling Study (1982), detailed the effect of Perth's industrial complex on the air pollution of the surrounding area, and developed models relating pollution levels to different meteorological conditions and source emissions.
More recently Watson ( 1984) investigated the buildup of carbon monoxide aside the Kwinana Freeway and showed the important effect of atmospheric stability in the dispersion of pollutants.
An attempt to study variations in the quality of the air in Perth was undertaken by Robertson eta!. (1985). The relation of pollution to sources was considered using elements as fingerprints. Relatively high lead levels were measured in the central business districts. The mass of particles was low in the suburbs and semi-industrial areas sampled.
The possibility of tracing sources using fingerprintelements has been shown by the work ofGatz (1975) in Chicago. It is noteworthy that tracer influences can be complex and variable.
The present work was designed to assess the variability of the sources, such as petrol engines and bush fires, as well as to monitor the extent of the dispersion of the pollution to the surrounding environment.
;~
" " !'i 1-'j 1.'1
ll II
11

INDIAN
OCEAN
0 I 2 3 4 I~ ....
Kilometres
PERTH SAMPLING SITES
20-$-
Figure I.-Map of the area showing the sampling sites. Suburban areas have stippled and industrial areas shown in heavy stipple.
20

Journal of the Royal Society of Western Australia, Vol. 69, Part 1, 1986
Perth, the capital of Western Australia, has little heavy industry with its light industry scattered over a wide area, commonly adjacent to garden, dormitory suburbs. the heavy industrial area is at Kwinana, 30 km southsouthwest from the city centre (see Figure 1), At Kwinana nickel and aluminium smelters, oil refineries, chemical plants, and power stations contribute to air pollution.
The katabatic easterly winds characteristic of early summer mornings tend to carry the effiuent from Kwinana out to sea. Later the sea breezes from the west and south-west may bring the odour of the Kwinana industrial area with them, particularly to Fremantle. The strong breezes of summer, which are a feature .of the local weather, tend to disperse the industrial pollution and the rains of winter act as a scrubber. However, the alternation of katabatic winds from the east and westerly seabreezes, at times cause the same parcel of air to return to the city.
21
Figure 2.-Topograhy of the concentration distribution for fine mass particle concentration (FPMC), sulfur dioxide (S02), and total nitrogen oxides (NOx) in Perth, viewed from the north-west, the area depicted corresponds with that on Figure I.
There are times during the equinoxes and also the summer when a brown haze develops. Pollution from industry undoubtedly contributes to this haze, but much of it is generated by the exhaust from motor vehicles. Perth has more motor vehicles per head of population than any other city in Australia. Perth also boasts the highest emissions (HC, CO, NOx, Pb) per person of any Australian city (Kenworthy and Newman 1984).
Material and methods Sampling sources
Pollutants of various sources were sampled using Whatman 41 filter papers in a fixed flow sampler placed at a "convenient" distance from the source. In the case of petrol and diesel motors this was one metre behind the exhaust outlet. Bush fire smoke was sampled from a distance of about 10 m. Particles emitted from cement works, brickworks, and power stations were sampled from the stack. The concentration of the exhausts sampled was not uniform, and the very high values of trace elements obtained from the cement works and the hospital incinerator are due to higher concentrations at the sampling port.
Another very important source along the coast, which was not sampled, is the ocean, a major source of sodium and to a lesser degree potassium and calcium (Ratio Na:K:Ca ~ 25:1:1).
Sampling ambient air The sampling was performed sequentially at 23 sites
(see Figure 1) during the Summer of 1985 between mid January and mid March. At each site the apparatus was run for 24 hours, to include a diurnal cycle. Sites were chosen to give a wide area coverage of the city, including as great a variety of different environments as possible.
., •I ,, .,,
;; If
" :~ '1

Journal of the Royal Society of Western Australia. Vol. 69. Part I. 1986
The same set of instruments was set up at each site. A nephelometer was used to measure the light scattering due to particles, a high volume sampler· collected suspended dust, SOrconcentrations were obtained by batch absorption method (physico-chemical analytical procedure), and a similar absorption method was applied to measure the concentration ofNOx
A nephelometer (Ahlquist and Carlson 1976) was used for the fine particle mass concentration (FPMC). In principle the integrating nephelometer uses the method oflight scattering, where air is drawn through a chamber in which the integrated light scattering coefficient (bscat) is measured (Heggie and Hawke 1984). The wavelength used (525 nm) is appropriate for the fine particles. The scattering coefficient is measured by illuminating a sample of air and detecting the amount of light scattered over a wide angle. Particles in the 0.2-1 1-Lm range of diameter are the most efficient at scattering light (Waggoneretal. 1981).
To negate the effects of atmospheric moisture a sample air inlet heater was used, equipped with a temperature control circuit to prevent alteration of the aerosol due to excessive heat.
The analog output of the nephelometer was connected to an analog-to-digital converter and the data were stored by a real time data logging system (NEC PC-8201A). One value was read every second. The mean, the standard deviation, the maximum and the minimum value were calculated by the microprocessor at ten minute intervals and stored.
The calculation of FPMC using the bscat values requires some knowledge of the chemical and physical structure of the aerosol (Heggie and Hawke 1984). In the absence of such detailed information, the approximate formula from the nephelometer manual (Meteorology Research Inc. 1979) may be used:
FPMC ~ 0.38 bscatg m-3
Standard high volume samples were obtained using a unit manufactured by Control Engineering Services. The samples were obtained by drawing air at a rate of 60m3 per hour through a cellulose filter paper. This Whatman 41 filter was chosen for its low content of trace elements. It was found in earlier studies (Robertson et a!. 1985), that silica based papers contain unacceptabily high amounts of potassium and calcium, two elements under study. The samples were processed by dissolving the filter papers in a nitric acid solution, which was subsequently filtered and analyzed.
The metal components of each solution were determined by atomic absorption spectroscopy. The absorbance of each sample was compared to that of standard metal solutions. Copper, lead and zinc needed no additional pre-treatment and were read directly using the air/acetylene flame. Calcium solutions, however were aspirated in a nitrous oxide/acetylene flame and required the addition of potassium in order to overcome ionisation interference. Sodium and potassium were determined from the solutions by standard flame photometric emission techniques.
The concentration of S02 and NOx in the air was determined by drawing air through chemical solutions in absorbers; the solutions react with the gaseous pollutants. The solution used for absorbing the S02 was
22
potassium tetrachloromercurate (TCM), which resists oxygenation in the air. Thereafter the complex reacts with pararosaniline and formaldehyde to form intensely coloured pararosaniline methyl sulfonic acid. The absorbance of the solution was measured photospectrometrically (548 nm with an effective spectral bandwidth of less than 15 nm) (see Scaringelli et a/.1967).
Nitrogen dioxides were collected by bubbling air through a potassium permanganate solution in series with a sodium hydroxide solution to form a stable solution of sodium nitrite. The potassium permanganate solution was used to oxidize the NO to N02• The nitrite ion produced during the sampling is determined colorimetrically by reacting the exposed absorbing reagent with phosphoric acid, sulfanilamide and N-1 naphtylenediamine dihydrochloride (Huygen and Steerman 1971).
Meterorological data for this period were obtained from a central weather station and related to the measured concentrations.
The effect of the weather The weather at the time of sampling can have an
important effect on dust sampling. The greater the turbulence, the more dispersed the dust becomes. The nearest wind measurements were taken from the Perth airport records; Table 6 gives a summary of the wind conditions. During a single day the wind velocity ranged widely, with most days containing periods of calm and other periods of fresh breezes. The maximum windspeed during sampling at the sites varied by a factor of 2 and the mean values by a factor of 4.
The predominant wind direction throughout January was from the south west, whereas during February and early March winds from the south and east were also common. The winds displayed the typical summer pattern for most of the survey, with morning easterlies giving way later in the day to sea breezes from the south west. The mean temperatures were high in January, building up to a climax through February (see Table 2). This consistent summer pattern made the sampling conditions similar for most of the 24 hour periods over which each site was sampled, even though comparative data of single days is subject to a high possibility of interpretation error. This limits the accuracy of the graphical display of the areal distribution for the traceelement distribution, FPMC, S02> and NOx in the contour and surface plots (Figures 2 and 3).
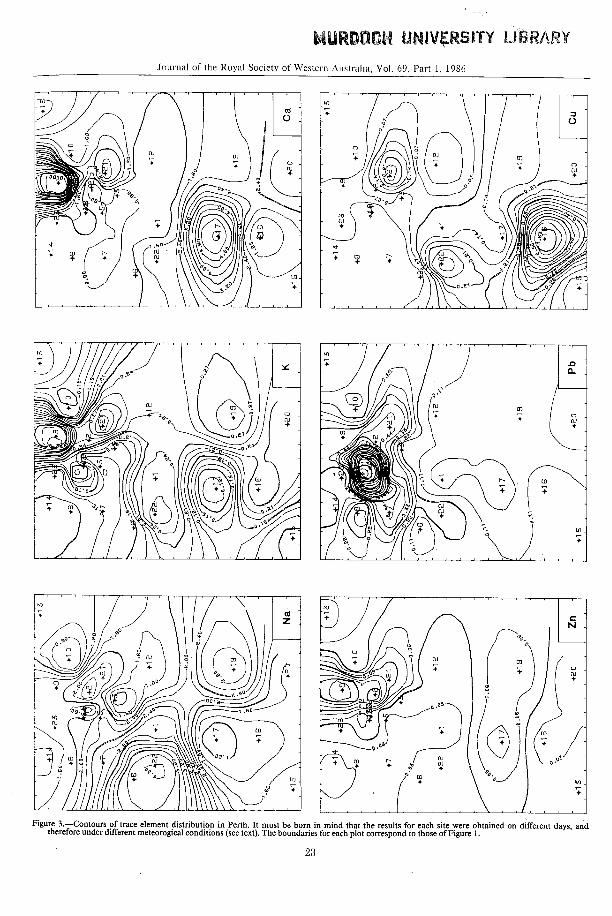
Results The trace-element results for the sites are shown in
Table 1 and Figure 3. The most obvious causal relationship appears between lead and the CBD area. Judging by the high lead concentrations in the petrol engine sources (Table 4), the CBD lead pollution can be attributed to contamination from the exhausts of petrol engines. This should be reduced as legislation comes into effect (as the cars complying with ADR 37 running on unleaded petrol come in wider use). The CBD is the only area which exceeded I. 5 {Lg m-3 on the day of sampling, but Raven and O'Connor (I 985) measured Pb-levels up to 3 {Lg m-3 in the winter period.
"' +
MURDOCH UNIV~RSITY USRARY
Journal of the Royal Society of Western Australia, Vol. 69, Part 1, 1986
Figure 3.-Contours of trace element distribution in Perth. It must be born in mind that the results for each site were obtained on different days, and therefore under different meteorogical conditions (see text). The boundaries for each plot correspond to those of Figure 1.
23

Journal of the Royal Society of Western Australia, VoL 69, Part I, !986
Table 1
The results of atomic absorption spectrophotometric analysis of six elements from 23 sites are given in micrograms per cubic metre of air sampled. The fine particle mass concentration in micrograms per cubic metre, obtained by the nephelometer, is also given (see also text).
FPMC
Code Site Na K Ca Cu Pb Zn fJ.g/m3
fJ.g/m3 fJ.g/m3 fJ.g/m3 fJ.g/m3 fJ.g/m3 fJ.g/m3 (24 hour avdgage)
01 A Murdoch ""'''"""'" 2.69 ± 0.07 0.25 ± 0.01 0.97 ± O.D7 0.12 ± 0,01 0.04 ± 0.01 0.02 ± 0.01 15 02 B Rivervale ................ 2.41 ± 0.06 o.2s ±om 3.26 ± 0.11 0.09 ± 0.01 0.47 ± 0.01 0.16 ± 0.01 129 03 c Bentley ................... 1.01 ± 0.03 0.17 ± 0.01 0.63 ± 0.02 0.06 ± 0.01 0.09 ± 0.01 0.03 ± 0.01 144 04 D CBD 57 Murray ..... 0.46 ± 0.01 0.08 ± 0.01 0.66 ± 0.02 0,0[ ± 0.01 0.85 ± 0.01 0.04 ± 0.01 -05 E S Perth .................... 2.44 ± 0.06 0.14 ± 0.01 0.71 ± 0.02 0.00 ± 0.01 0.24 ± 0.01 0.02 ± 0.01 91 06 F N Fremantle ...... ,,. 3.92 ± 0.10 0.17 ± 0.01 1.05 ± 0.03 0.00 ± 0.01 0.05 ± 0.01 0.04 ± 0.01 148 07 G Claremont .. , .......... 2.62 ± 0.07 0.15 ± 0.01 0.64 ± 0.02 0.00 ± 0.01 0.46 ± 0.01 0.02 ± 0.01 118 08 H Florea!,, ......... , .... 1.76 ± 0.05 0.13 ± 0.01 0.88 ± 0.02 0.00 ± 0.01 0.04 ± 0.01 0.02 ± O.Dl 114 09 I Bayswater ................ 1.78 ± 0.05 0.41 ± 0.01 9.89 ± 0.29 0.04 ± 0.01 0.35 ± O.Ql 0.16 ± 0.01 182 lO J Redcliffe., ............... 0.54 ± 0.01 0.12 ± 0.01 I.IO ± 0.03 0.00 ± O.Ql 0.09 ± 0.01 0.03 ± 0.01 61 11 K Chidlow , ............... 3.02 ± 0.08 0.20 ± 0.01 0.77 ± 0.02 0.01 ± 0.01 0.06 ± 0.01 0.04 ± 0.01 167 12 L Thornlie .................. L56 ± 0.04 0.24 ± 0.01 0.85 ± 0.02 0.00 ± 0.01 0.08 ± 0.01 0.04 ± 0.01 129 13 M Swanview .............. 1.14±0.03 0.10 ± 0.01 0.34 ± 0.01 0.00 ± 0.01 0.06 ± 0.01 0.01 ± 0.01 110 14 N Doubleview ............ 1.29 ± 0.04 0.13 ± 0.01 0.89 ± 0.03 0.01 ± 0.01 0.38 ± O.Ql 0.04 ± 0.01 -15 0 Rockingham.,, ...... 1.68 ± 0.04 0.13±0.01 2.03 ± 0.09 0.15 ± 0.01 0.12 ± 0.01 0.04 ± 0.01 99 16 p Orelia ...................... 1.30 ± 0.04 0.24 ± 0.01 I.l4 ± 0.07 0.67 ± 0.02 0.14 ± 0.01 0.02 ± 0.01 84 17 Q Bangenup ......... , .... 1.07 ± 0.03 0.11±0.01 5.71 ± 0.19 0.12 ± 0.01 0.04 ± 0.01 0.08 ± 0.01 91
R CBD W Queens 18 Bdg ............................ 2.71 ± 0.07 0.34 ± 0.01 2.16 ± 0.11 0.02 ± 0.01 1.94 ± 0.05 0.08 ± 0.01 218 19 s Arrnadale Dump ..... 2.92 ± 0.08 0.29 ± 0.01 1.81 ± 0.10 0.16 ± 0.01 0.07 ± 0.01 0.07 ± 0.01 247 20 T Mundijong .............. L55 ± 0.04 0.21 ± 0.01 3.07 ± 0.12 0.20 ± 0.01 0.04 ± O.Dl 0.02 ± O.Ql 224 21 u Kewdale ................. 2.13±0.06 0.31 ± 0.01 3.20 ± 0.13 0.27 ± 0.01 0.48 ± 0.01 0.10 ± 0.01 !890 22 v Beaconsfield ........... 4.09 ± 0.10 0.27 ± 0.01 2,01 ± 0.09 0.32 ± 0.01 0.22 ± 0.01 0.04 ± 0.01 243 23 w Joondanna ............. 1.64 ± 0.04 0.14 ±0.01 0.71 ± 0.06 0.06 ± 0.01 0.25 ± 0.01 0.04 ± O.ot 194
Judged by the source results, the zinc peak to the east of the city could result from the hospital incinerator burning. Bush fires and cement works can be seen as sources of potassium, and the weak peaks down the east centre of the map (Figure 3 - K) may result from a combination of both these sources in addition to K from seaspray, No source for copper was found (see Table 4), but the small peaks at Orelia, Kewdale and South Fremantle appear to be associated with industrial areas.
Both bush fires and cement works are seen to be sources for calcium in the air (Table 4) and cannot be separated. However, cement works are considered to be a relatively continuous source, whereas bush fires are highly erratic. The peak at Banganup (site 17 in Figure 1) appears to be caused by proximity to the Cockburn cement works.
Site code
I 2 3 4 5 6 7 8 9
lO 11 12 13 14 15 16 17 18 19 20 21 22 23
There were a number of outbreaks of bush fires, due to high temperatures in February (see Table 2), which at times increased the number of particles in the air over
Table 2 Measured so2 and NOx concentration for a 24 hour sampling period at each site (in micrograms per cubic metre).
Daily average temperature on the days of sampling; obtained from the meteorology station at the airport.
Date Locality so2 NOx Temp.
fJ.gm-3 p.gm-3 "C
10.1.85 Murdoch 1.2 19 23 14.1.85 Rivervale N.D. 12 20 16.1.85 Bentley 0.8 10 25 17.1.85 C.B.D.E. 57 Murray Street 1.7 32 25 22.1.85 South Perth Zoo 1.6 45 21 23.1.85 North Fremantle 4.1 37 26 24.1.85 Claremont 1.0 62 22 29.1.85 City Beach Bold Park 1.1 16 19 30.1.85 Bayswater 1.1 51 24 31.1.85 Redcliffe N.D. 20 29 2.2.85 Chidlow (off map) N.D. 15 22 5.2.85 Thornlie 1.9 32 28 6.2.85 Swan view N.D. 10 29 8.2.85 Doubleview 3.5 15 28
12.2.85 Rockingham 1.3 15 29 13.2.85 Orelia 2.4 6 34 14.2.85 Bangenup 3.5 7 28 19.2.85 C.B.D. W. Queen's Bdg 14.3 94 32 20.2.85 Arrnadale Tip 1.3 14 33 23.2.85 Mundijong 1.4 27 29 26.2.85 Kewdale 8.4 11 31
5.3.85 Beaconsfield 1.0 13 29 7.3.85 Joondanna 1.3 26 21
N.D. not detectable
24

Journal of the Royal Society of Western Australia, Vol. 69, Part 1, 1986
Table 3 Atomic absorption spectrophotometric analyses of sources are given for six elements in micrograms per cubic metre. The samples were obtained placing fixed flow samplers in the vicinity of the source (see text). Where all the elements are high, as they are for the cement works, it is likely that a more concentrated sample ofthe source was taken.
Sample Site Na K Ca Cu Pb Zn
fJ.g/ m3 fJ.g/ m3 fJ.g/m3 fJ.gim3 fJ.g/m3 fJ.g/ m3
PETROL 5.8 A 4.12±0.33 1.18±0.14 5.29±0.24 0.27±0.07 449±12 0.82±0.08 5.9 B 2.35±0.17 0.59±0.07 3.38±0.13 0.00±0.01 460± 12 0.74±0.05 5.10 c 3.14±0.23 1.57±0.11 4.12±0.17 0.00±0.01 474± 12 0.71±0.05 5.11 D 7.06±0.64 3.53±0.31 9.41 ±0.45 0.00±0.01 421±13 3.06±0.18
DIESEL 5.5 B 11.8±0.66 11.8±0.4 13.4±0.49 0.69±0.11 1.77±0.24 4.31±0.19 6.5 c 4.90±0.51 1.96±0.2 - 0.00±0.01 1.28±0.23 30.4±0.74 7.5 D 7.84±0.57 9.80±0.40 - 0.88±0.12 4.80±0.30 4.31±0.19 3.5 IE 2.35±0.56 1.18±0.2 4.35±0.59 0.00±0.01 2.35±0.29 0.59±0.13 3.6 2E 7.84±0.73 13.1±0.54 3.27±0.62 1.05±0.16 2.61 ±0.32 0.65±0.15 3.7 3E 4.71±0.59 2.35±0.29 2.94±0.56 0.00±0.01 0.59±0.25 0.82±0.14 3.8 4E 7.06±0.66 9.41±0.44 5.88±0.62 1.88±0.16 2.35±0.29 0.82±0.14 6.8 DE 9.41±0.69 4.7±0.3 8.94±0.43 0.59±0.13 0.00±0.01 2.47±0.17
COAL FIRED 6.3 A 2.16±0.13 1.96±0.08 1.57±0.07 0.06±0.02 0.00±0.01 0.77±0.04 6.4 B 4.31 ±0.25 1.96±0.12 3.80±0.16 0.01±0.01 0.00±0.01 1.14±0.06 6.5 c 6.27±0.30 3.14±0.15 23.8±0.58 0.31±0.05 0.51 ±0.09 7.84±0.21 6.6 D 3.14±0.23 1.57±0.11 5.33±0.19 0.29±0.04 0.00±0.01 2.90±0.10 6.7 E 1.76±0.12 2.55±0.09 1.88±0.08 0.10±0.02 0.00±0.01 1.02±0.04
BUSH FIRES 5.1 A 61.2±1.8 142±3.2 152±3.5 2.18±0.17 2,12±0.29 5.29±0.23 5:2 B 17.6±0.9 17.6±0.6 22.9±0.7 1.06±0.14 1.52±0.28 2.12±0.16 5.3 c 67.1±1.9 222±4.9 32.4±0.9 0.00±0.01 0.59±0.26 2.25±0.17 6.1 D 70.2±1.6 108±2.4 248±6.5 0.31±0.01 0.00±0.01 3.57±0.12 6.2 E 49.0±1.2 79.2±1.7 141±3.9 0.29±0.04 0.00±0.01 0.67±0.05
CEMENT WORKS 4.1 CEI 400±9.1 4400±110 1590± 78 1.91±0.20 9.56±0.50 10.6±0.53 4.2 CE2 435±9.8 4720±120 2300±95 2.35±0.20 12.1 ±0.56 13.5±0.59 4.3 CE3 290±6.5 3190±80 1190±55 1.57±0.13 8.43±0.38 9.02±0.39 4.4 CE4 586± 16.6 5820± 140 1870± 72 1.77±0.14 11.2±0.44 7.65±0.36 4.5 CE5 460± 10.3 5000± 126 1930±86 0.44±0.16 11.5±0.54 7.06±0.05 4.6 CE6 596±13.4 5900±149 3870± 140 4.31±0.29 18.4±0.79 47.8±1.41
BRICKWORKS 9.1 MBI 1.02±0.04 0.88±0.03 2.82±0.08 0.08±0.01 0.22±0.01 0.49±0.02 9.2 MB2 2.02±0.06 1.03±0.03 1.89±0.10 0.06±0.01 0.34±0.01 1.03±0.03 9.3 MB3 0.27±0.03 0.59±0.02 0.90±0.04 0.00±0.01 0.09±0.01 0.43±0.01 9.4 MB4 0.00±0.00 0.27±0.01 0.40±0.03 0.01±0.01 0.07±0.01 0.31±0.01
-
Table 4 Sources diagnostic clements shows the mean and standard deviation (S.D.) of each group of samples taken from the six sources listed in Table 3. Also shown are earlier results from household and hospital incinerators in which insufficient samples were obtained to yield a standard deviation.
Source Na K Ca Cu Pb Zn
fJ-g/m3 S.D. l'-g/m3 S.D. p.g!m3 S.D. fJ-g/m3 S.D. j.tg/m3 S.D. fJ-g/m3 S.D.
PETROL 4.17 2.06 1.72 1.27 5.55 2.69 0.07 0.13 450.6 22.4 1.33 1.15 4 Samples
DIESEL 6.98 2.96 6.78 4.77 6.47* 4.05 0.64 0.65 1.97 1.47 5.54 10.2 8 Samples
COAL FIRED 3.53 1.82 2.24 0.61 7.28 9.38 0.13 0.12 0.10 0.23 2.73 2.98 5 Samples
BUSH FIRES 53.02 21.37 114.0 75.9 119.0 93.5 0.75 0.89 0.85 0.95 2.78 1.74 5 Samples
CEMENT WORKS 461 116 4840 1000 2110 908 2.06 1.28 11.9 3.49 16.0 15.9 6 Samples
BRICKWORKS 0.83 0.90 0.69 0.34 !.50 1.07 O.D3 0.04 0.18 0.13 0.56 0.32 4 Samples
HOUSEHOLD INCINERATOR 26.7 - 21.6 - 21.6 - 0.54 - 5.40 - 8.08 -
2 Samples
HOSPITAL INCINERATOR 5590 - 3610 - 900 - 123 - 1000 - 6500 -
2 Samples - - L__
*6 samples
25

Journal of the Royal Society of Western Australia, Vol. 69, Part I, 1986
TableS
Atomic absorption spectrophotometric analyses of six elements are ~ven for the six sites that were sampled twice. Series 1 was sampled before Chrismas in 1984 and Senes 2 during January and February 1985. The vertical arrows indicate an increase of pollution from series 1 to series 2. Excellent within-site agreement is shown in bold and a good agreement by italics. Strong reverse trends, such as calcium for Arrnadale (site was near dumping area), are thought to have been caused by some special, but unknown circumstance.
Na K Site {'g/m3 error J.<.g/m3 error
RAAF CLAREMONT 1 g:~i J :8:8~ 0.041 ~ ±0.002 2 0.150 ±0.004
WAIT Bentley 1 1.36 ±0.04 o.o41 I ±O.oo2 1 2.16 ±0.06 0.123 ±0.003 2 1.02 ±0.03 0.173 ±0.004
Rockingham 1 2.69 ±0.07 0.233 ±0.006 2 1.68 ±0.04 0.132 ±0.003
Orelia I 3.16 ±0.08 0.286 ±0.007 2 1.30 ±0.04 0.242 ±0.006
Arrnadale Dump I g:~i J :8:8~ 0.292 ±0.007 2 0.291 ±0.007
Queen's Bldg I 0.84' ±0.02 0.056 ' ±0.001 2 2.71 ±0.07 0.337 ±0.008
the city. A serious bush fire on February 26 had a marked effect on parts of the city, and was a contributary cause to the very high particle count obtained at Kewdale (site 21) at that time (see Table 1). For this reason this site caused a high peak in the graphic display of Figure 2-FPMC. Not included in the plottings is the site in Chidlow (site 11) because it is off the map in Figure 1; this site was rather considered to be a control spot in an almost rural "clean air" area outside the city. Some of the FPMC values are doubtful due to instrumentation problems.
Some of the trace elements show a sympathetic relationship. Thus Zn and K are significantly correlated (r~0.65, P<O.Ol); both are known to be derived from the
Ca Cu Pb Zn {'g/m3 error f<g/m3 error p.g;m3 error p.glm3 error
0.45 ±0.01 0.097 ±0.002 o.157 I ±O.oo4 0.017 ±0.001 0.64 ±0.02 0.002 ±0.001 0.463 ±0.013 0.018 ±0.001
0.191 ±0.01 0.004 ~ ±0.001 0.071 ±0.001 0.005' ±0.001 0.26 ±0.01 0.004 ±0.001 0.093 ±0.002 0.007 ±0.001 0.63 ±0.02 0.062 ±0.002 0.086 ±0.002 0.031 ±0.001
o.1o I ±0.02 2.03 ±0.09
0.050 J ±0.002 0.148 ±0.003
0.059 J ±0.002 0.116 ±0.003
o.ou I ±o.oo1 0.041 ±0.001
0.96 ±0.02 0.207 J ±0.005 0.052 J ±0.002 0.027 ±0.001 1.14 ±0.07 0.668 ±0.018 0.138 ±0.003 0.023 ±0.001
3.18 ±0.09 0.186 ±0.004 0.067 ±0.002 0.021 J ±0.001 1.81 ±0.10 0.156 ±0.003 0.067 ±0.002 0.067 ±0.002
0.34' ±0.01 0.045 ±0.001 0.4881 ±0.013 0.016 ±0.001 2.16 ±0.11 0.016 ±0.001 1.938 ±0.045 0.016 ±0.001
emissions of incinerators. As mentioned above car traffic and its pollutants (Pb, NOx) shows the highest concentrations in the CBD, and as a result Pb and NOx correlate with a coefficient ofO. 73 (p<O.Ol).
In comparison with a previous sampling (December 1984) some of the trace element concentrations increased-see Table 5.
Conclusions The trace element results link lead to petrol engines,
calcium to cement works, potassium to bush fires and cement works, and zinc to hospital incinerators. The contour maps of these elements for Perth show that none
Table6
Daily average windspeed, maximum wind speed, gusts and predominant wind direction on the days of sampling. The data were obtained at the meterological station at the Perth airport
Site Date Mean Speed Max Speed Gusts Direction in knots in knots range Murdoch 10.1.85 6 20 No SWSteady Rivervale 14.1.85 7 28 Yes SE-SW-SE Bentley 16.1.85 15 41 Yes E Steady CBDE 17.1.85 11 36 Yes SE-S S Perth (Zoo) 22.1.85 7 26 Yes Main1ySW NFremantle 23.1.85 5 20 Inter Main1ySW Claremont 24.1.85 6 25 Yes SWSteady Floreat 29.1.85 6 26 Yes sw-s Bayswater 30.1.85 8 28 Yes SE-SW-SE Redcliffe (Airport) 31.1.85 7 25 Inter MainlyNE Chidlow (Off Map) 2.2.85 8 25 Inter SWSteady Thomlie 5.2.85 10 35 Yes SE Swan view 6.2.85 11 29 Yes E Steady Doubleview 8.2.85 4 22 Inter S Variable Rockingham 12.2.85 8 27 Yes E-sw-E Orelia 13.2.85 5 25 Inter E Variable Bangenup 14.2.85 10 31 Yes MainlyS CBDW 19.2.85 4 20 No SWVar-E Arrnadale Tip 20.2.85 8 16 No MainlySWVar Mundijong 23.2.85 4 20 No E-w-s-E-SE Kewdale 26.2.85 5 21 Inter N-w-s-EVar Beaconsfield 5.3.85 4 20 Inter SWVariab1e Joondanna 7.3.85 6 23 Yes SE-w-s
The mean and maximum velocities were taken from approximately 0830 on the stated date until about 0830 on the following day. Gusts inter-intermediate, some gusts experienced during the course of the day.
26

Journal of the Royal Society of Western Australia. VoL 6~. Part I. I n6
of these sources of air pollution are out of control at the present time, although all should be considered in any plans to keep Perth air clean. Sulphur dioxide and nitrogen oxides levels are low in the suburbs, but less so in the CBD and near industrial areas.
The SOrvalues are, compared with overseas cities, very low. A WHO study group (World Health Organization 1979) establishing limits for S0
2 concentrations recommended yearly arithmetic means are kept below 40 - 60 jl-g m-3 so2 to prevent health problems due to long term exposure; Perth's S02 levels fortunately are not even near this limit (Table 2).
Some of the nephelometer readings were erratic, therefore a comparison of the FPMC with other cities would be unreliable.
Although the area coverage for this study was satisfactory, it would be desirable for future surveys to monitor the air pollution at all sites simultaniously in order to reduce meteorlolgical influences.
Perth is not a city as yet plagued with air pollution problems. It is still a far cry from Tokyo, Los Angeles or Sydney (Milne et a!. 1983, Roberts et a!. 1983) in the contamination of the air its inhabitants have to breathe. Located in an area with a comparable climate to Los Angeles with high sun intensities, the trapping of poisonous products and the production of photochemical smog could become a serious problem. Increasing traffic density, more heavy industry, greater incineration of waste, and salt from the sea, all tend to promote photochemical smog for the future.
Acknowledgements.-We would like to thank the Western Mining Corporation and the Air Quality Branch of the Department of Conservation and Environment for funding the research that made this paper possible. Our thanks go to Dr. Bill Scott. Dr. Tom Lyons and Mr. Jeff Kenworthy who read a draft of the paper and made suggestions for its improvement. We also would like to thank Mr. Allan Scott. who gave us the meteorological data used; we thank Mr. Mike Welton and Mr. Eugene Tulimowski for keeping the instruments operational under difficult circumstances. Especial thanks go to Mr. Graham Smith, whose ingenuity in finding sample sites knew no bounds, and who operated the so2 and NOx apparatus with great efficiency. Finally we wish to thank Professor O'Connor and Mr. Ron Powell, under whose auspices this research was undertaken.
27
References Ahlquist, N, C, and Carlson, R. J, (1976).-A new instrument for
evaluating the visual quality of air. J. Air Pollut. Control Ass., 17; 467.
Bottomley, G. A. and Boujois, L P. ( 1975)-Lead in soil of Hierrisson Island, Western Australia. Search. 6: 389.
Bottomley, G. A. and Cattel, F. C (1975).-Nitrogen oxide levels in suburbs of Perth, Western Australia. J. Roy, Soc. W.A .. 58: 65.
Gatz, D. F. (1975).-Relative contributions of different sources of urban aerosols: Application of a new estimation method to multiple sites in Chicago. At mos. Em•ir. 9: I.
Heggie, A. C and Hawke, G. S. (1984).-Air quality monitoring using integrating nephelometers: Operational considerations and data interpretation. Clean Air, 18: 42.
Huygen, C and Steerrnan, P. H. (1971).-The determination of nitrogen dioxide in air after absorption in a modified alkaline solution. Almas. Em•ir., 5: 887.
Kenworthy, J. R. and Newman, P. W. G. ( 1984).-Motor vehicle emissions inventories: A review of methodology, application and potential for Australian cities. Transport research paper 4/84. Environmental Science, Murdoch University.
Kwinana Air Modelling Study ( 1982).-The Department of Conservation and Environment, Perth, Western Australia. Report I 0.
Meteorology Research Inc. (1979).-Handbook Integrating Nephelometer and Recorder, Model 1550b and System 2050b, Altadena, California.
Milne, J. W., Roberts, D. B., Walker, S. J. and Williams, D. J. (1983).-Sources of Sydney Brown Haze. The Urban Atmosphere, Sydney, a case study. CSIRO Division of Fossil Fuels.
O'Connor, B. H., Chang, W. J. and Martin, D. J. (1981).-Chemical characterisation of atmospheric aerosol in Perth, Western Australia. Proc. of the seventh int. clean air conf., Adelaide.
Raven, M. D. and O'Connor, B. H. ( 1985).-Monitoring of airborne lead levels in Perth by X-ray flourescence spectrometry. Australian Association, W.A. Branch.
Roberts, D. B., Milne, J. W., Jones, D. J. A., Cosstick, R. J. and Williams, D. J. (1983).-The chemical Composition of Sydney Brown Haze. The Urban Atmosphere, Sydney, a case study. CSIRO Division of Fossil Fuels.
Robertson, W. A., Lax, F., and Garkaklis, B. V. ( 1985).-How clean is the air in Perth'? A preliminary investigation. Clean Air, Nov.: 118.
Scaringgelli, F. P., Salzman, B. E. and Frey, S. A. ( 1967).-Spectrometric determination of atmospheric Sulfur dioxide. Anal. Chem .. 39: 1709.
Waggoner, A. P., Weiss, R. E., Alquist, N. C., Covert, D. S., Will, S. and Charlson, R. J. ( 1981 ).-Optical characteristics of atmospheric aerosols. Armas. Em•ir .. 15: 1891.
Watson, L D. ( 1984).-Roadside air pollution: Carbon monoxide. Western Geographer, 8: 53.
Williams, D. J., Milne, J. W., Roberts, D. B., Phillip, D. H., Jones, D. J. A. and Cosstick, R. ( 1981 )-The nature and origin of Sydney Brown Haze. CSIRO Investigation Report 1205 R.
World Health Or~anization ( 1979).-Environmental Health Criteria 8. Sulfur Oxtdes and Suspended Particular Matter, Geneva.