Air, Noise, and Light Monitoring Results For Assessing...
206
Air, Noise, and Light Monitoring Results For Assessing Environmental Impacts of Horizontal Gas Well Drilling Operations (ETD‐10 Project) Prepared for: West Virginia Department of Environmental Protection Division of Air Quality 601 57 th Street, SE Charleston, WV 25304 Submitted by: Michael McCawley, PhD West Virginia University School of Public Health PO Box 9190 Morgantown, WV 26506 May 3, 2013
Transcript of Air, Noise, and Light Monitoring Results For Assessing...
Air, Noise, and Light Monitoring Results
For
Assessing Environmental Impacts of Horizontal Gas Well Drilling Operations
(ETD‐10 Project)
Prepared for:
West Virginia Department of Environmental Protection
Division of Air Quality
601 57th Street, SE
Charleston, WV 25304
Submitted by:
Michael McCawley, PhD
West Virginia University
School of Public Health
PO Box 9190
Morgantown, WV 26506
May 3, 2013
i
Table of Contents page
Executive Summary………………………………………………………………………………………………………… 2
1.0 Background………………………………………………………………………………………………………………. 4
2.0 Interpretation of Potential Health Effects from Exposures Found in the Study…………. 17
3.0 Conclusions and Recommendations………………………………………………………………………… 19
4.0 Sampling Site Results………………………………………………………………………………………………. 23
5.0 References……………………………………………………………………………………………………………… 129
Appendix A ATSDR MRL values…………………………………………………………………………….. 131
Appendix B SUMMA Canister results with HQ and HI values…………………………………. 144
Appendix C Meteorology Data………………………………………………………………………………. 163
Appendix D Results From Other Studies……………………. …………………………………………. 183
Appendix E Setback Regulation Summary…………………………………………………………….. 187
Appendix F Dust Track Correction Factors………………………………………………………………. 193
ii
LIST OF TABLES page
Table 1.0 National Ambient Air Quality Standards established by the EPA …………………………. 6
Table 1.0.1 Typical Activities and the Associated Noise Level……………………………………………… 12
Table 1.0.2 Perceptions of Increases in Decibel Level…………………………………………………………. 13
Table 1.0.3 Maximum Noise Emission Levels………………………………………………………………………. 14
Table 1.0.4 Examples of Illumination and the accompanying amount of Illuminance………….. 15
Table 1.0.5 Risk of Lung Cancer for Smokers and Nonsmokers from Radiation Exposure……. 16
Table 4.0.1 Summary List of Hydrocarbons detected by GC‐FID in ppb………………………………. 25
Table 4.0.2 Summary of PM10 and PM2.5 levels measured by TEOM………………………………… 27
Table 4.0.3 Summary of Average sound levels (dBA)…………………………………………………………… 27
Table 4.0.4 Ammonia Values……………………………………………………………………………………………….. 27
Table 4.0.5 Range of Values for Gases by Location……………………………………………………………… 27
Table 4.0.6 PID Direct‐Reading Analysis of Hydrocarbons…………………………………………………… 28
Table 4.0.7 Airborne Radiation Levels………………………………………………………………………………... 29
Table 4.1 GC‐FID HC Results ‐ Donna Pad…………………………………………………………………………….. 33
Table 4.2 GC‐FID HC Results ‐ Weekley Pad…………………………………………………………………………. 46
Table 4.3 GC‐FID HC Results ‐ Mills Wetzel 2 Pad…………………………………………………………………. 61
Table 4.5 GC‐FID HC Results ‐ Maury Pad…………………………………………………………………………….. 78
Table 4.6 GC‐FID HC Results Lemons Pad……………………………………………………………………………… 101
Table 4.7 GC‐FID HC Results ‐ WV DNR Pad A……………………………………………………………………….. 118
iii
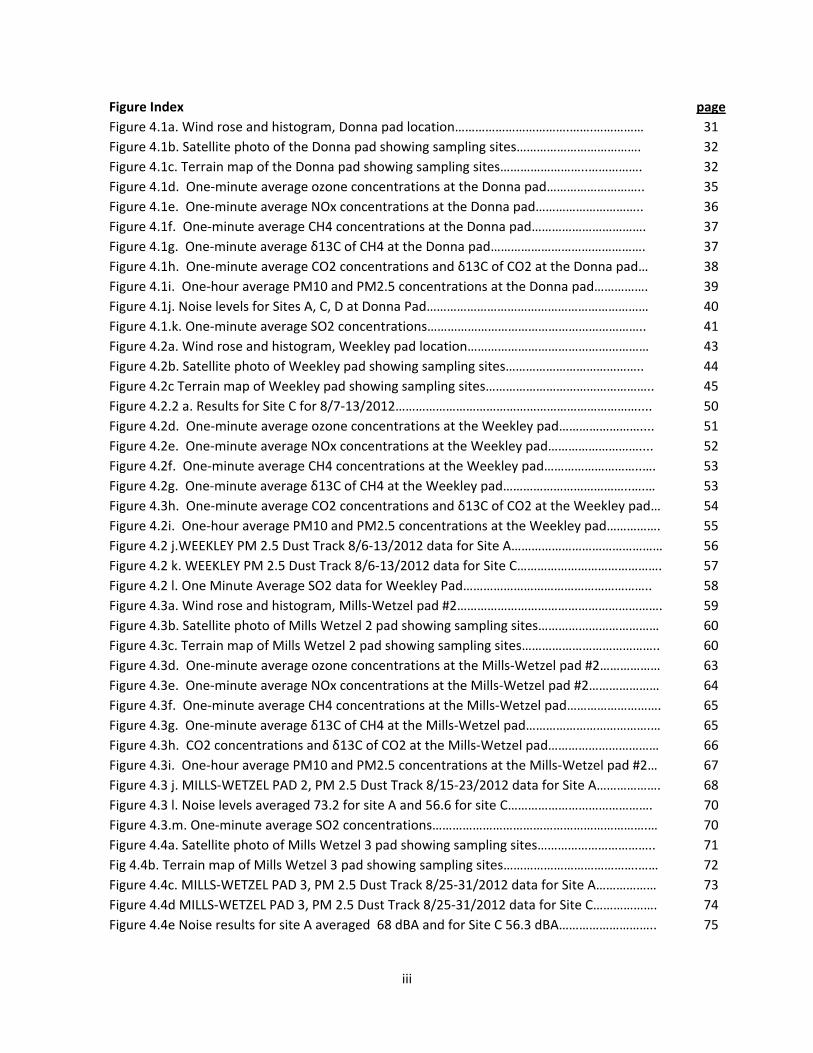
Figure Index page
Figure 4.1a. Wind rose and histogram, Donna pad location…………………………….…….…………… 31
Figure 4.1b. Satellite photo of the Donna pad showing sampling sites………………………………. 32
Figure 4.1c. Terrain map of the Donna pad showing sampling sites……………………..……………. 32
Figure 4.1d. One‐minute average ozone concentrations at the Donna pad……………………….. 35
Figure 4.1e. One‐minute average NOx concentrations at the Donna pad………………………….. 36
Figure 4.1f. One‐minute average CH4 concentrations at the Donna pad……………………………. 37
Figure 4.1g. One‐minute average δ13C of CH4 at the Donna pad………………………………………. 37
Figure 4.1h. One‐minute average CO2 concentrations and δ13C of CO2 at the Donna pad… 38
Figure 4.1i. One‐hour average PM10 and PM2.5 concentrations at the Donna pad……………. 39
Figure 4.1j. Noise levels for Sites A, C, D at Donna Pad………………………………………………………… 40
Figure 4.1.k. One‐minute average SO2 concentrations……………………………………………………….. 41
Figure 4.2a. Wind rose and histogram, Weekley pad location……………………………………………… 43
Figure 4.2b. Satellite photo of Weekley pad showing sampling sites………………………………….. 44
Figure 4.2c Terrain map of Weekley pad showing sampling sites………………………………………….. 45
Figure 4.2.2 a. Results for Site C for 8/7‐13/2012……………………………………………………………….... 50
Figure 4.2d. One‐minute average ozone concentrations at the Weekley pad…………………….... 51
Figure 4.2e. One‐minute average NOx concentrations at the Weekley pad……………………….... 52
Figure 4.2f. One‐minute average CH4 concentrations at the Weekley pad………………………..…. 53
Figure 4.2g. One‐minute average δ13C of CH4 at the Weekley pad………………………………..….… 53
Figure 4.3h. One‐minute average CO2 concentrations and δ13C of CO2 at the Weekley pad… 54
Figure 4.2i. One‐hour average PM10 and PM2.5 concentrations at the Weekley pad……………. 55
Figure 4.2 j.WEEKLEY PM 2.5 Dust Track 8/6‐13/2012 data for Site A……………………………………… 56
Figure 4.2 k. WEEKLEY PM 2.5 Dust Track 8/6‐13/2012 data for Site C……………………………………. 57
Figure 4.2 l. One Minute Average SO2 data for Weekley Pad……………………………………………….. 58
Figure 4.3a. Wind rose and histogram, Mills‐Wetzel pad #2……………………………………………………. 59
Figure 4.3b. Satellite photo of Mills Wetzel 2 pad showing sampling sites……………………………… 60
Figure 4.3c. Terrain map of Mills Wetzel 2 pad showing sampling sites………………………………….. 60
Figure 4.3d. One‐minute average ozone concentrations at the Mills‐Wetzel pad #2……………… 63
Figure 4.3e. One‐minute average NOx concentrations at the Mills‐Wetzel pad #2………………… 64
Figure 4.3f. One‐minute average CH4 concentrations at the Mills‐Wetzel pad………………………. 65
Figure 4.3g. One‐minute average δ13C of CH4 at the Mills‐Wetzel pad……………………………….… 65
Figure 4.3h. CO2 concentrations and δ13C of CO2 at the Mills‐Wetzel pad…………………………… 66
Figure 4.3i. One‐hour average PM10 and PM2.5 concentrations at the Mills‐Wetzel pad #2… 67
Figure 4.3 j. MILLS‐WETZEL PAD 2, PM 2.5 Dust Track 8/15‐23/2012 data for Site A………………. 68
Figure 4.3 l. Noise levels averaged 73.2 for site A and 56.6 for site C……………………………………. 70
Figure 4.3.m. One‐minute average SO2 concentrations……………………………………………………….… 70
Figure 4.4a. Satellite photo of Mills Wetzel 3 pad showing sampling sites…………………………….. 71
Fig 4.4b. Terrain map of Mills Wetzel 3 pad showing sampling sites………………………………….…… 72
Figure 4.4c. MILLS‐WETZEL PAD 3, PM 2.5 Dust Track 8/25‐31/2012 data for Site A……………… 73
Figure 4.4d MILLS‐WETZEL PAD 3, PM 2.5 Dust Track 8/25‐31/2012 data for Site C………………. 74
Figure 4.4e Noise results for site A averaged 68 dBA and for Site C 56.3 dBA……………………….. 75

iv
Figure Index Cont’d page
Figure 4.5a. Wind rose and histogram, Maury pad location…………………………………………………... 76
Figure 4.5b. Satellite photo of the Maury pad showing sampling sites…………………………………... 77
Figure 4.5c. Terrain map of the Maury pad showing sampling sites…………………………………..…… 78
Figure 4.5.2 a. PID data for Site B. ………….…….. ……………………………………………………………………… 82
Figure 4.5d. One‐minute average ozone concentrations for the first week at the Maury pad… 83
Figure 4.5e. One‐minute average ozone concentrations for the second week, Maury pad……. 83
Figure 4.5f. One‐minute average ozone concentrations for the third week at the Maury pad… 84
Figure 4.5g. One‐minute average ozone concentrations for the fourth week, Maury pad……... 84
Figure 4.5h. One‐minute average ozone concentrations for the fifth week at the Maury pad… 85
Figure 4.5i. One‐minute average NOx concentrations for the first week at the Maury pad……… 86
Figure 4.5j. One‐minute average NOx concentrations for the second week, Maury pad…………. 86
Figure 4.5k. One‐minute average NOx concentrations for the third week at the Maury pad…… 87
Figure 4.5l. One‐minute average NOx concentrations for the fourth week at the Maury pad….. 87
Figure 4.5m. One‐minute average NOx concentrations for the fifth week at the Maury pad…… 87
Figure 4.5n. One‐minute average CH4 concentrations at the Maury pad…………………………………. 88
Figure 4.5o. One‐minute average CH4 concentrations at the Maury pad……………………………….. 89
Figure 4.5p. One‐minute average δ13C of CH4 at the Maury pad…………………………………………… 90
Figure 4.5q. One‐minute average δ13C of CH4 at the Maury pad…………………………………………… 91
Figure 4.5r. One‐minute average CO2 concentrations and δ13C of CO2 at the Maury pad……. 91
Figure 4.5s. One‐minute average CO2 concentrations and δ13C of CO2 at the Maury pad…… 92
Figure 4.5t. One‐hour average PM10 and PM2.5 concentrations at the Maury pad………………. 93
Figure 4.5 u. Noise levels averaged 53.3 dBA for site B and 59.8 dBA for site D………………….. 94
Figure 4.5. v. One‐minute average SO2 concentrations for the Maury pad…………………………. 95
Figure 4.5. w. One‐minute average SO2 concentrations for the Maury pad…………………………. 95
Figure 4.5.x. One‐minute average SO2 concentrations for the Maury pad…………………………… 95
Figure 4.5.y. One‐minute average SO2 concentrations for the Maury pad………………………….. 96
Figure 4.5.z. One‐minute average SO2 concentrations for the Maury pad…………………………… 97
Figure 4.5.aa. Two‐hour average OC and EC concentrations for the Maury pad………………. 98
Figure 4.6a. Wind rose and histogram, the Lemons pad location……………………………………….. 99
Figure 4.6b. Satellite photo of the Lemon pad showing sampling sites………………………………. 100
Figure 4.6c. Terrain map of the Lemons pad showing sampling sites…………………………………. 100
Figure 4.6.2 a. PID results for 9/20‐27/2012 at Site A…………………………………………………………… 103
Figure 4.6.2 b. PID results for 9/20‐27/2012 and 10/1‐3/2012 at Site C………………………………. 104
Figure 4.6d. One‐minute average ozone concentrations for the first week, Lemons pad……. 105
Figure 4.6e. One‐minute average ozone concentrations for the second week, Lemons pad…. 105
Figure 4.6f. One‐minute average ozone concentrations for the third week, Lemons pad……… 106
Figure 4.6g. One‐minute average NOx concentrations for the first week, Lemons pad…………. 107
Figure 4.6h. One‐minute average NOx concentrations for the second week, Lemons pad…….. 107
Figure 4.6i. One‐minute average NOx concentrations for the third week at the Lemons pad…. 108

v
Figure Index Cont’d page
Figure 4.6j. One‐minute average CH4 concentrations at the Lemons pad………………………………. 109
Figure 4.6k. One‐minute average δ13C of CH4 at the Lemons pad………………………………………… 109
Figure 4.6l. One‐minute average CO2 concentrations and δ13C of CO2, Lemons pad…………… 110
Figure 4.6m. One‐hour average PM10 and PM2.5 concentrations at the Lemons pad…………. 111
Figure 4.6 n. Noise results for the period 9/20‐30/12 for Site C averaged 54 dBA………………… 112
Figure 4.6.o. One‐minute average SO2 concentrations for the Lemons pad……………………….. 113
Figure 4.6.p. One‐minute average SO2 concentrations for the Lemons pad……………………….. 114
Figure 4.6.q. One‐minute average SO2 concentrations for the Lemons pad……………………….. 115
Figure 4.6.r. Two‐hour average OC and EC concentrations for the Lemons pad……………………. 116
Figure 4.7a. Wind rose and histogram, WVDNR A Pad location…………………………………………… 116
Figure 4.7b. Satellite photo of the WVDNR A pad showing sampling sites……………………………. 117
Figure 4.7c. Terrain map of the WVDNR pad showing sampling sites………………………………….. 117
Figure 4.7.2 a PID data for 10/19‐20/2012 at Site B…………………………………………………………….. 118
Figure 4.7d. One‐minute average ozone concentrations at the WVDNR A pad………………….. 119
Figure 4.7e. CH4 concentrations and δ13C of CH4 at the WVDNR A pad……………………………… 122
Figure 4.7f. CO2 concentrations and δ13C of CO2 at the Brooke Co. pad…………………………….. 123
Figure 4.7g. One‐hour average PM10 and PM2.5 concentrations at the WVDNR Pad A……….. 124
Figure 4.7 h. PM 2.5 Dust Track 10/19‐27/2012 data for Site A………………………………………………. 125
Figure 4.7 i. PM 2.5 Dust Track 10/19‐27/2012 data for Site C……………………………………………….. 126
Figure 4.7.j. One‐minute average SO2 concentrations for the WVDNR A pad………………………… 127
Figure 4.8.a Location of Control Summa Canister samples in Morgantown, WV…………………… 128
vi
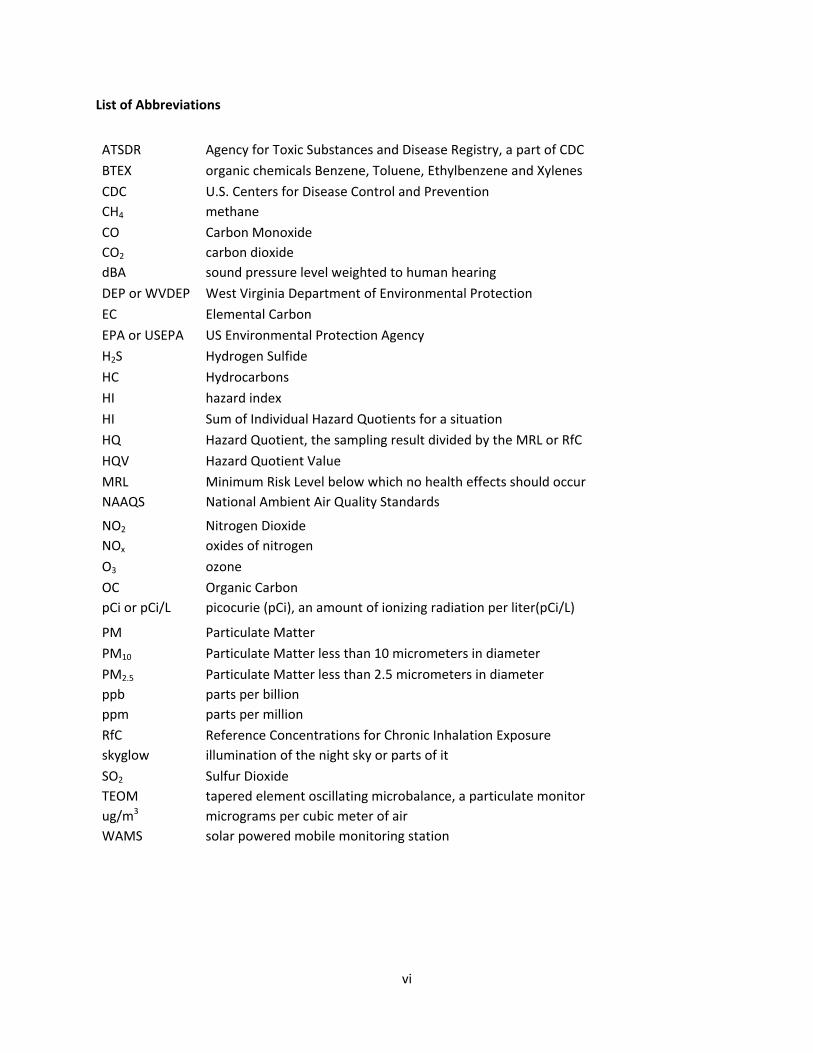
List of Abbreviations
ATSDR Agency for Toxic Substances and Disease Registry, a part of CDC
BTEX organic chemicals Benzene, Toluene, Ethylbenzene and Xylenes
CDC U.S. Centers for Disease Control and Prevention
CH4 methane
CO Carbon Monoxide
CO2 carbon dioxide
dBA sound pressure level weighted to human hearing
DEP or WVDEP West Virginia Department of Environmental Protection
EC Elemental Carbon
EPA or USEPA US Environmental Protection Agency
H2S Hydrogen Sulfide
HC Hydrocarbons
HI hazard index
HI Sum of Individual Hazard Quotients for a situation
HQ Hazard Quotient, the sampling result divided by the MRL or RfC
HQV Hazard Quotient Value
MRL Minimum Risk Level below which no health effects should occur
NAAQS National Ambient Air Quality Standards
NO2 Nitrogen Dioxide
NOx oxides of nitrogen
O3 ozone
OC Organic Carbon
pCi or pCi/L picocurie (pCi), an amount of ionizing radiation per liter(pCi/L)
PM Particulate Matter
PM10 Particulate Matter less than 10 micrometers in diameter
PM2.5 Particulate Matter less than 2.5 micrometers in diameter
ppb parts per billion
ppm parts per million
RfC Reference Concentrations for Chronic Inhalation Exposure
skyglow illumination of the night sky or parts of it
SO2 Sulfur Dioxide
TEOM tapered element oscillating microbalance, a particulate monitor
ug/m3 micrograms per cubic meter of air
WAMS solar powered mobile monitoring station
1
Disclaimer
The contents of this report reflect the views of the authors who are responsible for the facts and the
accuracy of the data presented. The contents DO NOT necessarily reflect the official views or policies of
the State. These reports do not constitute a standard, specification, or regulation. Trade or
manufacturers' names which may appear herein are cited only because they are considered essential to
the objectives of these reports. The State of West Virginia does not endorse products or manufacturers.
This report was prepared for the West Virginia Department of Environmental Protection.
2
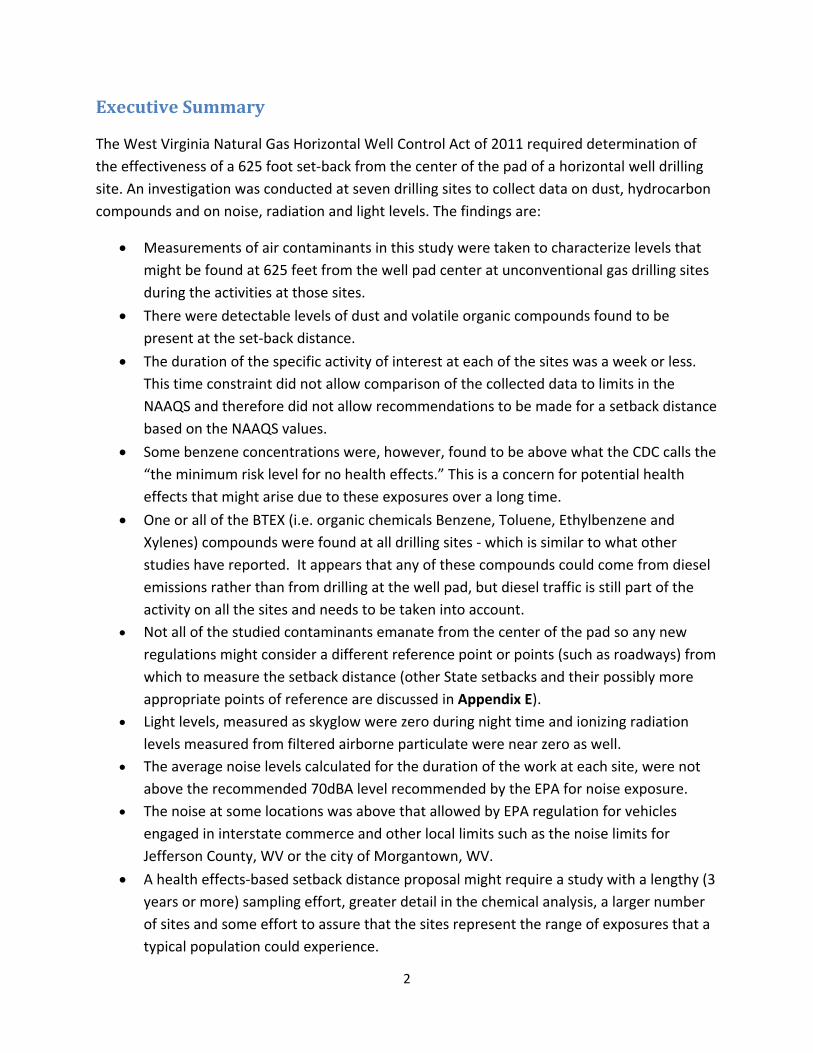
ExecutiveSummary
The West Virginia Natural Gas Horizontal Well Control Act of 2011 required determination of
the effectiveness of a 625 foot set‐back from the center of the pad of a horizontal well drilling
site. An investigation was conducted at seven drilling sites to collect data on dust, hydrocarbon
compounds and on noise, radiation and light levels. The findings are:
Measurements of air contaminants in this study were taken to characterize levels that
might be found at 625 feet from the well pad center at unconventional gas drilling sites
during the activities at those sites.
There were detectable levels of dust and volatile organic compounds found to be
present at the set‐back distance.
The duration of the specific activity of interest at each of the sites was a week or less.
This time constraint did not allow comparison of the collected data to limits in the
NAAQS and therefore did not allow recommendations to be made for a setback distance
based on the NAAQS values.
Some benzene concentrations were, however, found to be above what the CDC calls the
“the minimum risk level for no health effects.” This is a concern for potential health
effects that might arise due to these exposures over a long time.
One or all of the BTEX (i.e. organic chemicals Benzene, Toluene, Ethylbenzene and
Xylenes) compounds were found at all drilling sites ‐ which is similar to what other
studies have reported. It appears that any of these compounds could come from diesel
emissions rather than from drilling at the well pad, but diesel traffic is still part of the
activity on all the sites and needs to be taken into account.
Not all of the studied contaminants emanate from the center of the pad so any new
regulations might consider a different reference point or points (such as roadways) from
which to measure the setback distance (other State setbacks and their possibly more
appropriate points of reference are discussed in Appendix E).
Light levels, measured as skyglow were zero during night time and ionizing radiation
levels measured from filtered airborne particulate were near zero as well.
The average noise levels calculated for the duration of the work at each site, were not
above the recommended 70dBA level recommended by the EPA for noise exposure.
The noise at some locations was above that allowed by EPA regulation for vehicles
engaged in interstate commerce and other local limits such as the noise limits for
Jefferson County, WV or the city of Morgantown, WV.
A health effects‐based setback distance proposal might require a study with a lengthy (3
years or more) sampling effort, greater detail in the chemical analysis, a larger number
of sites and some effort to assure that the sites represent the range of exposures that a
typical population could experience.

3
Without more appropriate sampling periods than the three year averaging period
required for the NAAQS or a health effects study, monitoring in the area of the drilling
activity could be undertaken by the industry and used by the industry to assure control
of emissions.

4
1.BackgroundHorizontal drilling and hydraulic fracturing methods to extract natural gas from shale beds has
been steadily increasing in West Virginia. These techniques have raised environmental
concerns from not only citizens, but also state agencies, which regulate these practices. On
December 14, 2011, the West Virginia Legislature enacted the new Natural Gas Horizontal Well
Control Act. This act requires that the West Virginia Department of Environmental Protection
(WVDEP) to prepare a report to the legislature on noise, light dust and volatile organic
compounds and their relationship to well location restrictions for occupied dwellings; allowing
the secretary to propose guidelines and procedures for controlling and mitigating levels of
noise, light, dust and volatile organic compounds in relation to horizontal drilling activities.
1.1 Drilling Operations and Air Emissions
1.1.1 Drilling Operations
The purpose of the monitoring study was to characterize emission during each of the five stages of Horizontal Drilling:
Pad Site Development
Vertical Drilling
Horizontal Drilling
Hydraulic Fracturing (HF)
Flowback and Completion
The pad site development phase involves the construction of well pads, access roads, and other
ancillary facilities A well is then drilled vertically using sections of rigid pipe to form the drill
string. Horizontal drilling can be done off of a vertical wellbore in order to expose more open
hole to the hydrocarbons. These horizontal legs can be over a mile long. Before natural gas
wells begin producing gas for sale, the wellbore and surrounding reservoir must be "cleaned up,
i.e., any fluids, sand, coal particles, or drill cuttings within the wellbore must be removed.” The
solid and liquid waste materials are then dumped into a pit or tank, and any gas that is removed
is flared or vented to the atmosphere. During the production phase, the primary activity
conducted is bringing hydrocarbons to the surface. During this phase, additional wells may be
drilled within the development area to enhance hydrocarbon recovery. This production phase
may last for a number of decades.
1.1.2 Exposure Criteria
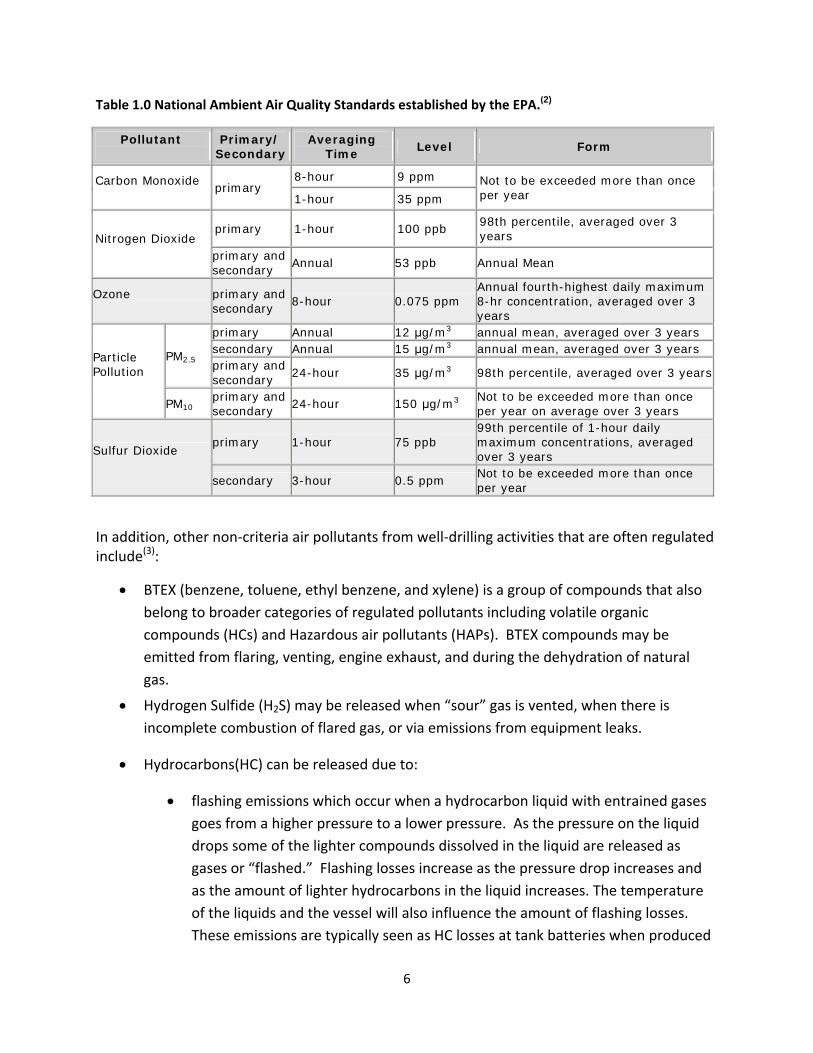
Of the six criteria pollutants established by the EPA, there are five (lead is the single one
excluded) that may be associated with drilling operations (Table 1). In many cases there are

5
multiple averaging times for which the limits apply, primarily because of different health effects
associated with the different averaging times. The Clean Air Act, last amended in 1990, requires
the EPA to set National Ambient Air Quality Standards (NAAQS)(40 CFR part 50) for pollutants
considered harmful to public health and the environment. The Clean Air Act identifies two types
of national ambient air quality standards. Primary standards provide public health protection,
including protecting the health of "sensitive" populations such as asthmatics, children, and the
elderly. Secondary standards provide public welfare protection, including protection against
decreased visibility and damage to animals, crops, vegetation, and buildings.
A review by the Department of Energy (1) points out that drilling activities often include sources for five of the criteria pollutants under the health‐based NAAQS:
Carbon Monoxide (CO) may be emitted during flaring and from the gas produced by
incomplete combustion of carbon‐based fuels and from vehicular traffic.
Particulate Matter (PM) occurs from dust or soil entering the air during pad
construction, traffic on access roads, and diesel exhaust from vehicles and engines.
Particulate matter can also be emitted during venting and flaring operations.
Sulfur Dioxide (SO2) is formed when fossil fuels containing sulfur are burned. Thus,
sulfur dioxide may be emitted during flaring of natural gas, or when fossil fuels are
combusted to provide power to pump jacks, compressor engines, or other equipment
and vehicles at oil and gas production sites.
Nitrogen Dioxide (NO2) is formed during flaring operations and when fuel is burned to
provide power to machinery such as compressor engines and other heavy equipment.
Ozone itself is not released during oil and gas development, but two of the main
compounds that combine to form ground‐level ozone (e.g., volatile organic compounds
and Nitrogen Oxides [NOx]) can be released during drilling operations. Volatile organic
compounds (HC) are those compounds of carbon (excluding carbon monoxide, carbon
dioxide, carbonic acid, metallic carbides or carbonates, and ammonium carbonate)
which form ozone through atmospheric photochemical reactions. In some applications,
HCs are defined as those carbon compounds containing three carbon molecules or
greater. Under this definition, methane is not considered a HC.
6
Table 1.0 National Ambient Air Quality Standards established by the EPA.(2)
Pollutant
Primary/ Secondary
Averaging Time
Level Form
Carbon Monoxide
primary 8-hour 9 ppm Not to be exceeded more than once
per year 1-hour 35 ppm
Nitrogen Dioxide
primary 1-hour 100 ppb 98th percentile, averaged over 3 years
primary and secondary
Annual 53 ppb Annual Mean
Ozone
primary and secondary
8-hour 0.075 ppm Annual fourth-highest daily maximum 8-hr concentration, averaged over 3 years
Particle Pollution
PM2.5
primary Annual 12 μg/m3 annual mean, averaged over 3 years secondary Annual 15 μg/m3 annual mean, averaged over 3 years primary and secondary
24-hour 35 μg/m3 98th percentile, averaged over 3 years
PM10 primary and secondary
24-hour 150 μg/m3 Not to be exceeded more than once per year on average over 3 years
Sulfur Dioxide
primary 1-hour 75 ppb 99th percentile of 1-hour daily maximum concentrations, averaged over 3 years
secondary 3-hour 0.5 ppm Not to be exceeded more than once per year
In addition, other non‐criteria air pollutants from well‐drilling activities that are often regulated include(3):
BTEX (benzene, toluene, ethyl benzene, and xylene) is a group of compounds that also
belong to broader categories of regulated pollutants including volatile organic
compounds (HCs) and Hazardous air pollutants (HAPs). BTEX compounds may be
emitted from flaring, venting, engine exhaust, and during the dehydration of natural
gas.
Hydrogen Sulfide (H2S) may be released when “sour” gas is vented, when there is
incomplete combustion of flared gas, or via emissions from equipment leaks.
Hydrocarbons(HC) can be released due to:
flashing emissions which occur when a hydrocarbon liquid with entrained gases
goes from a higher pressure to a lower pressure. As the pressure on the liquid
drops some of the lighter compounds dissolved in the liquid are released as
gases or “flashed.” Flashing losses increase as the pressure drop increases and
as the amount of lighter hydrocarbons in the liquid increases. The temperature
of the liquids and the vessel will also influence the amount of flashing losses.
These emissions are typically seen as HC losses at tank batteries when produced
7
liquids are sent from a pressurized vessel (separator or treater) to a storage tank.
In recent years, these flashing losses have gained considerable attention from
state and federal regulatory agencies as they can add up to significant quantities
of HC emissions, a precursor to ozone formation.
the accumulation of fluids in mature gas wells, in the wellbore, which can
impede and sometimes halt gas production and may require well blowdowns
(venting the well to atmospheric pressure) in which substantial methane and
associated HC emissions are released to the atmosphere.
Also associated with drilling operations but not coming from the actual well, itself, are
primary engine emissions including NOx (oxides of nitrogen, which may include nitrogen
dioxide), lesser amounts of CO, hydrocarbons, particulate and sulfur (contained in the
fuel).
1.1.3 Comparison Values of Non‐criteria Pollutants
1.1.3.1 Hydrocarbons (HCs)
The HCs assessed in this study are those most often considered by the EPA. However, the list is
derived from hazardous waste site sampling rather than the gas extraction industry. However,
for comparison to previous studies it was useful to maintain the list as it is rather than invent a
new one. The list does contain many commonly found HCs but it need to be remembered that
there may be others, not analyzed, that do occur. The EPA and other agencies have also
developed risk assessment metrics for the list of hazardous waste site HCs which are useful in
performing risk assessment analyses.
In order to assess air exposures from the monitoring of drilling activities it is necessary to have
some standard against which to compare. A standard could provide a health endpoint in terms
of some disease state that is likely to occur in the event of an overexposure, that is, an
exposure exceeding the reference value. However, that approach is not preventative. By the
time an overexposure occurs so, potentially, has disease. Rather it is preferable to have,
instead, a guidance value that indicates a level at which further attention is warranted and
perhaps intervention should be considered. Reference Concentrations for Chronic Inhalation
Exposure (RfCs), which represent EPA’s guidance values and are meant to be interpreted
against the risk of long term, chronic exposure, are concentrations of a particular pollutant,
below which (non‐cancer) adverse health effects are not expected to occur over a period of
continuous exposure. Values found above a reference concentration do not necessarily mean
that adverse health effects will occur, but that there is more of a potential. To make the
comparison between the sample result and the RfC, a hazard quotient is traditionally

8
calculated. A hazard quotient (HQ) is simply the sampling result divided by the RfC. If the value
is less than one, then health effects are not expected. To be even more conservative in the risk
assessment, and to account for effects from multiple pollutants that may be additive, the
individual hazard quotients of a sample may be added to produce a hazard index (HI). Again, if
the HI is less than one, then health effects are not expected.
The Minimal Risk Levels (MRLs) published by the U.S. Centers for Disease Control and
Prevention (CDC) are guidance values that perform that role. One of the Centers at CDC, the
Agency for Toxic Substances and Disease Registry (ATSDR), is mandated by Congress to address
potential public health impacts associated with environmental exposures to hazardous
substances from waste sites and releases of hazardous substances into the environment. MRLs
are similar in value and use to RfCs and are also intended for use as screening values to identify
chemicals of potential health concern at hazardous waste sites. They may also serve as trigger
values to alert primary care physicians to look for symptoms of exposure. They are not intended
as precise values above which adverse health effects will occur. An exposure level exceeding
the MRL merely indicates that further evaluation of the exposure scenario and potentially
exposed population may be warranted, although the more often the MRL is exceeded and the
greater the magnitude of the value by which the MRL is exceeded, the greater the likelihood
that an adverse health outcome will occur. Further, the relevance of an HQV (hazard quotient
value) to any given exposure scenario will vary from person to person and substance to
substance.(6) The selection of which substances to evaluate was based on existing knowledge of
toxicology and experience in assessing and evaluating hazardous substances and adverse health
outcomes. The chosen adverse health outcomes are:
Birth defects and reproductive disorders
Cancer
Immune function disorders
Kidney dysfunction
Liver dysfunction
Lung & respiratory diseases
Neurotoxic disorders
Exposure to certain hydrocarbons is a concern in this type of industry. The higher the exposure,
the greater the concern. This is the basic concept behind what is called risk assessment. Risk
assessment evaluates “probabilities”. The higher the probability, the more unfavorable the
risk. In the case of the findings here, a hazard quotient greater than 1 based on the chronic

9
exposure MRLs was chosen to highlight the exposure as significant. Appendix A lists the MRLs
developed by ATSDR and Appendix B has the list of organic compounds detected from the
SUMMA Canisters and the chronic exposure MRL level. The chronic exposure MRL is the lowest
exposure level and so is the most conservative. It does, however, assume that exposures would
occur consistently over a year or more at or above that average level. The list of chemicals were
arranged in order of the hazard quotient (HQ) also called the Hazard Quotient Value (HQV)
determined for the exposure levels found from the sampling described in this report. Unlike the
RfC’s, MRLs are based upon three distinct exposure scenarios, namely acute (14 days or less),
intermediate (15‐364 days), and chronic (365 days or more). Use of an acute or intermediate
MRL value might facilitate a determination of whether, for example, a current air level of a
volatile compound would pose an immediate or future health risk to exposed populations or
warrant an emergency removal action, but not necessarily be indicative of any effects
associated with longer‐term continuous, low‐level exposure.
The MRL development process also entails internal peer review, external peer review, and an
opportunity for public comment. This process is done in a very transparent fashion, and the
decisions that are made regarding any internal review comment, public comment, or peer
reviewer comments, become part of a legal docket that is available to the public. By contrast,
the USEPA RfCs, while undergoing extensive internal peer review, have not historically always
been subjected to external peer review or public review prior to incorporation in USEPA's
Integrated Risk Information System (IRIS). The agents and the recommended level below which
there should be minimal probability of an adverse effect are listed in Appendix A.
1.1.4.2 Noise
Noise is generally viewed as being one of a number of general biological stressors. It is felt that
excessive exposure to noise might be considered a health risk in that noise may contribute to
the development and aggravation of stress related conditions such as high blood pressure,
coronary disease, ulcers, colitis, and migraine headaches. Loud sounds can cause an arousal
response in which a series of reactions occur in the body. Adrenalin is released into the
bloodstream; heart rate, blood pressure, and respiration tend to increase; gastrointestinal
motility is inhibited; peripheral blood vessels constrict; and muscles tense. On the conscious
level we are alerted and prepared to take action. Even though noise may have no relationship
to danger, the body will respond automatically to noise as a warning signal. There are also
some indications that noise exposure can increase susceptibility to viral infection and toxic
substances.
EPA has identified a 24‐hour exposure level of 70 decibels as the level of environmental noise
which will prevent any measurable hearing loss over a lifetime. Likewise, levels of 55 decibels
outdoors and 45 decibels indoors are identified as preventing activity interference and

10
annoyance. These levels of noise are considered those which will permit spoken conversation
and other activities such as sleeping, working and recreation, which are part of the daily human
condition.
The levels are not single event, or "peak" levels. Instead, they represent averages of acoustic
energy over periods of time such as 8 hours or 24 hours, and over long periods of time such as
years. For example, occasional higher noise levels would be consistent with a 24‐hour energy
average of 70 decibels, so long as a sufficient amount of relative quiet is experienced for the
remaining period of time.
Noise levels for various areas are identified according to the use of the area. Levels of 45
decibels are associated with indoor residential areas, hospitals and schools, whereas 55
decibels is identified for certain outdoor areas where human activity takes place. The level of 70
decibels is identified for all areas in order to prevent hearing loss.
1.1.4.2.1 Evidence of Health Effects from Noise Exposure
Growing evidence suggests a link between noise exposure at levels found herein and
cardiovascular problems. There is also evidence suggesting that noise may be related to birth
defects and low birth‐weight babies.(7) The epidemiologic evidence that long‐term traffic noise
exposure increases the incidence of cardiovascular disease has increased considerably since
2008(8,9). At the same time, the evidence increases that nocturnal noise exposure may be more
relevant for the genesis of cardiovascular disease than daytime noise exposure:
For aircraft noise, there was a non‐significant decrease in the risk of hypertension for
noise during daytime, but a significant increase for noise (more than 10 dB) at night.(8) Road traffic noise exposure increases the risk of cardiovascular disease more in those
who sleep with open windows or whose bedroom is oriented toward the road(at levels of 66‐70 dBA).(9)
The risk for hypertension increased in those who slept with open windows during the night, but it decreased in those who had sound insulation installed or where the bedroom was not facing the main road. (10)
There is evidence of an adverse effect of railway noise increase of 10 dBA over daytime average of 55 dBA) on blood pressure, which was especially associated with night time exposure and those effects were particularly high among persons with physician‐diagnosed hypertension, cardiovascular disease, and diabetes.(11)
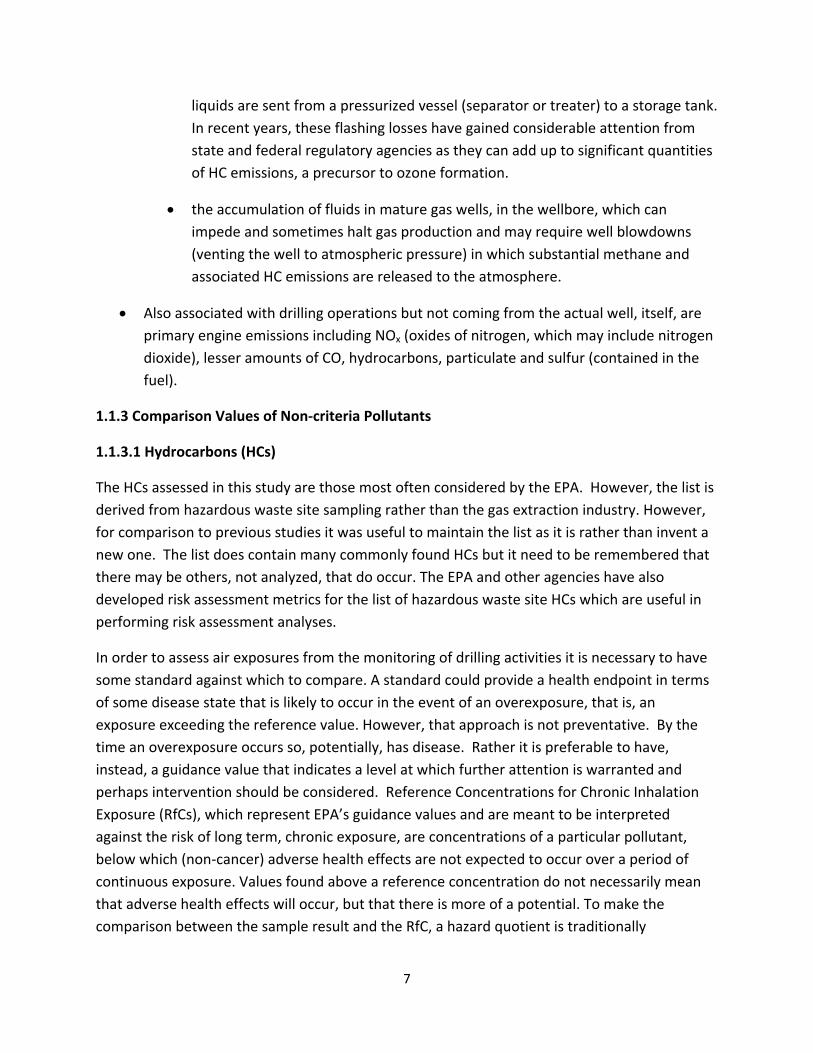
Noise levels associated with common activities are given in Table 1.0.1.
1.1.4.2.2 Local Noise Ordinances

11
The single county noise ordinance for West Virginia is in Jefferson County (although municipalities, such as Morgantown, WV also have noise ordinances). The ZONING & DEVELOPMENT REVIEW ORDINANCE is as follows:
Section 5.8 Residential/Light Industrial/Commercial District
The purpose of this district is to guide the high intensity growth into the perceived growth area.
5.8 (b) Standards
5.8 (b) 2. NOISE. All noise shall be muffled so as not to be objectionable due to intermitting, beat frequency, or shrillness. Noise levels shall not exceed the following sound levels dB(A). The sound‐pressure level shall be measured at the property line with a sound level meter. 5.8 (b) 5. VIBRATION. No vibration shall be produced which is transmitted through the ground and is discernible without the aid of instruments at any point beyond the lot line nor shall any vibration produced exceed 0.002g peak measured at or beyond the lot line using either seismic or electronic vibration‐measuring equipment.
DAY NIGHT
Sound Measured In 7 AM ‐ 6 PM 6 PM ‐ 7 AM
Adjoining Agricultural or
Residential Growth District 60 dB(A) 50 dB(A)
Residential Uses in R.L.C. District 65 dB(A) 55 dB(A)
Commercial Uses 70 dB(A) 60 dB(A)
Light Industrial Uses adjacent 85 dB(A) 80 dB(A) to noise source
The following sources of noise are exempt:
Transportation vehicles not under the control of the industrial use.
Occasionally used safety signals, warning devices, and emergency pressure relief valves.
Temporary construction activity between 7:00 a.m. and 7:00 p.m.
12
Table 1.0.1 Typical Activities and the Associated Noise Level(19)
Sound Level dBA
Grand Canyon at Night (no roads, birds, wind)
10
Quiet basement w/o mechanical equipment
20
Quiet Room 28‐33
Whisper, Quiet Library at 6' 30
Computer 37‐45
Refrigerator 40‐43
Typical Living Room 40
Forced Hot Air Heating System
42‐52
Clothes Dryer 56‐58
Printer 58‐65
Normal conversation at 3' 60‐65
Window Fan on High 60‐66
Alarm Clock 60‐80
Dishwasher 63‐66
Clothes Washer 65‐70
Phone 66‐75
Push Reel Mower 68‐72
Inside Car, Windows Closed, 30 MPH
68‐73
Handheld Electronic Games 68‐76
Kitchen Exhaust Fan, High 69‐71
Inside Car, Windows Open, 30 MPH
72‐76
Garbage Disposal 76‐83
Air Popcorn Popper 78‐85
City Traffic (inside car) 85
Jackhammer at 50' 95
Snowmobile, Motorcycle 100
12 Gauge Shotgun Blast 165
Some state and local governments have enacted legislative statutes for land use planning and
control. As an example, the state of California has legislation on highway noise and compatible
land use development. This State legislation requires local governments to consider the adverse

13
environmental effects of noise in their land development process. In addition, the law gives
local governments broad powers to pass ordinances relating to the use of land, including
among other things, the location, size, and use of buildings and open space.
There are also county noise ordinances in some surrounding states such as Maryland (Howard
Conty, Montgomery County and St. Mary’s County) with daytime limits ranging from 70dBA to
90 dBA for industrial areas and nighttime limits lower by 5 dBA, in general. Virginia’s Fairfax
County allows a maximum of 72 dBA for industrial areas and Charlotte, NC has a limit of 60dBA.
These limits appear to be not applied as averages but as single instances and therefore
represent a maximum.
Table 1.0.2 Perceptions of Increases in Decibel Level(19)
Clearly Noticeable Change 5dB
About Twice as Loud 10dB
About Four Times as Loud 20dB
The Federal Government advocates that local governments use their power to regulate land
development in such a way that the developments are planned, designed, and constructed in
such a way that noise impacts are minimized.
Another possible approach to noise control is to adopt a limit on the increase in noise over the
background that exists in an area. There is no mandated definition for what constitutes a
substantial increase over existing noise levels in an area. Most State Highway agencies, for
example, use either a 10 dBA increase or a 15 dBA increase in noise levels to define a
"substantial increase" in existing noise levels (Table 1.0.2). Several State highway agencies use a
sliding scale to define substantial increase. The sliding scale combines the increase in noise
levels with the absolute values of the noise levels, allowing for a greater increase at lower
absolute levels before a substantial increase occurs.
For existing (in‐use) medium and heavy trucks with a GVWR of more than 4,525 kilograms, the
Federal government has authority to regulate the noise emission levels only for those that are
engaged in interstate commerce. Regulation of all other in‐use vehicles must be done by State
or local governments. The EPA emission level standards for in‐use medium and heavy trucks
engaged in interstate commerce are shown in Table 1.0.3.

14
Table 1.0.3 Maximum Noise Emission Levels
as Required by EPA for In‐Use Medium and Heavy Trucks
with GVWR Over 4,525 Kilograms Engaged in Interstate Commerce(40CFR202)
1.1.4.3 Light
Light pollution , which can be generally defined as excessive, misdirected, or obtrusive artificial
light, has been shown to affect the mating, predation and migration behaviors of many
nocturnal wildlife species, in turn affecting entire ecosystems. In addition, there is evidence
(see Appendix D) that light pollution may, in humans, influence melatonin suppression,
circadian rhythms and health. Measurement of light is made in term of several different units.
The first, the footcandle, is a unit of light intensity, measured in lumens per square foot. One
lumen is the brightness of one candle at a distance of one foot, approximately 10.7639 lux. The
lux is a unit of illumination equal to one lumen per square meter. This is the metric equivalent
of foot‐candles (one lux equals 0.0929 footcandles), and also called a meter‐candle. Illuminance
is then the total luminous flux incident on a surface, per unit area. Irradiance, on the other
hand, is the power of electromagnetic radiation per unit area (radiative flux) incident on a
surface and is measured in units of watts per square meter. The frequency of the light can
therefore influence the amount of measured irradiance. For sunlight, which has a broad
spectrum of frequencies the relationship between Illuminance (measured as lux) and irradiance
(measured as watts per square meter) is generally accepted as 100 to 1. That is, 100 lux equals
one watt per square meter. For this study measurements were made of the light intensity of
the sky. The sky was used because, at all sites, the color (i.e. spectral frequency) should be
consistent, unlike the ground or other randomly chosen surfaces. It was assumed that light
pollution would be detected as “skyglow”, due to scattering of light by dust and moisture in the
atmosphere. Therefore sensors were pointed upward at all sampling sites.
Speed
Maximum Noise Level 15 Meters from Centerline of
Travel
< 56 kph 83 dBA
> 56 kph 87 dBA
Stationary 85 dBA

15
Table 1.0.4 Examples of Illumination and the accompanying amount of
Illuminance
Illuminance Surfaces illuminated by:
10−4 lux Moonless, overcast night sky
0.002 lux Moonless clear night sky
0.27–1.0 lux Full moon on a clear night
3.4 lux Dark limit of civil twilight under a clear sky
50 lux Family living room
80 lux Office building hallway
100 lux (1 W/m2) Very dark overcast day
320–500 lux Office lighting
400 lux Sunrise or sunset on a clear day.
1,000 lux Overcast day
10,000–25,000 lux Full daylight (not direct sun)
32,000–130,000 lux Direct sunlight
1.1.4.4 Ionizing Radiation
Ionizing radiation is radiation composed of particles that carry enough energy to cause an
electron from an atom or molecule to be removed, thus ionizing it. Ionizing radiation includes
Alpha particles and Beta particles. Alpha particles consist of two protons and two neutrons
bound together into a particle identical to a helium nucleus. When alpha particle emitting
material is inhaled, the alpha particle exposure is far more dangerous than a similar amount of
other kinds of radiation due to the higher effectiveness of alpha radiation to cause biological
damage. Beta particles are high‐energy, high‐speed electrons or positrons emitted by certain
types of radioactive nuclei, and have a lower relative effectiveness to cause biological damage
than do alpha particles. Radiation exposure is measured in terms of the number of particles (in
16
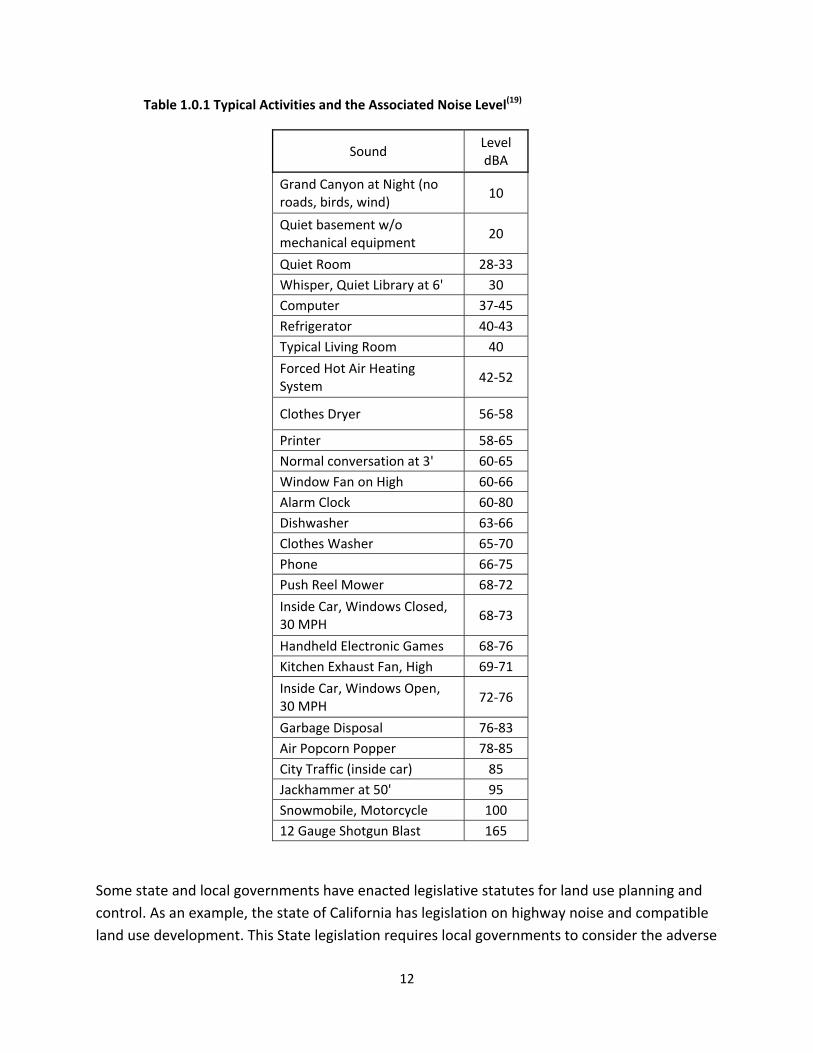
the case of alpha and beta radiation) produced per second. One Curie (Ci) is 3.7x10¹⁰ (37
followed by 9 zeros) particle produced per second. A picocurie (pCi) is one billionth of that or 37
radioactive particles per second. The most important source of materials releasing ionizing
radiation that enter the body are terrestrial in origin. Radiation levels depend on uranium and
thorium content of the rock, which varies widely across the United States. The highest levels
are found in the Appalachians, the upper Midwest, and the Rocky Mountain states. The average indoor radiation level is estimated to be about 1.3 pCi/liter (L) of air, and about 0.4
pCi/L of air is normally found in the outside air.
Table 1.0.5 Risk of Lung Cancer for Smokers and Nonsmokers from Radiation Exposure
Radiation Level
If 1,000 people who smoked were exposed to this level over a lifetime*...
The risk of cancer from radiation exposure compares to**...
20 pCi/L About 260 people could get lung cancer 250 times the risk of drowning
10 pCi/L About 150 people could get lung cancer 200 times the risk of dying in a home fire
8 pCi/L About 120 people could get lung cancer 30 times the risk of dying in a fall 4 pCi/L About 62 people could get lung cancer 5 times the risk of dying in a car crash 2 pCi/L About 32 people could get lung cancer 6 times the risk of dying from poison 1.3 pCi/L About 20 people could get lung cancer (Average indoor radon level) 0.4 pCi/L About 3 people could get lung cancer (Average outdoor radon level) * Lifetime risk of lung cancer deaths from EPA Assessment of Risks from Radon in Homes (EPA 402-R-03-003). ** Comparison data calculated using the Centers for Disease Control and Prevention's 1999-2001 National Center for Injury Prevention and Control Reports.
Radiation Level
If 1,000 people who never smoked were exposed to this level over a lifetime*...
The risk of cancer from radiation exposure compares to**...
20 pCi/L About 36 people could get lung cancer 35 times the risk of drowning
10 pCi/L About 18 people could get lung cancer 20 times the risk of dying in a home fire
8 pCi/L About 15 people could get lung cancer 4 times the risk of dying in a fall 4 pCi/L About 7 people could get lung cancer The risk of dying in a car crash 2 pCi/L About 4 person could get lung cancer The risk of dying from poison 1.3 pCi/L About 2 people could get lung cancer (Average indoor radon level) 0.4 pCi/L (Average outdoor radon level)
Note: If you are a former smoker, your risk may be higher. * Lifetime risk of lung cancer deaths from EPA Assessment of Risks from Radon in Homes (EPA 402‐R‐03‐003). ** Comparison data calculated using the Centers for Disease Control and Prevention's 1999‐2001 National Center for Injury Prevention and Control Reports.

17
2.InterpretationofPotentialHealthEffectsfromExposuresFoundintheStudy
The interpretation of the health effects that may occur due to exposure to air contaminants,
noise and light must be tempered by the consideration of the limited number of sites that were
sampled and the small number of companies (4) that those sites represent. It is unknown
whether these companies represent the best or the worst of the companies or where in
between the best and the worst they may fall. For those contaminants for which there are
standards under the NAAQS, the characterization of the levels, in theory at least, is simple;
either the contaminant levels were above or below the NAAQS. For the HCs a very simple risk
assessment was done. The determination was whether the concentration was above or below
the MRL. The MRL was chosen conservatively to represent chronic exposures, that is,
exposures over a year or more. It is unlikely that any single drill site would expose any location
to the levels found in this study for a period of a year or more. The assumption of a chronic
exposure was done because of the uncertainty about how far away exposures might occur and
the possibility that a given residence might be exposed from operations at several nearby drill
sites. Any concentration above the MRL was considered to present a hazard. Any
concentration below the MRL did not. There were four out of the seven locations where
SUMMA canister samples were taken that showed benzene concentrations in excess of the
MRL.
2.1 PM2.5 dust levels at the 625 foot setback distance had one‐hour average values above
the annual NAAQS limit occurring over the course of several days at all but one site
(Mills Wetzel 2). This happened for two readily apparent reasons. The first reason was
that areas were not kept sufficiently watered to prevent dust buildup on the roadways
the construction equipment was using. The second reason was that the heavy
equipment was working directly next to where the samplers were located even though
the samplers were placed 625 feet from the presumed eventual center of the well pad.
The center of the well pad, in this case, was an obviously inappropriate location from
which to determine the setback if the purpose of the setback was to remove the source
of the dust from nearby residences. The same potential for dust generation was
observed at all locations reported on here. Heavy traffic movement could be observed
on potentially dusty roads at all sites, at distances 625 feet from the center of the pad
(and farther, for that matter).
2.2 The only significant hazard quotient was for Benzene which has an MRL (based on
immunological system effects) of 9.5 g/m3 for chronic (>365 days), 19 g/m3 for
18
intermediate (14 to 364 days) and 28.5g/m3 for acute (1 to14 days) exposure. For
comparison, the US EPA RfC’s for Benzene is 30 g/m3. Even with the higher value for
the RfC there were still MRLs above 1.0 at three of the four sites. Assessments in areas
of Garfield County Colorado have concluded that the ambient benzene levels associated
with drilling operations there demonstrate an increased potential risk for development
of cancer as well as chronic and acute noncancerous health effects where natural gas
development operations is the only major industry other than agriculture. (14) From a
risk assessment standpoint, which is what the MRLs were developed to assist with,
there is a potential risk of immunological system health effects in a population that may
live within 625 feet of drilling operations. It should be stressed, though, that this is not
the same as being out of compliance with the NAAQS. Risk assessment is meant to
identify the potential for a health problem. The higher the multiplicative factor over the
MRL the more likely it is that a health problem could develop.
2.3 Noise levels above 55 dBA occurred frequently, but averages were below the EPA’s
recommended long‐term level of 70 dBA. As noted above, this could still be
problematic, resulting in increased stress levels and their concomitant side effects as
noted in studies cited in Section 1.1.4.2.1 which showed health effects associated with
noise levels similar to those seen herein. Again, this was a consistent problem
throughout operations and not just associated with a single kind of operation. Although
the levels for highway noise given in Table 1.0.3 are for 15 meters away from the
highway, noise at the 625 foot setback distance exceeded 85 dBA a number of times.
These were short‐term excursions but the standard for Table 1.0.3 does not specify a
time.
2.4 Light levels, measured as skyglow were zero during night time and ionizing radiation
levels were near zero as well.

19
3 ConclusionsandRecommendations3.1 Conclusions
3.1.1 There was activity associated with the drilling site and with the source of air
contaminants and noise at 625 feet and farther from the center of the pad. A
setback distance of 625 feet from the center of the pad, therefore, does not assure
that residences would be unexposed to contaminants from drilling site activity.
3.1.2 There does not appear to be a simple solution to specifying a single point from
which to specify the set‐back distance to assure exposure control. There is no single
geometry to which all drill site activities conform. The activities follow the terrain of
the site and the needs of the process. There is no good reason to believe that using
the center of the Pad as the reference point from which the setback is taken will
assure that activity associated with some possible sources of the studied
contaminants will not occur closer than 625 feet from the actual source. Studies
have also shown that the meteorology (and topography) may be a more important
factor than a distance measured on a map for determining air contaminant
concentration (18).
3.1.3 The levels of contaminants that were seen were not unexpected based on previous
studies. However, they were seen to fluctuate over a wide range (i.e. have a high
standard deviation) so that consideration needs to be given to increased control
monitoring of the process.
3.1.4 Unlike the PA DEP study results in Appendix D, the hazard quotient for benzene
from the SUMMA canister sampling summarized in the Table in Appendix B was high
enough at the proposed setback distance at four of the drilling locations sampled to
be of concern.
3.1.5 One or all of the BTEX compounds were found at all drilling sites. Although any of
these compounds could come from diesel emissions, diesel traffic is still part of the
activity on all the sites and needs to be taken into account. BTEX and isotopic
methane may provide the best substances to use as tracers of activity and control of
processes at the drill site, although isotopic methane is more difficult to measure
and there are no inexpensive, easily moved units for making the measurement.
3.1.6 PM2.5 levels were above the annual NAAQS for at least one hour at certain locations,
under certain conditions at 625 feet from the pad center and were never above the
twenty four‐hour average time value. However, the health effect‐based NAAQS is
not appropriate for exact comparison with the measurements taken for PM2.5 or any
other contaminant in the list of those sampled. The short‐term nature of the drilling
process was apparently not envisioned by the developers of the NAAQS, which
requires a minimum of a year’s worth of data during which the site is actively
20
operating. It remains an open question as to how to apply intermittent exposures to
evidence from studies of continuous exposure used as the basis of the NAAQS. To
actually predict whether the exposures will cause health effects in the population, a
new health effects study specific to the industry might have to be conducted or a
previously published study of the industry (like reference 14) applied to the current
conditions.
3.1.7 In a lengthy report by the Energy Institute at the University of Texas at Austin on
“Fact‐Based Regulation for Environmental Protection in Shale Gas Development” it
was pointed out that large, fixed position air sampling units are most appropriate to
monitor the cumulative atmospheric impact of effectively non‐point sources such as
automobile exhausts and widely dispersed point sources such as gasoline
stations(15). Point sources such as drilling operations and gas processing plants,
cannot be appropriately monitored even by several fixed units spread over a large
area. It also should be noted that assessment of lifetime exposure levels requires
either very long term continuous monitoring such as provided by fixed units or
extensive, randomly selected, multiple short duration samples on a long term basis.
Lifetime exposures cannot be estimated from a small number of short term
measurements. Although the contaminant plumes of point sources ultimately
contribute to the average compositions of air they can only be effectively monitored
using targeted technologies that allow greater spatial granularity.
3.2 Recommendations
3.2.1 A more definitive sampling and health effects study needs to be done in West
Virginia to address the issues of potential exposures from gas drilling to the people
in the State. The topography of West Virginia, more so than for the states around it,
lends itself to increasing the concentration of emitted contaminants because of the
complex terrain, the increased likelihood of atmospheric inversions in that terrain
and the microclimatology during certain seasons. Much greater funding and time
would be needed, though, than for the study described in this report to come to a
conclusion. Input and cooperation should be sought from all concerned parties to
assure the success of the study.
3.2.2 Better use of roadway wetting agents would reduce many of the peak dust
exposures seen from roadside samples that were taken over the course of the
survey. Workers noted that the only use of wetting agents they had seen were when
the sampler were being placed on site. While this may be an exaggeration, the
amount of fine dust that had collected at the sites and the levels over the PM2.5
NAAQS were visible proof that some increased wetting agents use was needed.

21
3.2.3 Greater spacing of diesel container‐trucks while waiting on line for HF could reduce
the local concentration of diesel exhaust and may reduce noise as well. For example,
noise levels at site C at the Donna pad, next to the roadway during HF operations
were some of the highest seen in all the study sites. Trucks had lined up along that
roadway for the duration of the operation and provided a consistent noise levels in
excess of 60 dBA.
3.2.4 Noise reduction, particularly from traffic may be abated by several well‐established
methods used with highway construction. These include:
Sound barriers around the drill site have been used in other locations
although none were seen here, so it is not possible to tell what effect they
may have, but it is certainly an area that could be explored.
Vegetation, if it is high enough, wide enough, and dense enough that it
cannot be seen over or through, can decrease highway traffic noise. A 61‐
meter width of dense vegetation can reduce noise by 10 decibels, which cuts
in half the loudness of traffic noise. It may not be feasible, however, to plant
enough vegetation along a road to achieve such reductions. If vegetation
already exists, it can be saved to maintain a psychological relief, if not an
actual lessening of traffic noise levels. If vegetation does not exist, it can be
planted for psychological relief.
Insulating buildings can greatly reduce highway traffic noise, especially when
windows are sealed and cracks and other openings are filled. Sometimes
noise‐absorbing material can be placed in the walls of new buildings during
construction. However, insulation can be costly because air conditioning is
usually necessary once the windows are sealed.
A noise attenuation measure that should always be considered is the
possibility of altering the roadway location to avoid those land use areas
which have been determined to have a potential noise impact. Since sound
intensity decays with distance from the source, increased distance between
the noise source and receiver may reduce the noise impact. It may also be
possible to obtain attenuation by depressing the roadway slightly to produce
a break in the line of sight from the source to the receiver. Potential noise
reduction should be considered with the many other factors that influence
the selection of roadway alignment.
3.2.5 The University of Texas at Austin report cited above notes that Industry best practice
is to install sound meters on all drill pads, compressor stations etc., such that the site
is connected by cellular phone or Wi‐Fi to record sound levels 24 hours a day. When
the permitted sound levels is exceeded and detected sound engineers investigate to
seek the source and report not only the cause but also what steps have been taken
22
to prevent a recurrence. This approach to monitoring of all pertinent hazards should
be considered for future regulations.
3.2.6 A review of alternative health effects information outside the scope of EPA
regulations or the data from this study is available in Appendix D and should be
considered in setting regulations.

23
4SamplingSiteResultsMarcellus gas wells at the various stages of development, as mentioned above, were selected
for this project. WVDEP first contacted the natural gas developers to establish site access.
Factors that were considered for placement of the sampling equipment include:
The sites selected for placing sampling equipment should be a minimum of 10
meters from the nearest drip line and when possible have no foliage or obstruction
between the drill pad site and the sample location.
The sampling equipment should be placed a minimum of 625 feet from the center of
the drill pad if the drill rig is not in place, starting directly downwind in the dominant
wind direction, with one mobile site as close as feasible to every 90 degrees.
Alternative locations were then considered when it was not possible to meet the above
specifications. These alternatives, in order of priority, included:
Any location with no foliage or intervening obstruction closest to within 625 to 1250
feet of the center of the drill pad and within 20 degrees of one of the ideal locations
can be selected as a sampling location, with preference given to a residence falling
within those bounds and meeting those specifications,.
Any location within 625 to 1250 feet of the center of the drill pad with no foliage or
intervening obstruction at the same level as the drill pad and at least 45 degrees
from the nearest ideal sample location it is meant to represent.
Any location within 625 to 1250 feet of the center of the drill pad with no foliage or
intervening obstruction at any level and at least 45 degrees from the nearest other
ideal sample location it is meant to represent.
There was always a WAMS location sited near the trailer for comparison. Set up of the
equipment was done at the selected sites usually for six days. The equipment was visually
inspected every second or third day during the sampling period. Photoionization detectors
were checked and calibrated in the field with isobutylene during the study period.
Sample numbers for the Summa Canisters are a combination of the location (e.g., site A, B or C,
although not uniquely identified to a particular pad, since the letter designation were repeated
for all pads and identified the direct reading equipment that was used along with the canisters)
and a consecutive set designation (e.g., 1, 2, 3, 4, etc.). Sample A1, for example, would be from
the first set of samples and placed at Sampling Site Location A. All samples with the same set
designation number (1, in this example) would have been taken during the same sampling
period (e.g. samples A1 and B1 would have been taken during the same time period but at sites
A and B respectively).

24
Two‐hour average OC and EC concentrations were obtained using the Sunset Laboratories
Aerosol Carbon Field Analyzer. The analyzer had a PM2.5 size‐selective inlet, so reported
concentrations are of OC and EC in PM2.5. The analyzer uses a quartz oven and non‐dispersive
infrared detection. Blank sample analysis was automatically conducted daily at midnight, and a
calibration check was conducted at the start and end of the monitoring period at each of the six
locations, as well as during weekly site visits. EC is formed by combustion of organic material,
such as fossil fuels, and is solely a primary pollutant. OC can be a primary or secondary
pollutant. Primary sources can be anthropogenic or biogenic, and secondary sources are
atmospheric oxidation processes. Both OC and EC can be emitted from the same source. With
respect to natural gas operations, the HCs emitted by gasoline‐ and diesel‐powered engines and
the natural gas itself can contribute to OC and diesel exhaust is a source of EC. The OC/EC
analyzer experienced multiple problems related to leaks and software during monitoring at the
six sites. Only the Maury and Lemons Pads were able to be monitored because of this.
Ammonia is not likely to be emitted in large quantities from natural gas operations. Its
inclusion in the laboratory instrumentation was intended for future atmospheric modeling
purposes, as ammonia plays an important role in aerosol formation. Because there was very
little variation in the ammonia concentration measured at each monitoring location, results for
five of the sites are shown in the table below rather than at the particular Site Sections in the
report.
Light levels fell to 0 during evening hours for all sites, measured both by the DOE and WAMS
instruments.
Radiation levels for alpha and beta sources were well below established background levels in
air. The only reason for the ability to detect any radiation of the filter samples was the fact that
over 300 liters or air were sampled onto the filters.
Figures for measured meteorological parameters other than wind (temperature, relative
humidity, rainfall, and solar intensity) are included in Appendix C.
Density Correction Factors for the Dust Track Measurements can be found in Appendix F.
A summary of the more important results, by Site, follows.
25
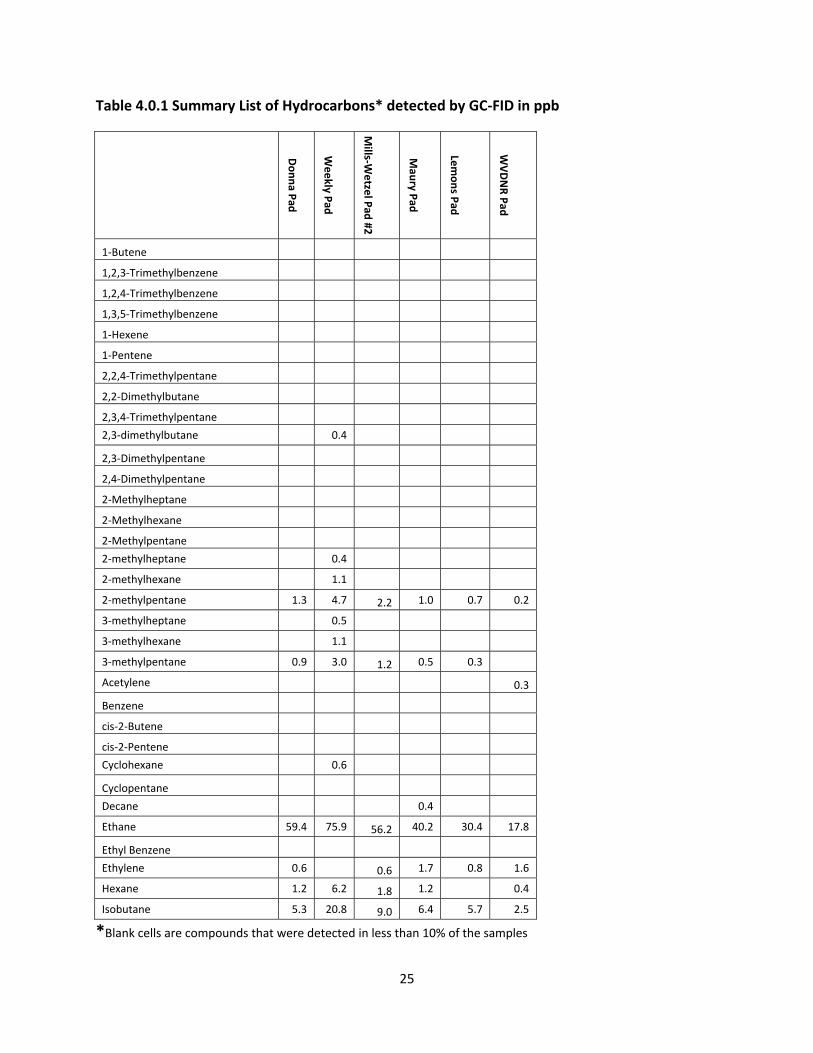
Table 4.0.1 Summary List of Hydrocarbons* detected by GC‐FID in ppb
Donna P
ad
Weekly P
ad
Mills‐W
etze
l Pad
#2
Mau
ry Pad
Lemons P
ad
WVDNR Pad
1‐Butene
1,2,3‐Trimethylbenzene
1,2,4‐Trimethylbenzene
1,3,5‐Trimethylbenzene
1‐Hexene
1‐Pentene
2,2,4‐Trimethylpentane
2,2‐Dimethylbutane
2,3,4‐Trimethylpentane
2,3‐dimethylbutane 0.4
2,3‐Dimethylpentane
2,4‐Dimethylpentane
2‐Methylheptane
2‐Methylhexane
2‐Methylpentane
2‐methylheptane 0.4
2‐methylhexane 1.1
2‐methylpentane 1.3 4.7 2.2 1.0 0.7 0.2
3‐methylheptane 0.5
3‐methylhexane 1.1
3‐methylpentane 0.9 3.0 1.2 0.5 0.3
Acetylene 0.3
Benzene
cis‐2‐Butene
cis‐2‐Pentene
Cyclohexane 0.6
Cyclopentane
Decane 0.4
Ethane 59.4 75.9 56.2 40.2 30.4 17.8
Ethyl Benzene
Ethylene 0.6 0.6 1.7 0.8 1.6
Hexane 1.2 6.2 1.8 1.2 0.4
Isobutane 5.3 20.8 9.0 6.4 5.7 2.5
*Blank cells are compounds that were detected in less than 10% of the samples

26
Table 4.0.1 cont’d
Donna P
ad
Weekly P
ad
Mills‐W
etze
l Pad
#2
Mau
ry Pad
Lemons P
ad
WVDNR Pad
Isoprene 5.5 6.6 5.2 4.0
Isopropylbenzene
m‐diethylbenzene 0.5
m/p‐Xylene (combined)
Methylcyclohexane 0.4 1.4 0.5 0.2
Methylcyclopentane 0.4
m‐Ethyltoluene
n‐butane 8.9 44.5 16.3 11.3 9.6 6.2
n‐Decane
n‐dodecane 3.6
n‐heptane 0.4 2.3 0.4 0.3
n‐Hexane
n‐octane 1.0
Nonane 0.4 0.2
n‐Nonane
n‐pentane 3.7 19.2 7.6 5.1 4.0 2.2
n‐Propylbenzene
n‐Undecane
o‐Ethyltoluene
o‐Xylene
p‐Diethylbenzene
p‐Ethyltoluene
n‐undecane 3.4
Propane 22.2 71.9 33.4 24.1 25.1 11.6
Propylene 0.2
Styrene
Toluene 1.4 0.7 1.0 0.3 1.0
trans‐2‐Butene
trans‐2‐Pentene
Undecane 0.3

27
Table 4.0.2 Summary of PM10 and PM2.5 levels measured by TEOM
PM10 (g/m3) PM2.5 (g/m3)
NAAQS 24‐hour Standard 150 35
Range of 24‐hour averages measured at each site
Donna Pad 12‐29 6‐15
Weekley Pad 9‐32 5‐20
Mills‐Wetzel Pad 2 9‐54 6‐17
Maury Pad 9‐90 5‐24
Lemons Pad 5‐24 3‐13
WVDNR Pad 2‐50 1‐13
Table 4.0.3 Summary of Average sound levels (dBA)
Donna Mills Wetzel 2 Mills Wetzel 3 Maury Lemon
Mean 52 65 64 58 54
Standard Deviation 10 10
8 6 4
Table 4.0.4 Ammonia Values
Well Pad
Average
(ppb)
Maximum
(ppb)
Minimum
(ppb)
Weekley 0.9 1.5 0.4
Mills‐Wetzel 2 0.6 1.0 0.2
Maury 0.6 5.3 0.1
Lemons 0.8 2.6 0.2
WVDNR A 0.4 0.6 0.2
Table 4.0.5 Range of Values for Gases by Location
Donna Weekley Mills Wetzel 2 Maury Lemons WVDNR
O3 (8 hr average)(ppb) 9‐56 4‐78 20‐67 2‐69 11‐61 14‐56
NOx(1 hr average)(ppb) 1.3‐30 3.4‐12 7.8‐38 23‐138 9‐151 ‐
CH4(6 day average) ppm) 2.1 2 2 2 2.1 1.9
SO2(3hr average)(ppb) 1.9‐10.4 1.1‐12.4 1.6‐8.4 1.1‐9.6 1.7‐3.7 2.1‐5.3

28
Table 4.0.6 PID Direct‐Reading Analysis of Hydrocarbons
Location Mean (ppb)
Standard Deviation
Weekley C 0.66 0.75
Maury D 2.50 2.60
Lemons A 1.66 0.81
Lemons C 8.15 9.72
WVDNR B 0.61 0.09

29
Table 4.0.7 Airborne Radiation Levels
Amount on Filter (pCi)
Concentration of Radioactive Materials in Air (pCi/L)
Pad Location (Sample Site)
Alpha 0.244 <0.0001
Weekley (A)
Alpha 0.388 <0.0001
Weekley ( C )
Alpha 0.383 <0.0001
Pad 2 ( C )
Alpha 0.287 <0.0001
Pad 2 (A)
Alpha 0.572 <0.0001
Pad 3 (A)
Alpha 0.583 <0.0001
Pad 3 ( C )
Alpha 0.432 <0.0001
Maury ( D )
Alpha 0.567 <0.0001
Lemons ( C )
Alpha 0.429 <0.0001
Lemons (A)
Alpha 0.0087 <0.0001
WV DNR (A)
Alpha 0.0814 <0.0001
WV DNR (C)
Beta ‐0.017 <0.0001
Weekley (A)
Beta 0.117 <0.0001
Weekley ( C )
Beta 0.562 <0.0001
Pad 2 ( C )
Beta Non
Detect
<0.0001
Pad 2 (A)
Beta 0.528 <0.0001
Pad 3 (A)
Beta 0.369 <0.0001
Pad 3 ( C )
Beta 0.617 <0.0001
Maury ( D )
Beta 0.608 <0.0001
Lemons ( C )
Beta 0.214 <0.0001
Lemons (A)
Beta Non
Detect
<0.0001
WV DNR (A)
Beta 0.076 <0.0001
WV DNR (C)
30
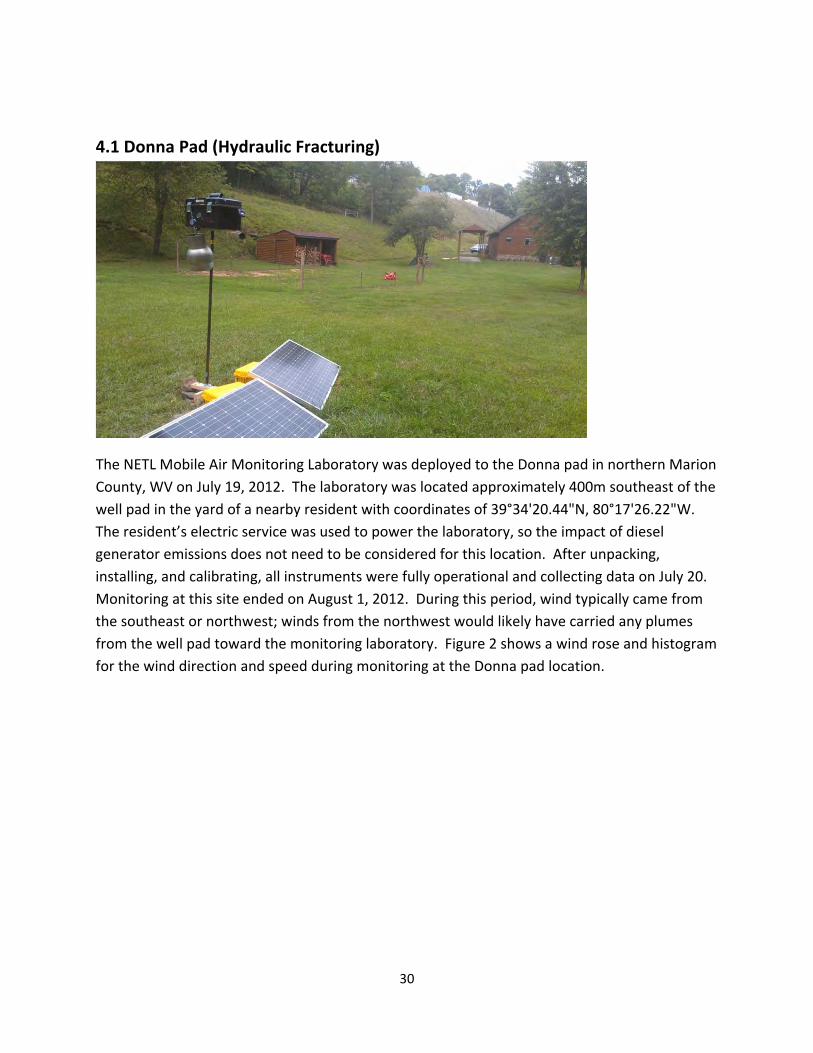
4.1 Donna Pad (Hydraulic Fracturing)
The NETL Mobile Air Monitoring Laboratory was deployed to the Donna pad in northern Marion
County, WV on July 19, 2012. The laboratory was located approximately 400m southeast of the
well pad in the yard of a nearby resident with coordinates of 39°34'20.44"N, 80°17'26.22"W.
The resident’s electric service was used to power the laboratory, so the impact of diesel
generator emissions does not need to be considered for this location. After unpacking,
installing, and calibrating, all instruments were fully operational and collecting data on July 20.
Monitoring at this site ended on August 1, 2012. During this period, wind typically came from
the southeast or northwest; winds from the northwest would likely have carried any plumes
from the well pad toward the monitoring laboratory. Figure 2 shows a wind rose and histogram
for the wind direction and speed during monitoring at the Donna pad location.

31
Figure 4.1a. Wind rose and histogram for wind direction and speed during monitoring at the Donna pad
location.

32
Figure 4.1b. Satellite photo of the Donna pad showing sampling sites (A,B,C, D) as red dots and location
of DOE trailer as shown by the green arrow. Black circle is the 625 foot setback distance.
Fig 4.1c Terrain map of the Donna pad showing sampling sites (A,B,C, D) as red dots and location of DOE
trailer as a yellow dot. Black circle is the 625 foot setback distance.

33
4.1.1 Hydrocarbon (HC) Results
HC data were collected over the entire duration of the Donna pad monitoring campaign, 7/20‐
8/1, for a total of 226 samples.
Table 4.1 GC‐FID HC results
4.1.2 Summa Canister HC Results
Only results above the reporting limit (Rpt Limit), that is, the concentration detectable with a
statistical certainty are reported.
Average Concentration, ppb
Standard Deviation, ppb
Minimum Concentration, ppb
Maximum Concentration, ppb
Frequency of Detection, %
hexane 1.2 2 0 10.3 42
n‐heptane 0.4 1.0 0 5.1 19
methylcyclohexane 0.4 1.0 0 5.2 19
toluene 1.4 0.9 0 4.1 84
ethane 59.4 108.3 9.2 837.5 100
ethylene 0.6 0.8 0 3.5 37
propane 22.2 20.8 3.4 175.9 100
isobutane 5.3 3.9 0.7 31.4 100
n‐butane 8.9 7.0 1.5 52.3 100
isopentane 4.9 3.3 0.7 21.6 100
n‐pentane 3.7 2.6 0.3 18.4 100
2methylpentane 1.3 1.5 0 6.9 60
3methylpentane 0.9 1.2 0 6.5 50
isoprene 5.5 4.5 0 25.4 94

34
Samples B1, C1, D1, A2 – no detectable HC compounds
4.1.2.3 Photoionization Detector (PID) Analysis Results
Instrument malfunctions resulted in loss of Photoionization Detector (PID) data for this site.
4.1.3 Ozone Results
Although the instrument was operating on July 20, ozone data are available from July 24
through August 1 (Figure 4.1d). There was a delay in obtaining data from the analyzer due to a

35
faulty wiring connection. The average ozone concentration using one minute data at the Donna
pad was 33ppb, and the maximum hourly average concentration was 65ppb. Day‐to‐night
variations were as high as 50ppb. Calculating 8‐hour averages to more directly compare to the
NAAQS results in a range of 8‐hour averages of 9ppb – 56ppb.
Figure 4.1d. One‐minute average ozone concentrations at the Donna pad.
4.1.4 NOx Results
Data for NOx are available for July 21‐24 and July 27‐August 1 (Figure 4.1e). The gap between
July 21 and 24 was due to an instrument malfunction that occurred during the calibration on
July 24. The instrument was brought back to NETL in Pittsburgh for repairs and then returned
to the Donna pad location. The average concentration of NOx at the Donna pad was 1.3ppb,
with peaks not exceeding 30ppb.

36
Figure 4.1e. One‐minute average NOx concentrations at the Donna pad.
4.1.5 Methane Results
The ambient methane concentration at the Donna Pad averaged 2.1 ppm (±0.1) with an
average isotopic composition of ‐49.3‰ (±1.3‰) which are typical background atmospheric
values (Figures 4.1f and g). With the exception of a few short‐term peaks, the only time the
concentration exceeded 4 ppm occurred between the evening of 7/28 through mid‐day on
7/29. During this time the average concentration of methane was 8.1 ppm with a maximum
concentration of 36.2 ppm. The average δ13C for this time frame increased to ‐40.8‰ with a
maximum value of ‐35.8‰, indicating a significant contribution from a thermogenic methane
source during this time.
37
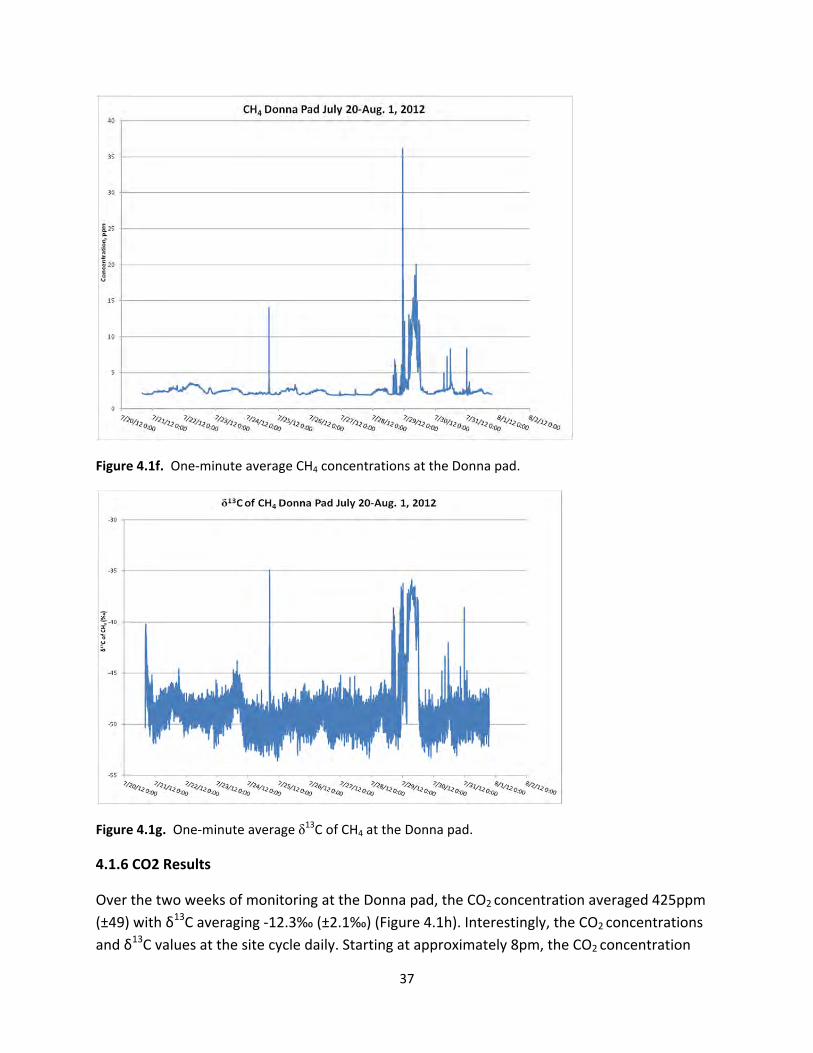
Figure 4.1f. One‐minute average CH4 concentrations at the Donna pad.
Figure 4.1g. One‐minute average δ13C of CH4 at the Donna pad.
4.1.6 CO2 Results
Over the two weeks of monitoring at the Donna pad, the CO2 concentration averaged 425ppm
(±49) with δ13C averaging ‐12.3‰ (±2.1‰) (Figure 4.1h). Interestingly, the CO2 concentrations
and δ13C values at the site cycle daily. Starting at approximately 8pm, the CO2 concentration

38
increased sharply to values typically greater than 450ppm and occasionally greater than
500ppm before dropping back to near ambient levels by 7am. During these times, the
corresponding δ13C values become more depleted, dropping to less than ‐14‰. The maximum
CO2 concentration at the site was 594ppm with a corresponding δ13C value of ‐16.0‰.
Figure 4.1h. One‐minute average CO2 concentrations and δ13C of CO2 at the Donna pad.
4.1.7 (Dust) Results
4.1.7.1 TEOM
Data are available for July 20‐Aug. 1 (Figure 4.1i). At the Donna pad, Average PM10
concentration was 19g/m3 and average PM2.5 concentration was 11g/m3. Maximum one‐
hour average concentrations of PM10 and PM2.5 were 76g/m3 and 38g/m3, respectively.

39
Figure 4.1i. One‐hour average PM10 and PM2.5 concentrations at the Donna pad.
4.1.7.2 Dust Track Results
A software malfunction resulted in loss of Dust Track dust data for this site.
4.1.8 Noise Results
The average noise level was 52 dBA with a standard deviation of 10 for sites A, C and D. Site C
which was closest to the road but 625 feet from the center of the pad had the highest continual
noise level at 60 with Sites A and D at 49 and 47 dBA respectively. Site B had a failure in the noise monitor.

40
Figure 4.1j. Noise levels for Sites A, C, D at Donna Pad. Hours 0, 24, 48 etc. are midnight. Heavy, vertical
lines are noon for each day.
0
20
40
60
80
0 24 48 72 96 120 144 168 192 216 240 264
Sound Level (dBA)
Time (Hours)
Site A
0
20
40
60
80
0 24 48 72 96 120 144 168 192 216 240 264Sound Level (dBA)
Time (Hours)
Site C
0
10
20
30
40
50
60
70
0 24 48 72 96 120 144 168 192 216 240 264
Sound Level (dBA)
Time (Hours)
Site D

41
4.1.9 SO2 Results
Data for SO2 are available for the entire monitoring period, July 21‐August 1 (Figure 4.1k). The average
concentration of SO2 at the Donna pad was 3.3ppb, with peaks not exceeding 23ppb. Calculating 1‐
hour averages from the one‐minute data for a more direct comparison with the NAAQS for SO2 results in
a range of 1‐hour averages of 1.4ppb – 11.5ppb. Similarly, calculating 3‐hour averages from the one‐
minute data results in a range of 1.9ppb –10.4ppb.
Figure 4.1k. One‐minute average SO2 concentrations .
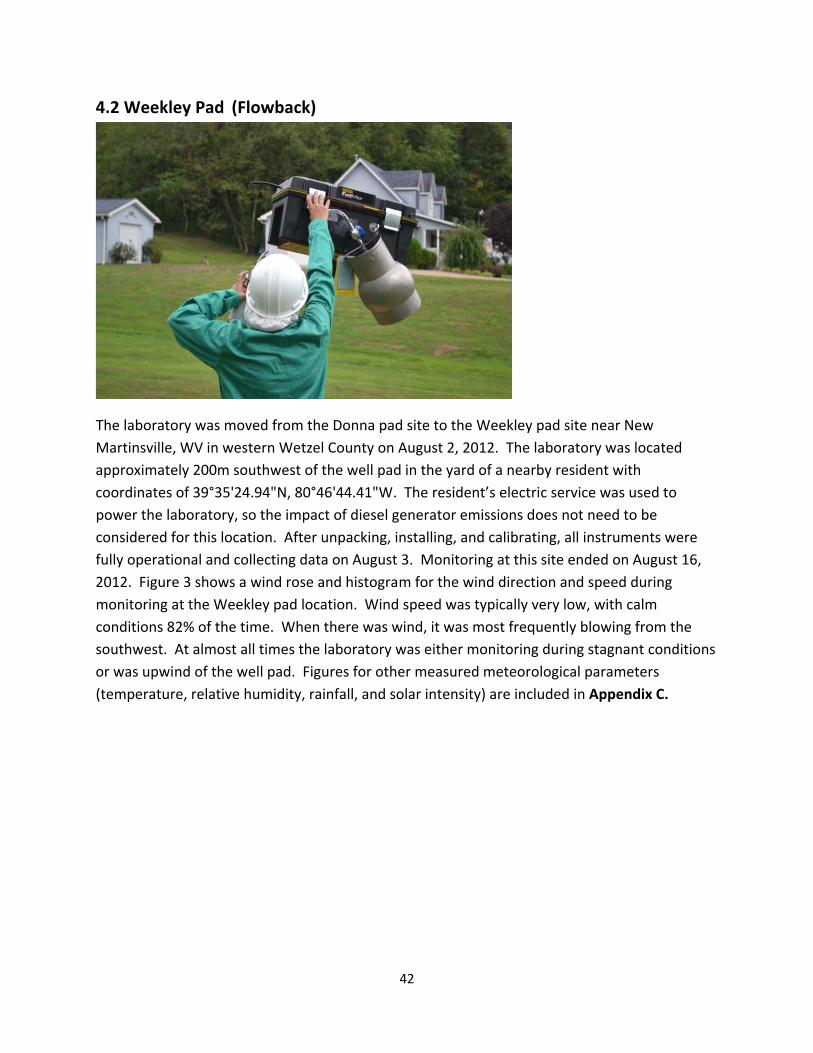
42
4.2 Weekley Pad (Flowback)
The laboratory was moved from the Donna pad site to the Weekley pad site near New
Martinsville, WV in western Wetzel County on August 2, 2012. The laboratory was located
approximately 200m southwest of the well pad in the yard of a nearby resident with
coordinates of 39°35'24.94"N, 80°46'44.41"W. The resident’s electric service was used to
power the laboratory, so the impact of diesel generator emissions does not need to be
considered for this location. After unpacking, installing, and calibrating, all instruments were
fully operational and collecting data on August 3. Monitoring at this site ended on August 16,
2012. Figure 3 shows a wind rose and histogram for the wind direction and speed during
monitoring at the Weekley pad location. Wind speed was typically very low, with calm
conditions 82% of the time. When there was wind, it was most frequently blowing from the
southwest. At almost all times the laboratory was either monitoring during stagnant conditions
or was upwind of the well pad. Figures for other measured meteorological parameters
(temperature, relative humidity, rainfall, and solar intensity) are included in Appendix C.

43
Figure 4.2a. Wind rose and histogram for wind direction and speed during monitoring at the Weekley
Pad.
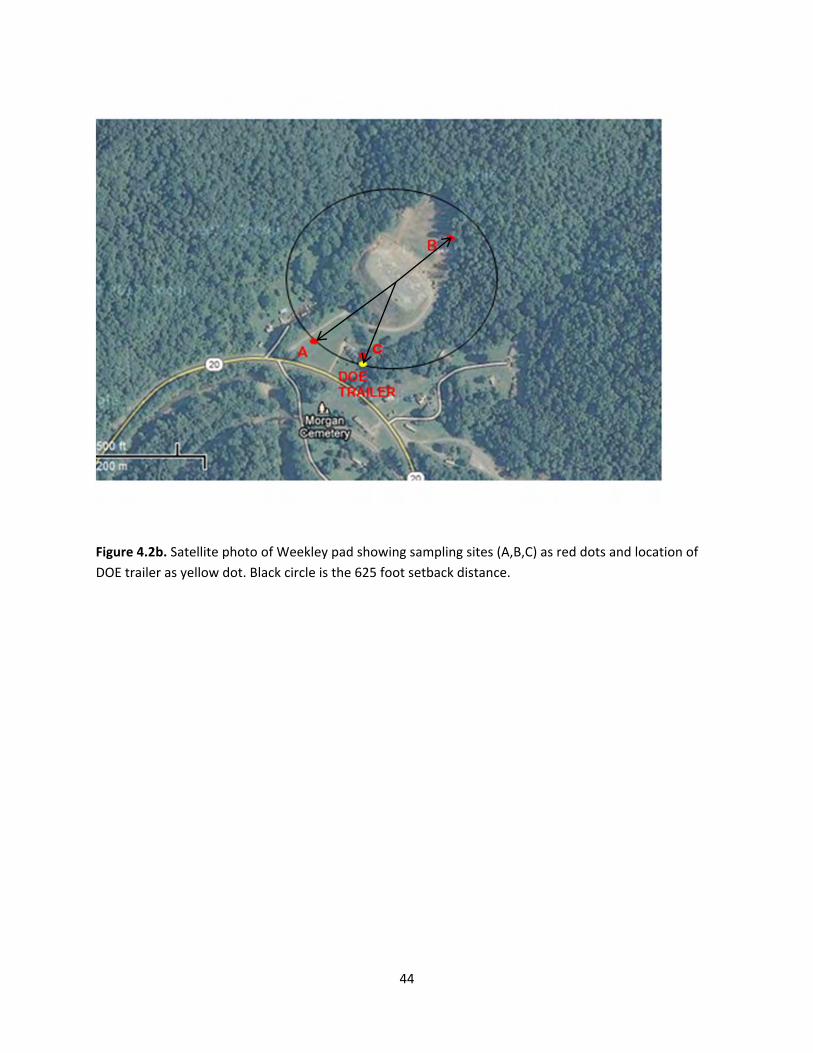
44
Figure 4.2b. Satellite photo of Weekley pad showing sampling sites (A,B,C) as red dots and location of
DOE trailer as yellow dot. Black circle is the 625 foot setback distance.

45
Figure 4.2c Terrain map of Weekley pad showing sampling sites (A,B,C) as red dots and location of DOE trailer as yellow dot. Black circle is the 625 foot setback distance.
4.2.1 HC Results
At the Weekley pad site, there were a total of 274 samples. The analyzer ran continuously from
August 3‐16, with a break in the data for several hours on August 9 for a scheduled
preventative maintenance check by a Perkin Elmer technician.

46
Table 4.2. GC‐FID results
4.2.2 Summa Canister HC Results
Only results above the reporting limit (Rpt Limit), that is, the concentration detectable with a
statistical certainty are reported.
Compound Average (ppb) Standard Deviation (ppb)
Minimum (ppb)
Maximum (ppb)
Frequency of Detection (%)
Hexane 6.2 23.9 0.0 375.8 54
Methylcyclopentane 0.4 1.8 0.0 28.1 15
Cyclohexane 0.6 2.5 0.0 36.3 23
2‐methylhexane 1.1 4.5 0.0 65.7 23
3‐methylhexane 1.1 4.4 0.0 62.1 24
n‐heptane 2.3 7.4 0.0 97.9 30
Methylcyclohexane 1.4 4.0 0.0 52.1 30
Toluene 0.7 1.3 0.0 12.1 32
2‐methylheptane 0.4 1.5 0.0 15.5 16
3‐methylheptane 0.5 1.9 0.0 19.9 17
n‐octane 1.0 3.0 0.0 27.6 22
Nonane 0.4 1.4 0.0 11.5 12
Ethane 75.9 199.9 3.3 3,169 100
Propane 71.9 285.1 2.1 4.639 100
Isobutane 20.8 73.3 0.0 1,158 97
n‐butane 44.5 199.9 1.0 3,249 100
Isopentane 17.0 24.0 0.0 186 100
n‐pentane 19.2 75.6 0.0 1,212 99
2,3‐dimethylbutane 0.4 2.3 0.0 35.3 11
2‐methylpentane 4.7 15.2 0.0 240 76
3‐methylpentane 3.0 9.7 0.0 151 67
Isoprene 6.6 5.2 0.0 23.8 90
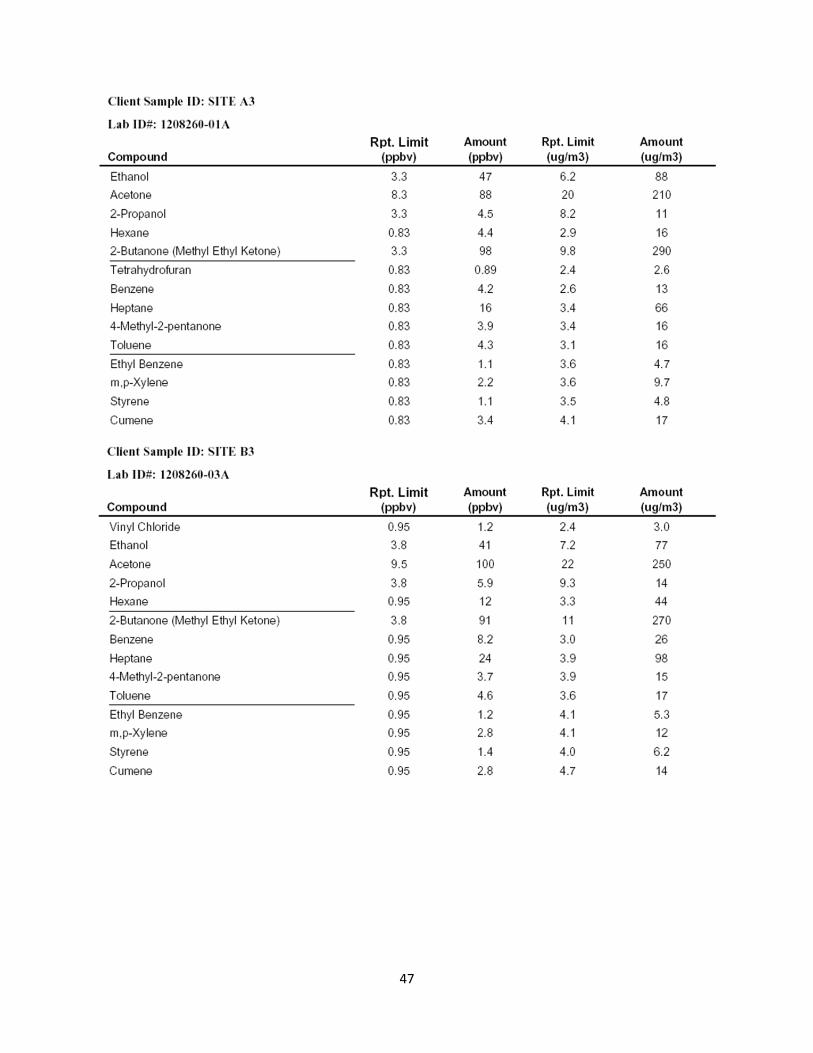
47
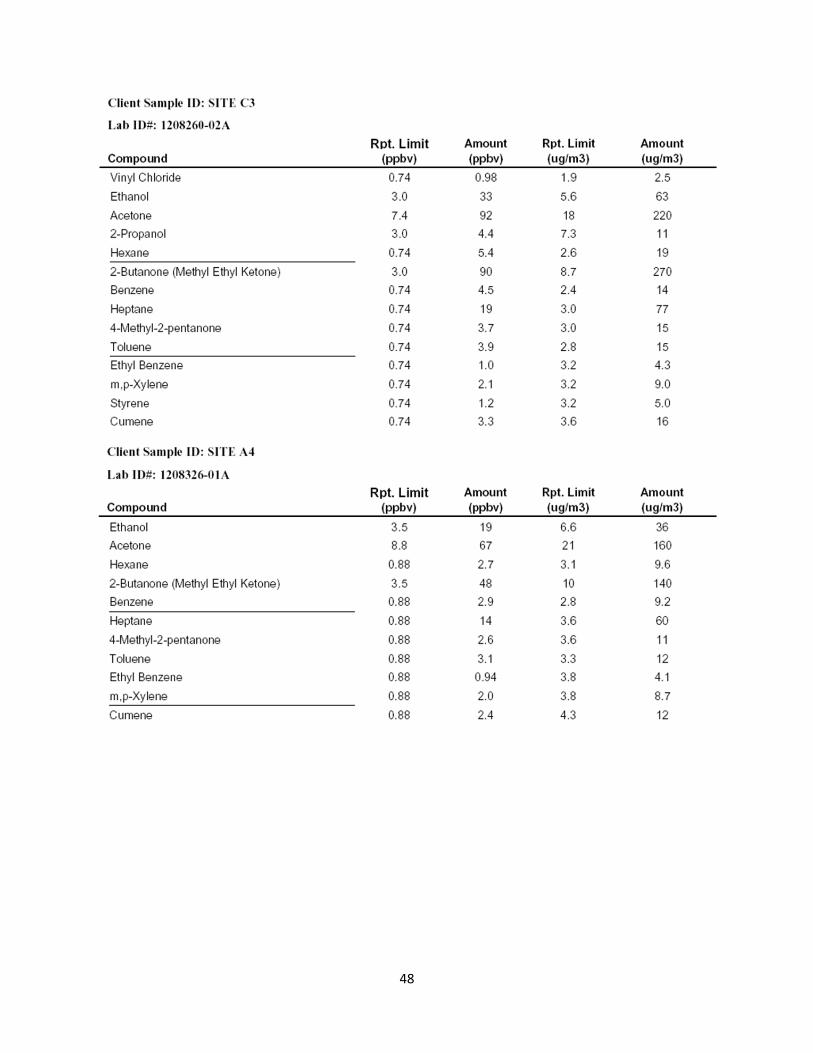
48

49

50
4.2.2.1 PID Results
Figure 4.2.2a. Results for Site C for 8/7‐13/2012.
Instrument malfunctions occurred at sites A and B resulting in loss of data for those sites for the
PID.
4.2.3 Ozone Results
Ozone data are available for the entire monitoring period at this site, August 3‐16 (Figure 4.2d).
The average ozone concentration using one minute data at the Weekley pad was 30ppb, and
the maximum hourly average concentration was 91ppb. Day‐to‐night variations ranged from
20‐85ppb. Calculating 8‐hour averages to more directly compare to the NAAQS results in a
range of 8‐hour averages of 4ppb – 78ppb.
0
2
4
6
8
10
12
14
16
18
20
0 1 2 3 4 5 6 7
Hydrocarbon Concentration (ppb)
TIME (days)
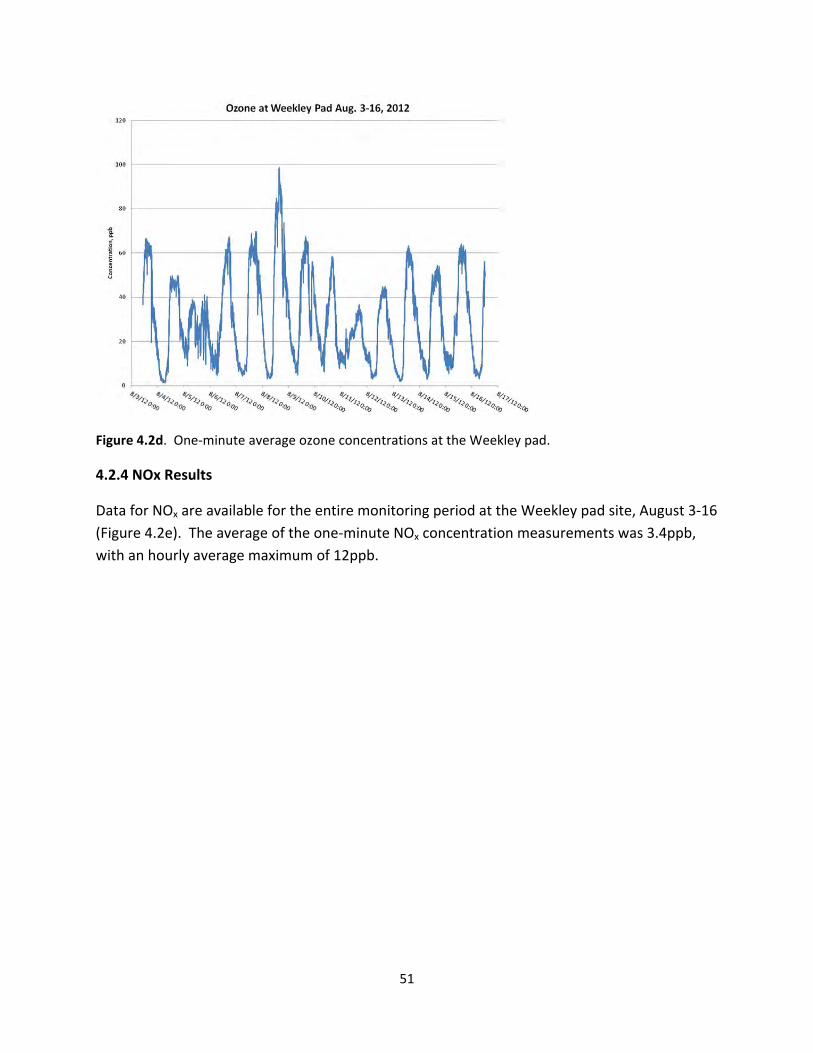
51
Figure 4.2d. One‐minute average ozone concentrations at the Weekley pad.
4.2.4 NOx Results
Data for NOx are available for the entire monitoring period at the Weekley pad site, August 3‐16
(Figure 4.2e). The average of the one‐minute NOx concentration measurements was 3.4ppb,
with an hourly average maximum of 12ppb.
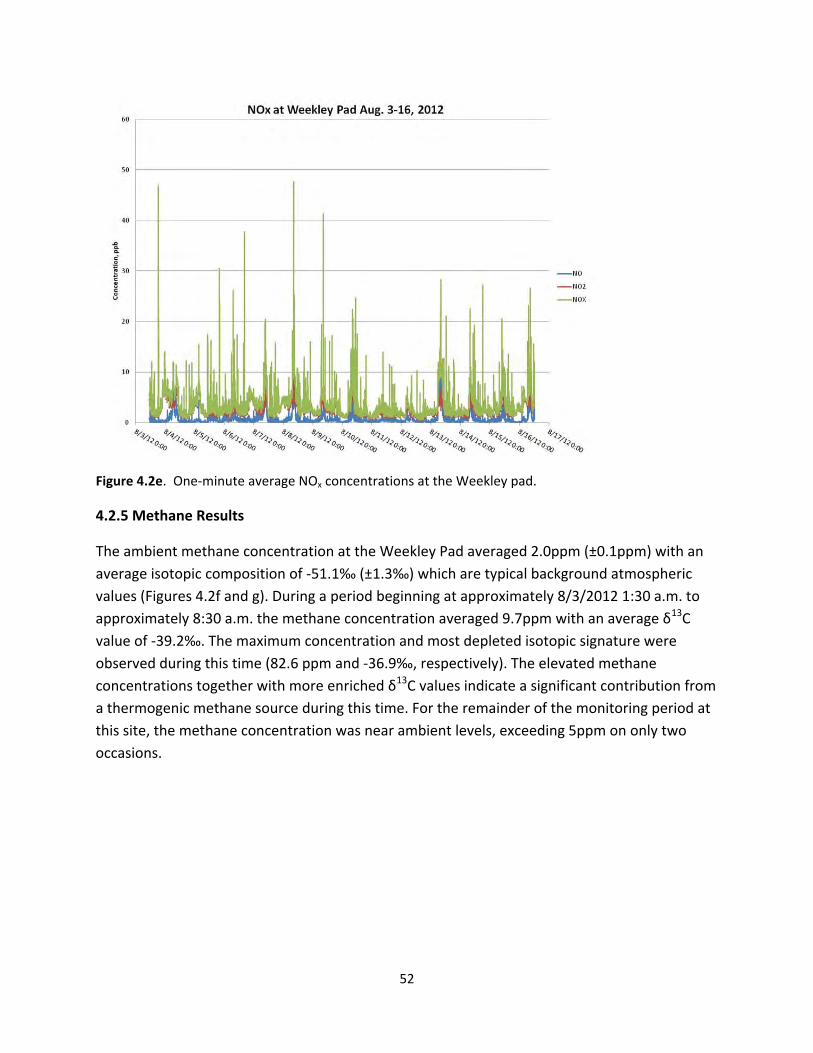
52
Figure 4.2e. One‐minute average NOx concentrations at the Weekley pad.
4.2.5 Methane Results
The ambient methane concentration at the Weekley Pad averaged 2.0ppm (±0.1ppm) with an
average isotopic composition of ‐51.1‰ (±1.3‰) which are typical background atmospheric
values (Figures 4.2f and g). During a period beginning at approximately 8/3/2012 1:30 a.m. to
approximately 8:30 a.m. the methane concentration averaged 9.7ppm with an average δ13C
value of ‐39.2‰. The maximum concentration and most depleted isotopic signature were
observed during this time (82.6 ppm and ‐36.9‰, respectively). The elevated methane
concentrations together with more enriched δ13C values indicate a significant contribution from
a thermogenic methane source during this time. For the remainder of the monitoring period at
this site, the methane concentration was near ambient levels, exceeding 5ppm on only two
occasions.
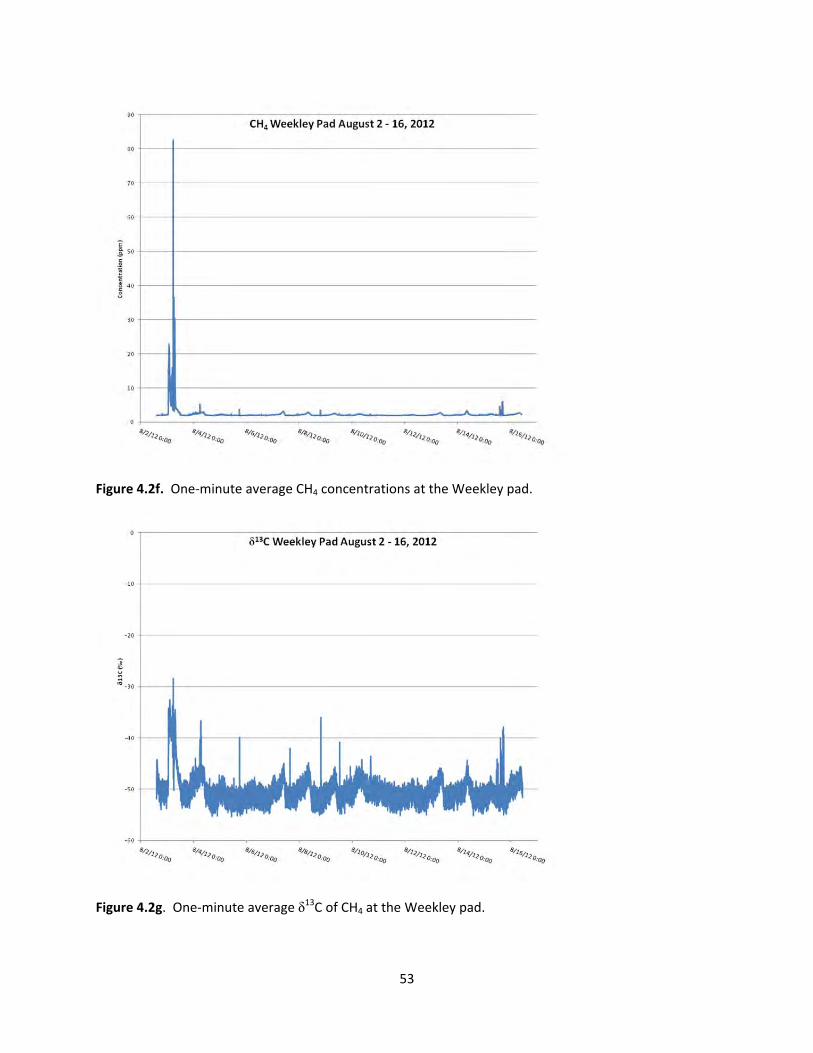
53
Figure 4.2f. One‐minute average CH4 concentrations at the Weekley pad.
Figure 4.2g. One‐minute average δ13C of CH4 at the Weekley pad.
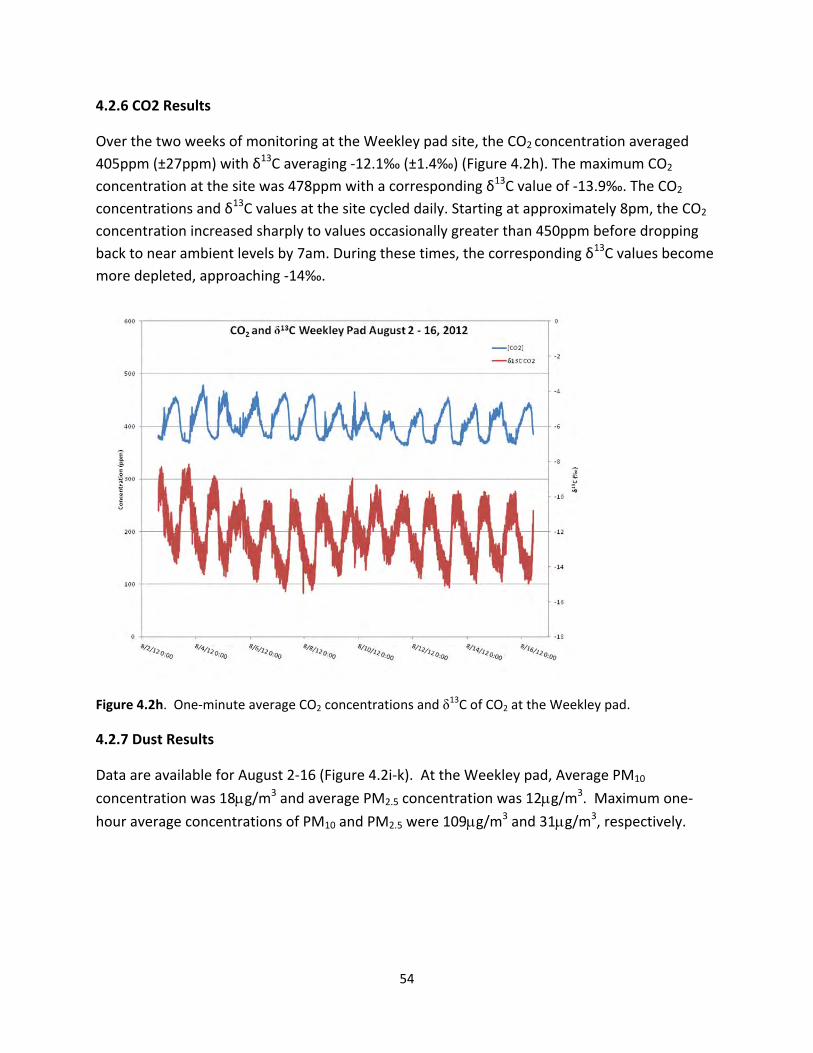
54
4.2.6 CO2 Results
Over the two weeks of monitoring at the Weekley pad site, the CO2 concentration averaged
405ppm (±27ppm) with δ13C averaging ‐12.1‰ (±1.4‰) (Figure 4.2h). The maximum CO2
concentration at the site was 478ppm with a corresponding δ13C value of ‐13.9‰. The CO2
concentrations and δ13C values at the site cycled daily. Starting at approximately 8pm, the CO2
concentration increased sharply to values occasionally greater than 450ppm before dropping
back to near ambient levels by 7am. During these times, the corresponding δ13C values become
more depleted, approaching ‐14‰.
Figure 4.2h. One‐minute average CO2 concentrations and δ13C of CO2 at the Weekley pad.
4.2.7 Dust Results
Data are available for August 2‐16 (Figure 4.2i‐k). At the Weekley pad, Average PM10
concentration was 18g/m3 and average PM2.5 concentration was 12g/m3. Maximum one‐
hour average concentrations of PM10 and PM2.5 were 109g/m3 and 31g/m3, respectively.

55
Figure 4.2i. One‐hour average PM10 and PM2.5 concentrations at the Weekley pad from TEOM.

56
Figure 4.2j.WEEKLEY PM 2.5 Dust Track 8/6‐13/2012 data for Site A, with hourly data points and 24 hour averages represented as bar lines.
0
10
20
30
40
50
60
0 1 2 3 4 5 6 7 8
PM 2.5 DUST CONCEN
TRATION (ug/m
3)
TIME (days)

57
Figure 4.2k. WEEKLEY PM 2.5 Dust Track 8/6‐13/2012 data for Site C, with hourly data points and 24 hour averages represented as bar lines.
4.2.8 SO2 Results
Data for SO2 are available for the entire monitoring period, August 3‐16 (Figure 4.2l). The
average concentration of SO2 at the Weekley pad was 2.7ppb, with peaks not exceeding 27ppb.
Calculating 1‐hour averages from the one‐minute data for a more direct comparison with the
NAAQS for SO2 results in a range of 1‐hour averages of 0.7ppb – 16.4ppb. Similarly, calculating
3‐hour averages from the one‐minute data results in a range of 1.1ppb –12.4ppb.
0
5
10
15
20
25
0 1 2 3 4 5 6 7
PM 2.5 DUST CONCEN
TRATION (ug/m
3)
TIME (days)
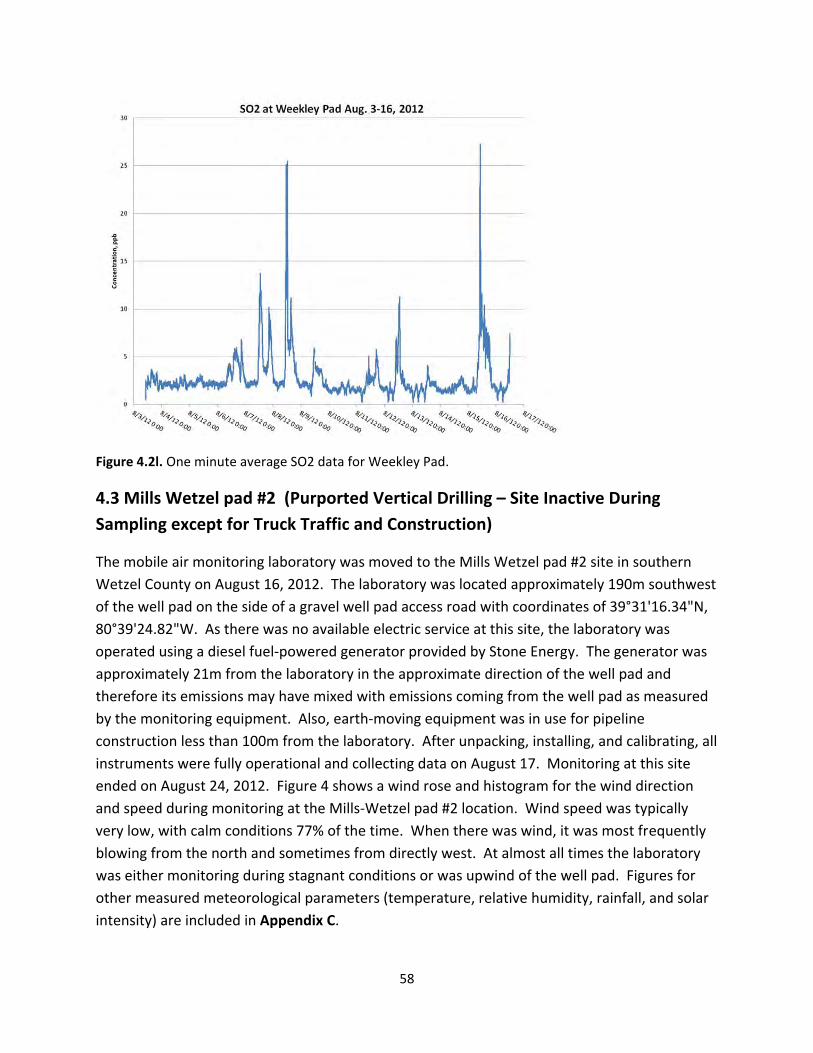
58
Figure 4.2l. One minute average SO2 data for Weekley Pad.
4.3 Mills Wetzel pad #2 (Purported Vertical Drilling – Site Inactive During
Sampling except for Truck Traffic and Construction)
The mobile air monitoring laboratory was moved to the Mills Wetzel pad #2 site in southern
Wetzel County on August 16, 2012. The laboratory was located approximately 190m southwest
of the well pad on the side of a gravel well pad access road with coordinates of 39°31'16.34"N,
80°39'24.82"W. As there was no available electric service at this site, the laboratory was
operated using a diesel fuel‐powered generator provided by Stone Energy. The generator was
approximately 21m from the laboratory in the approximate direction of the well pad and
therefore its emissions may have mixed with emissions coming from the well pad as measured
by the monitoring equipment. Also, earth‐moving equipment was in use for pipeline
construction less than 100m from the laboratory. After unpacking, installing, and calibrating, all
instruments were fully operational and collecting data on August 17. Monitoring at this site
ended on August 24, 2012. Figure 4 shows a wind rose and histogram for the wind direction
and speed during monitoring at the Mills‐Wetzel pad #2 location. Wind speed was typically
very low, with calm conditions 77% of the time. When there was wind, it was most frequently
blowing from the north and sometimes from directly west. At almost all times the laboratory
was either monitoring during stagnant conditions or was upwind of the well pad. Figures for
other measured meteorological parameters (temperature, relative humidity, rainfall, and solar
intensity) are included in Appendix C.
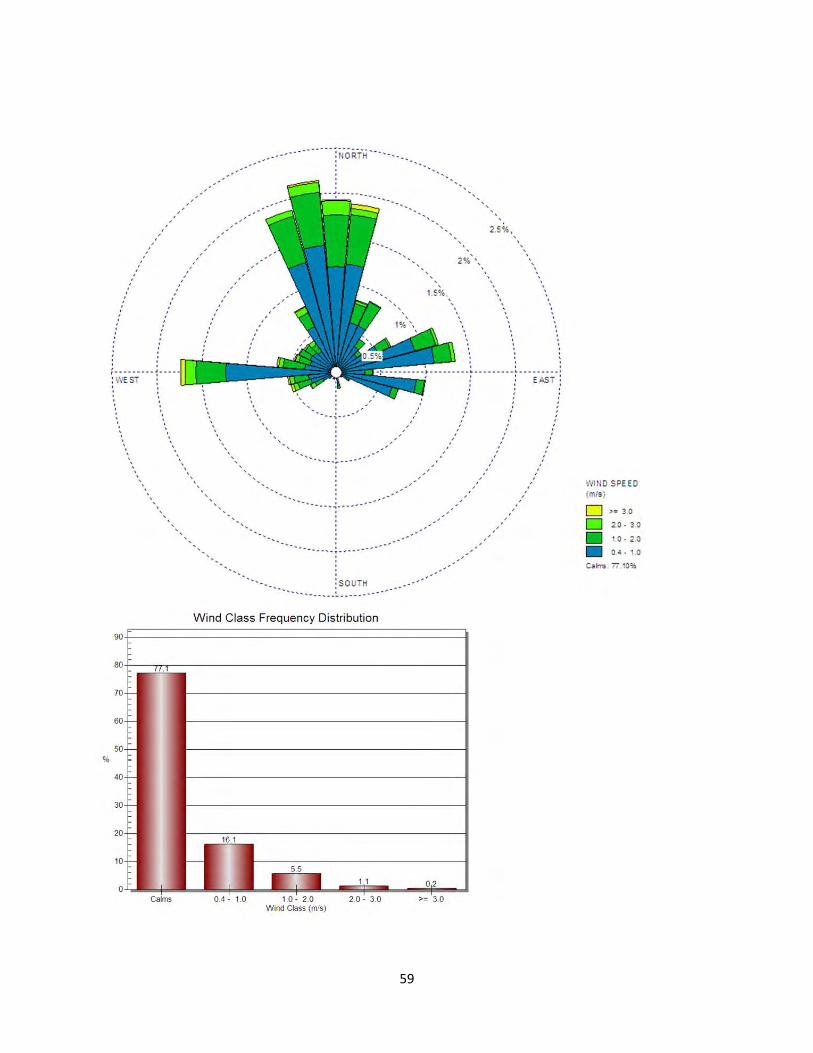
59
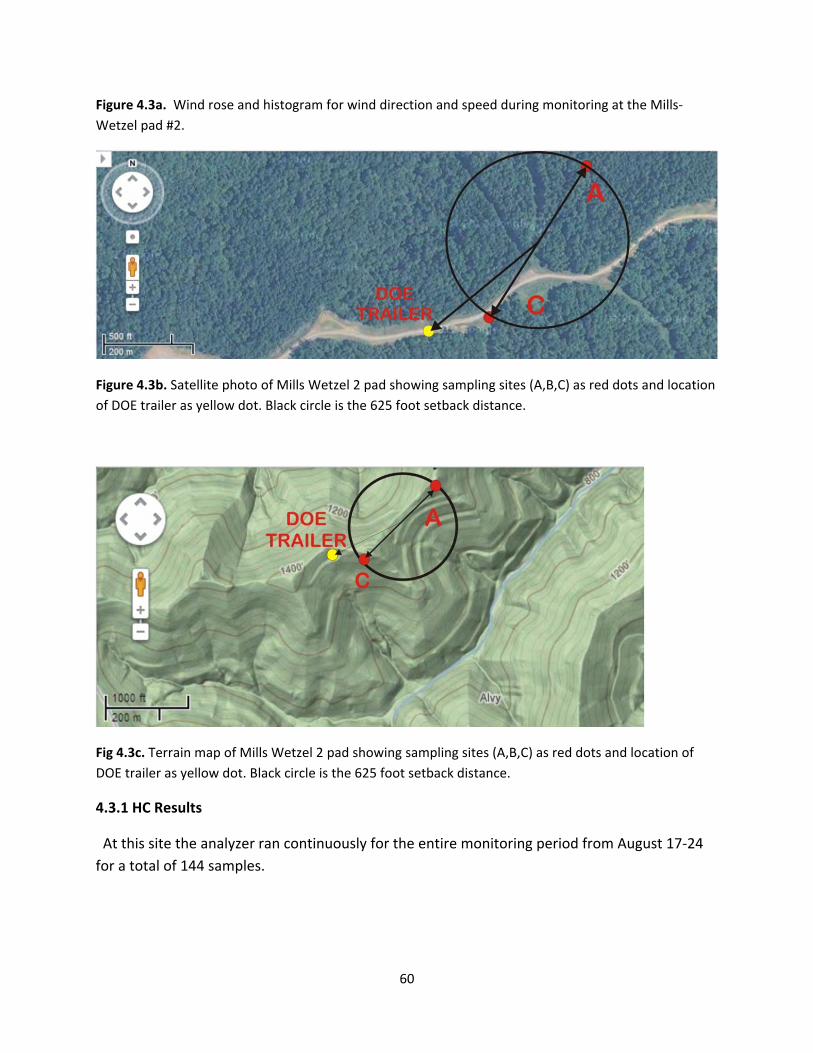
60
Figure 4.3a. Wind rose and histogram for wind direction and speed during monitoring at the Mills‐
Wetzel pad #2.
Figure 4.3b. Satellite photo of Mills Wetzel 2 pad showing sampling sites (A,B,C) as red dots and location
of DOE trailer as yellow dot. Black circle is the 625 foot setback distance.
Fig 4.3c. Terrain map of Mills Wetzel 2 pad showing sampling sites (A,B,C) as red dots and location of
DOE trailer as yellow dot. Black circle is the 625 foot setback distance.
4.3.1 HC Results
At this site the analyzer ran continuously for the entire monitoring period from August 17‐24
for a total of 144 samples.

61
Table 4.3 GC‐FID HC results
Compound Average (ppb) Standard Deviation (ppb)
Minimum (ppb)
Maximum (ppb)
Frequency of Detection (%)
Hexane 1.8 2.6 0.0 13.0 56
n‐heptane 0.4 0.9 0.0 5.4 22
Methylcyclohexane 0.5 1.0 0.0 5.8 24
Toluene 1.0 1.6 0.0 10.7 44
Ethane 56.2 43.1 7.8 271.7 100
Ethylene 0.6 1.1 0 6.1 34
Propane 33.4 27.0 6.3 168.8 100
Isobutane 9.0 6.9 1.1 40.7 100
n‐butane 16.3 13.1 3.9 79.5 100
Isopentane 10.9 10.1 2.1 68.7 100
n‐pentane 7.6 6.7 0.7 40.3 100
2‐methylpentane 2.2 2.4 0.0 13.1 69
3‐methylpentane 1.2 1.8 0.0 9.2 46
Isoprene 5.2 4.7 0.0 21.4 68
4.3.2 Summa Canister HC Results
Only results above the reporting limit (Rpt Limit), that is, the concentration detectable with a
statistical certainty are reported.
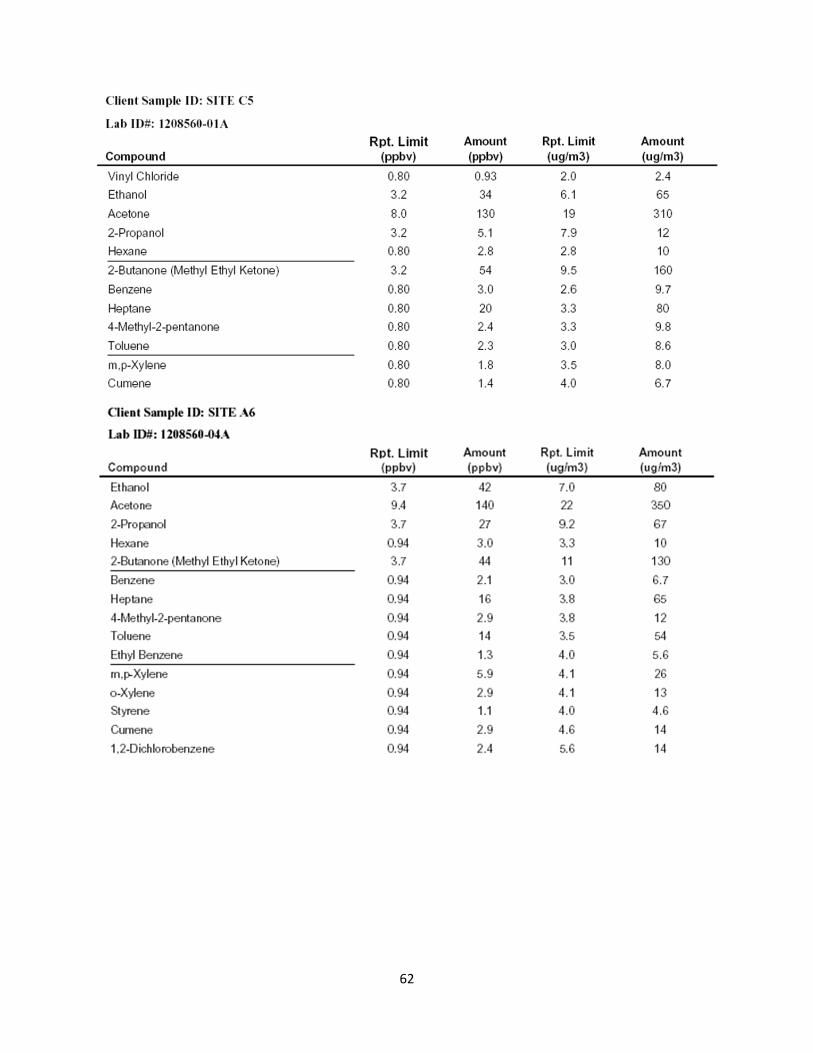
62

63
4.3.3 Ozone Results
Ozone data are available for the entire monitoring period at this site, August 17‐24 (Figure 4.3
d). The average ozone concentration using one minute data at the Mills‐Wetzel pad #2 was
46ppb, and the maximum hourly average concentration was 71ppb. Day‐to‐night variations
were as high as 60ppb. Calculating 8‐hour averages to more directly compare to the NAAQS
results in a range of 8‐hour averages of 20ppb – 67ppb.
Figure 4.3d. One‐minute average ozone concentrations at the Mills‐Wetzel pad #2.
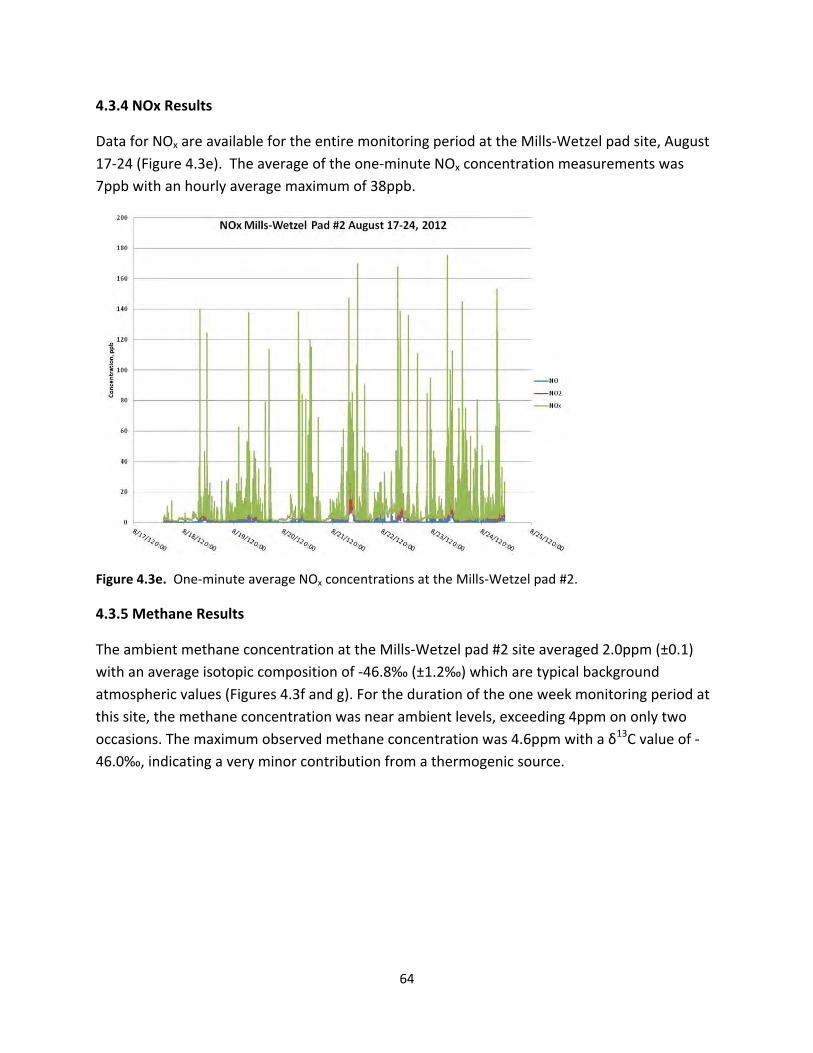
64
4.3.4 NOx Results
Data for NOx are available for the entire monitoring period at the Mills‐Wetzel pad site, August
17‐24 (Figure 4.3e). The average of the one‐minute NOx concentration measurements was
7ppb with an hourly average maximum of 38ppb.
Figure 4.3e. One‐minute average NOx concentrations at the Mills‐Wetzel pad #2.
4.3.5 Methane Results
The ambient methane concentration at the Mills‐Wetzel pad #2 site averaged 2.0ppm (±0.1)
with an average isotopic composition of ‐46.8‰ (±1.2‰) which are typical background
atmospheric values (Figures 4.3f and g). For the duration of the one week monitoring period at
this site, the methane concentration was near ambient levels, exceeding 4ppm on only two
occasions. The maximum observed methane concentration was 4.6ppm with a δ13C value of ‐
46.0‰, indicating a very minor contribution from a thermogenic source.
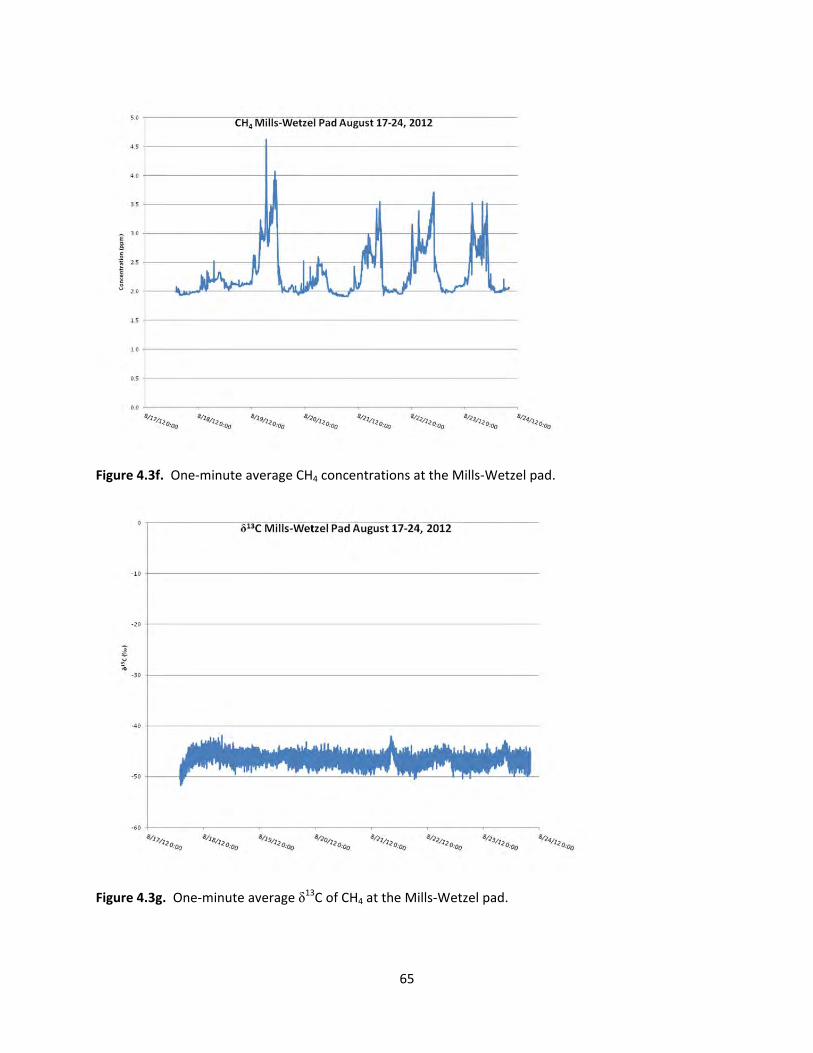
65
Figure 4.3f. One‐minute average CH4 concentrations at the Mills‐Wetzel pad.
Figure 4.3g. One‐minute average δ13C of CH4 at the Mills‐Wetzel pad.

66
4.3.6 CO2 Results
Over the one week of monitoring at the Mills Wetzel pad #2 site, the CO2 concentration
averaged 384ppm (±13ppm) with δ13C averaging ‐10.8‰ (±1.0‰) (Figure 4.3h). The maximum
CO2 concentration at the site was 509ppm with a corresponding δ13C value of ‐14.8‰. The CO2
concentrations and δ13C values at the site cycled daily. Starting at approximately 8pm, the CO2
concentration increased gradually to values occasionally greater than 410ppm before dropping
back to near ambient levels by 7am. During these times, the corresponding δ13C values become
more depleted, approaching ‐12‰.
Figure 4.3h. One‐minute average CO2 concentrations and δ13C of CO2 at the Mills‐Wetzel pad.
4.3.7 TEOM (Dust) Results
Data are available for August 17‐24 (Figure 4.3i‐k). At the Mills‐Wetzel pad, Average PM10
concentration was 30g/m3 and average PM2.5 concentration was 12g/m3. Maximum one‐
hour average concentrations of PM10 and PM2.5 were 546g/m3 and 36g/m3, respectively. The
substantial peaks in PM10 concentration at this site were likely due to the mobile air monitoring
laboratory’s position on the side of a gravel well pad access road as well as the nearby earth‐
moving activity for pipeline construction.

67
Figure 4.3i. One‐hour average PM10 and PM2.5 concentrations at the Mills‐Wetzel pad #2.
Figure 4.3j. MILLS‐WETZEL PAD 2, PM 2.5 Dust Track 8/15‐23/2012 data for Site A, with hourly data
points and 24 hour averages represented as bar lines. (Note the small range of the vertical axis denoting
a constant level being recorded by the device.)
0
2
4
6
8
10
12
14
0 1 2 3 4 5 6 7 8 9
PM2.5 Concentration (ug/m3)
Time (days)
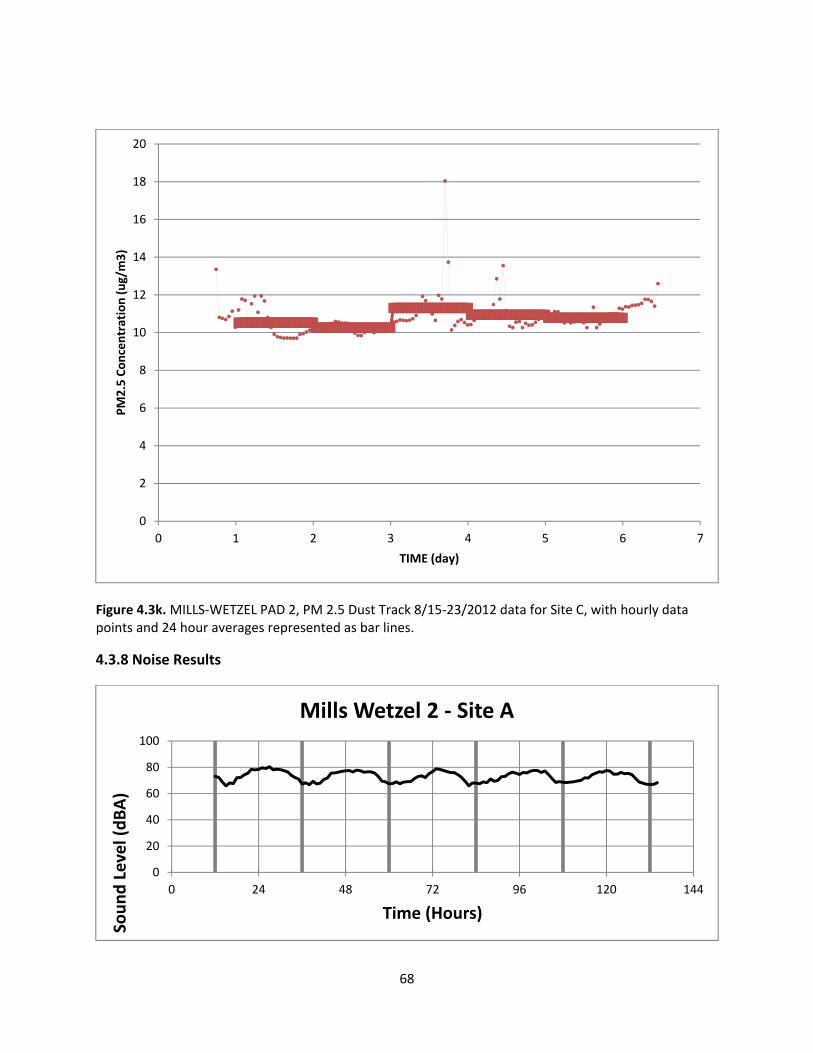
68
Figure 4.3k. MILLS‐WETZEL PAD 2, PM 2.5 Dust Track 8/15‐23/2012 data for Site C, with hourly data points and 24 hour averages represented as bar lines.
4.3.8 Noise Results
0
2
4
6
8
10
12
14
16
18
20
0 1 2 3 4 5 6 7
PM2.5 Concentration (ug/m3)
TIME (day)
0
20
40
60
80
100
0 24 48 72 96 120 144
Sound Level (dBA)
Time (Hours)
Mills Wetzel 2 ‐ Site A

69
Figure 4.3l. Noise levels averaged 56 for site A and 73 for site C with an average level of 65 dBA with a standard deviation of 10 for the two sites together. Hours 0, 24, 48 etc. are midnight.
Heavy, vertical lines are noon for each day.
4.3.9 SO2 Results Data for SO2 are available for the entire monitoring period, August 17‐24 (Figure 4.3m). The
average concentration of SO2 at the Weekley pad was 3.0ppb, with peaks not exceeding 17ppb.
Calculating 1‐hour averages from the one‐minute data for a more direct comparison with the
NAAQS for SO2 results in a range of 1‐hour averages of 1.4ppb – 9.5ppb. Similarly, calculating
3‐hour averages from the one‐minute data results in a range of 1.6ppb –8.4ppb.
0
10
20
30
40
50
60
70
80
90
0 24 48 72 96 120 144
NOISE LEVEL (dBA)
TIME (hours)
MILLS WETZEL 2 ‐ SITE C

70
Figure 4.3m. One‐minute average SO2 concentrations
4.4 Mills Wetzel pad #3 (Site Preparation)
Sampling was conducted over an 8 day period from August 24‐31, 2012 using a Dust Track
direct reading dust monitor. The DOE trailer was not available to monitor this site. The
monitors at Sites A and C were adjusted by the same density factor used for the Mills Wetzel
pad #2 less than a mile away. No PID was used because of high dust levels potentially disabling
the monitors.
Fig 4.4a. Satellite photo of Mills Wetzel 3 pad showing sampling sites (A, C) as red dots. The DOE trailer
was not placed at this location. Black circle is the 625 foot setback distance.
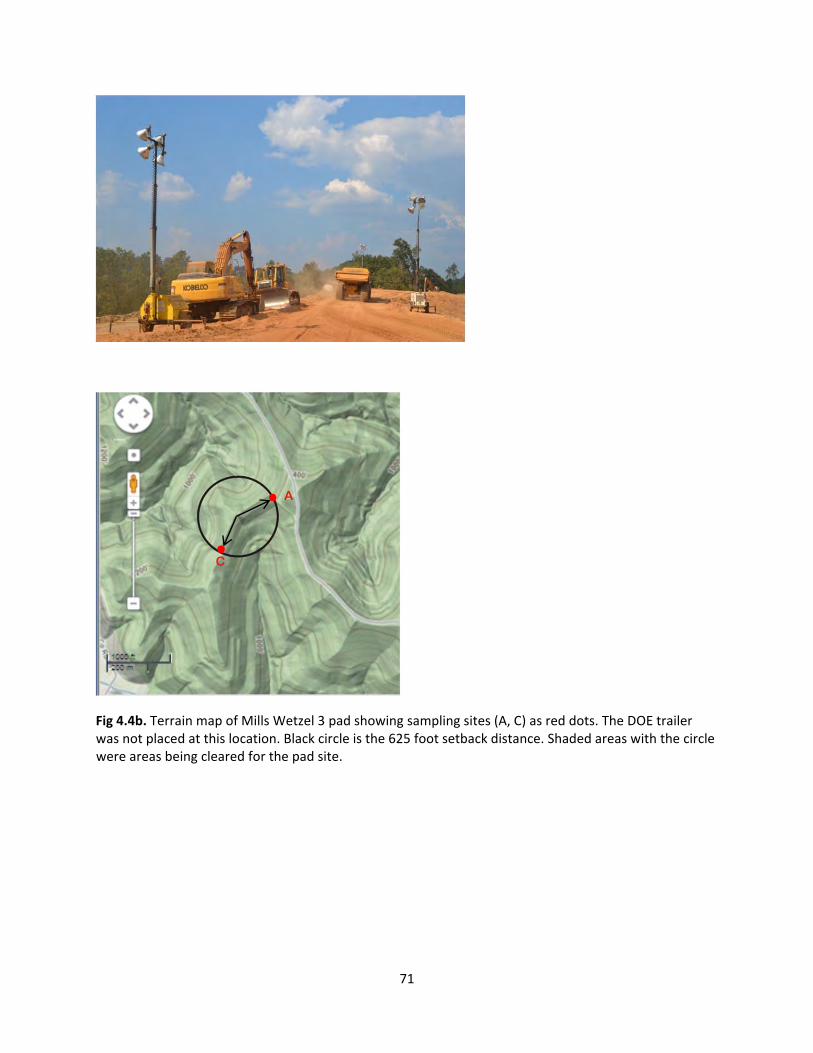
71
Fig 4.4b. Terrain map of Mills Wetzel 3 pad showing sampling sites (A, C) as red dots. The DOE trailer was not placed at this location. Black circle is the 625 foot setback distance. Shaded areas with the circle were areas being cleared for the pad site.
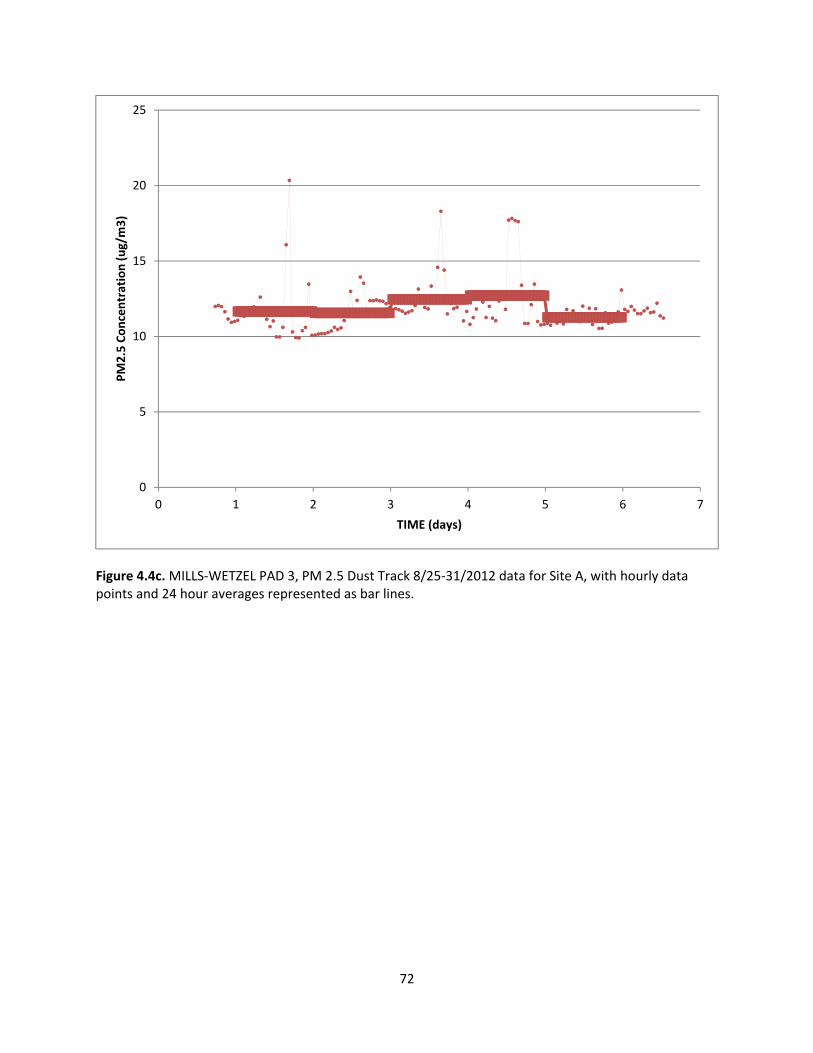
72
Figure 4.4c. MILLS‐WETZEL PAD 3, PM 2.5 Dust Track 8/25‐31/2012 data for Site A, with hourly data points and 24 hour averages represented as bar lines.
0
5
10
15
20
25
0 1 2 3 4 5 6 7
PM2.5 Concentration (ug/m3)
TIME (days)

73
Figure 4.4d. MILLS‐WETZEL PAD 3, PM 2.5 Dust Track 8/25‐31/2012 data for Site C, with hourly data
points and 24 hour averages represented as bar lines.
4.4.8 Noise Results
0
5
10
15
20
25
30
0 2 4 6 8
PM2.5 Dust Concentration (ug/m
3)
Time (Days)
0
20
40
60
80
100
0 24 48 72 96 120 144 168Sound Level (dBA)
Time (Hours)
Mills Wetzel 3 ‐ Site A

74
Figure 4.4e. Noise results for site A averaged 58 dBA and for Site C 69 dBA with an average between both sites of 64 dBA. Hours 0, 24, 48 etc. are midnight. Heavy, vertical lines are noon for each day.
4.5 Maury pad (Hydraulic Fracturing and Flowback)
4.5.1 HC Results
The laboratory was deployed to the Maury pad site near New Martinsville, WV in western
Wetzel County on August 24, 2012. The laboratory was located approximately 190m northeast
of the well pad on the side of a gravel well pad access road with coordinates of 39°37'5.48"N,
80°46'57.45"W. As there was no available electric service at this site, the laboratory was
operated using a diesel fuel‐powered generator provided by Stone Energy. The generator was
approximately 5m from the laboratory in the opposite direction of the well pad. After
unpacking, installing, and calibrating, some instruments were fully operational and collecting
data on August 24. The remaining instruments were calibrated and began collecting data on
August 29. Monitoring at this site ended on September 26, 2012. Figure 4.5a shows a wind
rose and histogram for the wind direction and speed during monitoring at the Maury pad
location. Wind speed was typically very low, with calm conditions 82% of the time. When
there was wind, it was most frequently blowing from the south. At almost all times the
laboratory was either monitoring during stagnant conditions or was almost directly downwind
of the well pad. Figures for other measured meteorological parameters (temperature, relative
humidity, rainfall, and solar intensity) are included in Appendix C.
0
10
20
30
40
50
60
70
80
0 24 48 72 96 120 144
Sound Level (dBA)
Time (Hours)
Mills Wetzel 3 ‐ Site C
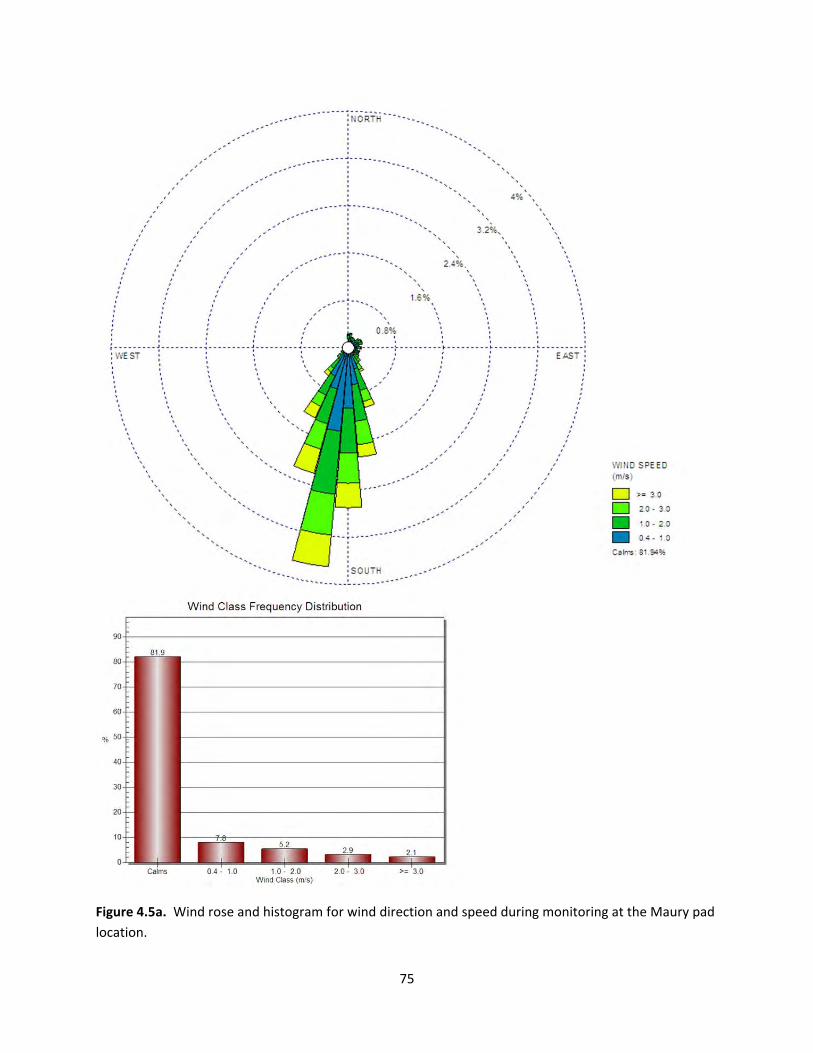
75
Figure 4.5a. Wind rose and histogram for wind direction and speed during monitoring at the Maury pad
location.

76
Figure 4.5b. Satellite photo of the Maury pad showing sampling sites (B, D) as red dots and location of
DOE trailer as shown by the yellow dot. Black circle is the 625 foot setback distance.
At this site the analyzer ran continuously for the entire monitoring period from August 26‐
September 29. However, there were a large number of samples that had to be discarded due
to moisture entering the gas chromatograph columns that caused an unstable baseline in the
chromatograms, including all of the samples collected after the morning of September 23. The
HCs analyzer has two columns; one is for the lighter hydrocarbons and one is for the heavier
hydrocarbons. In table 4, for the lighter hydrocarbons ethane‐isporene, there were a total of
535 samples with data for August 26‐September 23. For the heavier compounds hexane‐
undecane, there were 353 samples, with intermittent periods of invalid data.

77
Fig. 4.5c. Terrain map of the Maury pad showing sampling sites (B, D) as red dots and location of DOE trailer as a yellow dot. Black circle is the 625 foot setback distance.
Table 4.5 GC‐FID HC Results
Compound Average (ppb) Standard Deviation (ppb)
Minimum (ppb)
Maximum (ppb)
Frequency of Detection (%)
Hexane 1.2 2.9 0.0 28.2 37
n‐heptane 0.3 1.2 0.0 14.2 11
Methylcyclohexane 0.2 0.8 0.0 7.0 10
Toluene 0.3 0.7 0.0 4.3 17
Nonane 0.2 0.7 0.0 3.8 12
Decane 0.4 1.0 0.0 6.9 16
Undecane 0.3 0.8 0.0 5.2 15
Ethane 40.2 62.1 3.3 840.5 100
Ethylene 1.7 1.4 0.0 8.7 74
Propane 24.1 31.3 0.0 453.3 100
Isobutane 6.4 6.5 0.0 72.0 96
n‐butane 11.3 13.9 0.0 184.0 99
Isopentane 5.9 6.2 0.0 64.3 96
n‐pentane 5.1 5.7 0.0 59.2 95
2‐methylpentane 1.0 1.7 0.0 14.8 42
3‐methylpentane 0.5 1.2 0.0 11.2 28
Isoprene 4.0 3.6 0.0 17.7 76
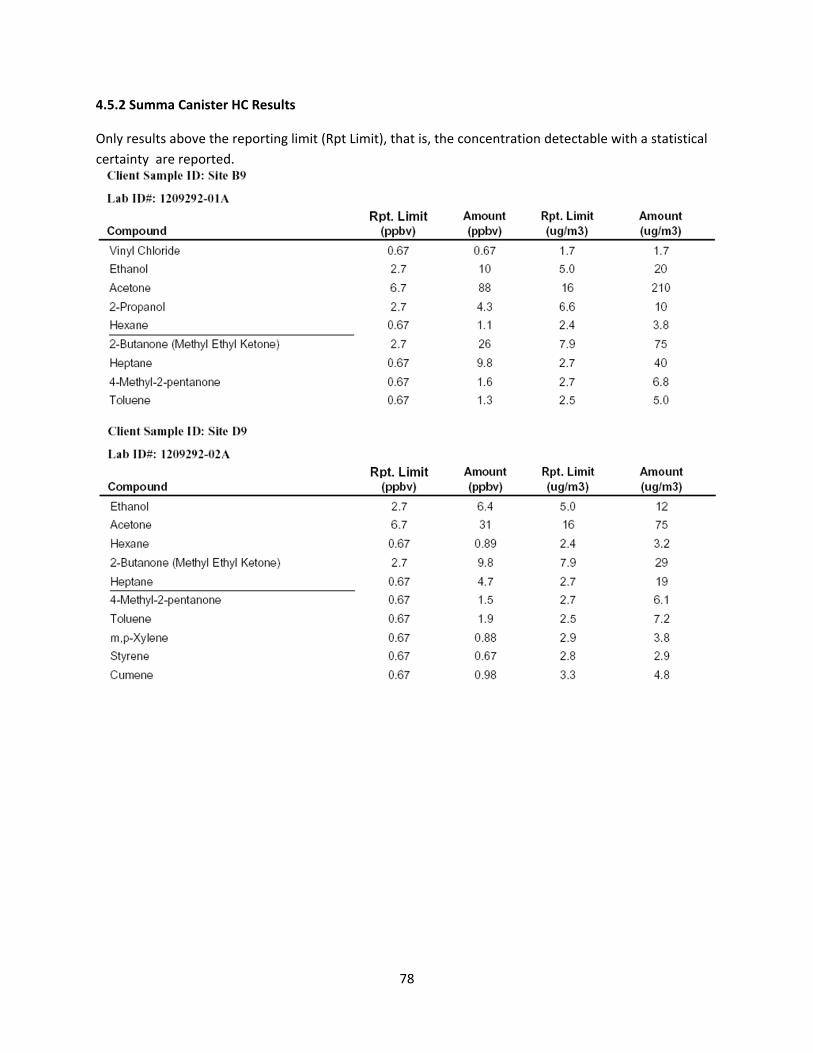
78
4.5.2 Summa Canister HC Results
Only results above the reporting limit (Rpt Limit), that is, the concentration detectable with a statistical
certainty are reported.

79

80

81
Figure 4.5.2a. PID data for 9/9‐10/2012 at Site B.
PID malfunction at Site D resulted in loss of data for that location.
4.5.3 Ozone Results
Ozone data are available for most of the monitoring duration at this site, August 24‐September
26, with a gap in the data from July 15‐18 due to a power outage (Figures 4.5d‐h). The average
ozone concentration using one minute data at the Maury pad was 21ppb, and the maximum
hourly average concentration was 76ppb. Day‐to‐night variations ranged from 30‐70ppb.
Calculating 8‐hour averages to more directly compare to the NAAQS results in a range of 8‐hour
averages of 2ppb – 69ppb.
0
2
4
6
8
10
12
14
16
18
0 0.5 1 1.5 2 2.5 3 3.5 4
VOC concentration (ppb)
Time (days)

82
Figure 4.5d. One‐minute average ozone concentrations for the first week at the Maury pad.
Figure 4.5e. One‐minute average ozone concentrations for the second week at the Maury pad.

83
Figure 4.5f. One‐minute average ozone concentrations for the third week at the Maury pad.
Figure 4.5g. One‐minute average ozone concentrations for the fourth week at the Maury pad.
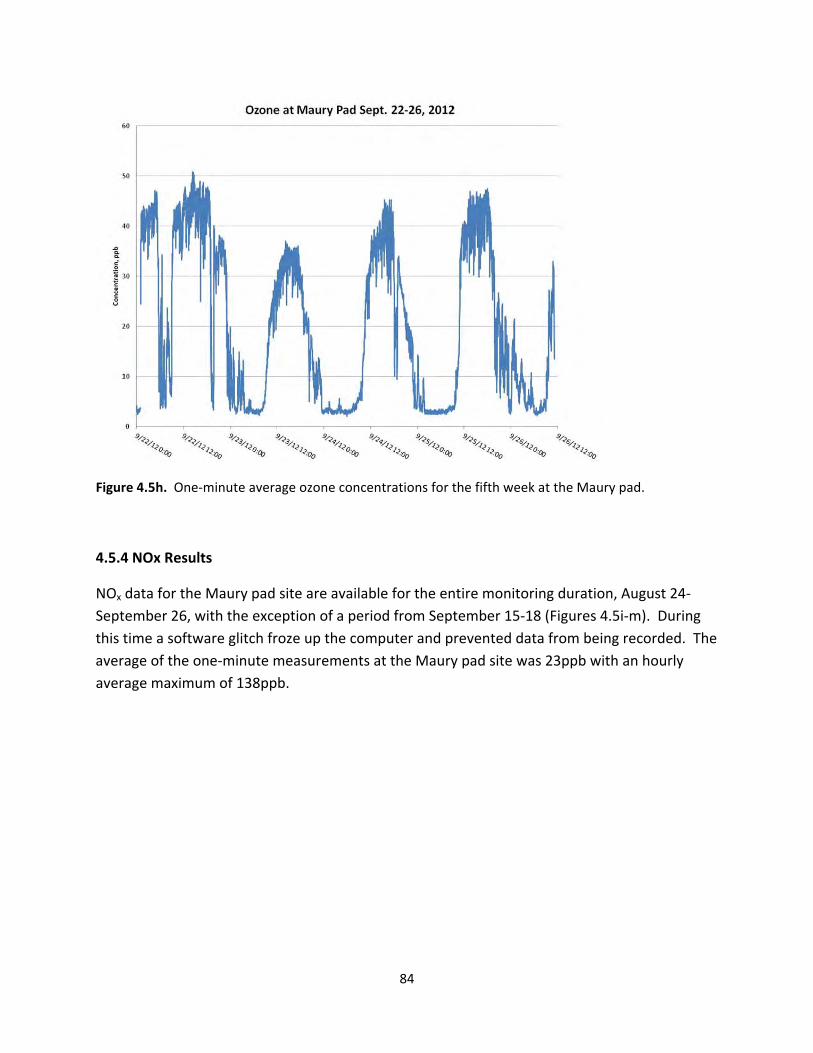
84
Figure 4.5h. One‐minute average ozone concentrations for the fifth week at the Maury pad.
4.5.4 NOx Results
NOx data for the Maury pad site are available for the entire monitoring duration, August 24‐
September 26, with the exception of a period from September 15‐18 (Figures 4.5i‐m). During
this time a software glitch froze up the computer and prevented data from being recorded. The
average of the one‐minute measurements at the Maury pad site was 23ppb with an hourly
average maximum of 138ppb.
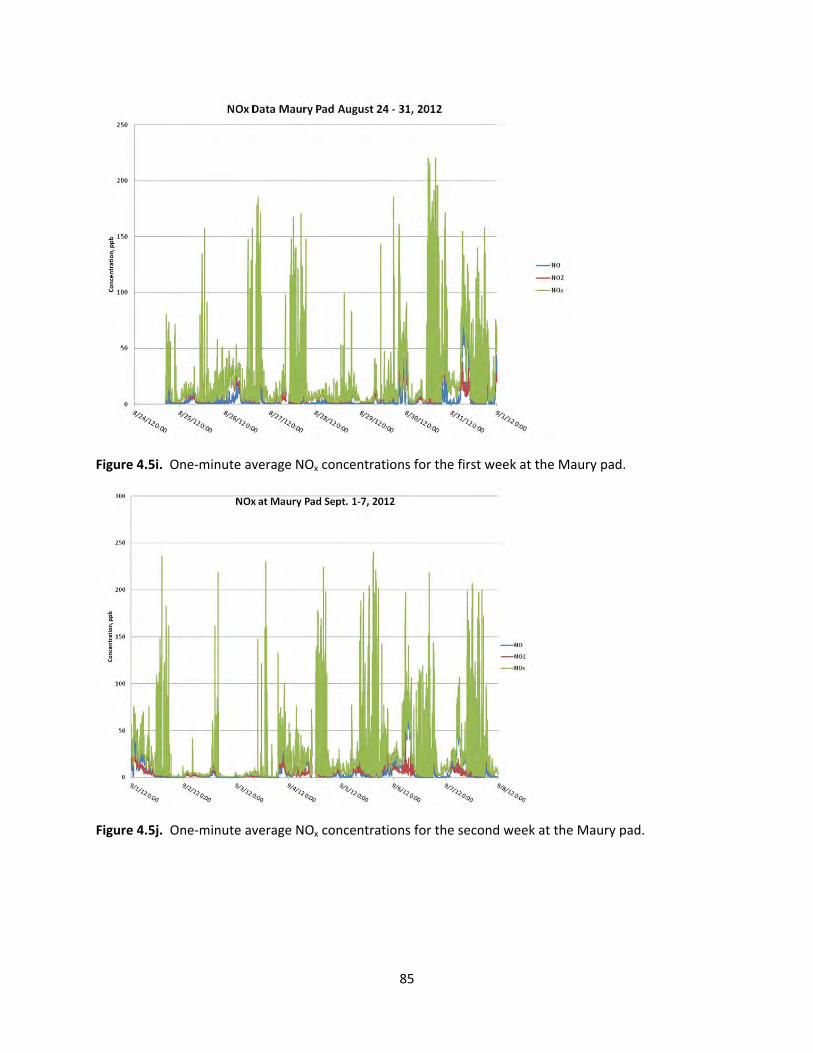
85
Figure 4.5i. One‐minute average NOx concentrations for the first week at the Maury pad.
Figure 4.5j. One‐minute average NOx concentrations for the second week at the Maury pad.
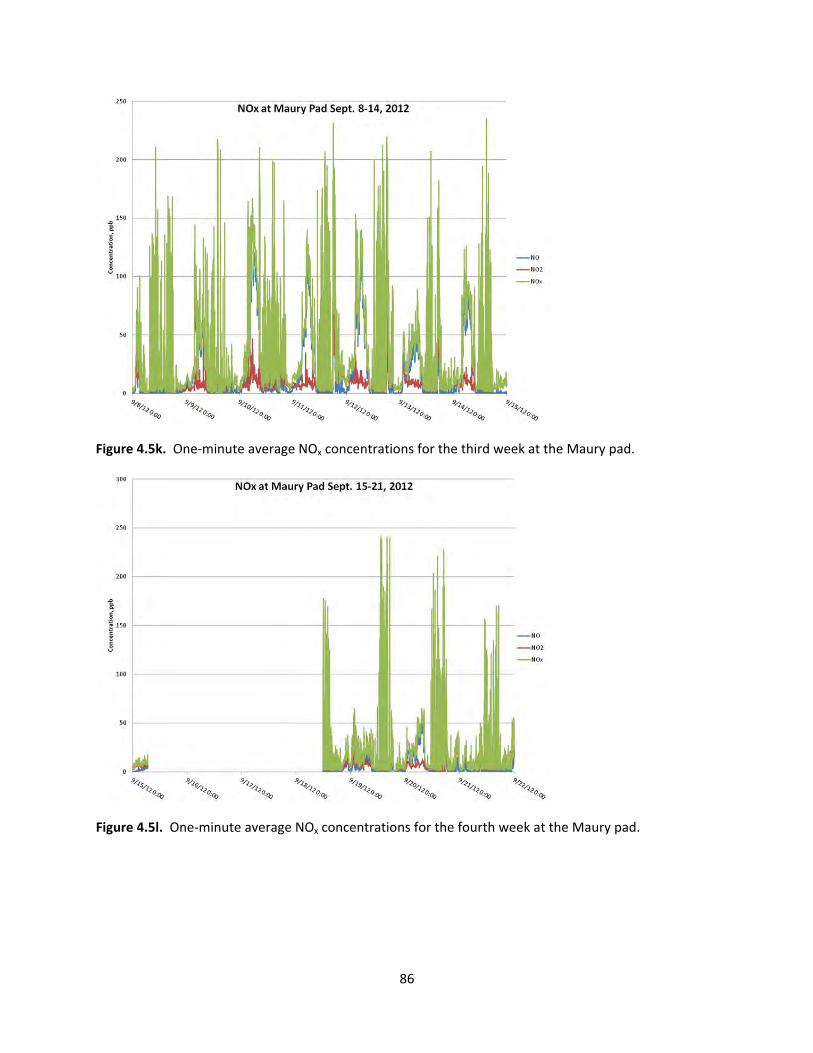
86
Figure 4.5k. One‐minute average NOx concentrations for the third week at the Maury pad.
Figure 4.5l. One‐minute average NOx concentrations for the fourth week at the Maury pad.

87
Figure 4.5m. One‐minute average NOx concentrations for the fifth week at the Maury pad.
4.5.5 Methane Results
The ambient methane concentration at the Maury pad averaged 2.0ppm (±0.1ppm) with an
average isotopic composition of ‐49.4‰ (±1.7‰) which are typical background atmospheric
values (Figures 4.5n‐q). For the majority of the four week monitoring period at this site, the
methane concentration was near ambient levels, exceeding 5ppm on only four occasions. The
maximum observed methane concentration was 40.8ppm. Unfortunately, the corresponding
δ13C value is not available due to an instrument error. For concentrations greater than 5ppm
(n=50), however, the δ13C averaged ‐41.5‰ (±1.5‰) reflecting a significant contribution from a
thermogenic source.

88
Figure 4.5n. One‐minute average CH4 concentrations at the Maury pad, 8/24/12 to 9/10/12.
Figure 4.5o. One‐minute average CH4 concentrations at the Maury pad, 9/11/12 to 9/26/12.

89
Figure 4.5p. One‐minute average δ13C of CH4 at the Maury pad, 8/24/12 to 9/10/12.
Figure 4.5q. One‐minute average δ13C of CH4 at the Maury pad, 9/11/12 to 9/26/12.

90
4.5.6 CO2 Results
Over the four weeks of monitoring at the Maury pad site, the CO2 concentration averaged
414ppm (±30ppm) with δ13C averaging ‐12.6‰ (±1.5‰) (Figures 4.5r and s). The maximum CO2
concentration at the site was 551ppm with a corresponding δ13C value of ‐16.7‰. The CO2
concentrations and δ13C values at the site cycled daily. Starting at approximately 8pm, the CO2
concentration increased gradually to values typically greater than 450ppm, and occasionally
greater than 500ppm, before dropping back to near ambient levels by 7am. During these times,
the corresponding δ13C values become more depleted, approaching ‐14‰ and as occasionally
as low as ‐16‰.
Figure 4.5r. One‐minute average CO2 concentrations and δ13C of CO2 at the Maury pad, 8/24/12 to
9/10/12.

91
Figure 4.5s. One‐minute average CO2 concentrations and δ13C of CO2 at the Maury pad, 9/11/12 to
9/26/12.
4.5.7 Dust Results Data are available for August 24‐September 26 (Figure 4.5t). At the Maury pad, Average PM10
concentration was 30g/m3 and average PM2.5 concentration was 12g/m3. Maximum one‐
hour average concentrations of PM10 and PM2.5 were 768g/m3 and 129g/m3, respectively. The substantial peaks in PM10 concentration at this site were likely due to the mobile air monitoring laboratory’s position by a frequently traveled gravel well pad access road.
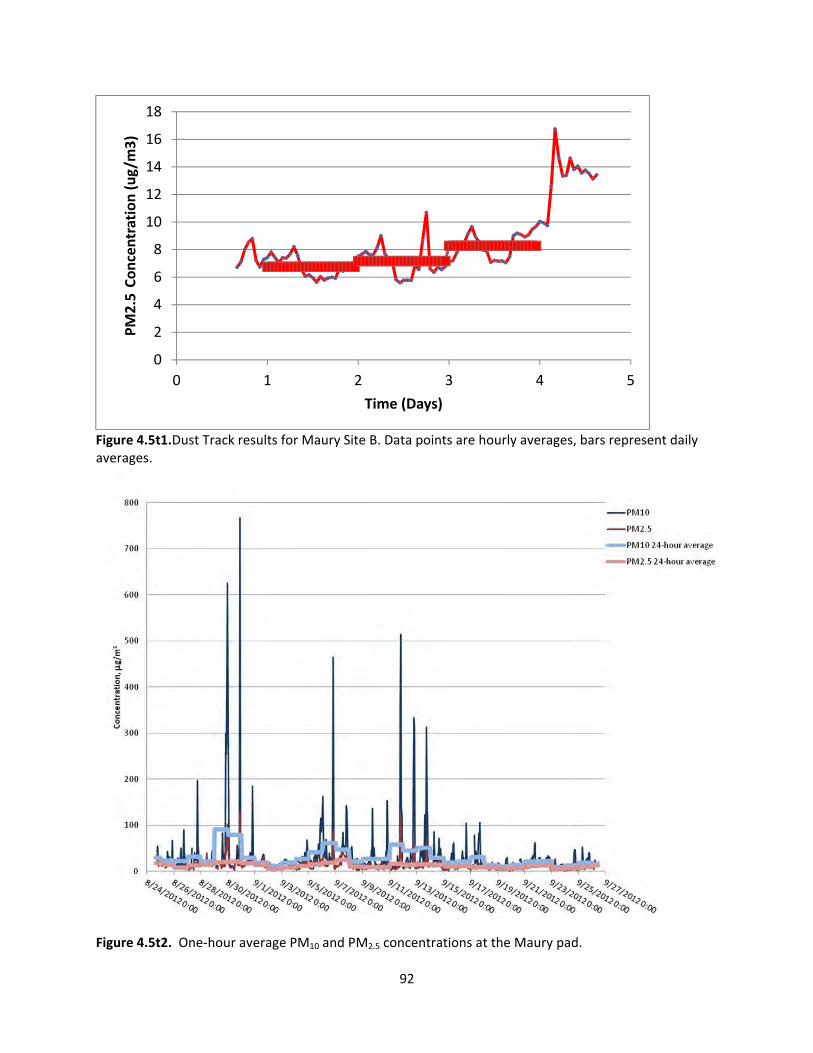
92
Figure 4.5t1.Dust Track results for Maury Site B. Data points are hourly averages, bars represent daily averages.
Figure 4.5t2. One‐hour average PM10 and PM2.5 concentrations at the Maury pad.
0
2
4
6
8
10
12
14
16
18
0 1 2 3 4 5
PM2.5
Concentration (ug/m
3)
Time (Days)
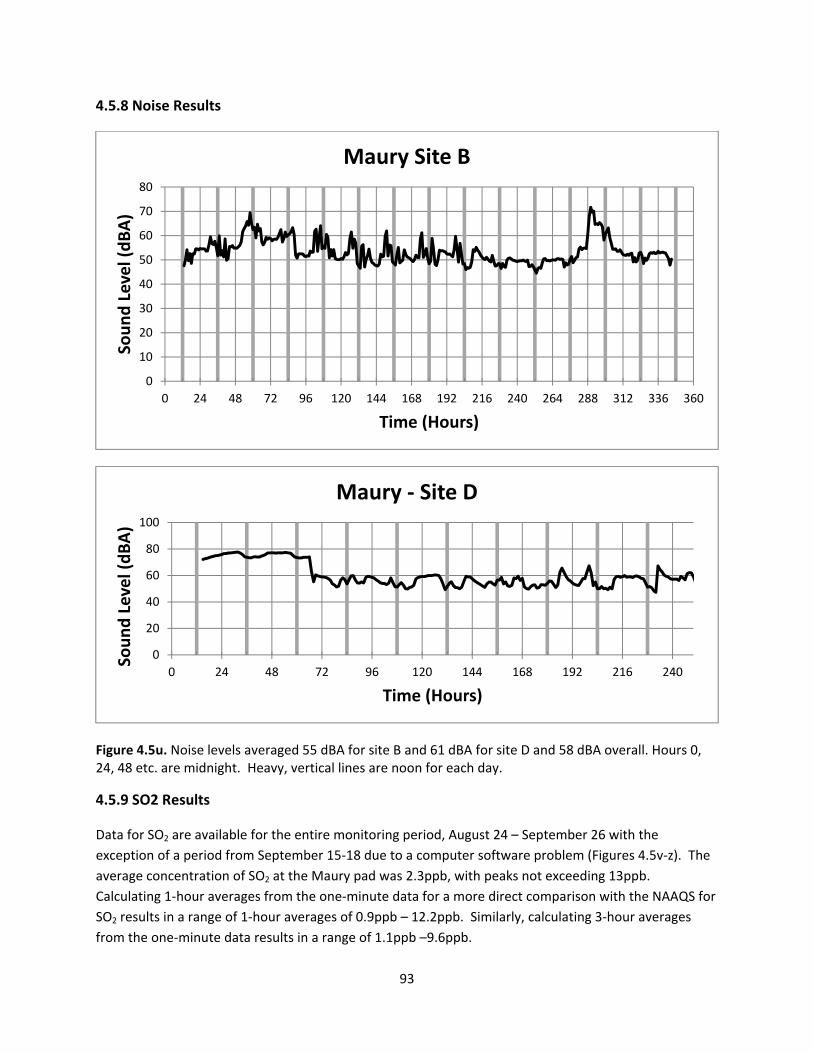
93
4.5.8 Noise Results
Figure 4.5u. Noise levels averaged 55 dBA for site B and 61 dBA for site D and 58 dBA overall. Hours 0, 24, 48 etc. are midnight. Heavy, vertical lines are noon for each day.
4.5.9 SO2 Results
Data for SO2 are available for the entire monitoring period, August 24 – September 26 with the
exception of a period from September 15‐18 due to a computer software problem (Figures 4.5v‐z). The
average concentration of SO2 at the Maury pad was 2.3ppb, with peaks not exceeding 13ppb.
Calculating 1‐hour averages from the one‐minute data for a more direct comparison with the NAAQS for
SO2 results in a range of 1‐hour averages of 0.9ppb – 12.2ppb. Similarly, calculating 3‐hour averages
from the one‐minute data results in a range of 1.1ppb –9.6ppb.
0
10
20
30
40
50
60
70
80
0 24 48 72 96 120 144 168 192 216 240 264 288 312 336 360
Sound Level (dBA)
Time (Hours)
Maury Site B
0
20
40
60
80
100
0 24 48 72 96 120 144 168 192 216 240
Sound Level (dBA)
Time (Hours)
Maury ‐ Site D

94
Figure 4.5v. One‐minute average SO2 concentrations for the Maury pad, August 24‐31, 2012.
Figure 4.5w. One‐minute average SO2 concentrations for the Maury pad, September 1‐7, 2012.

95
Figure 4.5x. One‐minute average SO2 concentrations for the Maury pad,September 8‐14, 2012.
Figure 4.5y. One‐minute average SO2 concentrations for the Maury pad, September 15‐21, 2012.

96
Figure 4.5z. One‐minute average SO2 concentrations for the Maury pad, September 22‐26, 2012.
4.5.10 OC/EC Results
At the Maury pad, data are available for the entire monitoring period with the exception of September
15‐18, when a software problem froze the computer and stopped the analysis. The data show high
variability, with an average OC concentration of 2.7gC/m3, ranging from 1.3‐6.7gC/m3, and an average
EC concentration of 1.4gC/m3, ranging from >0.1‐6.2g/m3.

97
Figure 4.5aa. Two‐hour average OC and EC concentrations for the Maury pad.
4.6 Lemons pad (Vertical Drill)
The laboratory was moved to the Lemons pad site, also near New Martinsville, WV in western
Wetzel County, on September 27, 2012. The laboratory was located approximately 200m
northwest of the well pad on a grassy knoll off the side of the main well pad access road with
coordinates of 39°39'8.73"N, 80°47'44.69"W. As there was no available electric service at this
site, the laboratory was operated using a diesel fuel‐powered generator provided by Stone
Energy. The generator was approximately 20m from the laboratory in the opposite direction of
the well pad. After unpacking, installing, and calibrating, instruments were fully operational
and collecting data on September 27. Monitoring at this site ended on October 15, 2012 due to
power interruption. The laboratory was moved from the site on October 17, 2012. During this
period, wind most frequently came from the southwest; winds from the southeast would likely
have carried any plumes from the well pad toward the monitoring laboratory but the frequency
of winds from the southeast was very low (less than 5%). Figure 4.6a shows a wind rose and
histogram for the wind direction and speed during monitoring at the Lemons pad location.
Figures for other measured meteorological parameters (temperature, relative humidity,
rainfall, and solar intensity) are included in Appendix C.
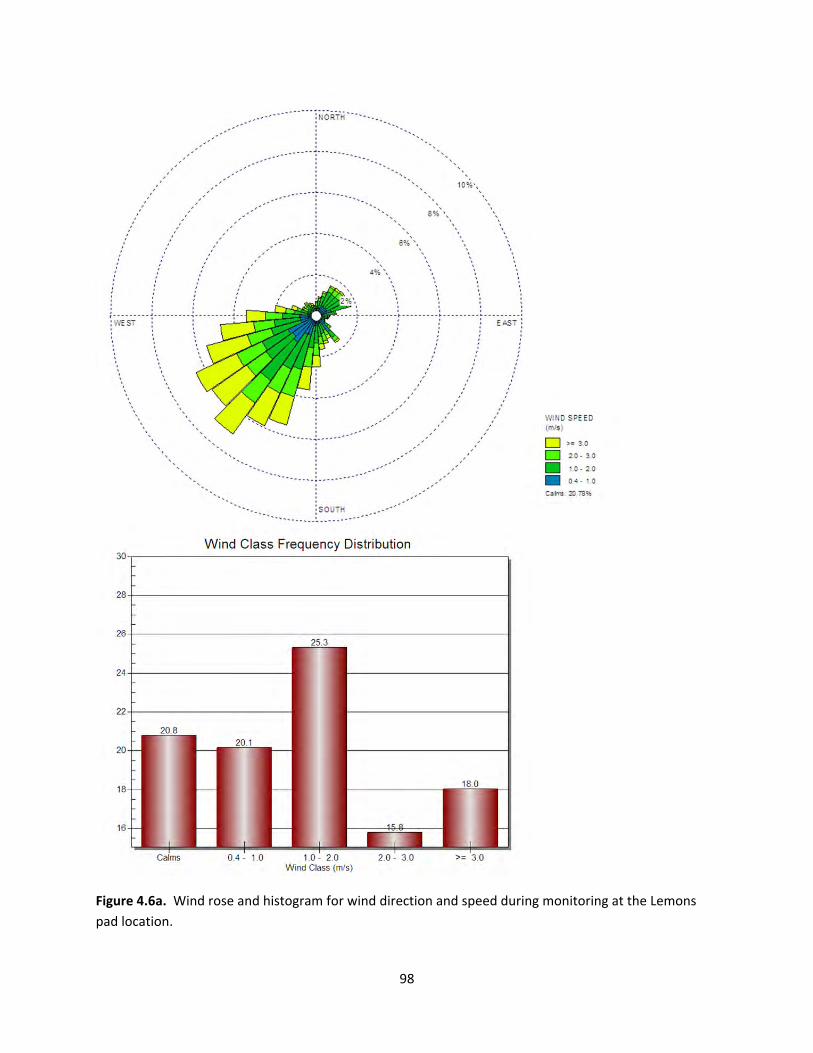
98
Figure 4.6a. Wind rose and histogram for wind direction and speed during monitoring at the Lemons
pad location.
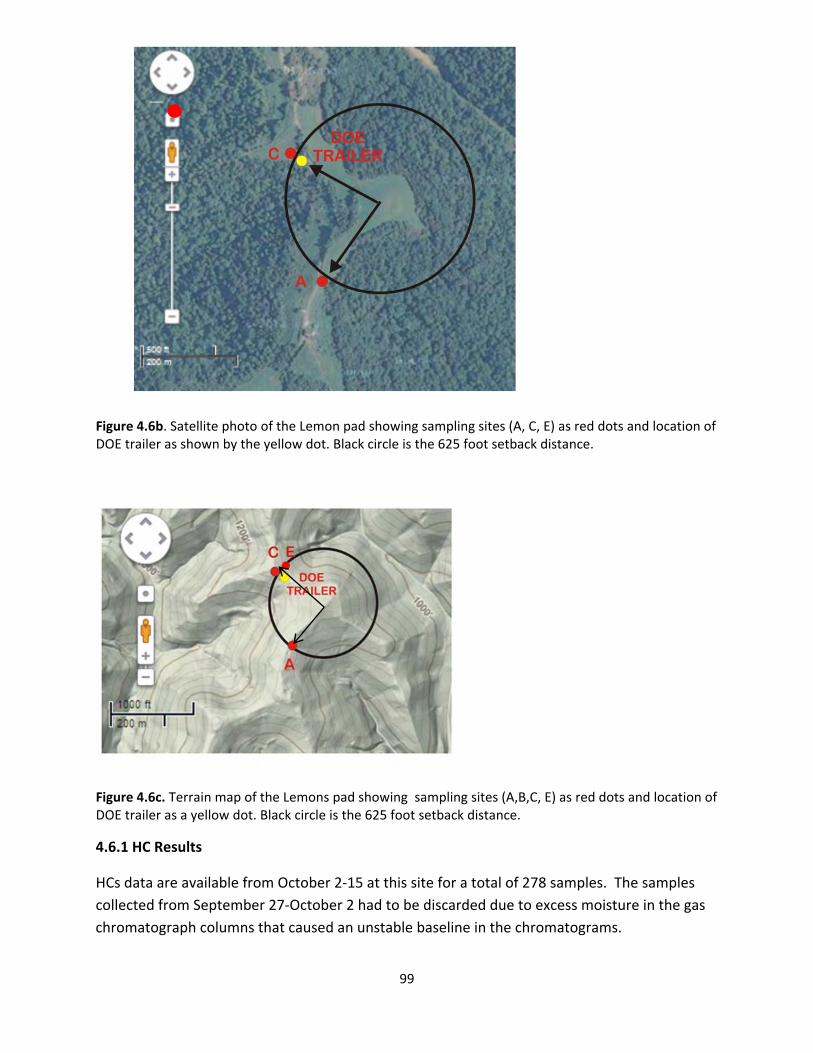
99
Figure 4.6b. Satellite photo of the Lemon pad showing sampling sites (A, C, E) as red dots and location of DOE trailer as shown by the yellow dot. Black circle is the 625 foot setback distance.
Figure 4.6c. Terrain map of the Lemons pad showing sampling sites (A,B,C, E) as red dots and location of DOE trailer as a yellow dot. Black circle is the 625 foot setback distance.
4.6.1 HC Results
HCs data are available from October 2‐15 at this site for a total of 278 samples. The samples
collected from September 27‐October 2 had to be discarded due to excess moisture in the gas
chromatograph columns that caused an unstable baseline in the chromatograms.

100
Table 4.6 GC‐FID HC Results
Compound Average (ppb) Standard Deviation (ppb)
Minimum (ppb)
Maximum (ppb)
Frequency of Detection (%)
Ethane 30.4 49.9 4.7 638.6 100
Ethylene 0.8 1.2 0.0 6.8 43
Propane 25.1 65.8 0.6 860.0 100
Isobutane 5.7 10.0 0.0 122.7 95
n‐butane 9.6 21.3 1.2 273.8 100
Isopentane 4.5 5.0 0.0 53 98
n‐pentane 4.0 5.0 0.0 57.7 96
2‐methylpentane 0.7 1.2 0.0 10.1 37
3‐methylpentane 0.3 1.0 0.0 9.4 18
4.6.2 Summa Canister HC Results
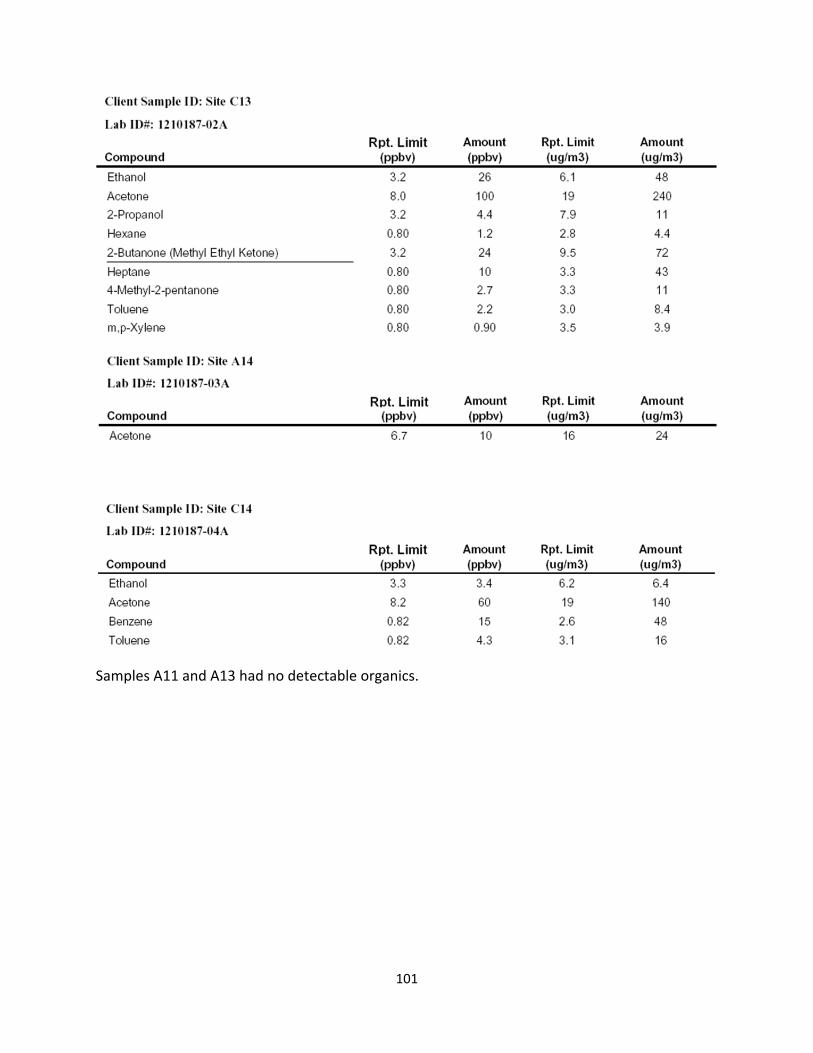
101
Samples A11 and A13 had no detectable organics.
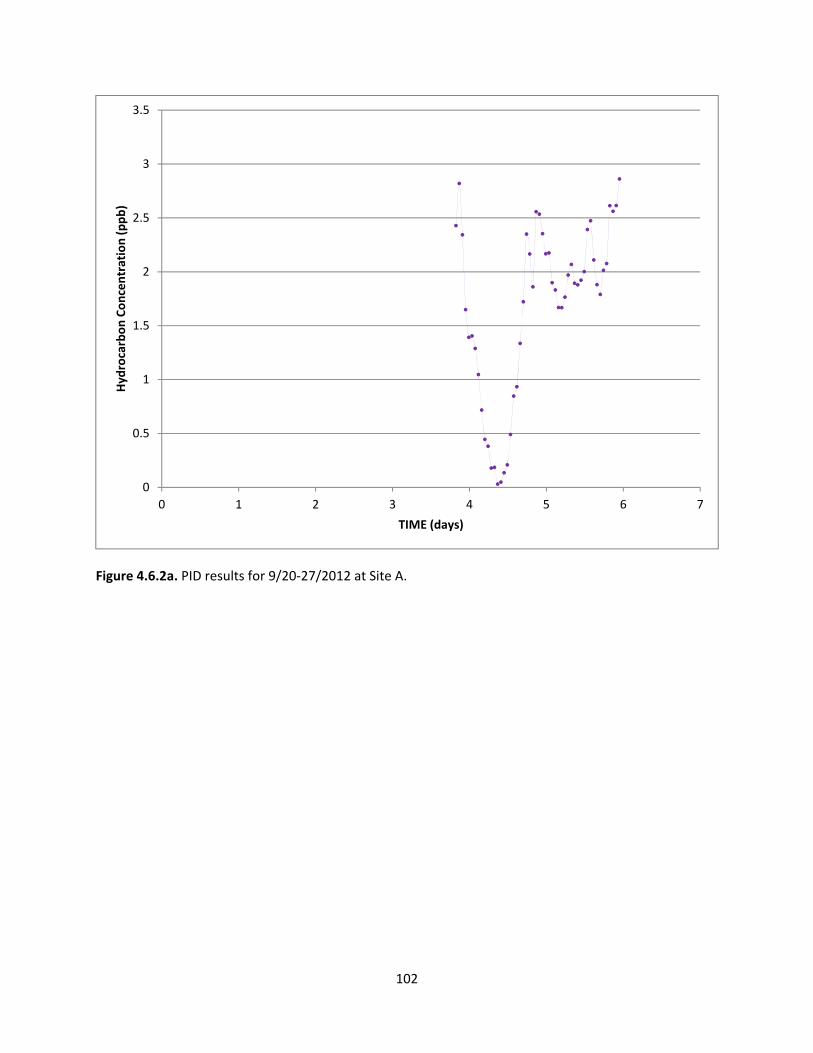
102
Figure 4.6.2a. PID results for 9/20‐27/2012 at Site A.
0
0.5
1
1.5
2
2.5
3
3.5
0 1 2 3 4 5 6 7
Hydrocarbon Concentration (ppb)
TIME (days)
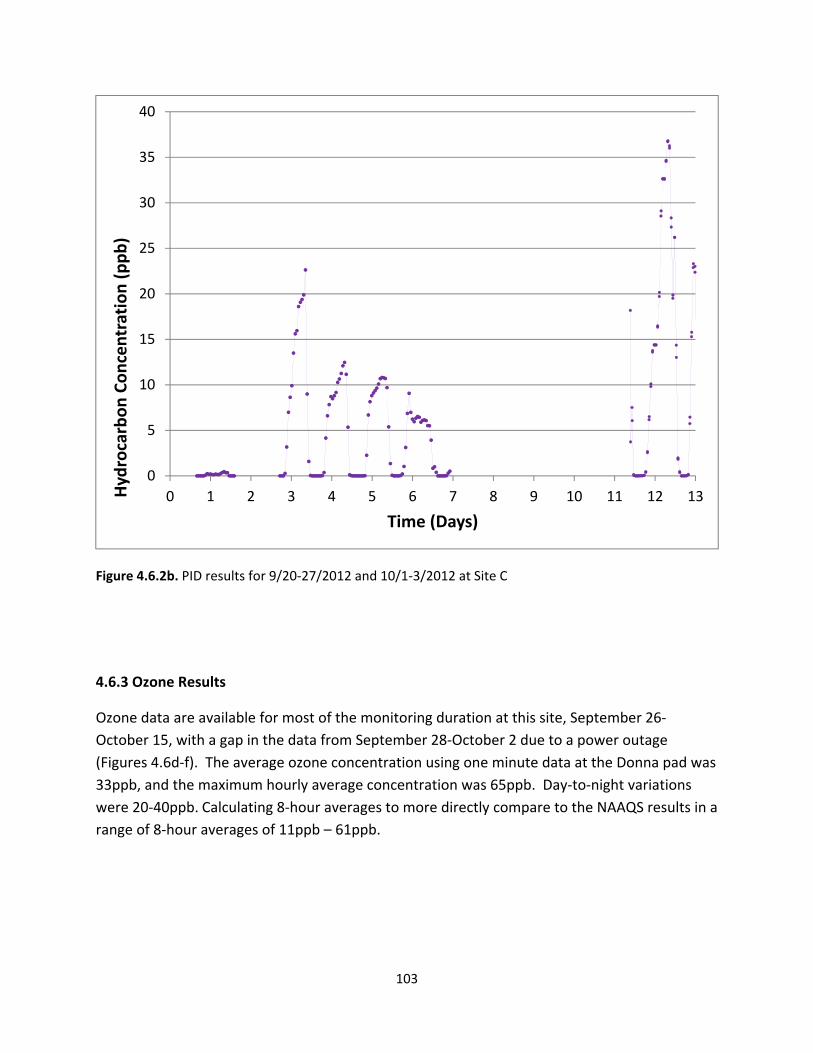
103
Figure 4.6.2b. PID results for 9/20‐27/2012 and 10/1‐3/2012 at Site C
4.6.3 Ozone Results
Ozone data are available for most of the monitoring duration at this site, September 26‐
October 15, with a gap in the data from September 28‐October 2 due to a power outage
(Figures 4.6d‐f). The average ozone concentration using one minute data at the Donna pad was
33ppb, and the maximum hourly average concentration was 65ppb. Day‐to‐night variations
were 20‐40ppb. Calculating 8‐hour averages to more directly compare to the NAAQS results in a
range of 8‐hour averages of 11ppb – 61ppb.
0
5
10
15
20
25
30
35
40
0 1 2 3 4 5 6 7 8 9 10 11 12 13Hydrocarbon Concentration (ppb)
Time (Days)
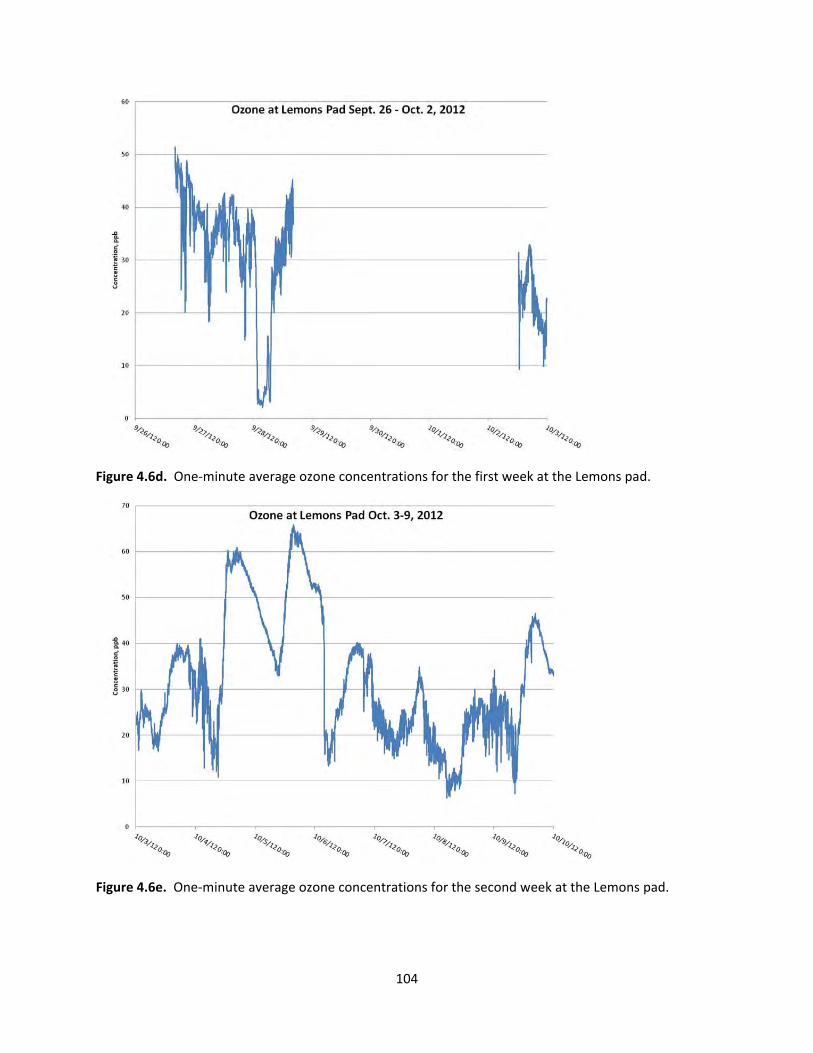
104
Figure 4.6d. One‐minute average ozone concentrations for the first week at the Lemons pad.
Figure 4.6e. One‐minute average ozone concentrations for the second week at the Lemons pad.
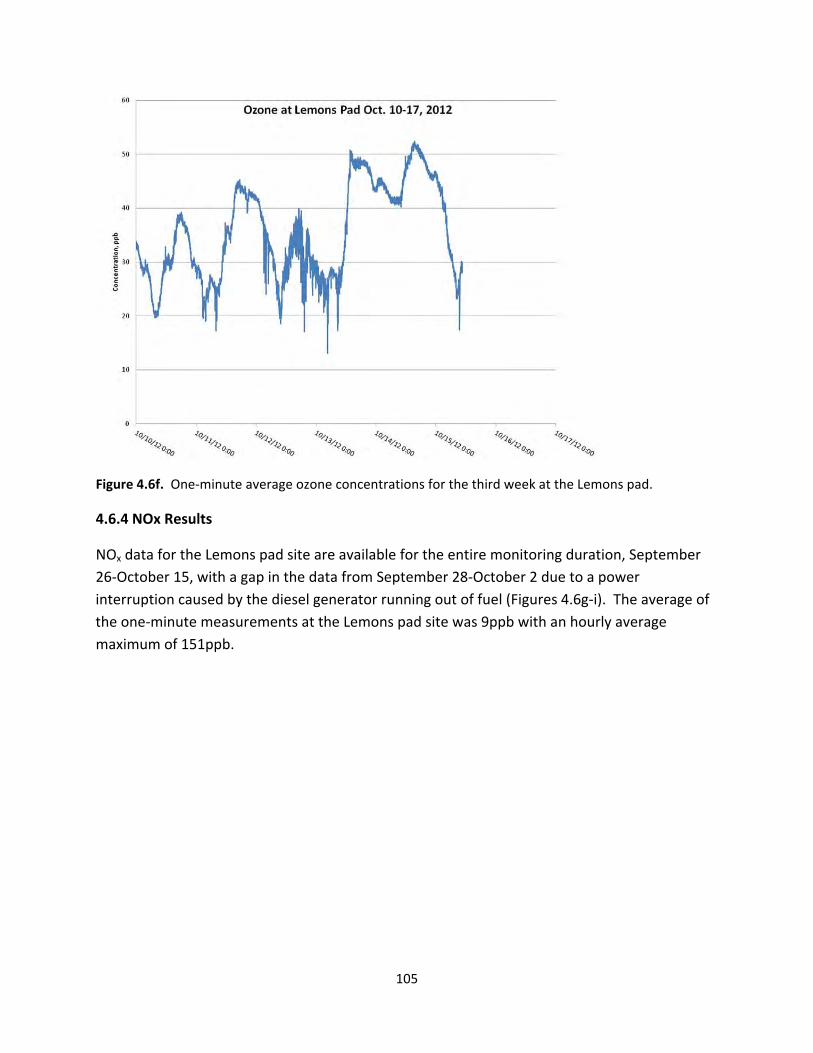
105
Figure 4.6f. One‐minute average ozone concentrations for the third week at the Lemons pad.
4.6.4 NOx Results
NOx data for the Lemons pad site are available for the entire monitoring duration, September
26‐October 15, with a gap in the data from September 28‐October 2 due to a power
interruption caused by the diesel generator running out of fuel (Figures 4.6g‐i). The average of
the one‐minute measurements at the Lemons pad site was 9ppb with an hourly average
maximum of 151ppb.

106
Figure 4.6g. One‐minute average NOx concentrations for the first week at the Lemons pad.
Figure 4.6h. One‐minute average NOx concentrations for the second week at the Lemons pad.
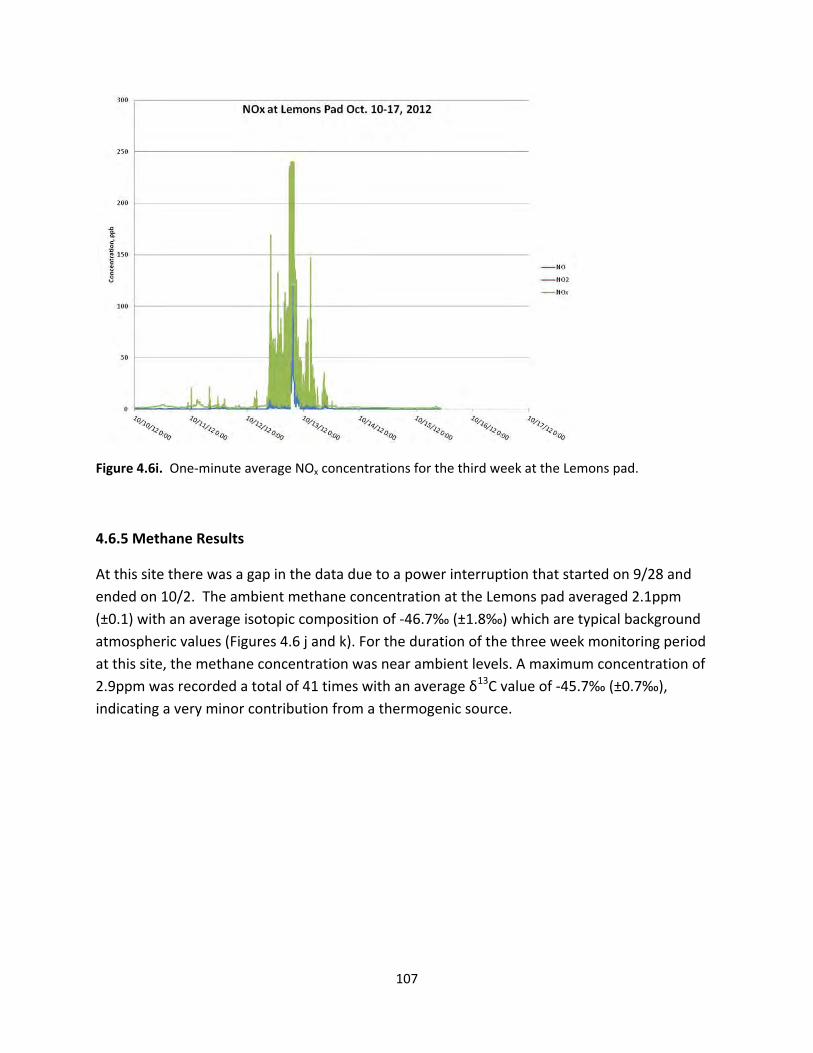
107
Figure 4.6i. One‐minute average NOx concentrations for the third week at the Lemons pad.
4.6.5 Methane Results
At this site there was a gap in the data due to a power interruption that started on 9/28 and
ended on 10/2. The ambient methane concentration at the Lemons pad averaged 2.1ppm
(±0.1) with an average isotopic composition of ‐46.7‰ (±1.8‰) which are typical background
atmospheric values (Figures 4.6 j and k). For the duration of the three week monitoring period
at this site, the methane concentration was near ambient levels. A maximum concentration of
2.9ppm was recorded a total of 41 times with an average δ13C value of ‐45.7‰ (±0.7‰),
indicating a very minor contribution from a thermogenic source.

108
Figure 4.6j. One‐minute average CH4 concentrations at the Lemons pad.
Figure 4.6k. One‐minute average δ13C of CH4 at the Lemons pad.

109
4.6.6 CO2 Results
Over the three weeks of monitoring at the Lemons pad site, the CO2 concentration averaged
395ppm (±9) with δ13C averaging ‐11.7‰ (±0.8‰) (Figure 4.6l). The CO2 concentrations and
δ13C values at the site cycled daily. Starting at approximately 8pm, the CO2 concentration
increased gradually to values typically greater than 415ppm and occasionally greater than
440ppm before dropping back to near ambient levels by 7am. During these times, the
corresponding δ13C values become more depleted, dropping to less than ‐13‰ and occasionally
approaching ‐14‰. The maximum CO2 concentration at the site was 446ppm with a
corresponding δ13C value of ‐13.6‰.
Figure 4.6l. One‐minute average CO2 concentrations and δ13C of CO2 at the Lemons pad.
4.6.7 Dust Results
Data are available for September 26‐October 17 with gaps in the data from September 28‐
October 2 and October 15‐16 due to power interruption (Figure 4.6 m1). At the Lemons pad,
Average PM10 concentration was 12g/m3 and average PM2.5 concentration was 7g/m3.
Maximum one‐hour average concentrations of PM10 and PM2.5 were 188g/m3 and 25g/m3,
respectively.

110
Figure 4.6m1. One‐hour average PM10 and PM2.5 concentrations at the Lemons pad.
Figure4.6m2. One hour (points) and 24 hour (bars) Dust Track averages for Lemons pad site C.
0
2
4
6
8
10
12
14
16
18
20
0 2 4 6 8 10 12 14 16 18 20
PM2.5 Concentration (ug/m3)
TIME (days)

111
4.6.8 Noise results
Figure 4.6n. Noise results for the period 9/20‐30/12 for Site C averaged 54 dBA. Site A had battery problems. Hours 0, 24, 48 etc. are midnight. Heavy, vertical lines are noon for each day.
4.6.9 SO2 Results
Data for SO2 are available for September 27 – October 15 with sections of data missing due to power
interruptions (Figures 4.6o‐q). The average concentration of SO2 at the Lemons pad was 2.6ppb, with
peaks not exceeding 4.5ppb. Calculating 1‐hour averages from the one‐minute data for a more direct
comparison with the NAAQS for SO2 results in a range of 1‐hour averages of 1.6ppb – 3.8ppb. Similarly,
calculating 3‐hour averages from the one‐minute data results in a range of 1.7ppb –3.7ppb.
0.00
10.00
20.00
30.00
40.00
50.00
60.00
70.00
0 24 48 72 96 120 144 168 192 216 240
Sound Level (dBA)
Time (Hours)
Lemons ‐ Site C

112
Figure 4.6o. One‐minute average SO2 concentrations for the Lemons pad, September 26 – October 2,
2012.
Figure 4.6p. One‐minute average SO2 concentrations for the Lemons pad, October 3‐9, 2012.

113
Figure 4.6q. One‐minute average SO2 concentrations for the Lemons pad, October 10‐17, 2012.
4.6.10 OC/EC Results
At the Lemons pad, data are available for the entire monitoring period with the exception of September
28 – October 2 due to a loss of electric power. The data are less noisy and have more distinct peaks in
concentration, with an average OC concentration of 2.4gC/m3, ranging from 1.2‐17.7gC/m3, and an
average EC concentration of 0.8gC/m3, ranging from >0.1‐6.6g/m3.
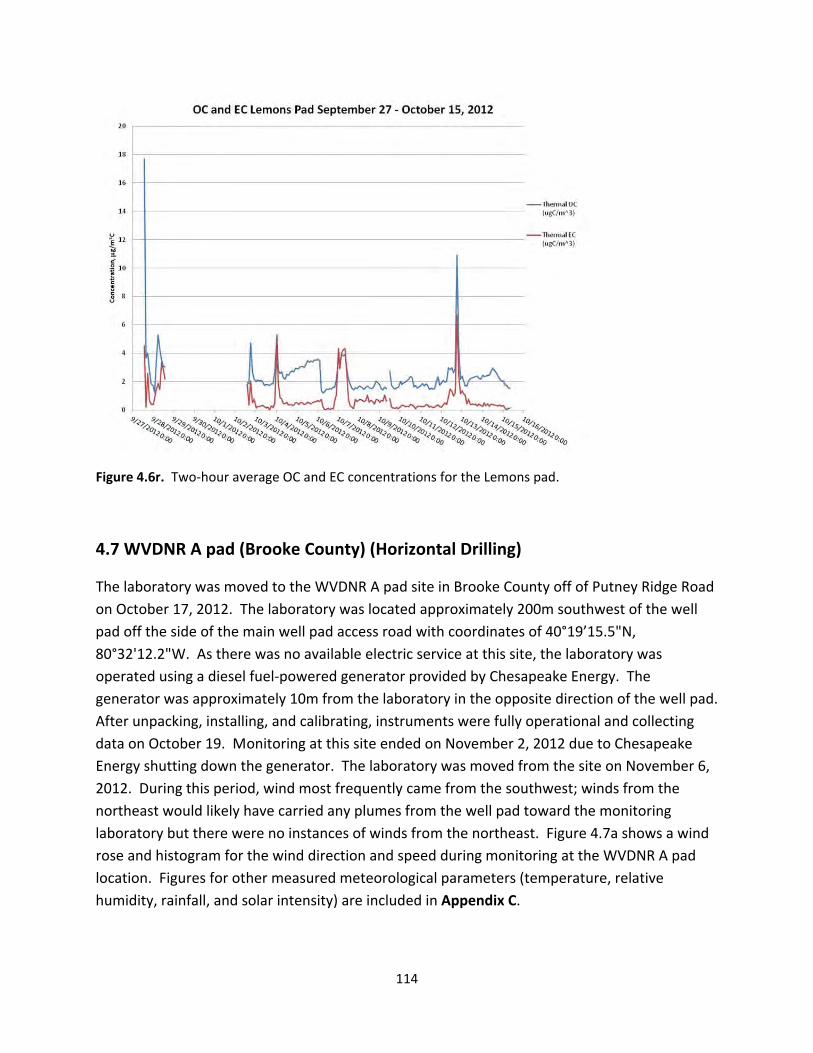
114
Figure 4.6r. Two‐hour average OC and EC concentrations for the Lemons pad.
4.7 WVDNR A pad (Brooke County) (Horizontal Drilling)
The laboratory was moved to the WVDNR A pad site in Brooke County off of Putney Ridge Road
on October 17, 2012. The laboratory was located approximately 200m southwest of the well
pad off the side of the main well pad access road with coordinates of 40°19’15.5"N,
80°32'12.2"W. As there was no available electric service at this site, the laboratory was
operated using a diesel fuel‐powered generator provided by Chesapeake Energy. The
generator was approximately 10m from the laboratory in the opposite direction of the well pad.
After unpacking, installing, and calibrating, instruments were fully operational and collecting
data on October 19. Monitoring at this site ended on November 2, 2012 due to Chesapeake
Energy shutting down the generator. The laboratory was moved from the site on November 6,
2012. During this period, wind most frequently came from the southwest; winds from the
northeast would likely have carried any plumes from the well pad toward the monitoring
laboratory but there were no instances of winds from the northeast. Figure 4.7a shows a wind
rose and histogram for the wind direction and speed during monitoring at the WVDNR A pad
location. Figures for other measured meteorological parameters (temperature, relative
humidity, rainfall, and solar intensity) are included in Appendix C.
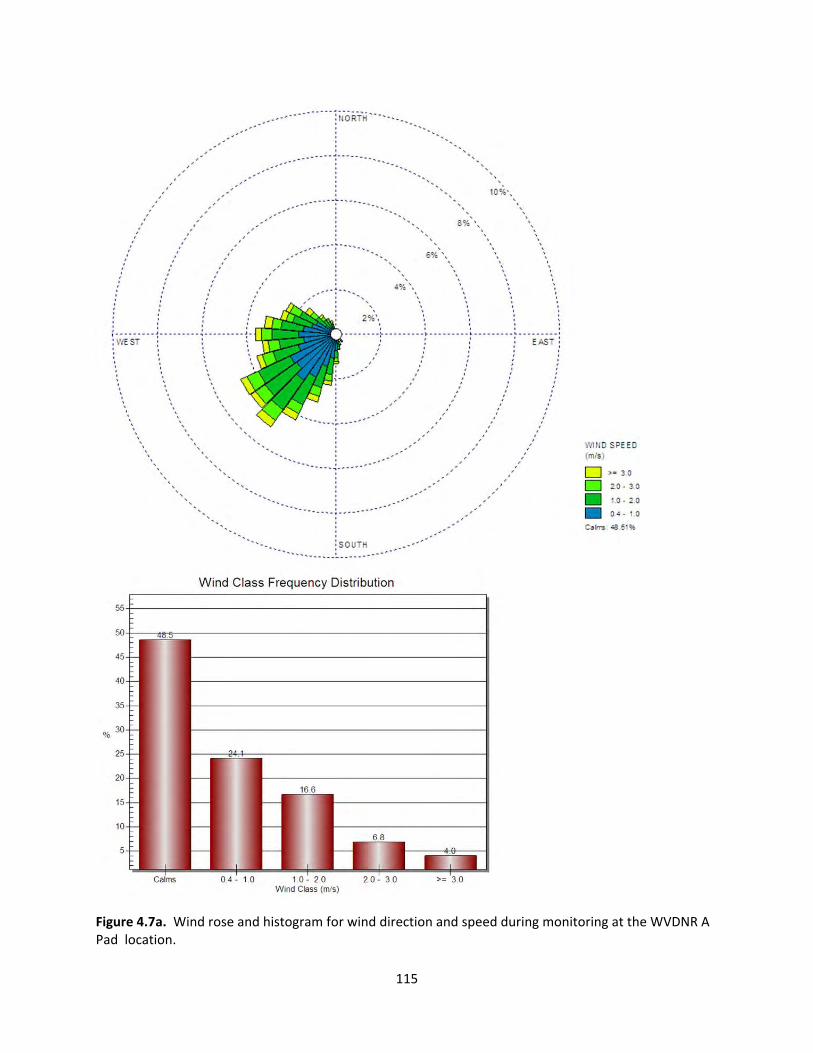
115
Figure 4.7a. Wind rose and histogram for wind direction and speed during monitoring at the WVDNR A Pad location.
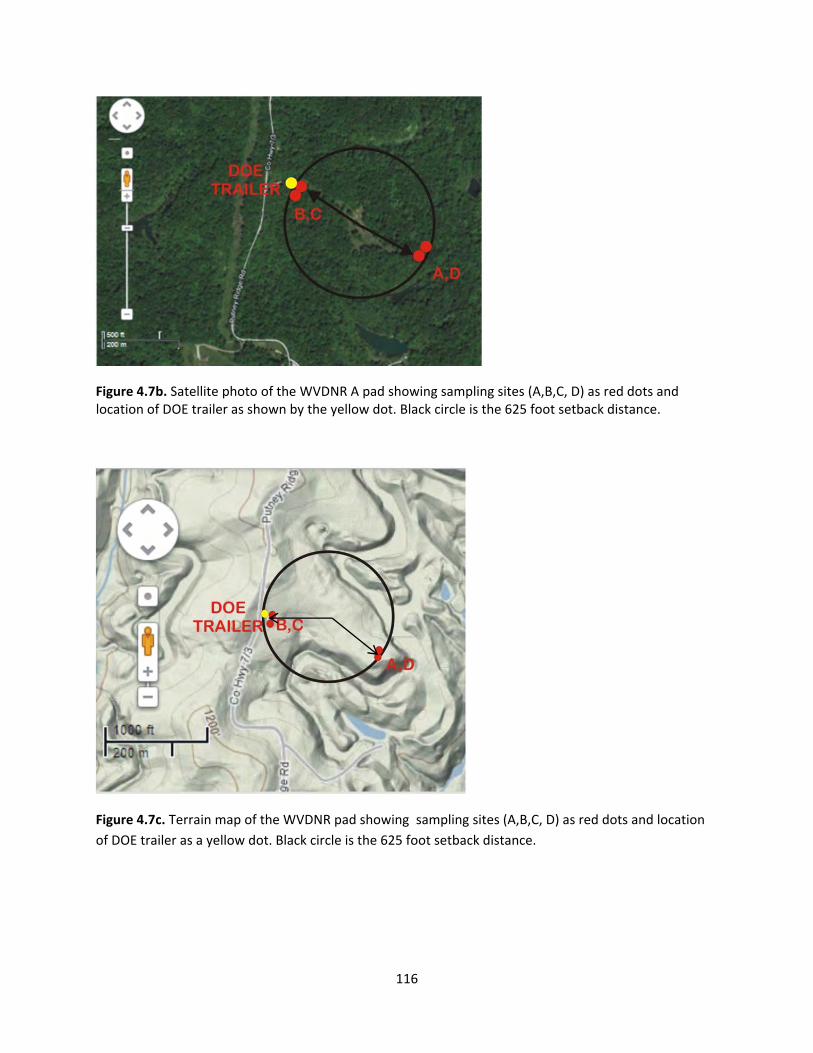
116
Figure 4.7b. Satellite photo of the WVDNR A pad showing sampling sites (A,B,C, D) as red dots and location of DOE trailer as shown by the yellow dot. Black circle is the 625 foot setback distance.
Figure 4.7c. Terrain map of the WVDNR pad showing sampling sites (A,B,C, D) as red dots and location
of DOE trailer as a yellow dot. Black circle is the 625 foot setback distance.

117
4.7.1 HC Results
The HCs analyzer was running continuously at this site from 10/19‐11/2 with a gap in the data
from 10/25‐10/31 due to a power interruption. There were a total of 162 samples.
Table 4.7 GC‐FID HC Results
Compound Average (ppb)
Standard Deviation (ppb)
Minimum (ppb)
Maximum (ppb)
Frequency of Detection (%)
Hexane 0.4 1.3 0.0 8.7 13
Toluene 1.0 1.0 0.0 8.8 82
m‐diethylbenzene 0.5 1.8 0.0 12.5 14
n‐undecane 3.4 14.3 0.0 122.3 40
n‐dodecane 3.6 12.7 0.0 95.8 43
Ethane 17.8 20.6 4.9 139.3 100
Ethylene 1.6 0.9 0.0 5.3 92
Propane 11.6 13.5 0.6 99.3 100
Propylene 0.2 0.5 0.0 3.7 20
Isobutane 2.5 3.1 0.0 22.2 86
n‐butane 6.2 8.4 0.0 58.6 99
Acetylene 0.3 0.6 0.0 3.2 25
Isopentane 2.3 2.5 0.0 15.8 83
n‐pentane 2.2 3.1 0.0 22.7 77
2‐methylpentane 0.2 0.7 0.0 4.6 10
4.7.2 Summa Canister HC Results

118
There were no samples for HCs taken at sites C or D because they were collocated with sites A
and B.
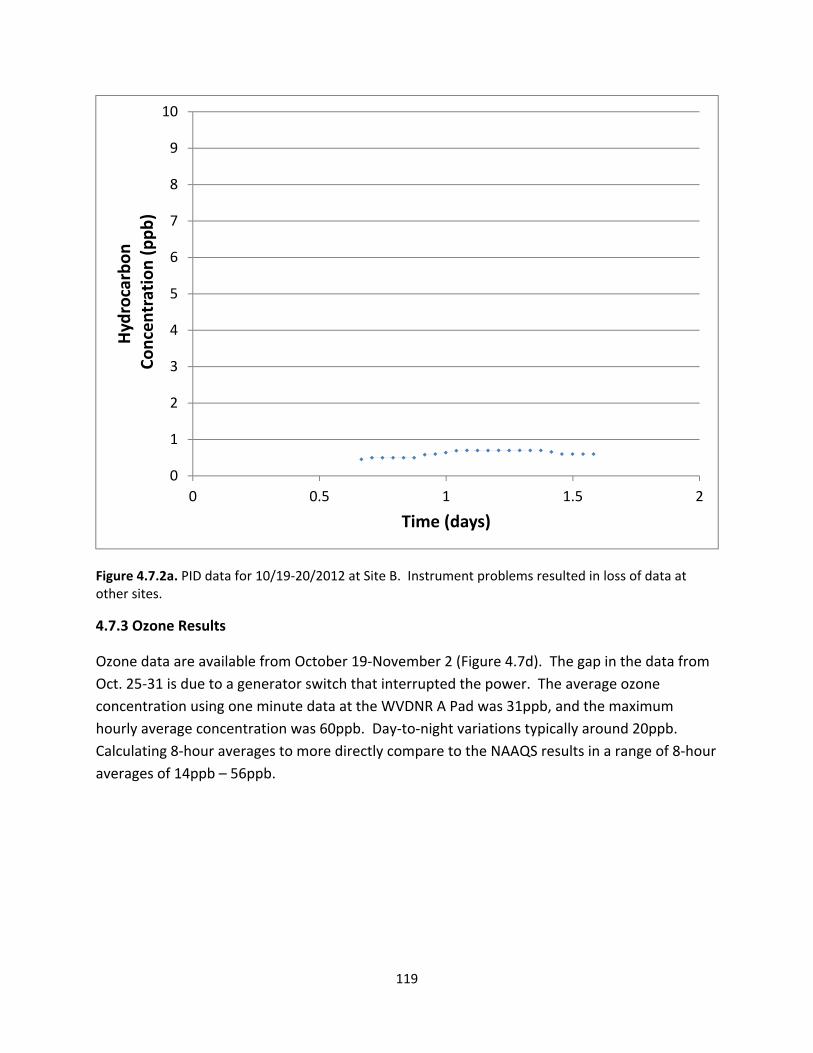
119
Figure 4.7.2a. PID data for 10/19‐20/2012 at Site B. Instrument problems resulted in loss of data at other sites.
4.7.3 Ozone Results
Ozone data are available from October 19‐November 2 (Figure 4.7d). The gap in the data from
Oct. 25‐31 is due to a generator switch that interrupted the power. The average ozone
concentration using one minute data at the WVDNR A Pad was 31ppb, and the maximum
hourly average concentration was 60ppb. Day‐to‐night variations typically around 20ppb.
Calculating 8‐hour averages to more directly compare to the NAAQS results in a range of 8‐hour
averages of 14ppb – 56ppb.
0
1
2
3
4
5
6
7
8
9
10
0 0.5 1 1.5 2
Hydrocarbon
Concentration (ppb)
Time (days)
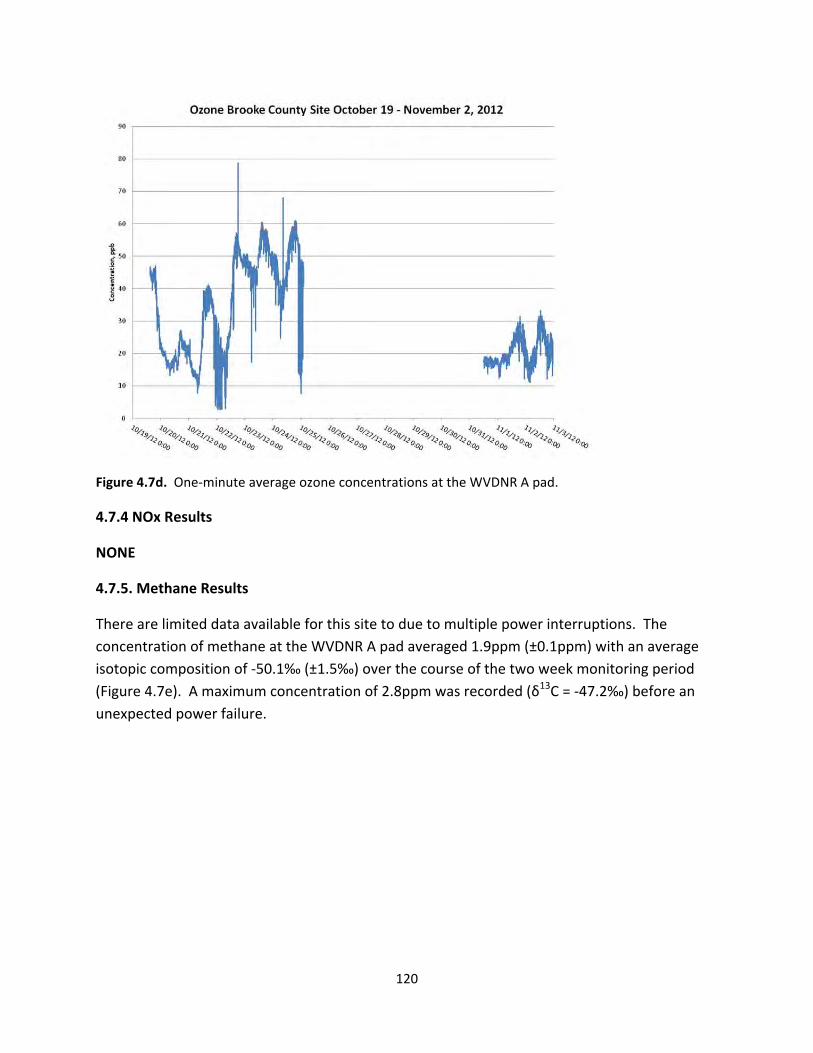
120
Figure 4.7d. One‐minute average ozone concentrations at the WVDNR A pad.
4.7.4 NOx Results
NONE
4.7.5. Methane Results
There are limited data available for this site to due to multiple power interruptions. The
concentration of methane at the WVDNR A pad averaged 1.9ppm (±0.1ppm) with an average
isotopic composition of ‐50.1‰ (±1.5‰) over the course of the two week monitoring period
(Figure 4.7e). A maximum concentration of 2.8ppm was recorded (δ13C = ‐47.2‰) before an
unexpected power failure.

121
Figure 4.7e. One‐minute average CH4 concentrations and δ13C of CH4 at the WVDNR A pad.
4.7.6 CO2 Results
The concentration of carbon dioxide at the WVDNR A pad site averaged 405ppm (±7ppm) with
an average isotopic composition of ‐12.5‰ (±0.9‰) over the course of the two week
monitoring period (Figure 4.7f). The maximum CO2 concentration at the site was 449ppm with a
corresponding δ13C value of ‐13.4‰.
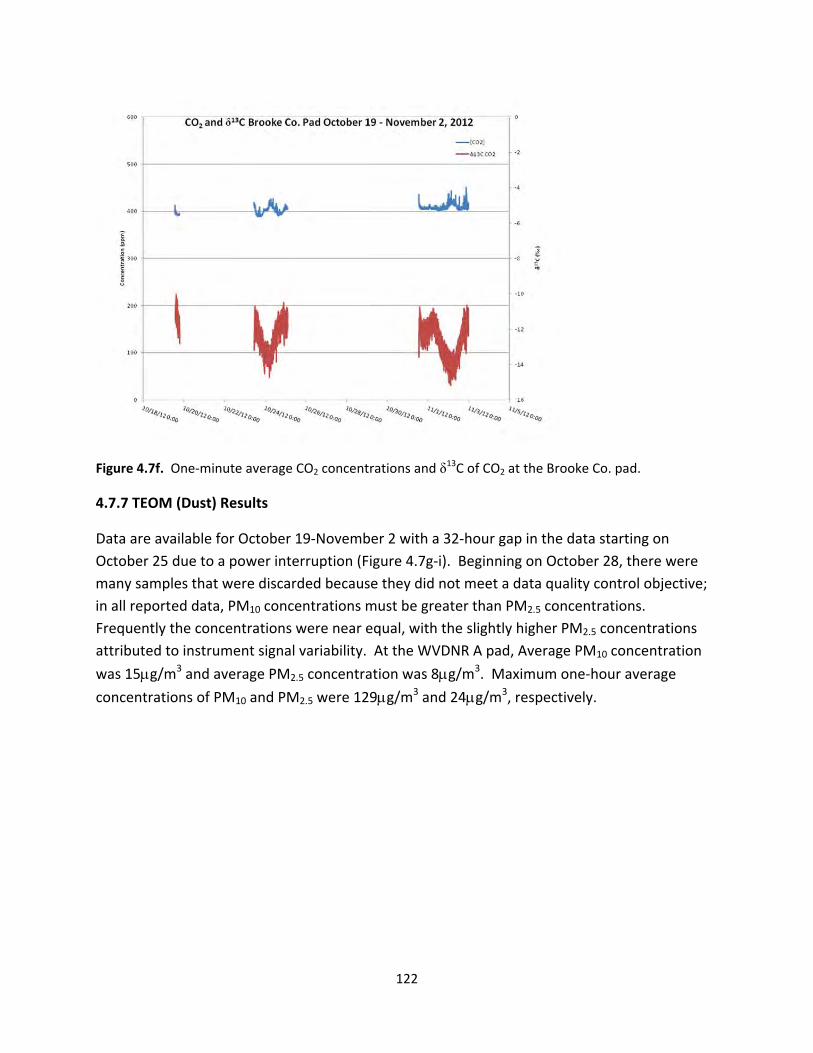
122
Figure 4.7f. One‐minute average CO2 concentrations and δ13C of CO2 at the Brooke Co. pad.
4.7.7 TEOM (Dust) Results
Data are available for October 19‐November 2 with a 32‐hour gap in the data starting on
October 25 due to a power interruption (Figure 4.7g‐i). Beginning on October 28, there were
many samples that were discarded because they did not meet a data quality control objective;
in all reported data, PM10 concentrations must be greater than PM2.5 concentrations.
Frequently the concentrations were near equal, with the slightly higher PM2.5 concentrations
attributed to instrument signal variability. At the WVDNR A pad, Average PM10 concentration
was 15g/m3 and average PM2.5 concentration was 8g/m3. Maximum one‐hour average
concentrations of PM10 and PM2.5 were 129g/m3 and 24g/m3, respectively.
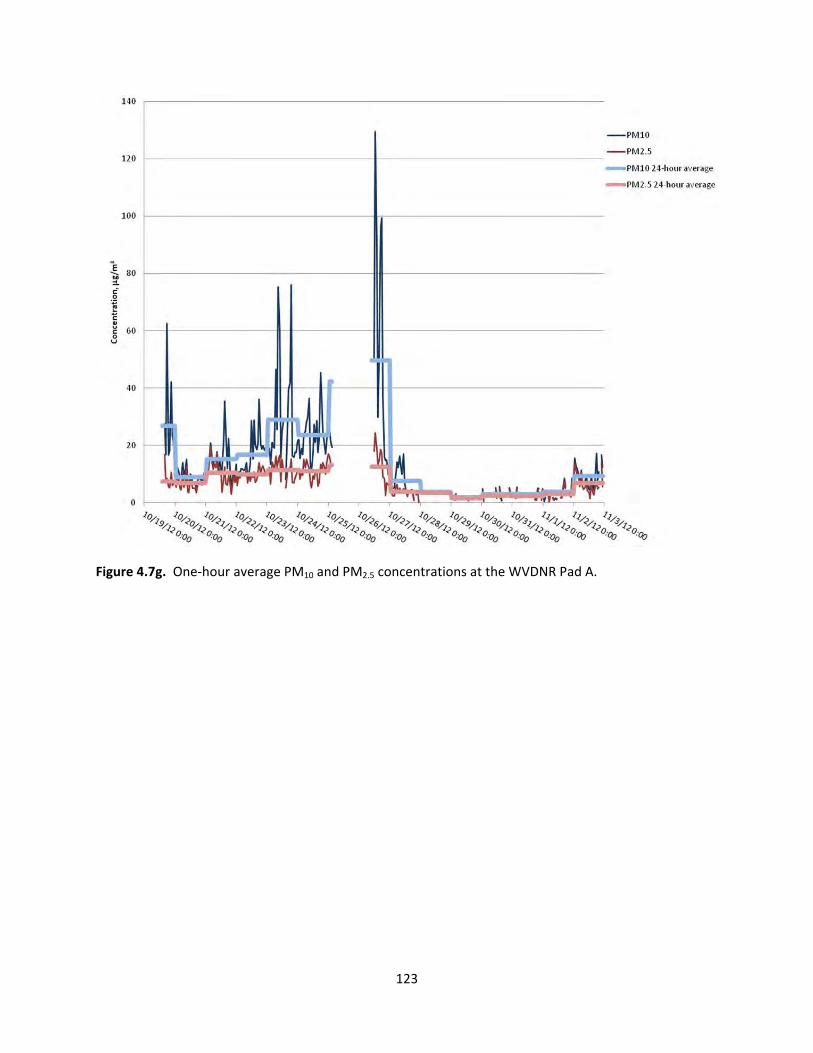
123
Figure 4.7g. One‐hour average PM10 and PM2.5 concentrations at the WVDNR Pad A.
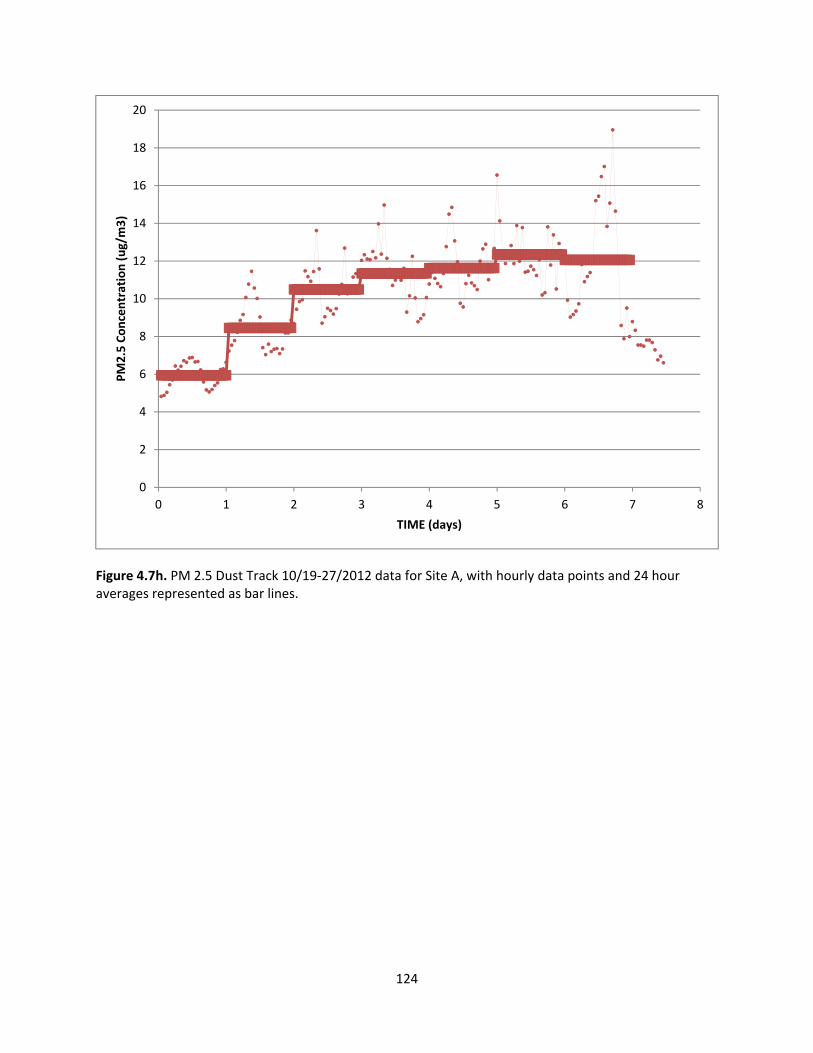
124
Figure 4.7h. PM 2.5 Dust Track 10/19‐27/2012 data for Site A, with hourly data points and 24 hour averages represented as bar lines.
0
2
4
6
8
10
12
14
16
18
20
0 1 2 3 4 5 6 7 8
PM2.5 Concentration (ug/m3)
TIME (days)
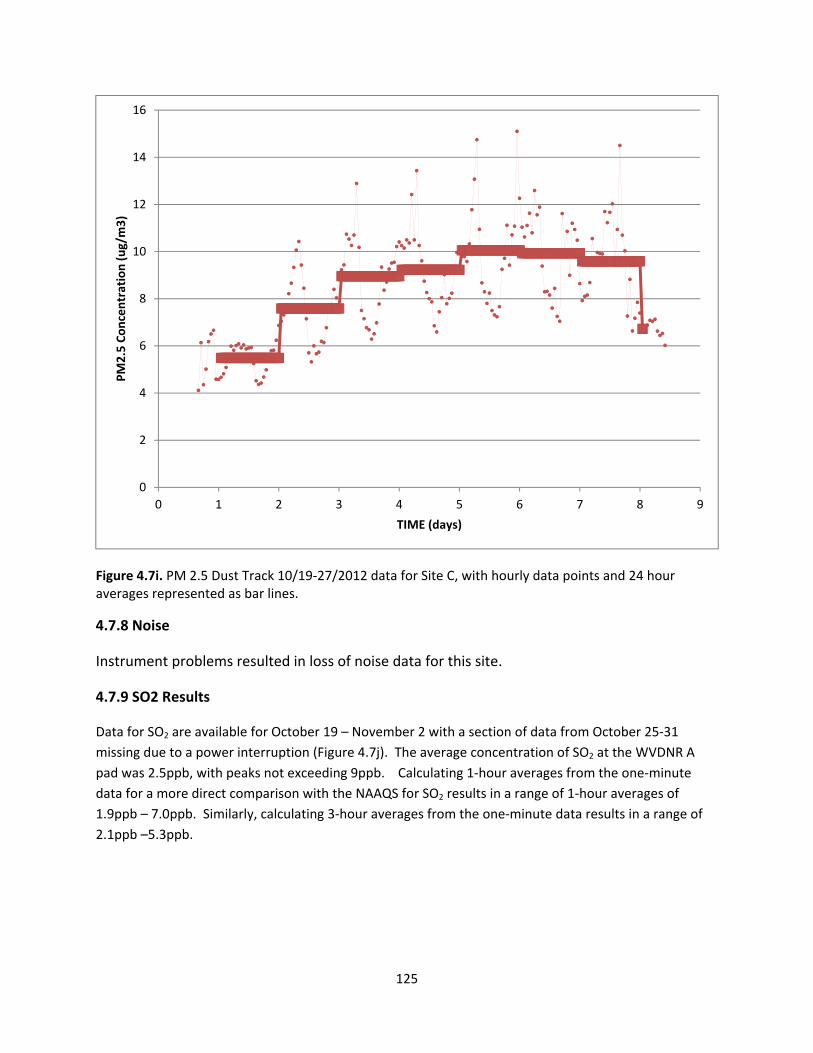
125
Figure 4.7i. PM 2.5 Dust Track 10/19‐27/2012 data for Site C, with hourly data points and 24 hour averages represented as bar lines.
4.7.8 Noise
Instrument problems resulted in loss of noise data for this site.
4.7.9 SO2 Results
Data for SO2 are available for October 19 – November 2 with a section of data from October 25‐31
missing due to a power interruption (Figure 4.7j). The average concentration of SO2 at the WVDNR A
pad was 2.5ppb, with peaks not exceeding 9ppb. Calculating 1‐hour averages from the one‐minute
data for a more direct comparison with the NAAQS for SO2 results in a range of 1‐hour averages of
1.9ppb – 7.0ppb. Similarly, calculating 3‐hour averages from the one‐minute data results in a range of
2.1ppb –5.3ppb.
0
2
4
6
8
10
12
14
16
0 1 2 3 4 5 6 7 8 9
PM2.5 Concentration (ug/m3)
TIME (days)

126
Figure 4.7j. One‐minute average SO2 concentrations for the WVDNR A pad.
4.8 Morgantown ‐ Control
Three Summa Canisters were placed in residential areas in Morgantown, Monongalia County,
West Virginia and used to sample for 72 hours (12/19‐22/2012). Two of the canisters were
placed, outside, side by side at a residence at the city limits. A third canister was placed,
outside, at a residence near the downtown area. No detectable organic compounds were
found in any of the canisters.

127
Figure 4.8a. Location of Control Summa Canister samples in Morgantown, WV.
128
5References
1. Air Management Practices Related to the Domestic Oil and Gas Industry Draft Report Prepared By:
ALL Consulting 1718 S. Cheyenne Ave Tulsa, Oklahoma 74119 TMS Contract # AC26‐05NT41816,
September 2009.
2. U.S. Environmental Protection Agency. National Ambient Air Quality Standards.
www.epa.gov/air/criteria.html (accessed September 2012).
3. US EPA, Office of Air Quality Planning and Standards Sector Policies and Programs Division. Oil and
Natural Gas Sector: Standards of Performance for Crude Oil and Natural Gas Production, Transmission,
and Distribution. EC/R, Incorporated 501 Eastowne Dr, Suite 250 Chapel Hill, North Carolina 27514
Contract No. EP‐D‐07‐061 Work Order No. 4‐06, 2006.
4. Clark , B.M. and T. Dutzik, Dirty Drilling The Threat of Oil and Gas Drilling in Michigan’s Great Lakes.
Edited by Brad Heavner, Rose Garr, Brian Imus, Margaux Shields and Amy Simpson. PIRGIM Education
Fund, February 2002
5. Commonwealth of Pennsylvania, Department of Environmental Protection. Southwestern Pennsylvania Marcellus Shale Short‐Term Ambient Air Sampling Report. November 1, 2010. 6. Risher, J. F. and C. T. DeRosa . The Precision, Uses, and Limitations of Public Health Guidance Values. Human and Ecological Risk Assessment: Vol. 3, No.5, pp. 681‐700 (1997) 7. Hume, K. I. , Brink, M., and M. Basner. Effects of environmental noise on sleep. Noise Health.
14(61):297‐302. (2012)
8. Jarup L., Babisch W., Houthuijs D., Pershagen G., Katsouyanni K., Cadum E., et al. Hypertension and
exposure to noise near airports: the HYENA study. Environ Health Perspect 116:329‐33. (2008)
9. Babisch W., Ising H., Gallacher J.E.J., Sweetnam P.M., Elwood P.C. Traffic noise and cardiovascular risk:
The caerphilly and speedwell studies, third phase‐10‐year follow up. Arch Environ Health 54:210‐6.
(1999)
10. Lercher, P., Widmann, U. and W. Kofler, Transportation noise and blood pressure: the importance of
modifying factors In: Cassereau D, editor. Internoise; Nice, France: Société Française d'Acoustique, 2000.
11. Dratva, J., Phuleria, H.C., Foraster, M., Gaspoz, J.M., Keidel ,D., Künzli N., et al. Transportation Noise
and Blood Pressure in a Population‐Based Sample of Adults. Environ Health Perspect 2011;120:50‐5.
12. Night noise guidelines for Europe. Copenhagen, Denmark: World Health Organisation (WHO), 2009.
Available from: http://www.euro.who.int/__data/assets/pdf_file/0017/43316/E92845.pdf (accessed
January 2013)
13. Fritschi, L., Brown, A.L., Kim, R., Schwela, D.H., Kephalopoulos, S., editors. Burden of disease from
environmental noise. Bonn, Germany: World Health Organization (WHO); 2011.

129
14. McKenzie, L.M., et al, Human health risk assessment of air emissions from development of
unconventional natural gas resources, Sci Total Environ (2012), doi:10.1016/j.scitotenv.2012.02.018
15. Groat , C. G., and T.W., Grimshaw. Fact‐Based Regulation for Environmental Protection in Shale Gas
Development. The Energy Institute, Flawn Academic Center, FAC 428, 2 West Mall, C2400, The
University of Texas at Austin, Austin, TX 78712, http://energy.utexas.edu/ (accessed September 2012)
16. Figueiro MG, Rea MS. Preliminary evidence that light through the eyelids can suppress melatonin and phase shift dim light melatonin onset. BMC Res Notes. 2012 May 7;5:221. doi: 10.1186/1756‐0500‐5‐221. 17. Schernhammer ES, Schulmeister K. Melatonin and cancer risk: does light at night compromise physiologic cancer protection by lowering serum melatonin levels? Br J Cancer. 2004 Mar 8;90(5):941‐3. 18. White N, teWaterNaude J, van der Walt A, Ravenscroft G, Roberts W, Ehrlich R. Meteorologically estimated exposure but not distance predicts asthma symptoms in school children in the environs of a petrochemical refinery: a cross‐sectional study. Environ Health 2009;8(1):45. 19. http://www.gcaudio.com/resources/howtos/loudness.html, accessed March 14, 2013.

APPENDIX A
ATSDR MRL VALUES
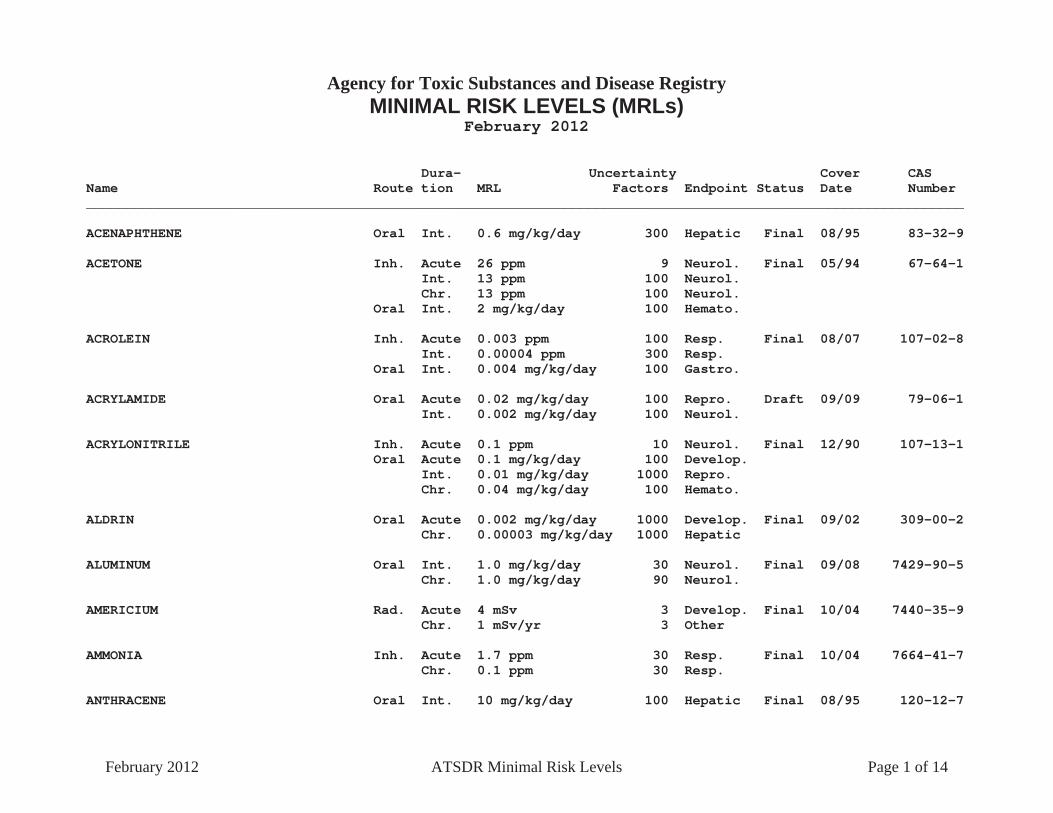
Agency for Toxic Substances and Disease Registry MINIMAL RISK LEVELS (MRLs)
February 2012
Dura- Uncertainty Cover CAS Name Route tion MRL Factors Endpoint Status Date Number ______________________________________________________________________________________________________________
ACENAPHTHENE Oral Int. 0.6 mg/kg/day 300 Hepatic Final 08/95 83-32-9
ACETONE Inh. Acute 26 ppm 9 Neurol. Final 05/94 67-64-1 Int. 13 ppm 100 Neurol. Chr. 13 ppm 100 Neurol. Oral Int. 2 mg/kg/day 100 Hemato.
ACROLEIN Inh. Acute 0.003 ppm 100 Resp. Final 08/07 107-02-8 Int. 0.00004 ppm 300 Resp. Oral Int. 0.004 mg/kg/day 100 Gastro.
ACRYLAMIDE Oral Acute 0.02 mg/kg/day 100 Repro. Draft 09/09 79-06-1 Int. 0.002 mg/kg/day 100 Neurol.
ACRYLONITRILE Inh. Acute 0.1 ppm 10 Neurol. Final 12/90 107-13-1 Oral Acute 0.1 mg/kg/day 100 Develop. Int. 0.01 mg/kg/day 1000 Repro. Chr. 0.04 mg/kg/day 100 Hemato.
ALDRIN Oral Acute 0.002 mg/kg/day 1000 Develop. Final 09/02 309-00-2 Chr. 0.00003 mg/kg/day 1000 Hepatic
ALUMINUM Oral Int. 1.0 mg/kg/day 30 Neurol. Final 09/08 7429-90-5 Chr. 1.0 mg/kg/day 90 Neurol.
AMERICIUM Rad. Acute 4 mSv 3 Develop. Final 10/04 7440-35-9 Chr. 1 mSv/yr 3 Other
AMMONIA Inh. Acute 1.7 ppm 30 Resp. Final 10/04 7664-41-7 Chr. 0.1 ppm 30 Resp.
ANTHRACENE Oral Int. 10 mg/kg/day 100 Hepatic Final 08/95 120-12-7
February 2012 ATSDR Minimal Risk Levels Page 1 of 14
mamccawley
Text Box
Appendix A

ARSENIC Oral Acute 0.005 mg/kg/day 10 Gastro. Final 08/07 7440-38-2 Chr. 0.0003 mg/kg/day 3 Dermal
ATRAZINE Oral Acute 0.01 mg/kg/day 100 Body Wt. Final 09/03 1912-24-9 Int. 0.003 mg/kg/day 300 Repro.
BARIUM, SOLUBLE SALTS Oral Int. 0.2 mg/kg/day 100 Renal Final 08/07 7440-39-3 Chr. 0.2 mg/kg/day 100 Renal
BENZENE Inh. Acute 0.009 ppm 300 Immuno. Final 08/07 71-43-2 Int. 0.006 ppm 300 Immuno. Chr. 0.003 ppm 10 Immuno. Oral Chr. 0.0005 mg/kg/day 30 Immuno.
BERYLLIUM Oral Chr. 0.002 mg/kg/day 300 Gastro. Final 09/02 7440-41-7
BIS(2-CHLOROETHYL) ETHER Inh. Int. 0.02 ppm 1000 Body Wt. Final 12/89 111-44-4
BIS(CHLOROMETHYL) ETHER Inh. Int. 0.0003 ppm 100 Resp. Final 12/89 542-88-1
BORON Inh. Acute 0.3 mg/m3 3 Resp. Final 11/10 7440-42-8 Oral Acute 0.2 mg/kg/day 100 Develop. Int. 0.2 mg/kg/day 66 Develop.
BROMODICHLOROMETHANE Oral Acute 0.04 mg/kg/day 1000 Hepatic Final 12/89 75-27-4 Chr. 0.02 mg/kg/day 1000 Renal
BROMOFORM Oral Acute 0.7 mg/kg/day 100 Hepatic Final 09/05 75-25-2 Int. 0.2 mg/kg/day 300 Hepatic Chr. 0.02 mg/kg/day 3000 Hepatic
BROMOMETHANE Inh. Acute 0.05 ppm 100 Neurol. Final 09/92 74-83-9 Int. 0.05 ppm 100 Neurol. Chr. 0.005 ppm 100 Neurol. Oral Int. 0.003 mg/kg/day 100 Gastro.
1,3-BUTADIENE Inh. Acute 0.1 ppm 90 Develop. Draft 09/09 106-99-0
2-BUTOXYETHANOL Inh. Acute 6 ppm 9 Hemato. Final 10/98 111-76-2 (ETHYLENE GLYCOL MONOBUTYL ETHER) Int. 3 ppm 9 Hemato. Chr. 0.2 ppm 3 Hemato. Oral Acute 0.4 mg/kg/day 90 Hemato. Int. 0.07 mg/kg/day 1000 Hepatic
February 2012 ATSDR Minimal Risk Levels Page 2 of 14
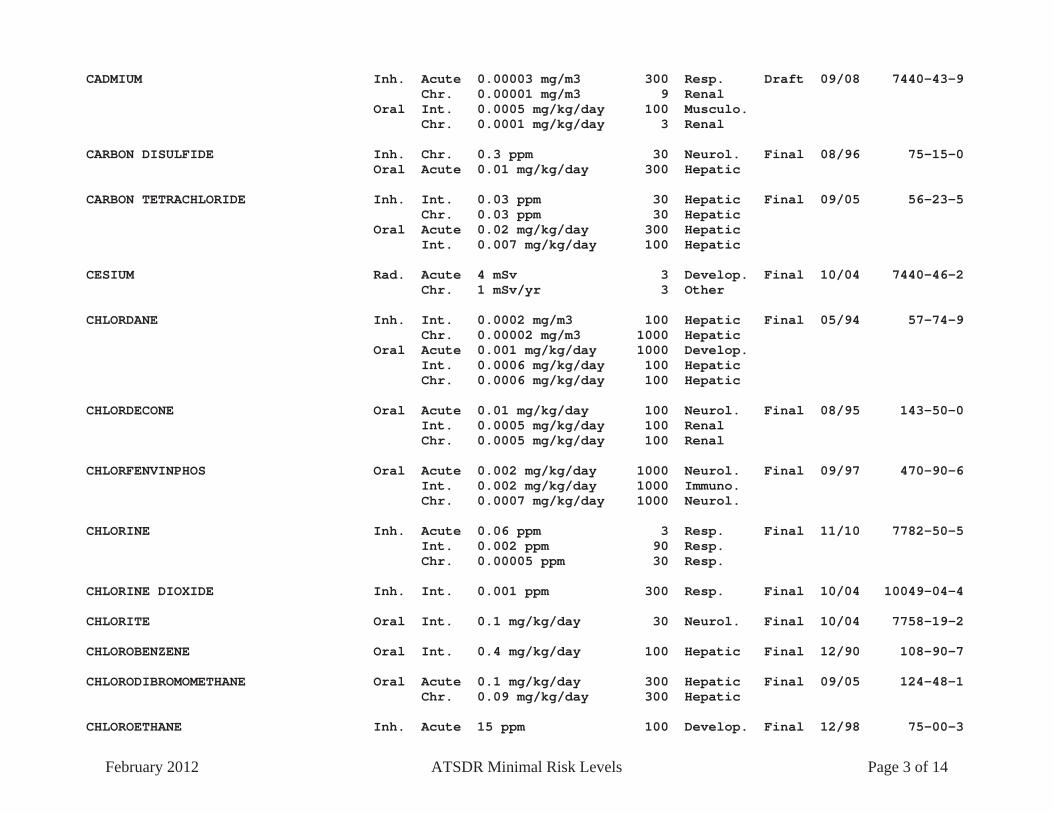
CADMIUM Inh. Acute 0.00003 mg/m3 300 Resp. Draft 09/08 7440-43-9 Chr. 0.00001 mg/m3 9 Renal Oral Int. 0.0005 mg/kg/day 100 Musculo. Chr. 0.0001 mg/kg/day 3 Renal
CARBON DISULFIDE Inh. Chr. 0.3 ppm 30 Neurol. Final 08/96 75-15-0 Oral Acute 0.01 mg/kg/day 300 Hepatic
CARBON TETRACHLORIDE Inh. Int. 0.03 ppm 30 Hepatic Final 09/05 56-23-5 Chr. 0.03 ppm 30 Hepatic Oral Acute 0.02 mg/kg/day 300 Hepatic Int. 0.007 mg/kg/day 100 Hepatic
CESIUM Rad. Acute 4 mSv 3 Develop. Final 10/04 7440-46-2 Chr. 1 mSv/yr 3 Other
CHLORDANE Inh. Int. 0.0002 mg/m3 100 Hepatic Final 05/94 57-74-9 Chr. 0.00002 mg/m3 1000 Hepatic Oral Acute 0.001 mg/kg/day 1000 Develop. Int. 0.0006 mg/kg/day 100 Hepatic Chr. 0.0006 mg/kg/day 100 Hepatic
CHLORDECONE Oral Acute 0.01 mg/kg/day 100 Neurol. Final 08/95 143-50-0 Int. 0.0005 mg/kg/day 100 Renal Chr. 0.0005 mg/kg/day 100 Renal
CHLORFENVINPHOS Oral Acute 0.002 mg/kg/day 1000 Neurol. Final 09/97 470-90-6 Int. 0.002 mg/kg/day 1000 Immuno. Chr. 0.0007 mg/kg/day 1000 Neurol.
CHLORINE Inh. Acute 0.06 ppm 3 Resp. Final 11/10 7782-50-5 Int. 0.002 ppm 90 Resp. Chr. 0.00005 ppm 30 Resp.
CHLORINE DIOXIDE Inh. Int. 0.001 ppm 300 Resp. Final 10/04 10049-04-4
CHLORITE Oral Int. 0.1 mg/kg/day 30 Neurol. Final 10/04 7758-19-2
CHLOROBENZENE Oral Int. 0.4 mg/kg/day 100 Hepatic Final 12/90 108-90-7
CHLORODIBROMOMETHANE Oral Acute 0.1 mg/kg/day 300 Hepatic Final 09/05 124-48-1 Chr. 0.09 mg/kg/day 300 Hepatic
CHLOROETHANE Inh. Acute 15 ppm 100 Develop. Final 12/98 75-00-3
February 2012 ATSDR Minimal Risk Levels Page 3 of 14

CHLOROFORM Inh. Acute 0.1 ppm 30 Hepatic Final 09/97 67-66-3 Int. 0.05 ppm 300 Hepatic Chr. 0.02 ppm 100 Hepatic Oral Acute 0.3 mg/kg/day 100 Hepatic Int. 0.1 mg/kg/day 100 Hepatic Chr. 0.01 mg/kg/day 1000 Hepatic
CHLOROMETHANE Inh. Acute 0.5 ppm 100 Neurol. Final 12/98 74-87-3 Int. 0.2 ppm 300 Hepatic Chr. 0.05 ppm 1000 Neurol.
4-CHLOROPHENOL Oral Acute 0.01 mg/kg/day 100 Hepatic Final 07/99 106-48-9
CHLORPYRIFOS Oral Acute 0.003 mg/kg/day 10 Neurol. Final 09/97 2921-88-2 Int. 0.003 mg/kg/day 10 Neurol. Chr. 0.001 mg/kg/day 100 Neurol.
CHROMIUM(III) SOLUBLE PARTICULATES Inh. Int. 0.0001 mg/m3 300 Resp. Draft 09/08 16065-83-1
CHROMIUM(III) INSOL. PARTICULATES Inh. Int. 0.005 mg/m3 90 Resp. Draft 09/08 16065-83-1
CHROMIUM(VI) Oral Int. 0.005 mg/kg/day 100 Hemato. Draft 09/08 18540-29-9 Chr. 0.001 mg/kg/day 100 Gastro.
CHROMIUM(VI), AEROSOL MISTS Inh. Int. 0.000005 mg/m3 100 Resp. Draft 09/08 18540-29-9 Chr. 0.000005 mg/m3 100 Resp.
CHROMIUM(VI), PARTICULATES Inh. Int. 0.0003 mg/m3 30 Resp. Draft 09/08 18540-29-9
COBALT Inh. Chr. 0.0001 mg/m3 10 Resp. Final 10/04 7440-48-4 Oral Int. 0.01 mg/kg/day 100 Hemato. Rad. Acute 4 mSv 3 Develop. Chr. 1 mSv/yr 3 Other
COPPER Oral Acute 0.01 mg/kg/day 3 Gastro. Final 10/04 7440-50-8 Int. 0.01 mg/kg/day 3 Gastro.
CRESOLS Oral Int. 0.1 mg/kg/day 100 Resp. Final 09/08 1319-77-3 Chr. 0.1 mg/kg/day 1000 Resp.
CYANIDE, SODIUM Oral Int. 0.05 mg/kg/day 100 Repro. Final 07/06 143-33-9
February 2012 ATSDR Minimal Risk Levels Page 4 of 14
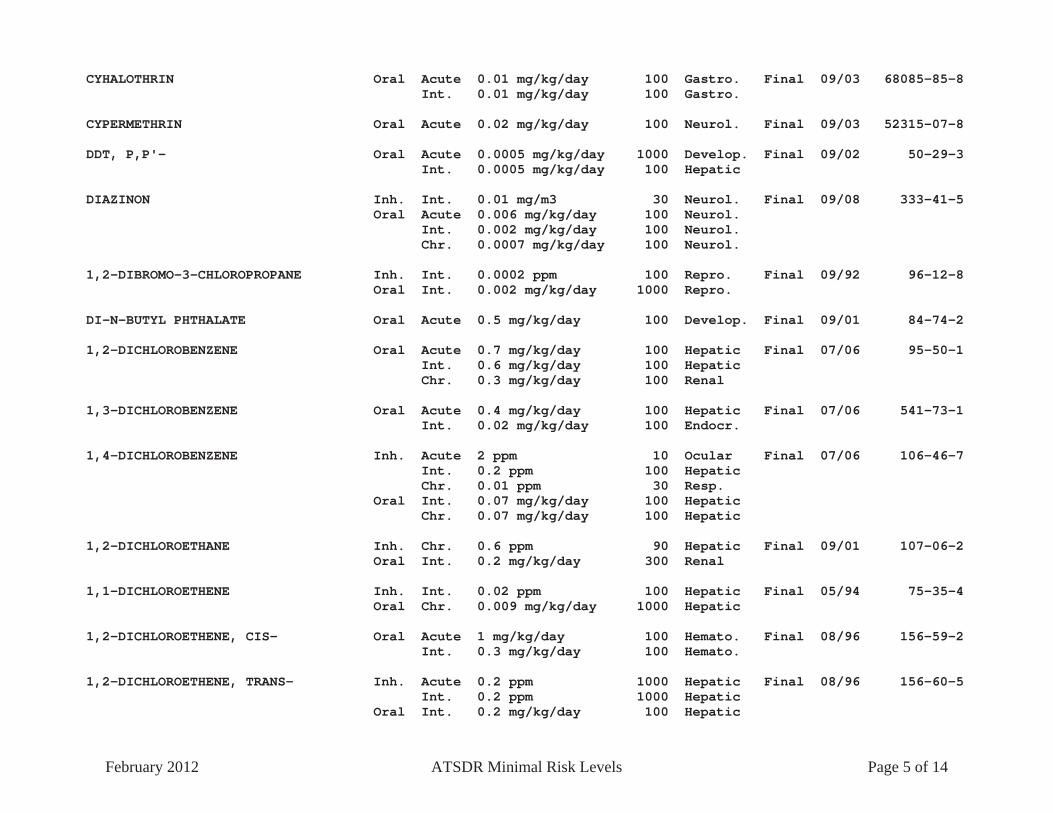
CYHALOTHRIN Oral Acute 0.01 mg/kg/day 100 Gastro. Final 09/03 68085-85-8 Int. 0.01 mg/kg/day 100 Gastro.
CYPERMETHRIN Oral Acute 0.02 mg/kg/day 100 Neurol. Final 09/03 52315-07-8
DDT, P,P'- Oral Acute 0.0005 mg/kg/day 1000 Develop. Final 09/02 50-29-3 Int. 0.0005 mg/kg/day 100 Hepatic
DIAZINON Inh. Int. 0.01 mg/m3 30 Neurol. Final 09/08 333-41-5 Oral Acute 0.006 mg/kg/day 100 Neurol. Int. 0.002 mg/kg/day 100 Neurol. Chr. 0.0007 mg/kg/day 100 Neurol.
1,2-DIBROMO-3-CHLOROPROPANE Inh. Int. 0.0002 ppm 100 Repro. Final 09/92 96-12-8 Oral Int. 0.002 mg/kg/day 1000 Repro.
DI-N-BUTYL PHTHALATE Oral Acute 0.5 mg/kg/day 100 Develop. Final 09/01 84-74-2
1,2-DICHLOROBENZENE Oral Acute 0.7 mg/kg/day 100 Hepatic Final 07/06 95-50-1 Int. 0.6 mg/kg/day 100 Hepatic Chr. 0.3 mg/kg/day 100 Renal
1,3-DICHLOROBENZENE Oral Acute 0.4 mg/kg/day 100 Hepatic Final 07/06 541-73-1 Int. 0.02 mg/kg/day 100 Endocr.
1,4-DICHLOROBENZENE Inh. Acute 2 ppm 10 Ocular Final 07/06 106-46-7 Int. 0.2 ppm 100 Hepatic Chr. 0.01 ppm 30 Resp. Oral Int. 0.07 mg/kg/day 100 Hepatic Chr. 0.07 mg/kg/day 100 Hepatic
1,2-DICHLOROETHANE Inh. Chr. 0.6 ppm 90 Hepatic Final 09/01 107-06-2 Oral Int. 0.2 mg/kg/day 300 Renal
1,1-DICHLOROETHENE Inh. Int. 0.02 ppm 100 Hepatic Final 05/94 75-35-4 Oral Chr. 0.009 mg/kg/day 1000 Hepatic
1,2-DICHLOROETHENE, CIS- Oral Acute 1 mg/kg/day 100 Hemato. Final 08/96 156-59-2 Int. 0.3 mg/kg/day 100 Hemato.
1,2-DICHLOROETHENE, TRANS- Inh. Acute 0.2 ppm 1000 Hepatic Final 08/96 156-60-5 Int. 0.2 ppm 1000 Hepatic Oral Int. 0.2 mg/kg/day 100 Hepatic
February 2012 ATSDR Minimal Risk Levels Page 5 of 14

2,4-DICHLOROPHENOL Oral Int. 0.003 mg/kg/day 100 Immuno. Final 07/99 120-83-2
1,2-DICHLOROPROPANE Inh. Acute 0.05 ppm 1000 Resp. Final 12/89 78-87-5 Int. 0.007 ppm 1000 Resp. Oral Acute 0.1 mg/kg/day 1000 Neurol. Int. 0.07 mg/kg/day 1000 Hemato. Chr. 0.09 mg/kg/day 1000 Hepatic
1,3-DICHLOROPROPENE Inh. Int. 0.008 ppm 30 Resp. Final 09/08 542-75-6 Chr. 0.007 ppm 30 Resp. Oral Int. 0.04 mg/kg/day 100 Gastro. Chr. 0.03 mg/kg/day 100 Gastro.
2,3-DICHLOROPROPENE Inh. Acute 0.002 ppm 90 Resp. Final 09/08 78-88-6
DICHLORVOS Inh. Acute 0.002 ppm 100 Neurol. Final 09/97 62-73-7 Int. 0.0003 ppm 100 Neurol. Chr. 0.00006 ppm 100 Neurol. Oral Acute 0.004 mg/kg/day 1000 Neurol. Int. 0.003 mg/kg/day 10 Neurol. Chr. 0.0005 mg/kg/day 100 Neurol.
DIELDRIN Oral Int. 0.0001 mg/kg/day 100 Neurol. Final 09/02 60-57-1 Chr. 0.00005 mg/kg/day 100 Hepatic
DI(2-ETHYLHEXYL)PHTHALATE Oral Int. 0.1 mg/kg/day 100 Repro. Final 09/02 117-81-7 Chr. 0.06 mg/kg/day 100 Repro.
DIETHYL PHTHALATE Oral Acute 7 mg/kg/day 300 Repro. Final 06/95 84-66-2 Int. 6 mg/kg/day 300 Hepatic
DIISOPROPYL METHYLPHOSPHONATE Oral Int. 0.8 mg/kg/day 100 Hemato. Final 10/98 1445-75-6 (DIMP) Chr. 0.6 mg/kg/day 100 Hemato.
DIMETHYLARSINIC ACID (DMA) Oral Chr. 0.02 mg/kg/day 100 Renal Final 08/07 75-60-5
1,1-DIMETHYLHYDRAZINE Inh. Int. 0.0002 ppm 300 Hepatic Final 09/97 57-14-7
1,2-DIMETHYLHYDRAZINE Oral Int. 0.0008 mg/kg/day 1000 Hepatic Final 09/97 540-73-8
1,3-DINITROBENZENE Oral Acute 0.008 mg/kg/day 100 Repro. Final 06/95 99-65-0 Int. 0.0005 mg/kg/day 1000 Hemato.
February 2012 ATSDR Minimal Risk Levels Page 6 of 14
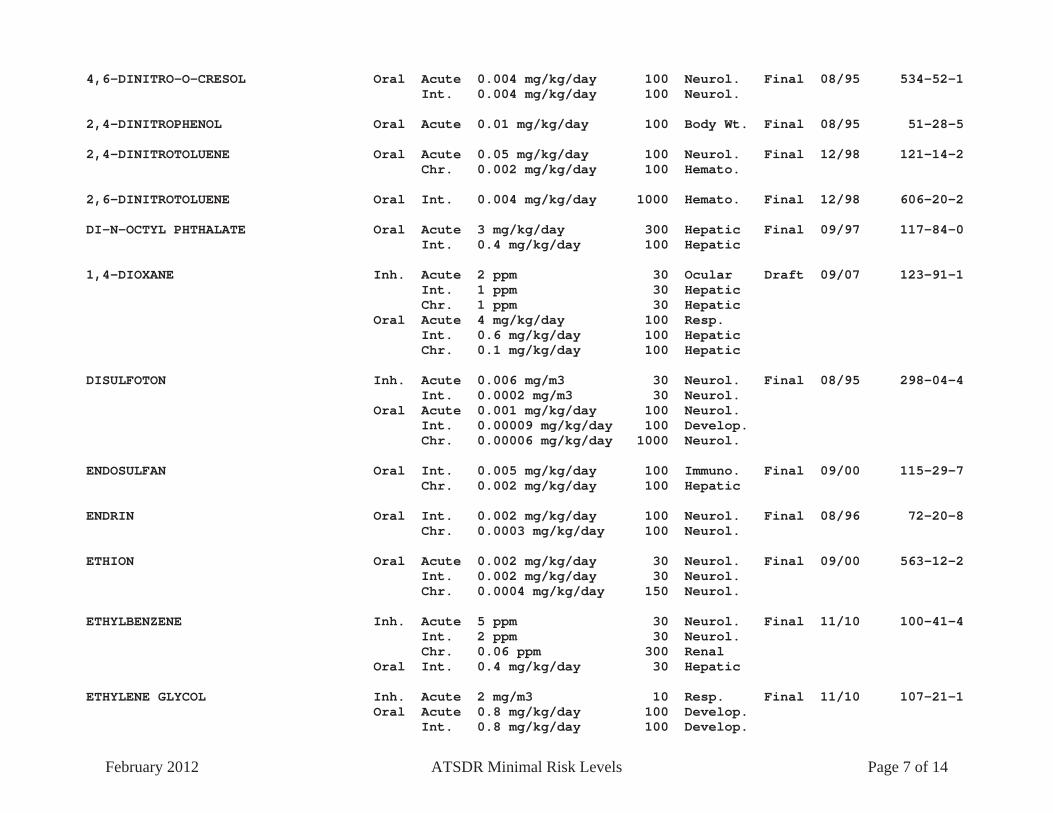
4,6-DINITRO-O-CRESOL Oral Acute 0.004 mg/kg/day 100 Neurol. Final 08/95 534-52-1 Int. 0.004 mg/kg/day 100 Neurol.
2,4-DINITROPHENOL Oral Acute 0.01 mg/kg/day 100 Body Wt. Final 08/95 51-28-5
2,4-DINITROTOLUENE Oral Acute 0.05 mg/kg/day 100 Neurol. Final 12/98 121-14-2 Chr. 0.002 mg/kg/day 100 Hemato.
2,6-DINITROTOLUENE Oral Int. 0.004 mg/kg/day 1000 Hemato. Final 12/98 606-20-2
DI-N-OCTYL PHTHALATE Oral Acute 3 mg/kg/day 300 Hepatic Final 09/97 117-84-0 Int. 0.4 mg/kg/day 100 Hepatic
1,4-DIOXANE Inh. Acute 2 ppm 30 Ocular Draft 09/07 123-91-1 Int. 1 ppm 30 Hepatic Chr. 1 ppm 30 Hepatic Oral Acute 4 mg/kg/day 100 Resp. Int. 0.6 mg/kg/day 100 Hepatic Chr. 0.1 mg/kg/day 100 Hepatic
DISULFOTON Inh. Acute 0.006 mg/m3 30 Neurol. Final 08/95 298-04-4 Int. 0.0002 mg/m3 30 Neurol. Oral Acute 0.001 mg/kg/day 100 Neurol. Int. 0.00009 mg/kg/day 100 Develop. Chr. 0.00006 mg/kg/day 1000 Neurol.
ENDOSULFAN Oral Int. 0.005 mg/kg/day 100 Immuno. Final 09/00 115-29-7 Chr. 0.002 mg/kg/day 100 Hepatic
ENDRIN Oral Int. 0.002 mg/kg/day 100 Neurol. Final 08/96 72-20-8 Chr. 0.0003 mg/kg/day 100 Neurol.
ETHION Oral Acute 0.002 mg/kg/day 30 Neurol. Final 09/00 563-12-2 Int. 0.002 mg/kg/day 30 Neurol. Chr. 0.0004 mg/kg/day 150 Neurol.
ETHYLBENZENE Inh. Acute 5 ppm 30 Neurol. Final 11/10 100-41-4 Int. 2 ppm 30 Neurol. Chr. 0.06 ppm 300 Renal Oral Int. 0.4 mg/kg/day 30 Hepatic
ETHYLENE GLYCOL Inh. Acute 2 mg/m3 10 Resp. Final 11/10 107-21-1 Oral Acute 0.8 mg/kg/day 100 Develop. Int. 0.8 mg/kg/day 100 Develop.
February 2012 ATSDR Minimal Risk Levels Page 7 of 14

ETHYLENE OXIDE Inh. Int. 0.09 ppm 100 Renal Final 12/90 75-21-8
FLUORANTHENE Oral Int. 0.4 mg/kg/day 300 Hepatic Final 08/95 206-44-0
FLUORENE Oral Int. 0.4 mg/kg/day 300 Hepatic Final 08/95 86-73-7
FLUORIDE, SODIUM Oral Chr. 0.05 mg/kg/day 3 Musculo. Final 09/03 7681-49-4
FLUORINE Inh. Acute 0.01 ppm 10 Resp. Final 09/03 7782-41-4
FORMALDEHYDE Inh. Acute 0.04 ppm 9 Resp. Final 07/99 50-00-0 Int. 0.03 ppm 30 Resp. Chr. 0.008 ppm 30 Resp. Oral Int. 0.3 mg/kg/day 100 Gastro. Chr. 0.2 mg/kg/day 100 Gastro.
FUEL OIL NO.2 Inh. Acute 0.02 mg/m3 1000 Neurol. Final 06/95 68476-30-2
GUTHION (AZINPHOS-METHYL) Inh. Acute 0.02 mg/m3 30 Neurol. Final 09/08 86-50-0 Int. 0.01 mg/m3 30 Neurol. Chr. 0.01 mg/m3 30 Neurol. Oral Acute 0.01 mg/kg/day 100 Neurol. Int. 0.003 mg/kg/day 100 Neurol. Chr. 0.003 mg/kg/day 100 Neurol.
HEPTACHLOR Oral Acute 0.0006 mg/kg/day 3000 Repro. Final 08/07 76-44-8 Int. 0.0001 mg/kg/day 300 Immuno.
HEXACHLOROBENZENE Oral Acute 0.008 mg/kg/day 300 Develop. Final 09/02 118-74-1 Int. 0.0001 mg/kg/day 90 Repro. Chr. 0.00005 mg/kg/day 300 Develop.
HEXACHLOROBUTADIENE Oral Int. 0.0002 mg/kg/day 1000 Renal Final 05/94 87-68-3
ALPHA-HEXACHLOROCYCLOHEXANE Oral Chr. 0.008 mg/kg/day 100 Hepatic Final 09/05 319-84-6
BETA-HEXACHLOROCYCLOHEXANE Oral Acute 0.05 mg/kg/day 100 Neurol. Final 09/05 319-85-7 Int. 0.0006 mg/kg/day 300 Hepatic
GAMMA-HEXACHLOROCYCLOHEXANE Oral Acute 0.003 mg/kg/day 300 Develop. Final 09/05 58-89-9 Int. 0.00001 mg/kg/day 1000 Immuno.
February 2012 ATSDR Minimal Risk Levels Page 8 of 14
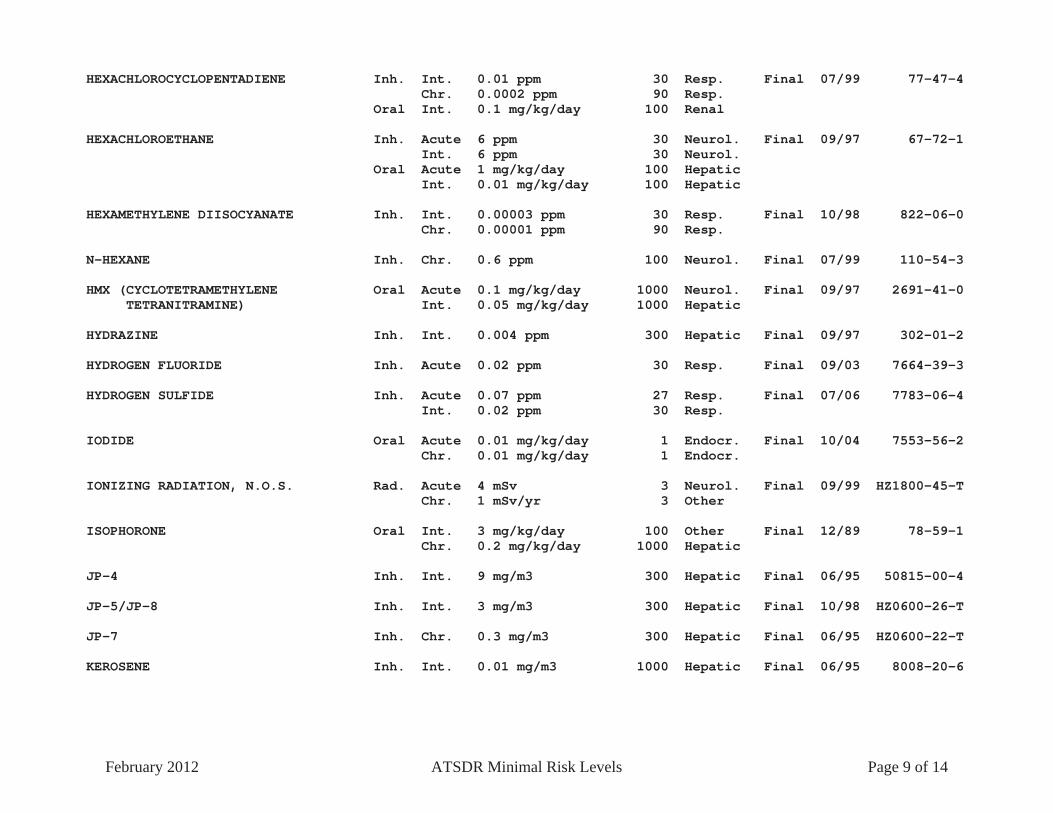
HEXACHLOROCYCLOPENTADIENE Inh. Int. 0.01 ppm 30 Resp. Final 07/99 77-47-4 Chr. 0.0002 ppm 90 Resp. Oral Int. 0.1 mg/kg/day 100 Renal
HEXACHLOROETHANE Inh. Acute 6 ppm 30 Neurol. Final 09/97 67-72-1 Int. 6 ppm 30 Neurol. Oral Acute 1 mg/kg/day 100 Hepatic Int. 0.01 mg/kg/day 100 Hepatic
HEXAMETHYLENE DIISOCYANATE Inh. Int. 0.00003 ppm 30 Resp. Final 10/98 822-06-0 Chr. 0.00001 ppm 90 Resp.
N-HEXANE Inh. Chr. 0.6 ppm 100 Neurol. Final 07/99 110-54-3
HMX (CYCLOTETRAMETHYLENE Oral Acute 0.1 mg/kg/day 1000 Neurol. Final 09/97 2691-41-0 TETRANITRAMINE) Int. 0.05 mg/kg/day 1000 Hepatic
HYDRAZINE Inh. Int. 0.004 ppm 300 Hepatic Final 09/97 302-01-2
HYDROGEN FLUORIDE Inh. Acute 0.02 ppm 30 Resp. Final 09/03 7664-39-3
HYDROGEN SULFIDE Inh. Acute 0.07 ppm 27 Resp. Final 07/06 7783-06-4 Int. 0.02 ppm 30 Resp.
IODIDE Oral Acute 0.01 mg/kg/day 1 Endocr. Final 10/04 7553-56-2 Chr. 0.01 mg/kg/day 1 Endocr.
IONIZING RADIATION, N.O.S. Rad. Acute 4 mSv 3 Neurol. Final 09/99 HZ1800-45-T Chr. 1 mSv/yr 3 Other
ISOPHORONE Oral Int. 3 mg/kg/day 100 Other Final 12/89 78-59-1 Chr. 0.2 mg/kg/day 1000 Hepatic
JP-4 Inh. Int. 9 mg/m3 300 Hepatic Final 06/95 50815-00-4
JP-5/JP-8 Inh. Int. 3 mg/m3 300 Hepatic Final 10/98 HZ0600-26-T
JP-7 Inh. Chr. 0.3 mg/m3 300 Hepatic Final 06/95 HZ0600-22-T
KEROSENE Inh. Int. 0.01 mg/m3 1000 Hepatic Final 06/95 8008-20-6
February 2012 ATSDR Minimal Risk Levels Page 9 of 14
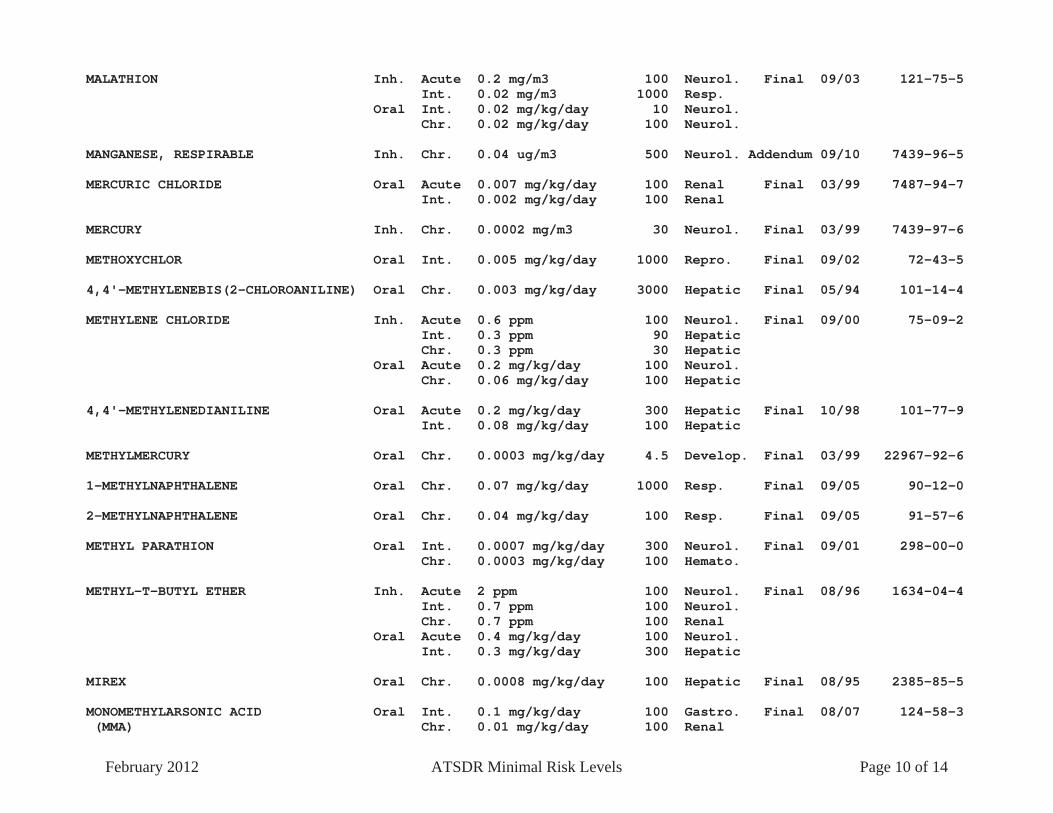
MALATHION Inh. Acute 0.2 mg/m3 100 Neurol. Final 09/03 121-75-5 Int. 0.02 mg/m3 1000 Resp. Oral Int. 0.02 mg/kg/day 10 Neurol. Chr. 0.02 mg/kg/day 100 Neurol.
MANGANESE, RESPIRABLE Inh. Chr. 0.04 ug/m3 500 Neurol. Addendum 09/10 7439-96-5
MERCURIC CHLORIDE Oral Acute 0.007 mg/kg/day 100 Renal Final 03/99 7487-94-7 Int. 0.002 mg/kg/day 100 Renal
MERCURY Inh. Chr. 0.0002 mg/m3 30 Neurol. Final 03/99 7439-97-6
METHOXYCHLOR Oral Int. 0.005 mg/kg/day 1000 Repro. Final 09/02 72-43-5
4,4'-METHYLENEBIS(2-CHLOROANILINE) Oral Chr. 0.003 mg/kg/day 3000 Hepatic Final 05/94 101-14-4
METHYLENE CHLORIDE Inh. Acute 0.6 ppm 100 Neurol. Final 09/00 75-09-2 Int. 0.3 ppm 90 Hepatic Chr. 0.3 ppm 30 Hepatic Oral Acute 0.2 mg/kg/day 100 Neurol. Chr. 0.06 mg/kg/day 100 Hepatic
4,4'-METHYLENEDIANILINE Oral Acute 0.2 mg/kg/day 300 Hepatic Final 10/98 101-77-9 Int. 0.08 mg/kg/day 100 Hepatic
METHYLMERCURY Oral Chr. 0.0003 mg/kg/day 4.5 Develop. Final 03/99 22967-92-6
1-METHYLNAPHTHALENE Oral Chr. 0.07 mg/kg/day 1000 Resp. Final 09/05 90-12-0
2-METHYLNAPHTHALENE Oral Chr. 0.04 mg/kg/day 100 Resp. Final 09/05 91-57-6
METHYL PARATHION Oral Int. 0.0007 mg/kg/day 300 Neurol. Final 09/01 298-00-0 Chr. 0.0003 mg/kg/day 100 Hemato.
METHYL-T-BUTYL ETHER Inh. Acute 2 ppm 100 Neurol. Final 08/96 1634-04-4 Int. 0.7 ppm 100 Neurol. Chr. 0.7 ppm 100 Renal Oral Acute 0.4 mg/kg/day 100 Neurol. Int. 0.3 mg/kg/day 300 Hepatic
MIREX Oral Chr. 0.0008 mg/kg/day 100 Hepatic Final 08/95 2385-85-5
MONOMETHYLARSONIC ACID Oral Int. 0.1 mg/kg/day 100 Gastro. Final 08/07 124-58-3 (MMA) Chr. 0.01 mg/kg/day 100 Renal
February 2012 ATSDR Minimal Risk Levels Page 10 of 14
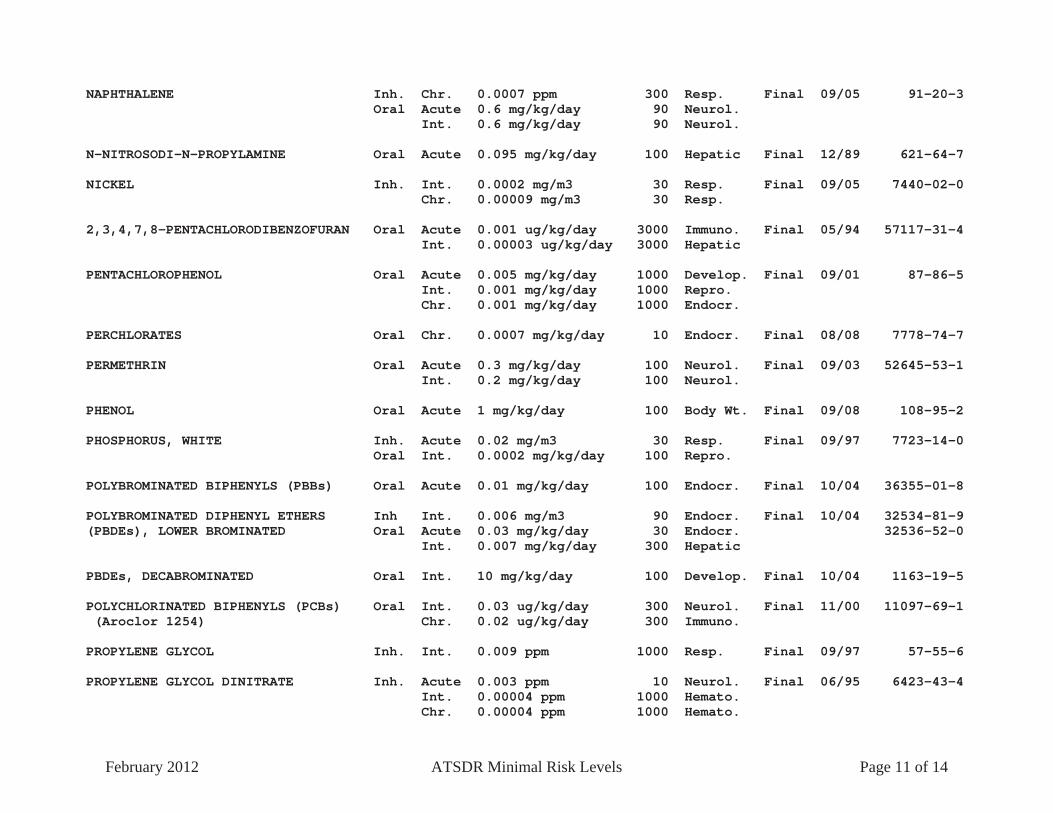
NAPHTHALENE Inh. Chr. 0.0007 ppm 300 Resp. Final 09/05 91-20-3 Oral Acute 0.6 mg/kg/day 90 Neurol. Int. 0.6 mg/kg/day 90 Neurol.
N-NITROSODI-N-PROPYLAMINE Oral Acute 0.095 mg/kg/day 100 Hepatic Final 12/89 621-64-7
NICKEL Inh. Int. 0.0002 mg/m3 30 Resp. Final 09/05 7440-02-0 Chr. 0.00009 mg/m3 30 Resp.
2,3,4,7,8-PENTACHLORODIBENZOFURAN Oral Acute 0.001 ug/kg/day 3000 Immuno. Final 05/94 57117-31-4 Int. 0.00003 ug/kg/day 3000 Hepatic
PENTACHLOROPHENOL Oral Acute 0.005 mg/kg/day 1000 Develop. Final 09/01 87-86-5 Int. 0.001 mg/kg/day 1000 Repro. Chr. 0.001 mg/kg/day 1000 Endocr.
PERCHLORATES Oral Chr. 0.0007 mg/kg/day 10 Endocr. Final 08/08 7778-74-7
PERMETHRIN Oral Acute 0.3 mg/kg/day 100 Neurol. Final 09/03 52645-53-1 Int. 0.2 mg/kg/day 100 Neurol.
PHENOL Oral Acute 1 mg/kg/day 100 Body Wt. Final 09/08 108-95-2
PHOSPHORUS, WHITE Inh. Acute 0.02 mg/m3 30 Resp. Final 09/97 7723-14-0 Oral Int. 0.0002 mg/kg/day 100 Repro.
POLYBROMINATED BIPHENYLS (PBBs) Oral Acute 0.01 mg/kg/day 100 Endocr. Final 10/04 36355-01-8
POLYBROMINATED DIPHENYL ETHERS Inh Int. 0.006 mg/m3 90 Endocr. Final 10/04 32534-81-9 (PBDEs), LOWER BROMINATED Oral Acute 0.03 mg/kg/day 30 Endocr. 32536-52-0 Int. 0.007 mg/kg/day 300 Hepatic
PBDEs, DECABROMINATED Oral Int. 10 mg/kg/day 100 Develop. Final 10/04 1163-19-5
POLYCHLORINATED BIPHENYLS (PCBs) Oral Int. 0.03 ug/kg/day 300 Neurol. Final 11/00 11097-69-1 (Aroclor 1254) Chr. 0.02 ug/kg/day 300 Immuno.
PROPYLENE GLYCOL Inh. Int. 0.009 ppm 1000 Resp. Final 09/97 57-55-6
PROPYLENE GLYCOL DINITRATE Inh. Acute 0.003 ppm 10 Neurol. Final 06/95 6423-43-4 Int. 0.00004 ppm 1000 Hemato. Chr. 0.00004 ppm 1000 Hemato.
February 2012 ATSDR Minimal Risk Levels Page 11 of 14

RDX (Cyclonite) Oral Acute 0.2 mg/kg/day 30 Neurol. Final 01/12 121-82-4 Int. 0.1 mg/kg/day 30 Neurol. Chr. 0.1 mg/kg/day 30 Neurol.
REFRACTORY CERAMIC FIBERS Inh. Chr. 0.03 fibers/cc 30 Resp. Final 10/04 HZ0900-26-T
SELENIUM Oral Chr. 0.005 mg/kg/day 3 Dermal Final 09/03 7782-49-2
STRONTIUM Oral Int. 2 mg/kg/day 30 Musculo. Final 10/04 7440-24-6
STYRENE Inh. Acute 5 ppm 10 Neurol. Final 11/10 100-42-5 Chr. 0.2 ppm 30 Neurol. Oral Acute 0.1 mg/kg/day 1000 Neurol.
SULFUR DIOXIDE Inh. Acute 0.01 ppm 9 Resp. Final 12/98 7446-09-5
SULFUR MUSTARD Inh. Acute 0.0007 mg/m3 30 Ocular Final 09/03 505-60-2 Int. 0.00002 mg/m3 30 Ocular Oral Acute 0.5 ug/kg/day 1000 Develop. Int. 0.07 ug/kg/day 300 Gastro.
2,3,7,8-TETRACHLORODIBENZO-P-DIOXIN Oral Acute 0.0002 ug/kg/day 21 Immuno. Final 12/98 1746-01-6 Int. 0.00002 ug/kg/day 30 Lymphor. Chr. 0.000001 ug/kg/day 90 Develop.
1,1,2,2-TETRACHLOROETHANE Oral Int. 0.5 mg/kg/day 100 Hepatic Final 09/08 79-34-5
TETRACHLOROETHYLENE Inh. Acute 0.2 ppm 10 Neurol. Final 09/97 127-18-4 Chr. 0.04 ppm 100 Neurol. Oral Acute 0.05 mg/kg/day 100 Develop.
TIN, INORGANIC Oral Int. 0.3 mg/kg/day 100 Hemato. Final 09/05 7440-31-5
TIN, DIBUTYL-, DICHLORIDE Oral Int. 0.005 mg/kg/day 1000 Immuno. Final 09/05 683-18-1
TIN, TRIBUTYL-, OXIDE Oral Int. 0.0003 mg/kg/day 100 Immuno. Final 09/05 56-35-9 Chr. 0.0003 mg/kg/day 100 Immuno.
TITANIUM TETRACHLORIDE Inh. Int. 0.01 mg/m3 90 Resp. Final 09/97 7550-45-0 Chr. 0.0001 mg/m3 90 Resp.
February 2012 ATSDR Minimal Risk Levels Page 12 of 14
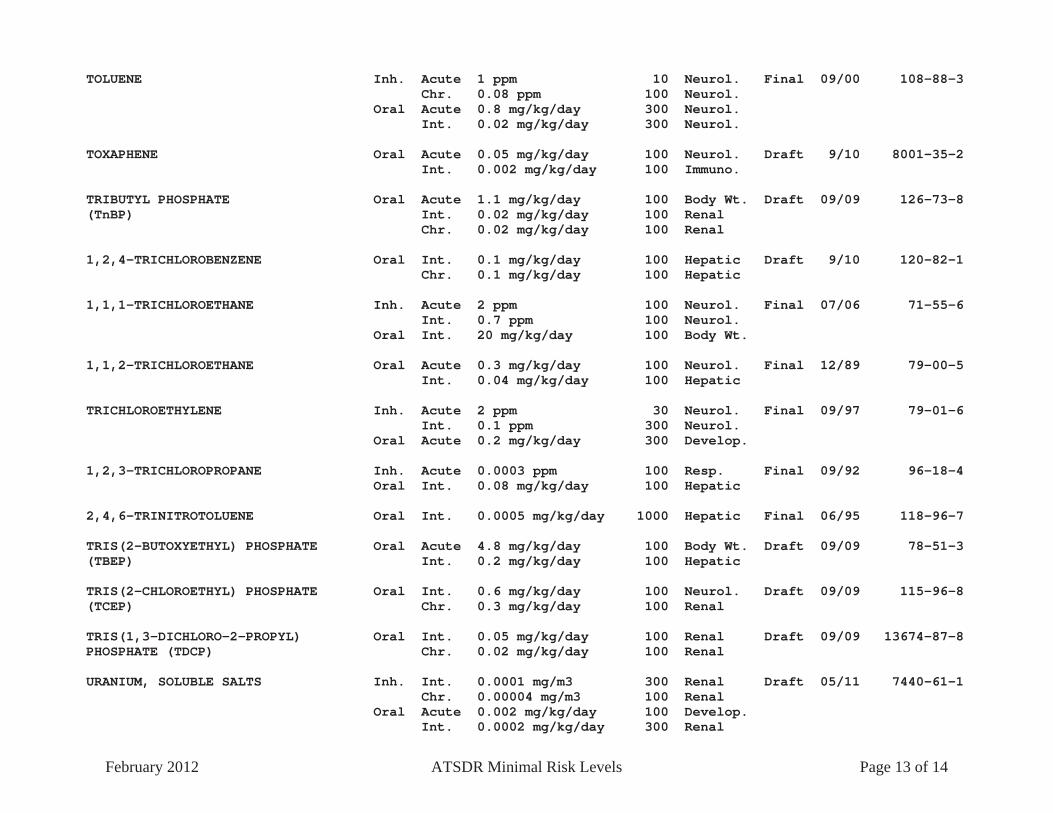
TOLUENE Inh. Acute 1 ppm 10 Neurol. Final 09/00 108-88-3 Chr. 0.08 ppm 100 Neurol. Oral Acute 0.8 mg/kg/day 300 Neurol. Int. 0.02 mg/kg/day 300 Neurol.
TOXAPHENE Oral Acute 0.05 mg/kg/day 100 Neurol. Draft 9/10 8001-35-2 Int. 0.002 mg/kg/day 100 Immuno.
TRIBUTYL PHOSPHATE Oral Acute 1.1 mg/kg/day 100 Body Wt. Draft 09/09 126-73-8 (TnBP) Int. 0.02 mg/kg/day 100 Renal Chr. 0.02 mg/kg/day 100 Renal
1,2,4-TRICHLOROBENZENE Oral Int. 0.1 mg/kg/day 100 Hepatic Draft 9/10 120-82-1 Chr. 0.1 mg/kg/day 100 Hepatic
1,1,1-TRICHLOROETHANE Inh. Acute 2 ppm 100 Neurol. Final 07/06 71-55-6 Int. 0.7 ppm 100 Neurol. Oral Int. 20 mg/kg/day 100 Body Wt.
1,1,2-TRICHLOROETHANE Oral Acute 0.3 mg/kg/day 100 Neurol. Final 12/89 79-00-5 Int. 0.04 mg/kg/day 100 Hepatic
TRICHLOROETHYLENE Inh. Acute 2 ppm 30 Neurol. Final 09/97 79-01-6 Int. 0.1 ppm 300 Neurol. Oral Acute 0.2 mg/kg/day 300 Develop.
1,2,3-TRICHLOROPROPANE Inh. Acute 0.0003 ppm 100 Resp. Final 09/92 96-18-4 Oral Int. 0.08 mg/kg/day 100 Hepatic
2,4,6-TRINITROTOLUENE Oral Int. 0.0005 mg/kg/day 1000 Hepatic Final 06/95 118-96-7
TRIS(2-BUTOXYETHYL) PHOSPHATE Oral Acute 4.8 mg/kg/day 100 Body Wt. Draft 09/09 78-51-3 (TBEP) Int. 0.2 mg/kg/day 100 Hepatic
TRIS(2-CHLOROETHYL) PHOSPHATE Oral Int. 0.6 mg/kg/day 100 Neurol. Draft 09/09 115-96-8 (TCEP) Chr. 0.3 mg/kg/day 100 Renal
TRIS(1,3-DICHLORO-2-PROPYL) Oral Int. 0.05 mg/kg/day 100 Renal Draft 09/09 13674-87-8 PHOSPHATE (TDCP) Chr. 0.02 mg/kg/day 100 Renal
URANIUM, SOLUBLE SALTS Inh. Int. 0.0001 mg/m3 300 Renal Draft 05/11 7440-61-1 Chr. 0.00004 mg/m3 100 Renal Oral Acute 0.002 mg/kg/day 100 Develop. Int. 0.0002 mg/kg/day 300 Renal
February 2012 ATSDR Minimal Risk Levels Page 13 of 14
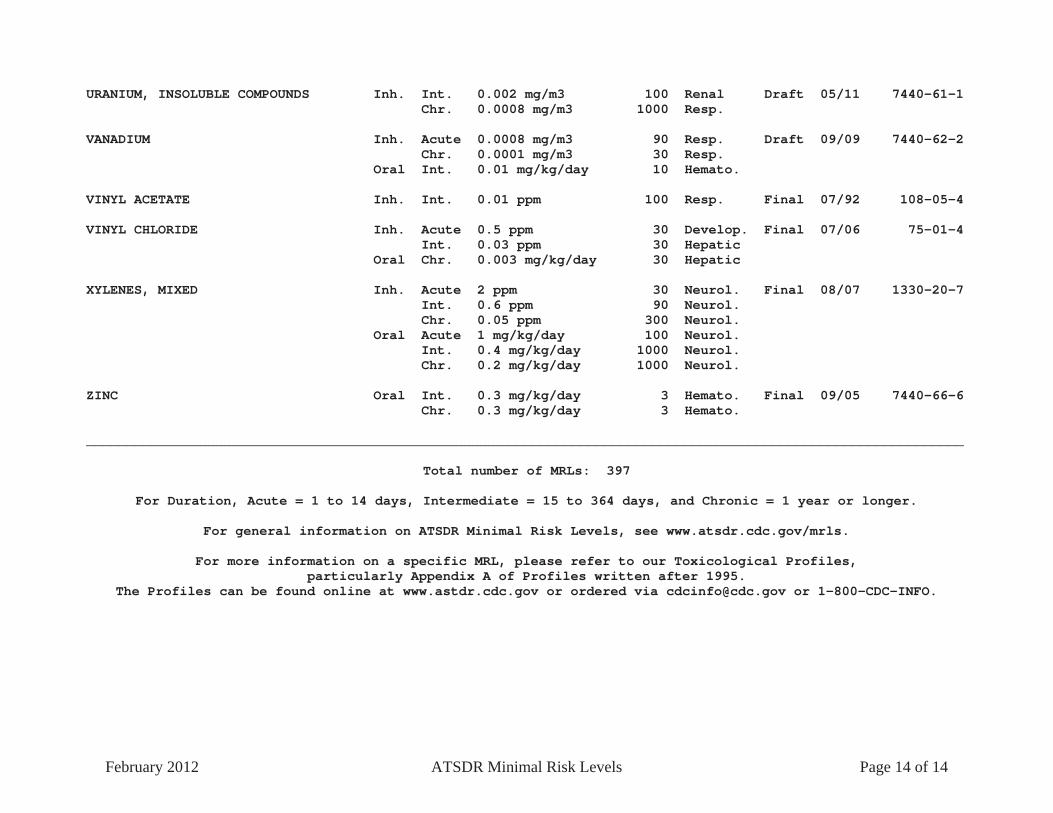
URANIUM, INSOLUBLE COMPOUNDS Inh. Int. 0.002 mg/m3 100 Renal Draft 05/11 7440-61-1 Chr. 0.0008 mg/m3 1000 Resp.
VANADIUM Inh. Acute 0.0008 mg/m3 90 Resp. Draft 09/09 7440-62-2 Chr. 0.0001 mg/m3 30 Resp. Oral Int. 0.01 mg/kg/day 10 Hemato.
VINYL ACETATE Inh. Int. 0.01 ppm 100 Resp. Final 07/92 108-05-4
VINYL CHLORIDE Inh. Acute 0.5 ppm 30 Develop. Final 07/06 75-01-4 Int. 0.03 ppm 30 Hepatic Oral Chr. 0.003 mg/kg/day 30 Hepatic
XYLENES, MIXED Inh. Acute 2 ppm 30 Neurol. Final 08/07 1330-20-7 Int. 0.6 ppm 90 Neurol. Chr. 0.05 ppm 300 Neurol. Oral Acute 1 mg/kg/day 100 Neurol. Int. 0.4 mg/kg/day 1000 Neurol. Chr. 0.2 mg/kg/day 1000 Neurol.
ZINC Oral Int. 0.3 mg/kg/day 3 Hemato. Final 09/05 7440-66-6 Chr. 0.3 mg/kg/day 3 Hemato.
______________________________________________________________________________________________________________
Total number of MRLs: 397
For Duration, Acute = 1 to 14 days, Intermediate = 15 to 364 days, and Chronic = 1 year or longer.
For general information on ATSDR Minimal Risk Levels, see www.atsdr.cdc.gov/mrls.
For more information on a specific MRL, please refer to our Toxicological Profiles, particularly Appendix A of Profiles written after 1995.
The Profiles can be found online at www.astdr.cdc.gov or ordered via [email protected] or 1-800-CDC-INFO.
February 2012 ATSDR Minimal Risk Levels Page 14 of 14

144
APPENDIX B
SUMMA CANISTER RESULTS
WITH HQ AND HI VALUES
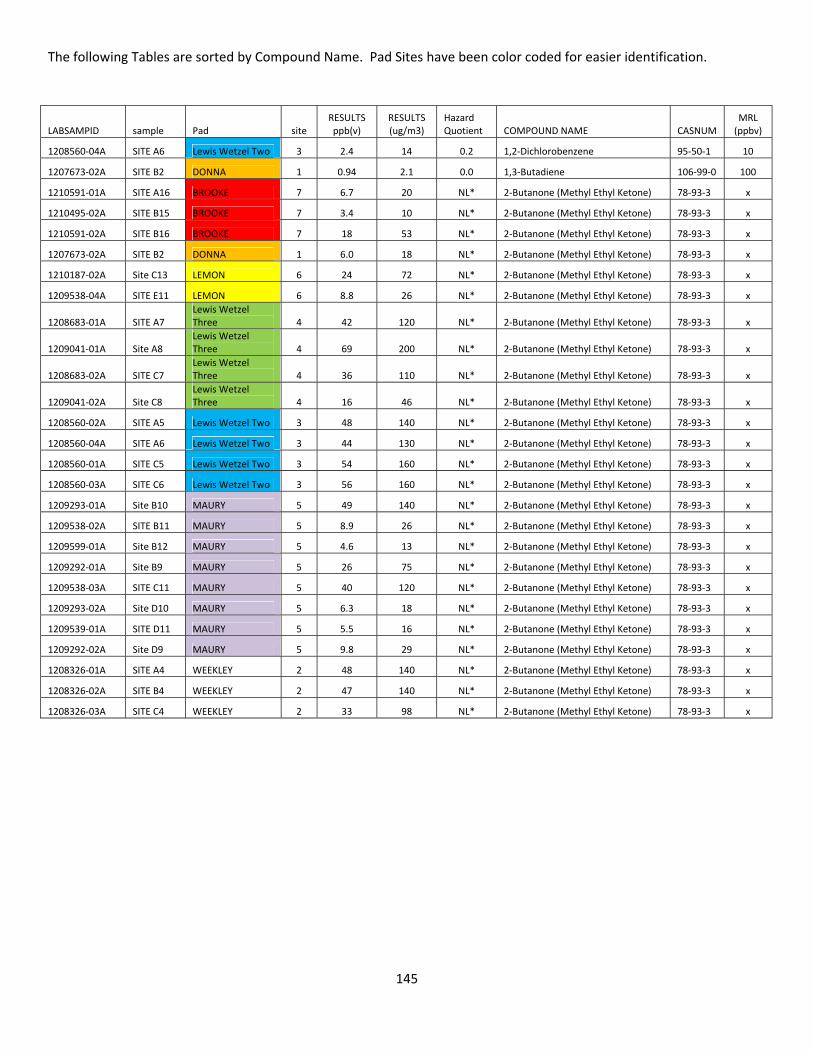
145
The following Tables are sorted by Compound Name. Pad Sites have been color coded for easier identification.
LABSAMPID sample Pad site RESULTS ppb(v)
RESULTS (ug/m3)
Hazard Quotient COMPOUND NAME CASNUM
MRL (ppbv)
1208560‐04A SITE A6 Lewis Wetzel Two 3 2.4 14 0.2 1,2‐Dichlorobenzene 95‐50‐1 10
1207673‐02A SITE B2 DONNA 1 0.94 2.1 0.0 1,3‐Butadiene 106‐99‐0 100
1210591‐01A SITE A16 BROOKE 7 6.7 20 NL* 2‐Butanone (Methyl Ethyl Ketone) 78‐93‐3 x
1210495‐02A SITE B15 BROOKE 7 3.4 10 NL* 2‐Butanone (Methyl Ethyl Ketone) 78‐93‐3 x
1210591‐02A SITE B16 BROOKE 7 18 53 NL* 2‐Butanone (Methyl Ethyl Ketone) 78‐93‐3 x
1207673‐02A SITE B2 DONNA 1 6.0 18 NL* 2‐Butanone (Methyl Ethyl Ketone) 78‐93‐3 x
1210187‐02A Site C13 LEMON 6 24 72 NL* 2‐Butanone (Methyl Ethyl Ketone) 78‐93‐3 x
1209538‐04A SITE E11 LEMON 6 8.8 26 NL* 2‐Butanone (Methyl Ethyl Ketone) 78‐93‐3 x
1208683‐01A SITE A7 Lewis Wetzel Three 4 42 120 NL* 2‐Butanone (Methyl Ethyl Ketone) 78‐93‐3 x
1209041‐01A Site A8 Lewis Wetzel Three 4 69 200 NL* 2‐Butanone (Methyl Ethyl Ketone) 78‐93‐3 x
1208683‐02A SITE C7 Lewis Wetzel Three 4 36 110 NL* 2‐Butanone (Methyl Ethyl Ketone) 78‐93‐3 x
1209041‐02A Site C8 Lewis Wetzel Three 4 16 46 NL* 2‐Butanone (Methyl Ethyl Ketone) 78‐93‐3 x
1208560‐02A SITE A5 Lewis Wetzel Two 3 48 140 NL* 2‐Butanone (Methyl Ethyl Ketone) 78‐93‐3 x
1208560‐04A SITE A6 Lewis Wetzel Two 3 44 130 NL* 2‐Butanone (Methyl Ethyl Ketone) 78‐93‐3 x
1208560‐01A SITE C5 Lewis Wetzel Two 3 54 160 NL* 2‐Butanone (Methyl Ethyl Ketone) 78‐93‐3 x
1208560‐03A SITE C6 Lewis Wetzel Two 3 56 160 NL* 2‐Butanone (Methyl Ethyl Ketone) 78‐93‐3 x
1209293‐01A Site B10 MAURY 5 49 140 NL* 2‐Butanone (Methyl Ethyl Ketone) 78‐93‐3 x
1209538‐02A SITE B11 MAURY 5 8.9 26 NL* 2‐Butanone (Methyl Ethyl Ketone) 78‐93‐3 x
1209599‐01A Site B12 MAURY 5 4.6 13 NL* 2‐Butanone (Methyl Ethyl Ketone) 78‐93‐3 x
1209292‐01A Site B9 MAURY 5 26 75 NL* 2‐Butanone (Methyl Ethyl Ketone) 78‐93‐3 x
1209538‐03A SITE C11 MAURY 5 40 120 NL* 2‐Butanone (Methyl Ethyl Ketone) 78‐93‐3 x
1209293‐02A Site D10 MAURY 5 6.3 18 NL* 2‐Butanone (Methyl Ethyl Ketone) 78‐93‐3 x
1209539‐01A SITE D11 MAURY 5 5.5 16 NL* 2‐Butanone (Methyl Ethyl Ketone) 78‐93‐3 x
1209292‐02A Site D9 MAURY 5 9.8 29 NL* 2‐Butanone (Methyl Ethyl Ketone) 78‐93‐3 x
1208326‐01A SITE A4 WEEKLEY 2 48 140 NL* 2‐Butanone (Methyl Ethyl Ketone) 78‐93‐3 x
1208326‐02A SITE B4 WEEKLEY 2 47 140 NL* 2‐Butanone (Methyl Ethyl Ketone) 78‐93‐3 x
1208326‐03A SITE C4 WEEKLEY 2 33 98 NL* 2‐Butanone (Methyl Ethyl Ketone) 78‐93‐3 x
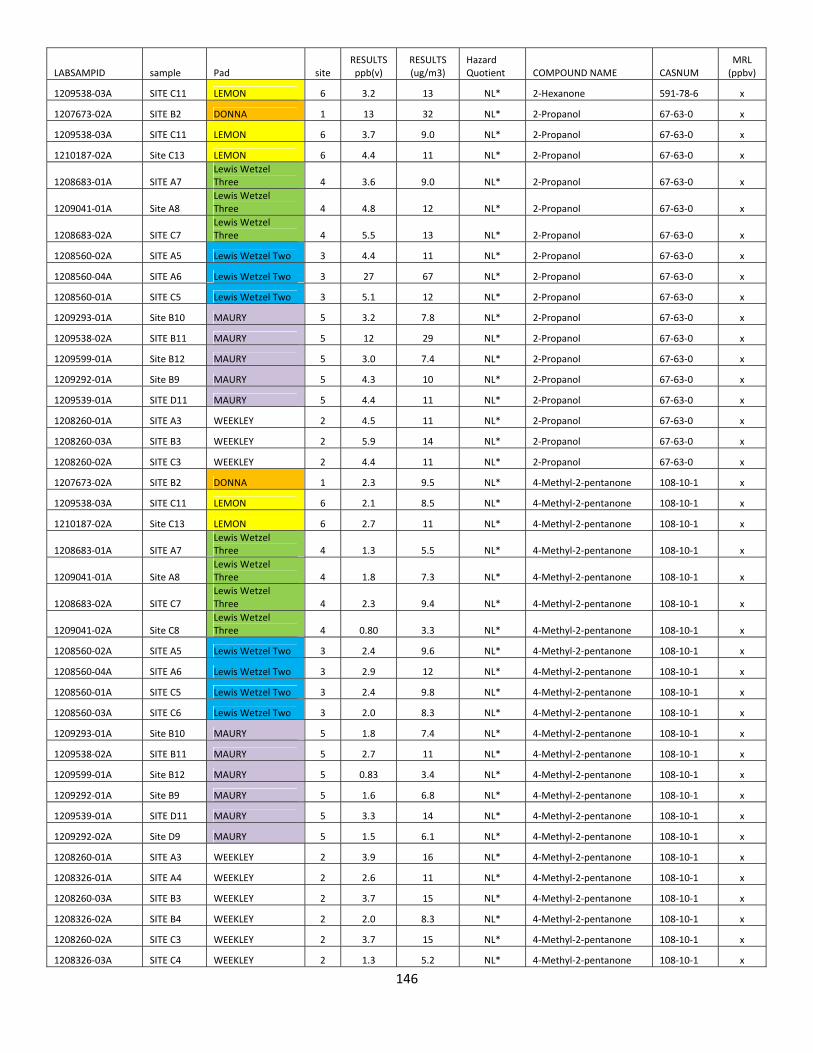
146
LABSAMPID sample Pad site RESULTS ppb(v)
RESULTS (ug/m3)
Hazard Quotient COMPOUND NAME CASNUM
MRL (ppbv)
1209538‐03A SITE C11 LEMON 6 3.2 13 NL* 2‐Hexanone 591‐78‐6 x
1207673‐02A SITE B2 DONNA 1 13 32 NL* 2‐Propanol 67‐63‐0 x
1209538‐03A SITE C11 LEMON 6 3.7 9.0 NL* 2‐Propanol 67‐63‐0 x
1210187‐02A Site C13 LEMON 6 4.4 11 NL* 2‐Propanol 67‐63‐0 x
1208683‐01A SITE A7 Lewis Wetzel Three 4 3.6 9.0 NL* 2‐Propanol 67‐63‐0 x
1209041‐01A Site A8 Lewis Wetzel Three 4 4.8 12 NL* 2‐Propanol 67‐63‐0 x
1208683‐02A SITE C7 Lewis Wetzel Three 4 5.5 13 NL* 2‐Propanol 67‐63‐0 x
1208560‐02A SITE A5 Lewis Wetzel Two 3 4.4 11 NL* 2‐Propanol 67‐63‐0 x
1208560‐04A SITE A6 Lewis Wetzel Two 3 27 67 NL* 2‐Propanol 67‐63‐0 x
1208560‐01A SITE C5 Lewis Wetzel Two 3 5.1 12 NL* 2‐Propanol 67‐63‐0 x
1209293‐01A Site B10 MAURY 5 3.2 7.8 NL* 2‐Propanol 67‐63‐0 x
1209538‐02A SITE B11 MAURY 5 12 29 NL* 2‐Propanol 67‐63‐0 x
1209599‐01A Site B12 MAURY 5 3.0 7.4 NL* 2‐Propanol 67‐63‐0 x
1209292‐01A Site B9 MAURY 5 4.3 10 NL* 2‐Propanol 67‐63‐0 x
1209539‐01A SITE D11 MAURY 5 4.4 11 NL* 2‐Propanol 67‐63‐0 x
1208260‐01A SITE A3 WEEKLEY 2 4.5 11 NL* 2‐Propanol 67‐63‐0 x
1208260‐03A SITE B3 WEEKLEY 2 5.9 14 NL* 2‐Propanol 67‐63‐0 x
1208260‐02A SITE C3 WEEKLEY 2 4.4 11 NL* 2‐Propanol 67‐63‐0 x
1207673‐02A SITE B2 DONNA 1 2.3 9.5 NL* 4‐Methyl‐2‐pentanone 108‐10‐1 x
1209538‐03A SITE C11 LEMON 6 2.1 8.5 NL* 4‐Methyl‐2‐pentanone 108‐10‐1 x
1210187‐02A Site C13 LEMON 6 2.7 11 NL* 4‐Methyl‐2‐pentanone 108‐10‐1 x
1208683‐01A SITE A7 Lewis Wetzel Three 4 1.3 5.5 NL* 4‐Methyl‐2‐pentanone 108‐10‐1 x
1209041‐01A Site A8 Lewis Wetzel Three 4 1.8 7.3 NL* 4‐Methyl‐2‐pentanone 108‐10‐1 x
1208683‐02A SITE C7 Lewis Wetzel Three 4 2.3 9.4 NL* 4‐Methyl‐2‐pentanone 108‐10‐1 x
1209041‐02A Site C8 Lewis Wetzel Three 4 0.80 3.3 NL* 4‐Methyl‐2‐pentanone 108‐10‐1 x
1208560‐02A SITE A5 Lewis Wetzel Two 3 2.4 9.6 NL* 4‐Methyl‐2‐pentanone 108‐10‐1 x
1208560‐04A SITE A6 Lewis Wetzel Two 3 2.9 12 NL* 4‐Methyl‐2‐pentanone 108‐10‐1 x
1208560‐01A SITE C5 Lewis Wetzel Two 3 2.4 9.8 NL* 4‐Methyl‐2‐pentanone 108‐10‐1 x
1208560‐03A SITE C6 Lewis Wetzel Two 3 2.0 8.3 NL* 4‐Methyl‐2‐pentanone 108‐10‐1 x
1209293‐01A Site B10 MAURY 5 1.8 7.4 NL* 4‐Methyl‐2‐pentanone 108‐10‐1 x
1209538‐02A SITE B11 MAURY 5 2.7 11 NL* 4‐Methyl‐2‐pentanone 108‐10‐1 x
1209599‐01A Site B12 MAURY 5 0.83 3.4 NL* 4‐Methyl‐2‐pentanone 108‐10‐1 x
1209292‐01A Site B9 MAURY 5 1.6 6.8 NL* 4‐Methyl‐2‐pentanone 108‐10‐1 x
1209539‐01A SITE D11 MAURY 5 3.3 14 NL* 4‐Methyl‐2‐pentanone 108‐10‐1 x
1209292‐02A Site D9 MAURY 5 1.5 6.1 NL* 4‐Methyl‐2‐pentanone 108‐10‐1 x
1208260‐01A SITE A3 WEEKLEY 2 3.9 16 NL* 4‐Methyl‐2‐pentanone 108‐10‐1 x
1208326‐01A SITE A4 WEEKLEY 2 2.6 11 NL* 4‐Methyl‐2‐pentanone 108‐10‐1 x
1208260‐03A SITE B3 WEEKLEY 2 3.7 15 NL* 4‐Methyl‐2‐pentanone 108‐10‐1 x
1208326‐02A SITE B4 WEEKLEY 2 2.0 8.3 NL* 4‐Methyl‐2‐pentanone 108‐10‐1 x
1208260‐02A SITE C3 WEEKLEY 2 3.7 15 NL* 4‐Methyl‐2‐pentanone 108‐10‐1 x
1208326‐03A SITE C4 WEEKLEY 2 1.3 5.2 NL* 4‐Methyl‐2‐pentanone 108‐10‐1 x
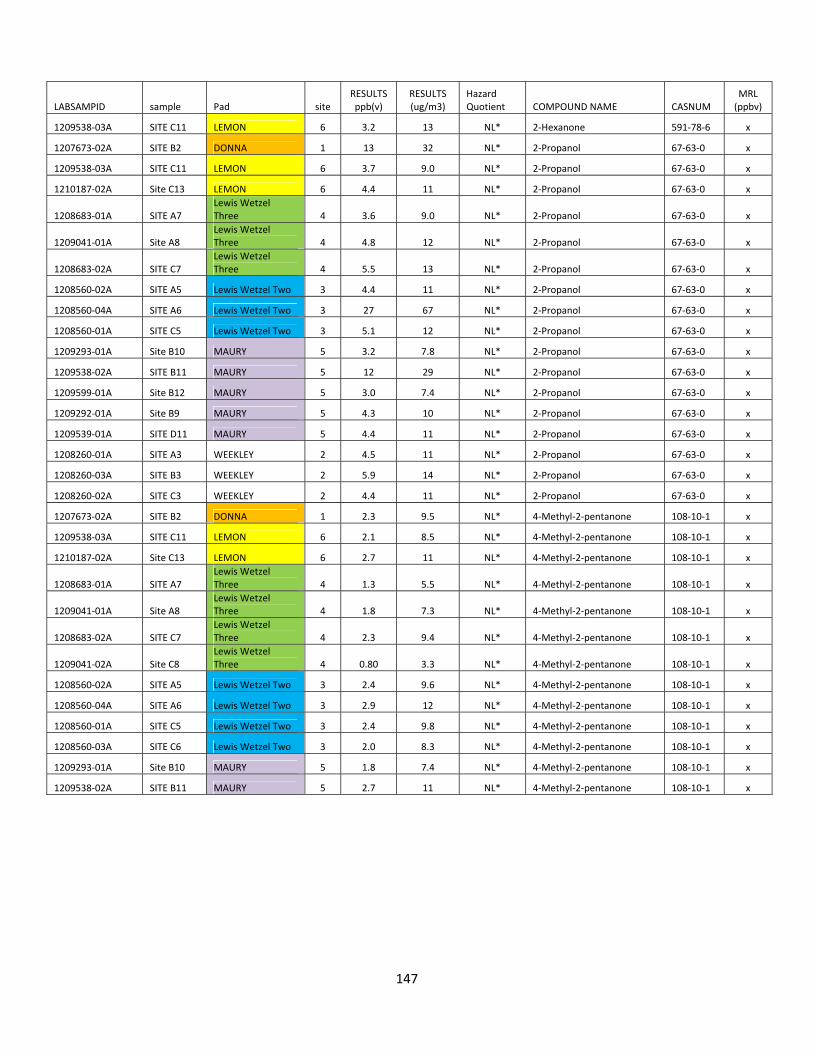
147
LABSAMPID sample Pad site RESULTS ppb(v)
RESULTS (ug/m3)
Hazard Quotient COMPOUND NAME CASNUM
MRL (ppbv)
1209538‐03A SITE C11 LEMON 6 3.2 13 NL* 2‐Hexanone 591‐78‐6 x
1207673‐02A SITE B2 DONNA 1 13 32 NL* 2‐Propanol 67‐63‐0 x
1209538‐03A SITE C11 LEMON 6 3.7 9.0 NL* 2‐Propanol 67‐63‐0 x
1210187‐02A Site C13 LEMON 6 4.4 11 NL* 2‐Propanol 67‐63‐0 x
1208683‐01A SITE A7 Lewis Wetzel Three 4 3.6 9.0 NL* 2‐Propanol 67‐63‐0 x
1209041‐01A Site A8 Lewis Wetzel Three 4 4.8 12 NL* 2‐Propanol 67‐63‐0 x
1208683‐02A SITE C7 Lewis Wetzel Three 4 5.5 13 NL* 2‐Propanol 67‐63‐0 x
1208560‐02A SITE A5 Lewis Wetzel Two 3 4.4 11 NL* 2‐Propanol 67‐63‐0 x
1208560‐04A SITE A6 Lewis Wetzel Two 3 27 67 NL* 2‐Propanol 67‐63‐0 x
1208560‐01A SITE C5 Lewis Wetzel Two 3 5.1 12 NL* 2‐Propanol 67‐63‐0 x
1209293‐01A Site B10 MAURY 5 3.2 7.8 NL* 2‐Propanol 67‐63‐0 x
1209538‐02A SITE B11 MAURY 5 12 29 NL* 2‐Propanol 67‐63‐0 x
1209599‐01A Site B12 MAURY 5 3.0 7.4 NL* 2‐Propanol 67‐63‐0 x
1209292‐01A Site B9 MAURY 5 4.3 10 NL* 2‐Propanol 67‐63‐0 x
1209539‐01A SITE D11 MAURY 5 4.4 11 NL* 2‐Propanol 67‐63‐0 x
1208260‐01A SITE A3 WEEKLEY 2 4.5 11 NL* 2‐Propanol 67‐63‐0 x
1208260‐03A SITE B3 WEEKLEY 2 5.9 14 NL* 2‐Propanol 67‐63‐0 x
1208260‐02A SITE C3 WEEKLEY 2 4.4 11 NL* 2‐Propanol 67‐63‐0 x
1207673‐02A SITE B2 DONNA 1 2.3 9.5 NL* 4‐Methyl‐2‐pentanone 108‐10‐1 x
1209538‐03A SITE C11 LEMON 6 2.1 8.5 NL* 4‐Methyl‐2‐pentanone 108‐10‐1 x
1210187‐02A Site C13 LEMON 6 2.7 11 NL* 4‐Methyl‐2‐pentanone 108‐10‐1 x
1208683‐01A SITE A7 Lewis Wetzel Three 4 1.3 5.5 NL* 4‐Methyl‐2‐pentanone 108‐10‐1 x
1209041‐01A Site A8 Lewis Wetzel Three 4 1.8 7.3 NL* 4‐Methyl‐2‐pentanone 108‐10‐1 x
1208683‐02A SITE C7 Lewis Wetzel Three 4 2.3 9.4 NL* 4‐Methyl‐2‐pentanone 108‐10‐1 x
1209041‐02A Site C8 Lewis Wetzel Three 4 0.80 3.3 NL* 4‐Methyl‐2‐pentanone 108‐10‐1 x
1208560‐02A SITE A5 Lewis Wetzel Two 3 2.4 9.6 NL* 4‐Methyl‐2‐pentanone 108‐10‐1 x
1208560‐04A SITE A6 Lewis Wetzel Two 3 2.9 12 NL* 4‐Methyl‐2‐pentanone 108‐10‐1 x
1208560‐01A SITE C5 Lewis Wetzel Two 3 2.4 9.8 NL* 4‐Methyl‐2‐pentanone 108‐10‐1 x
1208560‐03A SITE C6 Lewis Wetzel Two 3 2.0 8.3 NL* 4‐Methyl‐2‐pentanone 108‐10‐1 x
1209293‐01A Site B10 MAURY 5 1.8 7.4 NL* 4‐Methyl‐2‐pentanone 108‐10‐1 x
1209538‐02A SITE B11 MAURY 5 2.7 11 NL* 4‐Methyl‐2‐pentanone 108‐10‐1 x
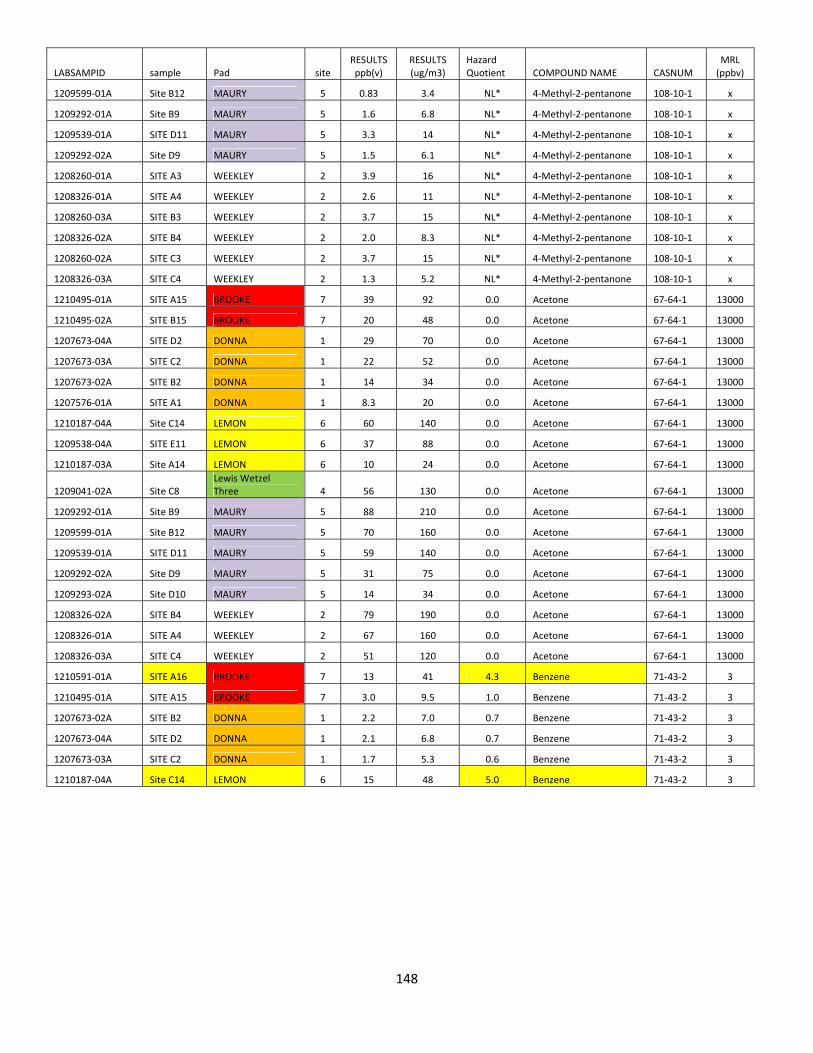
148
LABSAMPID sample Pad site RESULTS ppb(v)
RESULTS (ug/m3)
Hazard Quotient COMPOUND NAME CASNUM
MRL (ppbv)
1209599‐01A Site B12 MAURY 5 0.83 3.4 NL* 4‐Methyl‐2‐pentanone 108‐10‐1 x
1209292‐01A Site B9 MAURY 5 1.6 6.8 NL* 4‐Methyl‐2‐pentanone 108‐10‐1 x
1209539‐01A SITE D11 MAURY 5 3.3 14 NL* 4‐Methyl‐2‐pentanone 108‐10‐1 x
1209292‐02A Site D9 MAURY 5 1.5 6.1 NL* 4‐Methyl‐2‐pentanone 108‐10‐1 x
1208260‐01A SITE A3 WEEKLEY 2 3.9 16 NL* 4‐Methyl‐2‐pentanone 108‐10‐1 x
1208326‐01A SITE A4 WEEKLEY 2 2.6 11 NL* 4‐Methyl‐2‐pentanone 108‐10‐1 x
1208260‐03A SITE B3 WEEKLEY 2 3.7 15 NL* 4‐Methyl‐2‐pentanone 108‐10‐1 x
1208326‐02A SITE B4 WEEKLEY 2 2.0 8.3 NL* 4‐Methyl‐2‐pentanone 108‐10‐1 x
1208260‐02A SITE C3 WEEKLEY 2 3.7 15 NL* 4‐Methyl‐2‐pentanone 108‐10‐1 x
1208326‐03A SITE C4 WEEKLEY 2 1.3 5.2 NL* 4‐Methyl‐2‐pentanone 108‐10‐1 x
1210495‐01A SITE A15 BROOKE 7 39 92 0.0 Acetone 67‐64‐1 13000
1210495‐02A SITE B15 BROOKE 7 20 48 0.0 Acetone 67‐64‐1 13000
1207673‐04A SITE D2 DONNA 1 29 70 0.0 Acetone 67‐64‐1 13000
1207673‐03A SITE C2 DONNA 1 22 52 0.0 Acetone 67‐64‐1 13000
1207673‐02A SITE B2 DONNA 1 14 34 0.0 Acetone 67‐64‐1 13000
1207576‐01A SITE A1 DONNA 1 8.3 20 0.0 Acetone 67‐64‐1 13000
1210187‐04A Site C14 LEMON 6 60 140 0.0 Acetone 67‐64‐1 13000
1209538‐04A SITE E11 LEMON 6 37 88 0.0 Acetone 67‐64‐1 13000
1210187‐03A Site A14 LEMON 6 10 24 0.0 Acetone 67‐64‐1 13000
1209041‐02A Site C8 Lewis Wetzel Three 4 56 130 0.0 Acetone 67‐64‐1 13000
1209292‐01A Site B9 MAURY 5 88 210 0.0 Acetone 67‐64‐1 13000
1209599‐01A Site B12 MAURY 5 70 160 0.0 Acetone 67‐64‐1 13000
1209539‐01A SITE D11 MAURY 5 59 140 0.0 Acetone 67‐64‐1 13000
1209292‐02A Site D9 MAURY 5 31 75 0.0 Acetone 67‐64‐1 13000
1209293‐02A Site D10 MAURY 5 14 34 0.0 Acetone 67‐64‐1 13000
1208326‐02A SITE B4 WEEKLEY 2 79 190 0.0 Acetone 67‐64‐1 13000
1208326‐01A SITE A4 WEEKLEY 2 67 160 0.0 Acetone 67‐64‐1 13000
1208326‐03A SITE C4 WEEKLEY 2 51 120 0.0 Acetone 67‐64‐1 13000
1210591‐01A SITE A16 BROOKE 7 13 41 4.3 Benzene 71‐43‐2 3
1210495‐01A SITE A15 BROOKE 7 3.0 9.5 1.0 Benzene 71‐43‐2 3
1207673‐02A SITE B2 DONNA 1 2.2 7.0 0.7 Benzene 71‐43‐2 3
1207673‐04A SITE D2 DONNA 1 2.1 6.8 0.7 Benzene 71‐43‐2 3
1207673‐03A SITE C2 DONNA 1 1.7 5.3 0.6 Benzene 71‐43‐2 3
1210187‐04A Site C14 LEMON 6 15 48 5.0 Benzene 71‐43‐2 3

149
LABSAMPID sample Pad site RESULTS ppb(v)
RESULTS (ug/m3)
Hazard Quotient COMPOUND NAME CASNUM
MRL (ppbv)
1209041‐01A Site A8 Lewis Wetzel Three 4 1.1 3.6 0.4 Benzene 71‐43‐2 3
1208683‐02A SITE C7 Lewis Wetzel Three 4 1.0 3.3 0.3 Benzene 71‐43‐2 3
1208683‐01A SITE A7 Lewis Wetzel Three 4 0.78 2.5 0.3 Benzene 71‐43‐2 3
1208560‐01A SITE C5 Lewis Wetzel Two 3 3.0 9.7 1.0 Benzene 71‐43‐2 3
1208560‐02A SITE A5 Lewis Wetzel Two 3 2.4 7.8 0.8 Benzene 71‐43‐2 3
1208560‐03A SITE C6 Lewis Wetzel Two 3 2.4 7.7 0.8 Benzene 71‐43‐2 3
1208560‐04A SITE A6 Lewis Wetzel Two 3 2.1 6.7 0.7 Benzene 71‐43‐2 3
1209538‐02A SITE B11 MAURY 5 85 270 28.3 Benzene 71‐43‐2 3
1209599‐01A Site B12 MAURY 5 49 160 16.3 Benzene 71‐43‐2 3
1209539‐01A SITE D11 MAURY 5 12 39 4.0 Benzene 71‐43‐2 3
1208260‐03A SITE B3 WEEKLEY 2 8.2 26 2.7 Benzene 71‐43‐2 3
1208260‐02A SITE C3 WEEKLEY 2 4.5 14 1.5 Benzene 71‐43‐2 3
1208260‐01A SITE A3 WEEKLEY 2 4.2 13 1.4 Benzene 71‐43‐2 3
1208326‐02A SITE B4 WEEKLEY 2 3.9 12 1.3 Benzene 71‐43‐2 3
1208326‐01A SITE A4 WEEKLEY 2 2.9 9.2 1.0 Benzene 71‐43‐2 3
1208326‐03A SITE C4 WEEKLEY 2 1.7 5.6 0.6 Benzene 71‐43‐2 3
1207576‐01A SITE A1 DONNA 1 5.1 16 0.0 Carbon Disulfide 75‐15‐0 300
1208683‐01A SITE A7 Lewis Wetzel Three 4 0.93 4.6 NL* Cumene 98‐82‐8 x
1209041‐01A Site A8 Lewis Wetzel Three 4 1.1 5.4 NL* Cumene 98‐82‐8 x
1208683‐02A SITE C7 Lewis Wetzel Three 4 1.2 5.8 NL* Cumene 98‐82‐8 x
1208560‐02A SITE A5 Lewis Wetzel Two 3 1.8 8.8 NL* Cumene 98‐82‐8 x
1208560‐04A SITE A6 Lewis Wetzel Two 3 2.9 14 NL* Cumene 98‐82‐8 x
1208560‐01A SITE C5 Lewis Wetzel Two 3 1.4 6.7 NL* Cumene 98‐82‐8 x
1208560‐03A SITE C6 Lewis Wetzel Two 3 1.4 7.0 NL* Cumene 98‐82‐8 x
1209292‐02A Site D9 MAURY 5 0.98 4.8 NL* Cumene 98‐82‐8 x
1208260‐01A SITE A3 WEEKLEY 2 3.4 17 NL* Cumene 98‐82‐8 x
1208326‐01A SITE A4 WEEKLEY 2 2.4 12 NL* Cumene 98‐82‐8 x
1208260‐03A SITE B3 WEEKLEY 2 2.8 14 NL* Cumene 98‐82‐8 x
1208326‐02A SITE B4 WEEKLEY 2 1.8 8.8 NL* Cumene 98‐82‐8 x
1208260‐02A SITE C3 WEEKLEY 2 3.3 16 NL* Cumene 98‐82‐8 x
1208326‐03A SITE C4 WEEKLEY 2 1.3 6.4 NL* Cumene 98‐82‐8 x
1207673‐02A SITE B2 DONNA 1 1.2 4.2 NL* Cyclohexane 110‐82‐7 x
1210495‐01A SITE A15 BROOKE 7 6.0 11 NL* Ethanol 64‐17‐5 x
1210591‐01A SITE A16 BROOKE 7 6.9 13 NL* Ethanol 64‐17‐5 x
1210495‐02A SITE B15 BROOKE 7 4.4 8.4 NL* Ethanol 64‐17‐5 x
1210591‐02A SITE B16 BROOKE 7 9.9 19 NL* Ethanol 64‐17‐5 x
1207673‐02A SITE B2 DONNA 1 38 71 NL* Ethanol 64‐17‐5 x
1209538‐03A SITE C11 LEMON 6 13 24 NL* Ethanol 64‐17‐5 x
1210187‐02A Site C13 LEMON 6 26 48 NL* Ethanol 64‐17‐5 x
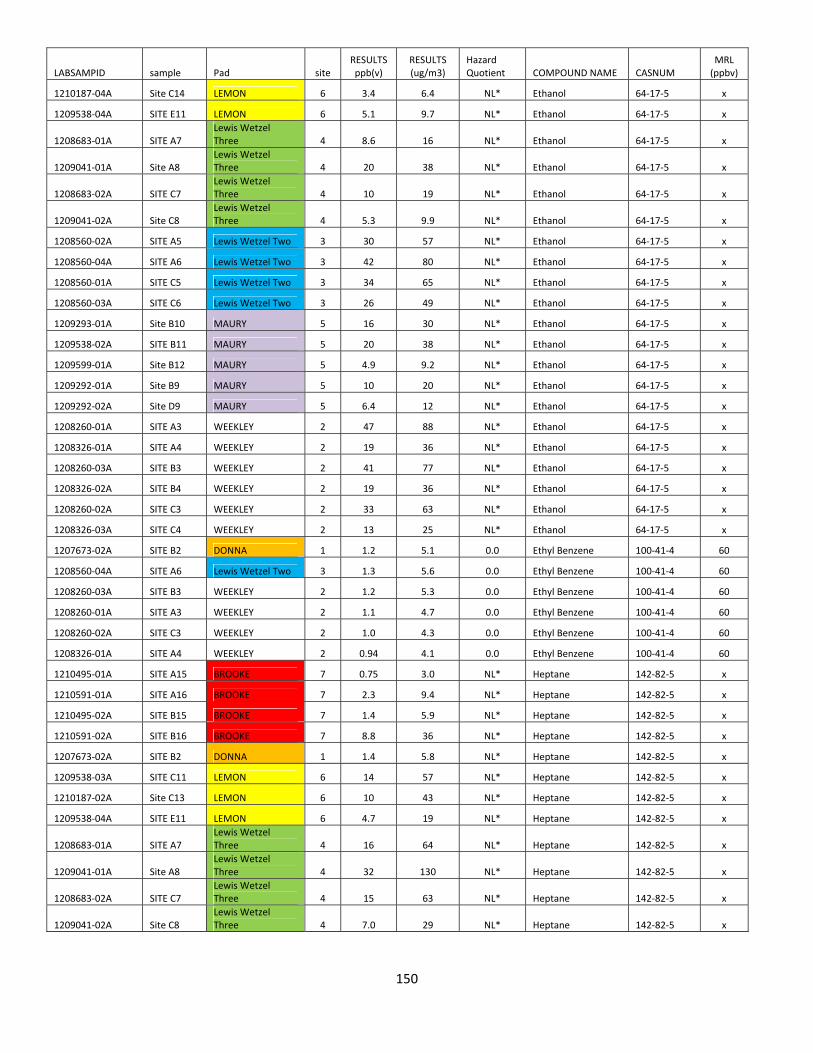
150
LABSAMPID sample Pad site RESULTS ppb(v)
RESULTS (ug/m3)
Hazard Quotient COMPOUND NAME CASNUM
MRL (ppbv)
1210187‐04A Site C14 LEMON 6 3.4 6.4 NL* Ethanol 64‐17‐5 x
1209538‐04A SITE E11 LEMON 6 5.1 9.7 NL* Ethanol 64‐17‐5 x
1208683‐01A SITE A7 Lewis Wetzel Three 4 8.6 16 NL* Ethanol 64‐17‐5 x
1209041‐01A Site A8 Lewis Wetzel Three 4 20 38 NL* Ethanol 64‐17‐5 x
1208683‐02A SITE C7 Lewis Wetzel Three 4 10 19 NL* Ethanol 64‐17‐5 x
1209041‐02A Site C8 Lewis Wetzel Three 4 5.3 9.9 NL* Ethanol 64‐17‐5 x
1208560‐02A SITE A5 Lewis Wetzel Two 3 30 57 NL* Ethanol 64‐17‐5 x
1208560‐04A SITE A6 Lewis Wetzel Two 3 42 80 NL* Ethanol 64‐17‐5 x
1208560‐01A SITE C5 Lewis Wetzel Two 3 34 65 NL* Ethanol 64‐17‐5 x
1208560‐03A SITE C6 Lewis Wetzel Two 3 26 49 NL* Ethanol 64‐17‐5 x
1209293‐01A Site B10 MAURY 5 16 30 NL* Ethanol 64‐17‐5 x
1209538‐02A SITE B11 MAURY 5 20 38 NL* Ethanol 64‐17‐5 x
1209599‐01A Site B12 MAURY 5 4.9 9.2 NL* Ethanol 64‐17‐5 x
1209292‐01A Site B9 MAURY 5 10 20 NL* Ethanol 64‐17‐5 x
1209292‐02A Site D9 MAURY 5 6.4 12 NL* Ethanol 64‐17‐5 x
1208260‐01A SITE A3 WEEKLEY 2 47 88 NL* Ethanol 64‐17‐5 x
1208326‐01A SITE A4 WEEKLEY 2 19 36 NL* Ethanol 64‐17‐5 x
1208260‐03A SITE B3 WEEKLEY 2 41 77 NL* Ethanol 64‐17‐5 x
1208326‐02A SITE B4 WEEKLEY 2 19 36 NL* Ethanol 64‐17‐5 x
1208260‐02A SITE C3 WEEKLEY 2 33 63 NL* Ethanol 64‐17‐5 x
1208326‐03A SITE C4 WEEKLEY 2 13 25 NL* Ethanol 64‐17‐5 x
1207673‐02A SITE B2 DONNA 1 1.2 5.1 0.0 Ethyl Benzene 100‐41‐4 60
1208560‐04A SITE A6 Lewis Wetzel Two 3 1.3 5.6 0.0 Ethyl Benzene 100‐41‐4 60
1208260‐03A SITE B3 WEEKLEY 2 1.2 5.3 0.0 Ethyl Benzene 100‐41‐4 60
1208260‐01A SITE A3 WEEKLEY 2 1.1 4.7 0.0 Ethyl Benzene 100‐41‐4 60
1208260‐02A SITE C3 WEEKLEY 2 1.0 4.3 0.0 Ethyl Benzene 100‐41‐4 60
1208326‐01A SITE A4 WEEKLEY 2 0.94 4.1 0.0 Ethyl Benzene 100‐41‐4 60
1210495‐01A SITE A15 BROOKE 7 0.75 3.0 NL* Heptane 142‐82‐5 x
1210591‐01A SITE A16 BROOKE 7 2.3 9.4 NL* Heptane 142‐82‐5 x
1210495‐02A SITE B15 BROOKE 7 1.4 5.9 NL* Heptane 142‐82‐5 x
1210591‐02A SITE B16 BROOKE 7 8.8 36 NL* Heptane 142‐82‐5 x
1207673‐02A SITE B2 DONNA 1 1.4 5.8 NL* Heptane 142‐82‐5 x
1209538‐03A SITE C11 LEMON 6 14 57 NL* Heptane 142‐82‐5 x
1210187‐02A Site C13 LEMON 6 10 43 NL* Heptane 142‐82‐5 x
1209538‐04A SITE E11 LEMON 6 4.7 19 NL* Heptane 142‐82‐5 x
1208683‐01A SITE A7 Lewis Wetzel Three 4 16 64 NL* Heptane 142‐82‐5 x
1209041‐01A Site A8 Lewis Wetzel Three 4 32 130 NL* Heptane 142‐82‐5 x
1208683‐02A SITE C7 Lewis Wetzel Three 4 15 63 NL* Heptane 142‐82‐5 x
1209041‐02A Site C8 Lewis Wetzel Three 4 7.0 29 NL* Heptane 142‐82‐5 x
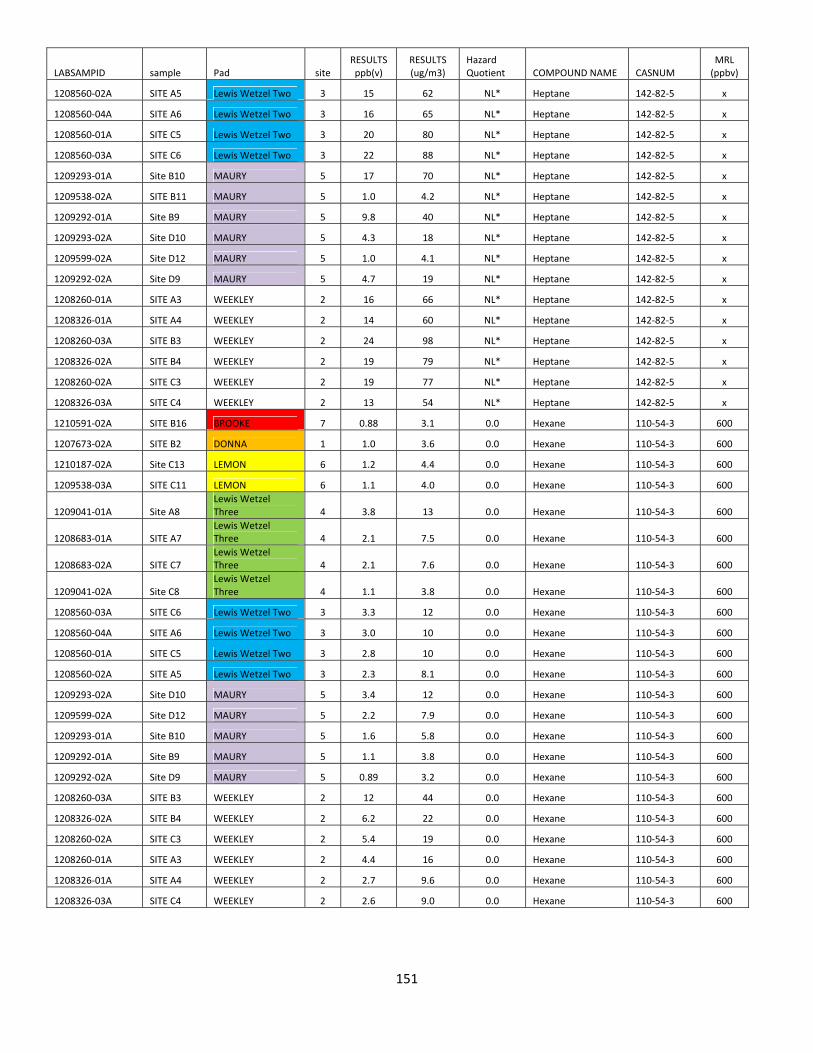
151
LABSAMPID sample Pad site RESULTS ppb(v)
RESULTS (ug/m3)
Hazard Quotient COMPOUND NAME CASNUM
MRL (ppbv)
1208560‐02A SITE A5 Lewis Wetzel Two 3 15 62 NL* Heptane 142‐82‐5 x
1208560‐04A SITE A6 Lewis Wetzel Two 3 16 65 NL* Heptane 142‐82‐5 x
1208560‐01A SITE C5 Lewis Wetzel Two 3 20 80 NL* Heptane 142‐82‐5 x
1208560‐03A SITE C6 Lewis Wetzel Two 3 22 88 NL* Heptane 142‐82‐5 x
1209293‐01A Site B10 MAURY 5 17 70 NL* Heptane 142‐82‐5 x
1209538‐02A SITE B11 MAURY 5 1.0 4.2 NL* Heptane 142‐82‐5 x
1209292‐01A Site B9 MAURY 5 9.8 40 NL* Heptane 142‐82‐5 x
1209293‐02A Site D10 MAURY 5 4.3 18 NL* Heptane 142‐82‐5 x
1209599‐02A Site D12 MAURY 5 1.0 4.1 NL* Heptane 142‐82‐5 x
1209292‐02A Site D9 MAURY 5 4.7 19 NL* Heptane 142‐82‐5 x
1208260‐01A SITE A3 WEEKLEY 2 16 66 NL* Heptane 142‐82‐5 x
1208326‐01A SITE A4 WEEKLEY 2 14 60 NL* Heptane 142‐82‐5 x
1208260‐03A SITE B3 WEEKLEY 2 24 98 NL* Heptane 142‐82‐5 x
1208326‐02A SITE B4 WEEKLEY 2 19 79 NL* Heptane 142‐82‐5 x
1208260‐02A SITE C3 WEEKLEY 2 19 77 NL* Heptane 142‐82‐5 x
1208326‐03A SITE C4 WEEKLEY 2 13 54 NL* Heptane 142‐82‐5 x
1210591‐02A SITE B16 BROOKE 7 0.88 3.1 0.0 Hexane 110‐54‐3 600
1207673‐02A SITE B2 DONNA 1 1.0 3.6 0.0 Hexane 110‐54‐3 600
1210187‐02A Site C13 LEMON 6 1.2 4.4 0.0 Hexane 110‐54‐3 600
1209538‐03A SITE C11 LEMON 6 1.1 4.0 0.0 Hexane 110‐54‐3 600
1209041‐01A Site A8 Lewis Wetzel Three 4 3.8 13 0.0 Hexane 110‐54‐3 600
1208683‐01A SITE A7 Lewis Wetzel Three 4 2.1 7.5 0.0 Hexane 110‐54‐3 600
1208683‐02A SITE C7 Lewis Wetzel Three 4 2.1 7.6 0.0 Hexane 110‐54‐3 600
1209041‐02A Site C8 Lewis Wetzel Three 4 1.1 3.8 0.0 Hexane 110‐54‐3 600
1208560‐03A SITE C6 Lewis Wetzel Two 3 3.3 12 0.0 Hexane 110‐54‐3 600
1208560‐04A SITE A6 Lewis Wetzel Two 3 3.0 10 0.0 Hexane 110‐54‐3 600
1208560‐01A SITE C5 Lewis Wetzel Two 3 2.8 10 0.0 Hexane 110‐54‐3 600
1208560‐02A SITE A5 Lewis Wetzel Two 3 2.3 8.1 0.0 Hexane 110‐54‐3 600
1209293‐02A Site D10 MAURY 5 3.4 12 0.0 Hexane 110‐54‐3 600
1209599‐02A Site D12 MAURY 5 2.2 7.9 0.0 Hexane 110‐54‐3 600
1209293‐01A Site B10 MAURY 5 1.6 5.8 0.0 Hexane 110‐54‐3 600
1209292‐01A Site B9 MAURY 5 1.1 3.8 0.0 Hexane 110‐54‐3 600
1209292‐02A Site D9 MAURY 5 0.89 3.2 0.0 Hexane 110‐54‐3 600
1208260‐03A SITE B3 WEEKLEY 2 12 44 0.0 Hexane 110‐54‐3 600
1208326‐02A SITE B4 WEEKLEY 2 6.2 22 0.0 Hexane 110‐54‐3 600
1208260‐02A SITE C3 WEEKLEY 2 5.4 19 0.0 Hexane 110‐54‐3 600
1208260‐01A SITE A3 WEEKLEY 2 4.4 16 0.0 Hexane 110‐54‐3 600
1208326‐01A SITE A4 WEEKLEY 2 2.7 9.6 0.0 Hexane 110‐54‐3 600
1208326‐03A SITE C4 WEEKLEY 2 2.6 9.0 0.0 Hexane 110‐54‐3 600

152
LABSAMPID sample Pad site RESULTS ppb(v)
RESULTS (ug/m3)
Hazard Quotient
COMPOUND NAME CASNUM
MRL (ppbv)
1207673‐02A SITE B2 DONNA 1 3.2 14 0.1 m,p‐Xylene 108‐38‐3/106‐42‐3 50
1210187‐02A Site C13 LEMON 6 0.90 3.9 0.0 m,p‐Xylene 108‐38‐3/106‐42‐3 50
1209538‐03A SITE C11 LEMON 6 0.88 3.8 0.0 m,p‐Xylene 108‐38‐3/106‐42‐3 50
1209041‐01A Site A8 Lewis Wetzel Three 4 1.5 6.4 0.0 m,p‐Xylene 108‐38‐3/106‐42‐3 50
1208683‐02A SITE C7 Lewis Wetzel Three 4 1.3 5.7 0.0 m,p‐Xylene 108‐38‐3/106‐42‐3 50
1208683‐01A SITE A7 Lewis Wetzel Three 4 1.2 5.0 0.0 m,p‐Xylene 108‐38‐3/106‐42‐3 50
1209041‐02A Site C8 Lewis Wetzel Three 4 0.72 3.1 0.0 m,p‐Xylene 108‐38‐3/106‐42‐3 50
1208560‐04A SITE A6 Lewis Wetzel Two 3 5.9 26 0.1 m,p‐Xylene 108‐38‐3/106‐42‐3 50
1208560‐03A SITE C6 Lewis Wetzel Two 3 2.1 9.0 0.0 m,p‐Xylene 108‐38‐3/106‐42‐3 50
1208560‐02A SITE A5 Lewis Wetzel Two 3 1.9 8.4 0.0 m,p‐Xylene 108‐38‐3/106‐42‐3 50
1208560‐01A SITE C5 Lewis Wetzel Two 3 1.8 8.0 0.0 m,p‐Xylene 108‐38‐3/106‐42‐3 50
1209539‐01A SITE D11 MAURY 5 0.94 4.1 0.0 m,p‐Xylene 108‐38‐3/106‐42‐3 50
1209538‐02A SITE B11 MAURY 5 0.90 3.9 0.0 m,p‐Xylene 108‐38‐3/106‐42‐3 50
1209292‐02A Site D9 MAURY 5 0.88 3.8 0.0 m,p‐Xylene 108‐38‐3/106‐42‐3 50
1209293‐01A Site B10 MAURY 5 0.80 3.4 0.0 m,p‐Xylene 108‐38‐3/106‐42‐3 50
1208260‐03A SITE B3 WEEKLEY 2 2.8 12 0.1 m,p‐Xylene 108‐38‐3/106‐42‐3 50
1208260‐01A SITE A3 WEEKLEY 2 2.2 9.7 0.0 m,p‐Xylene 108‐38‐3/106‐42‐3 50
1208260‐02A SITE C3 WEEKLEY 2 2.1 9.0 0.0 m,p‐Xylene 108‐38‐3/106‐42‐3 50
1208326‐01A SITE A4 WEEKLEY 2 2.0 8.7 0.0 m,p‐Xylene 108‐38‐3/106‐42‐3 50
1208326‐02A SITE B4 WEEKLEY 2 2.0 8.9 0.0 m,p‐Xylene 108‐38‐3/106‐42‐3 50
1208326‐03A SITE C4 WEEKLEY 2 0.99 4.3 0.0 m,p‐Xylene 108‐38‐3/106‐42‐3 50
1207673‐02A SITE B2 DONNA 1 1.3 5.6 0.0 o‐Xylene 95‐47‐6 50
1208560‐04A SITE A6 Lewis Wetzel Two 3 2.9 13 0.1 o‐Xylene 95‐47‐6 50
1208560‐04A SITE A6 Lewis Wetzel Two 3 1.1 4.6 0.0 Styrene 100‐42‐5 200
1209292‐02A Site D9 MAURY 5 0.67 2.9 0.0 Styrene 100‐42‐5 200
1208260‐03A SITE B3 WEEKLEY 2 1.4 6.2 0.0 Styrene 100‐42‐5 200
1208260‐02A SITE C3 WEEKLEY 2 1.2 5.0 0.0 Styrene 100‐42‐5 200
1208260‐01A SITE A3 WEEKLEY 2 1.1 4.8 0.0 Styrene 100‐42‐5 200
1208260‐01A SITE A3 WEEKLEY 2 0.89 2.6 NL* Tetrahydrofuran 109‐99‐9 x
1210495‐01A SITE A15 BROOKE 7 1.9 7.2 0.0 Toluene 108‐88‐3 80
1210591‐01A SITE A16 BROOKE 7 1.5 5.8 0.0 Toluene 108‐88‐3 80
1210591‐02A SITE B16 BROOKE 7 1.5 5.6 0.0 Toluene 108‐88‐3 80
1210495‐02A SITE B15 BROOKE 7 0.89 3.3 0.0 Toluene 108‐88‐3 80
1207673‐02A SITE B2 DONNA 1 62 230 0.8 Toluene 108‐88‐3 80
1207673‐04A SITE D2 DONNA 1 2.2 8.1 0.0 Toluene 108‐88‐3 80
1210187‐04A Site C14 LEMON 6 4.3 16 0.1 Toluene 108‐88‐3 80
1210187‐02A Site C13 LEMON 6 2.2 8.4 0.0 Toluene 108‐88‐3 80
1209538‐03A SITE C11 LEMON 6 1.9 7.2 0.0 Toluene 108‐88‐3 80
1209041‐01A Site A8 Lewis Wetzel Three 4 2.7 10 0.0 Toluene 108‐88‐3 80

153
LABSAMPID sample Pad site RESULTS ppb(v)
RESULTS (ug/m3)
Hazard Quotient
COMPOUND NAME CASNUM MRL (ppbv)
1208683‐02A SITE C7 Lewis Wetzel Three 4 1.9 7.3 0.0 Toluene 108‐88‐3 80
1208683‐01A SITE A7 Lewis Wetzel Three 4 1.4 5.3 0.0 Toluene 108‐88‐3 80
1209041‐02A Site C8 Lewis Wetzel Three 4 1.4 5.2 0.0 Toluene 108‐88‐3 80
1208560‐04A SITE A6 Lewis Wetzel Two 3 14 54 0.2 Toluene 108‐88‐3 80
1208560‐01A SITE C5 Lewis Wetzel Two 3 2.3 8.6 0.0 Toluene 108‐88‐3 80
1208560‐02A SITE A5 Lewis Wetzel Two 3 2.2 8.3 0.0 Toluene 108‐88‐3 80
1208560‐03A SITE C6 Lewis Wetzel Two 3 2.0 7.6 0.0 Toluene 108‐88‐3 80
1209539‐01A SITE D11 MAURY 5 3.5 13 0.0 Toluene 108‐88‐3 80
1209538‐02A SITE B11 MAURY 5 3.2 12 0.0 Toluene 108‐88‐3 80
1209292‐02A Site D9 MAURY 5 1.9 7.2 0.0 Toluene 108‐88‐3 80
1209293‐01A Site B10 MAURY 5 1.6 5.9 0.0 Toluene 108‐88‐3 80
1209292‐01A Site B9 MAURY 5 1.3 5.0 0.0 Toluene 108‐88‐3 80
1209599‐01A Site B12 MAURY 5 1.2 4.6 0.0 Toluene 108‐88‐3 80
1209293‐02A Site D10 MAURY 5 0.78 3.0 0.0 Toluene 108‐88‐3 80
1208260‐03A SITE B3 WEEKLEY 2 4.6 17 0.1 Toluene 108‐88‐3 80
1208260‐01A SITE A3 WEEKLEY 2 4.3 16 0.1 Toluene 108‐88‐3 80
1208260‐02A SITE C3 WEEKLEY 2 3.9 15 0.0 Toluene 108‐88‐3 80
1208326‐01A SITE A4 WEEKLEY 2 3.1 12 0.0 Toluene 108‐88‐3 80
1208326‐02A SITE B4 WEEKLEY 2 2.6 9.9 0.0 Toluene 108‐88‐3 80
1208326‐03A SITE C4 WEEKLEY 2 1.7 6.4 0.0 Toluene 108‐88‐3 80
1207673‐02A SITE B2 DONNA 1 0.94 5.1 NL* Trichloroethene 79‐01‐6 x
1209041‐01A Site A8 Lewis Wetzel Three 4 1.4 3.5 0.0 Vinyl Chloride 75‐01‐4 30
1208560‐03A SITE C6 Lewis Wetzel Two 3 1.3 3.3 0.0 Vinyl Chloride 75‐01‐4 30
1208560‐01A SITE C5 Lewis Wetzel Two 3 0.93 2.4 0.0 Vinyl Chloride 75‐01‐4 30
1208560‐02A SITE A5 Lewis Wetzel Two 3 0.89 2.3 0.0 Vinyl Chloride 75‐01‐4 30
1209293‐01A Site B10 MAURY 5 0.96 2.5 0.0 Vinyl Chloride 75‐01‐4 30
1209292‐01A Site B9 MAURY 5 0.67 1.7 0.0 Vinyl Chloride 75‐01‐4 30
1208260‐03A SITE B3 WEEKLEY 2 1.2 3.0 0.0 Vinyl Chloride 75‐01‐4 30
1208326‐02A SITE B4 WEEKLEY 2 1.2 3.2 0.0 Vinyl Chloride 75‐01‐4 30
1208260‐02A SITE C3 WEEKLEY 2 0.98 2.5 0.0 Vinyl Chloride 75‐01‐4 30
1208326‐03A SITE C4 WEEKLEY 2 0.79 2.0 0.0 Vinyl Chloride 75‐01‐4 30
*NL ‐ not listed by ATSDR
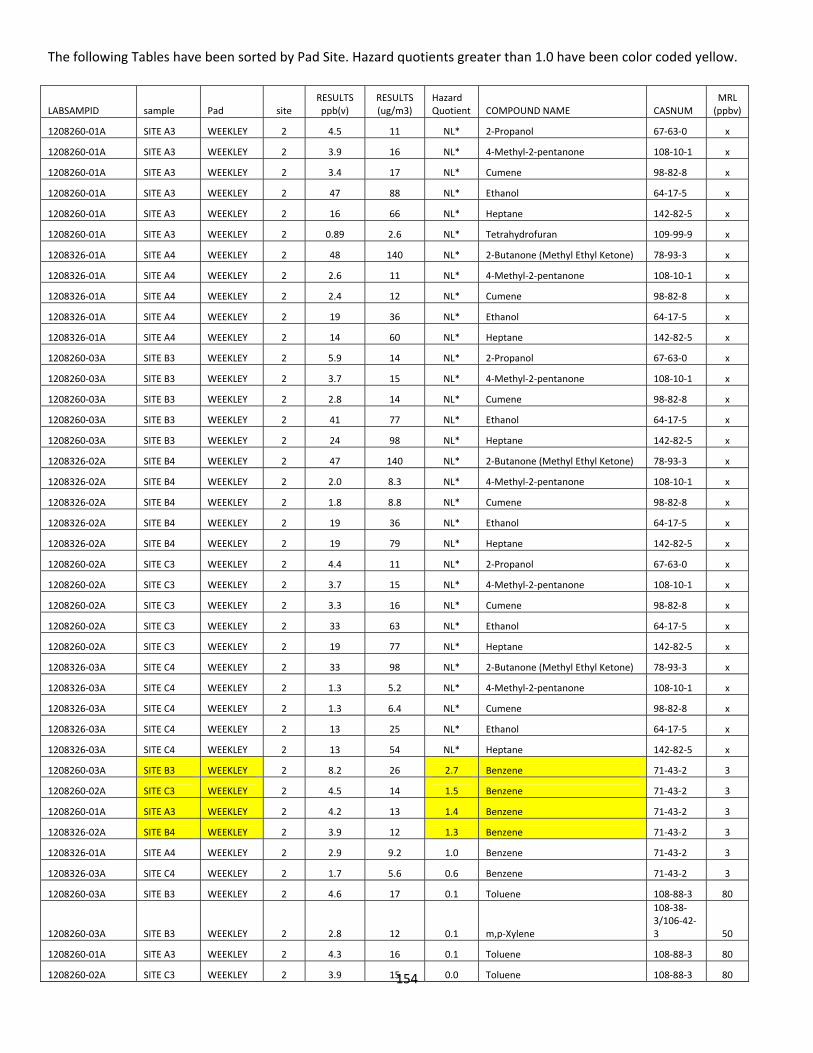
154
The following Tables have been sorted by Pad Site. Hazard quotients greater than 1.0 have been color coded yellow.
LABSAMPID sample Pad site RESULTS ppb(v)
RESULTS (ug/m3)
Hazard Quotient COMPOUND NAME CASNUM
MRL (ppbv)
1208260‐01A SITE A3 WEEKLEY 2 4.5 11 NL* 2‐Propanol 67‐63‐0 x
1208260‐01A SITE A3 WEEKLEY 2 3.9 16 NL* 4‐Methyl‐2‐pentanone 108‐10‐1 x
1208260‐01A SITE A3 WEEKLEY 2 3.4 17 NL* Cumene 98‐82‐8 x
1208260‐01A SITE A3 WEEKLEY 2 47 88 NL* Ethanol 64‐17‐5 x
1208260‐01A SITE A3 WEEKLEY 2 16 66 NL* Heptane 142‐82‐5 x
1208260‐01A SITE A3 WEEKLEY 2 0.89 2.6 NL* Tetrahydrofuran 109‐99‐9 x
1208326‐01A SITE A4 WEEKLEY 2 48 140 NL* 2‐Butanone (Methyl Ethyl Ketone) 78‐93‐3 x
1208326‐01A SITE A4 WEEKLEY 2 2.6 11 NL* 4‐Methyl‐2‐pentanone 108‐10‐1 x
1208326‐01A SITE A4 WEEKLEY 2 2.4 12 NL* Cumene 98‐82‐8 x
1208326‐01A SITE A4 WEEKLEY 2 19 36 NL* Ethanol 64‐17‐5 x
1208326‐01A SITE A4 WEEKLEY 2 14 60 NL* Heptane 142‐82‐5 x
1208260‐03A SITE B3 WEEKLEY 2 5.9 14 NL* 2‐Propanol 67‐63‐0 x
1208260‐03A SITE B3 WEEKLEY 2 3.7 15 NL* 4‐Methyl‐2‐pentanone 108‐10‐1 x
1208260‐03A SITE B3 WEEKLEY 2 2.8 14 NL* Cumene 98‐82‐8 x
1208260‐03A SITE B3 WEEKLEY 2 41 77 NL* Ethanol 64‐17‐5 x
1208260‐03A SITE B3 WEEKLEY 2 24 98 NL* Heptane 142‐82‐5 x
1208326‐02A SITE B4 WEEKLEY 2 47 140 NL* 2‐Butanone (Methyl Ethyl Ketone) 78‐93‐3 x
1208326‐02A SITE B4 WEEKLEY 2 2.0 8.3 NL* 4‐Methyl‐2‐pentanone 108‐10‐1 x
1208326‐02A SITE B4 WEEKLEY 2 1.8 8.8 NL* Cumene 98‐82‐8 x
1208326‐02A SITE B4 WEEKLEY 2 19 36 NL* Ethanol 64‐17‐5 x
1208326‐02A SITE B4 WEEKLEY 2 19 79 NL* Heptane 142‐82‐5 x
1208260‐02A SITE C3 WEEKLEY 2 4.4 11 NL* 2‐Propanol 67‐63‐0 x
1208260‐02A SITE C3 WEEKLEY 2 3.7 15 NL* 4‐Methyl‐2‐pentanone 108‐10‐1 x
1208260‐02A SITE C3 WEEKLEY 2 3.3 16 NL* Cumene 98‐82‐8 x
1208260‐02A SITE C3 WEEKLEY 2 33 63 NL* Ethanol 64‐17‐5 x
1208260‐02A SITE C3 WEEKLEY 2 19 77 NL* Heptane 142‐82‐5 x
1208326‐03A SITE C4 WEEKLEY 2 33 98 NL* 2‐Butanone (Methyl Ethyl Ketone) 78‐93‐3 x
1208326‐03A SITE C4 WEEKLEY 2 1.3 5.2 NL* 4‐Methyl‐2‐pentanone 108‐10‐1 x
1208326‐03A SITE C4 WEEKLEY 2 1.3 6.4 NL* Cumene 98‐82‐8 x
1208326‐03A SITE C4 WEEKLEY 2 13 25 NL* Ethanol 64‐17‐5 x
1208326‐03A SITE C4 WEEKLEY 2 13 54 NL* Heptane 142‐82‐5 x
1208260‐03A SITE B3 WEEKLEY 2 8.2 26 2.7 Benzene 71‐43‐2 3
1208260‐02A SITE C3 WEEKLEY 2 4.5 14 1.5 Benzene 71‐43‐2 3
1208260‐01A SITE A3 WEEKLEY 2 4.2 13 1.4 Benzene 71‐43‐2 3
1208326‐02A SITE B4 WEEKLEY 2 3.9 12 1.3 Benzene 71‐43‐2 3
1208326‐01A SITE A4 WEEKLEY 2 2.9 9.2 1.0 Benzene 71‐43‐2 3
1208326‐03A SITE C4 WEEKLEY 2 1.7 5.6 0.6 Benzene 71‐43‐2 3
1208260‐03A SITE B3 WEEKLEY 2 4.6 17 0.1 Toluene 108‐88‐3 80
1208260‐03A SITE B3 WEEKLEY 2 2.8 12 0.1 m,p‐Xylene
108‐38‐3/106‐42‐3 50
1208260‐01A SITE A3 WEEKLEY 2 4.3 16 0.1 Toluene 108‐88‐3 80
1208260‐02A SITE C3 WEEKLEY 2 3.9 15 0.0 Toluene 108‐88‐3 80
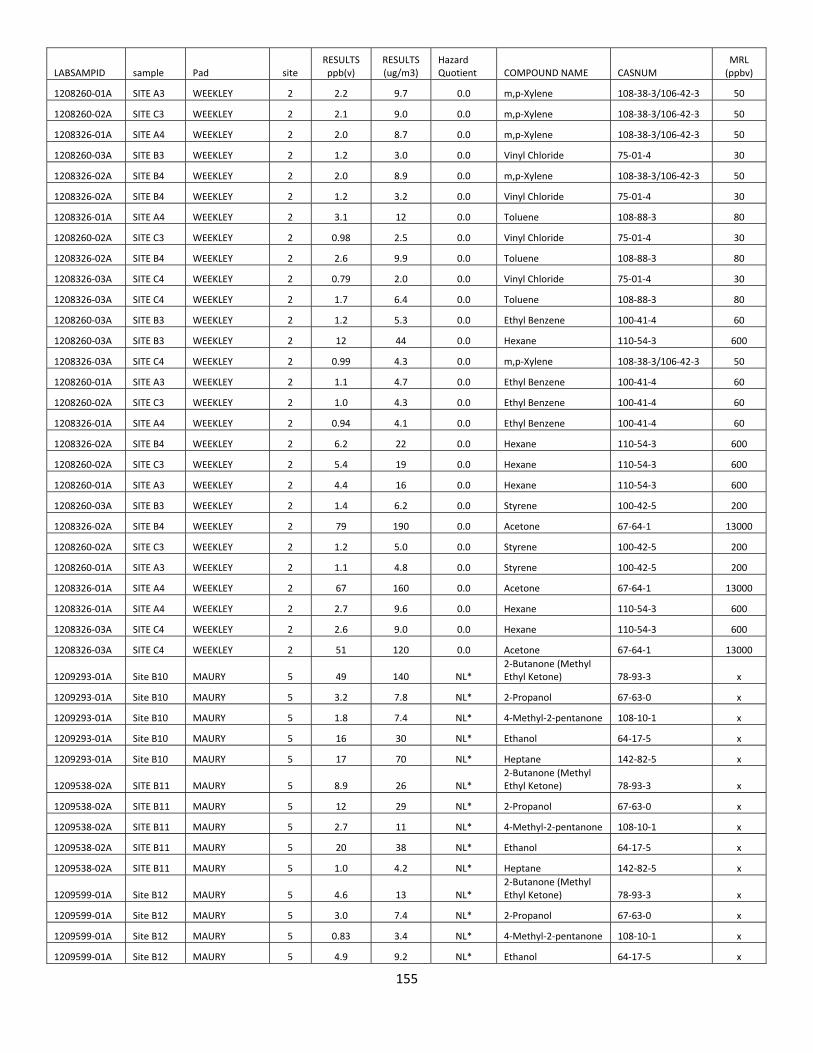
155
LABSAMPID sample Pad site RESULTS ppb(v)
RESULTS (ug/m3)
Hazard Quotient COMPOUND NAME CASNUM
MRL (ppbv)
1208260‐01A SITE A3 WEEKLEY 2 2.2 9.7 0.0 m,p‐Xylene 108‐38‐3/106‐42‐3 50
1208260‐02A SITE C3 WEEKLEY 2 2.1 9.0 0.0 m,p‐Xylene 108‐38‐3/106‐42‐3 50
1208326‐01A SITE A4 WEEKLEY 2 2.0 8.7 0.0 m,p‐Xylene 108‐38‐3/106‐42‐3 50
1208260‐03A SITE B3 WEEKLEY 2 1.2 3.0 0.0 Vinyl Chloride 75‐01‐4 30
1208326‐02A SITE B4 WEEKLEY 2 2.0 8.9 0.0 m,p‐Xylene 108‐38‐3/106‐42‐3 50
1208326‐02A SITE B4 WEEKLEY 2 1.2 3.2 0.0 Vinyl Chloride 75‐01‐4 30
1208326‐01A SITE A4 WEEKLEY 2 3.1 12 0.0 Toluene 108‐88‐3 80
1208260‐02A SITE C3 WEEKLEY 2 0.98 2.5 0.0 Vinyl Chloride 75‐01‐4 30
1208326‐02A SITE B4 WEEKLEY 2 2.6 9.9 0.0 Toluene 108‐88‐3 80
1208326‐03A SITE C4 WEEKLEY 2 0.79 2.0 0.0 Vinyl Chloride 75‐01‐4 30
1208326‐03A SITE C4 WEEKLEY 2 1.7 6.4 0.0 Toluene 108‐88‐3 80
1208260‐03A SITE B3 WEEKLEY 2 1.2 5.3 0.0 Ethyl Benzene 100‐41‐4 60
1208260‐03A SITE B3 WEEKLEY 2 12 44 0.0 Hexane 110‐54‐3 600
1208326‐03A SITE C4 WEEKLEY 2 0.99 4.3 0.0 m,p‐Xylene 108‐38‐3/106‐42‐3 50
1208260‐01A SITE A3 WEEKLEY 2 1.1 4.7 0.0 Ethyl Benzene 100‐41‐4 60
1208260‐02A SITE C3 WEEKLEY 2 1.0 4.3 0.0 Ethyl Benzene 100‐41‐4 60
1208326‐01A SITE A4 WEEKLEY 2 0.94 4.1 0.0 Ethyl Benzene 100‐41‐4 60
1208326‐02A SITE B4 WEEKLEY 2 6.2 22 0.0 Hexane 110‐54‐3 600
1208260‐02A SITE C3 WEEKLEY 2 5.4 19 0.0 Hexane 110‐54‐3 600
1208260‐01A SITE A3 WEEKLEY 2 4.4 16 0.0 Hexane 110‐54‐3 600
1208260‐03A SITE B3 WEEKLEY 2 1.4 6.2 0.0 Styrene 100‐42‐5 200
1208326‐02A SITE B4 WEEKLEY 2 79 190 0.0 Acetone 67‐64‐1 13000
1208260‐02A SITE C3 WEEKLEY 2 1.2 5.0 0.0 Styrene 100‐42‐5 200
1208260‐01A SITE A3 WEEKLEY 2 1.1 4.8 0.0 Styrene 100‐42‐5 200
1208326‐01A SITE A4 WEEKLEY 2 67 160 0.0 Acetone 67‐64‐1 13000
1208326‐01A SITE A4 WEEKLEY 2 2.7 9.6 0.0 Hexane 110‐54‐3 600
1208326‐03A SITE C4 WEEKLEY 2 2.6 9.0 0.0 Hexane 110‐54‐3 600
1208326‐03A SITE C4 WEEKLEY 2 51 120 0.0 Acetone 67‐64‐1 13000
1209293‐01A Site B10 MAURY 5 49 140 NL* 2‐Butanone (Methyl Ethyl Ketone) 78‐93‐3 x
1209293‐01A Site B10 MAURY 5 3.2 7.8 NL* 2‐Propanol 67‐63‐0 x
1209293‐01A Site B10 MAURY 5 1.8 7.4 NL* 4‐Methyl‐2‐pentanone 108‐10‐1 x
1209293‐01A Site B10 MAURY 5 16 30 NL* Ethanol 64‐17‐5 x
1209293‐01A Site B10 MAURY 5 17 70 NL* Heptane 142‐82‐5 x
1209538‐02A SITE B11 MAURY 5 8.9 26 NL* 2‐Butanone (Methyl Ethyl Ketone) 78‐93‐3 x
1209538‐02A SITE B11 MAURY 5 12 29 NL* 2‐Propanol 67‐63‐0 x
1209538‐02A SITE B11 MAURY 5 2.7 11 NL* 4‐Methyl‐2‐pentanone 108‐10‐1 x
1209538‐02A SITE B11 MAURY 5 20 38 NL* Ethanol 64‐17‐5 x
1209538‐02A SITE B11 MAURY 5 1.0 4.2 NL* Heptane 142‐82‐5 x
1209599‐01A Site B12 MAURY 5 4.6 13 NL* 2‐Butanone (Methyl Ethyl Ketone) 78‐93‐3 x
1209599‐01A Site B12 MAURY 5 3.0 7.4 NL* 2‐Propanol 67‐63‐0 x
1209599‐01A Site B12 MAURY 5 0.83 3.4 NL* 4‐Methyl‐2‐pentanone 108‐10‐1 x
1209599‐01A Site B12 MAURY 5 4.9 9.2 NL* Ethanol 64‐17‐5 x
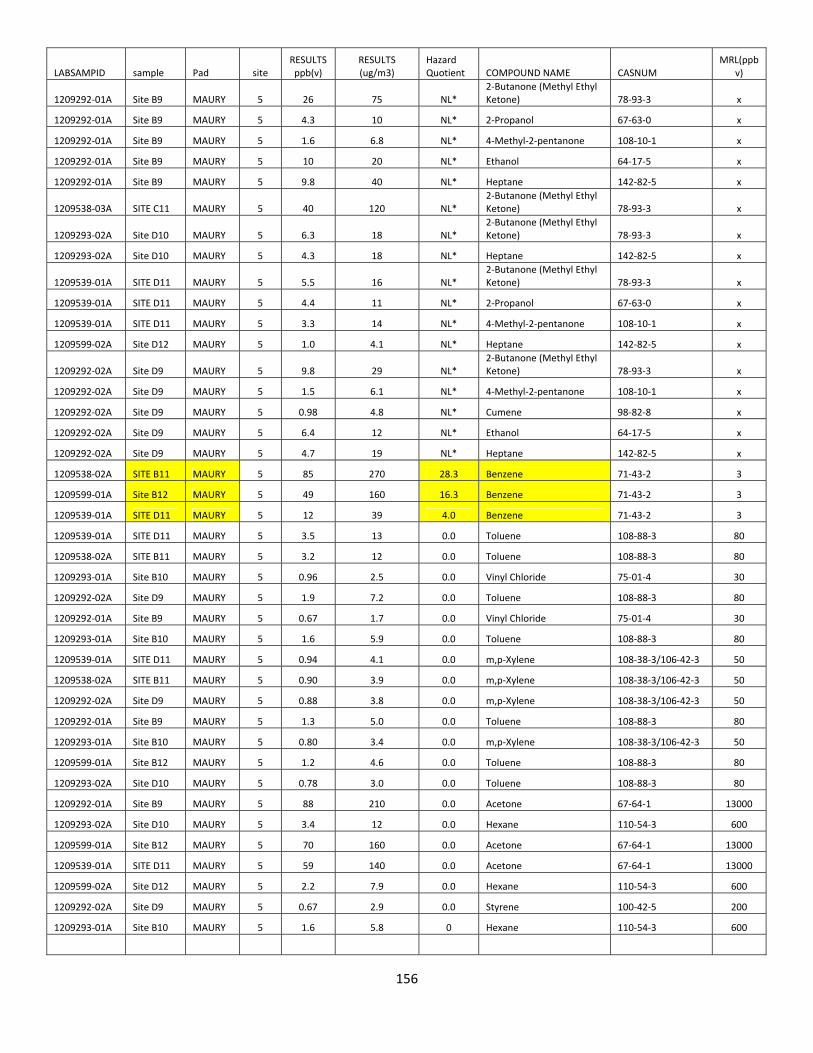
156
LABSAMPID sample Pad site RESULTS ppb(v)
RESULTS (ug/m3)
Hazard Quotient COMPOUND NAME CASNUM
MRL(ppbv)
1209292‐01A Site B9 MAURY 5 26 75 NL* 2‐Butanone (Methyl Ethyl Ketone) 78‐93‐3 x
1209292‐01A Site B9 MAURY 5 4.3 10 NL* 2‐Propanol 67‐63‐0 x
1209292‐01A Site B9 MAURY 5 1.6 6.8 NL* 4‐Methyl‐2‐pentanone 108‐10‐1 x
1209292‐01A Site B9 MAURY 5 10 20 NL* Ethanol 64‐17‐5 x
1209292‐01A Site B9 MAURY 5 9.8 40 NL* Heptane 142‐82‐5 x
1209538‐03A SITE C11 MAURY 5 40 120 NL* 2‐Butanone (Methyl Ethyl Ketone) 78‐93‐3 x
1209293‐02A Site D10 MAURY 5 6.3 18 NL* 2‐Butanone (Methyl Ethyl Ketone) 78‐93‐3 x
1209293‐02A Site D10 MAURY 5 4.3 18 NL* Heptane 142‐82‐5 x
1209539‐01A SITE D11 MAURY 5 5.5 16 NL* 2‐Butanone (Methyl Ethyl Ketone) 78‐93‐3 x
1209539‐01A SITE D11 MAURY 5 4.4 11 NL* 2‐Propanol 67‐63‐0 x
1209539‐01A SITE D11 MAURY 5 3.3 14 NL* 4‐Methyl‐2‐pentanone 108‐10‐1 x
1209599‐02A Site D12 MAURY 5 1.0 4.1 NL* Heptane 142‐82‐5 x
1209292‐02A Site D9 MAURY 5 9.8 29 NL* 2‐Butanone (Methyl Ethyl Ketone) 78‐93‐3 x
1209292‐02A Site D9 MAURY 5 1.5 6.1 NL* 4‐Methyl‐2‐pentanone 108‐10‐1 x
1209292‐02A Site D9 MAURY 5 0.98 4.8 NL* Cumene 98‐82‐8 x
1209292‐02A Site D9 MAURY 5 6.4 12 NL* Ethanol 64‐17‐5 x
1209292‐02A Site D9 MAURY 5 4.7 19 NL* Heptane 142‐82‐5 x
1209538‐02A SITE B11 MAURY 5 85 270 28.3 Benzene 71‐43‐2 3
1209599‐01A Site B12 MAURY 5 49 160 16.3 Benzene 71‐43‐2 3
1209539‐01A SITE D11 MAURY 5 12 39 4.0 Benzene 71‐43‐2 3
1209539‐01A SITE D11 MAURY 5 3.5 13 0.0 Toluene 108‐88‐3 80
1209538‐02A SITE B11 MAURY 5 3.2 12 0.0 Toluene 108‐88‐3 80
1209293‐01A Site B10 MAURY 5 0.96 2.5 0.0 Vinyl Chloride 75‐01‐4 30
1209292‐02A Site D9 MAURY 5 1.9 7.2 0.0 Toluene 108‐88‐3 80
1209292‐01A Site B9 MAURY 5 0.67 1.7 0.0 Vinyl Chloride 75‐01‐4 30
1209293‐01A Site B10 MAURY 5 1.6 5.9 0.0 Toluene 108‐88‐3 80
1209539‐01A SITE D11 MAURY 5 0.94 4.1 0.0 m,p‐Xylene 108‐38‐3/106‐42‐3 50
1209538‐02A SITE B11 MAURY 5 0.90 3.9 0.0 m,p‐Xylene 108‐38‐3/106‐42‐3 50
1209292‐02A Site D9 MAURY 5 0.88 3.8 0.0 m,p‐Xylene 108‐38‐3/106‐42‐3 50
1209292‐01A Site B9 MAURY 5 1.3 5.0 0.0 Toluene 108‐88‐3 80
1209293‐01A Site B10 MAURY 5 0.80 3.4 0.0 m,p‐Xylene 108‐38‐3/106‐42‐3 50
1209599‐01A Site B12 MAURY 5 1.2 4.6 0.0 Toluene 108‐88‐3 80
1209293‐02A Site D10 MAURY 5 0.78 3.0 0.0 Toluene 108‐88‐3 80
1209292‐01A Site B9 MAURY 5 88 210 0.0 Acetone 67‐64‐1 13000
1209293‐02A Site D10 MAURY 5 3.4 12 0.0 Hexane 110‐54‐3 600
1209599‐01A Site B12 MAURY 5 70 160 0.0 Acetone 67‐64‐1 13000
1209539‐01A SITE D11 MAURY 5 59 140 0.0 Acetone 67‐64‐1 13000
1209599‐02A Site D12 MAURY 5 2.2 7.9 0.0 Hexane 110‐54‐3 600
1209292‐02A Site D9 MAURY 5 0.67 2.9 0.0 Styrene 100‐42‐5 200
1209293‐01A Site B10 MAURY 5 1.6 5.8 0 Hexane 110‐54‐3 600
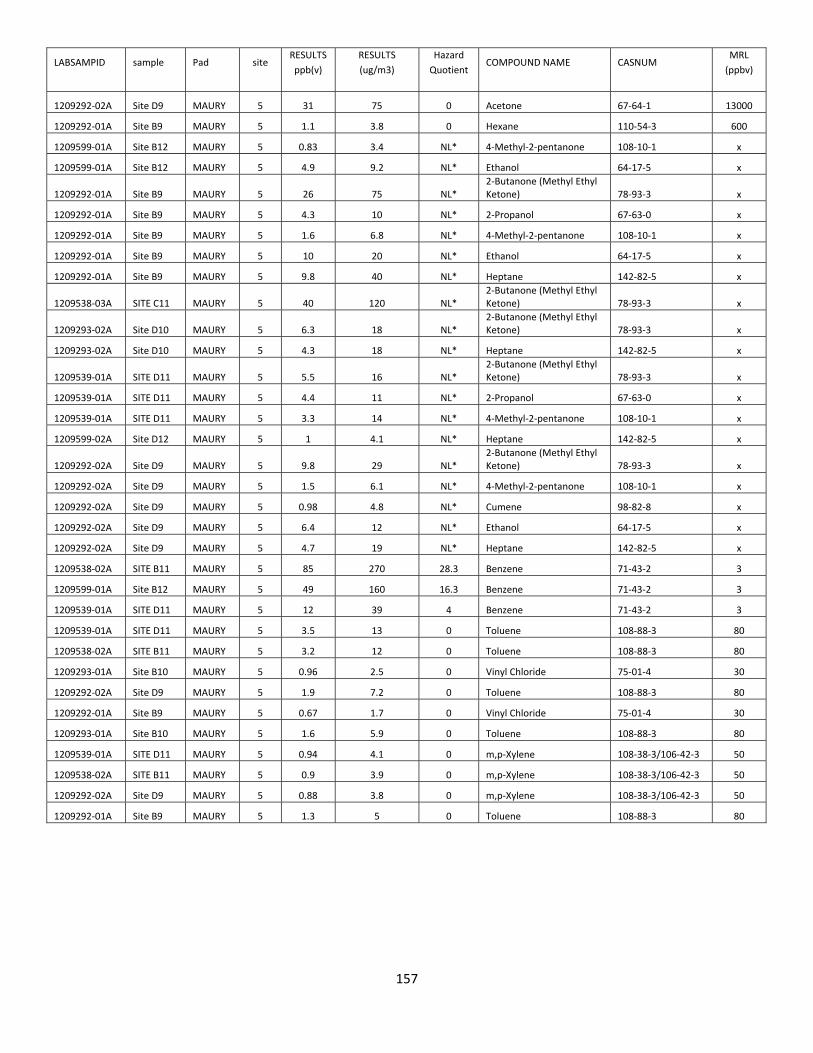
157
LABSAMPID sample Pad site RESULTS
ppb(v)
RESULTS
(ug/m3)
Hazard
Quotient COMPOUND NAME CASNUM
MRL
(ppbv)
1209292‐02A Site D9 MAURY 5 31 75 0 Acetone 67‐64‐1 13000
1209292‐01A Site B9 MAURY 5 1.1 3.8 0 Hexane 110‐54‐3 600
1209599‐01A Site B12 MAURY 5 0.83 3.4 NL* 4‐Methyl‐2‐pentanone 108‐10‐1 x
1209599‐01A Site B12 MAURY 5 4.9 9.2 NL* Ethanol 64‐17‐5 x
1209292‐01A Site B9 MAURY 5 26 75 NL* 2‐Butanone (Methyl Ethyl Ketone) 78‐93‐3 x
1209292‐01A Site B9 MAURY 5 4.3 10 NL* 2‐Propanol 67‐63‐0 x
1209292‐01A Site B9 MAURY 5 1.6 6.8 NL* 4‐Methyl‐2‐pentanone 108‐10‐1 x
1209292‐01A Site B9 MAURY 5 10 20 NL* Ethanol 64‐17‐5 x
1209292‐01A Site B9 MAURY 5 9.8 40 NL* Heptane 142‐82‐5 x
1209538‐03A SITE C11 MAURY 5 40 120 NL* 2‐Butanone (Methyl Ethyl Ketone) 78‐93‐3 x
1209293‐02A Site D10 MAURY 5 6.3 18 NL* 2‐Butanone (Methyl Ethyl Ketone) 78‐93‐3 x
1209293‐02A Site D10 MAURY 5 4.3 18 NL* Heptane 142‐82‐5 x
1209539‐01A SITE D11 MAURY 5 5.5 16 NL* 2‐Butanone (Methyl Ethyl Ketone) 78‐93‐3 x
1209539‐01A SITE D11 MAURY 5 4.4 11 NL* 2‐Propanol 67‐63‐0 x
1209539‐01A SITE D11 MAURY 5 3.3 14 NL* 4‐Methyl‐2‐pentanone 108‐10‐1 x
1209599‐02A Site D12 MAURY 5 1 4.1 NL* Heptane 142‐82‐5 x
1209292‐02A Site D9 MAURY 5 9.8 29 NL* 2‐Butanone (Methyl Ethyl Ketone) 78‐93‐3 x
1209292‐02A Site D9 MAURY 5 1.5 6.1 NL* 4‐Methyl‐2‐pentanone 108‐10‐1 x
1209292‐02A Site D9 MAURY 5 0.98 4.8 NL* Cumene 98‐82‐8 x
1209292‐02A Site D9 MAURY 5 6.4 12 NL* Ethanol 64‐17‐5 x
1209292‐02A Site D9 MAURY 5 4.7 19 NL* Heptane 142‐82‐5 x
1209538‐02A SITE B11 MAURY 5 85 270 28.3 Benzene 71‐43‐2 3
1209599‐01A Site B12 MAURY 5 49 160 16.3 Benzene 71‐43‐2 3
1209539‐01A SITE D11 MAURY 5 12 39 4 Benzene 71‐43‐2 3
1209539‐01A SITE D11 MAURY 5 3.5 13 0 Toluene 108‐88‐3 80
1209538‐02A SITE B11 MAURY 5 3.2 12 0 Toluene 108‐88‐3 80
1209293‐01A Site B10 MAURY 5 0.96 2.5 0 Vinyl Chloride 75‐01‐4 30
1209292‐02A Site D9 MAURY 5 1.9 7.2 0 Toluene 108‐88‐3 80
1209292‐01A Site B9 MAURY 5 0.67 1.7 0 Vinyl Chloride 75‐01‐4 30
1209293‐01A Site B10 MAURY 5 1.6 5.9 0 Toluene 108‐88‐3 80
1209539‐01A SITE D11 MAURY 5 0.94 4.1 0 m,p‐Xylene 108‐38‐3/106‐42‐3 50
1209538‐02A SITE B11 MAURY 5 0.9 3.9 0 m,p‐Xylene 108‐38‐3/106‐42‐3 50
1209292‐02A Site D9 MAURY 5 0.88 3.8 0 m,p‐Xylene 108‐38‐3/106‐42‐3 50
1209292‐01A Site B9 MAURY 5 1.3 5 0 Toluene 108‐88‐3 80

158
LABSAMPID sample Pad site RESULTS ppb(v)
RESULTS (ug/m3)
Hazard Quotient COMPOUND NAME CASNUM
MRL (ppbv)
1209293‐01A Site B10 MAURY 5 0.80 3.4 0.0 m,p‐Xylene 108‐38‐3/106‐42‐3 50
1209599‐01A Site B12 MAURY 5 1.2 4.6 0.0 Toluene 108‐88‐3 80
1209293‐02A Site D10 MAURY 5 0.78 3.0 0.0 Toluene 108‐88‐3 80
1209292‐01A Site B9 MAURY 5 88 210 0.0 Acetone 67‐64‐1 13000
1209293‐02A Site D10 MAURY 5 3.4 12 0.0 Hexane 110‐54‐3 600
1209599‐01A Site B12 MAURY 5 70 160 0.0 Acetone 67‐64‐1 13000
1209539‐01A SITE D11 MAURY 5 59 140 0.0 Acetone 67‐64‐1 13000
1209599‐02A Site D12 MAURY 5 2.2 7.9 0.0 Hexane 110‐54‐3 600
1209292‐02A Site D9 MAURY 5 0.67 2.9 0.0 Styrene 100‐42‐5 200
1209293‐01A Site B10 MAURY 5 1.6 5.8 0.0 Hexane 110‐54‐3 600
1209292‐02A Site D9 MAURY 5 31 75 0.0 Acetone 67‐64‐1 13000
1209292‐01A Site B9 MAURY 5 1.1 3.8 0.0 Hexane 110‐54‐3 600
1209292‐02A Site D9 MAURY 5 0.89 3.2 0.0 Hexane 110‐54‐3 600
1209293‐02A Site D10 MAURY 5 14 34 0.0 Acetone 67‐64‐1 13000
1208560‐02A SITE A5 Lewis Wetzel Two 3 48 140 NL*
2‐Butanone (Methyl Ethyl Ketone) 78‐93‐3 x
1208560‐02A SITE A5 Lewis Wetzel Two 3 4.4 11 NL* 2‐Propanol 67‐63‐0 x
1208560‐02A SITE A5 Lewis Wetzel Two 3 2.4 9.6 NL* 4‐Methyl‐2‐pentanone 108‐10‐1 x
1208560‐02A SITE A5 Lewis Wetzel Two 3 1.8 8.8 NL* Cumene 98‐82‐8 x
1208560‐02A SITE A5 Lewis Wetzel Two 3 30 57 NL* Ethanol 64‐17‐5 x
1208560‐02A SITE A5 Lewis Wetzel Two 3 15 62 NL* Heptane 142‐82‐5 x
1208560‐04A SITE A6 Lewis Wetzel Two 3 44 130 NL*
2‐Butanone (Methyl Ethyl Ketone) 78‐93‐3 x
1208560‐04A SITE A6 Lewis Wetzel Two 3 27 67 NL* 2‐Propanol 67‐63‐0 x
1208560‐04A SITE A6 Lewis Wetzel Two 3 2.9 12 NL* 4‐Methyl‐2‐pentanone 108‐10‐1 x
1208560‐04A SITE A6 Lewis Wetzel Two 3 2.9 14 NL* Cumene 98‐82‐8 x
1208560‐04A SITE A6 Lewis Wetzel Two 3 42 80 NL* Ethanol 64‐17‐5 x
1208560‐04A SITE A6 Lewis Wetzel Two 3 16 65 NL* Heptane 142‐82‐5 x
1208560‐01A SITE C5 Lewis Wetzel Two 3 54 160 NL*
2‐Butanone (Methyl Ethyl Ketone) 78‐93‐3 x
1208560‐01A SITE C5 Lewis Wetzel Two 3 5.1 12 NL* 2‐Propanol 67‐63‐0 x
1208560‐01A SITE C5 Lewis Wetzel Two 3 2.4 9.8 NL* 4‐Methyl‐2‐pentanone 108‐10‐1 x
1208560‐01A SITE C5 Lewis Wetzel Two 3 1.4 6.7 NL* Cumene 98‐82‐8 x
1208560‐01A SITE C5 Lewis Wetzel Two 3 34 65 NL* Ethanol 64‐17‐5 x
1208560‐01A SITE C5 Lewis Wetzel Two 3 20 80 NL* Heptane 142‐82‐5 x
1208560‐03A SITE C6 Lewis Wetzel Two 3 56 160 NL*
2‐Butanone (Methyl Ethyl Ketone) 78‐93‐3 x
1208560‐03A SITE C6 Lewis Wetzel Two 3 2.0 8.3 NL* 4‐Methyl‐2‐pentanone 108‐10‐1 x
1208560‐03A SITE C6 Lewis Wetzel Two 3 1.4 7.0 NL* Cumene 98‐82‐8 x
1208560‐03A SITE C6 Lewis Wetzel Two 3 26 49 NL* Ethanol 64‐17‐5 x

159
LABSAMPID sample Pad site RESULTS
ppb(v)
RESULTS
(ug/m3)
Hazard
Quotient COMPOUND NAME CASNUM
MRL(ppb
v)
1208560‐03A SITE C6 Lewis Wetzel Two 3 22 88 NL* Heptane 142‐82‐5 x
1208560‐01A SITE C5 Lewis Wetzel Two 3 3.0 9.7 1.0 Benzene 71‐43‐2 3
1208560‐02A SITE A5 Lewis Wetzel Two 3 2.4 7.8 0.8 Benzene 71‐43‐2 3
1208560‐03A SITE C6 Lewis Wetzel Two 3 2.4 7.7 0.8 Benzene 71‐43‐2 3
1208560‐04A SITE A6 Lewis Wetzel Two 3 2.1 6.7 0.7 Benzene 71‐43‐2 3
1208560‐04A SITE A6 Lewis Wetzel Two 3 2.4 14 0.2 1,2‐Dichlorobenzene 95‐50‐1 10
1208560‐04A SITE A6 Lewis Wetzel Two 3 14 54 0.2 Toluene 108‐88‐3 80
1208560‐04A SITE A6 Lewis Wetzel Two 3 5.9 26 0.1 m,p‐Xylene 108‐38‐3/106‐42‐3 50
1208560‐04A SITE A6 Lewis Wetzel Two 3 2.9 13 0.1 o‐Xylene 95‐47‐6 50
1208560‐03A SITE C6 Lewis Wetzel Two 3 1.3 3.3 0.0 Vinyl Chloride 75‐01‐4 30
1208560‐03A SITE C6 Lewis Wetzel Two 3 2.1 9.0 0.0 m,p‐Xylene 108‐38‐3/106‐42‐3 50
1208560‐02A SITE A5 Lewis Wetzel Two 3 1.9 8.4 0.0 m,p‐Xylene 108‐38‐3/106‐42‐3 50
1208560‐01A SITE C5 Lewis Wetzel Two 3 1.8 8.0 0.0 m,p‐Xylene 108‐38‐3/106‐42‐3 50
1208560‐01A SITE C5 Lewis Wetzel Two 3 0.93 2.4 0.0 Vinyl Chloride 75‐01‐4 30
1208560‐02A SITE A5 Lewis Wetzel Two 3 0.89 2.3 0.0 Vinyl Chloride 75‐01‐4 30
1208560‐01A SITE C5 Lewis Wetzel Two 3 2.3 8.6 0.0 Toluene 108‐88‐3 80
1208560‐02A SITE A5 Lewis Wetzel Two 3 2.2 8.3 0.0 Toluene 108‐88‐3 80
1208560‐03A SITE C6 Lewis Wetzel Two 3 2.0 7.6 0.0 Toluene 108‐88‐3 80
1208560‐04A SITE A6 Lewis Wetzel Two 3 1.3 5.6 0.0 Ethyl Benzene 100‐41‐4 60
1208560‐04A SITE A6 Lewis Wetzel Two 3 1.1 4.6 0.0 Styrene 100‐42‐5 200
LABSAMPID sample Pad site RESULTS ppb(v)
RESULTS (ug/m3)
Hazard Quotient COMPOUND NAME CASNUM
MRL(ppbv)
1208560‐03A SITE C6 Lewis Wetzel Two 3 3.3 12 0.0 Hexane 110‐54‐3 600
1208560‐04A SITE A6 Lewis Wetzel Two 3 3.0 10 0.0 Hexane 110‐54‐3 600
1208683‐01A SITE A7 Lewis Wetzel Three 4 42 120 NL*
2‐Butanone (Methyl Ethyl Ketone) 78‐93‐3 x
1208683‐01A SITE A7 Lewis Wetzel Three 4 3.6 9 NL* 2‐Propanol 67‐63‐0 x
1208683‐01A SITE A7 Lewis Wetzel Three 4 1.3 5.5 NL* 4‐Methyl‐2‐pentanone 108‐10‐1 x
1208683‐01A SITE A7 Lewis Wetzel Three 4 0.93 4.6 NL* Cumene 98‐82‐8 x
1208683‐01A SITE A7 Lewis Wetzel Three 4 8.6 16 NL* Ethanol 64‐17‐5 x
1208683‐01A SITE A7 Lewis Wetzel Three 4 16 64 NL* Heptane 142‐82‐5 x
1209041‐01A Site A8 Lewis Wetzel Three 4 69 200 NL*
2‐Butanone (Methyl Ethyl Ketone) 78‐93‐3 x
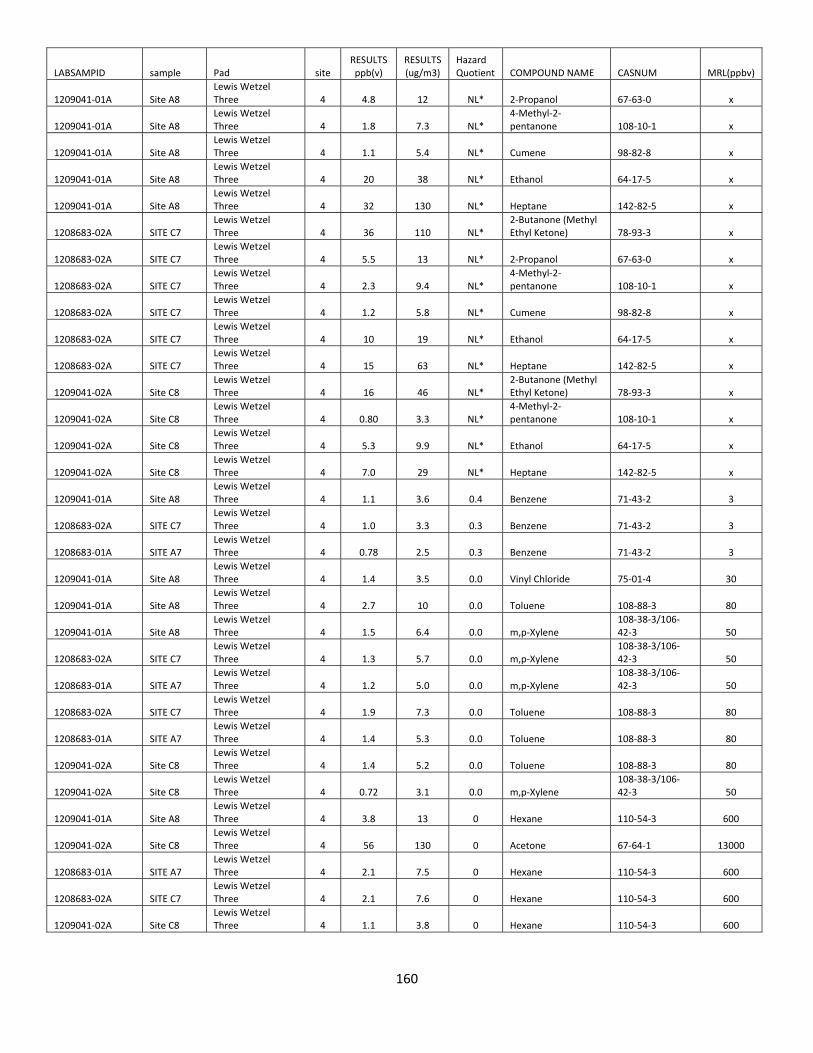
160
LABSAMPID sample Pad site RESULTS ppb(v)
RESULTS (ug/m3)
Hazard Quotient COMPOUND NAME CASNUM MRL(ppbv)
1209041‐01A Site A8 Lewis Wetzel Three 4 4.8 12 NL* 2‐Propanol 67‐63‐0 x
1209041‐01A Site A8 Lewis Wetzel Three 4 1.8 7.3 NL*
4‐Methyl‐2‐pentanone 108‐10‐1 x
1209041‐01A Site A8 Lewis Wetzel Three 4 1.1 5.4 NL* Cumene 98‐82‐8 x
1209041‐01A Site A8 Lewis Wetzel Three 4 20 38 NL* Ethanol 64‐17‐5 x
1209041‐01A Site A8 Lewis Wetzel Three 4 32 130 NL* Heptane 142‐82‐5 x
1208683‐02A SITE C7 Lewis Wetzel Three 4 36 110 NL*
2‐Butanone (Methyl Ethyl Ketone) 78‐93‐3 x
1208683‐02A SITE C7 Lewis Wetzel Three 4 5.5 13 NL* 2‐Propanol 67‐63‐0 x
1208683‐02A SITE C7 Lewis Wetzel Three 4 2.3 9.4 NL*
4‐Methyl‐2‐pentanone 108‐10‐1 x
1208683‐02A SITE C7 Lewis Wetzel Three 4 1.2 5.8 NL* Cumene 98‐82‐8 x
1208683‐02A SITE C7 Lewis Wetzel Three 4 10 19 NL* Ethanol 64‐17‐5 x
1208683‐02A SITE C7 Lewis Wetzel Three 4 15 63 NL* Heptane 142‐82‐5 x
1209041‐02A Site C8 Lewis Wetzel Three 4 16 46 NL*
2‐Butanone (Methyl Ethyl Ketone) 78‐93‐3 x
1209041‐02A Site C8 Lewis Wetzel Three 4 0.80 3.3 NL*
4‐Methyl‐2‐pentanone 108‐10‐1 x
1209041‐02A Site C8 Lewis Wetzel Three 4 5.3 9.9 NL* Ethanol 64‐17‐5 x
1209041‐02A Site C8 Lewis Wetzel Three 4 7.0 29 NL* Heptane 142‐82‐5 x
1209041‐01A Site A8 Lewis Wetzel Three 4 1.1 3.6 0.4 Benzene 71‐43‐2 3
1208683‐02A SITE C7 Lewis Wetzel Three 4 1.0 3.3 0.3 Benzene 71‐43‐2 3
1208683‐01A SITE A7 Lewis Wetzel Three 4 0.78 2.5 0.3 Benzene 71‐43‐2 3
1209041‐01A Site A8 Lewis Wetzel Three 4 1.4 3.5 0.0 Vinyl Chloride 75‐01‐4 30
1209041‐01A Site A8 Lewis Wetzel Three 4 2.7 10 0.0 Toluene 108‐88‐3 80
1209041‐01A Site A8 Lewis Wetzel Three 4 1.5 6.4 0.0 m,p‐Xylene
108‐38‐3/106‐42‐3 50
1208683‐02A SITE C7 Lewis Wetzel Three 4 1.3 5.7 0.0 m,p‐Xylene
108‐38‐3/106‐42‐3 50
1208683‐01A SITE A7 Lewis Wetzel Three 4 1.2 5.0 0.0 m,p‐Xylene
108‐38‐3/106‐42‐3 50
1208683‐02A SITE C7 Lewis Wetzel Three 4 1.9 7.3 0.0 Toluene 108‐88‐3 80
1208683‐01A SITE A7 Lewis Wetzel Three 4 1.4 5.3 0.0 Toluene 108‐88‐3 80
1209041‐02A Site C8 Lewis Wetzel Three 4 1.4 5.2 0.0 Toluene 108‐88‐3 80
1209041‐02A Site C8 Lewis Wetzel Three 4 0.72 3.1 0.0 m,p‐Xylene
108‐38‐3/106‐42‐3 50
1209041‐01A Site A8 Lewis Wetzel Three 4 3.8 13 0 Hexane 110‐54‐3 600
1209041‐02A Site C8 Lewis Wetzel Three 4 56 130 0 Acetone 67‐64‐1 13000
1208683‐01A SITE A7 Lewis Wetzel Three 4 2.1 7.5 0 Hexane 110‐54‐3 600
1208683‐02A SITE C7 Lewis Wetzel Three 4 2.1 7.6 0 Hexane 110‐54‐3 600
1209041‐02A Site C8 Lewis Wetzel Three 4 1.1 3.8 0 Hexane 110‐54‐3 600
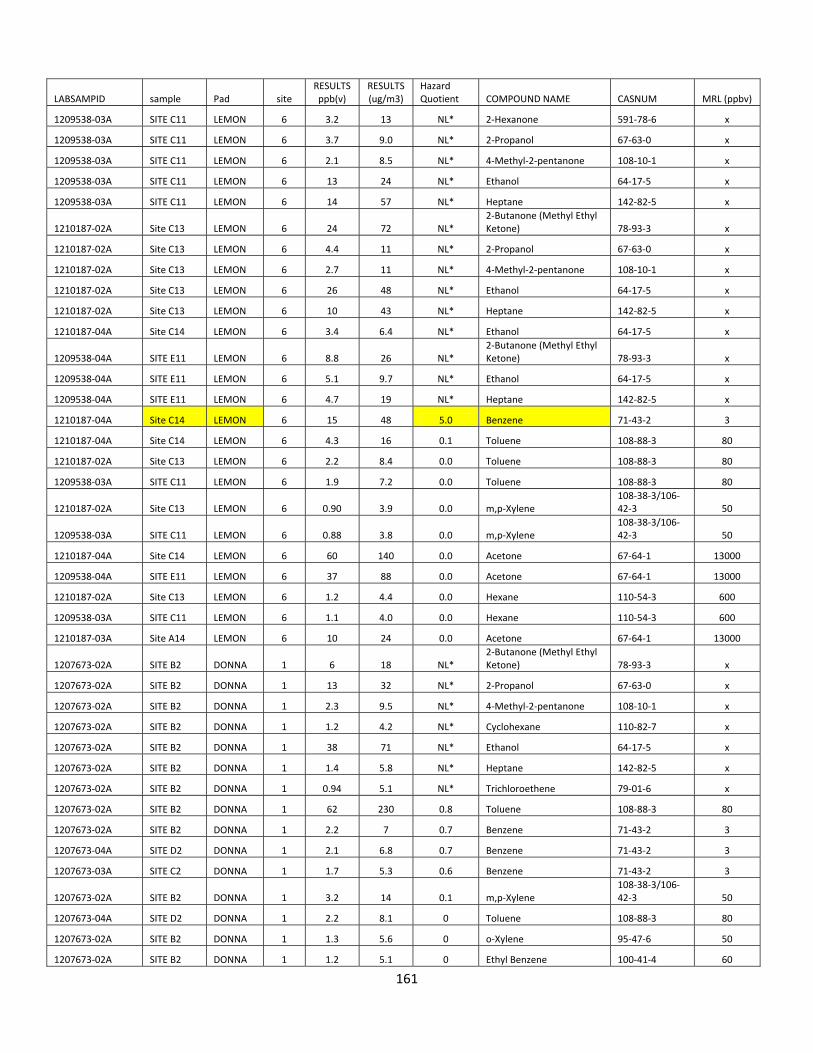
161
LABSAMPID sample Pad site RESULTS ppb(v)
RESULTS (ug/m3)
Hazard Quotient COMPOUND NAME CASNUM MRL (ppbv)
1209538‐03A SITE C11 LEMON 6 3.2 13 NL* 2‐Hexanone 591‐78‐6 x
1209538‐03A SITE C11 LEMON 6 3.7 9.0 NL* 2‐Propanol 67‐63‐0 x
1209538‐03A SITE C11 LEMON 6 2.1 8.5 NL* 4‐Methyl‐2‐pentanone 108‐10‐1 x
1209538‐03A SITE C11 LEMON 6 13 24 NL* Ethanol 64‐17‐5 x
1209538‐03A SITE C11 LEMON 6 14 57 NL* Heptane 142‐82‐5 x
1210187‐02A Site C13 LEMON 6 24 72 NL* 2‐Butanone (Methyl Ethyl Ketone) 78‐93‐3 x
1210187‐02A Site C13 LEMON 6 4.4 11 NL* 2‐Propanol 67‐63‐0 x
1210187‐02A Site C13 LEMON 6 2.7 11 NL* 4‐Methyl‐2‐pentanone 108‐10‐1 x
1210187‐02A Site C13 LEMON 6 26 48 NL* Ethanol 64‐17‐5 x
1210187‐02A Site C13 LEMON 6 10 43 NL* Heptane 142‐82‐5 x
1210187‐04A Site C14 LEMON 6 3.4 6.4 NL* Ethanol 64‐17‐5 x
1209538‐04A SITE E11 LEMON 6 8.8 26 NL* 2‐Butanone (Methyl Ethyl Ketone) 78‐93‐3 x
1209538‐04A SITE E11 LEMON 6 5.1 9.7 NL* Ethanol 64‐17‐5 x
1209538‐04A SITE E11 LEMON 6 4.7 19 NL* Heptane 142‐82‐5 x
1210187‐04A Site C14 LEMON 6 15 48 5.0 Benzene 71‐43‐2 3
1210187‐04A Site C14 LEMON 6 4.3 16 0.1 Toluene 108‐88‐3 80
1210187‐02A Site C13 LEMON 6 2.2 8.4 0.0 Toluene 108‐88‐3 80
1209538‐03A SITE C11 LEMON 6 1.9 7.2 0.0 Toluene 108‐88‐3 80
1210187‐02A Site C13 LEMON 6 0.90 3.9 0.0 m,p‐Xylene 108‐38‐3/106‐42‐3 50
1209538‐03A SITE C11 LEMON 6 0.88 3.8 0.0 m,p‐Xylene 108‐38‐3/106‐42‐3 50
1210187‐04A Site C14 LEMON 6 60 140 0.0 Acetone 67‐64‐1 13000
1209538‐04A SITE E11 LEMON 6 37 88 0.0 Acetone 67‐64‐1 13000
1210187‐02A Site C13 LEMON 6 1.2 4.4 0.0 Hexane 110‐54‐3 600
1209538‐03A SITE C11 LEMON 6 1.1 4.0 0.0 Hexane 110‐54‐3 600
1210187‐03A Site A14 LEMON 6 10 24 0.0 Acetone 67‐64‐1 13000
1207673‐02A SITE B2 DONNA 1 6 18 NL* 2‐Butanone (Methyl Ethyl Ketone) 78‐93‐3 x
1207673‐02A SITE B2 DONNA 1 13 32 NL* 2‐Propanol 67‐63‐0 x
1207673‐02A SITE B2 DONNA 1 2.3 9.5 NL* 4‐Methyl‐2‐pentanone 108‐10‐1 x
1207673‐02A SITE B2 DONNA 1 1.2 4.2 NL* Cyclohexane 110‐82‐7 x
1207673‐02A SITE B2 DONNA 1 38 71 NL* Ethanol 64‐17‐5 x
1207673‐02A SITE B2 DONNA 1 1.4 5.8 NL* Heptane 142‐82‐5 x
1207673‐02A SITE B2 DONNA 1 0.94 5.1 NL* Trichloroethene 79‐01‐6 x
1207673‐02A SITE B2 DONNA 1 62 230 0.8 Toluene 108‐88‐3 80
1207673‐02A SITE B2 DONNA 1 2.2 7 0.7 Benzene 71‐43‐2 3
1207673‐04A SITE D2 DONNA 1 2.1 6.8 0.7 Benzene 71‐43‐2 3
1207673‐03A SITE C2 DONNA 1 1.7 5.3 0.6 Benzene 71‐43‐2 3
1207673‐02A SITE B2 DONNA 1 3.2 14 0.1 m,p‐Xylene 108‐38‐3/106‐42‐3 50
1207673‐04A SITE D2 DONNA 1 2.2 8.1 0 Toluene 108‐88‐3 80
1207673‐02A SITE B2 DONNA 1 1.3 5.6 0 o‐Xylene 95‐47‐6 50
1207673‐02A SITE B2 DONNA 1 1.2 5.1 0 Ethyl Benzene 100‐41‐4 60
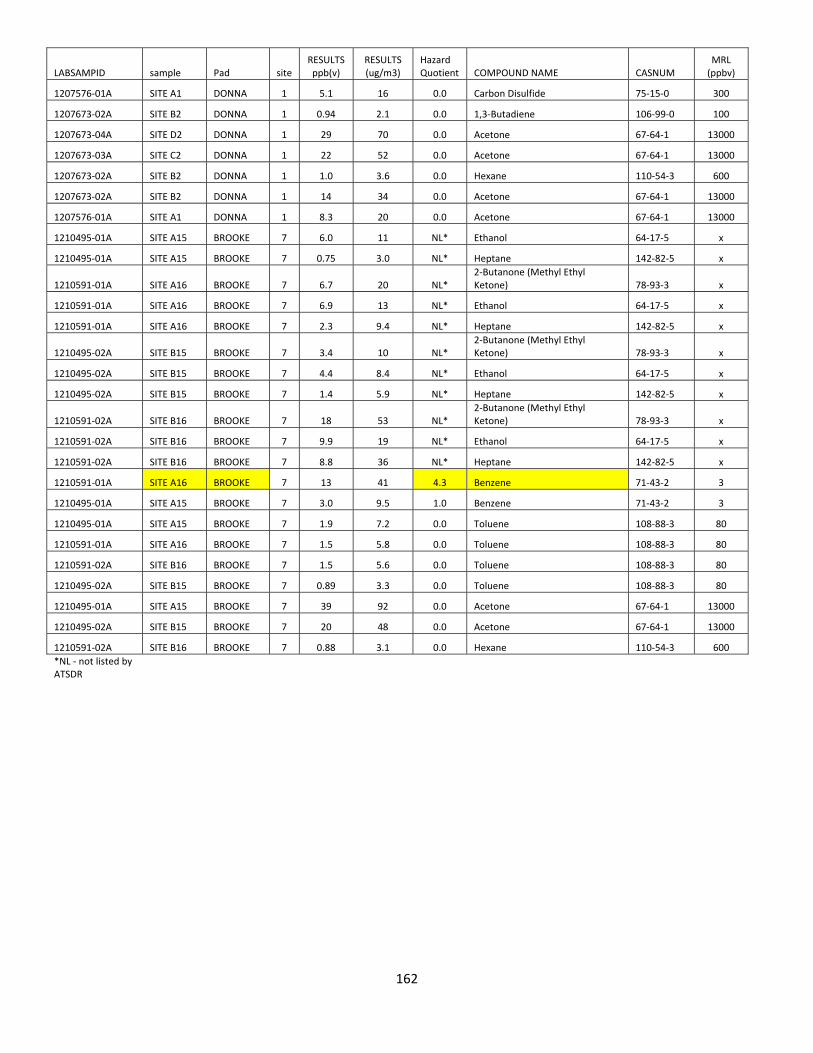
162
LABSAMPID sample Pad site RESULTS ppb(v)
RESULTS (ug/m3)
Hazard Quotient COMPOUND NAME CASNUM
MRL (ppbv)
1207576‐01A SITE A1 DONNA 1 5.1 16 0.0 Carbon Disulfide 75‐15‐0 300
1207673‐02A SITE B2 DONNA 1 0.94 2.1 0.0 1,3‐Butadiene 106‐99‐0 100
1207673‐04A SITE D2 DONNA 1 29 70 0.0 Acetone 67‐64‐1 13000
1207673‐03A SITE C2 DONNA 1 22 52 0.0 Acetone 67‐64‐1 13000
1207673‐02A SITE B2 DONNA 1 1.0 3.6 0.0 Hexane 110‐54‐3 600
1207673‐02A SITE B2 DONNA 1 14 34 0.0 Acetone 67‐64‐1 13000
1207576‐01A SITE A1 DONNA 1 8.3 20 0.0 Acetone 67‐64‐1 13000
1210495‐01A SITE A15 BROOKE 7 6.0 11 NL* Ethanol 64‐17‐5 x
1210495‐01A SITE A15 BROOKE 7 0.75 3.0 NL* Heptane 142‐82‐5 x
1210591‐01A SITE A16 BROOKE 7 6.7 20 NL* 2‐Butanone (Methyl Ethyl Ketone) 78‐93‐3 x
1210591‐01A SITE A16 BROOKE 7 6.9 13 NL* Ethanol 64‐17‐5 x
1210591‐01A SITE A16 BROOKE 7 2.3 9.4 NL* Heptane 142‐82‐5 x
1210495‐02A SITE B15 BROOKE 7 3.4 10 NL* 2‐Butanone (Methyl Ethyl Ketone) 78‐93‐3 x
1210495‐02A SITE B15 BROOKE 7 4.4 8.4 NL* Ethanol 64‐17‐5 x
1210495‐02A SITE B15 BROOKE 7 1.4 5.9 NL* Heptane 142‐82‐5 x
1210591‐02A SITE B16 BROOKE 7 18 53 NL* 2‐Butanone (Methyl Ethyl Ketone) 78‐93‐3 x
1210591‐02A SITE B16 BROOKE 7 9.9 19 NL* Ethanol 64‐17‐5 x
1210591‐02A SITE B16 BROOKE 7 8.8 36 NL* Heptane 142‐82‐5 x
1210591‐01A SITE A16 BROOKE 7 13 41 4.3 Benzene 71‐43‐2 3
1210495‐01A SITE A15 BROOKE 7 3.0 9.5 1.0 Benzene 71‐43‐2 3
1210495‐01A SITE A15 BROOKE 7 1.9 7.2 0.0 Toluene 108‐88‐3 80
1210591‐01A SITE A16 BROOKE 7 1.5 5.8 0.0 Toluene 108‐88‐3 80
1210591‐02A SITE B16 BROOKE 7 1.5 5.6 0.0 Toluene 108‐88‐3 80
1210495‐02A SITE B15 BROOKE 7 0.89 3.3 0.0 Toluene 108‐88‐3 80
1210495‐01A SITE A15 BROOKE 7 39 92 0.0 Acetone 67‐64‐1 13000
1210495‐02A SITE B15 BROOKE 7 20 48 0.0 Acetone 67‐64‐1 13000
1210591‐02A SITE B16 BROOKE 7 0.88 3.1 0.0 Hexane 110‐54‐3 600
*NL ‐ not listed by ATSDR

163
APPENDIX C
METEOROLOGY DATA
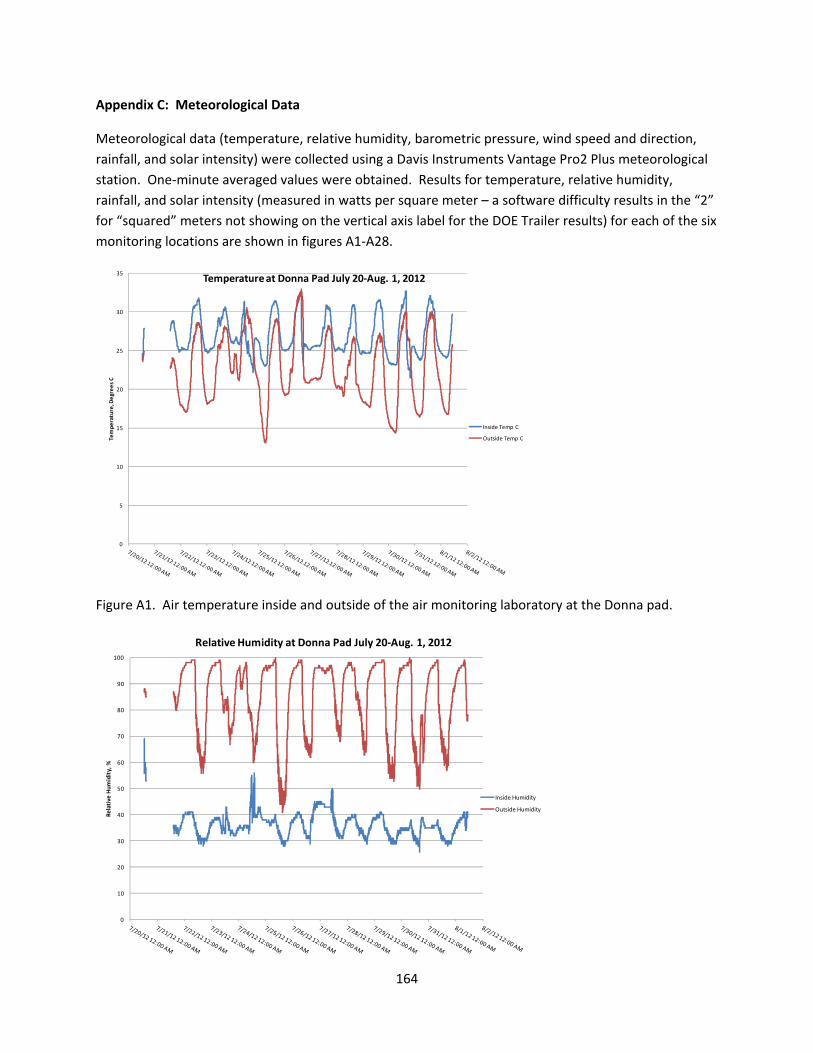
164
Appendix C: Meteorological Data
Meteorological data (temperature, relative humidity, barometric pressure, wind speed and direction,
rainfall, and solar intensity) were collected using a Davis Instruments Vantage Pro2 Plus meteorological
station. One‐minute averaged values were obtained. Results for temperature, relative humidity,
rainfall, and solar intensity (measured in watts per square meter – a software difficulty results in the “2”
for “squared” meters not showing on the vertical axis label for the DOE Trailer results) for each of the six
monitoring locations are shown in figures A1‐A28.
Figure A1. Air temperature inside and outside of the air monitoring laboratory at the Donna pad.
0
5
10
15
20
25
30
35
Temperature, Degrees C
Temperature at Donna Pad July 20‐Aug. 1, 2012
Inside Temp C
Outside Temp C
0
10
20
30
40
50
60
70
80
90
100
Relative
Humidity, %
Relative Humidity at Donna Pad July 20‐Aug. 1, 2012
Inside Humidity
Outside Humidity
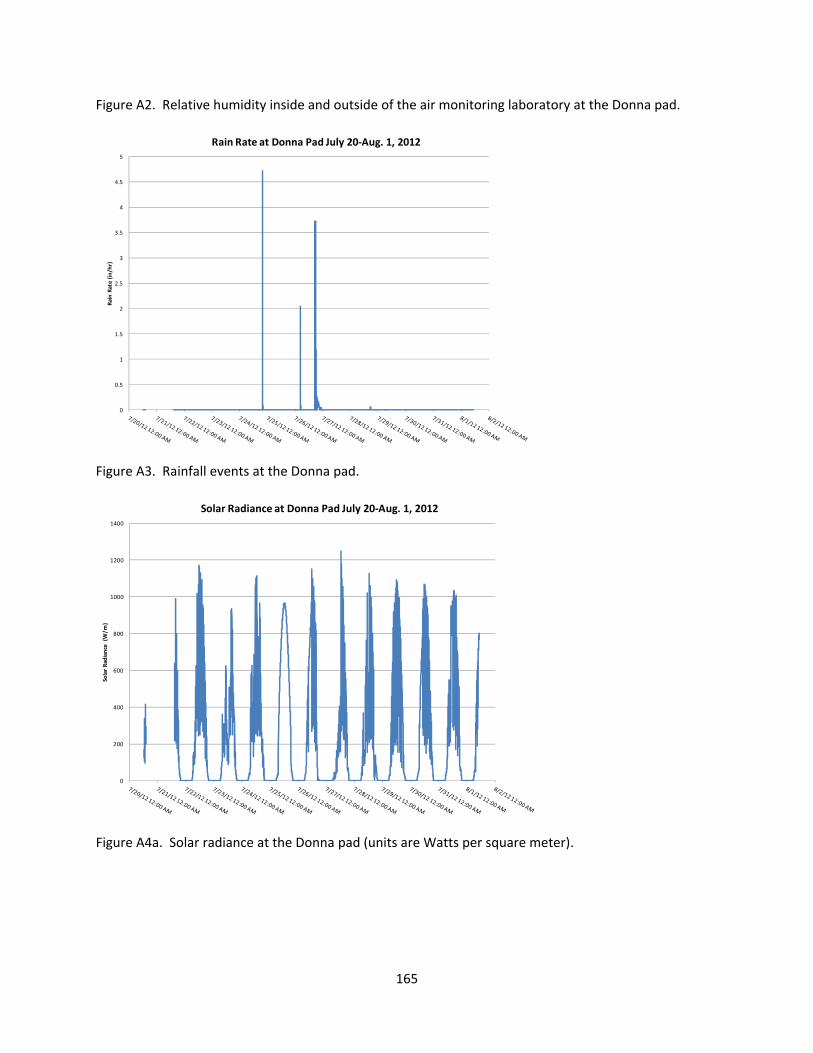
165
Figure A2. Relative humidity inside and outside of the air monitoring laboratory at the Donna pad.
Figure A3. Rainfall events at the Donna pad.
Figure A4a. Solar radiance at the Donna pad (units are Watts per square meter).
0
0.5
1
1.5
2
2.5
3
3.5
4
4.5
5
Rain Rate (in/hr)
Rain Rate at Donna Pad July 20‐Aug. 1, 2012
0
200
400
600
800
1000
1200
1400
Solar Radiance (W/m
)
Solar Radiance at Donna Pad July 20‐Aug. 1, 2012
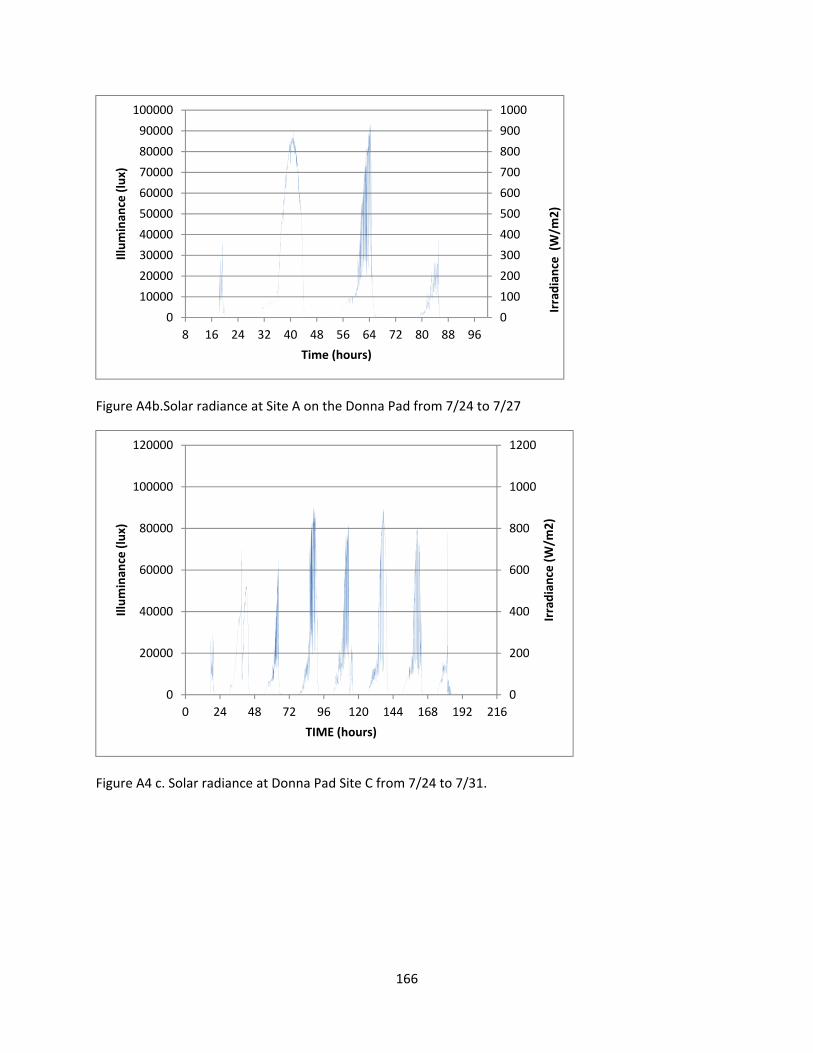
166
Figure A4b.Solar radiance at Site A on the Donna Pad from 7/24 to 7/27
Figure A4 c. Solar radiance at Donna Pad Site C from 7/24 to 7/31.
0
100
200
300
400
500
600
700
800
900
1000
0
10000
20000
30000
40000
50000
60000
70000
80000
90000
100000
8 16 24 32 40 48 56 64 72 80 88 96
Irradiance (W/m
2)
Illuminan
ce (lux)
Time (hours)
0
200
400
600
800
1000
1200
0
20000
40000
60000
80000
100000
120000
0 24 48 72 96 120 144 168 192 216
Irradiance (W/m
2)
Illuminan
ce (lux)
TIME (hours)
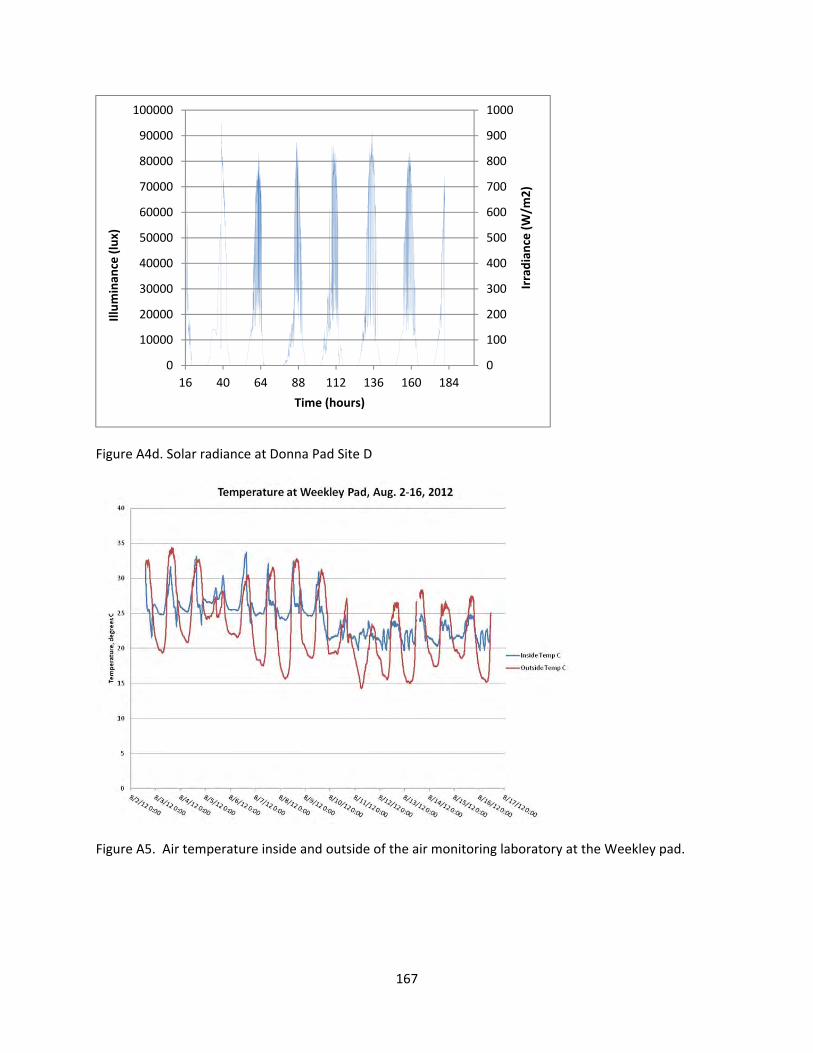
167
Figure A4d. Solar radiance at Donna Pad Site D
Figure A5. Air temperature inside and outside of the air monitoring laboratory at the Weekley pad.
0
100
200
300
400
500
600
700
800
900
1000
0
10000
20000
30000
40000
50000
60000
70000
80000
90000
100000
16 40 64 88 112 136 160 184
Irradiance (W/m
2)
Illuminan
ce (lux)
Time (hours)
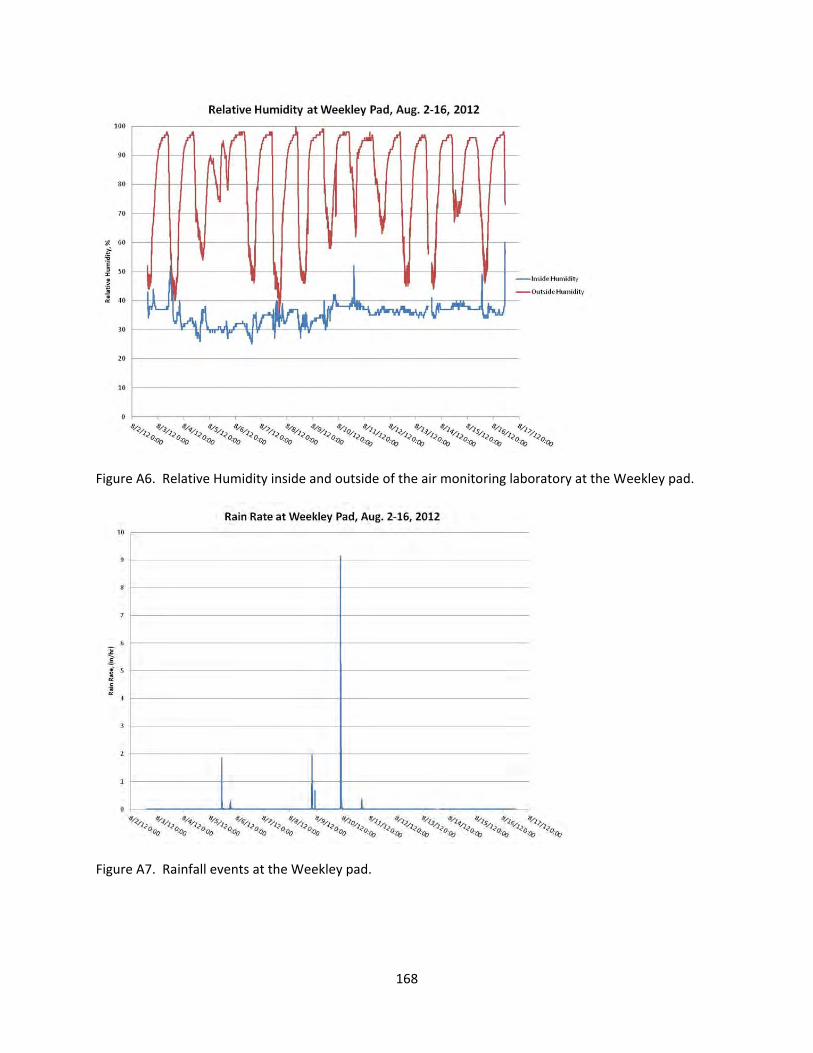
168
Figure A6. Relative Humidity inside and outside of the air monitoring laboratory at the Weekley pad.
Figure A7. Rainfall events at the Weekley pad.

169
Figure A8a. Solar radiance at the Weekley pad at DOE Trailer.
Figure A8b. Solar radiance at the Weekley pad at Site A for 8/6 to 8/12.
0
200
400
600
800
1000
1200
0
20000
40000
60000
80000
100000
120000
0 24 48 72 96 120 144 168
Irradiance (W/m
2)
Illuminan
ce (lux)
TIME (hours)

170
Figure A9. Air temperature inside and outside of the air monitoring laboratory at the Mills‐Wetzel pad.

171
Figure A10. Relative humidity inside and outside of the air monitoring laboratory at the Mills‐Wetzel
pad.
Figure A11. Rainfall events at the Mills‐Wetzel pad.
Figure A12. Solar radiance at the Mills‐Wetzel pad.

172
Figure A12b. Solar radiance at the Mills‐Wetzel pad 2 site C for 8/15 to 8/17.
.
Figure A12c. Solar radiance at the Mills‐Wetzel pad 3 site C for 8/25 to 8/31.
0
200
400
600
800
1000
1200
0
20000
40000
60000
80000
100000
120000
0 8 16 24 32 40 48 56
Irradiance (W/m
2)
Illuminan
ce (lux)
TIME (hours)
0
200
400
600
800
1000
1200
0
20000
40000
60000
80000
100000
120000
0 24 48 72 96 120 144 168 192
Irradiance (W/m
2)
Illuminan
ce(lux)
TIME (hours)

173
Figure A13. Air temperature inside and outside of the air monitoring laboratory for the first two weeks
of monitoring at the Maury pad. The gap in the data was due to a software error.
Figure A14. Air temperature inside and outside of the air monitoring laboratory for the second two
weeks of monitoring at the Maury pad. The gap in the data was due to a software error.

174
Figure A15. Relative humidity inside and outside of the air monitoring laboratory for the first two weeks
of monitoring at the Maury pad. The gap in the data was due to a software error.
Figure A16. Relative humidity inside and outside of the air monitoring laboratory for the second two
weeks of monitoring at the Maury pad. The gap in the data was due to a software error.

175
Figure A17. Rainfall events for the first two weeks of monitoring at the Maury pad. The gap in the data
was due to a software error.
Figure A18. Rainfall events for the second two weeks of monitoring at the Maury pad. The gap in the
data was due to a software error.

176
Figure A19. Solar radiance for the first two weeks of monitoring at the DOE trailer at the Maury pad.
The gap in the data was due to a software error.
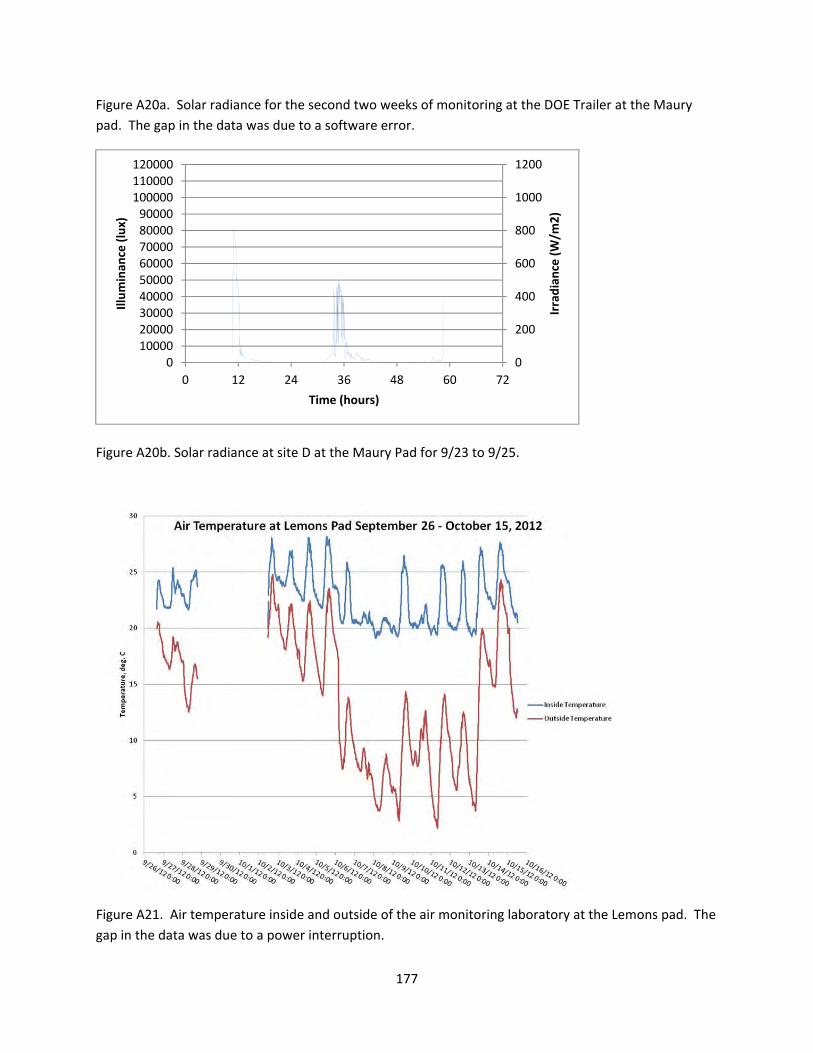
177
Figure A20a. Solar radiance for the second two weeks of monitoring at the DOE Trailer at the Maury
pad. The gap in the data was due to a software error.
Figure A20b. Solar radiance at site D at the Maury Pad for 9/23 to 9/25.
Figure A21. Air temperature inside and outside of the air monitoring laboratory at the Lemons pad. The
gap in the data was due to a power interruption.
0
200
400
600
800
1000
1200
0100002000030000400005000060000700008000090000100000110000120000
0 12 24 36 48 60 72
Irradiance (W/m
2)
Illuminan
ce (lux)
Time (hours)
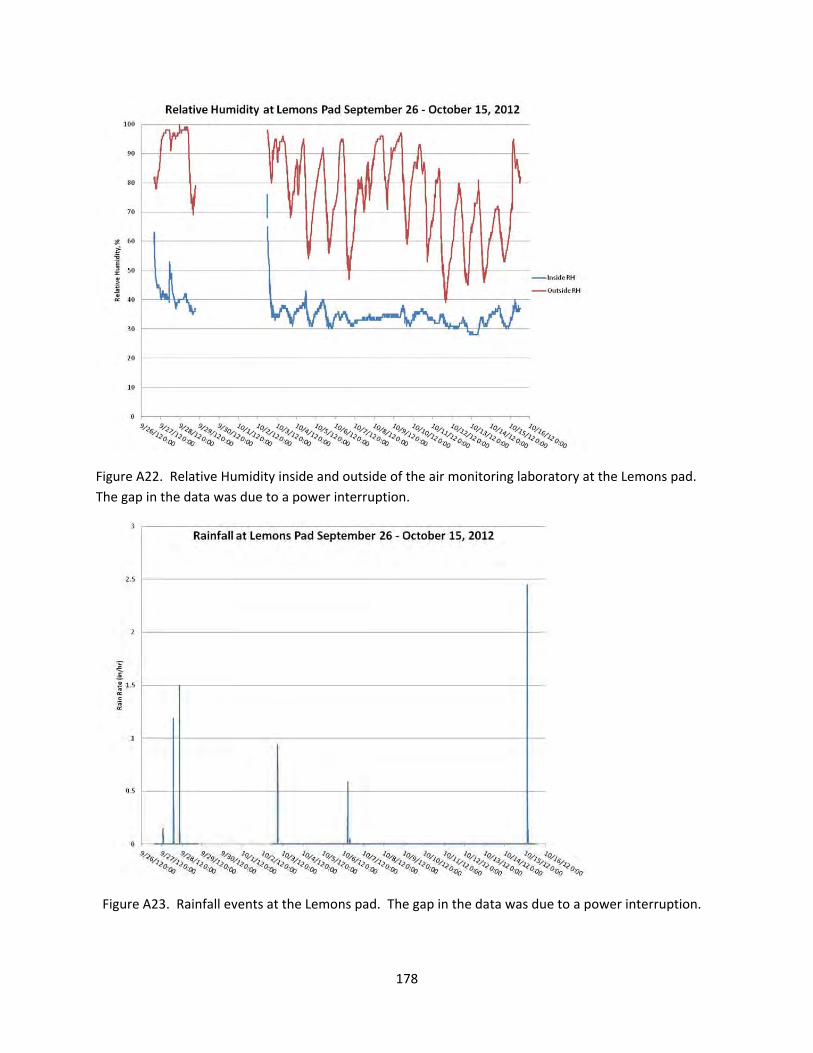
178
Figure A22. Relative Humidity inside and outside of the air monitoring laboratory at the Lemons pad.
The gap in the data was due to a power interruption.
Figure A23. Rainfall events at the Lemons pad. The gap in the data was due to a power interruption.
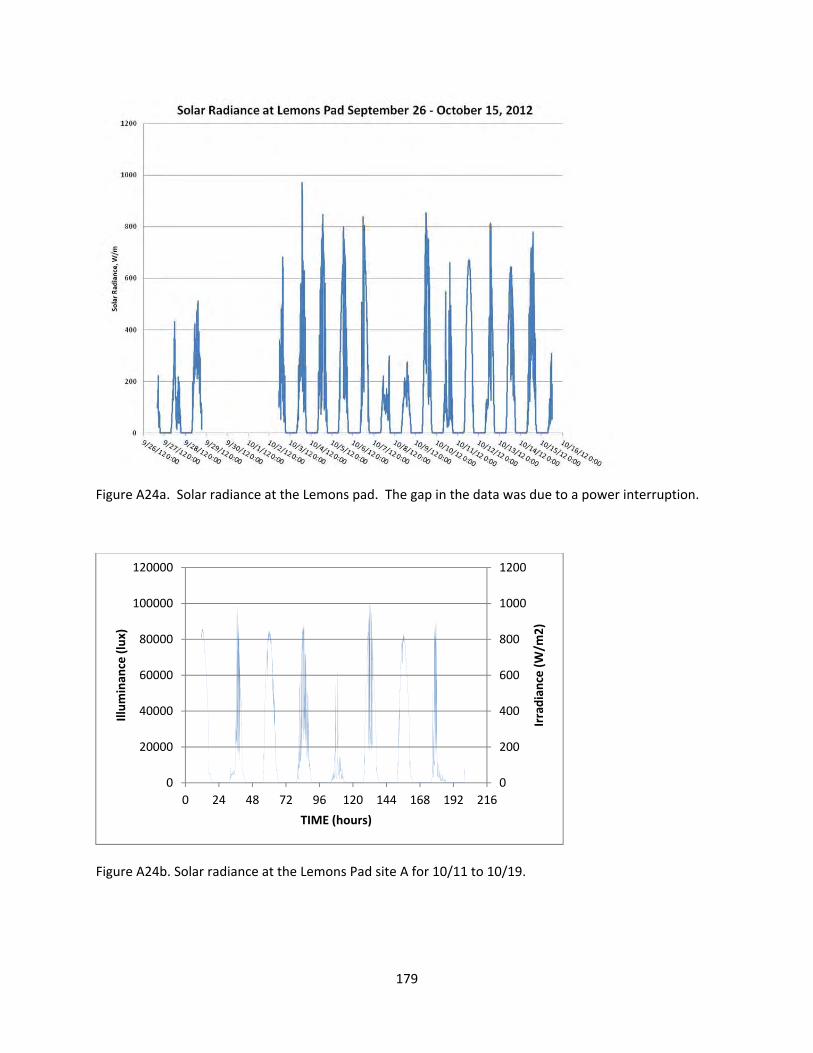
179
Figure A24a. Solar radiance at the Lemons pad. The gap in the data was due to a power interruption.
Figure A24b. Solar radiance at the Lemons Pad site A for 10/11 to 10/19.
0
200
400
600
800
1000
1200
0
20000
40000
60000
80000
100000
120000
0 24 48 72 96 120 144 168 192 216
Irradiance (W/m
2)
Illuminan
ce (lux)
TIME (hours)

180
Figure A20c. Solar radiance at the Lemons Pad Site C from 9/20 to 10/11.
Figure A25. Air temperature inside and outside of the air monitoring laboratory at the WVDNR A pad.
The gap in the data was due to a power interruption.
0
200
400
600
800
1000
1200
0
20000
40000
60000
80000
100000
120000
0 24 48 72 96 120 144 168 192 216 240 264 288 312 336 360 384 408 432 456 480 504 528 552
Irradiance (w/m
2)
Illuminan
ce(lux)
TIME (hours)

181
Figure A26. Relative humidity inside and outside of the air monitoring laboratory at the WVDNR A pad.
The gap in the data was due to a power interruption.
Figure A27. Rainfall events at the WVDNR A pad. The gap in the data was due to a power interruption.

182
Figure A28a. Solar radiance at the WVDNR A pad at the DOE Trailer. The gap in the data was due to a
power interruption.
Figure A28b. Solar radiance at the WV DNR A pad at site A for 10/19 to 10/26.
0
200
400
600
800
1000
1200
0
20000
40000
60000
80000
100000
120000
0 24 48 72 96 120 144
Irradiance (W/m
2)
Illuminan
ce (lux)
TIME (hours)

APPENDIX D
Results From Other Studies
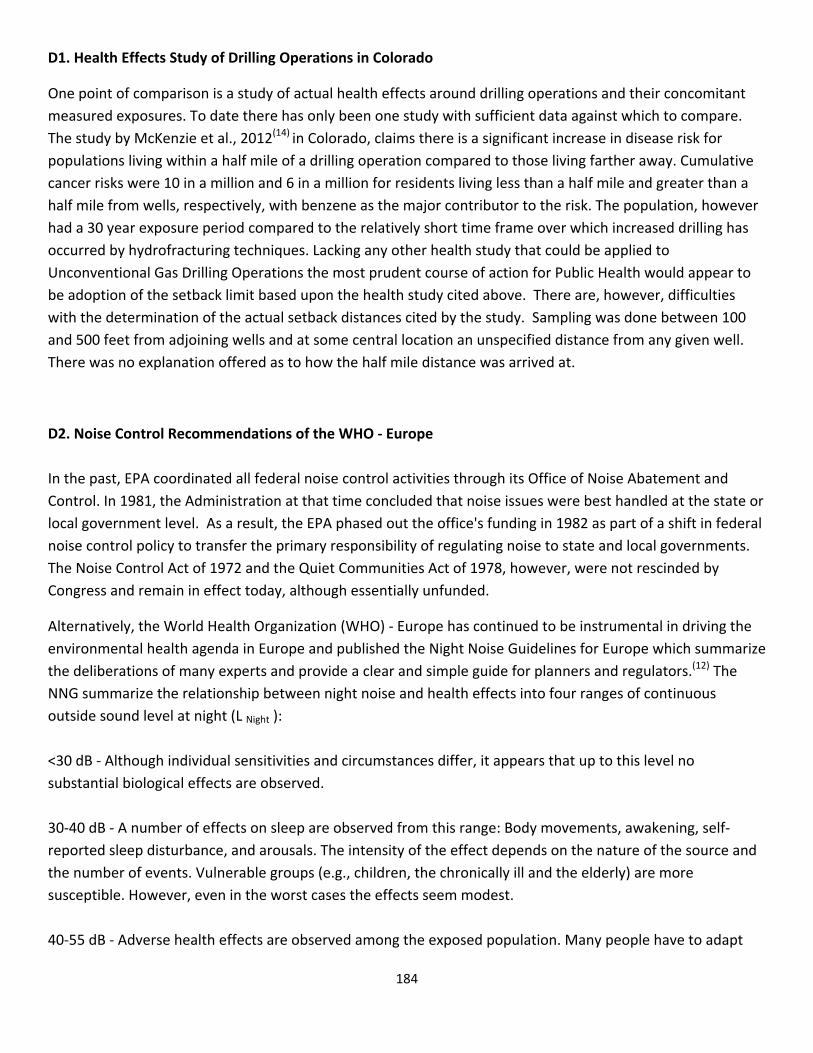
184
D1. Health Effects Study of Drilling Operations in Colorado
One point of comparison is a study of actual health effects around drilling operations and their concomitant
measured exposures. To date there has only been one study with sufficient data against which to compare.
The study by McKenzie et al., 2012(14) in Colorado, claims there is a significant increase in disease risk for
populations living within a half mile of a drilling operation compared to those living farther away. Cumulative
cancer risks were 10 in a million and 6 in a million for residents living less than a half mile and greater than a
half mile from wells, respectively, with benzene as the major contributor to the risk. The population, however
had a 30 year exposure period compared to the relatively short time frame over which increased drilling has
occurred by hydrofracturing techniques. Lacking any other health study that could be applied to
Unconventional Gas Drilling Operations the most prudent course of action for Public Health would appear to
be adoption of the setback limit based upon the health study cited above. There are, however, difficulties
with the determination of the actual setback distances cited by the study. Sampling was done between 100
and 500 feet from adjoining wells and at some central location an unspecified distance from any given well.
There was no explanation offered as to how the half mile distance was arrived at.
D2. Noise Control Recommendations of the WHO ‐ Europe
In the past, EPA coordinated all federal noise control activities through its Office of Noise Abatement and
Control. In 1981, the Administration at that time concluded that noise issues were best handled at the state or
local government level. As a result, the EPA phased out the office's funding in 1982 as part of a shift in federal
noise control policy to transfer the primary responsibility of regulating noise to state and local governments.
The Noise Control Act of 1972 and the Quiet Communities Act of 1978, however, were not rescinded by
Congress and remain in effect today, although essentially unfunded.
Alternatively, the World Health Organization (WHO) ‐ Europe has continued to be instrumental in driving the
environmental health agenda in Europe and published the Night Noise Guidelines for Europe which summarize
the deliberations of many experts and provide a clear and simple guide for planners and regulators.(12) The
NNG summarize the relationship between night noise and health effects into four ranges of continuous
outside sound level at night (L Night ):
<30 dB ‐ Although individual sensitivities and circumstances differ, it appears that up to this level no
substantial biological effects are observed.
30‐40 dB ‐ A number of effects on sleep are observed from this range: Body movements, awakening, self‐
reported sleep disturbance, and arousals. The intensity of the effect depends on the nature of the source and
the number of events. Vulnerable groups (e.g., children, the chronically ill and the elderly) are more
susceptible. However, even in the worst cases the effects seem modest.
40‐55 dB ‐ Adverse health effects are observed among the exposed population. Many people have to adapt

185
their lives to cope with the noise at night. Vulnerable groups are more severely affected.
>55 dB ‐ The situation is considered increasingly dangerous for public health. Adverse health effects occur
frequently, a sizeable proportion of the population is highly annoyed and sleep disturbed. There is evidence
that the risk of cardiovascular disease increases.
More recently, WHO ‐ Europe (2011) has reported on the burden of disease as a result of the growing concern
of the public, environmental health agencies, and policy makers in Europe, in terms of disability‐adjusted life‐
years (DALYs) lost due to environmental noise.(13) The findings suggest that sleep disturbance, due mainly to
road traffic noise, constitutes the heaviest burden followed by annoyance which account for 903 000 and 587
000 DALYs, respectively. The other factors associated with environmental noise are ischemic heart disease (61
000 DALYs), cognitive impairment in children (45 000 DALYs) and tinnitus (22 000 DALYs). The report
concludes with the estimate that at least one million healthy life years are lost every year from traffic related
noise in Western Europe.
D3. Disturbance of Sleep Patterns by Light
Light disturbance of sleep may have similar effects to noise. Individual‐specific doses of light delivered through
closed eyelids have been shown suppress melatonin and phase shift dim light melatonin onset and may be
related to sleep disorders.(16) Melatonin production in humans decreases when people are exposed to light at
night. Since melatonin shows potential oncostatic action in a variety of tumours, it is possible that lowered
serum melatonin levels caused by exposure to light at night enhance the general tumour development.(17)
4. PA DEP Table of HC’s for Drill Sites
The Pennsylvania Department of Environmental Protection reported on VOC concentrations from SUMMA
canister sampling. (5) The compounds that were detected that the PA DEP believed were most likely related to
the Marcellus Shale drilling activities were acetone, benzene, n‐heptane, propene and toluene. Concentrations
of these pollutants were at, or slightly higher than, levels detected in the PA DEP monitoring network sites.
However, none were detected at levels of concern. The table below shows the results of that study.

186
Pennsylvania DEP Analysis of VOC Levels at Pennsylvania Drilling Sites
Concentration (ug/m3)
Compounds MDL
Floren
ce 001
Floren
ce 002
Floren
ce 003
Stewart 0
01
Stewart 0
02
Stewart 0
03
CrossC
reek 0
01
CrossC
reek 0
02
CrossC
reek 0
03
EnergyC
orp 001
EnergyC
orp 002
EnergyC
orp 003
Yeager 001
Yeager 002
Yeager 003
Aren
dtsville
Marcu
s Hook
1,1,1‐Trichloroethane 0.23 ‐‐ ‐‐ ‐‐ ‐‐ ‐‐ ‐‐ ‐‐ ‐‐ ‐‐ ‐‐ ‐‐ ‐‐ ‐‐ ‐‐ ‐‐ ‐‐ ‐‐
1,1,2,2‐Tetrachloroethane 0.462 ‐‐ ‐‐ ‐‐ ‐‐ ‐‐ ‐‐ ‐‐ ‐‐ ‐‐ ‐‐ ‐‐ ‐‐ ‐‐ ‐‐ ‐‐ ‐‐ ‐‐
1,1,2‐Trichloro‐1,2,2‐trifluoroethane 0.194 0.64 0.76 0.72 ‐‐ 0.56 0.75 0.67 0.62 0.64 0.62 0.59 0.69 0.66 0.72 0.77 0.64 0.62
1,1,2‐Trichloroethane 0.132 ‐‐ ‐‐ ‐‐ ‐‐ ‐‐ ‐‐ ‐‐ ‐‐ ‐‐ ‐‐ ‐‐ ‐‐ ‐‐ ‐‐ ‐‐ ‐‐ ‐‐
1,1‐Dichloroethane 0.142 ‐‐ ‐‐ ‐‐ ‐‐ ‐‐ ‐‐ ‐‐ ‐‐ ‐‐ ‐‐ ‐‐ ‐‐ ‐‐ ‐‐ ‐‐ ‐‐ ‐‐
1,1‐Dichloroethene 0.091 ‐‐ ‐‐ ‐‐ ‐‐ ‐‐ ‐‐ ‐‐ ‐‐ ‐‐ ‐‐ ‐‐ ‐‐ ‐‐ ‐‐ ‐‐ ‐‐ ‐‐
1,2,4‐Trichlorobenzene 0.274 1.3 ‐‐ ‐‐ ‐‐ ‐‐ ‐‐ ‐‐ ‐‐ ‐‐ ‐‐ ‐‐ ‐‐ ‐‐ ‐‐ ‐‐ 0.31 0.46
1,2,4‐Trimethylbenzene 0.175 ‐‐ ‐‐ ‐‐ ‐‐ ‐‐ ‐‐ ‐‐ ‐‐ ‐‐ ‐‐ ‐‐ ‐‐ ‐‐ ‐‐ ‐‐ 0.14 0.44
1,2‐Dibromoethane 0.198 ‐‐ ‐‐ ‐‐ ‐‐ ‐‐ ‐‐ ‐‐ ‐‐ ‐‐ ‐‐ ‐‐ ‐‐ ‐‐ ‐‐ ‐‐ ‐‐ ‐‐
1,2‐Dichloro‐1,1,2,2‐tetrafluoroethane
0.184 ‐‐ ‐‐ ‐‐ ‐‐ ‐‐ ‐‐ ‐‐ ‐‐ ‐‐ ‐‐ ‐‐ ‐‐ ‐‐ ‐‐ ‐‐ ‐‐ ‐‐
1,2‐Dichlorobenzene 0.301 ‐‐ ‐‐ ‐‐ ‐‐ ‐‐ ‐‐ ‐‐ ‐‐ ‐‐ ‐‐ ‐‐ ‐‐ ‐‐ ‐‐ ‐‐ ‐‐ ‐‐
1,2‐Dichloroethane 0.101 ‐‐ ‐‐ ‐‐ ‐‐ ‐‐ ‐‐ ‐‐ ‐‐ ‐‐ ‐‐ ‐‐ ‐‐ ‐‐ ‐‐ ‐‐ 0.054 ‐‐
1,2‐Dichloropropane 0.11 ‐‐ ‐‐ ‐‐ ‐‐ ‐‐ ‐‐ ‐‐ ‐‐ ‐‐ ‐‐ ‐‐ ‐‐ ‐‐ ‐‐ ‐‐ 0.076 0.067
1,3,5‐Trimethylbenzene 0.316 ‐‐ ‐‐ ‐‐ ‐‐ ‐‐ ‐‐ ‐‐ ‐‐ ‐‐ ‐‐ ‐‐ ‐‐ ‐‐ ‐‐ ‐‐ ‐‐ 0.16
1,3‐Butadiene 0.362 ‐‐ ‐‐ ‐‐ ‐‐ ‐‐ ‐‐ ‐‐ ‐‐ ‐‐ ‐‐ ‐‐ ‐‐ ‐‐ ‐‐ ‐‐ ‐‐ ‐‐
1,3‐Dichlorobenzene 0.302 ‐‐ ‐‐ ‐‐ ‐‐ ‐‐ ‐‐ ‐‐ ‐‐ ‐‐ ‐‐ ‐‐ ‐‐ ‐‐ ‐‐ ‐‐ ‐‐ ‐‐
1,4‐Dichlorobenzene 0.297 ‐‐ ‐‐ ‐‐ ‐‐ ‐‐ ‐‐ ‐‐ ‐‐ ‐‐ ‐‐ ‐‐ ‐‐ ‐‐ ‐‐ ‐‐ ‐‐ 0.15
1‐Bromopropane 0.108 ‐‐ ‐‐ ‐‐ ‐‐ ‐‐ ‐‐ ‐‐ ‐‐ ‐‐ ‐‐ ‐‐ ‐‐ ‐‐ ‐‐ ‐‐ ‐‐ ‐‐
1‐Ethyl‐4‐methylbenzene 0.238 ‐‐ ‐‐ ‐‐ ‐‐ ‐‐ ‐‐ ‐‐ ‐‐ ‐‐ ‐‐ ‐‐ ‐‐ ‐‐ ‐‐ ‐‐ 0.18 0.17
2‐Butanone (MEK) 0.473 0.83 1.7 1.2 0.91 1.5 1.2 2.8 2 4.1 1.8 ‐‐ 2.2 2.3 2.6 2.1 2.6 2.3
2‐Hexanone 0.606 2.6 ‐‐ ‐‐ ‐‐ ‐‐ ‐‐ 0.7 ‐‐ ‐‐ 1 ‐‐ ‐‐ 1.1 ‐‐ ‐‐ 0.51 0.33
2‐Methoxy‐2‐methylpropane (MTBE) 0.148 ‐‐ ‐‐ ‐‐ ‐‐ ‐‐ ‐‐ ‐‐ ‐‐ ‐‐ ‐‐ ‐‐ ‐‐ ‐‐ ‐‐ ‐‐ ‐‐ ‐‐
4‐Methyl‐2‐pentanone (MIBK) 0.606 3.3 ‐‐ ‐‐ ‐‐ ‐‐ ‐‐ ‐‐ ‐‐ ‐‐ ‐‐ ‐‐ ‐‐ ‐‐ ‐‐ ‐‐ ‐‐ ‐‐
Acetone 0.419 24 17 17 8.8 24 13 ‐‐ 18 11 16 11 40 24 18 31 19 18
Acrolein 0.122 0.41 0.71 0.94 ‐‐ 1.2 ‐‐ ‐‐ 1.5 0.92 0.76 3.7 0.78 1.3 ‐‐ 2.2 2 1.2
Benzene 0.071 0.29 0.3 0.8 0.51 0.35 0.42 0.7 0.64 1.3 0.45 0.35 0.3 0.32 0.48 0.35 0.52 1.7
187
APPENDIX E
SUMMARY OF SETBACK REGULATIONS
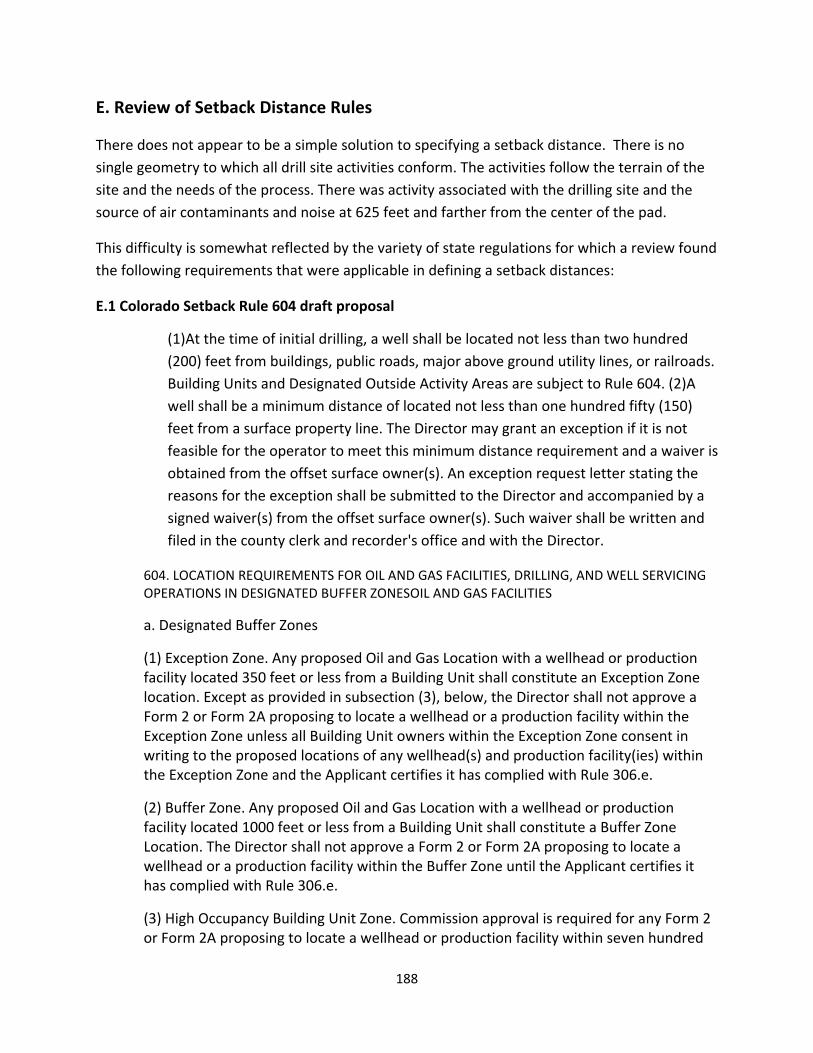
188
E. Review of Setback Distance Rules
There does not appear to be a simple solution to specifying a setback distance. There is no
single geometry to which all drill site activities conform. The activities follow the terrain of the
site and the needs of the process. There was activity associated with the drilling site and the
source of air contaminants and noise at 625 feet and farther from the center of the pad.
This difficulty is somewhat reflected by the variety of state regulations for which a review found
the following requirements that were applicable in defining a setback distances:
E.1 Colorado Setback Rule 604 draft proposal
(1)At the time of initial drilling, a well shall be located not less than two hundred
(200) feet from buildings, public roads, major above ground utility lines, or railroads.
Building Units and Designated Outside Activity Areas are subject to Rule 604. (2)A
well shall be a minimum distance of located not less than one hundred fifty (150)
feet from a surface property line. The Director may grant an exception if it is not
feasible for the operator to meet this minimum distance requirement and a waiver is
obtained from the offset surface owner(s). An exception request letter stating the
reasons for the exception shall be submitted to the Director and accompanied by a
signed waiver(s) from the offset surface owner(s). Such waiver shall be written and
filed in the county clerk and recorder's office and with the Director.
604. LOCATION REQUIREMENTS FOR OIL AND GAS FACILITIES, DRILLING, AND WELL SERVICING OPERATIONS IN DESIGNATED BUFFER ZONESOIL AND GAS FACILITIES
a. Designated Buffer Zones
(1) Exception Zone. Any proposed Oil and Gas Location with a wellhead or production facility located 350 feet or less from a Building Unit shall constitute an Exception Zone location. Except as provided in subsection (3), below, the Director shall not approve a Form 2 or Form 2A proposing to locate a wellhead or a production facility within the Exception Zone unless all Building Unit owners within the Exception Zone consent in writing to the proposed locations of any wellhead(s) and production facility(ies) within the Exception Zone and the Applicant certifies it has complied with Rule 306.e.
(2) Buffer Zone. Any proposed Oil and Gas Location with a wellhead or production facility located 1000 feet or less from a Building Unit shall constitute a Buffer Zone Location. The Director shall not approve a Form 2 or Form 2A proposing to locate a wellhead or a production facility within the Buffer Zone until the Applicant certifies it has complied with Rule 306.e.
(3) High Occupancy Building Unit Zone. Commission approval is required for any Form 2 or Form 2A proposing to locate a wellhead or production facility within seven hundred
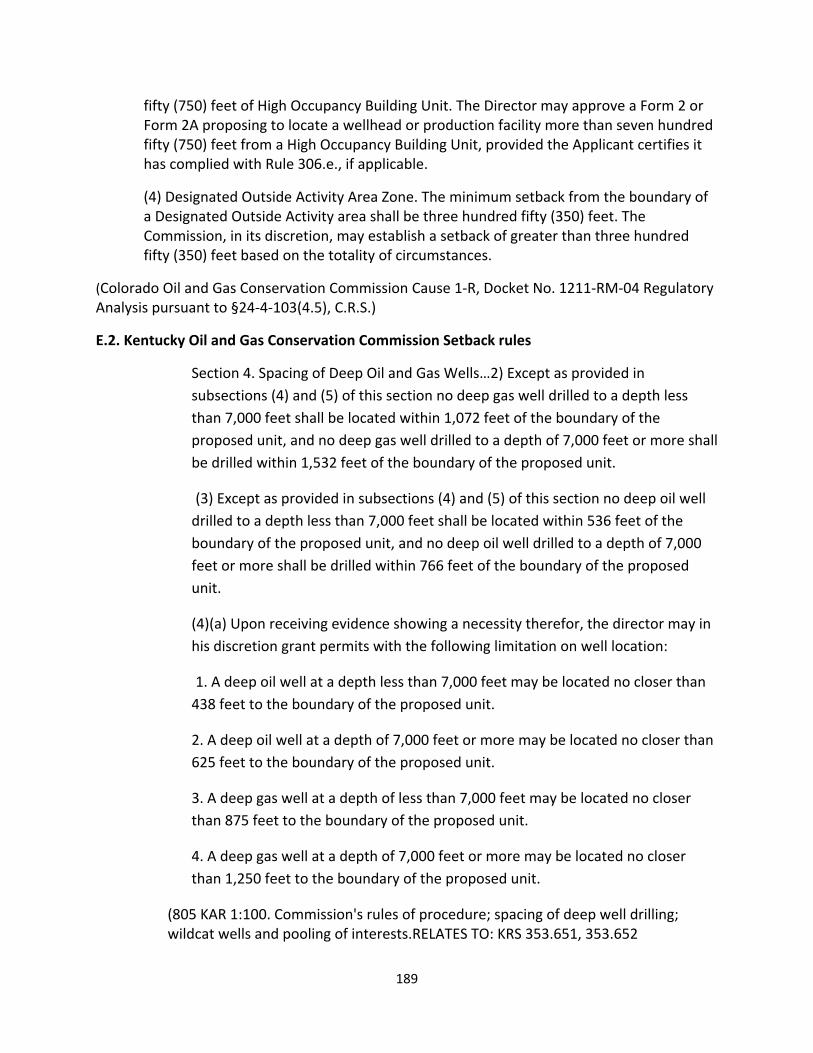
189
fifty (750) feet of High Occupancy Building Unit. The Director may approve a Form 2 or Form 2A proposing to locate a wellhead or production facility more than seven hundred fifty (750) feet from a High Occupancy Building Unit, provided the Applicant certifies it has complied with Rule 306.e., if applicable.
(4) Designated Outside Activity Area Zone. The minimum setback from the boundary of a Designated Outside Activity area shall be three hundred fifty (350) feet. The Commission, in its discretion, may establish a setback of greater than three hundred fifty (350) feet based on the totality of circumstances.
(Colorado Oil and Gas Conservation Commission Cause 1‐R, Docket No. 1211‐RM‐04 Regulatory Analysis pursuant to §24‐4‐103(4.5), C.R.S.)
E.2. Kentucky Oil and Gas Conservation Commission Setback rules
Section 4. Spacing of Deep Oil and Gas Wells…2) Except as provided in
subsections (4) and (5) of this section no deep gas well drilled to a depth less
than 7,000 feet shall be located within 1,072 feet of the boundary of the
proposed unit, and no deep gas well drilled to a depth of 7,000 feet or more shall
be drilled within 1,532 feet of the boundary of the proposed unit.
(3) Except as provided in subsections (4) and (5) of this section no deep oil well
drilled to a depth less than 7,000 feet shall be located within 536 feet of the
boundary of the proposed unit, and no deep oil well drilled to a depth of 7,000
feet or more shall be drilled within 766 feet of the boundary of the proposed
unit.
(4)(a) Upon receiving evidence showing a necessity therefor, the director may in
his discretion grant permits with the following limitation on well location:
1. A deep oil well at a depth less than 7,000 feet may be located no closer than
438 feet to the boundary of the proposed unit.
2. A deep oil well at a depth of 7,000 feet or more may be located no closer than
625 feet to the boundary of the proposed unit.
3. A deep gas well at a depth of less than 7,000 feet may be located no closer
than 875 feet to the boundary of the proposed unit.
4. A deep gas well at a depth of 7,000 feet or more may be located no closer
than 1,250 feet to the boundary of the proposed unit.
(805 KAR 1:100. Commission's rules of procedure; spacing of deep well drilling; wildcat wells and pooling of interests.RELATES TO: KRS 353.651, 353.652
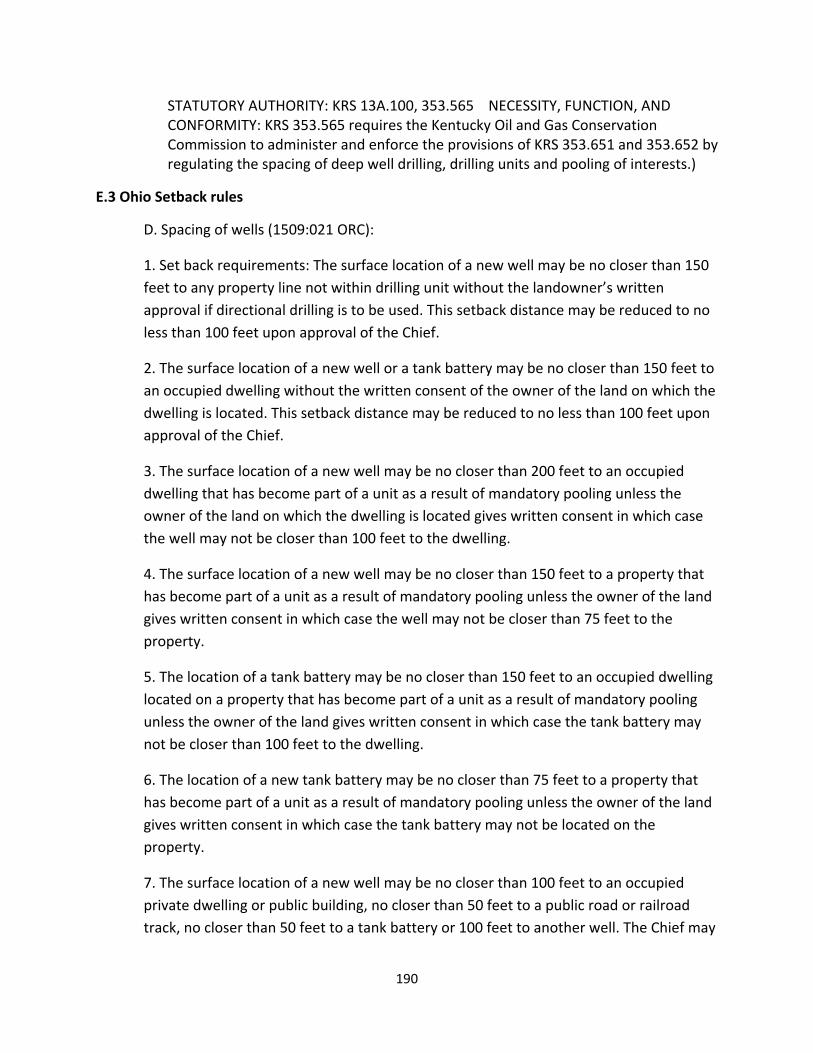
190
STATUTORY AUTHORITY: KRS 13A.100, 353.565 NECESSITY, FUNCTION, AND CONFORMITY: KRS 353.565 requires the Kentucky Oil and Gas Conservation Commission to administer and enforce the provisions of KRS 353.651 and 353.652 by regulating the spacing of deep well drilling, drilling units and pooling of interests.)
E.3 Ohio Setback rules
D. Spacing of wells (1509:021 ORC):
1. Set back requirements: The surface location of a new well may be no closer than 150
feet to any property line not within drilling unit without the landowner’s written
approval if directional drilling is to be used. This setback distance may be reduced to no
less than 100 feet upon approval of the Chief.
2. The surface location of a new well or a tank battery may be no closer than 150 feet to
an occupied dwelling without the written consent of the owner of the land on which the
dwelling is located. This setback distance may be reduced to no less than 100 feet upon
approval of the Chief.
3. The surface location of a new well may be no closer than 200 feet to an occupied
dwelling that has become part of a unit as a result of mandatory pooling unless the
owner of the land on which the dwelling is located gives written consent in which case
the well may not be closer than 100 feet to the dwelling.
4. The surface location of a new well may be no closer than 150 feet to a property that
has become part of a unit as a result of mandatory pooling unless the owner of the land
gives written consent in which case the well may not be closer than 75 feet to the
property.
5. The location of a tank battery may be no closer than 150 feet to an occupied dwelling
located on a property that has become part of a unit as a result of mandatory pooling
unless the owner of the land gives written consent in which case the tank battery may
not be closer than 100 feet to the dwelling.
6. The location of a new tank battery may be no closer than 75 feet to a property that
has become part of a unit as a result of mandatory pooling unless the owner of the land
gives written consent in which case the tank battery may not be located on the
property.
7. The surface location of a new well may be no closer than 100 feet to an occupied
private dwelling or public building, no closer than 50 feet to a public road or railroad
track, no closer than 50 feet to a tank battery or 100 feet to another well. The Chief may
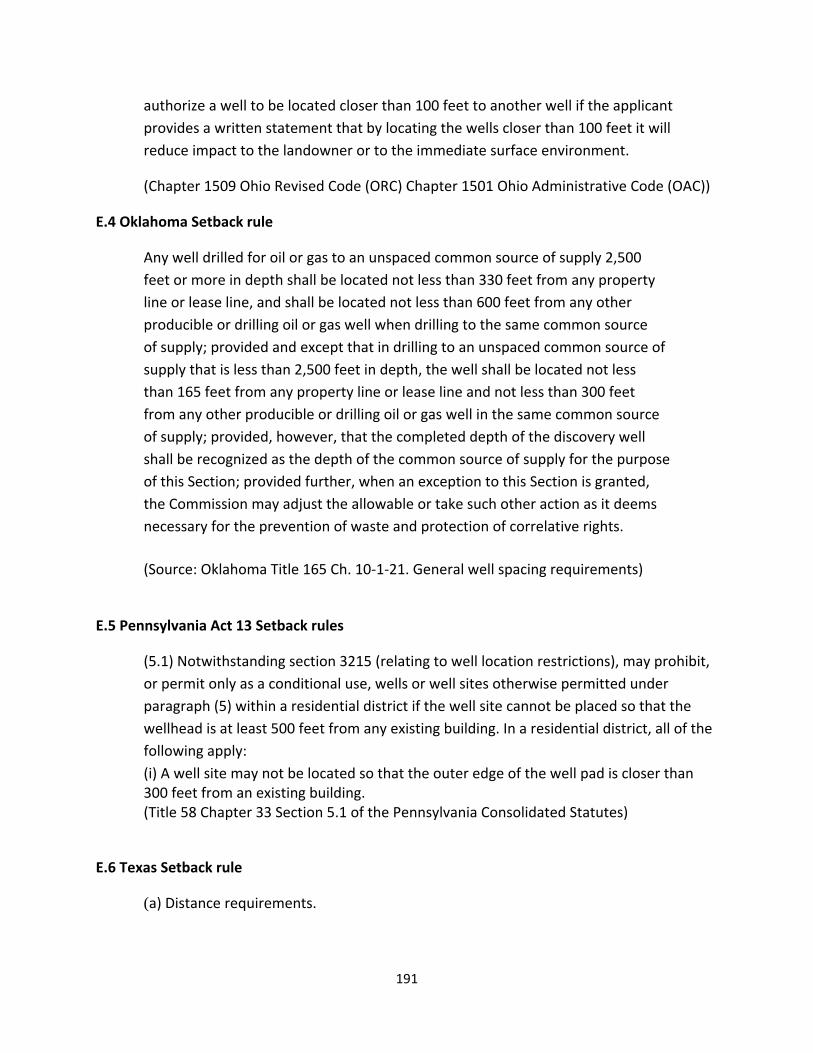
191
authorize a well to be located closer than 100 feet to another well if the applicant
provides a written statement that by locating the wells closer than 100 feet it will
reduce impact to the landowner or to the immediate surface environment.
(Chapter 1509 Ohio Revised Code (ORC) Chapter 1501 Ohio Administrative Code (OAC))
E.4 Oklahoma Setback rule
Any well drilled for oil or gas to an unspaced common source of supply 2,500
feet or more in depth shall be located not less than 330 feet from any property
line or lease line, and shall be located not less than 600 feet from any other
producible or drilling oil or gas well when drilling to the same common source
of supply; provided and except that in drilling to an unspaced common source of
supply that is less than 2,500 feet in depth, the well shall be located not less
than 165 feet from any property line or lease line and not less than 300 feet
from any other producible or drilling oil or gas well in the same common source
of supply; provided, however, that the completed depth of the discovery well
shall be recognized as the depth of the common source of supply for the purpose
of this Section; provided further, when an exception to this Section is granted,
the Commission may adjust the allowable or take such other action as it deems
necessary for the prevention of waste and protection of correlative rights.
(Source: Oklahoma Title 165 Ch. 10‐1‐21. General well spacing requirements)
E.5 Pennsylvania Act 13 Setback rules
(5.1) Notwithstanding section 3215 (relating to well location restrictions), may prohibit,
or permit only as a conditional use, wells or well sites otherwise permitted under
paragraph (5) within a residential district if the well site cannot be placed so that the
wellhead is at least 500 feet from any existing building. In a residential district, all of the
following apply:
(i) A well site may not be located so that the outer edge of the well pad is closer than 300 feet from an existing building. (Title 58 Chapter 33 Section 5.1 of the Pennsylvania Consolidated Statutes)
E.6 Texas Setback rule
(a) Distance requirements.
192
(1) No well for oil, gas, or geothermal resource shall hereafter be drilled nearer
than 1,200 feet to any well completed in or drilling to the same horizon on the same
tract or farm, and no well shall be drilled nearer than 467 feet to any property line,
lease line, or subdivision line; provided the commission, in order to prevent waste or
to prevent the confiscation of property, may grant exceptions to permit drilling
within shorter distances than prescribed in this paragraph when the commission
shall determine that such exceptions are necessary either to prevent waste or to
prevent the confiscation of property.
(Texas Administrative Code TITLE 16 ECONOMIC REGULATION PART 1 RAILROAD
COMMISSION OF TEXAS CHAPTER 3 OIL AND GAS DIVISION RULE §3.37 Statewide
Spacing Rule)
E.7 Wyoming Setback rule
Before drilling commences, approval to construct proper and adequate reserve pits for
the reception and confinement of mud and cuttings and to facilitate the drilling
operation shall be applied for and received in accordance with Chapter 4, Section 1 of
these rules. Special precautions including, but not limited to, an impermeable liner
and/or membrane, monitoring systems, or closed systems, shall be taken, if necessary,
to prevent contamination of streams and potable water and to provide additional
protection to human health and safety in instances where drilling operations are
conducted in close proximity to water supplies, residences, schools, hospitals, or other
structures where people are known to congregate. Pits, wellheads, pumping units,
tanks, and treaters shall be located no closer than three hundred fifty feet (350') from
any of the aforementioned items. The Supervisor may impose greater distances for
good cause and likewise grant exceptions to the 350‐foot rule.
(Wyoming Oil and Gas Conservation Comm’n, Rules and Regulations Ch. 3 § 22(b))
E.8 Other states:
Michigan 300 ft. (well, assoc. surface facilities) Mich. Admin. Code R. 324.502 (2011)
Maryland 1,000 ft. (well). Code Md. Reg. 26.19.01.09 (2011)
New Mexico 500 ft. (temp. pit or below‐grade tank); 500 ft. (permanent pit).
19.15.17.10 NMAC (2011)
New York 500 ft. (well pad). R SGEIS 7.1.11.1 (2011)

193
APPENDIX F
DUST TRACK CORRECTION FACTORS
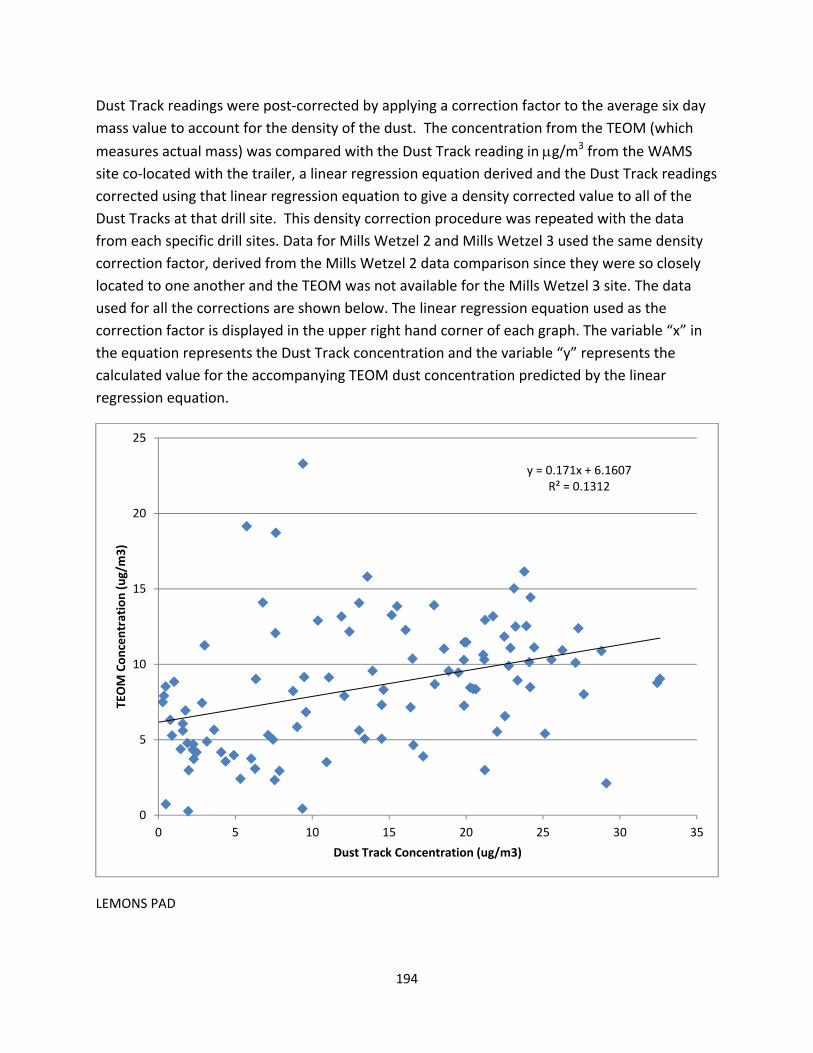
194
Dust Track readings were post‐corrected by applying a correction factor to the average six day
mass value to account for the density of the dust. The concentration from the TEOM (which
measures actual mass) was compared with the Dust Track reading in g/m3 from the WAMS
site co‐located with the trailer, a linear regression equation derived and the Dust Track readings
corrected using that linear regression equation to give a density corrected value to all of the
Dust Tracks at that drill site. This density correction procedure was repeated with the data
from each specific drill sites. Data for Mills Wetzel 2 and Mills Wetzel 3 used the same density
correction factor, derived from the Mills Wetzel 2 data comparison since they were so closely
located to one another and the TEOM was not available for the Mills Wetzel 3 site. The data
used for all the corrections are shown below. The linear regression equation used as the
correction factor is displayed in the upper right hand corner of each graph. The variable “x” in
the equation represents the Dust Track concentration and the variable “y” represents the
calculated value for the accompanying TEOM dust concentration predicted by the linear
regression equation.
LEMONS PAD
y = 0.171x + 6.1607R² = 0.1312
0
5
10
15
20
25
0 5 10 15 20 25 30 35
TEOM Concentration (ug/m3)
Dust Track Concentration (ug/m3)

195
Weekley Pad
y = 0.3074x + 5.6444R² = 0.4508
0
5
10
15
20
25
30
0 10 20 30 40 50 60
TEOM Concentration (ug/m
3)
Dust Track Concentration (ug/m3)

196
Maury Pad
y = 0.2916x + 4.2743R² = 0.2319
0
5
10
15
20
25
0 5 10 15 20 25 30 35 40 45
TEOM Concentration (ug/m3)
Dust Track Concentration (ug/m3)
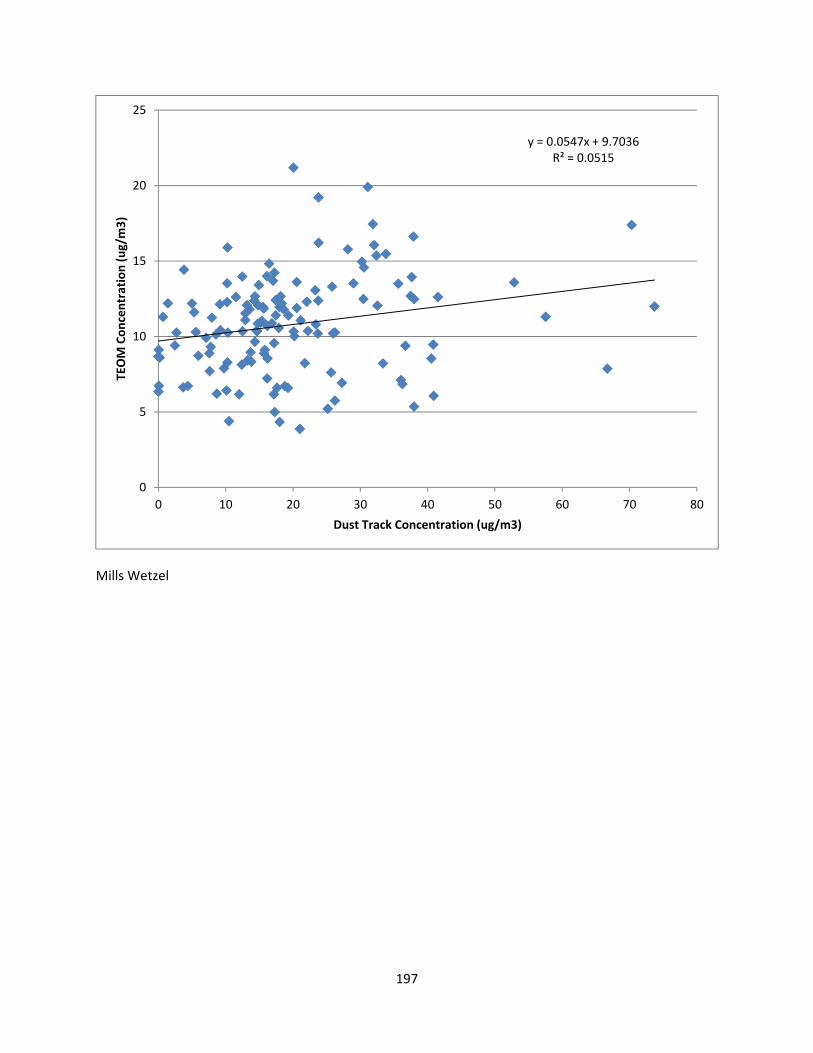
197
Mills Wetzel
y = 0.0547x + 9.7036R² = 0.0515
0
5
10
15
20
25
0 10 20 30 40 50 60 70 80
TEOM Concentration (ug/m3)
Dust Track Concentration (ug/m3)

198
WV DNR A Pad
y = 0.3091x + 2.6387R² = 0.4914
0
5
10
15
20
25
30
0 10 20 30 40 50 60
TEOM Concentration (ug/m3)
Dust Track Concentration (ug/m3)