Air Navigation Report - International Civil Aviation ... 2016_final... · Some 3.5 billion...
20
2016 Edition Air Navigation Report
Transcript of Air Navigation Report - International Civil Aviation ... 2016_final... · Some 3.5 billion...

2016 Edition
Air Navigation Report

2Air Navigation Report 2016 Edition
A Coordinated, Needs-based Approach to Air Navigation EvolutionThe air transport industry plays a major role in world economic activity. One of the key elements to maintaining the vitality of civil aviation is to ensure safe, secure, efficient and environmentally sustainable operations at the global, regional and national levels.
A specialized agency of the United Nations, the International Civil Aviation Organization (ICAO) was created in 1944 to promote the safe and orderly development of international civil aviation throughout the world.
ICAO sets the Standards and Recommended Practices (SARPs) necessary for aviation safety, security, efficiency, economic development and environmental protection on a global basis. ICAO serves as the primary forum for co-operation in all fields of civil aviation among its 191 Member States as well as industry and other aviation partners.
In the context of an assured safety environment aligned with the Global Aviation Safety Plan (GASP), ICAO seeks to ensure the delivery of efficient and comprehensive air navigation services through globally planned initiatives as outlined in the Global Air Navigation Plan (GANP). The Organization works constantly to address the expectations of the aviation community in all key performance areas through the following coordinated activities:
• Policy and Standardization initiatives.• Implementing programmes to address performance issues.• Monitoring of key performance trends and indicators.• Performance Analysis.
The GANP represents a rolling, 15-year strategic methodology which leverages existing technologies and anticipates future developments based on State/industry agreed operational objectives. Its structured approach, organized in blocks of upgrades in non-overlapping six-year time increments starting in 2013 and continuing through 2031 and beyond, provides a basis for sound investment strategies and will generate commitment from States, equipment manufacturers, operators and service providers.
The GANP also explores the need for more integrated aviation planning at both regional and national level and addresses required solutions through the consensus-driven Aviation System Block Upgrade (ASBU) systems engineering modernization strategy.
In all of its coordinated activities, ICAO always strives to achieve a balance between the need for increased capacity and efficiency while maintaining aviation safety and the impact on climate change at an acceptable level.
This report provides updates on air navigation capacity and efficiency indicators, including Performance-based navigation issued in 2015, taking as a benchmark the analysis in the previous report of 2014.

3Air Navigation Report 2016 Edition
© 2016, International Civil Aviation OrganizationPublished in Montréal, Canada International Civil Aviation Organization 999 Boulevard Robert-BourassaMontréal, Quebec, CanadaH3C 5H7
www.icao.int
Disclaimer
This report makes use of information, including air transport and safety related data and statistics, which is furnished to the International Civil Aviation Organization (ICAO) by third parties. All third party content was obtained from sources believed to be reliable and was accurately reproduced in the report at the time of printing. However, ICAO specifically does not make any warranties or representations as to the accuracy, completeness, or timeliness of such information and accepts no liability or responsibility arising from reliance upon or use of the same. The views expressed in this report do not necessarily reflect individual or collective opinions or official positions of ICAO Member States.
All maps rendered in this document are notional, may not reflect actual boundaries agreed by the United Nations and should not be used for navigational purposes.
Note:
All Performance-based navigation indicators trough out the report relate to international aerodromes only, as published in the regional air navigation plans.

4Air Navigation Report 2016 Edition
Contents
Contents
Executive Summary .................................................. 5
Traffic Overview .............................................................. 5
Low-Cost Carrier Activity .................................................. 6
Falling Oil Prices Fuel Positive 2015 Results ....................... 6
Passenger Capacity Boosted ............................................ 6
Air Cargo Still Facing Challenges ....................................... 6
Airline Financial Results ................................................... 6
Regional Targets and Achievements ....................... 7
Regional Dashboards ....................................................... 7
Performance Targets ........................................................ 7
Global Air Navigation Priorities ............................... 8
Performance-Based Navigation (PBN) ............................... 8
Introduction ............................................................... 8
The Status and Targets for PBN Implementation ............ 8
Progress on Achieving PBN Targets .............................. 9
PBN Implementation Plans – Status ........................... 10
PBN Approaches ...................................................... 11
PBN SID/STAR Procedures ........................................ 12
Environmental Gains through PBNTerminal Procedures — CDO and CCO ............................ 13
Next Steps ................................................................... 13
Assistance for Implementation ................................... 13
Enhanced Functionality ............................................. 13
Strategic Development .............................................. 13
Environmental Benefits .......................................... 14
Recent ICAO Developments ................................... 16
Aviation Frequency Spectrum ......................................... 16
Rationalization of Terrestrial Navigation Aids ..................... 16
Amendment 13 to Annex 14 Volume I ............................. 17
Aeronautical Meteorology ............................................... 17
Appendix 1 – Air Navigation Regions ...................... 18

5Air Navigation Report 2016 Edition
Some 3.5 billion passengers used air transport for their business and tourism needs in 2015, according topreliminary figures on scheduled services. The number of annual total passengers carried was up approximately 6.4% compared to 2014. The number of departures reached approximately 34 million globally, and world passenger traffic, expressed in terms of total scheduled revenue passenger-kilometres (RPKs), posted an increase of 6.8% with approximately 6,562 billion RPKs being performed. The aviation industry, composed of some 1,400 commercial airlines, 4,130 airports and 173 air navigation services providers (ANSPs), continued to play a critical role during 2015 in fostering the growth of tourism and trade. Over half of the world’s 1.1 billion tourists are transported by air today, while aircraft carry 35% of world trade by value.
International scheduled passenger traffic expressed in terms of RPKs grew by 6.7% in 2015, up from the 6% recorded in 2014. European traffic increased by 5.5% and accounted for the largest share of international RPKs at 37%. The Asia/Pacific region, meanwhile, had the second largest share with 28% and grew by 8.2%. The Middle East region moved 14% of world RPKs and recorded growth of 12.1% compared to 2014, while North America, also with a 14% RPK share, recorded 3.3% growth. Carriers in Latin America and the Caribbean managed 4% of world RPK traffic and recorded 7.9% growth, and Africa, with a 3% share, grew at a rate of 0.6%. In terms of domestic scheduled air services, overall markets grew by 6.9% in 2015. North America, the world’s largest domestic market with 43% share of the world domestic scheduled traffic, experienced 4.7% growth in 2015. The Asia/Pacific region, which accounted for 39% of world domestic scheduled traffic, grew strongly by 10.3% in 2015 – mainly due to strong double digit growth in India and China.
Executive Summary
Figure 1: International scheduled passenger traffic (RPK) growth in 2015
Preliminary figures covering scheduled commercial services only. Statistics app¬licable to traffic by region of airline domicile.
Traffic Overview
+3.3%
+7.9%
+0.6%
+12.1% +8.2%
+5.5%
WORLD: +6.7%
Executive Summary

6Air Navigation Report 2016 Edition
Executive Summary
Low-cost carriers (LCCs) carried more than 950 million passengers in 2015, approximately 28% of total scheduled passengers. LCCs in Asia/Pacific represented 31% of total LCC passengers carried, followed by Europe with 30% and North America with 26%. The increasing presence of LCCs in emerging economies is considered to have been an important contributing factor to overall growth in passenger traffic.
Despite sluggish economic growth in advanced economies and most emerging markets, global passenger traffic (RPK) growth in 2015 still increased by around one percentage point compared to the previous year. A nearly 40% decline in the average 2015 jet fuel price gave air carriers some flexibility to lower air fares and help stimulate this increase.
Seating capacity offered by the world’s airlines in 2015, expressed in available seat-kilometres (ASKs), increased globally by around 6.1%. While capacity growth ranged from 0.1 % in Africa to 13.8% in the Middle East, the average global passenger load factor improved by 0.5 percentage points over 2014; ranging from 68.9% for Africa to 83.5% for North America. Despite an increase in capacity offered in all regions, continued air carrier optimization resulted in average passenger load factors reaching 80.2% compared to 79.7% in 2014.
World scheduled freight (air cargo) traffic, measured in freight tonne-kilometres (FTKs), grew by 2.2 % in 2015 – less than half of the 4.9% growth rate registered in 2014. This is considered a reflection of the stagnating general economic situation worldwide. The international segment of freight traffic, which represents nearly 87% of total air freight, grew by around 2.9% after registering 5.2% growth in 2014. The scheduled international freight load factor declined from around 50% in 2014 to 47% in 2015, also mirroring generally weak world trade trends. 2015 also saw more and more air carriers improving their cargo capacity utilization by moving higher volumes of freight via passenger aircraft, rather than making use of dedicated freighters.
Fuel accounted for nearly a third of air carrier operating costs in 2014. The significant decline in fuel costs and its positive effects of growth in traffic offset the mixed effects of a strong US dollar on the yields and unit costs of the air carriers. As a result, the airline industry was expected to end 2015 with another record operating profit of around 60 billion US dollars and an operating margin of 7.6%. 2014 had seen an operating profit of 42 billion US dollars and operating margin of 5.5%. More than a third of world airline profits in 2015 were generated by North American carriers. Looking forward to 2016, a further decline expected in oil prices, coupled with an improving economic scenario, should see passenger traffic and profits continue their upward trend.
Low-Cost Carrier Activity Air Cargo Still Facing Challenges
Airline Financial Results
Falling Oil Prices Fuel Positive 2015 Results
Passenger Capacity Boosted

7Air Navigation Report 2016 Edition
Regional Targets and Achievements
Regional Targets and Achievements
The Performance Dashboards present up-to-date regional implementation results, highlighting what States and groups of States are achieving in collaboration with their respective Planning and Implementation Regional Groups (PIRGs). Their ultimate intention is to help motivate aviation groups and stakeholders to continue to participate in and improve upon the applicable cooperative programmes being implemented at the regional level. The dashboards are available on the ICAO public safety and air navigation websites, as well as on each Regional Office website. http://www.icao.int/safety/Pages/Regional-Targets.aspx
In 2013 and 2014, ICAO Member States were invited to adopt regional safety objectives and targets through their respective regional air navigation bodies. As of March 2015, all ICAO air navigation regions had adopted targets through the form of resolutions. These resolutions can be found on the ICAO public safety and air navigation website. http://www.icao.int/safety/Pages/Regional-Targets.aspx#tabs-2
Regional targets were defined for the following priorities:• Implementation of Performance-based Navigation
at international aerodromes (PBN)• Utilisation of Air Traffic Flow Management (ATFM) systems • Implementation of Aeronautical Information Management
(AIM)• Implementation of Ground-Ground Digital Coordination /
Transfer (GGDCT)• Continuous Climb Operations and Continuous Descent
Operations (CCO/CDO)• Fuel savings/CO2 emissions reduction due
to ASBU implementation
The remainder of this report provides details of the levels of implementation for the global air navigation highest priority, PBN, as well as fuel savings/CO2 emissions reduction due to ASBU implementation. This report does not detail the level of implementation of AIM, ATFM and GGDCT due to insufficient data. ICAO has advocated that States take action on achieving the objectives of implementing the priorities of the GANP and providing data to the planning and implementation regional groups (PIRGS) on their progress and status of implementation.
Regional Dashboards Performance Targets
Table 1: Adopted Regional Air Navigation Priorities and Targets
Regional Office Air NavigationAir Nav. Region
AFIESAF
ANS Performance Indicators for Africa (APIRG/19–October 2013)WACAF
MID MID MID Region Air Navigation Strategy (DGCA-MID/3–April 2015)
ASIA/PAC APAC APANPIRG Priorities and Targets (APANPIRG/25–September 2014)
NAMNACC Port-of-Spain Declaration (NACC/DCA/5–April 2014)
CAR
SAM SAM BOGOTA Declaration (RAAC/13–December 2013)
EUR
EUR/NAT
EUR ASBU Implementation Plan (EANPG/55–November 2013)
NAT NAT Service Development Roadmap (NAT-SPG/49–June 2013)

8Air Navigation Report 2016 Edition
Introduction
The GANP identifies PBN as being the global aviation community’s highest air navigation priority. Even before the development of the ASBU modules, ICAO focused its efforts on the development and implementation of PBN at international aerodromes, application of continuous descent operations/continuous climb operations (CDO/CCO) and utilization of air traffic flow management (ATFM) including runway sequencing capabilities (AMAN/DMAN). Supported by the second ICAO High-level Safety Conference (HLSC) in 2015, PBN has also been recognized as a means to help reduce the probability of runway excursions and controlled flight into terrain (CFIT).
The aim of this section is to provide a global update on PBN implementation. ICAO Assembly Resolution A37-11 established specific PBN implementation or performance targets for States to achieve by the end of 2016. This section therefore provides an assessment including trends on the global progress against those targets.
The Status and Targets for PBN Implementation
Implementation of PBN continues to grow throughout the world as a result of ICAO Assembly Resolution A37-11 which resolved that States complete an implementation plan as a matter of urgency to achieve:
1. Implementation of RNAV and RNP Operations (where
required) for en route and terminal areas according to established timelines and intermediate milestones;
2. Implementation of approach procedures with vertical guidance (APV) (Baro-VNAV and/or augmented GNSS), including LNAV-only minima, for all instrument runway ends, either as the primary approach or as a back-up for precision approaches by 2016 with intermediate milestones as follows: 30% by 2010, 70% by 2014; and
3. Implementation of straight-in LNAV-only procedures as an exception to 2) above, for instrument runways at aerodromes where there is no local altimeter setting and where there are no aircraft suitably equipped for APV operations with a maximum certificated take-off mass of 5,700 kg or more.
Global Air Navigation Priorities
Global Air Navigation PrioritiesPerformance-Based Navigation (PBN)
9Air Navigation Report 2016 Edition
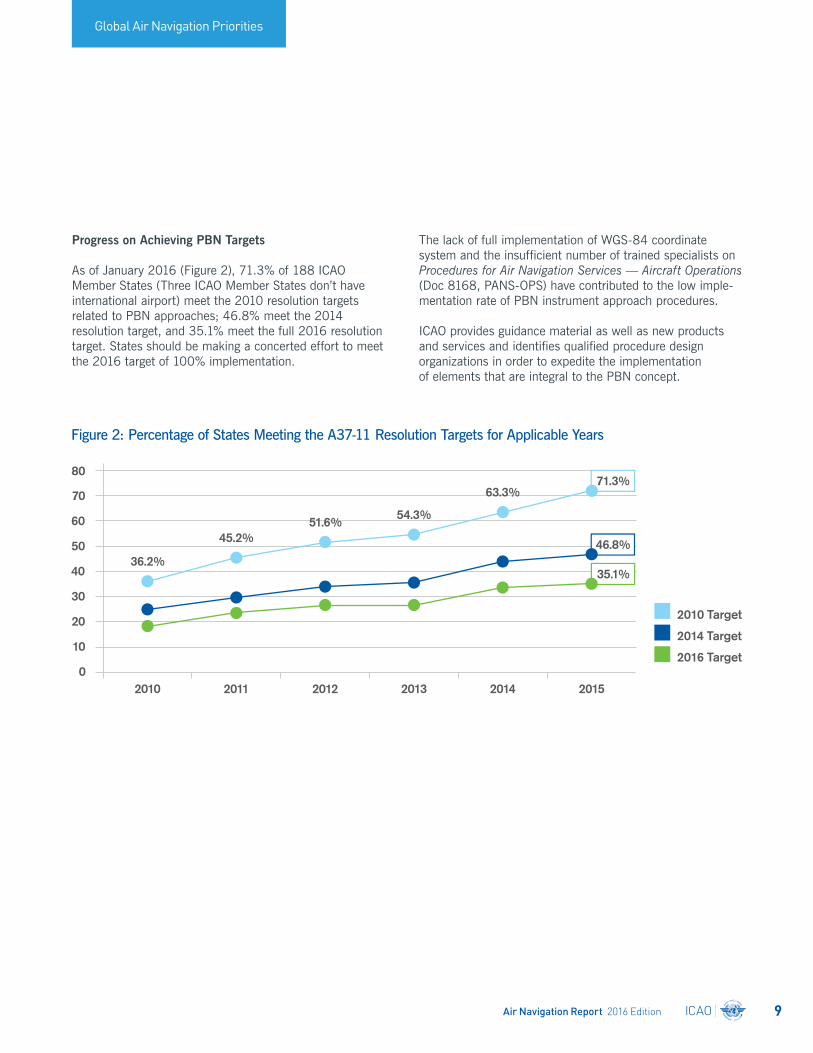
Progress on Achieving PBN Targets
As of January 2016 (Figure 2), 71.3% of 188 ICAO Member States (Three ICAO Member States don’t have international airport) meet the 2010 resolution targets related to PBN approaches; 46.8% meet the 2014 resolution target, and 35.1% meet the full 2016 resolution target. States should be making a concerted effort to meet the 2016 target of 100% implementation.
The lack of full implementation of WGS-84 coordinate system and the insufficient number of trained specialists on Procedures for Air Navigation Services — Aircraft Operations (Doc 8168, PANS-OPS) have contributed to the low imple-mentation rate of PBN instrument approach procedures.
ICAO provides guidance material as well as new products and services and identifies qualified procedure design organizations in order to expedite the implementation of elements that are integral to the PBN concept.
Figure 2: Percentage of States Meeting the A37-11 Resolution Targets for Applicable Years
2010 Target
0
40
20
60
10
50
30
70
80
2010 2011 2012 2013 2014
2016 Target
2014 Target
36.2%
45.2%51.6% 54.3%
63.3%
2015
71.3%
46.8%
35.1%
Global Air Navigation Priorities
10Air Navigation Report 2016 Edition
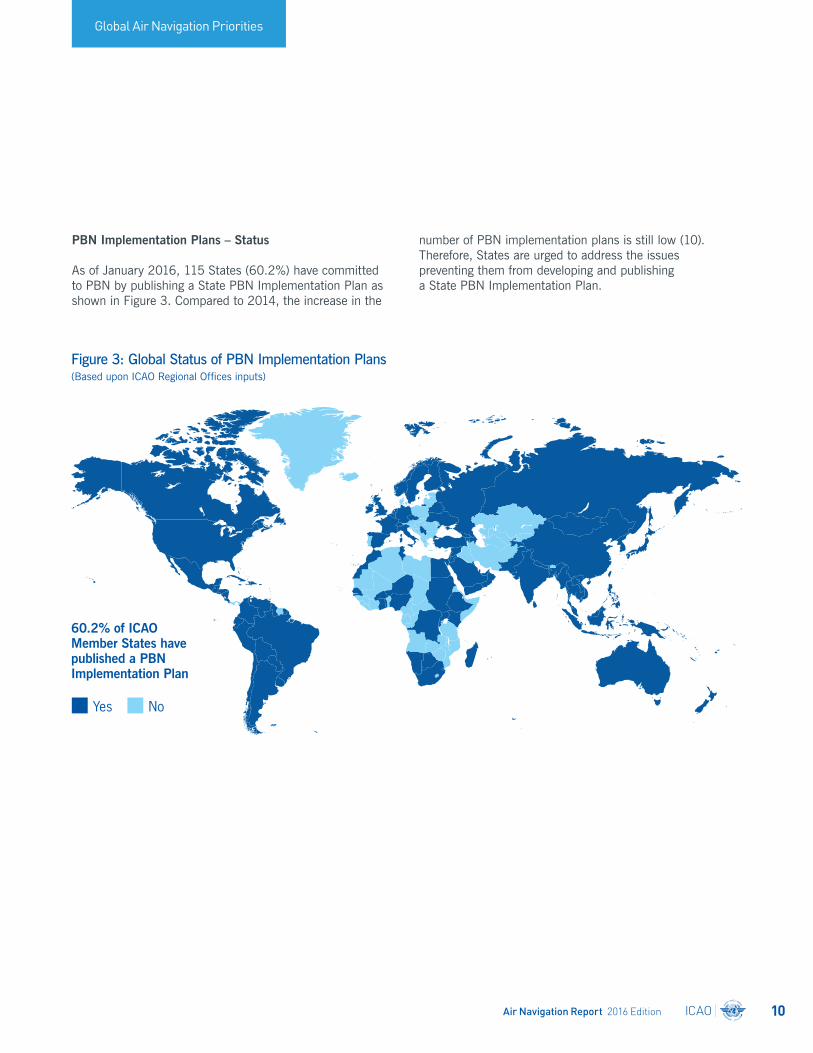
Figure 3: Global Status of PBN Implementation Plans (Based upon ICAO Regional Offices inputs)
Yes No
60.2% of ICAO Member States have published a PBN Implementation Plan
PBN Implementation Plans – Status
As of January 2016, 115 States (60.2%) have committed to PBN by publishing a State PBN Implementation Plan as shown in Figure 3. Compared to 2014, the increase in the
number of PBN implementation plans is still low (10). Therefore, States are urged to address the issues preventing them from developing and publishing a State PBN Implementation Plan.
Global Air Navigation Priorities

11Air Navigation Report 2016 Edition
0
50
25
75
100PBN
UNK
RNP AR
LPV
LNAV/VNAV
LNAV2010 2011 2012 2013 2014 2015
1 The unit of measurement for monitoring implementation is the runway which is defined as “PBN runway” when at least one PBN approach procedure is published.
Figure 4: Global PBN Implementation growth 2010–2015 (% of PBN Runways for the World)
Figure 5: Growth in Global Number of PBN Approaches Employed 2010–2015 (% of PBN Runways for the World)
PBN Approaches
There are various types of PBN instrument approach procedures that can be implemented. The PBN approach procedures considered in this report are those related to runways at International Aerodromes as defined in the ICAO Regional Air Navigation Plans (ANPs).
ICAO’s PBN Concept was introduced through the publication of the ICAO Performance-based Navigation (PBN) Manual (Doc 9613) in 2008. Since then, PBN has been increasingly implemented in the terminal areas in the form of RNP (LNAV, LNAV/VNAV, LPV) or RNP AR approaches1.
As of January 2016, 59.8% of all instrument runways have at least one PBN approach procedure defined (Figure 4), representing an increase of 4 percentage points compared to 2014.
Figure 5 shows that LNAV approach procedures are the ones mostly implemented (50.8%), followed by LNAV/VNAV (39.1%), LPV (25.5%) and RNP AR (11.9%).
Some approach procedures are classified as “unknown” when no information has been provided (6.3%).
Global Air Navigation Priorities
0
50
25
7541.7% 45.5% 49.5% 51.9% 55.8%
2010 2011 2012 2013 2014 2015
59.8%
59.8% (+4%) of all instrument runways have at least one PBN approach procedure
Implementation of all PBN approach types continues to increase
% o
f Ins
trum
ent R
unw
ays
% o
f Ins
trum
ent R
unw
ays

12Air Navigation Report 2016 Edition
Figure 6: PBN SID and STAR Growth 2010–2015 (% of SID/STAR Runways in the World)
PBN SID/STAR Procedures
Establishment of PBN structured arrival and departure flows enables more accurate navigation, allows for more efficient flights and more flexible routing and facilitates improved sequencing resulting in reduced delays.
PBN implementation has been monitored in terms of the growth of PBN Standard Instrument Departures (SIDs) and Standard Terminal Arrival (STARs) procedures at international instrument runways.
As of January 2016, 35.9% of all runways have at least one PBN SID procedure published and 32.8% have a PBN STAR procedure, which increased by 1.9% and 2.6% respectively compared to 2014.
Global Air Navigation Priorities
0
20
10
30
5
25
15
35
40
2010 2011 2012 2013 2014 2015
SID
STAR
35.9%
32.8%
1/3 of all international instrument runways have PBN SID/STAR procedures available
% o
f Ins
trum
ent R
unw
ays
13Air Navigation Report 2016 Edition
Many major airports now employ PBN procedures and, in a large number of cases, judicious design has resulted in significant reductions in environmental impacts. This is particularly the case where the airspace design has supported continuous descent operations (CDO) and continuous climb operations (CCO).
ICAO’s Continuous Descent Operations (CDO) Manual (Doc 9931) and Continuous Climb Operations (CCO) Manual (Doc 9993) provide guidance in the design, implementation and operation of environmentally friendly arrivals and departures. In order for this to be fully implemented, ATM tools and techniques, especially arrival and departure management tools, have to be implemented and/or updated to ensure that arrival and departure flows are smooth and appropriately sequenced.
In line with the continued focus on PBN as the highest priority for Air Navigation, ICAO’s PBN Programme is working to further improve and develop the PBN concept, whilst also assisting States with successful implementation of PBN routes and procedures.
Assistance for Implementation
In light of the importance of PBN, the following have been highlighted by States and the aviation stakeholders as the key areas for ICAO to focus its efforts to ensure effective and coordinated implementation:
• The need for guidance material, workshops and symposia on all aspects of PBN including regulatory oversight issues (as recommended by the High-level Safety Conference in 2015);
• Online learning packages;
• Classroom courses to ensure that PBN requirements and Standards are fully understood and properly implemented;
• Active, coordinated support for continuing development and amendment of Standards;
• Specific products to assist a State with its PBN implementation needs; and
• Assistance to ensure harmonized and integrated implementation of related technologies and support tools to optimize performance capability objectives.
Many such products are now available through the ICAO PBN website and ICAO continues to coordinate with all aviation stakeholders to identify new initiatives, develop more in-depth guidance material and create additional training courses (online and classroom), as required, to support high-level requirements for PBN implementation.
Enhanced Functionality
Several advanced PBN functions and options are being developed which will increase PBN usability in challenging environments, allowing safer access to more airports and improved route efficiencies. Additionally the development of RNP AR (authorization required) Departures will enable PBN departure routes to be developed in more locations, particularly in mountainous terrain, and assist with capacity improvements by enabling parallel runway departures. The focus of all this work is to address all related issues, ensuring a complete deliverable improvement to the end users.
Implementation of PBN in terminal airspace is seen as a key enabler for the advanced terminal operations envisaged by a mature ATM modernization programme and the developments planned for the concept will ensure its widest possible applicability.
Strategic Development
Whilst improving the PBN concept functionality is important, a need has also been identified to develop a long-term strategy which would reduce the number of specifications to a more streamlined set which would still offer full support for all current or planned PBN operations.
Another major initiative in this area relates to the increasing harmonization and standardization of PBN terminology and references across all areas, from operational approvals to chart names. This will improve understanding of the concept and help to drive increased and safer use of PBN worldwide.
Global Air Navigation Priorities
Environmental Gains through PBN Terminal Procedures — CDO and CCO
Next Steps

14Air Navigation Report 2016 Edition
In response to the request from Assembly Resolution A38-18, ICAO’s Committee on Aviation Environmental Protection (CAEP) has undertaken an analysis to understand the range of fuel and CO2 emissions savings that could be delivered from the implementation of Aviation System Block Upgrades (ASBU) Block 0 modules. CAEP has since completed a thorough assessment, following the preliminary analysis the results of which were presented in the 2014 ICAO Air Navigation Report.
As illustrated in the figure 7 below, a phased approach was used to carry out the analysis. Recognizing that many of the ASBU Block 0 modules were designed for purposes other than environmental protection, the first step was to identify those modules with the potential of delivering fuel and CO2 emissions savings. Then, leveraging the results of trials and existing studies, rules of thumb were developed for each of the modules identified. At the same time, ICAO gathered information on the current and planned implementation. Using that information together, global changes in fuel consumption from the implementation of the modules were modelled and the results documented.
For this analysis, 15 modules were identified that deliver fuel and CO2 emissions savings. It was possible to quantify the benefits for 13 of these modules, as shown in Table 2. As a result of this analysis, an update to Guidance on the Development of States’ Action Plans on CO2 Emissions
Reduction Activities (Doc 9988) will be available that will include the indicators developed for estimating the benefits from those modules. This will provide States with a consistent means of estimating the expected results from the implementation of these measures.
Environmental Benefits
Figure 7: ASBU Fuel and CO2 Emissions Savings Analysis Approach
Environmental Benefits
• Identify modules with potential environmental benefit
• Estimate Global Changes in Fuel Consumption
• Document and Communicate results with ICAO Stakeholders
• Create Rules of Thumb for each Module• Identify Current and Planned implementationStep 2
Step 3
Step 4
Step 1

15Air Navigation Report 2016 Edition
Table 2: ASBU Block 0 modules that can reduce fuel consumption and CO2 emissions
Module Title Benefits
B0-CDO Continuous Descent Operations Reduced fuel burn on arrival
B0-FRTO Free Route Operations Reduced in-flight fuel burn
B0-RSEQ Runway Sequencing Reduced airborne holding and taxi-out time
B0-CCO Continuous Climb Operations Reduced fuel burn during climb
B0-NOPS Network Operations Reduced fuel burn in all phases of flight, including taxi
B0-TBO Trajectory Based Operations Reduced in-flight fuel burn
B0-WAKE Wake Turbulence Separation Reduced taxi-out time and reduced in-flight fuel burn
B0-ACDM Airport Collaborative Decision Making Reduced taxi-out time
B0-ASUR Alternative Surveillance Reduced in-flight fuel burn
B0-OPFL Optimum Flight Levels Reduced in-flight fuel burn
B0-APTA Approach procedures including
Reduced fuel burn during arrival, fewer missed approaches vertical guidance
B0-SURF A-SMGCS, ASDE-X Reduced taxi and airborne holding time
B0-AMET Met information supporting enhanced
Reduced fuel burn in all phases operational efficiency
B0-FICE Increased efficiency through ground Reduced in-flight fuel burn
- ground integration (benefits not quantified in the analysis)
B0-DAIM Digital AIM Reduced in-flight fuel burn
(benefits not quantified in the analysis)
Environmental Benefits
A questionnaire was sent to States in order to understand their current status and plans to implement the selected Block 0 modules by 2018. The responses received covered more than 92% of global air traffic movements. Beyond the direct fuel savings offered by the implementation of the modules identified, additional fuel and CO2 emissions are saved as a result of aircraft being able to carry less fuelon-board due to the improved system efficiency.
Based on the implementation data communicated by States, CAEP modelled that, between 2013 and 2018, fuel burn savings are estimated to range between 55 and 107 kg per flight on average across all ICAO regions. This corresponds to a range of 2.48 to 4.87 metric tons in global annual
fuel savings in 2018 as a result of current and planned ASBU Block 0 implementations since 2013, representing 0.62 to 1.31% of fuel savings in 2018. These fuel savings correspond to a global CO2 emissions savings of between 7.8 and 15.4 metric tons and in terms of fuel cost, savings of up to 2.1 billion Euros or 2.3 billion US dollars are possible.
The figures mentioned previously describe the benefits to be achieved based on the planned implementation of ASBU Block 0. If all States were to implement those Block 0 modules that are relevant to their operations, then it is estimated that the theoretical upper bound of fuel burn savings from the global implementation of Block 0 modules between 2013 and 2018 is between 0.8 and 1.6%.

16Air Navigation Report 2016 Edition
The safety of air operation is critically dependent on the availability of reliable communication and navigation services. Current and future communication, navigation and surveillance/air traffic management (CNS/ATM) provisions depend upon continued sufficient availability of radio frequency spectrum that can support the high integrity and availability requirements associated with aeronautical safety systems and demand special conditions to avoid harmful interference to these systems. Spectrum requirements for current and future aeronautical CNS systems are specified in the ICAO Spectrum Strategy.
International provisions for radio frequency spectrum management, set down in the International Telecommunication Union (ITU) Radio Regulations, are updated during World Radiocommunication Conferences (WRCs) held by the ITU every four years. At these conferences, aviation has to compete with a number of other industries that are actively seeking an expansion of the spectrum available to them. This results in an ever-increasing pressure on existing allocations for safety and regularity of flight, and potential risk of interference to the aeronautical services using those allocations.
During WRC-15 in Geneva, Switzerland (2–27 November 2015) positive results were achieved for aviation. The ICAO position was fully satisfied, protecting existing aeronautical safety services and gaining access to spectrum for new services. The essential elements contributing to this successful outcome were the timely coordination of the ICAO position with all ICAO Member States in preparation for the conference, the active participation by ICAO experts in WRC-15 preparatory work of the ITU and regional telecommunication organizations, participation of civil aviation in the delegations of States’ spectrum administrators, and the active participation of the ICAO delegation at the conference itself.
Notable outcomes include: a new frequency allocation for space-based reception of ADS-B, enabling tracking of aircraft globally, including remote and polar regions; full protection of primary surveillance radar spectrum and of the frequency band used by aeronautical radio altimeters; better regulatory protection of Fixed Satellite Service (FSS) VSAT links used in Africa to provide terrestrial aeronautical and meteorological communications networks; new regulatory
spectrum provisions related to the use of FSS spectrum for the command and control link for remotely piloted aircraft; increased regulatory protection for the COSPAS-SARSAT system; a new frequency allocation for wireless avionics intra-communications – a potential enabler for safer and more fuel efficient aircraft designs; and an agenda item for the next conference, WRC-19, supporting the development of the Global Aeronautical Distress and Safety system.
Preparatory activities towards WRC-19 have now started. An ICAO position on the various agenda items to be addressed by WRC-19 will be available in 2017.
Recommendations 1/8 (rationalization of radio systems) and 6/10 (rationalization of terrestrial navigation aids) made by the 12th Air Navigation Conference at the ICAO HQ (19-30 November 2012), called for ICAO and States to explore opportunities for realizing economic benefits through the reduction of the number of terrestrial navigation aids in the framework of global implementation of GNSS operations, while at the same time ensuring that an adequate terrestrial navigation infrastructure remains available to mitigate the potential loss of GNSS services.
To assist the implementation of the recommendations, in 2015 ICAO completed the development of guidance material outlining a strategy for the rationalization of conventional navigation infrastructure and for its future evolution. The material will be included as a new attachment to Annex 10, Volume I. It is based on practical experience with the navigation facility rationalization efforts that are currently ongoing in a number of States in several ICAO Regions. It provides general guidance, including specific considerations regarding different types of navigation aids, and defines a practical strategy for the rationalization of navigation aids and for a coordinated evolution towards the provision of a terrestrial navigation infrastructure serving as a back-up to GNSS, taking into account the need to consult aircraft operators and international organizations, and to ensure safety, efficiency and cost-effectiveness of any rationalization effort.
Recent ICAO DevelopmentsAviation Frequency Spectrum
Recent ICAO Developments
Rationalization of Terrestrial Navigation Aids

17Air Navigation Report 2016 Edition
Specifically, the strategy recognizes that NDB (Non Directional Beacons) serve essentially no role in modern navigation operations and should be rationalized accordingly by replacing them with RNAV waypoints, except where no other alternative is available due to constraints in user fleet, financial terrain or safety limitations. Similarly, it calls for a rationalization of VOR facilities. As part of the rationalization, no new standalone VOR facilities should be implemented and existing facilities should be gradually withdrawn, except where required to provide a GNSS back-up function and to support some residual operational purposes. The strategy also stresses the need to align rationalization planning with equipment lifecycles and the PBN implementation planning process. It recognizes the central role of DME/DME navigation as the most suitable terrestrial navigation capability, providing adequate redundant capability to GNSS for most applications, to be further evolved to fill coverage gaps as operationally useful and provide a navigation infrastructure complementary to GNSS. At the same time, the strategy takes into account the fact that in some cases there may be a need to provide a residual capability based on VOR (or VOR/DME if possible) to cater to airspace users not equipped with suitable DME/DME avionics, where required. At the regional level, the availability of the global strategy will enable each region to develop a rationalization strategy consistent with the GANP.
The ICAO Council recently adopted a number of proposals constituting Amendment 13 to Annex 14 — Aerodromes, Volume I — Aerodrome Design and Operations that are aimed at improving capacity and efficiency at aerodromes. Among the proposals that will have a positive impact on air navigation are those that permit reduced taxiway separation distances. These are expected to significantly improve efficiency and reduce construction costs for many airports in different parts of the world. It may enable additional taxi routes at an airport with important efficiency gains. According to Airport Council International (ACI) one large airport estimates time savings due to elimination of restrictions on Code F taxi routes at around three minutes per A380 movement. With regards to construction costs for reconfigurations of taxiways and aprons, three large
airports estimate a combined total cost reduction of over 500 million US dollars. While these figures are for particular airports and may not be typical, they are indicative of very substantial savings to the industry. In the longer run, for development of new areas of airports, reduced taxiway separations would optimize the use of available ground surfaces. The construction cost savings are estimated at around 2 to 4% in the case of a new development to code F infrastructure standards.
The provision of meteorological information has taken another step towards integration into a system-wide information management environment as a part of Amendment 77 to Annex 3 — Meteorological Service for International Air Navigation which will become applicable in November 2016. This amendment means that the digital exchange of METAR/SPECI, TAF and SIGMET will now be a recommended practice for all States and that advisories for tropical cyclones and volcanic ash as well as AIRMET information will all now be integrated.
Further enhancements have been made to the provision of the World Area Forecast System (WAFS) with the inclusion of digital information on cumulonimbus clouds, icing and turbulence as well as the introduction of additional forecast levels, in particular at cruise levels.
Another landmark has been passed with the imminent cessation of the SADIS satellite broadcast system for the dissemination of meteorological information which is being superseded by the already established Internet-based services.
Recent ICAO Developments
Amendment 13 to Annex 14 Volume I
Aeronautical Meteorology

18Air Navigation Report 2016 Edition
Air Navigation Regions
For air navigation purposes, ICAO Member States are grouped by air navigation region. The region to which each State belongs to is listed below. Some States may however have flight information regions in multiple regions.
Appendix 1
Appendix 1
AN Region-NAT only
AN Region-NAM only
AN Region-CAR only
AN Region-SAM only
AN Region-MID only
AN Region-EUR only
AN Region-AFI only
AN Region-ASIA/PAC only

19Air Navigation Report 2016 Edition
Appendix 1
African (AFI) Region (48 States)
Angola, Benin, Botswana, Burkina Faso, Burundi, Cameroon, Cape Verde, Central African Republic, Chad, Comoros, Djibouti, Equatorial Guinea, Eritrea, Ethiopia, Gabon, Gambia, Ghana, Guinea, Guinea-Bissau, Kenya, Lesotho, Liberia, Madagascar, Malawi, Mali, Mauritania, Mauritius, Mozambique, Namibia, Niger, Nigeria, Rwanda, Sao Tome and Principe, Senegal, Seychelles, Sierra Leone, Somalia, South Africa, Swaziland, Togo, Uganda, Zambia, Zimbabwe, South Sudan, United Republic of Tanzania, Democratic Republic of the Congo, Cote d’Ivoire, Congo
Asia-Pacific (ASIA/PAC) Region (38 States)
Afghanistan, Bangladesh, Bhutan, Brunei Darussalam, Cambodia, China, Democratic People’s Republic of Korea, India, Indonesia, Japan, Lao People’s Democratic Republic, Malaysia, Maldives, Mongolia, Myanmar, Nepal, Pakistan, Philippines, Republic of Korea, Singapore, Sri Lanka, Thailand, Timor-Leste, Viet Nam, Australia, Cook Islands, Fiji, Kiribati, Marshall Islands, Micronesia (Federated States of), Nauru, New Zealand, Palau, Papua New Guinea, Samoa, Solomon Islands, Tonga, Vanuatu
Caribbean (CAR) Region (19 States)
Antigua and Barbuda, Bahamas, Barbados, Costa Rica, Cuba, Belize, Dominican Republic, El Salvador, Grenada, Guatemala, Haiti, Honduras, Jamaica, Mexico, Nicaragua, Saint Kitts and Nevis, Saint Lucia, Saint Vincent and the Grenadines, Trinidad and Tobago
European (EUR) Region (55 States)
Armenia, Azerbaijan, Georgia, Kazakhstan, Kyrgyzstan, Tajikistan, Turkey, Turkmenistan, Uzbekistan, Cyprus, Israel, Belarus, Belgium, Croatia, Czech Republic, Denmark, Estonia, Finland, France, Germany, Greece, Italy, Latvia, Lithuania, Luxembourg, Netherlands, Norway, Portugal, Spain, Sweden, Switzerland, Ukraine, Russian Federation, United Kingdom of Great Britain and Northern Ireland, Albania, Andorra, Austria, Bosnia and Herzegovina, Bulgaria, Hungary, Ireland, Malta, Monaco, Montenegro, Poland, Republic of Moldova, Romania, San Marino, Serbia, Slovakia, Slovenia, The former Yugoslav Republic of Macedonia, Algeria, Morocco, Tunisia
Middle-East (MID) Region (15 States)
Bahrain, Iraq, Jordan, Kuwait, Lebanon, Oman, Qatar, Saudi Arabia, Syrian Arab Republic, United Arab Emirates, Yemen, Iran (Islamic Republic of), Egypt, Libya, Sudan
North-American (NAM) Region (2 States)
Canada, United States of America
North-Atlantic (NAT) Region (1 State)
Iceland
South-American (SAM) Region (13 States)
Argentina, Brazil, Chile, Colombia, Ecuador, Guyana, Panama, Paraguay, Peru, Suriname, Uruguay, Venezuela (Bolivarian Republic of), Bolivia (Plurinational State of)
www.icao.int
International Civil Aviation Organization999 Boulevard Robert-BourassaMontréal, QC, CanadaH3C 5H7
Tel.: +1 (514) 954-8219Fax: +1 (514) 954-6077Email: [email protected]