Case Study Analysis of the Impacts of Water Acquisition for ...
Air Impacts of Increased Natural Gas Acquisition, Processing, andUse: A Critical ReviewChristopher W. Moore,*,† Barbara Zielinska,† Gabrielle Pet́ron,‡,§ and Robert B. Jackson∥,⊥
†Desert Research Institute, Division of Atmospheric Sciences, Reno, Nevada 89512, United States‡Cooperative Institute for Research in Environmental Sciences, University of Colorado Boulder, Boulder, Colorado 80309, UnitedStates§Earth System Research Laboratory, National Oceanic and Atmospheric Administration, Boulder, Colorado 80305, United States∥School of Earth Sciences, Woods Institute for the Environment, and Precourt Institute for Energy, Stanford University, Stanford,California 94305, United States⊥Duke University, Nicholas School of the Environment and Center on Global Change, Durham, North Carolina 27708, United States
ABSTRACT: During the past decade, technological advancements in theUnited States and Canada have led to rapid and intensive development ofmany unconventional natural gas plays (e.g., shale gas, tight sand gas, coal-bedmethane), raising concerns about environmental impacts. Here, we summarizethe current understanding of local and regional air quality impacts of naturalgas extraction, production, and use. Air emissions from the natural gas life cycleinclude greenhouse gases, ozone precursors (volatile organic compounds andnitrogen oxides), air toxics, and particulates. National and state regulatorsprimarily use generic emission inventories to assess the climate, air quality, andhealth impacts of natural gas systems. These inventories rely on limited,incomplete, and sometimes outdated emission factors and activity data, basedon few measurements. We discuss case studies for specific air impacts groupedby natural gas life cycle segment, summarize the potential benefits of usingnatural gas over other fossil fuels, and examine national and state emission regulations pertaining to natural gas systems. Finally,we highlight specific gaps in scientific knowledge and suggest that substantial additional measurements of air emissions from thenatural gas life cycle are essential to understanding the impacts and benefits of this resource.
■ INTRODUCTION
Natural gas currently accounts for 26% of primary energyconsumption in the U.S., compared to 20% for coal and 36%for petroleum and other liquids.1 Although the percentage ofU.S. energy obtained from natural gas is expected to risemodestly to 28% during the next 30 years, the production ofnatural gas is expected to increase to the point where the U.S.will be a net exporter of natural gas by 2020.1 A decrease inconventional on-shore gas production since the 1980s has beenthe impetus in the U.S. for developing unconventional naturalgas plays (areas targeted for exploration and production) thathave low permeabilitysuch as sandstones (tight-sand gas),shales (shale gas), and coal (coal-bed methane).1 Between 2000and 2011, the share of U.S. natural gas production fromunconventional formations increased from 31% to 67% and isexpected to reach 80% by 2040.1 In particular, annual shale gasproduction is expected to double from 7.9 trillion cubic feet(Tcf) in 2011 to 16.7 Tcf by 2040.1
Between 2000 and 2011, the number of producing gas wellsin the U.S. increased by 50%,2 reaching 514 637. This surge inexploration and production from unconventional sources hasbeen accompanied by public concerns about various environ-mental issuesincluding air quality, water quantity and quality,
and human health impacts.3−9 Moreover, with this fast-movingindustry, scientists have been struggling to obtain adequatefunding and data access for research studies, and regulatorshave been grappling with the development of new rules andpolicies along with limited resources for enforcement duringthe surge in drilling.7,10,11 Decision and rule making at the stateand national levels in the U.S. have been informed in part bylimited, out of date, and sometimes incomplete emissioninventories11 and self-reported industry data. Further con-founding the ability to adequately assess the industry’senvironmental impacts are a number of other factors including(1) a lack of independent field measurements to evaluateassumptions, quantify risks, and assess actual impacts; (2)contradictory scientific results; and (3) polarizing political andsociological dichotomies (i.e., jobs vs environmental steward-ship).
Special Issue: Understanding the Risks of Unconventional Shale GasDevelopment
Received: November 30, 2013Revised: February 25, 2014Accepted: March 3, 2014
Critical Review
pubs.acs.org/est
© XXXX American Chemical Society A dx.doi.org/10.1021/es4053472 | Environ. Sci. Technol. XXXX, XXX, XXX−XXX

To lay the foundation for a clear, concise discussion of theissues, we begin by defining a consistent vocabulary.Unconventional oil and natural gas development in general isoften referred to as “fracking”.12,13 Instead, we separate theprocess of drilling, often undertaken 1−2 km horizontally andkilometers underground, from the more scientifically accurateterm “hydraulic fracturing”, which describes the process offracturing low permeability rocks using water mixed with sandand proprietary chemicals pumped into the borehole underhigh pressure.7,12,14 Hydraulic fracturing originated in the1940s, but the pressures and volumes used today are muchhigher than in the past. The process of hydraulic fracturingtypically lasts only a few days to a few weeks.15,16 Bothunconventional and conventional natural gas wells typicallyproduce commercially for a few decades.17 Therefore, a trueevaluation of the air quality impacts of natural gas productionand use must expand to all areas of the natural gas life cycle.Throughout this critical review, we will refer to five stages of
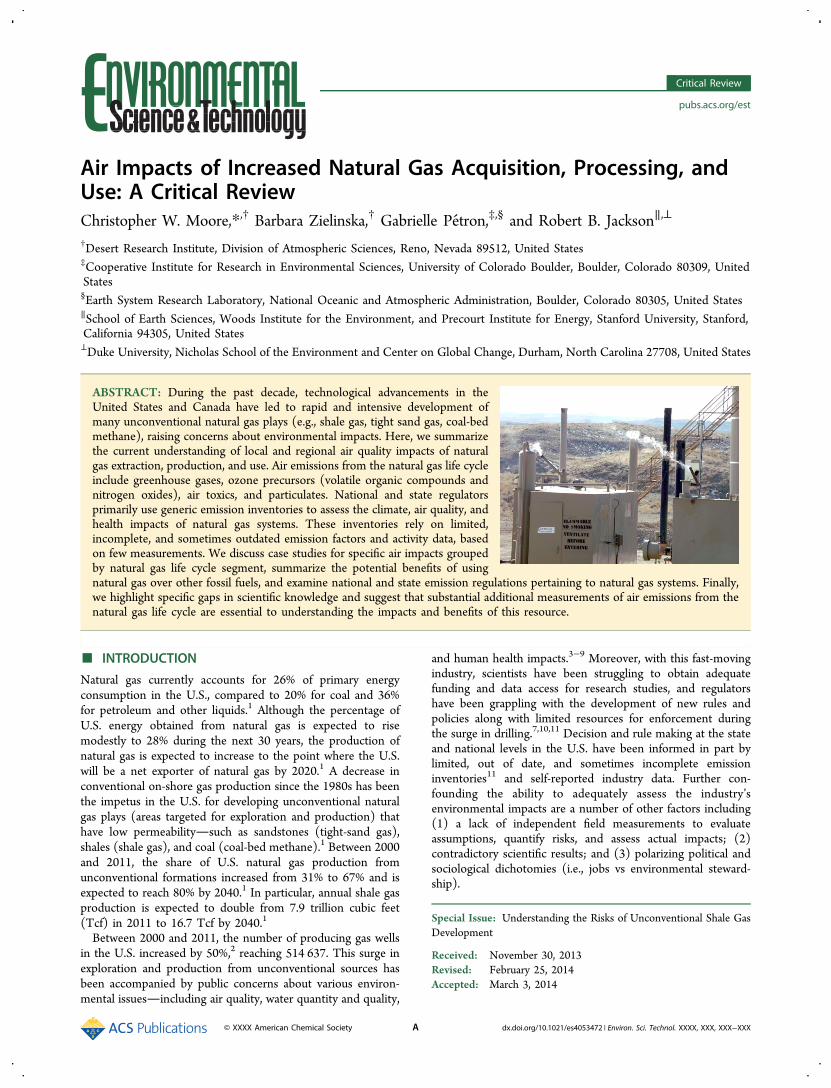
the natural gas life cycle using the terminology of Branosky etal.:18 (1) preproduction; (2) natural gas production; (3) naturalgas transmission, storage, and distribution; (4) natural gas end-use; and (5) well production end-of-life (Figure 1). In terms ofthe life cycle, unconventional natural gas differs fromconventional natural gas in three main ways. First, extractionof unconventional natural gas often requires directional orhorizontal drilling. Second, well-completion (hydraulic fractur-ing) procedures for unconventional natural gas are much moreextensive than for conventional wells. Third, unconventionalnatural gas wells typically have a sharper production declinecurve and a less well constrained total volume of natural gasrecovered per well (based on both economical and practicalconstraints).19,20 Once out of the ground, however, unconven-tional natural gas is subject to the same fate (e.g., processing,transport, end-use) as conventional natural gas, and theatmospheric impacts are indistinguishable between the twoforms.Much of the earlier scientific work on unconventional natural
gas has focused on evaluating the potential climate impacts andbenefits of developing unconventional natural gas reservoirsand switching from coal or oil burning to using natural gas.21
These studies typically focus on climate forcing impacts and
their conclusions range from small benefits (<6% greenhousegas reduction) for the switch to unconventional fromconventional natural gas, to potentially large benefits (>30%greenhouse gas reduction) for the switch to natural gas overcoal22 for power generation. The air-quality benefits ofswitching from coal to natural gas are extensive for pollutantssuch as mercury and sulfur dioxide (SO2). These benefits maybe less so for nitrogen oxides (NOx), important ozoneprecursors for which life cycle emissions appear to be similarfor natural gas and coal23,24 unless natural gas combined-cycle(use of two heat engines) technology is used to generateelectricity.25
When possible, we will distinguish between conventional andunconventional natural gas in this review, which is organizedinto five sections. In the first section, we present a review ofstudies on methane (CH4) leakage from the entire natural gaslife cycle. The second section includes a synthesis of availablestudies on the non-methane air quality impacts of natural gas,which include emissions of the hazardous air pollutantsbenzene; toluene; ethylbenzene; and xylenes (BTEX); othernon-methane volatile organic compounds (NMVOCs) andNOx, both precursors of surface ozone; and particulate matter.We summarize the current understanding of the benefits andimpacts of switching from coal or oil to gas in the third section.In the final two sections, we discuss current air emissionregulations at the state and national levels and identify key areasfor future research on the air quality impacts of unconventionalnatural gas.
■ ESTIMATES OF LIFE CYCLE METHANE LEAKAGEFROM NATURAL GAS
As the primary chemical constituent of natural gas (70−90% byvolume for raw natural gas from the well and >90% by volumefor pipeline quality natural gas),26,27 CH4 can alter globalatmospheric chemistry and is a powerful greenhouse gas.28
Combined, natural gas systems are the highest emitters of CH4of any anthropogenic sector in the U.S.30 and may be partiallyresponsible for a renewed increase in global CH4 levels since2006.28,31 CH4 is an important atmospheric constituent in thatit has been shown to influence background ozone concen-trations at the Earth’s surface,32 although it reacts very slowly in
Figure 1. Potential species emitted to the atmosphere during specific stages of the natural gas life cycle.
Environmental Science & Technology Critical Review
dx.doi.org/10.1021/es4053472 | Environ. Sci. Technol. XXXX, XXX, XXX−XXXB

the lower atmosphere (8−9 year global average lifetime). TheFifth Assessment of the Intergovernmental Panel on ClimateChange (IPCC) estimates that CH4 has a global warmingpotential 28−34 times that of CO2 over a 100-year time frameand 84−86 times greater on a 20-year time frame.33 Surfacelevel CH4 in the global atmosphere is about 1.8 ppm, making itthe second largest contributor (after CO2) to the total directradiative forcing due to long-lived greenhouse gases.34
Raw natural gas produced from wells distributed across abasin is gathered via a network of pipelines and compressorstations. It then is processed at centralized plants to removecontaminants, such as water and acids, and to separate CH4from natural gas liquids and condensate or oil. Processednatural gas that enters the pipeline distribution network forconsumers is comprised primarily of CH4 and ethane (C2H6),with the addition of an odorant, mercaptan, to help customersdetect leaks in their homes or neighborhoods. C2H6 is left inthe natural gas stream, at typically ∼5%, to maintain theminimum energy content of the gas. Its lifetime in theatmosphere is much shorter than that of CH4, typically only afew months.Each year since 1998,35 the U.S. Environmental Protection
Agency (US EPA) has released an updated national inventory(NI) of greenhouse gas (GHG) sources and sinks andsubmitted it to the United Nations Framework Conventionon Climate Change. National estimates for CH4 emissions fromnatural gas systems are modeled and calculated annually from1990 to two years prior to the release year based on 80 differentemission factors (emissions per unit process or component)determined from direct measurements made at ∼200 sites inthe early 1990s.11,30,36 Additional emissions or activity data forthe estimates are supplied by states and the industry.37,38
Uncertainties in this inventory approach are illustrated by aseries of methodological changes that US EPA implementedduring the past four years to estimate CH4 emissions fromnatural gas systems30,39 (Figure 2). Based on the US EPAapproach, leakage estimates for natural gas across the entire lifecycle ranged from as high as 2.8% of domestic natural gasproduction (2011 and 2012 GHG NI releases) to as low as1.65% in the 2013 US EPA GHG NI release (6.9 million metrictons lost out of 418 million metric tons CH4 produced
29). This
range in values is important because an analysis by Alvarez etal.40 concluded that CH4 leakage of 3.2% or less would provideimmediate net climate benefits for electricity production fromnatural gas compared to coal.Two recent scientific studies have found that U.S. total CH4
emissions are underestimated in current inventories.41,42 Milleret al.41 published a top-down estimate of CH4 emissions in theU.S. based on long-term aircraft and tower observationsconducted by U.S. government laboratories (National Oceanicand Atmospheric Administration and Department of Energy)in 2007 and 2008. The authors concluded that the US EPAinventory underestimated CH4 anthropogenic emissions by∼50%. Brandt et al.42 reached a similar conclusion of ∼50%underestimation by US EPA based on a meta-analysis ofpublished results. Based in part on the distribution of emissionsexcess observed especially in the southern U.S. and on thecontent of propane in the air, both studies suggest that some ofthe missing emissions in the inventory could be explained bylarger emissions from oil and gas production and processing.A few regional atmospheric studies in the U.S. have shown
elevated levels of methane and other hydrocarbons in oil andgas producing regions.43−45 Karion et al.45 estimated that 8.9%± 2.8% of the methane produced in the Uintah Basin gas fieldof Utah was lost to the atmosphere based on airbornemeasurements on one day in 2012. This is more than twice theaverage loss rate estimated by Pet́ron et al.44 (average, 4%;range, 2.3−7.7%) for an oil and gas field in northeasternColorado in 2008, based on a mix of methane and propanetower and ground-based measurements and inventory data.Recent emission factors derived by Allen et al.15 for three
natural gas production source categories (gas well completionflowbacks, production site equipment leaks, and venting ofpneumatic pumps and controllers) suggest that average CH4emissions for well completions using reduced-emissionsflowback procedures are less than estimated in the US EPAinventory. The study, however, found higher emissions onaverage from pneumatic devices and pumps and production siteleaks than assumed in the US EPA GHG NI. The directemission measurements conducted by Allen et al.15 at 190onshore production sitesin partnership with operatorsinfour different U.S. regions were averaged and extrapolated tothe national level for comparison with the US EPA GHG NI. Atthe national level, they estimated that 0.42% of natural gas grossproduction leaked to the atmosphere, which is lower than inthe 2013 US EPA GHG NI estimate for 2011 (0.49%).Transmission, storage, and distribution of natural gas
includes hundreds of thousands of kilometers of pipeline,> 1400 compressor stations, and approximately 3.5 Tcf(∼equivalent to two months of national consumption) ofunderground storage throughout the U.S.46 According to the2013 US EPA inventory, transmission is the stage of the naturalgas life cycle with the highest emission of CH4. Emissionsduring transmission, storage, and distribution are mainly limitedto fugitive CH4 (and, to a lesser extent, C2H6) emissions froman aging natural gas pipeline infrastructure and venting duringpipeline and compressor station maintenance. A few studieshave focused on methane leakage from the natural gasdistribution network across cities such as Los Angeles,California,47 Boston, Massachusetts,48 and Washington, DC.49
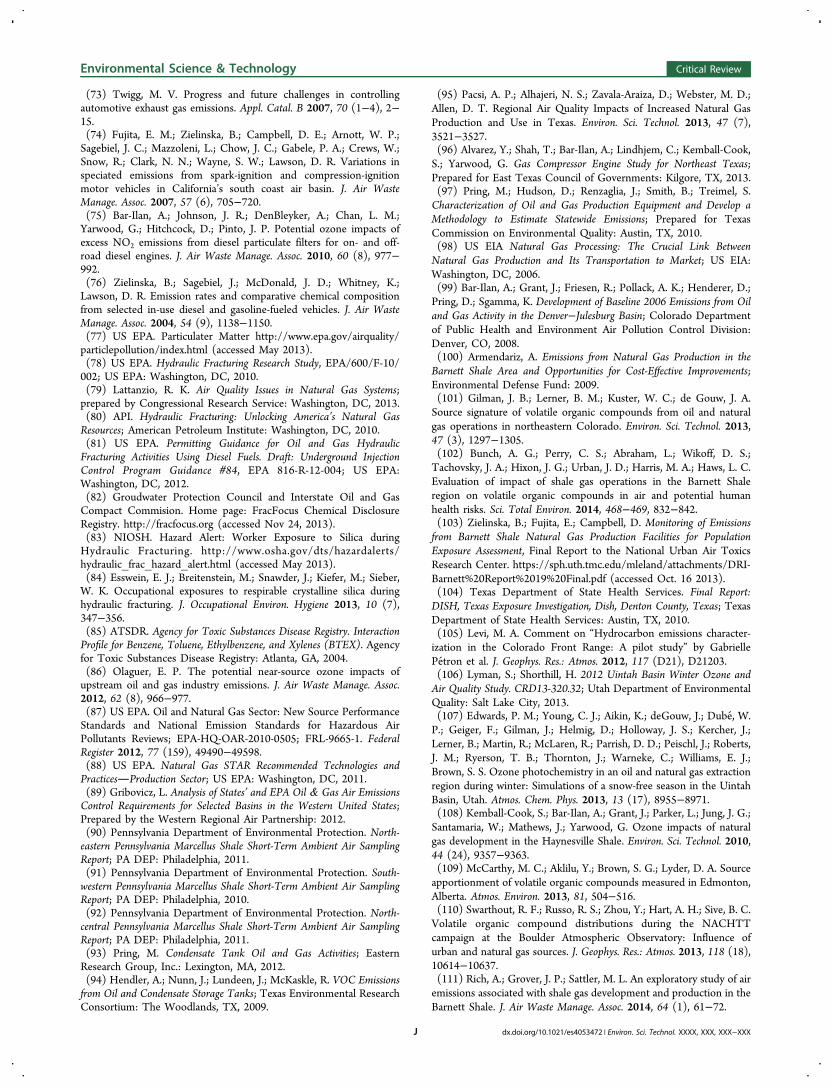
For example, Phillips et al.48 mapped ∼3400 natural gasdistribution pipeline leaks across Boston’s 800 road miles in2011. An example of these leaks is shown in Figure 3 whereconcentrations of methane as high as 28.5 ppm (compared to a
Figure 2. U.S. natural gas systems methane emission estimates from1990 to present based on the 2010, 2011, 2012, and 2013 releases ofthe US EPA GHG NI.
Environmental Science & Technology Critical Review
dx.doi.org/10.1021/es4053472 | Environ. Sci. Technol. XXXX, XXX, XXX−XXXC

global background of 1.8 ppm28) were measured. The presenceof older cast-iron distribution mains was the strongest predictorfor the leaks that they observed (r2 = 0.79, P < 0.00148).The US EPA CH4 leakage rates for distribution alone are in
the range 0.35−0.70%.50,51 Lelieveld et al.52 combined lossestimates for storage and distribution together to suggest anoverall average loss rate of 1.4% (with a range from 1.0% to2.5%). Based on additional data from Texas and elsewhere,Howarth et al.53 assumed a higher range of values, from 1.4% to3.6% leakage of CH4 during transmission, storage, anddistribution; but these estimates have been disputed.54 Cathleset al.54 suggested that Howarth et al.53 “significantly over-estimated” fugitive emissions and undervalued the emissionreduction from the use of “green technologies”. Otherauthors54,55 have criticized Howarth et al.53 for use of “heatrather than electricity generation” for their life cycle assessment,and a 20 year time frame that overemphasized the shorter-termimpact of CH4 on radiative forcing. However, with the currentlack of representative and recently measured emissions, we areleft to wonder just what the actual leakage rates are at theregional and national scales, emphasizing the difficulty withelucidating existing interpretations.A review of 20 years of literature on CH4 leaks
42 has foundthat the extent of leakages from North American natural gassystems may be larger than anticipated, yet best managementpractices and regulation for technologically achievableemissions reduction and effective leak detection and repairprograms can significantly reduce the climate footprint ofnatural gas.56 The large recent changes in US EPA method-ology and annual emission estimates and disparities in site leveland regional level emission measurements highlight the needfor additional research to better understand emissions acrossthe natural gas life cycle (see above) and to reconcile emissionsmeasured at different spatiotemporal scales.15,22,40,52,53,57,58
■ AIR QUALITY IMPACTS OF THE FIRST TWO LIFECYCLE STAGES
Preproduction. In addition to CH4, activities in the firsttwo of the five natural gas life cycle stages emit othercompounds than can impact local and regional air quality. Thepreproduction stage includes everything from exploration, siteclearing, and road construction to drilling, hydraulic fracturing,and well completion. For a single well, preproduction is usuallycompleted within a few weeks; but these operations may becarried out for a dozen or more wells on a pad and at multiplesites in the field, typically lasting for months.16 Severalpollutants with environmental and human health impacts59
have been linked to this stage60−64 and a few monitoring effortsare underway to document actual atmospheric exposures.65−67
Air quality impacts begin with the use of large diesel-poweredequipment during site preparation,62 including the constructionof roads and holding ponds as well as clearing of the wellpad.68,69 Emissions from on and off-road diesel use continuethroughout drilling and hydraulic fracturing as millions ofgallons of water, sand, and hydraulic fracturing chemicals aretransported to and from the well pads.70 Diesel emissions areknown to include airborne fine particulate matter (2.5 μm andsmaller in diameter; PM2.5)
71−74 as well as ozone precursorssuch as NOx and NMVOCs.75,76 Long-term exposure to PM2.5can lead to decreased lung function, asthma, and increasedrespiratory symptoms such as coughing and difficulty breath-ing.77 Truck traffic also generates coarse particulate matter ≤10μm in diameter (PM10),
62emitted from tire wear, brake wear,and resuspended road dust. However, Litovitz et al.62 foundthat emissions from oil and gas operation related transportationin Pennsylvania were small compared to other emissions fromnatural gas activities statewide, contributing only 0.5−1.2% ofVOCs, 3.2−3.5% of NOx, and 2.1−3.5% of PM2.5 emitted fromnatural gas activities.
Figure 3. Locations of elevated methane concentrations in the Beacon Hill area of Boston, Massachusetts, associated with natural gas distributionpipeline leaks. Data from Phillips et al.48
Environmental Science & Technology Critical Review
dx.doi.org/10.1021/es4053472 | Environ. Sci. Technol. XXXX, XXX, XXX−XXXD

Emissions can continue into the drilling and hydraulicfracturing procedures. During the process of drilling, pockets ofCH4, and potentially C2H6 and propane, through which thedrill passes, can be released into the atmosphere.57 However,little information exists on the frequency and volume ofemissions from these releases, which is currently a majoruncertainty in emissions inventories. Emissions measurementsare strongly needed during this section of preproduction.After drilling is completed, water, hydraulic fracturing fluid,
and proppant (e.g., silica sand or man-made ceramic beads) arepumped underground at pressures of ∼10 000 to 20 000 psi tofracture the low permeability reservoir rock to allow the naturalgas to flow.7,78 Emissions during drilling and hydraulicfracturing include exhaust from diesel63 and natural-gaspowered engines for drilling rigs and pumps.79 Bar-Ilan etal.63 estimated that 12 to 27% of NOx emissions from naturalgas activities in three areas of Wyoming originate from drillingrigs alone. Litovitz et al.62 estimated that well drilling andhydraulic fracturing in Pennsylvania accounted for 2.6−10% ofVOC, 29−39% of NOx, 16−33% of PM2.5, and 35−55% of SOxemissions from natural gas activities. The fluid used duringhydraulic fracturing can contain hundreds of chemicals,including acids, ethylene glycol, and isopropanol.7,80−82
However, the detailed constituents of the hydraulic fracturingfluid mix are often proprietary, meaning that reporting of theconstituents is voluntary by the industry82 and oftenincomplete. Also, no information exists on the interactions ofthe chemicals in the fracturing fluid with naturally occurringchemicals down the well and what potential problems thismight cause. Many of the constituents are volatile underatmospheric conditions. A portion of the fracturing fluid mixreturns to the surface during the flowback stage and is stored inholding ponds or flowback tanks and later disposed at industrialwaste or deep injection facilities. A full classification of allemissions during drilling and hydraulic fracturing does not toour knowledge exist.Another area where little information exists is on the
emission of (and exposure to) respirable silica (crystalline silica“small enough to enter the gas-exchange regions of thelungs83”; 10 μm and smaller83) from the proppant injectedduring hydraulic fracturing. The U.S. National Institute forOccupational Safety and Health conducted field studies at 11sites in five states between 2010 and 2011 and found thatworkers were exposed to high levels of respirable silica in 31%of sampled cases (N = 111).84 The high values observed wereten or more times the recommended exposure limit and abovethe filtration capabilities of half-face respirators worn by theworkers.84 This exposure can occur during transportation of thesand by truck or conveyor belt and also can occur upstream, atthe site where the silica is extracted.83 Exposure to respirablesilica can decrease lung function, increase respiratory symptomssuch as coughing, result in difficulty breathing, and causeasthma and silicosis.83 The impacts of respirable silica aregreatest for workers on site, but broader studies are needed forpeople living near well pads and production staging areas.Once drilling and hydraulic fracturing operations have been
finished, the well is completed and prepared to produce naturalgas. Emissions during the well completion process, particularlyduring venting and flaring of initial natural gas before the well isconnected to a transmission pipeline, can include CH4 andBTEX.60,85 These emissions can also other nonmethanehydrocarbons, along with hydrogen sulfide H2S,
63 NOx, and ifthere is incomplete combustion of natural gas formaldehyde,86
at concentrations in the air that have the potential to affectresidents living within <800 m of wells.60 Most of theseemissions, however, are scheduled to be mostly eliminated by201587 when the US EPA will require use of “greencompletions” or “reduced emission completions” whentechnically feasible. During these processes, flowback fluid, oiland gas are separated as soon as possible in well completion,and the gas and oil are routed for sale. Green completionsreduce overall emission of CH4 and air pollutants thattraditionally would have been vented.15,88,89
Allen et al.15 describe four different completion flowbackconfigurations at hydraulically fractured gas wells and presentdirect measurements of CH4 emissions at 27 sites in fourdifferent regions of the U.S. On average, the sites sampled byAllen et al.15 had lower emissions than what is assumed by the2013 US EPA GHG NI for 2011. Methane emissions measuredduring 27 well completion flowbacks, for instance, averagedonly 1.7 Mg CH4
15 compared to an average of 81 Mg per eventused in the 2013 US EPA GHG NI.15 Measured emissionsduring a flowback event, however, varied by two orders ofmagnitude within a basin.15 The distribution of emissions fromcompletion flowback measured by Allen et al.15 is not Gaussian,and therefore, a simple set of uniform average emission factorsat the regional and national levels for an average greencompletion configuration will most likely not capture the actualaggregated emission magnitude.
Production. Several atmospheric pollutants have beenlinked to the production stage of the natural gas life cycleand have been studied in a few areas.65−67,90−97 As mentionedearlier, the natural gas that flows directly from the well oftencontains other associated NMVOCs, water vapor, carbondioxide, hydrogen sulfide, or natural gas liquids14 and needsprocessing in order to meet purity standards for addition to thepipeline infrastructure, known as “pipeline quality naturalgas”.14,98 Processing occurs near the well and/or at a centralizedprocessing plant and includes compression of the processednatural gas to be transported through pipelines to consumers.Once production at a well has begun, emission sources caninclude well-head compressors or pumps that bring theproduced gas up to the surface or up to pipeline pressure(engines are often fired with raw or processed natural gas), wellpad equipment bleeding and leaks, flare emissions, maintenanceemissions, and compressor station emissions. Litovitz et al.62
estimated that production sites and compressor stations inPennsylvania accounted for 91−97% of VOCs, 59−68% ofNOx, 64−84% of PM2.5, and 40−64% of SOx emissions fromnatural gas activities.Other sources of CH4 and NMVOCs (including BTEX)
emissions during the production stage can include dehydratorregeneration vents, venting from pneumatic pumps and devicesthat are actuated by natural gas, leaks through faulty casing,incomplete emissions capture, or burning in flaring systems.Some of these emissions can be continuous or intermittent butwill be ongoing during the entire lifetime of the well unlessdirect emissions capture and destruction or recovery are putinto place. Emissions from crude oil and liquid condensate(light crude oil) storage tanks were estimated to be responsiblefor 66% of total NMVOCs emitted by oil and gas operations inDenver-Julesburg Basin in the northeast Colorado FrontRange.99 Other emissions related to maintenance or productionstimulation, for example, will be episodic such as during liquidunloadings and during workovers. Due to the diffuse nature ofemissions from hundreds of thousands of well pads, variations
Environmental Science & Technology Critical Review
dx.doi.org/10.1021/es4053472 | Environ. Sci. Technol. XXXX, XXX, XXX−XXXE

in composition of the raw gas itself, and varying degrees ofemissions controls and reduction requirements, conclusions onthe overall air quality impact of this stage span from highlydetrimental8,43 ,44,100 ,101 to little or no impact atall.65,90,92,95,102−105 This level of discrepancy indicates thatmore work needs to be done at the basin scale on the emissionsfrom the production stage of the life cycle and their impacts.Oil and gas emissions of ozone (O3) precursors
(NMVOCs)44,62,63,99,101,106−112 have been linked to regionalexceedances of the 8-h national ambient air quality standard forO3 (75 ppb for fourth highest daily maximum concentrationaveraged for three consecutive years). O3 precur-sors44,62,63,99,101,106−112 emitted from the natural gas and oilproduction stage can make attainment of US EPA O3 exposurelimits difficult even in winter for some areas.99,106−108,113,114
High surface level O3 concentrations, produced by increasedNOx and VOC abundance,86,115 can lead to respiratoryproblems, particularly in children and older adults.116 The USEPA nonattainment designation for the O3 standard has been adriving force behind state-level regulation of O3 precursoremissions from oil and gas operations and increased ambient airmonitoring programs in Wyoming and Colorado,89 two stateswith the most stringent air regulations in the U.S. for theiraffected areas. Air monitoring before and during oil and gasdevelopment can help regulators and air quality managers keeptrack of the air impacts of different air pollution sources andhow they may change over time. To date, most US EPA andstate air monitoring (especially for O3) is done in urban areas,leaving entire industrialized rural and suburban communitieswithout baseline and routine air quality measurements.Other Stages. Much less information exists on the non-
CH4 emissions from two of the three other natural gas life cyclestages. Since pipeline quality natural gas is predominantly CH4,few other pollutants have been reported to be emitted from thetransmission, storage and distribution stage (Figure 1). On theother hand, some emissions (e.g., NOx, SO2, CO2, and CH4)from the use of natural gas are estimated each year by the USEPA,117 particularly what is emitted during use for powergeneration (discussed in more detail below), and researchershave attributed some formaldehyde emissions to natural gascombustion. In particular, Zhang et al.118 attributed 10−30% ofthe primary formaldehyde concentrations to natural gascombustion in the Houston, Texas area during the 2006Texas Air Quality Study (TexAQS). Other studies haveindicated that O3 concentration criteria exceedances in Texascities are attributed to natural gas combustion.118,119
At the end of the well production life (well production end-of-life), the well is “plugged” (if not just abandoned). Whatinformation is available on the potential for gas leakage isderived primarily from historical studies of conventional wells.In Alberta, for instance, 4% of abandoned wellbores leaked,including many which were plugged before abandonment.120 InPennsylvania, an estimated 325 000 oil and gas wells weredrilled between 1860 and 2000, but the PennsylvaniaDepartment of Environmental Protection only has records for88 300 regulated operating wells, 44 700 plugged wells, and8000 abandoned wells, leaving the status of 184 000 wellsunknown.121 Other states have similar issues, for instance, NewYork plugged 323 (mostly old/abandoned) wells in 2012 withmany more still needing to be plugged.122 Until the number oforphaned/abandoned wells is known, we cannot even begin toestimate the air quality impacts from this portion of the naturalgas life cycle.
■ POTENTIAL AIR QUALITY BENEFITS OFINCREASED NATURAL GAS USE
The interest in increasing production and use of natural gas inthe U.S. during the past decade is due, in part, to the fact thatnatural gas emits less CO2, sulfur dioxide (SO2), NOx, andmercury (Hg) compared to coal and oil when burned toproduce heat or electricity.23,36,95,123,124 Natural gas use forelectricity generation emits roughly half the CO2 of coal perkWh produced, potentially improving air quality and reducingGHG emissions compared to coal. An immediate benefit froman increased share of natural gas for electricity generation in theU.S. (from 14% in 2000 to 29% in 2012125) is a reduction inthe carbon intensity of U.S. electricity generation in 2011 and2012.25,126,127 The controversy, however, arises in attemptingto estimate the total methane leakage associated with naturalgas production, distribution, and use, and, to a lesser extent, themethane leakage associated with coal mining.55,57 Most lifecycle comparison studies have relied on leakage estimatesderived from the US EPA GHG NI for natural gas systems.Venkatesh et al.128 estimated that approximately 1−3 kg ofNOx per MWh and 2−10 kg of SO2 per MWh are the typicalemissions from coal-fired power plants likely to be retired orreplaced by combined cycle natural gas plants. Alternatively,emissions of SO2 and Hg from natural-gas-fired power plantsare negligible; and emissions of NOx are substantially lowerthan for coal-fired power plants.Another potential use for natural gas (conventional or
unconventional) includes replacing petroleum in products suchas liquid fuels and olefins.129 Olefins are used to produceplastics (polyethylene, polyester, polyvinyl chloride (PVC), andpolystyrene) that are, in turn, used to produce millions ofconsumer goods. Access to CH4, C2H6, propane, and butanethrough unconventional natural gas development, may increasetheir use in the production of high-value chemicals. Thebenefits of a potentially “new” source of materials for makingthese products is clear, but new process chemistry will beneeded to replace petroleum with natural gas,129 and these useswill need to be included in new life cycle assessments forunconventional natural gas.Until the efficiency of compressed natural gas (CNG)
vehicles increases, and CH4 leakage rates from natural gasproduction decrease further, the GHG benefits of substitutingnatural gas for gasoline in vehicles are small22 or negli-gible.40,130,131 Alvarez et al.40 estimated that converting a fleetof gasoline cars to CNG would increase radiative forcing for atleast 80 years before modest net climate benefits would beachieved; the comparable crossover point for heavy-duty dieselvehicles would be nearly 300 years. In fact, Alvarez et al.40
estimated that CNG conversion would result in more rapidclimate change for decades, attributable to the greater radiativeforcing in the early years after conversion. In contrast,converting vehicles to natural gas would have immediate(nonclimate) air quality benefits compared to gasoline becauseof the cleaner burning properties of natural gas and reducednon-methane air pollution.
■ REGULATIONS
Until recently, air regulation of oil and gas productionoperations was done at the state level. The US EPA attemptsto quantify and minimize the air quality impacts of industrialactivities, including oil and natural gas operations. In 2012, theagency released a set of new source performance standards
Environmental Science & Technology Critical Review
dx.doi.org/10.1021/es4053472 | Environ. Sci. Technol. XXXX, XXX, XXX−XXXF

(NSPS).87 The NSPS take effect in 2015 and rely heavily onself-reporting from the industry of emissions to the US EPA.132
The standards attempt to limit VOC emissions during wellcompletion by requiring the use of green completiontechnologies, which the US EPA estimates will result in a95% reduction of VOC emissions and a 99.9% reduction in SO2emissions.87,89 Further requirements of the rule include limitingemissions of VOCs from a new single oil or condensate tank tofour tons per year133 and limiting BTEX from a singledehydrator to one ton per year.87 The rule focuses on two typesof compressors: centrifugal compressors with wet seals mustreduce VOC emissions by 95% and reciprocating compressorsmust have regular maintenance to keep them from leakingVOCs.87 Also, pneumatic controllers are required to vent lessthan six standard cubic feet per hour. Other air toxics are notspecifically regulated under this new rule and are limited tomajor sources that emit 10 or more tons of a single air toxic or25 or more tons of a combination of toxics.87
The US EPA also has adopted multiple tiers of emissionstandards for on-road134 and off-road135 diesel engines that mayinfluence overall air impacts from the natural gas life cycle.These standards apply to criteria pollutants including NOx,non-methane hydrocarbons, CO, and PM. Manufacturers mustcurrently ensure that each new engine, vehicle, or equipmentmeets the latest emission standards. If diesel engines were builtbefore US EPA emission standards came into effect, however,they are generally not affected by the standards or otherregulatory requirements. Although the latest tiers of dieselengine emission standards are very stringent, heavy-duty dieselengines are long lasting. Thus, many older trucks and off-roadequipment are still being used.Many states have also taken separate, individual actions to
regulate the overall environmental impacts of the oil andnatural gas industries, and some states are developing publicdisclosure laws for hydraulic fracturing fluids.82 Coloradopassed regulations from 2007 to 2009 requiring operators to(1) use no-bleed or low bleed pneumatic devices at oil and gasproduction sites in the northeastern Front Range O3 non-attainment area, (2) use green completion technologies at oiland gas wells when technically feasible, and (3) control flashingemissions from condensate and oil storage tanks. The Coloradosystem-wide emissions reduction requirements for NMVOCsfrom tanks are 90% in the summertime and 70% otherwise; thestate, however, estimates that the actual annual averagereduction in emissions has been 53% (compared to havingno controls in place).136,137 Wyoming has required greencompletions since 2004 and requires 98% reduction ofemissions (instead of 95% for the NSPS) for newly installedtanks.89 Montana requires the control of emissions from thewell immediately upon completion and has specific regulationsregarding compression devices, pneumatic controllers, con-densate/crude oil storage tanks, and glycol dehydrators.89 NewYork has issued a moratorium on high-volume hydraulicfracturing.Other states have taken fewer additional regulatory steps and
will rely largely on the NSPS that will begin January 1, 2015.89
These include Alaska, North Dakota, New Mexico, and WestVirginia. Texas has been tracking emissions data from the oiland gas industry for years, but often limits regulation ofemissions to the Houston and Dallas−Fort Worth federal O3standard non-attainment areas.138 Utah has regulations thatlimit emissions from hydrocarbon storage tanks; however, theseregulations only apply to Salt Lake City and Davis County.89
These areas are not near the Uintah Basin where oil and gasoperations exist, and therefore do nothing to improve the highwintertime O3 concentrations observed during strong temper-ature inversions.89,139 Pennsylvania has recently reevaluated andlimited the oil and natural gas facilities that were previouslyexempt from regulations.140 The wide variety of regulations andpractices by different states indicates that much more attentionshould be focused on systematically assessing the air emissionsfrom oil and gas operations and their air impacts in those stateswith substantial levels of unconventional natural gas activitiesand production.
■ RECOMMENDATIONSBased on our examination of the literature on the air qualityimpacts of unconventional gas extraction and distribution, wehave determined that actual measurement data on variousindividual segments of the natural gas life cycle are sparse orcritically lacking. To maximize the true benefits and minimizethe negative impacts of this resource, we recommend that thefollowing steps be taken to fill critical knowledge gaps:
• Air quality measurements need to be made prior to oiland gas development, including during drilling andhydraulic fracturing, to more clearly understand thedirect impacts of these activities. Air monitoring duringthese operations can help ensure emissions managementstrategies are effective and exposure to air pollutants,including silica, are kept to a minimum.
• A full chemical classification of emissions, including airtoxics, during all life cycle stages needs to be obtained toproperly perform source apportionment modeling and tounderstand all potential air quality and health impacts.
• Independent scientific data on the true nationwide extentof methane leaks from the production, processing,transmission, storage, and distribution infrastructure,including measurements of flows and fluxes, should beacquired.
• An inventory of abandoned/orphaned wells should becollected so that emissions can be properly estimated.
• Measurements on the variation of air emissioncomposition and magnitude by natural gas and oilplays need to be made.
• Collaborations between independent scientists, regula-tors, and operators need to be increased to gain access toareas where measurements should be made and toinform effective emissions detection, reduction, andmonitoring strategies.
■ AUTHOR INFORMATIONCorresponding Author*Phone: 775-674-7078. Fax: 775-673-7016. E-mail: [email protected] authors declare no competing financial interest.
■ ACKNOWLEDGMENTSC.M. and B.Z. thank DRI’s Division of Atmospheric Sciencesfor support to write this review. G.P. acknowledges financialsupport from the National Science Foundation AirWaterGasSustainability Research Network award. Any opinions, findings,and conclusions or recommendations expressed in this materialare those of the authors and do not necessarily reflect the viewsof their employers and funding sources. R.J. acknowledges
Environmental Science & Technology Critical Review
dx.doi.org/10.1021/es4053472 | Environ. Sci. Technol. XXXX, XXX, XXX−XXXG

support from the National Science Foundation (GeosciencesDirectorate), the Environmental Defense Fund, and DukeUniversity.
■ REFERENCES(1) US EIA. Annual Energy Outlook 2013 with Projections to 2040.http://www.eia.gov/forecasts/aeo/ (accessed Oct. 15, 2013).(2) US EIA. Natural GasU.S. Energy Information Administration(EIA). http://www.eia.gov/naturalgas/ (accessed Nov. 22, 2013).(3) Jackson, R. B.; Vengosh, A.; Darrah, T. H.; Warner, N. R.; Down,A.; Poreda, R. J.; Osborn, S. G.; Zhao, K.; Karr, J. D. Increased straygas abundance in a subset of drinking water wells near Marcellus shalegas extraction. Proc. Natl. Acad. Sci. 2013, 110 (28), 11250−11255.(4) Warner, N. R.; Jackson, R. B.; Darrah, T. H.; Osborn, S. G.;Down, A.; Zhao, K.; White, A.; Vengosh, A. Geochemical evidence forpossible natural migration of Marcellus Formation brine to shallowaquifers in Pennsylvania. Proc. Natl. Acad. Sci. 2012, 109 (30), 11961−11966.(5) Osborn, S. G.; Vengosh, A.; Warner, N. R.; Jackson, R. B.Methane contamination of drinking water accompanying gas-welldrilling and hydraulic fracturing. Proc. Natl. Acad. Sci. 2011, 108 (20),8172−8176.(6) Bamberger, M.; Oswald, R. E. Impacts of gas drilling on humanand animal health. New Solutions 2012, 22 (1), 51−77.(7) Ground Water Protection Council and ALL Consulting. ModernShale Gas Development in the United States: A Primer; U.S. Departmentof Energy: Washington, DC, 2009.(8) US EPA. Outdoor AirIndustry, Business, and Home: Oil andNatural Gas ProductionAdditional Information http://www.epa.gov/oaqps001/community/details/oil-gas_addl_info.html#activity2(accessed Oct. 16, 2013).(9) Krzyzanowski, J. Environmental pathways of potential impacts tohuman health from oil and gas development in northeast BritishColumbia, Canada. Environ. Rev. 2012, 20 (2), 122−134.(10) Kargbo, D. M.; Wilhelm, R. G.; Campbell, D. J. Natural gasplays in the marcellus shale: Challenges and potential opportunities.Environ. Sci. Technol. 2010, 44 (15), 5679−5684.(11) Beusse, R.; Dunlap, C.; Good, K.; Hauck, E.; McGhee-Lenart,R.; Narimatsu, J. EPA Needs to Improve Air Emissions Data for the Oiland Natural Gas Production Sector, EPA Report 13-P-0161; Office ofthe Inspector General of the United States, Environmental ProtectionAgency: Washington, DC, 2013.(12) The Truth About Hydraulic Fracturing. Hydraulic Fracturing Part1 of 2; Cabot Oil and Gas Corporation: Houston, TX, 2013.(13) Snow, N. API, U.S. Chamber separately question proposedfederal fracing rules. Oil Gas J. August 26, 2013.(14) Schlumberger Oilfield Glossary. http://www.glossary.oilfield.slb.com/ (accessed May 2013).(15) Allen, D. T.; Torres, V. M.; Thomas, J.; Sullivan, D. W.;Harrison, M.; Hendler, A.; Herndon, S. C.; Kolb, C. E.; Fraser, M. P.;Hill, A. D.; Lamb, B. K.; Miskimins, J.; Sawyer, R. F.; Seinfeld, J. H.Measurements of methane emissions at natural gas production sites inthe United States. Proc. Natl. Acad. Sci. 2013, 110 (44), 17768−17773.(16) Encana. Well Completion & Hydraulic Fracturing, 2011. http://w w w . e n c a n a . c o m / p d f / c o m m u n i t i e s / u s a /wellcompletionandhydraulicfracturing(DJ).pdf (accessed March 14,2014).(17) Encana Life of the well 2011. www.encana.com/pdf/communities/usa/LifeOfTheWell2011.pdf (accessed March 14, 2014).(18) Branosky, E.; Stevens, A.; Forbes, S. Defining the Shale Gas LifeCycle: A Framework for Identifying and Mitigating EnvironmentalImpacts; World Resources Institute: Washington, DC, 2012.(19) Baihly, J.; Altman, R.; Malpani, R.; Luo, F. Study assesses shaledecline rates. Am. Oil Gas Rep. 2011.(20) Hughes, J. D. Drill, Baby, Drill: Can Unconventional Fuels Usherin a New Era of Energy Abundance; Post Carbon Institute: Santa Rosa,CA, 2013. http://www.postcarbon.org/reports/DBD-report-FINAL.pdf.
(21) Hughes, J. D. Lifecycle Greenhouse Gas Emissions From Shale GasCompared to Coal: An Analysis of Two Conflicting Studies; Post CarbonInstitute: Santa Rosa, CA, 2011. www.postcarbon.org/reports/PCI-Hughes-NETL-Cornell-Comparison.pdf.(22) Burnham, A.; Han, J.; Clark, C. E.; Wang, M.; Dunn, J. B.;Palou-Rivera, I. Life-cycle greenhouse gas emissions of shale gas,natural gas, coal, and petroleum. Environ. Sci. Technol. 2012, 46 (2),619−627.(23) Jaramillo, P.; Griffin, W. M.; Matthews, H. S. Comparative life-cycle air emissions of coal, domestic natural gas, LNG, and SNG forelectricity generation. Environ. Sci. Technol. 2007, 41 (17), 6290−6296.(24) US EPA. Air Emissions/Clean Energy; US EPA: Washington,DC. http://www.epa.gov/cleanenergy/energy-and-you/affect/air-emissions.html (accessed March 14, 2014).(25) de Gouw, J. A.; Parrish, D. D.; Frost, G. J.; Trainer, M. Reducedemissions of CO2, NOx, and SO2 from U.S. power plants owing toswitch from coal to natural gas with combined cycle technology.Earth’s Future 2014, DOI: 10.1002/2013ef000196.(26) US EPA. Annex 3 Methodological Descriptions for AdditionalSource or Sink Categories; Table A-128; 2013. http://www.epa.gov/climatechange/Downloads/ghgemissions/US-GHG-Inventory-2013-Annex-3-Additional-Source-or-Sink-Categories.pdf (accessed March14, 2014).(27) Variability of Natural Gas Composition in Select MajorMetropolitan Areas of the United States, GRI-92/0123; Gas ResearchInstitute: Des Plaines, IA, 1992.(28) Kirschke, S.; Bousquet, P.; Ciais, P.; Saunois, M.; Canadell, J. G.;Dlugokencky, E. J.; Bergamaschi, P.; Bergmann, D.; Blake, D. R.;Bruhwiler, L.; Cameron-Smith, P.; Castaldi, S.; Chevallier, F.; Feng, L.;Fraser, A.; Heimann, M.; Hodson, E. L.; Houweling, S.; Josse, B.;Fraser, P. J.; Krummel, P. B.; Lamarque, J.-F.; Langenfelds, R. L.; LeQuere, C.; Naik, V.; O’Doherty, S.; Palmer, P. I.; Pison, I.; Plummer,D.; Poulter, B.; Prinn, R. G.; Rigby, M.; Ringeval, B.; Santini, M.;Schmidt, M.; Shindell, D. T.; Simpson, I. J.; Spahni, R.; Steele, L. P.;Strode, S. A.; Sudo, K.; Szopa, S.; van der Werf, G. R.; Voulgarakis, A.;van Weele, M.; Weiss, R. F.; Williams, J. E.; Zeng, G. Three decades ofglobal methane sources and sinks. Nat. Geosci. 2013, 6 (10), 813−823.(29) Hausfather, Z.; Muller, R. New EPA Report Reveals SignificantlyLower Methane Leakage from Natural Gas. http://static.berkeleyearth.org/memos/epa-report-reveals-lower-methane-leakage-from-natural-gas.pdf (accessed March 14, 2014).(30) US EPA. Inventory of U.S. Greenhouse Gas Emissions and Sinks:1990−2011, EPA 430-R-13-001; US EPA: Washington, DC, 2013;http://www.epa.gov/climatechange/ghgemissions/usinventoryreport.html.(31) Nisbet, E. G.; Dlugokencky, E. J.; Bousquet, P. Methane on theRiseAgain. Science 2014, 343 (6170), 493−495.(32) West, J. J.; Fiore, A. M.; Horowitz, L. W.; Mauzerall, D. L.Global health benefits of mitigating ozone pollution with methaneemission controls. Proc. Natl. Acad. Sci. 2006, 103 (11), 3988−3993.(33) IPCC. Working Group I Contribution to the IPCC Fifth AssesmentReport (AR5), Climate Change 2013: The Physical Science Basis. Table8.7; IPCC: Brussels, 2013.(34) NOAA NOAA/ESRL Global Monitoring DivisionThe NOAAAnnual Greenhouse Gas Index (AGGI). http://www.esrl.noaa.gov/gmd/aggi/aggi.html (accessed Nov. 24, 2013).(35) US EPA. Greenhouse Gas Inventory Report Archive. http://www.epa.gov/climatechange/ghgemissions/usinventoryreport/archive.html (accessed Nov. 23, 2013).(36) Harrison, M. R.; Campbell, L. M.; Shires, T. M.; Cowgill, R. M.Methane Emissions from the Natural Gas Industry Volume 2: TechnicalReport, Report No. EPA-600/R-96−080b; Prepared for the GasResearch Institute and the U.S. EPA: Washington, DC, 1996.(37) US EPA. Subpart W; Petroleum and Natural Gas Systems;Greenhouse Gas Reporting Program. http://www.epa.gov/ghgreporting/reporters/subpart/w.html (accessed Nov. 23, 2013).(38) US EPA. Subpart C; Greenhouse Gas Reporting Program.http://www.epa.gov/ghgreporting/reporters/subpart/c.html (ac-cessed Nov. 23, 2013).
Environmental Science & Technology Critical Review
dx.doi.org/10.1021/es4053472 | Environ. Sci. Technol. XXXX, XXX, XXX−XXXH

(39) US EPA. Overview of Updates to the Natural Gas Sector EmissionsCalculations for the Inventory of U.S. Greenhouse Gas Emissions andSinks: 1990−2011; US EPA: Washington, DC, 2013. http://www.epa.gov/climatechange/Downloads/ghgemissions/fact-sheet-oil-and-gas-estimates-in-2013-inventory.pdf.(40) Alvarez, R. A.; Pacala, S. W.; Winebrake, J. J.; Chameides, W. L.;Hamburg, S. P. Greater focus needed on methane leakage from naturalgas infrastructure. Proc. Natl. Acad. Sci. U.S.A. 2012, 109 (17), 6435−6440.(41) Miller, S. M.; Wofsy, S. C.; Michalak, A. M.; Kort, E. A.;Andrews, A. E.; Biraud, S. C.; Dlugokencky, E. J.; Eluszkiewicz, J.;Fischer, M. L.; Janssens-Maenhout, G.; Miller, B. R.; Miller, J. B.;Montzka, S. A.; Nehrkorn, T.; Sweeney, C. Anthropogenic emissionsof methane in the United States. Proc. Natl Acad. Sci. 2013,DOI: 10.1073/pnas.1314392110.(42) Brandt, A. R.; Heath, G. A.; Kort, E. A.; O’Sullivan, F.; Pet́ron,G.; Jordaan, S. M.; Tans, P.; Wilcox, J.; Gopstein, A. M.; Arent, D.;Wofsy, S.; Brown, N. J.; Bradley, R.; Stucky, G. D.; Eardley, D.;Harriss, R. Methane leaks from North American natural gas systems.Science 2014, 343 (6172), 733−735.(43) Katzenstein, A. S.; Doezema, L. A.; Simpson, I. J.; Balke, D. R.;Rowland, F. S. Extensive regional atmospheric hydrocarbon pollutionin the southwestern United States. Proc. Natl. Acad. Sci. U.S.A. 2003,100 (21), 11975−11979.(44) Petron, G.; Frost, G.; Miller, B. R.; Hirsch, A. I.; Montzka, S. A.;Karion, A.; Trainer, M.; Sweeney, C.; Andrews, A. E.; Miller, L.;Kofler, J.; Bar-Ilan, A.; Dlugokencky, E. J.; Patrick, L.; Moore, C. T.;Ryerson, T. B.; Siso, C.; Kolodzey, W.; Lang, P. M.; Conway, T.;Novelli, P.; Masarie, K.; Hall, B.; Guenther, D.; Kitzis, D.; Miller, J.;Welsh, D.; Wolfe, D.; Neff, W.; Tans, P. Hydrocarbon emissionscharacterization in the Colorado Front Range: A pilot study. J.Geophys. Res.: Atmos. 2012, 117, DOI: 10.1029/2011jd016360.(45) Karion, A.; Sweeney, C.; Pet́ron, G.; Frost, G.; MichaelHardesty, R.; Kofler, J.; Miller, B. R.; Newberger, T.; Wolter, S.; Banta,R.; Brewer, A.; Dlugokencky, E.; Lang, P.; Montzka, S. A.; Schnell, R.;Tans, P.; Trainer, M.; Zamora, R.; Conley, S. Methane emissionsestimate from airborne measurements over a western United Statesnatural gas field. Geophys. Res. Lett. 2013, 40 (16), 4393−4397.(46) US EIA. About U.S. natural gas pipelines. http://www.eia.gov/pub/oil_gas/natural_gas/analysis_publications/ngpipeline/index.html(access May 2013).(47) Peischl, J.; Ryerson, T. B.; Brioude, J.; Aikin, K. C.; Andrews, A.E.; Atlas, E.; Blake, D.; Daube, B. C.; de Gouw, J. A.; Dlugokencky, E.;Frost, G. J.; Gentner, D. R.; Gilman, J. B.; Goldstein, A. H.; Harley, R.A.; Holloway, J. S.; Kofler, J.; Kuster, W. C.; Lang, P. M.; Novelli, P.C.; Santoni, G. W.; Trainer, M.; Wofsy, S. C.; Parrish, D. D.Quantifying sources of methane using light alkanes in the Los Angelesbasin, California. J. Geophys. Res.: Atmos. 2013, 118 (10), 4974−4990.(48) Phillips, N. G.; Ackley, R.; Crosson, E. R.; Down, A.; Hutyra, L.R.; Brondfield, M.; Karr, J. D.; Zhao, K. G.; Jackson, R. B. Mappingurban pipeline leaks: Methane leaks across Boston. Environ. Pollut.2013, 173, 1−4.(49) Jackson, R. B.; Down, A.; Phillips, N. G.; Ackley, R. C.; Cook, C.W.; Plata, D. L.; Zhao, K. Natural Gas Pipeline Leaks AcrossWashington, DC. Environ. Sci. Technol. 2014, 48 (3), 2051−2058.(50) Harrison, M. R.; Shires, T. M.; Wessels, J. K.; Cowgill, R. M.Methane Emissions from the Natural Gas Industry. Executive Summary,Vol. 1, EPA-600/R-96-080a; U.S. Environmental Protection Agency,Office of Research and Development: Washington, DC, 1996.(51) Kirchgessner, D. A.; Lott, R. A.; Cowgill, R. M.; Harrison, M. R.;Shires, T. M. Estimate of methane emissions from the U.S. natural gasindustry. Chemosphere 1997, 35 (6), 1365−1390.(52) Lelieveld, J.; Lechtenbohmer, S.; Assonov, S. S.; Brenninkmeijer,C. A. M.; Dienst, C.; Fischedick, M.; Hanke, T. Greenhouse gases:Low methane leakage from gas pipelines. Nature 2005, 434 (7035),841−842.(53) Howarth, R. W.; Santoro, R.; Ingraffea, A. Methane and thegreenhouse-gas footprint of natural gas from shale formations. ClimaticChange 2011, 106 (4), 679−690.
(54) Cathles, L.; Brown, L.; Taam, M.; Hunter, A. A commentary on“The greenhouse-gas footprint of natural gas in shale formations” byHowarth, R.W.; Santoro, R.; Ingraffea, A. Climatic Change 2012, 113(2), 525−535.(55) Weber, C. L.; Clavin, C. Life cycle carbon footprint of shale gas:Review of evidence and implications. Environ. Sci. Technol. 2012, 46(11), 5688−5695.(56) US EPA. Recommended Technologies and Practices; NaturalGas STAR Program.http://www.epa .gov/gasstar/tools/recommended.html (accessed Feb. 24, 2014).(57) Jiang, M.; Griffin, W. M.; Hendrickson, C.; Jaramillo, P.;VanBriesen, J.; Venkatesh, A. Life cycle greenhouse gas emissions ofMarcellus shale gas. Environ. Res. Lett. 2011, 6, (3), DOI: 10.1021/Es903811p.(58) Wigley, T. M. L. Coal to gas: The influence of methane leakage.Climatic Change 2011, 108 (3), 601−608.(59) Colborn, T.; Kwiatkowski, C.; Schultz, K.; Bachran, M. Naturalgas operations from a public health perspective. Hum. Ecol. Risk Assess2011, 17 (5), 1039−1056.(60) McKenzie, L. M.; Witter, R. Z.; Newman, L. S.; Adgate, J. L.Human health risk assessment of air emissions from development ofunconventional natural gas resources. Sci. Total Environ. 2012, 424,79−87.(61) Rodriguez, G.; Ouyang, C. Air Emissions Characterization forHydraulic Fracturing Operations in the United States; University ofMichigan: Ann Arbor, MI, 2013.(62) Litovitz, A.; Curtright, A.; Abramzon, S.; Burger, N.; Samaras, C.Estimation of Regional Air-Quality Damages from Marcellus ShaleNatural Gas Extraction in Pennsylvania. Environ. Res. Lett. 2013, 8 (1),014017.(63) Bar-Ilan, A.; Grant, J.; Parikh, R.; Morris, R.; Sgamma, K.;Moore, T.; Gribovicz, L. A Comprehensive Emissions Inventory ofUpstream Oil and Gas Activities in the Rocky Mountain States;ENVIRON: Novato, CA, 2008.(64) Russell, J.; Pollack, A. Final Report: Oil and Gas EmissionInventories for the Western States; Prepared for the Western Governors’Association: Denver, CO, 2005.(65) Pennsylvania Department of Environmental Protection.Technical Support Document for Long-Term Ambient Air MonitoringProject Near Permanent Marcellus Shale Gas Facilities Protocol; PA DEP:Philadelphia, 2013.(66) TCEQ. Sampling Results Near Oil and Natural Gas Facilities byCounty. http://www.tceq.texas.gov/toxicology/barnettshale/samplingresults (accessed Oct. 15, 2013).(67) US EPA. Oil and Natural Gas Sector: Standards of Performancefor Crude Oil and Natural Gas Production, Transmission, andDistribution. Background Technical Support Document for ProposedStandards; US EPA: Washington, DC, 2011.(68) Cabot Oil & Gas Corporation. The Life of a Natural Gas Well(or Just about Everything You Want to Know about Natural GasProduction). Cabot Life of a Well: Part 1 of 2; Cabot Oil & GasCorporation: Houston, TX, 2013.(69) Cabot Oil & Gas Corporation. Cabot Oil & GasWellpad SiteProgression. http://www.cabotog.com/outreach-videos/wellpad-site-progression/ (Oct. 17, 2013).(70) Vengosh, A.; Jackson, R. B.; Warner, N. R.; Darrah, T. H.;Kondash, A. A critical review of the risks to water resources fromunconventional shale gas development and hydraulic fracturing in theUnited States. Environ. Sci. Technol. 2014, In Press.(71) Kovats, N.; Acs, A.; Ferincz, A.; Kovacs, A.; Horvath, E.; Kakasi,B.; Jancsek-Turoczi, B.; Gelencser, A. Ecotoxicity and genotoxicityassessment of exhaust particulates from diesel-powered buses. Environ.Monit. Assess. 2013, 185 (10), 8707−8713.(72) Zielinska, B.; Sagebiel, J.; Arnott, W. P.; Rogers, C. F.; Kelly, K.E.; Wagner, D. A.; Lighty, J. S.; Sarofim, A. F.; Palmer, G. Phase andsize distribution of polycyclic aromatic hydrocarbons in diesel andgasoline vehicle emissions. Environ. Sci. Technol. 2004, 38 (9), 2557−2567.
Environmental Science & Technology Critical Review
dx.doi.org/10.1021/es4053472 | Environ. Sci. Technol. XXXX, XXX, XXX−XXXI
(73) Twigg, M. V. Progress and future challenges in controllingautomotive exhaust gas emissions. Appl. Catal. B 2007, 70 (1−4), 2−15.(74) Fujita, E. M.; Zielinska, B.; Campbell, D. E.; Arnott, W. P.;Sagebiel, J. C.; Mazzoleni, L.; Chow, J. C.; Gabele, P. A.; Crews, W.;Snow, R.; Clark, N. N.; Wayne, S. W.; Lawson, D. R. Variations inspeciated emissions from spark-ignition and compression-ignitionmotor vehicles in California’s south coast air basin. J. Air WasteManage. Assoc. 2007, 57 (6), 705−720.(75) Bar-Ilan, A.; Johnson, J. R.; DenBleyker, A.; Chan, L. M.;Yarwood, G.; Hitchcock, D.; Pinto, J. P. Potential ozone impacts ofexcess NO2 emissions from diesel particulate filters for on- and off-road diesel engines. J. Air Waste Manage. Assoc. 2010, 60 (8), 977−992.(76) Zielinska, B.; Sagebiel, J.; McDonald, J. D.; Whitney, K.;Lawson, D. R. Emission rates and comparative chemical compositionfrom selected in-use diesel and gasoline-fueled vehicles. J. Air WasteManage. Assoc. 2004, 54 (9), 1138−1150.(77) US EPA. Particulater Matter http://www.epa.gov/airquality/particlepollution/index.html (accessed May 2013).(78) US EPA. Hydraulic Fracturing Research Study, EPA/600/F-10/002; US EPA: Washington, DC, 2010.(79) Lattanzio, R. K. Air Quality Issues in Natural Gas Systems;prepared by Congressional Research Service: Washington, DC, 2013.(80) API. Hydraulic Fracturing: Unlocking America’s Natural GasResources; American Petroleum Institute: Washington, DC, 2010.(81) US EPA. Permitting Guidance for Oil and Gas HydraulicFracturing Activities Using Diesel Fuels. Draft: Underground InjectionControl Program Guidance #84, EPA 816-R-12-004; US EPA:Washington, DC, 2012.(82) Groudwater Protection Council and Interstate Oil and GasCompact Commision. Home page: FracFocus Chemical DisclosureRegistry. http://fracfocus.org (accessed Nov 24, 2013).(83) NIOSH. Hazard Alert: Worker Exposure to Silica duringHydraulic Fracturing. http://www.osha.gov/dts/hazardalerts/hydraulic_frac_hazard_alert.html (accessed May 2013).(84) Esswein, E. J.; Breitenstein, M.; Snawder, J.; Kiefer, M.; Sieber,W. K. Occupational exposures to respirable crystalline silica duringhydraulic fracturing. J. Occupational Environ. Hygiene 2013, 10 (7),347−356.(85) ATSDR. Agency for Toxic Substances Disease Registry. InteractionProfile for Benzene, Toluene, Ethylbenzene, and Xylenes (BTEX). Agencyfor Toxic Substances Disease Registry: Atlanta, GA, 2004.(86) Olaguer, E. P. The potential near-source ozone impacts ofupstream oil and gas industry emissions. J. Air Waste Manage. Assoc.2012, 62 (8), 966−977.(87) US EPA. Oil and Natural Gas Sector: New Source PerformanceStandards and National Emission Standards for Hazardous AirPollutants Reviews; EPA-HQ-OAR-2010-0505; FRL-9665-1. FederalRegister 2012, 77 (159), 49490−49598.(88) US EPA. Natural Gas STAR Recommended Technologies andPracticesProduction Sector; US EPA: Washington, DC, 2011.(89) Gribovicz, L. Analysis of States’ and EPA Oil & Gas Air EmissionsControl Requirements for Selected Basins in the Western United States;Prepared by the Western Regional Air Partnership: 2012.(90) Pennsylvania Department of Environmental Protection. North-eastern Pennsylvania Marcellus Shale Short-Term Ambient Air SamplingReport; PA DEP: Philadelphia, 2011.(91) Pennsylvania Department of Environmental Protection. South-western Pennsylvania Marcellus Shale Short-Term Ambient Air SamplingReport; PA DEP: Philadelphia, 2010.(92) Pennsylvania Department of Environmental Protection. North-central Pennsylvania Marcellus Shale Short-Term Ambient Air SamplingReport; PA DEP: Philadelphia, 2011.(93) Pring, M. Condensate Tank Oil and Gas Activities; EasternResearch Group, Inc.: Lexington, MA, 2012.(94) Hendler, A.; Nunn, J.; Lundeen, J.; McKaskle, R. VOC Emissionsfrom Oil and Condensate Storage Tanks; Texas Environmental ResearchConsortium: The Woodlands, TX, 2009.
(95) Pacsi, A. P.; Alhajeri, N. S.; Zavala-Araiza, D.; Webster, M. D.;Allen, D. T. Regional Air Quality Impacts of Increased Natural GasProduction and Use in Texas. Environ. Sci. Technol. 2013, 47 (7),3521−3527.(96) Alvarez, Y.; Shah, T.; Bar-Ilan, A.; Lindhjem, C.; Kemball-Cook,S.; Yarwood, G. Gas Compressor Engine Study for Northeast Texas;Prepared for East Texas Council of Governments: Kilgore, TX, 2013.(97) Pring, M.; Hudson, D.; Renzaglia, J.; Smith, B.; Treimel, S.Characterization of Oil and Gas Production Equipment and Develop aMethodology to Estimate Statewide Emissions; Prepared for TexasCommission on Environmental Quality: Austin, TX, 2010.(98) US EIA Natural Gas Processing: The Crucial Link BetweenNatural Gas Production and Its Transportation to Market; US EIA:Washington, DC, 2006.(99) Bar-Ilan, A.; Grant, J.; Friesen, R.; Pollack, A. K.; Henderer, D.;Pring, D.; Sgamma, K. Development of Baseline 2006 Emissions from Oiland Gas Activity in the Denver−Julesburg Basin; Colorado Departmentof Public Health and Environment Air Pollution Control Division:Denver, CO, 2008.(100) Armendariz, A. Emissions from Natural Gas Production in theBarnett Shale Area and Opportunities for Cost-Effective Improvements;Environmental Defense Fund: 2009.(101) Gilman, J. B.; Lerner, B. M.; Kuster, W. C.; de Gouw, J. A.Source signature of volatile organic compounds from oil and naturalgas operations in northeastern Colorado. Environ. Sci. Technol. 2013,47 (3), 1297−1305.(102) Bunch, A. G.; Perry, C. S.; Abraham, L.; Wikoff, D. S.;Tachovsky, J. A.; Hixon, J. G.; Urban, J. D.; Harris, M. A.; Haws, L. C.Evaluation of impact of shale gas operations in the Barnett Shaleregion on volatile organic compounds in air and potential humanhealth risks. Sci. Total Environ. 2014, 468−469, 832−842.(103) Zielinska, B.; Fujita, E.; Campbell, D. Monitoring of Emissionsfrom Barnett Shale Natural Gas Production Facilities for PopulationExposure Assessment, Final Report to the National Urban Air ToxicsResearch Center. https://sph.uth.tmc.edu/mleland/attachments/DRI-Barnett%20Report%2019%20Final.pdf (accessed Oct. 16 2013).(104) Texas Department of State Health Services. Final Report:DISH, Texas Exposure Investigation, Dish, Denton County, Texas; TexasDepartment of State Health Services: Austin, TX, 2010.(105) Levi, M. A. Comment on “Hydrocarbon emissions character-ization in the Colorado Front Range: A pilot study” by GabriellePet́ron et al. J. Geophys. Res.: Atmos. 2012, 117 (D21), D21203.(106) Lyman, S.; Shorthill, H. 2012 Uintah Basin Winter Ozone andAir Quality Study. CRD13-320.32; Utah Department of EnvironmentalQuality: Salt Lake City, 2013.(107) Edwards, P. M.; Young, C. J.; Aikin, K.; deGouw, J.; Dube,́ W.P.; Geiger, F.; Gilman, J.; Helmig, D.; Holloway, J. S.; Kercher, J.;Lerner, B.; Martin, R.; McLaren, R.; Parrish, D. D.; Peischl, J.; Roberts,J. M.; Ryerson, T. B.; Thornton, J.; Warneke, C.; Williams, E. J.;Brown, S. S. Ozone photochemistry in an oil and natural gas extractionregion during winter: Simulations of a snow-free season in the UintahBasin, Utah. Atmos. Chem. Phys. 2013, 13 (17), 8955−8971.(108) Kemball-Cook, S.; Bar-Ilan, A.; Grant, J.; Parker, L.; Jung, J. G.;Santamaria, W.; Mathews, J.; Yarwood, G. Ozone impacts of naturalgas development in the Haynesville Shale. Environ. Sci. Technol. 2010,44 (24), 9357−9363.(109) McCarthy, M. C.; Aklilu, Y.; Brown, S. G.; Lyder, D. A. Sourceapportionment of volatile organic compounds measured in Edmonton,Alberta. Atmos. Environ. 2013, 81, 504−516.(110) Swarthout, R. F.; Russo, R. S.; Zhou, Y.; Hart, A. H.; Sive, B. C.Volatile organic compound distributions during the NACHTTcampaign at the Boulder Atmospheric Observatory: Influence ofurban and natural gas sources. J. Geophys. Res.: Atmos. 2013, 118 (18),10614−10637.(111) Rich, A.; Grover, J. P.; Sattler, M. L. An exploratory study of airemissions associated with shale gas development and production in theBarnett Shale. J. Air Waste Manage. Assoc. 2014, 64 (1), 61−72.
Environmental Science & Technology Critical Review
dx.doi.org/10.1021/es4053472 | Environ. Sci. Technol. XXXX, XXX, XXX−XXXJ
(112) Rodriguez, M. A.; Barna, M. G.; Moore, T. Regional impacts ofoil and gas development on ozone formation in the western UnitedStates. J. Air Waste Manage. Assoc. 2009, 59 (9), 1111−1118.(113) Schnell, R. C.; Oltmans, S. J.; Neely, R. R.; Endres, M. S.;Molenar, J. V.; White, A. B. Rapid photochemical production of ozoneat high concentrations in a rural site during winter. Nat. Geosci. 2009, 2(2), 120−122.(114) Carter, W. P. L.; Seinfeld, J. H. Winter ozone formation andVOC incremental reactivities in the Upper Green River Basin ofWyoming. Atmos. Environ. 2012, 50, 255−266.(115) Seinfeld, J. H.; Pandis, S. N. Atmospheric Chemistry and Physics;Wiley & Sons, Inc.: New York, 1998; p 1326.(116) US EPA. Ground Level Ozone. http://www.epa.gov/glo/index.html (accessed May 2013).(117) US EPA. eGRID (Emissions & Generation ResourceIntegrated Database); Clean Energy. http://www.epa.gov/cleanenergy/energy-resources/egrid/index.html (Feb. 20, 2014).(118) Zhang, H.; Li, J.; Ying, Q.; Guven, B. B.; Olaguer, E. P. Sourceapportionment of formaldehyde during TexAQS 2006 using a source-oriented chemical transport model. J. Geophys. Res.: Atmos. 2013, 118(3), 1525−1535.(119) Zhang, H.; Ying, Q. Contributions of local and regional sourcesof NOx to ozone concentrations in Southeast Texas. Atmos. Environ.2011, 45 (17), 2877−2887.(120) Watson, T. L.; Bachu, S. Evaluation of the potential for gas andCO2 leakage along wellbores. SPE Drill. Completion 2009, 24 (1),115−126.(121) PA DEP. Pennsylvania’s Plan for Addressing Problem ofAbandoned Wells and Orphaned Wells, Doc Number: 550-0800-001;PA DEP: Philadelphia, 2000.(122) NYSDEC. Well PluggingNYS Dept. of EnvironmentalConservation. http://www.dec.ny.gov/energy/92920.html (Feb. 21,2014).(123) US EPA. Emissions & Generation Resource IntegratedDatabase (eGRID)Clean Energy. http://www.epa.gov/cleanenergy/energy-resources/egrid/index.html (accessed Nov. 22,2013).(124) Zapata, C.; Muller, N.; Kleeman, M. PM2.5 co-benefits ofclimate change legislation part 1: California’s AB 32. Climatic Change2013, 117 (1−2), 377−397.(125) US EIA. Electric Power Monthly with Data for September 2013;US EIA: Washington, DC, 2013; http://www.eia.gov/electricity/monthly/pdf/epm.pdf.(126) US EIA. EnvironmentAnalysis & Projections. http://www.eia.gov/environment/emissions/carbon/ (accessed Nov. 22, 2013).(127) US EIA. Monthly Energy ReviewEnergy InformationAdministration. http://www.eia.gov/totalenergy/data/monthly/index.cfm#environment (accessed Nov. 22, 2013).(128) Venkatesh, A.; Jaramillo, P.; Griffin, W. M.; Matthews, H. S.Implications of near-term coal power plant retirement for SO2 andNOx and life cycle GHG emissions. Environ. Sci. Technol. 2012, 46(18), 9838−9845.(129) McFarland, E. Unconventional chemistry for unconventionalnatural gas. Science 2012, 338 (6105), 340−342.(130) Wadud, Z.; Khan, T. Air Quality and Climate Impacts due toCNG Conversion of Motor Vehicles in Dhaka, Bangladesh. Environ.Sci. Technol. 2013, 47 (24), 13907−13916.(131) Venkatesh, A.; Jaramillo, P.; Griffin, W. M.; Matthews, H. S.Uncertainty in Life Cycle Greenhouse Gas Emissions from UnitedStates Natural Gas End-Uses and Its Effects on Policy. Environ. Sci.Technol. 2011, 45 (19), 8182−8189.(132) Pennslyvania Department of Environmental Protection.Guidance for Performing Single Stationary Source Determinations forOil and Gas Industries; PA DEP: Philadelphia, 2012.(133) US EPA. Oil and Natural Gas Sector: Reconsideration ofCertain Provisions of New Source Performance Standards; EPA-HQ-OAR-2010−0505; FRL-9844-4. Federal Register 2013, 77 (184),58416−58448.
(134) US EPA. Heavy Trucks, Buses, and Engines. http://www.epa.gov/otaq/hd-hwy.htm (accessed Nov. 12, 2013).(135) US EPA. Nonroad Diesel Engines. http://www.epa.gov/otaq/nonroad-diesel.htm (accessed Nov. 12, 2013).(136) Wells, D. Condensate Tank Emissions, 2012. http://www.epa.gov/ttnchie1/conference/ei20/session6/dwells.pdf (accessed Nov 24,2013).(137) State Review of Oil & Natural Gas Environmental Regulations.Colorado Hydraulic Fracturing Review; State of Colorado: Denver, CO,2011.(138) TCEQ. Oil and Gas Facilities: Air Compliance Information.http://www.tceq.texas.gov/assistance/industry/oilgas_air.html (ac-cessed Nov 28, 2013).(139) Oltmans, S.; Schnell, R.; Johnson, B.; Pet́ron, G.; Mefford, T.;Neely, R. Anatomy of wintertime ozone associated with oil and naturalgas extraction activity in Wyoming and Utah. Elem. Sci. Anth. 2014,DOI: 10.12952/journal.elementa.000024.(140) PA DEP. Air Quality Permit Exemptions, Document No. 275-2101-003; Pennsylvania Department of Environmental Protection:Philadelphia, 2013.
Environmental Science & Technology Critical Review
dx.doi.org/10.1021/es4053472 | Environ. Sci. Technol. XXXX, XXX, XXX−XXXK