AIR FRANCE-KLM RESULTS PRESENTATION · which Transavia France 9.1% • Accelerated capacity growth...
41
AIR FRANCE-KLM RESULTS PRESENTATION Full Year 2018 20 February 2019
Transcript of AIR FRANCE-KLM RESULTS PRESENTATION · which Transavia France 9.1% • Accelerated capacity growth...

AIR FRANCE-KLM RESULTS PRESENTATION
Full Year 2018
20 February 2019

6,359 6,164
FY2017 FY2018
1,923 1,332
FY2017 FY2018
RESILIENT FULL YEAR RESULT DESPITE STRIKE IMPACT AND FUEL INCREASE
RASK(1)
At constant currency
Operating result
Passengers
Net debt
2
-€195m-€591m
(1) Group revenues per Available Seat Kilometer (RASK) Passenger + Transavia
(2) Restated for implementation of new IFRS accounting standards
+2.8%+1.1%
FY2017 FY2018 FY2017 FY2018
• More than 100 million passengers carried in 2018,
European leader for long-haul
• Successful expansion of Transavia in France and
the Netherlands and solid growth trend of MRO
third-party activity
• Significant progress in the social dialogue
> Air France: finalization of labor agreements for all
staff categories
> KLM: new CLAs implemented for all staff
categories(2) (2)
98.7m 101.4m
FINANCIAL REVIEW
FRÉDÉRIC GAGEY
Results at 31 December 2018

(1) Restated for implementation of new IFRS accounting standards
(2) Net income - group part one-off elements in Q4 2017:
- Positive effect of €47 million after tax in Q4 2017 resulting from IFRS 16 restatement of lease debt in dollars
- Non current expense impact of €1,195 million after tax in Q4 2017 related to KLM pension plan de-recognition
Excluding these one-offs, the change in Net income - group part Q4 2018 is €-438 million compared to last year.
Q4 2018: REVENUE INCREASE OF +4.1% AND AN OPERATING RESULT AT €40 MILLION AFTER SIGNIFICANT FUEL IMPACT
4
(1)
Change
at constant currency
Revenues (€ bn) 6.54 6.28 +4.1% +4.3%
EBITDA (€ m) 776 970 -20.0% -15.7%
Operating result (€ m) 40 228 -82.4% -77.7%
Operating margin 0.6% 3.6% -3.0 pt -2.3 pt
Net income - Group part (€ m) -218 -928 +710m
Q4 2018 Q4 2017 Change(1)
(2)

5
Q4 2018: REVENUE GROWTH SUPPORTED BY ALL BUSINESSES
(1) Passenger airline capacity = Available Seat Kilometers, Cargo capacity = Available Ton Kilometers, Group capacity = Equivalent Available Seat
Kilometers
(2) Unit revenues: Passenger airlines = revenue per Available Seat Kilometer, Cargo = revenue per Available Ton Kilometer, Group = revenue per
Equivalent Available Seat Kilometer
(3) 2017 restated for implementation of the new IFRS accounting standards
Capacity (1)
Unit
Revenue (2)
Constant Currency
Revenues
(€ m)Change
Operating result
(€ m)Change
(3) Operating margin Change (3)
+3.2% -0.1%
+0.7% +1.3%
Transavia +14.4% -0.9% 309 +12.0% -42 +20.4% -13.6% -1.0 pt
Maintenance 490 +5.4% 46 -27.8% 3.8% -2.0 pt
Group +3.7% -0.2% 6,538 +4.1% 40 -82.4% 0.6% -3.0 pt
0.6%Network 5,727 +3.7% 34 -82.9% -3.0 pt
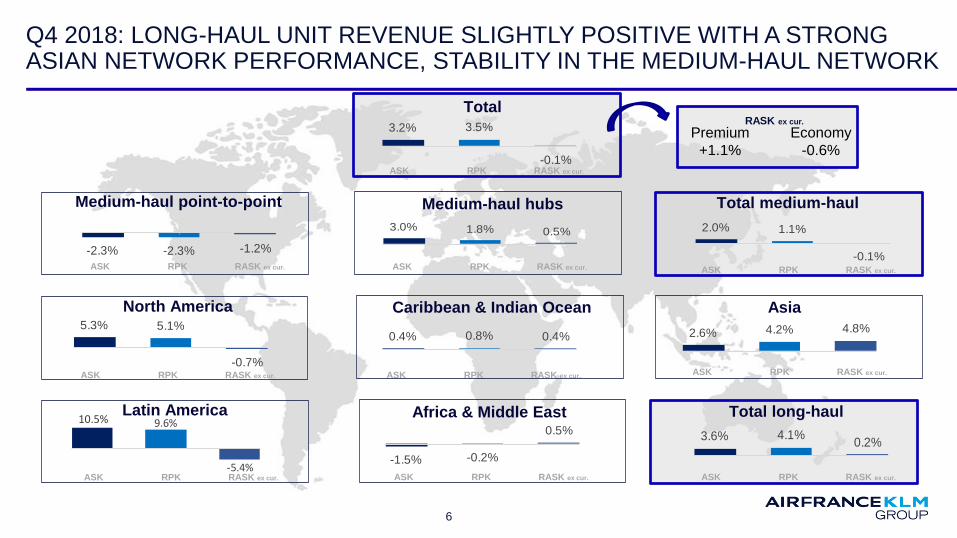
Q4 2018: LONG-HAUL UNIT REVENUE SLIGHTLY POSITIVE WITH A STRONG ASIAN NETWORK PERFORMANCE, STABILITY IN THE MEDIUM-HAUL NETWORK
AsiaCaribbean & Indian Ocean
Latin America Africa & Middle East Total long-haul
Total
Medium-haul point-to-point Medium-haul hubs Total medium-haul
ASK RPK RASK ex cur. ASK RPK RASK ex cur.ASK RPK RASK ex cur.
ASK RPK RASK ex cur. ASK RPK RASK ex cur. ASK RPK RASK ex cur.
ASK RPK RASK ex cur.
ASK RPK RASK ex cur. ASK RPK RASK ex cur. ASK RPK RASK ex cur.
Premium
+1.1%
Economy
-0.6%
RASK ex cur.
6
5.3% 5.1%
-0.7%
1
9.6%
-5.4%
1
2.6% 4.2% 4.8%
1
0.4% 0.8% 0.4%1
-1.5% -0.2%
0.5%1
3.6% 4.1%0.2%
1
3.2% 3.5%
-0.1%
1
3.0% 1.8% 0.5%1
2.0% 1.1%
-0.1%
1
-2.3% -2.3% -1.2%
1
10.5%
North America

3.0%
-0.9%+0.2%
-0.5%-3.5%
Reported
change
Currency effect Fuel price effect Pension effect At constant
currency, fuel
and pension
expenses
7
(1) 2017 restated for implementation of the new IFRS accounting standards
(1)
Q4 2018 UNIT COSTS DOWN -0.9%, FULL YEAR UNIT COSTS AT +0.6% IN LINE WITH GUIDANCE
+
• Q4 2018 cost efficiencies offsetting wage inflation
including retroactive booking
• Full Year 2018 unit cost +0.6% within guided target
range, and -0.2% net of strike impact
Underlying unit costQ4 2018

Q4 staff cost +3% and +1% excluding retroactive
booking of the new Air France labor agreement
Employee productivity +2.2% in Q4 (with capacity
+3.7%)
Q4 2018: LABOR PRODUCTIVITY IMPROVED, IMPLEMENTATION OF ANNUAL WAGE AGREEMENTS AT AIR FRANCE
+850 FTE
+3.0%
productivity(1)
51,600 52,450
31,950 32,350
+350 FTE
+1.3%
productivity(1)
Q4 2017 Q4 2018
Employee productivity
Average FTEs, including temporary staff
8
Q4 2017 Q4 2018
(1) Productivity measured in EASK/FTE
Change
at constant currency
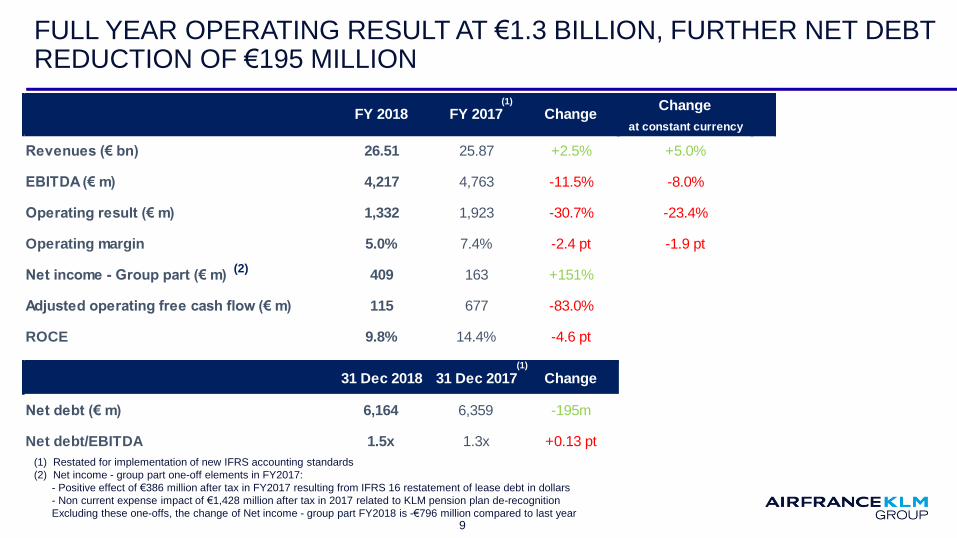
Revenues (€ bn) 26.51 25.87 +2.5% +5.0%
EBITDA (€ m) 4,217 4,763 -11.5% -8.0%
Operating result (€ m) 1,332 1,923 -30.7% -23.4%
Operating margin 5.0% 7.4% -2.4 pt -1.9 pt
Net income - Group part (€ m) 409 163 +151%
Adjusted operating free cash flow (€ m) 115 677 -83.0%
ROCE 9.8% 14.4% -4.6 pt
31 Dec 2018 31 Dec 2017 Change
Net debt (€ m) 6,164 6,359 -195m
Net debt/EBITDA 1.5x 1.3x +0.13 pt
FY 2018 FY 2017 Change
FULL YEAR OPERATING RESULT AT €1.3 BILLION, FURTHER NET DEBT REDUCTION OF €195 MILLION
9
(1)
(1)
(1) Restated for implementation of new IFRS accounting standards
(2) Net income - group part one-off elements in FY2017:
- Positive effect of €386 million after tax in FY2017 resulting from IFRS 16 restatement of lease debt in dollars
- Non current expense impact of €1,428 million after tax in 2017 related to KLM pension plan de-recognition
Excluding these one-offs, the change of Net income - group part FY2018 is -€796 million compared to last year
(2)
(1)

10
RESILIENT RESULTS DESPITE STRIKE IMPACT AND FUEL INCREASE, SUBSTANTIAL MARGIN AT TRANSAVIA
(1) Passenger airline capacity = Available Seat Kilometers, Cargo capacity = Available Ton Kilometers, Group capacity = Equivalent Available Seat Kilometers
(2) Unit revenues: Passenger airlines = revenue per Available Seat Kilometer, Cargo = revenue per Available Ton Kilometer, Group = revenue per Equivalent
Available Seat Kilometer
(3) 2017 restated for implementation of the new IFRS accounting standards
FY 2018Capacity
(1)
Unit
Revenue (2)
Constant Currency
Revenues
(€ m)Change
Operating result
(€ m)Change
(3) Operating margin Change (3)
+2.1% +1.1%
+0.1% +5.2%
Transavia +8.4% +3.6% 1,611 +12.2% 139 +18.0% 8.6% +0.4 pt
Maintenance 1,920 +6.6% 195 -22.5% 4.5% -1.6 pt
Group +2.4% +1.5% 26,515 +2.5% 1,332 -30.7% 5.0% -2.4 pt
4.3% -2.6 ptNetwork 22,943 +1.6% 994 -36.1%

NETWORK REVENUE INCREASE DRIVEN BY HIGHER UNIT REVENUES AND OPERATING RESULT IMPACTED BY STRIKES
11
• Q4 2018 Passenger unit revenues -0.1% at constant
currency, including the negative impact of protest
movements in France
• Full Year Passenger unit revenues at +1.1% at
constant currency despite negative strike effect
• Ancillaries revenues at €650 million, +10.8% in 2018
compared to last year
• Q4 2018 Cargo maintains positive unit revenues
(RATK) +1.3% at constant currency and Full Year 2018
at 5.2%, particularly driven by strength in Asia, North
America and Europe
• Both full freighters and bellies deliver an increased
positive contribution to the Network result compared to
last year

TRANSAVIA STRONG GROWTH AND A RECORD HIGH MARGIN
12
(2)
• Best result since launch of Transavia: operating result of €139
million and operating margin above 8% in the two companies, of
which Transavia France 9.1%
• Accelerated capacity growth in fourth quarter 2018 +14.4%,
ending 2018 with growth of +8.4%, of which +21% in France
• Transavia’s cost structure is well aligned with the low-cost
business model:
Maximizing use of aircraft, a single aircraft type
Simplicity of the product and fares, multiple options
Light organizational structure, outsourcing non-core activities,
strong synergies between the two subsidaries

13
(2)
• Several large contracts won for NextGen components and
Engines
• Third-party revenues maintain solid growth trend, margin
pressure partly due to one-offs
• For 2019, focus on margin through better optimization of
the turn-around-time and first effects of selective
tendering
In €mFY 2018 FY 2017 Change At constant
currency
Total revenues 4,349 4,155 +4.7%
Third-party revenues 1,920 1,801 +6.6% +11.0%
Operating result 195 252 -57 m -42 m
Operating margin 4.5% 6.1% -1.6 pt -1.4 pt
In $m 31 Dec 2018 31 Dec 2017 Change
Order book 11,400 10,800 +600 m
MAINTENANCE ORDER BOOK INCREASE CONTINUING
(1) Order book is the cumulative value of signed contracts with external customers and
may differ from the order book accounting definition in the financial statements
(1)

AIR FRANCE RESULT IMPACTED BY STRIKES, KLM DELIVERS A SOLID RESULT IN LINE WITH LAST YEAR’S PERFORMANCE
14
FY 2018
2017 restated for implementation of the new IFRS accounting standards
Capacity Revenues
(€ m)Change
Operating
result
(€ m)
ChangeOperating
marginChange
Net debt
(€ m)Change
+2.5% 16,073 +1.2% 266 -69.2% 1.7% -3.8 pt 3,556 -36
+2.3% 10,955 +5.0% 1,073 -0.5% 9.8% -0.5 pt 2,826 -454
+2.4% 26,515 +2.5% 1,332 -30.7% 5.0% -2.4 pt 6,164 -195

3,596
1,087
115
+246 -130 -2,625
-972
Cash flow before VDP
and change in WCR
Change in WCR Voluntary Departure
Plans
Net investments Operating Free Cash
Flow
Payment of lease debt Adjusted operating free
cash flow
POSITIVE ADJUSTED OPERATING FREE CASH FLOW DESPITE THE STRIKES
15(1) Adjusted operating free cash flow = Operating free cash flow with deduction of repayment of lease debt
In € m
(1)
(FY 2017: +3949)(FY 2017: +291) (FY 2017: -141) (FY 2017: -2438)
(FY 2017: -984)
(FY 2017: 677)
FY 2018
(FY 2017: +1661)

6,3596,164
+439+211
+242-972
-115
Net debt at 31 Dec2017
Payment of lease debt Adj.operating free cashflow
New lease debt Repurchase hybrid Currency & other Net debt at 31 Dec2018
NET DEBT REDUCED BY €195 MILLION YOY, INCLUDING REPURCHASE OF €197 MILLION OF HYBRID BONDS
16
1.3x
31 Dec 2017 31 Dec 2018
Net Debt / EBITDA
(1) Restated for implementation of the new IFRS accounting standards and restated again for 2017 base compared to
previous reporting by -€212 mln correction on IFRS leases, due to a revision of accounting for real-estate contracts
(2) Adjusted operating free cash flow = Operating free cash flow with deduction of repayment of lease debt
(3) Net Debt / EBITDA: 12 months sliding, see calculation in press release
(1)
(3)
(2)(1)
In € m
In € bn
Liquidity situation
1.5x 4.7 3.6
1.7 1.8
6.4 5.4
31 Dec 2017 31 Dec 2018
Net Debt evolution
Undrawn credit linesCash & Cash Equivalents
(including premium)

OUTLOOK
Results at 31 December 2018

REVENUE OUTLOOK
18
Long-haul forward booking load factor(change vs previous year)
Based on the current data for Passenger network:
Long-haul forward booking load factors from February to
April are on average stable compared to last year, and
positively oriented for the early summer,
First quarter passenger unit revenues at constant currency
expected below last year, due in part to the Easter shift.
-0 pt-2 pt
+2 pt +2 pt +2 pt
Feb-19 Mar-19 Apr-19 May-19 Jun-19
Easter effect

1.5 1.4 1.6 1.8 1.6
2018:
Fuel bill €4.9bn(2)
2019:
Fuel bill €5.6bn(2)
2020:
Fuel bill € 5.8bn(2)
$ bn
FUEL BILL INCREASE BY €650 MILLION IN 2019, EXPLAINED BY DIFFERENCE IN HEDGE IMPACT COMPARED TO 2018
5.8(1)
(1)
(1) Based on forward curve at 15 February 2019. Sensitivity computation based on 2019 fuel price, assuming constant crack spread between Brent
and Jet Fuel. Jet fuel price including into plane cost
(2) Assuming average exchange rate on US dollar/Euro of 1.18 for 2018, 1.14 for 2019 and 1.17 for 2020
2018
(1)
6.8(1)
2019
19
(1)(1)
(1)
2018 2019 2020 Q4 18 Q1 19 Q2 19 Q3 19 Q4 19
Brent ($ per bbl) (1) 72 65 64 68 63 66 66 65
Jet fuel ($ per metric ton) (1) 738 703 715 740 675 706 712 716
Jet fuel ($ per metric ton)(1) 651 693 717 683 658 686 708 717
% of consumption already hedged 60% 59% 33% 59% 61% 61% 61% 55%
Hedge result (in $ m) 800 100 0 150 50 50 0 0
Market
price
Price after
hedge
6.4(1)
2020
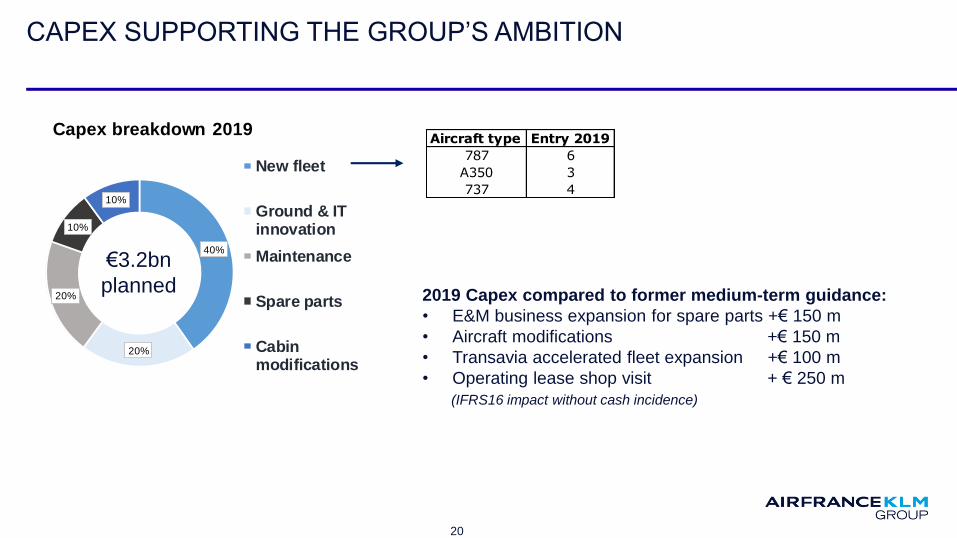
40%
20%
20%
10%
10%
Capex breakdown 2019
New fleet
Ground & ITinnovation
Maintenance
Spare parts
Cabinmodifications
CAPEX SUPPORTING THE GROUP’S AMBITION
20
€3.2bn
planned2019 Capex compared to former medium-term guidance:
• E&M business expansion for spare parts +€ 150 m
• Aircraft modifications +€ 150 m
• Transavia accelerated fleet expansion +€ 100 m
• Operating lease shop visit + € 250 m
(IFRS16 impact without cash incidence)
Aircraft type Entry 2019
787 6
A350 3
737 4

FULL YEAR GUIDANCE
21
Actual 2018 Guidance 2019
Passenger +2.1% +2.0% to +3.0%
Transavia +8.4% +9% to +11%
+€450m +€650m
€183m headwind Neutral effect
+0.6% -1% to 0%
€2.6bn €3.2bn
1.5x below 1.5xNet Debt / EBITDA
Capacity
Fuel
Currency
Unit cost ex-currency at
constant fuel price
Capex
(1)
(1) To align with industry practice, the metric EASK will not be used anymore as of 2019.
New Unit Cost definition will be: Net cost per Available Seat Kilometer at constant fuel and currency
The impact of this change should be approximately -0.1pt for 2019

STRATEGIC ORIENTATIONS
BENJAMIN SMITH
Results at 31 December 2018

23
74 new routes added in 2018
A STRONG POSITION IN THE COMPETITIVE AIRLINE MARKETPLACE
101m+ passengers carried in 2018
318 destinations in 118 countries
1.1m tons of cargo transported in 2018
88,800full-time employees+
548aircraft
2,000 aircraft maintained for 200+ clients

24
The European pillar
of the leading global airline partnership,
which includes Delta and China Eastern
Paris-CDG & Amsterdam-Schiphol:
2 of the largest connecting hubs
in Europe
Strong presence
in all major markets
The largest network
between Europe
and the rest of the world
Outstanding professionalism
and commitment of the Group employees
A STRONG POSITION IN THE COMPETITIVE AIRLINE MARKETPLACE
Leverage
our powerful
competitive
advantages

25
A STRONG POSITION IN THE COMPETITIVE AIRLINE MARKETPLACE…
…relying on strong brands benefiting from exceptional reputations
• The Group’s low-cost business
• Point-to-point flights to Europe
from the Netherlands and France
• Leader in hospitality, service
and digital services
• Globally recognized as premium
airline
• Strong French home market
• Connecting passengers
• An efficient network airline
• Primarly focused
on connecting customers
• A unique Dutch identity
26
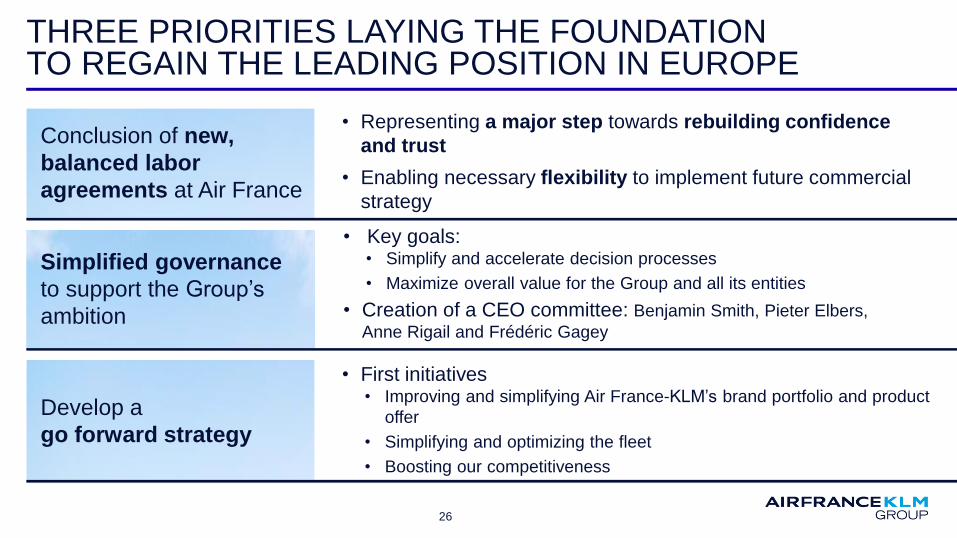
THREE PRIORITIES LAYING THE FOUNDATIONTO REGAIN THE LEADING POSITION IN EUROPE
Conclusion of new,
balanced labor
agreements at Air France
• Representing a major step towards rebuilding confidence
and trust
• Enabling necessary flexibility to implement future commercial
strategy
• First initiatives• Improving and simplifying Air France-KLM’s brand portfolio and product
offer
• Simplifying and optimizing the fleet
• Boosting our competitiveness
Develop a
go forward strategy
Simplified governance
to support the Group’s
ambition
• Key goals:• Simplify and accelerate decision processes
• Maximize overall value for the Group and all its entities
• Creation of a CEO committee: Benjamin Smith, Pieter Elbers,
Anne Rigail and Frédéric Gagey

27
SIMPLIFYING AND STRENGTHENING AIR FRANCE-KLM’SBRAND PORTFOLIO
From several over-lapping brands to a simplified brand portfolio
Objective: provide greater clarity for customers and more consistency with the Group's
global commercial product offer
• Decision to integrate Joon employees and aircraft into Air France, the latest cabin crew agreements
enable Air France to retain Joon’s cost savings through other means
• Air France regional fleet, currently under the HOP! brand, will wear the Air France HOP livery
2828
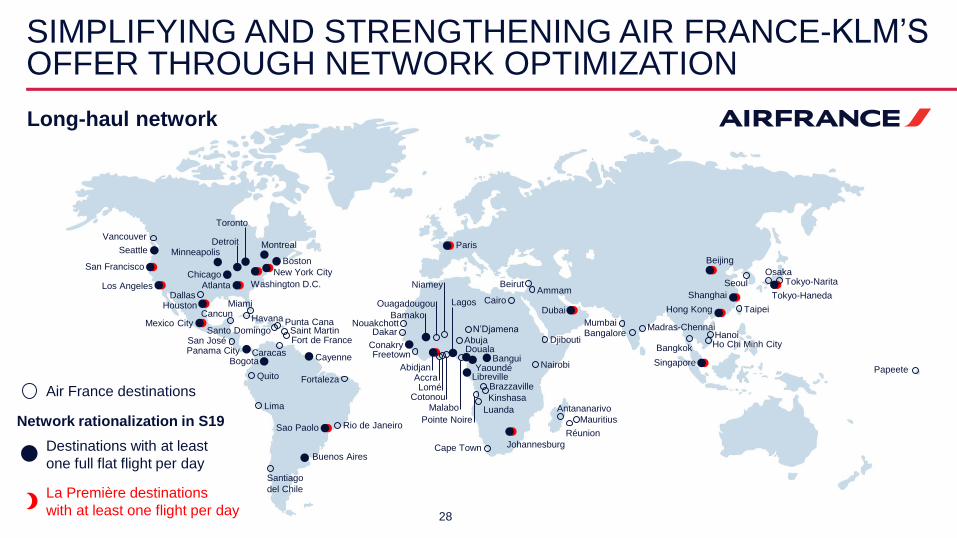
SIMPLIFYING AND STRENGTHENING AIR FRANCE-KLM’SOFFER THROUGH NETWORK OPTIMIZATION
La Première destinations
with at least one flight per day
Destinations with at least
one full flat flight per day
Mexico City
Panama City Bogota Cayenne
Houston
Los Angeles
San Francisco
Seattle
Atlanta Washington D.C.
New York City
Boston
Montreal
Chicago
Toronto
DetroitMinneapolis
Buenos Aires
Sao Paolo
Johannesburg
Dubai
Paris
Beijing
Tokyo-HanedaShanghai
Hong Kong
SingaporeAbidjan
LibrevilleYaoundé
Bangui
Lagos
Douala
Bamako
Conakry
Long-haul network
Air France destinations
Network rationalization in S19
Dallas
Vancouver
San José
CancunMiami
Havana
Saint MartinPunta Cana
Fort de France
Antananarivo
Mauritius
Réunion
Cape Town
Santo Domingo
Caracas
PapeeteQuito
Rio de Janeiro
Santiago
del Chile
Lima
Fortaleza
Abuja
AccraLomé
Cotonou Kinshasa
DakarDjibouti
Freetown
Brazzaville
LuandaMalabo
Nairobi
N’Djamena
Ouagadougou
Niamey
Nouakchott
Pointe Noire
CairoAmmam
Beirut
Mumbai
Bangkok
Bangalore
Tokyo-NaritaSeoul
HanoiHo Chi Minh City
Osaka
Taipei
Madras-Chennai

2929
SIMPLIFYING AND STRENGTHENING AIR FRANCE-KLM’SOFFER THROUGH NETWORK OPTIMIZATION
KLM destinations
Bogota
Aruba CuracaoBonaire
CartagenaPanama CityParamaribo
QuitoGuayaquil Fortaleza
Lima
Santiago
del Chile
Buenos Aires
Sao Paulo Rio de Janeiro
Houston
Atlanta
Washington D.C.New York City
Boston
Las VegasLos Angeles
Salt Lake CitySan Francisco Chicago
MinneapolisMontreal
Toronto
CalgaryEdmonton
Vancouver
Amsterdam
JohannesburgCape Town
Windhoek
Lagos
Luanda
AccraNairobi
EntebbeKigali
Arusha Dar es Salam
Muscat
Abu Dhabi
DubaiDammam
Kuwait CityTel Aviv
Bombay
New Delhi
TokyoSeoul
Beijing
Osaka
Shanghai
HangzhouChengdu
TaipeiXiamen
Hong Kong
Bangkok Manila
Kuala Lumpur
Singapore
JakartaDenpasar
Long-haul network

30
DELIVERING THE BEST PRODUCT OFFERTO OUR CLIENTS
• Right-sized cabins and more efficient
aircraft interior configurations, to serve each
market segment with appropriate gauge and
product
• Aircraft retrofit to latest cabin standards
to be accelerated• First Air France Airbus 330 retrofitted
on line two weeks ago
• Airbus 380 retrofit to be launched in 2020
• All aircraft retrofit completed at KLM
• Flight connectivity in all the Group’s
long-haul fleet in 2020

31
MEDIUM-HAUL
FLEET
• Tender offer to be launched in
2019
SIMPLIFYING AND OPTIMIZING THE FLEET
LONG-HAUL
FLEET
• Fuel efficient aircraft:
6 Boeing 787 and 3 Airbus 350 to enter the combined
fleet in 2019, more to come in the following years
• Ongoing phase out of the remaining
Air France Airbus 340 in 2020 and KLM Boeing 747 in
2021
• A380 fleet to decrease from 10 to 7 aircraft at the expiry
of the leases in 2020 and 2021
• Phase out of ATRs in 2020
REGIONAL
FLEET

32
BOOSTING OUR COMPETITIVENESS
The strategy of upgrading and simplifying the product offer and optimizing the fleet
aims to reinforce the Group’s competitiveness, and we will go further:
• Achieve Air France profitability in order to increase its margin to industry standards
• Improve the operational robustness, reducing fleet constraints and adding spare aircraft at
Air France
• Control our infrastructure costs, improving the relationship with ADP and Schiphol
airports
Reopening discussions with ADP for new terminal T4, to improve the customer experience and
operational performance
Maximise societal support for growing KLM at Schiphol
• In Europe, implementation of the conditions for a level playing field

Q&A
Results at 31 December 2018
APPENDIX
Results at 31 December 2018

LONG-HAUL AND MEDIUM-HAUL HUBS CONTRIBUTING TO POSITIVE UNIT REVENUE PERFORMANCE
Total long-haul
Total
Total medium-haul
ASK RPK RASK ex cur. ASK RPK RASK ex cur.ASK RPK RASK ex cur.
ASK RPK RASK ex cur. ASK RPK RASK ex cur. ASK RPK RASK ex cur.
ASK RPK RASK ex cur.
ASK RPK RASK ex cur. ASK RPK RASK ex cur. ASK RPK RASK ex cur.
Premium
+3.5%
Economy
+0.6%
RASK ex cur.
35
3.0% 3.4% 2.9%
1
2.1% 2.8% 2.0%
1
0.1% 0.9%
-0.4%
1
8.6% 8.7%
0.0%
1
-1.6% -0.7%
0.3%1 2.4% 3.1% 1.2%
1
2.1% 2.8% 1.1%1
-3.3% -1.4% -2.6%
11.7% 2.2% 2.8%
1
0.8% 1.6% 1.5%1
FY 2018
Latin America Africa & Middle East
Caribbean & Indian Ocean
Medium-haul hubs
AsiaNorth America
Medium-haul point-to-point
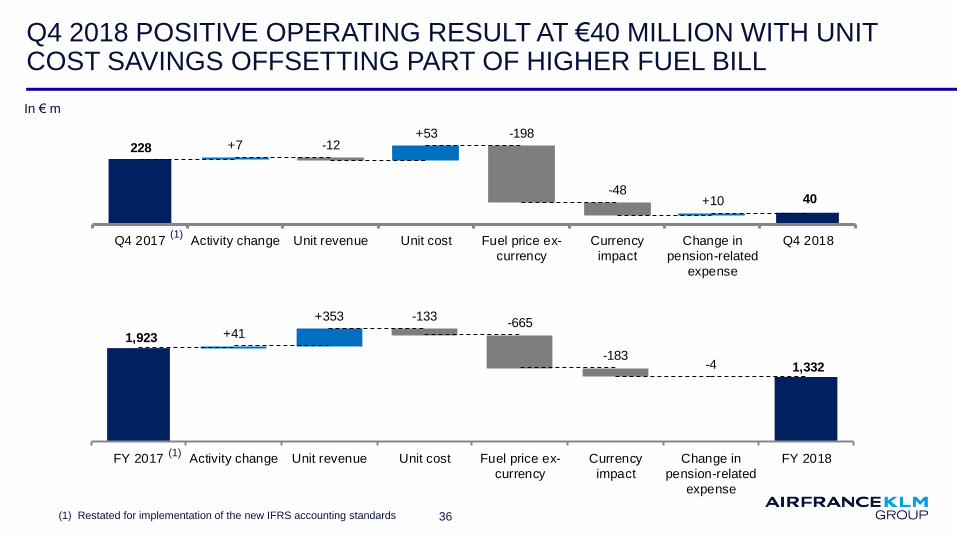
1,923
1,332
+41
+353 -133-665
-183-4
FY 2017 Activity change Unit revenue Unit cost Fuel price ex-
currency
Currency
impact
Change in
pension-related
expense
FY 2018
228
40
+7+53
+10
-12-198
-48
Q4 2017 Activity change Unit revenue Unit cost Fuel price ex-
currency
Currency
impact
Change in
pension-related
expense
Q4 2018
Q4 2018 POSITIVE OPERATING RESULT AT €40 MILLION WITH UNIT COST SAVINGS OFFSETTING PART OF HIGHER FUEL BILL
In € m
36
(1)
(1) Restated for implementation of the new IFRS accounting standards
(1)

FUEL BILL SENSITIVITY FOR FULL YEAR 2019
37
Based on forward curve at 15 february 2019. Sensitivity computation based on 2019 fuel price, assuming constant crack spread between Brent and Jet Fuel
Assuming average exchange rate on US dollar/Euro of 1.14 for 2019
$0 Bln
$1 Bln
$2 Bln
$3 Bln
$4 Bln
$5 Bln
$6 Bln
$7 Bln
$8 Bln
$9 Bln
$10 Bln
35 40 45 50 55 60 65 70 75 80 85 90 95 100
Fue
l bill
Brent price in USD/bl
Price before hedge (in $/bl) without ITP
Price after hedge (in $/bl) without ITP
Market 65.03 $/bblAFKL price 2019 64.00 $/bblHedge gain + 1.03 $/bbl
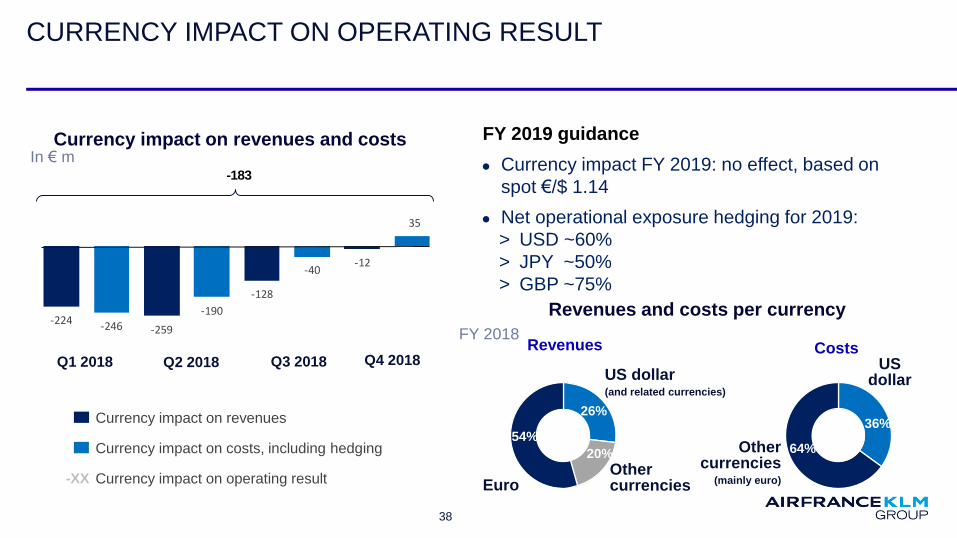
-224 -246 -259
-190
-128
-40 -12
35
CURRENCY IMPACT ON OPERATING RESULT
Currency impact FY 2019: no effect, based on
spot €/$ 1.14
Net operational exposure hedging for 2019:
> USD ~60%
> JPY ~50%
> GBP ~75%
Revenues
Euro
US dollar(and related currencies)
26%
20%
Othercurrencies
54%
Costs
36%
64%Other currencies
(mainly euro)
US dollar
Currency impact on revenues
Currency impact on costs, including hedging
Currency impact on operating result-XX
In € m
FY 2019 guidance
FY 2018
Revenues and costs per currency
Currency impact on revenues and costs
Q1 2018
38
Q3 2018Q2 2018
-183
Q4 2018
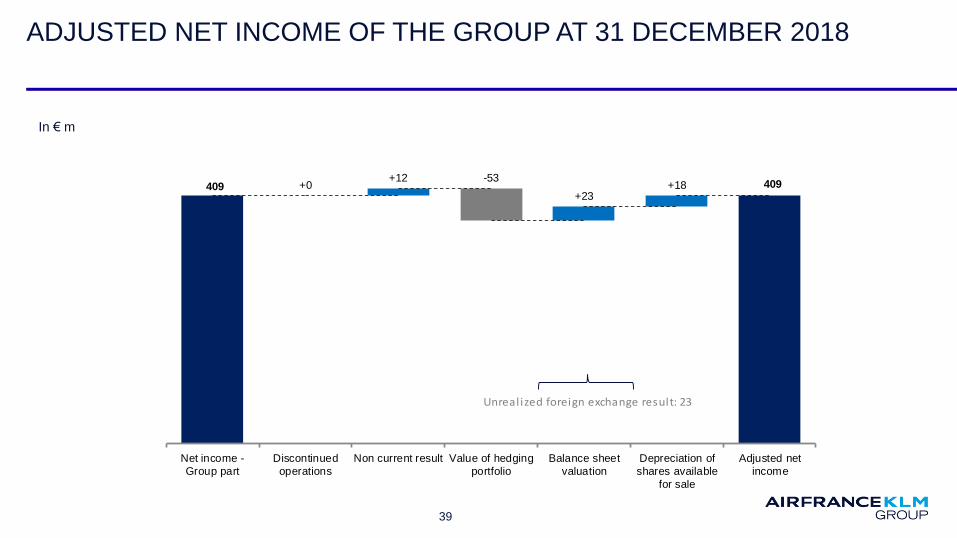
ADJUSTED NET INCOME OF THE GROUP AT 31 DECEMBER 2018
39
In € m
Unrealized foreign exchange result: 23
409 409+0+12
+23+18
-53
Net income -
Group part
Discontinued
operations
Non current result Value of hedging
portfolio
Balance sheet
valuation
Depreciation of
shares available
for sale
Adjusted net
income

-1,612 -1,767
1
PENSION DETAILS AT 31 DECEMBER 2018
Net balance sheet situation by airlineNet balance sheet situation by airline
Air France
Air France end of service benefit plan (ICS): pursuant to French regulations and the company agreement, every employee receives an end of
service indemnity payment on retirement (no mandatory funding requirement). ICS represents the main part of the Air France position
Air France pension plan (CRAF): related to ground staff affiliated to the CRAF until 31 December 1992
KLM
Defined benefit schemes for Ground Staff
31 Dec 2017
40
In € m
-1,679
67 1
-1,686
-81
1
31 Dec 2018
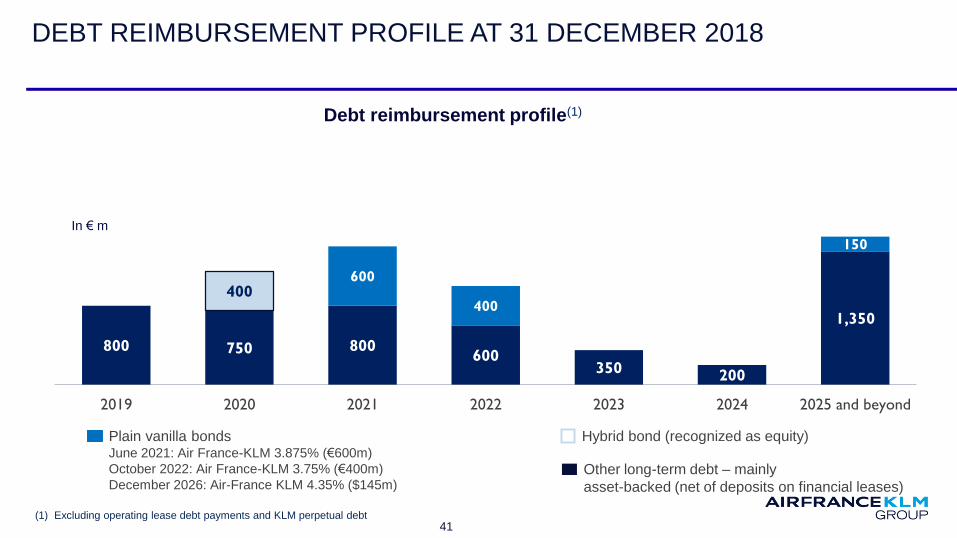
DEBT REIMBURSEMENT PROFILE AT 31 DECEMBER 2018
Plain vanilla bondsJune 2021: Air France-KLM 3.875% (€600m)
October 2022: Air France-KLM 3.75% (€400m)
December 2026: Air-France KLM 4.35% ($145m)Other long-term debt – mainly
asset-backed (net of deposits on financial leases)
Hybrid bond (recognized as equity)
Debt reimbursement profile(1)
800 750 800600
350200
1,350
600
400
150
400
2019 2020 2021 2022 2023 2024 2025 and beyond
In € m
41(1) Excluding operating lease debt payments and KLM perpetual debt