AIR FORCE INSTITUTE OF TECHNOLOGY · the third element of this DoD corporate vision: igniting a...
126
CUSTOMER-FOCUSED BUSINESS PRACTICE ADOPTION: A COMPARISON OF PRIVATE AND PUBLIC SECTOR IMPLEMENTATIONS THESIS James P. Swisher, Captain, USAF AFIT/GLM/ENS/04-19 DEPARTMENT OF THE AIR FORCE AIR UNIVERSITY AIR FORCE INSTITUTE OF TECHNOLOGY Wright-Patterson Air Force Base, Ohio APPROVED FOR PUBLIC RELEASE; DISTRIBUTION UNLIMITED.
Transcript of AIR FORCE INSTITUTE OF TECHNOLOGY · the third element of this DoD corporate vision: igniting a...

CUSTOMER-FOCUSED BUSINESS
PRACTICE ADOPTION:
A COMPARISON OF PRIVATE AND PUBLIC
SECTOR IMPLEMENTATIONS
THESIS
James P. Swisher, Captain, USAF
AFIT/GLM/ENS/04-19
DEPARTMENT OF THE AIR FORCE AIR UNIVERSITY
AIR FORCE INSTITUTE OF TECHNOLOGY
Wright-Patterson Air Force Base, Ohio
APPROVED FOR PUBLIC RELEASE; DISTRIBUTION UNLIMITED.

The views expressed in this thesis are those of the author and do not reflect the official policy or position of the United States Air Force, Department of Defense, or the United States Government.
AFIT/GLM/ENS/04-19
CUSTOMER-FOCUSED BUSINESS PRACTICE ADOPTION:
A COMPARISON OF PRIVATE AND PUBLIC SECTOR IMPLEMENTATIONS
THESIS
Presented to the Faculty
Department of Operational Sciences
Graduate School of Engineering and Management
Air Force Institute of Technology
Air University
Air Education and Training Command
In Partial Fulfillment of the Requirements for the
Degree of Master of Science in Logistics Management
James P. Swisher, BS
Captain, USAF
March 2004
APPROVED FOR PUBLIC RELEASE; DISTRIBUTION UNLIMITED.
AFIT/GLM/ENS/04-19
CUSTOMER-FOCUSED BUSINESS PRACTICE ADOPTION:
A COMPARISON OF PRIVATE AND PUBLIC SECTOR IMPLEMENTATIONS
James P. Swisher, BS Captain, USAF
Approved: ____________________________________ Stephan P. Brady, Lt Col (USAF) (Chair) date ____________________________________ Marvin A. Arostegui, Lt Col (USAF) (Member) date
iv
AFIT/GLM/ENS/04-19
Abstract
This thesis evaluates a variety of documented cases of customer-focused business
practice initiatives to discern common principles of implementation within the private
and public sectors. The business practices Quality, Activity-Based Costing (ABC),
Customer Profitability Analysis (CPA), and Customer Relationship Management (CRM)
were found to be the major techniques utilized over the past three decades. Cases were
collected which documented implementation of these customer-focused business
practices in the private and public sectors.
Using grounded theory methodology, the implementations were analyzed for
emerging concepts. The concepts uncovered in this study were further analyzed through
a comparison of private and public sector implementations. This research revealed
similarities and differences between the implementations in the private and public sectors
and provides a framework of common generalizable principles for further testing.
The concepts which emerged are of particular interest to government managers
seeking improvement in their organization. Managers can use the information discovered
in this research to increase their knowledge of a basic conceptual framework in which
implementations of customer-focused business practices were conducted.

v
Acknowledgments
I would like to express my sincere appreciation to my faculty advisor, Lt. Col.
Stephan Brady, for his guidance, support, and vision during this thesis effort. He
provided me the inspiration that was needed when it seemed this project was at a dead
end. Additionally, as the research progressed, the paths that were chosen were not
always successful; but I appreciate the latitude I was provided to freely explore the
possibilities.
I would also like to thank my reader, Lt. Col. Arostegui for his inputs and advice
he provided as this research project neared the finish line. His added perspective helped
to hone the final product into a higher quality work.
Last but not least, I thank my family. The road to graduation has not always been
smooth and I appreciate the support I received from my wife and daughters. They were
kind when I was frustrated, they comforted me when I was tired, and they showed
patience when I was not at home.
Although the actual course work and thesis research in this program are
considered an individual effort…I couldn’t have done it without the support of those
around me…I’m truly thankful for the special people who helped me along the way.
James P. Swisher
vi
Table of Contents
Page Abstract ........................................................................................................................... iv
Acknowledgments.............................................................................................................v List of Figures ............................................................................................................... viii List of Tables ................................................................................................................... x I. Introduction .............................................................................................................1 General Issue............................................................................................................1 Background and Overview ......................................................................................3 Problem Statement ...................................................................................................5 Research Question ...................................................................................................5 Investigative Questions............................................................................................6 Summary and Conclusion ........................................................................................6 II. Review of Literature ................................................................................................7 Chapter Overview ....................................................................................................7 Quality......................................................................................................................8 Dr. Deming ........................................................................................................8 Dr. Juran...........................................................................................................10 Activity-Based Costing..........................................................................................13 Customer Profitability Analysis.............................................................................16 Customer Relationship Management .....................................................................23 Defense Logistics Agency: Brief Improvement History…………………………27 Summary and Conclusion ......................................................................................36 III. Methodology..........................................................................................................37 Chapter Overview ..................................................................................................37 Method Comparison...............................................................................................37 Strategy of Inquiry .................................................................................................40 Case Study Definition ............................................................................................41 Case Study Application..........................................................................................42 Types of Case Studies............................................................................................43 Grounded Theory Definition..................................................................................43 Grounded Theory Application ...............................................................................44 Case Selection........................................................................................................46 Data Analysis .........................................................................................................48
vii
Page Validity and Reliability..........................................................................................51 Summary and Conclusion ......................................................................................56 IV. Analysis and Results ..............................................................................................57 Chapter Overview ..................................................................................................57 Investigative Question One....................................................................................57 Data Analysis .........................................................................................................60 Investigative Question Three ...........................................................................62 Concept Development......................................................................................63 Investigative Question Two .............................................................................69 Investigative Question Four.............................................................................73 Investigative Question Five .............................................................................79 Research Findings..................................................................................................84 Summary and Conclusion ......................................................................................85 V. Discussion ..............................................................................................................86 Chapter Overview ..................................................................................................86 Findings..................................................................................................................86 Limitations .............................................................................................................87 Managerial Significance ........................................................................................88 Recommendations for Future Research .................................................................90 Research Summary ................................................................................................91 Appendix A. Case Summary..........................................................................................92 Appendix B. Concept Matrix.......................................................................................105 Bibliography .................................................................................................................107
viii
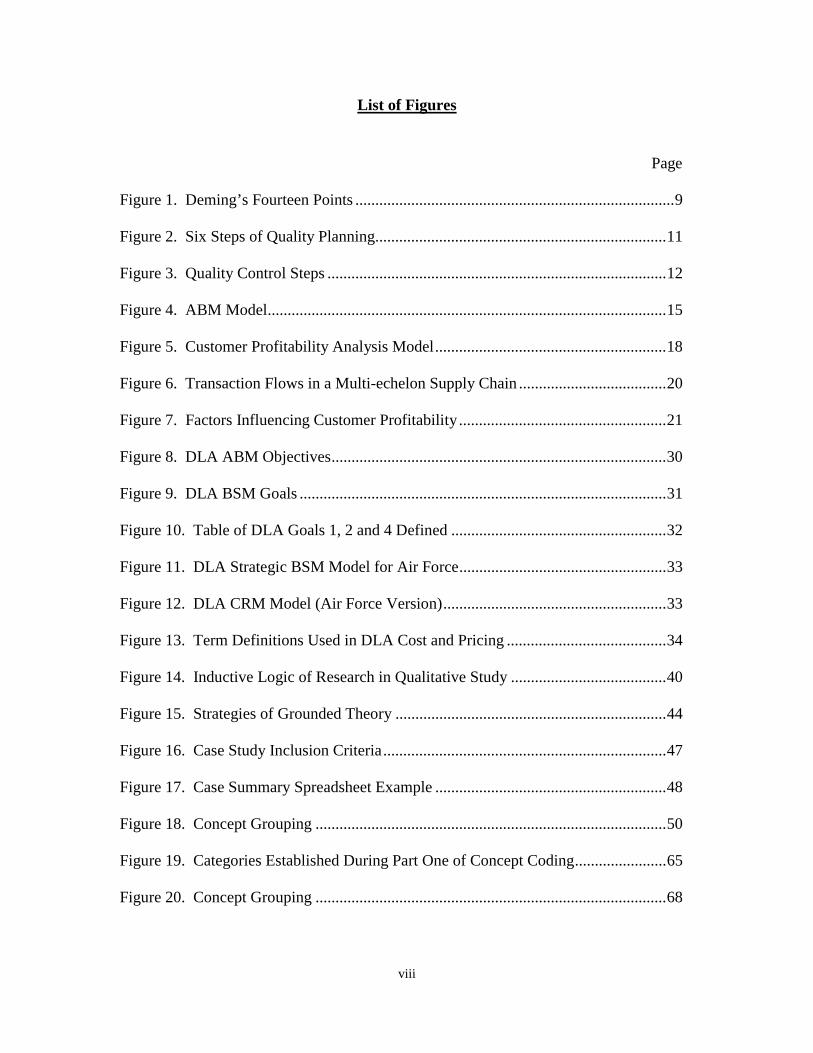
List of Figures
Page Figure 1. Deming’s Fourteen Points ................................................................................9 Figure 2. Six Steps of Quality Planning.........................................................................11 Figure 3. Quality Control Steps .....................................................................................12 Figure 4. ABM Model....................................................................................................15 Figure 5. Customer Profitability Analysis Model..........................................................18 Figure 6. Transaction Flows in a Multi-echelon Supply Chain .....................................20 Figure 7. Factors Influencing Customer Profitability ....................................................21 Figure 8. DLA ABM Objectives....................................................................................30 Figure 9. DLA BSM Goals ............................................................................................31 Figure 10. Table of DLA Goals 1, 2 and 4 Defined ......................................................32 Figure 11. DLA Strategic BSM Model for Air Force....................................................33 Figure 12. DLA CRM Model (Air Force Version)........................................................33 Figure 13. Term Definitions Used in DLA Cost and Pricing ........................................34 Figure 14. Inductive Logic of Research in Qualitative Study .......................................40 Figure 15. Strategies of Grounded Theory ....................................................................44 Figure 16. Case Study Inclusion Criteria.......................................................................47 Figure 17. Case Summary Spreadsheet Example ..........................................................48 Figure 18. Concept Grouping ........................................................................................50 Figure 19. Categories Established During Part One of Concept Coding.......................65 Figure 20. Concept Grouping ........................................................................................68

ix
Page Figure 21. Summary of Common Principles in Private-Sector Implementations .........73 Figure 22. Summary of Common Principles in Public-Sector Implementations...........78 Figure 23. Common Principles of Implementation........................................................87
x
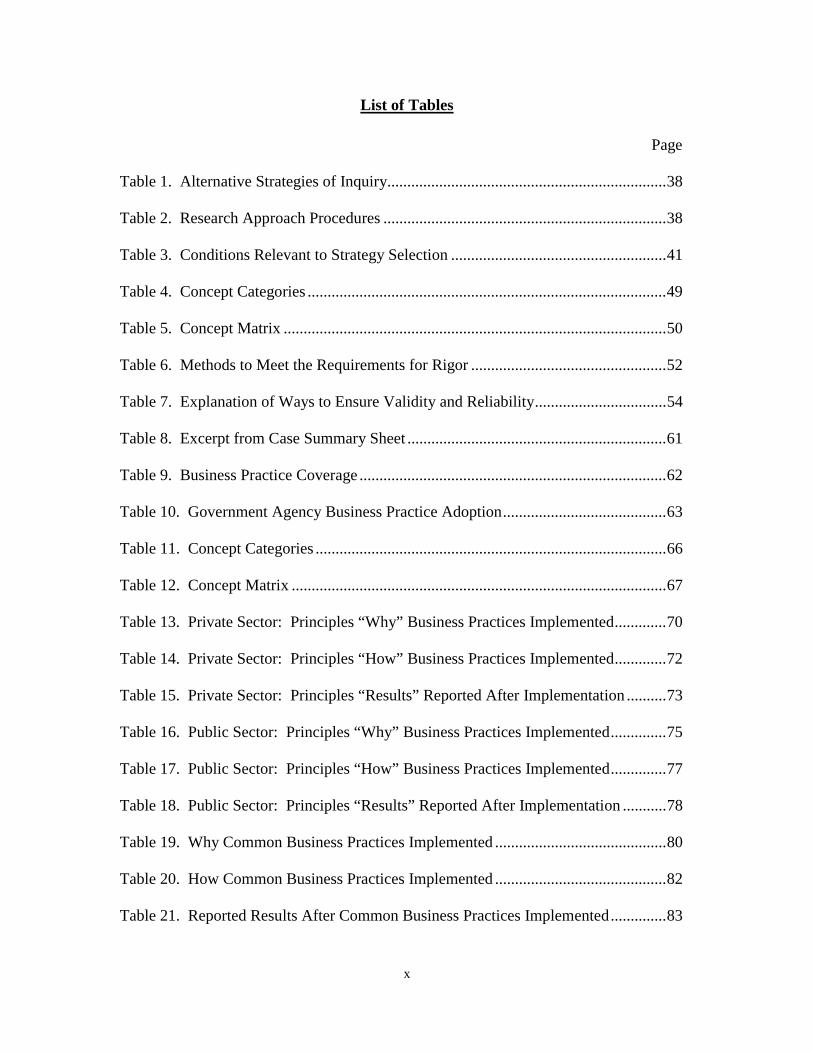
List of Tables
Page Table 1. Alternative Strategies of Inquiry......................................................................38 Table 2. Research Approach Procedures .......................................................................38 Table 3. Conditions Relevant to Strategy Selection ......................................................41 Table 4. Concept Categories ..........................................................................................49 Table 5. Concept Matrix ................................................................................................50 Table 6. Methods to Meet the Requirements for Rigor .................................................52 Table 7. Explanation of Ways to Ensure Validity and Reliability.................................54 Table 8. Excerpt from Case Summary Sheet .................................................................61 Table 9. Business Practice Coverage .............................................................................62 Table 10. Government Agency Business Practice Adoption.........................................63 Table 11. Concept Categories ........................................................................................66 Table 12. Concept Matrix ..............................................................................................67 Table 13. Private Sector: Principles “Why” Business Practices Implemented.............70 Table 14. Private Sector: Principles “How” Business Practices Implemented.............72 Table 15. Private Sector: Principles “Results” Reported After Implementation ..........73 Table 16. Public Sector: Principles “Why” Business Practices Implemented..............75 Table 17. Public Sector: Principles “How” Business Practices Implemented..............77 Table 18. Public Sector: Principles “Results” Reported After Implementation ...........78 Table 19. Why Common Business Practices Implemented ...........................................80 Table 20. How Common Business Practices Implemented ...........................................82 Table 21. Reported Results After Common Business Practices Implemented..............83
1
CUSTOMER-FOCUSED BUSINESS PRACTICE ADOPTION:
A COMPARISON OF PRIVATE AND PUBLIC SECTOR IMPLEMENTATIONS
I. Introduction
General Issue
In basic capitalistic economic theory, a firm exists to create a profit; a public
agency exists to serve citizens. Although their purposes differ, both are similar in that
resources are consumed in order to provide a product or service. “It is contended that
private businesses are innately more efficient than public agencies. The reason is not that
lazy and incompetent workers somehow end up in the public sector, while the ambitious
and capable gravitate to the private sector. Rather, it is that the market system creates
incentives and pressures for internal efficiency which are absent in the public sector”
(McConnell and Brue, 1996:624). Economic efficiency is further defined by McConnell
and Brue (1996) as obtaining the largest possible output of a good or service from the
smallest possible input of resources. Due to the nature of commercial, for-profit firms,
methods to improve efficiency are continuously explored; these improvements are sought
across the entire organization from production to customer service strategies.
Public-sector agencies have not always been concerned with efficiency. In 1986,
Michael Dulworth and Brian Usilaner of the Government Accounting Office presented
evidence which demonstrated the, then recent, change. “The private sector’s concern
with productivity improvement has only recently spilled over into the federal
2
government. There are many reasons for this heightened awareness, including the $200
billion federal deficits, the Balanced Budget and Emergency Deficit Control Act of 1985,
new policies and priorities under the Reagan administration, and the publicity associated
with private sector productivity problems” (Dulworth and Usilaner, 1986:26).
The techniques of interest in this study are those which seek to improve efficiency
of the organization as a whole, not just one aspect such as a production line. Some
methods are strictly management policies or techniques where others are more
philosophical in nature and relate to overhauling organization culture. Are the same
efficiency improvement techniques directly applied to public not-for-profit entities? How
does the improvement technique look, comparatively speaking, when used by a
government agency?
Looking back 30 years, it is readily apparent that customer-focused business
practices have been applied to public organizations. Although not implemented to
increase profits, efficiency improvement methods have been adopted in order to decrease
costs and/or increase the effectiveness of the organization in providing their services.
As in commercial business, public not-for-profits vary in size. Small public
agencies are found at the municipal level while larger organizations exist at the federal
level. Public-sector agencies are mostly government organizations. Not-for-profits in the
public sector also include charitable and grass-roots community organizations; however,
these agencies are not of interest here. From city management to the Department of
Defense (DoD), public entities exist to serve the public. The organizations have many
different functions; but each organization clearly provides some type of “public” service
usually based on the organization’s purpose. At one end of the spectrum, city
3
governments provide services to their citizens such as refuse collection, municipal
structure, utility services and recreation areas. The DoD, at the other end of the
spectrum, provides security services for our nation.
In order to aid readers of this study, a few definitions are in order. First, the terms
not-for-profit and public sector are used interchangeably in reference to government
agencies. Second, a for-profit firm is referred to as a commercial sector organization,
private-sector firm, or, the firm.
Background and Overview
Recent evidence in support of the assertion that government agencies seek to
improve is found in the 1997 Defense Reform Initiative. In 1997, the DoD published the
Defense Reform Initiative stating the DoD plan for meeting the requirements of the
national defense strategy. A key part of this initiative is the focus on transforming the
DoD into a leaner, more agile organization. “The Defense Reform Initiative addresses
the third element of this DoD corporate vision: igniting a revolution in business affairs
within DoD that will bring to the Department management techniques and business
practices that have restored American corporations to leadership in the marketplace”
(DoD, 1997).
The plan identified four key methods to be used for the transformation:
Reengineer, Consolidate, Compete, and Eliminate. First, Reengineering was defined as
adopting modern business practices to improve and achieve world-class standards of
performance. Next, Consolidation was defined as streamlining organizations to decrease
redundancies and increase synergies. The method of Compete also addressed common
business practices and was defined as applying market mechanisms to improve quality,
4
reduce costs, and respond to customer needs. The last method, Eliminate, was defined as
reducing excess support to free resources and permit a focus on core competencies (DoD,
1997).
The current Secretary of Defense, Donald Rumsfeld furthers the view that the
DoD needs to improve operations.
Our challenge is to transform not just the way we deter and defend, but the way we conduct our daily business. Let's make no mistake: The modernization of the Department of Defense is a matter of some urgency. In fact, it could be said that it's a matter of life and death, ultimately, every American's. We must develop and build weapons to deter those new threats. We must rebuild our infrastructure, which is in a very serious state of disrepair. And we must assure that the noble cause of military service remains the high calling that will attract the very best. All this costs money. It costs more than we have. It demands agility -- more than today's bureaucracy allows. And that means we must recognize another transformation: the revolution in management, technology and business practices. Successful modern businesses are leaner and less hierarchical than ever before. They reward innovation and they share information. They have to be nimble in the face of rapid change or they die. Business enterprises die if they fail to adapt, and the fact that they can fail and die is what provides the incentive to survive. But governments can't die, so we need to find other incentives for bureaucracy to adapt and improve. (Rumsfeld, 2001).
One can reason the dynamic environment of defense, in which the DoD operates,
would require a different approach to efficiency improvements; therefore, a static model
developed from theory and practice in the private sector may not be a direct fit. This
research aims to examine how customer-focused business practices have been applied to
public sector not-for-profit organizations and to determine if a difference exists,
compared to the private sector, in the implementations of the business practices.
5
The purpose of the research is not to determine the factors of a successful
approach, as volumes of information of this type exists in the fields of organizational
behavior, change management, and leadership; but rather to provide a broad exploration,
a generalization, of how the efficiency improvements have been adopted.
Problem Statement
Public-sector organizations routinely face a fiscal dilemma as funding to provide
their service is derived each year from local, state, or federal budgets. For example, the
DoD is funded each year through their allocation of the federal budget. As such,
government agencies are inherently required to constantly search for better, more
efficient methods of doing business. Since commercial-sector organizations must
generate profits or fail, government looks to for-profit firms for ideas which may improve
government organization efficiencies. Public agency leaders are charged by citizens to
provide their services at the best cost to the public; therefore, many commercial business
practices migrate into the public sector. The primary focus in this research is on
government organizations in the public sector, but the results should be applicable to any
not-for-profit organization. This research seeks to identify what generalizable principles
of customer-focused business practice adoption exist and how those principles in public-
sector implementations differ from private-sector implementations in order to enable
government managers to better achieve their organization’s objectives.
Research Question
How do the common generalizable principles of private-sector customer-focused
business practice implementation compare to public-sector agency implementation?
6
Investigative Questions
In order to address what common principles exist and how private-sector use
differs from public-sector use, certain investigative questions should be answered.
• What are the recent customer-focused business practices used to improve
operations?
• What are the common principles of recent customer-focused business practice
implementations in private-sector entities?
• Which of the recent customer-focused business practices determined from the
answer to investigative question one have been implemented by public-sector
agencies?
• What are the common principles of recent customer-focused business practice
implementations in public-sector entities?
• Do the common principles of commercial implementations match principles of
implementations in public-sector entities?
Research and analysis will be based on answering these questions.
Summary and Conclusion
This chapter presented an overview of this thesis project. A problem statement
was provided, and an overarching research question was stated. Five investigative
questions were given which will be used to guide the focus of the research process in
order to derive an answer to the research question. Subsequent chapters will cover the
matter in more depth and reveal the appropriate data analysis formulated to provide valid
and reliable results. Chapter II will examine common business practice techniques and
philosophies that evolved over the past three decades to improve efficiency and profit.
7
II. Review of Literature
Chapter Overview A review of the relevant literature, the existing body of knowledge, was
conducted in order to answer the first investigative question and determine the common
business practices which have evolved over the past thirty years. Although work has
been done on individual business practice implementation, no works were found during
the literature review that specifically addressed overall generalizable principles of
customer-focused business practice adoption within government. This thesis aims to
contribute to the body of knowledge by uncovering some generalizable principles of
customer-focused business practice adoption within the public sector.
This chapter will examine common customer-focused business practice
techniques and philosophies which have evolved over the past three decades which have
been applied to improve efficiency and profit. The improvement techniques discussed
will be Quality, Activity Based Costing (ABC), Customer Profitability Analysis (CPA),
and Customer Relationship Management (CRM). These methods were subjectively
chosen by the author as they were found to be the most popularly written about topics in
business journals, textbooks, and periodicals covering the past three decades. As such,
many public-sector organizations have adopted these methods. The business practices
will be presented in the same chronological order as they occurred. In order to provide a
clearer context of this research, the chapter will close with a brief history of some
customer-focused business practices that have been implemented by the DoD’s main
supplier of consumable goods, the Defense Logistics Agency (DLA).
8
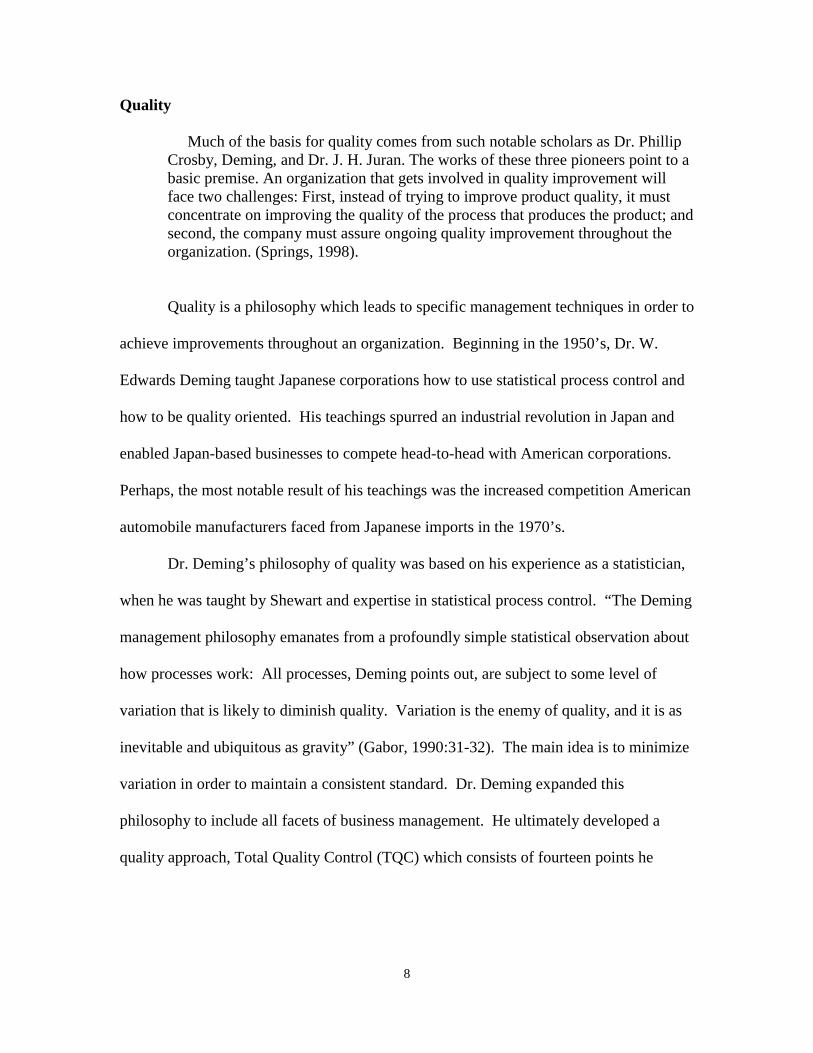
Quality
Much of the basis for quality comes from such notable scholars as Dr. Phillip Crosby, Deming, and Dr. J. H. Juran. The works of these three pioneers point to a basic premise. An organization that gets involved in quality improvement will face two challenges: First, instead of trying to improve product quality, it must concentrate on improving the quality of the process that produces the product; and second, the company must assure ongoing quality improvement throughout the organization. (Springs, 1998).
Quality is a philosophy which leads to specific management techniques in order to
achieve improvements throughout an organization. Beginning in the 1950’s, Dr. W.
Edwards Deming taught Japanese corporations how to use statistical process control and
how to be quality oriented. His teachings spurred an industrial revolution in Japan and
enabled Japan-based businesses to compete head-to-head with American corporations.
Perhaps, the most notable result of his teachings was the increased competition American
automobile manufacturers faced from Japanese imports in the 1970’s.
Dr. Deming’s philosophy of quality was based on his experience as a statistician,
when he was taught by Shewart and expertise in statistical process control. “The Deming
management philosophy emanates from a profoundly simple statistical observation about
how processes work: All processes, Deming points out, are subject to some level of
variation that is likely to diminish quality. Variation is the enemy of quality, and it is as
inevitable and ubiquitous as gravity” (Gabor, 1990:31-32). The main idea is to minimize
variation in order to maintain a consistent standard. Dr. Deming expanded this
philosophy to include all facets of business management. He ultimately developed a
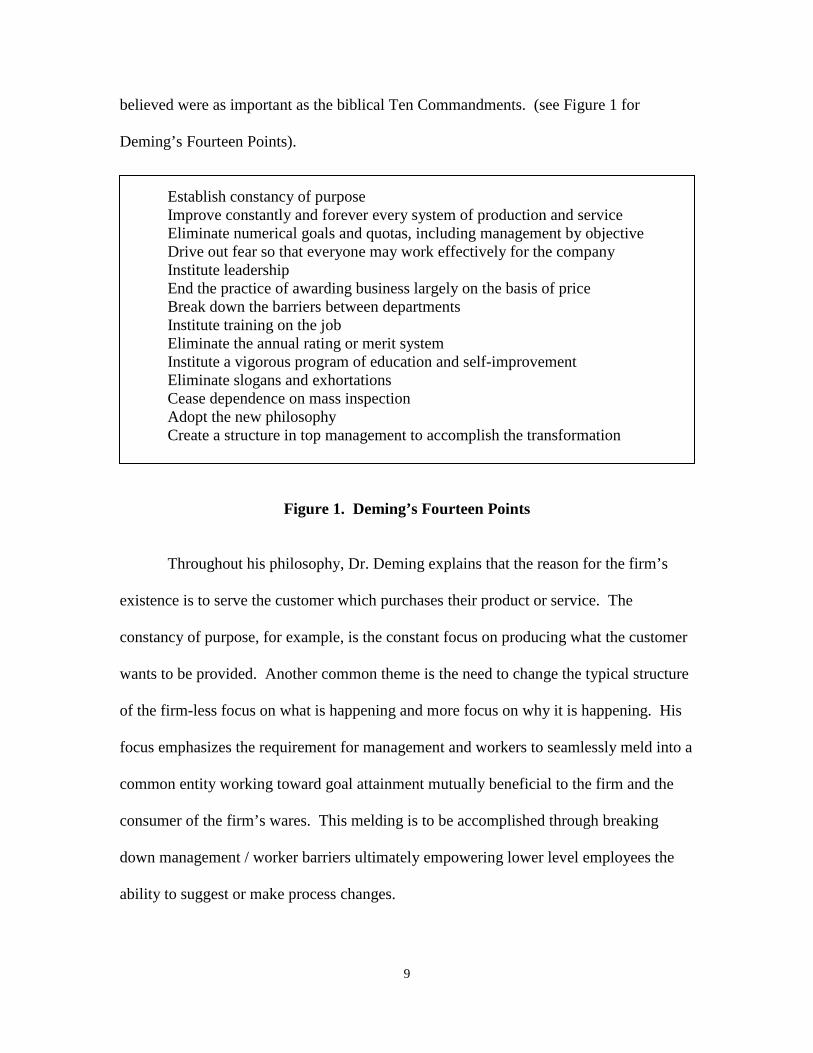
quality approach, Total Quality Control (TQC) which consists of fourteen points he
9
believed were as important as the biblical Ten Commandments. (see Figure 1 for
Deming’s Fourteen Points).
Establish constancy of purpose Improve constantly and forever every system of production and service Eliminate numerical goals and quotas, including management by objective Drive out fear so that everyone may work effectively for the company Institute leadership End the practice of awarding business largely on the basis of price Break down the barriers between departments Institute training on the job Eliminate the annual rating or merit system Institute a vigorous program of education and self-improvement Eliminate slogans and exhortations Cease dependence on mass inspection Adopt the new philosophy Create a structure in top management to accomplish the transformation
Figure 1. Deming’s Fourteen Points
Throughout his philosophy, Dr. Deming explains that the reason for the firm’s
existence is to serve the customer which purchases their product or service. The
constancy of purpose, for example, is the constant focus on producing what the customer
wants to be provided. Another common theme is the need to change the typical structure
of the firm-less focus on what is happening and more focus on why it is happening. His
focus emphasizes the requirement for management and workers to seamlessly meld into a
common entity working toward goal attainment mutually beneficial to the firm and the
consumer of the firm’s wares. This melding is to be accomplished through breaking
down management / worker barriers ultimately empowering lower level employees the
ability to suggest or make process changes.
10
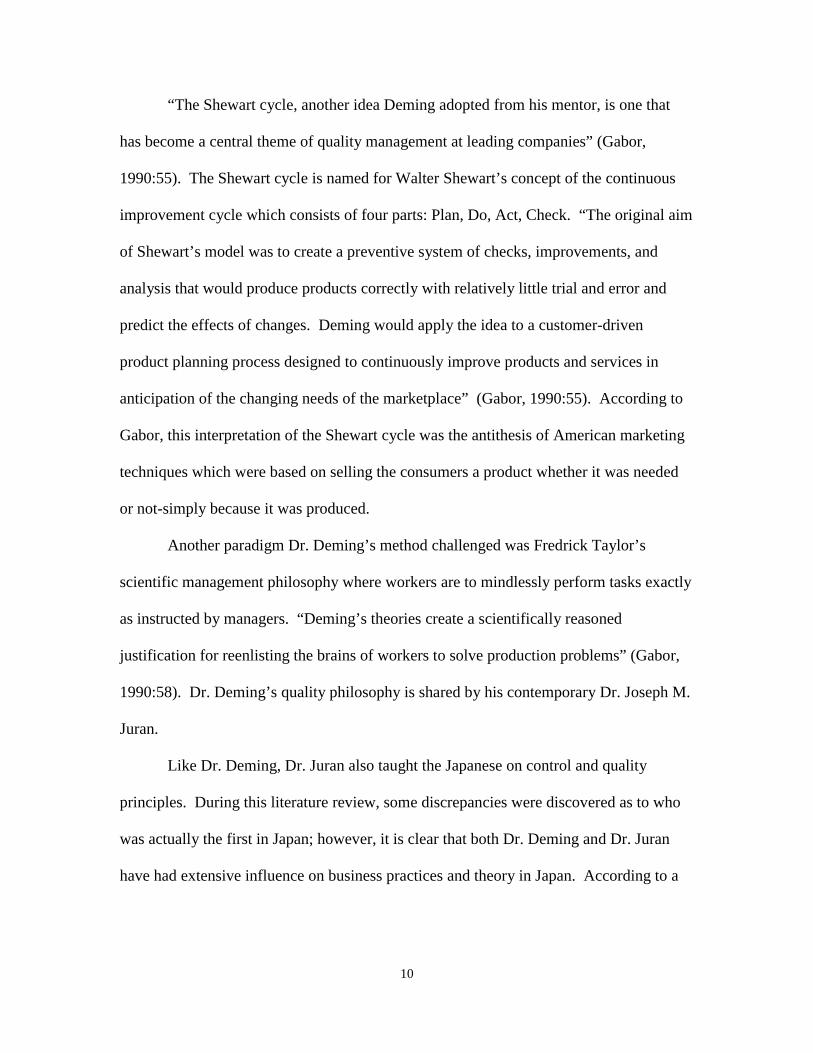
“The Shewart cycle, another idea Deming adopted from his mentor, is one that
has become a central theme of quality management at leading companies” (Gabor,
1990:55). The Shewart cycle is named for Walter Shewart’s concept of the continuous
improvement cycle which consists of four parts: Plan, Do, Act, Check. “The original aim
of Shewart’s model was to create a preventive system of checks, improvements, and
analysis that would produce products correctly with relatively little trial and error and
predict the effects of changes. Deming would apply the idea to a customer-driven
product planning process designed to continuously improve products and services in
anticipation of the changing needs of the marketplace” (Gabor, 1990:55). According to
Gabor, this interpretation of the Shewart cycle was the antithesis of American marketing
techniques which were based on selling the consumers a product whether it was needed
or not-simply because it was produced.
Another paradigm Dr. Deming’s method challenged was Fredrick Taylor’s
scientific management philosophy where workers are to mindlessly perform tasks exactly
as instructed by managers. “Deming’s theories create a scientifically reasoned
justification for reenlisting the brains of workers to solve production problems” (Gabor,
1990:58). Dr. Deming’s quality philosophy is shared by his contemporary Dr. Joseph M.
Juran.
Like Dr. Deming, Dr. Juran also taught the Japanese on control and quality
principles. During this literature review, some discrepancies were discovered as to who
was actually the first in Japan; however, it is clear that both Dr. Deming and Dr. Juran
have had extensive influence on business practices and theory in Japan. According to a
11
film about Dr. Juran, “An Immigrant’s Gift” produced by Howland Blackiston, Dr. Juran
lectured the Japanese on quality after Dr. Deming.
Dr. Juran’s focus on quality is derived from a study of management. His assertion
is that managers exist to either make changes (breakthrough) or prevent change from
occurring (control) (Juran, 1995). Like Dr. Deming, Dr. Juran also proclaims quality is
not a reactive process; it is a proactive business philosophy. He has been credited with
formulating the philosophy of Total Quality Management (TQM) and has developed a
quality trilogy which is trademarked as the Juran Trilogy® consisting of three elements:
Quality Planning, Quality Improvement, and Quality Control.
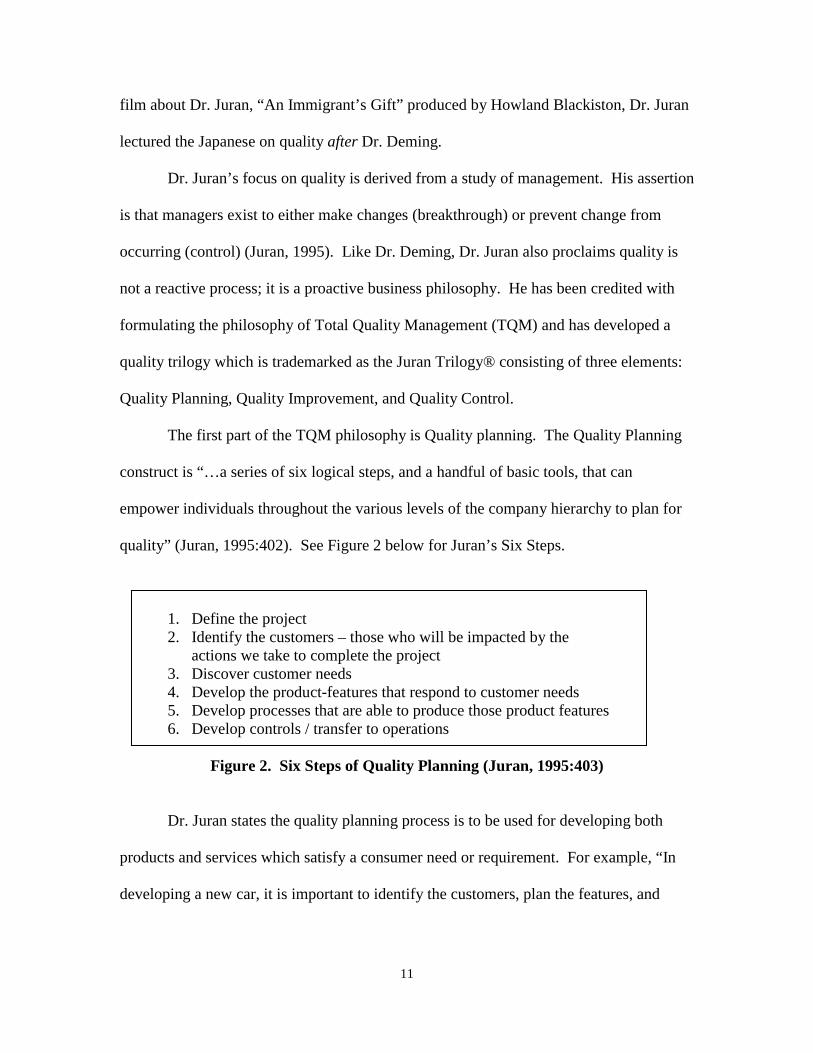
The first part of the TQM philosophy is Quality planning. The Quality Planning
construct is “…a series of six logical steps, and a handful of basic tools, that can
empower individuals throughout the various levels of the company hierarchy to plan for
quality” (Juran, 1995:402). See Figure 2 below for Juran’s Six Steps.
1. Define the project 2. Identify the customers – those who will be impacted by the
actions we take to complete the project 3. Discover customer needs 4. Develop the product-features that respond to customer needs 5. Develop processes that are able to produce those product features 6. Develop controls / transfer to operations
Figure 2. Six Steps of Quality Planning (Juran, 1995:403)
Dr. Juran states the quality planning process is to be used for developing both
products and services which satisfy a consumer need or requirement. For example, “In
developing a new car, it is important to identify the customers, plan the features, and
12
design the production processes and process controls. The exact same steps are required
for developing new services-whether that service takes the form of a credit card that earns
frequent flyer miles, a pay-per-view cable TV service, or a call answering capability
offered by the telephone company” (Juran, 1995:404).
The second component of the trilogy, Quality Improvement, is a discipline which
concentrates on improving the level of performance of a particular process. Dr. Juran
provides three sources from which improvement can be derived. The first is elimination
of the causes of variance which cause deviation from established standards. Next is
increasing effectiveness through increased diligence such as making better use of
facilities, knowledge, and vendor relationships. The last source of improvement can be
found by establishing a higher level of effectiveness by “Breakthrough”. Dr. Juran posits
“Breakthrough” is the organized method in which process change occurs (Juran, 1995).
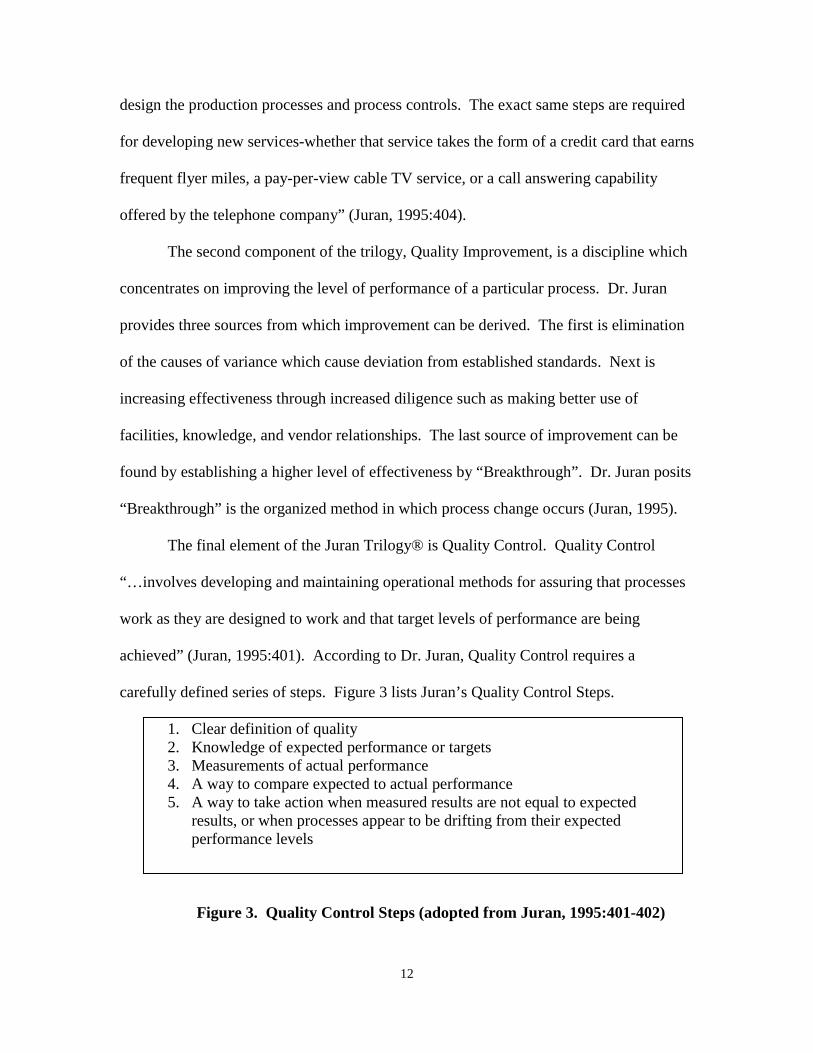
The final element of the Juran Trilogy® is Quality Control. Quality Control
“…involves developing and maintaining operational methods for assuring that processes
work as they are designed to work and that target levels of performance are being
achieved” (Juran, 1995:401). According to Dr. Juran, Quality Control requires a
carefully defined series of steps. Figure 3 lists Juran’s Quality Control Steps.
1. Clear definition of quality 2. Knowledge of expected performance or targets 3. Measurements of actual performance 4. A way to compare expected to actual performance 5. A way to take action when measured results are not equal to expected
results, or when processes appear to be drifting from their expected performance levels
Figure 3. Quality Control Steps (adopted from Juran, 1995:401-402)
13
Dr. Juran further states that any organization pursuing quality “…should create an
all-pervasive unity so that everyone will know which is the new direction, and will be
stimulated to go there” (1995:429). The purpose of the trilogy is to provide the means to
achieve this cohesiveness and address the forces which cause resistance to change. “Such
an obstacle can be overcome if we are able to find a universal thought process-a universal
way of thinking about quality-which fits all functions, all levels, all product lines”
(1995:429). Quality Planning addresses the quality features required and how they will
be delivered, Quality Improvement addresses current deficiencies in goods or services,
and Quality Control is used to maintain the results achieved in Quality Planning and
Quality Improvement.
The quality movement provided a need for a method of collecting accurate cost
information. Traditional cost-accounting methods were recognized as incapable of
providing information of value to managers and were usually completely ignored during
this time. Nonetheless, when seeking improvement throughout a for-profit firm, many
decisions were made which required some type of cost data analysis. The new method
born of this requirement was Activity-Based Costing (ABC).
Activity Based Costing
Activity Based Costing (ABC) is a method of assigning costs according to the
activities resources perform on the object which consumes the resource. “The two-stage
assignment process enables ABC to overcome the traditional volume-based allocation
techniques. The approach directly addresses the management and control of overhead
costs within an organization” (Pohlen and La Londe, 1994:8). It differs from traditional
cost accounting (TCA) methods in that the goals are 180 degrees opposite: TCA
14
methods’ objective is to allocate all costs while ABC’s objective is to assign costs
specifically to the object which generates the cost. ABC allows for specific cost focus at
either the product or customer level. “ABC measures process and activity performance,
determines the cost of business process outputs, and identifies opportunities to improve
process efficiency and effectiveness” (DoD, 1995).
Under generally accepted accounting principles (GAAP), the accounting systems
do not include information about customers or accurate product cost information on
financial reports. Additionally, the problems created by GAAP are argued as obstacles to
organization improvement. Before ABC, firms made process changes without knowing
the “true” cost of the change.
“As competition increased, and as the basis of competition shifted away from the
efficient use of direct labor and machines, managers needed more accurate information
about the costs of processes, products, and customers than they could obtain from the
system used for external financial reporting. ABC “…systems emerged in the mid-1980s
to meet the need for accurate information about the cost of resource demands by
individual products, services, customers, and channels” (Kaplan and Cooper, 1998:3).
Many authors have proclaimed the benefits of ABC since the mid 1980s. Howell
and Soucy provide support and argued current cost management practice was inadequate
and only useful when assigning costs to products at an aggregate level (1990).
Reichebacher supports the case for ABC with three main points: “...product/service costs
aggregated in accounts separate from customer, sales/marketing/service costs collected
separate from customers, and accounting systems exist in proud isolation from each other
due to fragmented corporate operations” (2003). Robert S. Kaplan and Robin Cooper of
15
the Harvard Business School further demonstrate ABC is the only accounting method
managers should use when looking for improvement opportunities or weighing decisions.
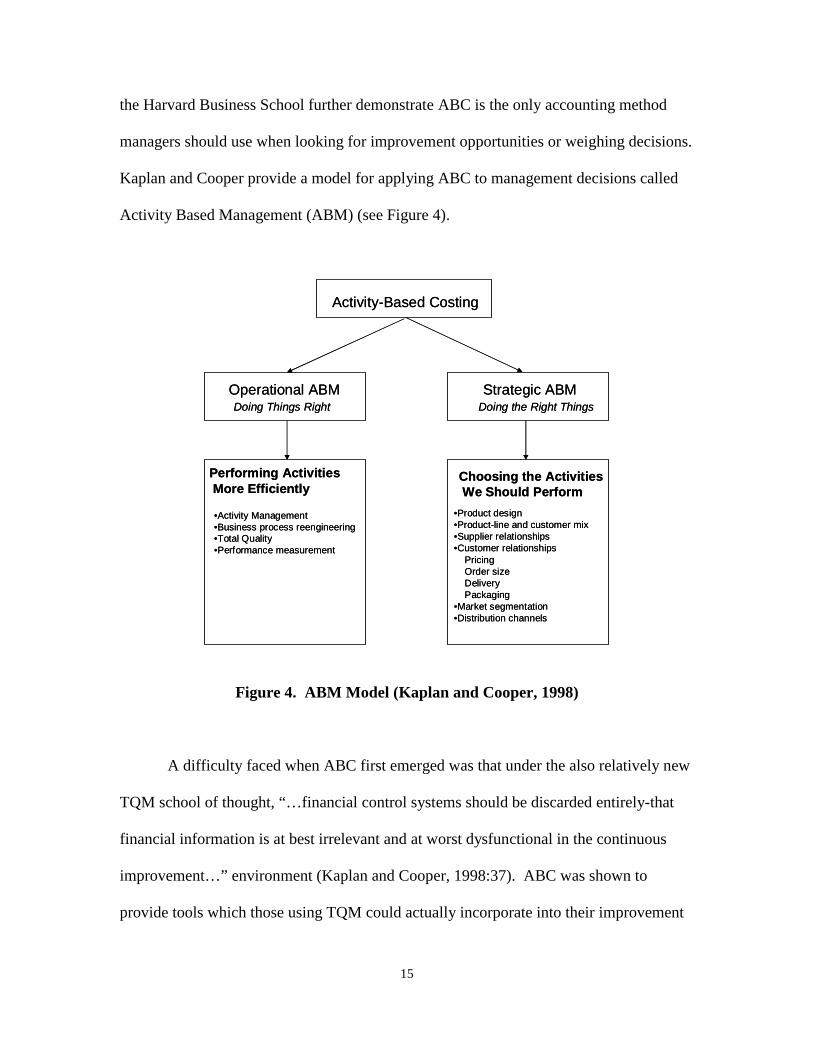
Kaplan and Cooper provide a model for applying ABC to management decisions called
Activity Based Management (ABM) (see Figure 4).
Figure 4. ABM Model (Kaplan and Cooper, 1998)
A difficulty faced when ABC first emerged was that under the also relatively new
TQM school of thought, “…financial control systems should be discarded entirely-that
financial information is at best irrelevant and at worst dysfunctional in the continuous
improvement…” environment (Kaplan and Cooper, 1998:37). ABC was shown to
provide tools which those using TQM could actually incorporate into their improvement
Activity-Based Costing
Operational ABM Strategic ABMDoing Things Right Doing the Right Things
Performing ActivitiesMore Efficiently
•Activity Management•Business process reengineering•Total Quality•Performance measurement
Choosing the ActivitiesWe Should Perform
•Product design•Product-line and customer mix•Supplier relationships•Customer relationships
PricingOrder sizeDeliveryPackaging
•Market segmentation•Distribution channels
16
processes and leverage the benefits of their process changes. “ABC supports continuous
process improvement by identifying where incremental improvements at the activity level
can improve overall enterprise performance” (Pohlen and La Londe, 1994:10). Analysis
of ABC generated reports at the customer level provided the jumping-off point for the
next method of improvement-Customer Profitability Analysis.
Customer Profitability Analysis
The idea of Customer Profitability Analysis (CPA) is still relatively new as the
earliest article found on CPA was written less than 15 years ago; “Customer Profitability:
As Critical as Product Profitability” by Robert A. Howell and Stephen R. Soucy in
Management Accounting, October 1990. CPA is an extension of Activity Based Costing
(ABC). ABC analysis is used to assign costs directly traceable to specific
company/customer interactions. ABC must be used because traditional accounting
systems are “...ill equipped to support customer profitability analysis” (Reichebacher,
2003). This is an important point because customers are both revenue generators and
revenue consumers for every business.
The idea of CPA is to analyze customer costs and revenues and determine which
customers are profitable, which customers are not profitable, and why. Customers can
then be ranked by profit contribution and customer profit profiles can be established.
Once a firm identifies its “unprofitables,” Kaplan and Cooper explain a firm may
transform “...unprofitable customers into profitable ones through targeted negotiations:
on price, on product mix and variety, on delivery terms, and distribution and payment
arrangements” (1998:189). According to Reichebacher, CPA is used to restore the link
between customers and costs. Similarly, Howell and Soucy state “...effective use of
17
customer profitability information will greatly enhance a company’s ability to direct the
right services to the right customer” (1990).
“Customer profitability analysis provides the capability to determine how
individual customers or customer groupings contribute to profitability. All sales do not
contribute to profitability in equal proportions. Some customers consume more logistics
resources than others do. Firms have tailored their logistics services to satisfy specific
customer requirements. “Fragmentation” of the supply chain suggests wide differences
may occur in the amount of logistics resources, or costs, required to support individual
customers” (La Londe & Ginter, 1999). Forrester Research, Inc. surveyed 33 Global
2500 companies and bolsters La Londe and Ginter’s finding—“Customers with identical
revenue potential vary widely when it comes to acquisition and service costs” (Chatham,
2000).
Firms today must look toward the entire supply chain in order to gain a
competitive edge, or maybe more so to just remain competitive. According to William
Copacino, author of Supply Chain Management: The Basics and Beyond (1997), “In
almost every industry, supply chain has become a much more important strategic and
competitive variable. It affects all of the shareholder value levers – cost, customer
service, asset productivity, and revenue generation” (2003). Tradeoffs are required
throughout the chain. CPA can provide firms the ability to more accurately determine
costs and find “hidden” profits. Niraj, Gupta, and Chakravarthi developed a CPA model
for the supply chain in 2001 with their work “Customer Profitability in a Supply Chain”
(2001). These authors demonstrate the need to look both upstream and downstream in
the supply chain as customers generate costs affecting the chain. “Companies that
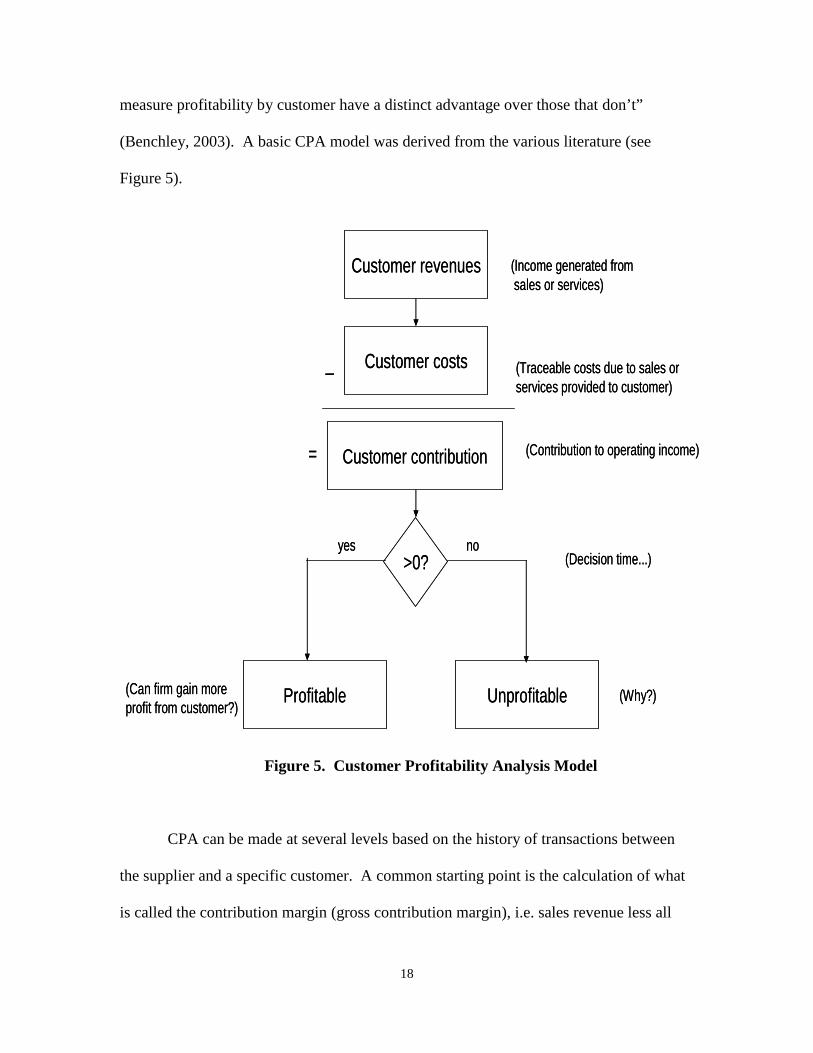
18
measure profitability by customer have a distinct advantage over those that don’t”
(Benchley, 2003). A basic CPA model was derived from the various literature (see
Figure 5).
Figure 5. Customer Profitability Analysis Model
CPA can be made at several levels based on the history of transactions between
the supplier and a specific customer. A common starting point is the calculation of what
is called the contribution margin (gross contribution margin), i.e. sales revenue less all
Customer revenues
Customer costs
Customer contribution
Profitable
_
Unprofitable
(Income generated fromsales or services)
(Traceable costs due to sales orservices provided to customer)
=
>0?yes
(Contribution to operating income)
(Decision time...)
(Why?)(Can firm gain moreprofit from customer?)
no
Customer revenues
Customer costs
Customer contribution
Profitable
_
Unprofitable
(Income generated fromsales or services)
(Traceable costs due to sales orservices provided to customer)
=
>0?yes
(Contribution to operating income)
(Decision time...)
(Why?)(Can firm gain moreprofit from customer?)
no
19
product-related expenses for all products sold to an individual customer during one
particular period of time (Wang & Splegel, 1994). Next, depending on the availability of
data, sales, general and administrative expenses traceable to the individual customer are
subtracted (Cooper & Kaplan, 1991, Howell & Soucy, 1990). One can then study the
result of the calculations: the operating profit generated by the customer. An extension of
this line of thinking is the computation of ‘‘customer return on assets’’, i.e. customer
profitability divided by e.g. the sum of accounts receivable and inventory (Rust et al
1996). Also, when CPA is applied to a supply chain, the entire chain should use ABC in
order to compute the costs from end to end. More specifically, data is needed on costs of
delivery, quality, flexibility, and service performance (Niraj, Gupta, and Narasimhan,
2001).
Customer profitability is also referred to as a value with future worth in some
writings. Lifetime Profitability Customer Analysis (LPCA) is a broader view of CPA.
“In this case, it often takes the form of the output from a net present value analysis”
(Söderlund & Vilgon, 1999). The output is referred to as the ‘‘lifetime value’’ of a
customer. A customer’s lifetime value is defined as the stream of expected future profits
on a customer’s transactions, discounted at some appropriate rate back to its current net
present value (Peppers & Rogers 1997:32). Under LCPA, the analysis looks further
back historically and forecasts into the future. Zaman (2002) states “Under the LCPA, all
the revenues and costs that will occur during the entire life of a customer relationship can
accurately be measured using...” ABC.
Niraj, Gupta, and Narasimhan (2001) extend the application of CPA to the supply
chain. “Estimating current profitability at the individual customer level is important to
20
distinguish the more profitable customers from the less profitable ones. This is also the
first step in developing estimates of customers’ lifetime values. This exercise, however,
takes on additional complexities when applied to an intermediary in a supply chain, such
as a distributor, because the costs of servicing a retail customer include not only those
incurred directly in servicing this customer” (2001). This view seems to be the broadest
application of CPA and, as the authors suggest, the most complex to accomplish.
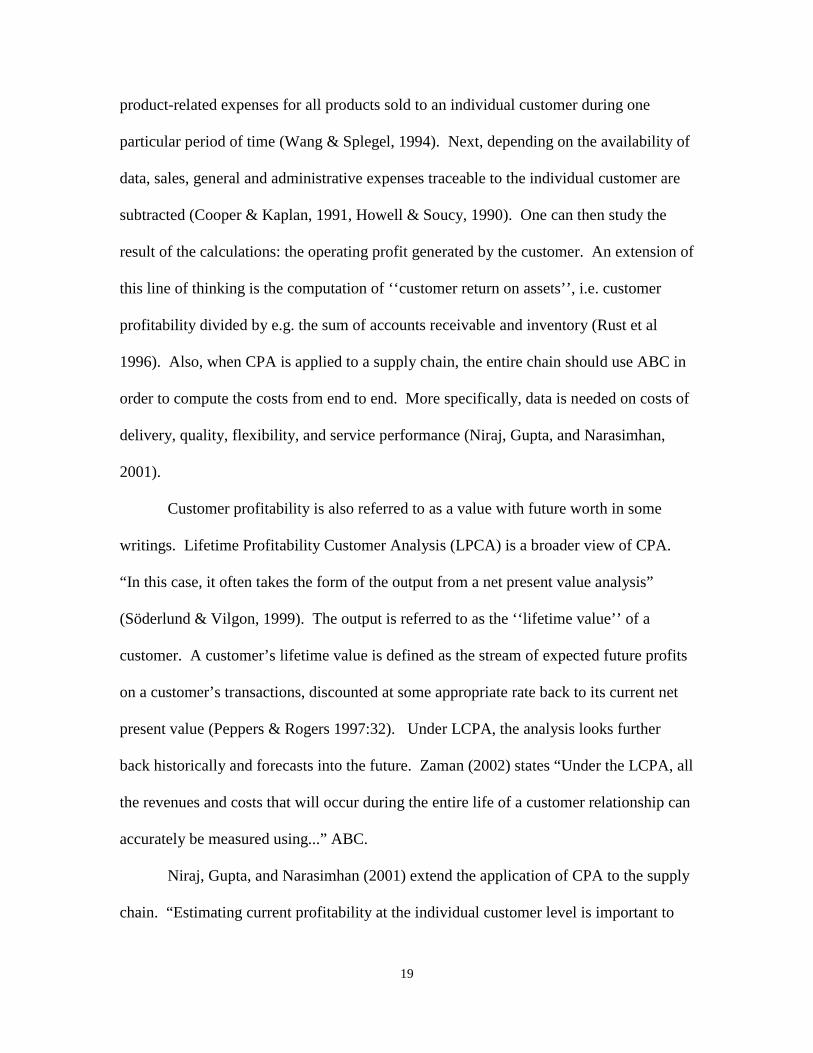
In Niraj et. al., a series of 14 equations was developed to address numerous cost
factors in a supply chain. The focus was mostly on distribution channel costs; however,
as stated earlier, the model includes upstream and downstream costs. Figure 6 shows the
transaction flows according to the authors.
Figure 6. Transaction Flows in a Multi-echelon Supply Chain (Niraj et. al., 2001)
Transaction Flows in a Multiechefon Supply Chain
Echelon 1 Distributors
Echelon 2 Redistributors
Echelon 3 Retailers
C3
Distributor A
■ •
•
—► Redistributor
B
-
• •
/
/
Retail Gullet C
IT
5" H- O o
C 3
Legends: Normal Flow of Onders ^ -
DD Flow of Orders <-
Normal Flow of Shipments
DD Flow of Shipments >
Noifls. In a tivee-echalon supply chain, we focus on cusiomer prolirab-hty of ihie d^sinOuTOf. A Its cusiomai^s may tJU re*£inbulors such as a or relail outlels such aa C. In a nornial delivery shipmeni. the disinbutc sNps ^oods lo ib cuatomai-s. Somebmes, a DO ahipcnent may be affargefl by Fam A. in *hich CMS, a manutecturer ships goods directly lo Rrm As cuslomars-
21
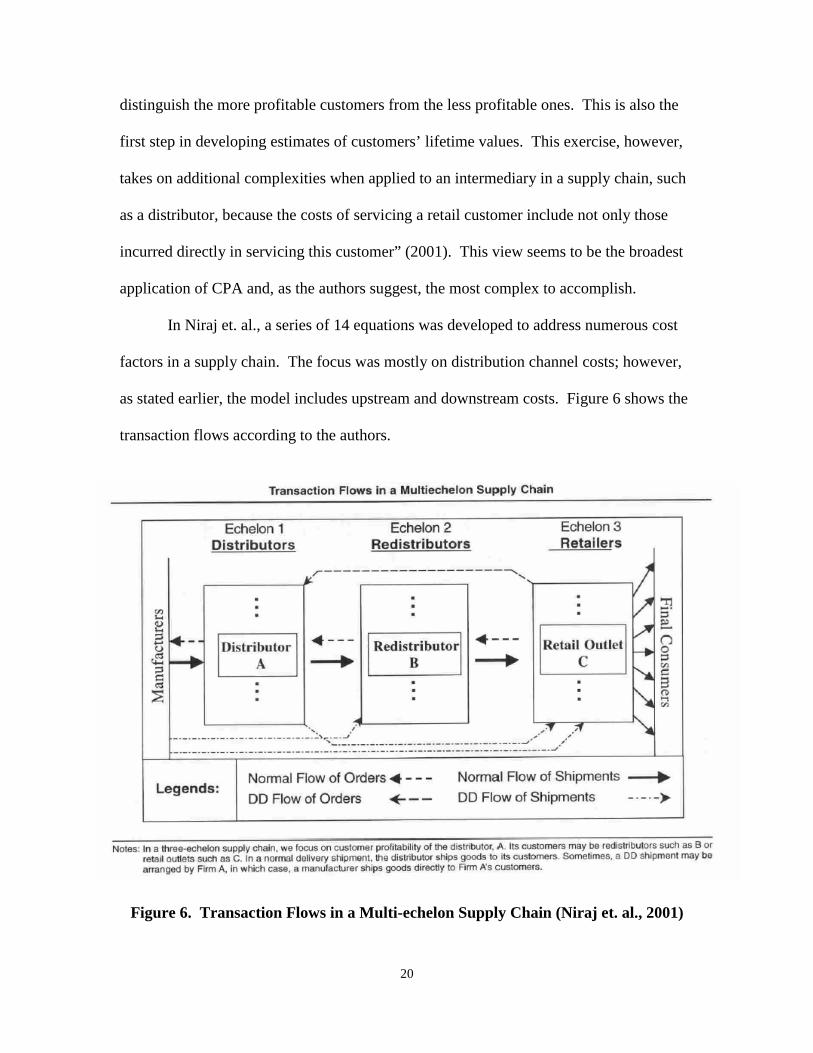
Another important piece in this literature is a diagram explicitly depicting factors which
influence customer profitability. Understanding the factors is critical because a firm
practicing CPA must make adjustments in the correct place in order to improve customer
contribution to their operating income. Figure 7 shows the external factors which
influence a firm’s customer level profitability.
Figure 7. Factors Influencing Customer Profitability (Niraj et. al., 2001)
Once the CPA is complete and customer profiles created, the firm next needs to
decide what to do with its unprofitable customers. Two distinct views exist regarding
unprofitables: 1) Fire the unprofitable customers and 2) Make unprofitable customers
profitable.
The first view, fire the unprofitables, is the elder. Many articles suggest one
should fire the unprofitable customer and let their competition lose money. “Let
Factors Inriuencing Customer Profitability
t /
1
Complexity / Factors 1 / .
Price/Gr OSS Margin
Customer Profitabi ity \ btriciency
. . 1 Factors V \ \ i
^*^
Volume
22
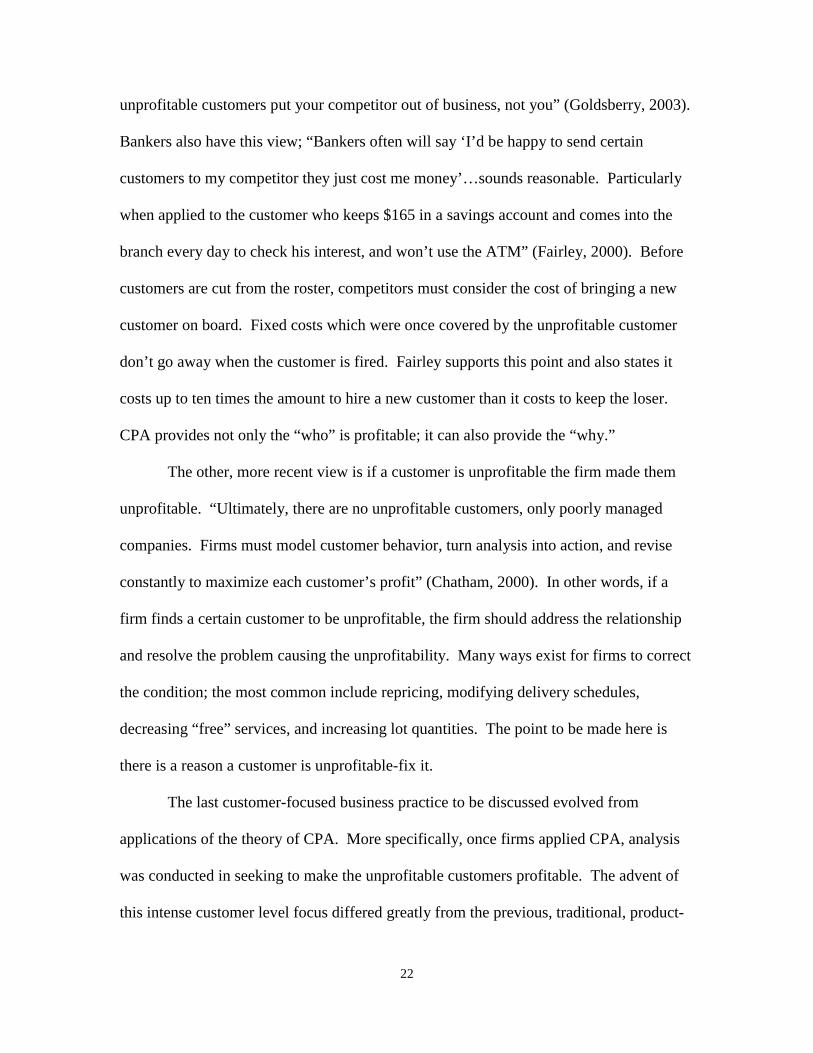
unprofitable customers put your competitor out of business, not you” (Goldsberry, 2003).
Bankers also have this view; “Bankers often will say ‘I’d be happy to send certain
customers to my competitor they just cost me money’…sounds reasonable. Particularly
when applied to the customer who keeps $165 in a savings account and comes into the
branch every day to check his interest, and won’t use the ATM” (Fairley, 2000). Before
customers are cut from the roster, competitors must consider the cost of bringing a new
customer on board. Fixed costs which were once covered by the unprofitable customer
don’t go away when the customer is fired. Fairley supports this point and also states it
costs up to ten times the amount to hire a new customer than it costs to keep the loser.
CPA provides not only the “who” is profitable; it can also provide the “why.”
The other, more recent view is if a customer is unprofitable the firm made them
unprofitable. “Ultimately, there are no unprofitable customers, only poorly managed
companies. Firms must model customer behavior, turn analysis into action, and revise
constantly to maximize each customer’s profit” (Chatham, 2000). In other words, if a
firm finds a certain customer to be unprofitable, the firm should address the relationship
and resolve the problem causing the unprofitability. Many ways exist for firms to correct
the condition; the most common include repricing, modifying delivery schedules,
decreasing “free” services, and increasing lot quantities. The point to be made here is
there is a reason a customer is unprofitable-fix it.
The last customer-focused business practice to be discussed evolved from
applications of the theory of CPA. More specifically, once firms applied CPA, analysis
was conducted in seeking to make the unprofitable customers profitable. The advent of
this intense customer level focus differed greatly from the previous, traditional, product-
23
centric methods. This customer level analysis grew into the concept of Customer
Relationship Management (CRM).
Customer Relationship Management
The idea of moving further away from product management and deeper into
customer management is what makes CRM a new way of thinking. Demonstrated
through each of the business practices presented thus far, application requires a paradigm
shift-a difficult change for some organizations.
The main underpinning of CRM is one-to-one marketing. In one-to-one
marketing, firms market their products or services to their customers one at a time. This
philosophy in CRM has four objectives: gain customer, sell to customer, provide item
sold to customer, and provide service to the customer after the sale. The advent of
information technologies such as data warehousing and data mining have led to the
capabilities firms needed to accomplish CRM. This “personal” relationship is the unit of
analysis for all firm/customer interactions. Similar to CPA, once the customer level
relationship is established, data from the transactions can be collected and analyzed.
A review of the literature showed varied definitions of CRM. The appropriate
definition depends on how CRM is used. “Many vendors, consulting firms, and even
companies, build their own definition of CRM partially mindful of how others are
defining the term. Because of this, while definitions are diverse, the market seems to
have coalesced along three “kinds” of definitions…” technology centric, customer
lifecycle centric, and strategy centric (Kellen, 2002:3). Kellen’s view was confirmed by
the author during this literature review.
24
Generally, a technology centric version of CRM is largely based on computer
systems or software which automates a portion of the customer’s interactions with the
firm. In technology centric CRM, a customer may use the internet to purchase the firm’s
product, the firm may market to the customer through electronic media, or a customer
may access the firm’s customer service area via the internet.
Customer lifecycle centric CRM is a philosophy of managing the customer
lifecycle, not the more familiar product lifecycle. The firm focuses efforts on attracting
the customer, transacting business with the customer, servicing and supporting the
customer, and ultimately enhancing the relationship with the customer (Kellen, 2002).
This method is a much broader application of CRM and was also found to be referred to
as analytic CRM by some authors (Kamakura, 2002, Swift, 2002, Oi and Singh, 2003).
“The customer lifecycle definition of CRM often describes CRM as the ability to
seamlessly interact with or market to the customer across this lifecycle” (Kellen, 2002:3)
enabling a continuous one-to-one relationship.
The third type of CRM discovered during this research is strategy centric. Many
information technology vendors and consulting firms are providing products today which
make this the most common form of CRM. The products marketed are referred to as
“CRM Solutions.” In strategic CRM, a new business model is developed with customer
relationships as the focus. Strategy is developed which seeks to exploit data collected
from each customer interaction in order to maximize profit. “These definitions describe
CRM as a technique to compete successfully in the market and build shareholder value”
(Kellen, 2002:3).
25
This author’s definition of CRM is a consolidation of the three previously
described views: CRM is a customer focused strategy in which a firm leverages
technology to extract maximum profit from the customer lifecycle. Functionally, this
definition describes the broadness and depth of the CRM philosophy.
According to a February, 2002 article in the Harvard Business Review, companies
are spending millions of dollars on CRM initiatives. “The promise of customer
relationship management is captivating, but in practice it can be perilous. When it works,
CRM allows companies to gather customer data swiftly, identify the most valuable
customers over time, and increase customer loyalty by providing customized products
and services” (Rigby, Reichheld, and Schefter, 2002:101-102). Rigby et al provide four
perils of CRM companies must avoid in order to be successful: 1. Implementing CRM
before creating a customer strategy, 2. Rolling out CRM before changing your
organization to match, 3. Assuming that more CRM technology is better, and 4.
Stalking, not wooing, customers.
The first peril, implementing CRM before creating a customer strategy is very
closely related to the purpose of strategic centric CRM. This strategy can be as simple as
segmentation analysis of customers as groups or a more complex division to the
individual customer level. “To implement CRM without conducting segmentation
analyses and determining marketing goals would be like trying to build a house without
engineering measures or an architectural plan” (Rigby et al, 2002:102).
Peril two, rolling out CRM before changing your organization to match is
analogous to the old saying “you can’t put a square peg in to a round hole.” For example,
customer service and order fulfillment functions should be modified to be customer
26
centric processes before CRM can be implemented. Firms which do not traditionally
harbor a customer focused vision statement will be out of sync with CRM. Rigby et al
state “The most successful companies in our study have worked for years at changing
their structures and systems before embarking on CRM initiatives” (2002:104).
The third peril, assuming more CRM technology is better, like peril number two,
can be interpreted at face value—more is not always better. CRM does not have to be
technologically intense. Information technologies provide the means for in-depth
analyses which should be conducted in full-blown CRM operations; however, CRM may
be better suited to incremental implementation (Peppers and Rogers, 2001:5). Further
supporting a small-scale CRM starting point, Rigby et al state “Customer relationships
can be managed in many ways, and the objectives of CRM can be fulfilled without huge
investments in technology simply by, say, motivating employees to be more aware of
customer needs” (2002:104).
The last peril, stalking, not wooing, customers is not as simple as the other three
previously discussed. There appears to be a fine line between one-to-one marketing and
junk mail. In marketing, direct mailings are often perceived as junk mail by those that
receive them. The principle variable is the level of interest that exists within the
household receiving the advertisement. In CRM, the variable of interest is not so
obvious. “Relationships are two-way streets. You may want to forge more relationships
with affluent customers, but do they want them with you?” (Rigby et al, 2002:108).
Further “…build relationships with disinterested customers, and you will be perceived as
a stalker, annoying potential customers and turning them into vociferous critics” (Rigby
et al, 2002:108). The challenge has been levied.
27
The improvement technique of CRM is another in a long line of “new” ideas
which have developed over the last three decades to improve profits in private-sector
firms. Quality, ABC, CPA, and CRM have grown in the private sector out of the need of
firms to constantly outpace their competitors. These techniques and philosophies are by
no means an all inclusive representation of customer-focused improvement efforts;
however, they do demonstrate fairly well the lineage of evolution which occurs. More
emphasis was placed on CPA in this review because it was the technique which departed
most from the previous, traditional focus of product profitability. Less emphasis,
perhaps, was placed on CRM because it encompasses attributes of Quality, ABC, and
CPA. Another look at an evolution of improvement efforts will be discussed next in
order to show public-sector agencies also have motivation for efficiency gains.
Defense Logistics Agency
The Defense Logistics Agency (DLA) is presented as a typical large public-sector
organization. The organization has a specific purpose in serving the public through the
support DLA provides the DoD in accomplishing its mission.
Government business process reengineering is a radical improvement approach that critically examines, rethinks, and redesigns mission product and service processes within a political environment. It achieves dramatic mission performance gains from multiple customer and stakeholder perspectives. It is a key part of a process management approach for optimal performance that continually evaluates, adjusts or removes processes. (Caudle, 1995)
Consumables are items that are “used up” or consumed by the end user sometime
after the item is purchased. The Department of Defense (DoD) purchases millions of
dollars of consumable items each year and the Defense Logistics Agency (DLA) is
28
DoD’s “supplier” of consumable goods for the military services. DLA manages most,
approximately 96 percent, of all consumable items used by DoD while the remaining
items are termed “service specific” and are managed by the individual service
components. DoD categorizes items of supply into nine specific classes: I) Subsistence;
II & IV) Clothing, tents, consumables; III) Bulk fuel, packaged petroleum, oils and
lubricants; V) Ammunition; VI) Comfort items; VII) End items; VIII) Medical; IX)
Reparables/non-reparables. DLA provides almost 100 percent of classes I, II, III, IV, VI,
and VIII along with class IX non-reparables. The military services provide class IX
reparables. DLA had $20.6 billion in sales in FY 2002.
DLA measures its effectiveness by customer satisfaction ratings; traditional DoD
supply-type metrics like issue and stockage effectiveness measure how often DLA is able
to satisfy a customer demand. Normally, the higher the metric, the better the service;
however, with fiscal restraints imposed by the annual DoD budget, DLA is limited in the
amount of inventory it can hold which in turn limits effectiveness ratings. Therefore, like
any wholesale operation, DLA is continuously attempting to buy the items its customers
will quickly purchase and use. Many methods are used to manage the inventory and most
recently, DLA has begun implementation of a philosophy called the Business Systems
Modernization (BSM) in order to update their computer systems software and
architecture.
Adequate inventory management is critical for DLA to enable its customers, the
United States Military services, to perform their mission. While enabling military
effectiveness DLA must cover the costs it incurs as a result of doing business. Although
the Quality movement took place during the 1980s and early 1990s in the DoD, DLA
29
began looking for more specific ways to improve operations efficiencies soon after the
end of the “Cold War”. At that time, the “new” business process improvement was
adoption of ABC.
ABC implementation at DLA began in the early 1990’s and led to the initial
implementation of ABM in 1996. DLA was out-front when compared to the efforts of
the rest of DoD. In July, 1999, the Under Secretary of Defense declared “...I direct the
Secretaries of the Military Departments and the Directors of the Defense Agencies to
pursue aggressively ABC/M implementation in maintenance depots and everywhere else
it could be expected to provide improved cost management” (DoD, 1999). The Under
Secretary further mandated all DoD agencies develop an implementation plan for
meeting his requirements. DLA published their plan in October, 1999. “In fact, DLA
was proactive in the development of ABC by initiating the program in 1993. In 1996, we
revised and revitalized our ABC efforts and began an aggressive ABC/M implementation
program across the Agency” (DLA, 1999).
As we enter a new century, which will provide significant changes in our Armed Forces and increases in technological sophistication of those forces, logistics and acquisition organizations and systems must change to keep pace. To remain competitive, DLA has recognized that we must reshape and refocus ourselves and apply the same innovation, teamwork, and warfighter focus that has made us successful in the past. To provide a roadmap for the future, we have developed a strategic plan which defines our vision, mission, goals, and objectives.
Embedded in our strategic goals is the need to reduce acquisition and logistics support costs to our customers. To achieve these goals, we recognize that we must better manage all of our costs, and we believe that Activity-Based Costing/Management (ABC/M) is a most effective tool to accomplish this. By utilizing activity based costing, we will provide our managers with information on activities that are taking place within their organization, and through management of those activities, we will institutionalize quantitative analysis in our decision-making and management process (DLA, 1999).
30
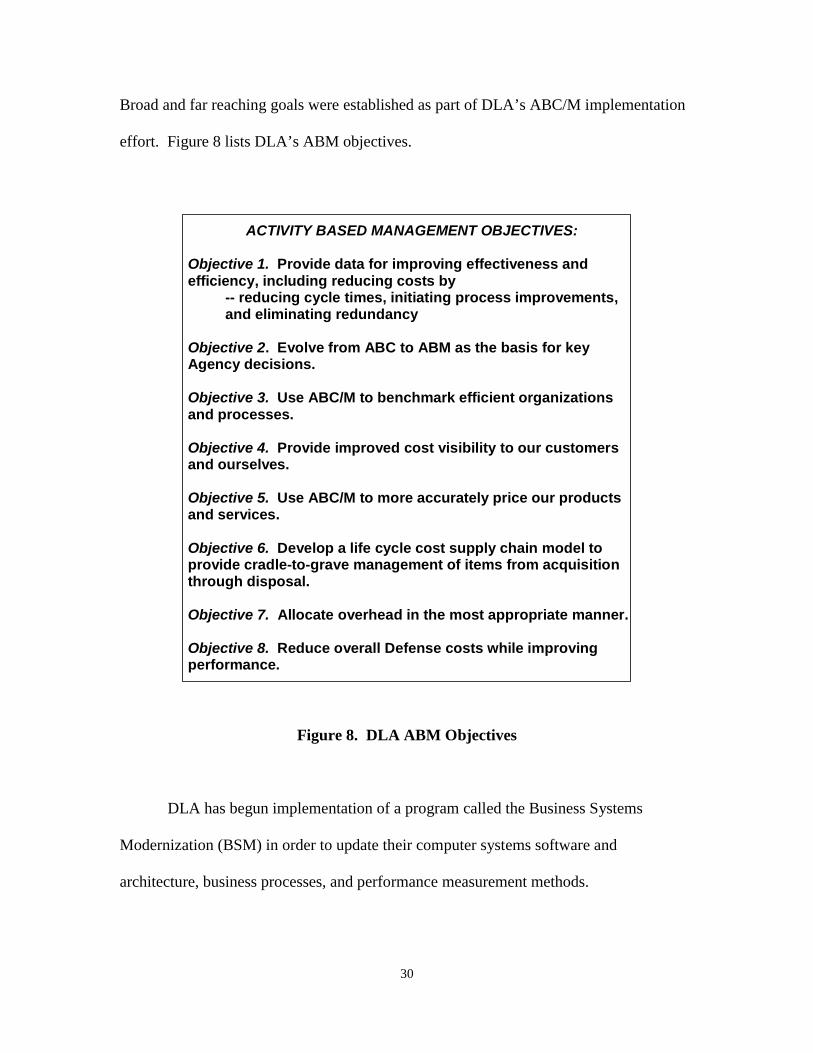
Broad and far reaching goals were established as part of DLA’s ABC/M implementation
effort. Figure 8 lists DLA’s ABM objectives.
ACTIVITY BASED MANAGEMENT OBJECTIVES:
Objective 1. Provide data for improving effectiveness and efficiency, including reducing costs by
-- reducing cycle times, initiating process improvements, and eliminating redundancy
Objective 2. Evolve from ABC to ABM as the basis for key Agency decisions. Objective 3. Use ABC/M to benchmark efficient organizations and processes. Objective 4. Provide improved cost visibility to our customers and ourselves. Objective 5. Use ABC/M to more accurately price our products and services. Objective 6. Develop a life cycle cost supply chain model to provide cradle-to-grave management of items from acquisition through disposal. Objective 7. Allocate overhead in the most appropriate manner. Objective 8. Reduce overall Defense costs while improving performance.
Figure 8. DLA ABM Objectives
DLA has begun implementation of a program called the Business Systems
Modernization (BSM) in order to update their computer systems software and
architecture, business processes, and performance measurement methods.
31
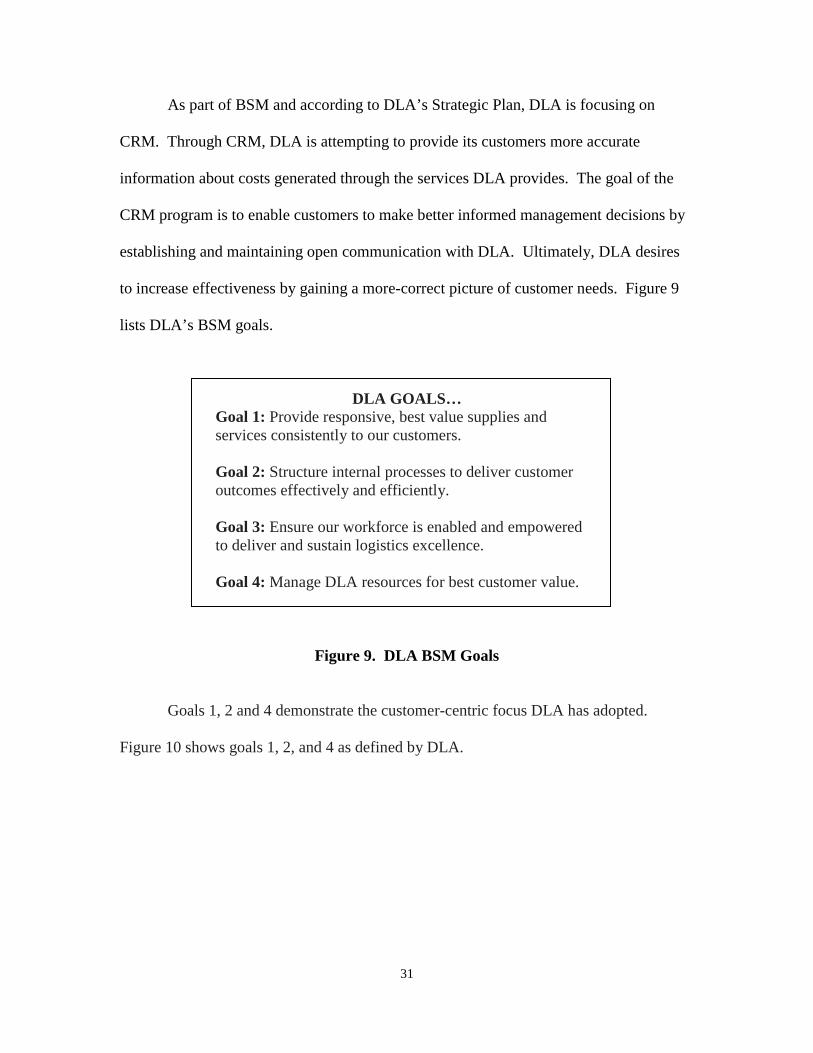
As part of BSM and according to DLA’s Strategic Plan, DLA is focusing on
CRM. Through CRM, DLA is attempting to provide its customers more accurate
information about costs generated through the services DLA provides. The goal of the
CRM program is to enable customers to make better informed management decisions by
establishing and maintaining open communication with DLA. Ultimately, DLA desires
to increase effectiveness by gaining a more-correct picture of customer needs. Figure 9
lists DLA’s BSM goals.
DLA GOALS… Goal 1: Provide responsive, best value supplies and services consistently to our customers. Goal 2: Structure internal processes to deliver customer outcomes effectively and efficiently. Goal 3: Ensure our workforce is enabled and empowered to deliver and sustain logistics excellence. Goal 4: Manage DLA resources for best customer value.
Figure 9. DLA BSM Goals
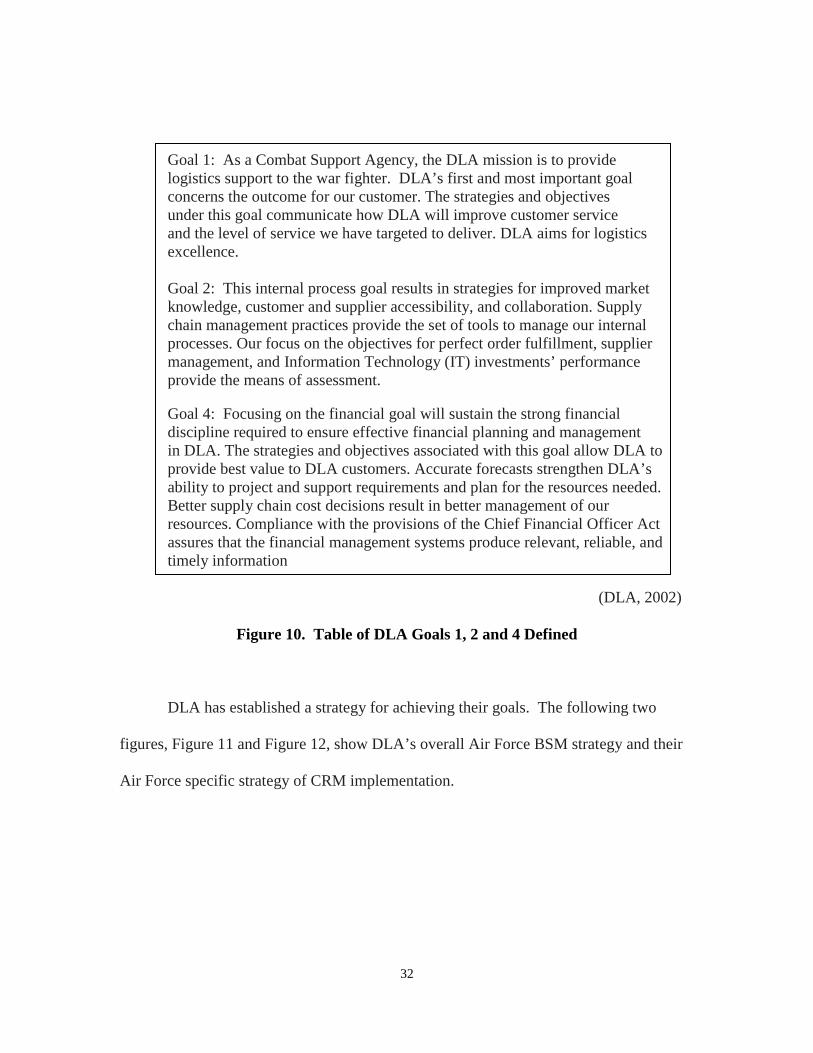
Goals 1, 2 and 4 demonstrate the customer-centric focus DLA has adopted.
Figure 10 shows goals 1, 2, and 4 as defined by DLA.
32
Goal 1: As a Combat Support Agency, the DLA mission is to provide logistics support to the war fighter. DLA’s first and most important goal concerns the outcome for our customer. The strategies and objectives under this goal communicate how DLA will improve customer service and the level of service we have targeted to deliver. DLA aims for logistics excellence.
Goal 2: This internal process goal results in strategies for improved market knowledge, customer and supplier accessibility, and collaboration. Supply chain management practices provide the set of tools to manage our internal processes. Our focus on the objectives for perfect order fulfillment, supplier management, and Information Technology (IT) investments’ performance provide the means of assessment.
Goal 4: Focusing on the financial goal will sustain the strong financial discipline required to ensure effective financial planning and management in DLA. The strategies and objectives associated with this goal allow DLA to provide best value to DLA customers. Accurate forecasts strengthen DLA’s ability to project and support requirements and plan for the resources needed. Better supply chain cost decisions result in better management of our resources. Compliance with the provisions of the Chief Financial Officer Act assures that the financial management systems produce relevant, reliable, and timely information (DLA, 2002)
Figure 10. Table of DLA Goals 1, 2 and 4 Defined
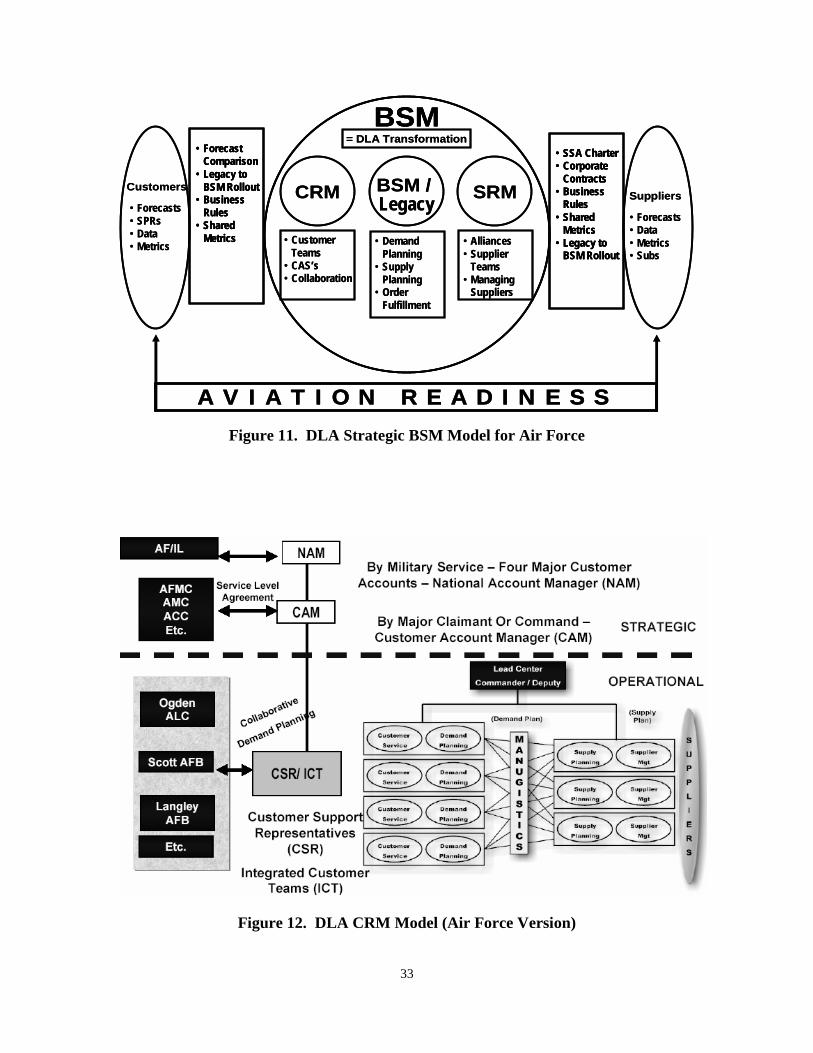
DLA has established a strategy for achieving their goals. The following two
figures, Figure 11 and Figure 12, show DLA’s overall Air Force BSM strategy and their
Air Force specific strategy of CRM implementation.
33
Figure 11. DLA Strategic BSM Model for Air Force
Figure 12. DLA CRM Model (Air Force Version)
• Forecasts• SPRs• Data• Metrics
Customers
• Forecasts• Data• Metrics• Subs
Suppliers
BSM
CRM BSM / Legacy
SRM
• Customer Teams
• CAS’s• Collaboration
• Demand Planning
• Supply Planning
• Order Fulfillment
• Alliances• Supplier
Teams• Managing
Suppliers
= DLA Transformation• SSA Charter• Corporate
Contracts• Business
Rules• Shared
Metrics• Legacy to
BSM Rollout
• Forecast Comparison
• Legacy to BSM Rollout
• Business Rules
• Shared Metrics
A V I A T I O N R E A D I N E S S
• Forecasts• SPRs• Data• Metrics
Customers
• Forecasts• Data• Metrics• Subs
Suppliers
BSMBSM
CRM BSM / Legacy
SRM
• Customer Teams
• CAS’s• Collaboration
• Demand Planning
• Supply Planning
• Order Fulfillment
• Alliances• Supplier
Teams• Managing
Suppliers
= DLA Transformation• SSA Charter• Corporate
Contracts• Business
Rules• Shared
Metrics• Legacy to
BSM Rollout
• SSA Charter• Corporate
Contracts• Business
Rules• Shared
Metrics• Legacy to
BSM Rollout
• Forecast Comparison
• Legacy to BSM Rollout
• Business Rules
• Shared Metrics
• Forecast Comparison
• Legacy to BSM Rollout
• Business Rules
• Shared Metrics
A V I A T I O N R E A D I N E S S
NAM
AFMC AMC ACC Etc.
Service Level Agreement
< >
By Military Service - Four Major Customer Accounts - National Account Manager (NAM)
CAM By Major Claimant Or Command - Customer Account Manager {CAM)
STRATEGIC
^^^^^^H
1 Ogden 1 ALC 1 ^^^1 1 1 Scott AFB 1 ^^^1 1
Lang ley AFB 1 Etc. 1
^^^^^^^1 1
L^ad Center
Commander / Deputy
.^X^^' 0^
^Ss^'
co^- ^\^^ .<^^ i
oe' ,o> ^^^■
CSRIICT
Customer Support Representatives
(CSR)
Integrated Customer Teams (ICT)
34
DLA has also worked to improve cost visibility for their customers. Net landed
cost is the current method (since FY 2002) used to assign distribution costs by activity.
This brings cost to the customer level and provides each customer the visibility of costs
generated by their activities. According to DLA’s FY2002 Amended Budget
Submission, “Net Landed Cost is the next generation of discrete pricing to (1) fairly
allocate costs to the level of services desired, (2) allocate costs to the customer driving
the costs, and (3) align costs more accurately” (DLA, 2002).
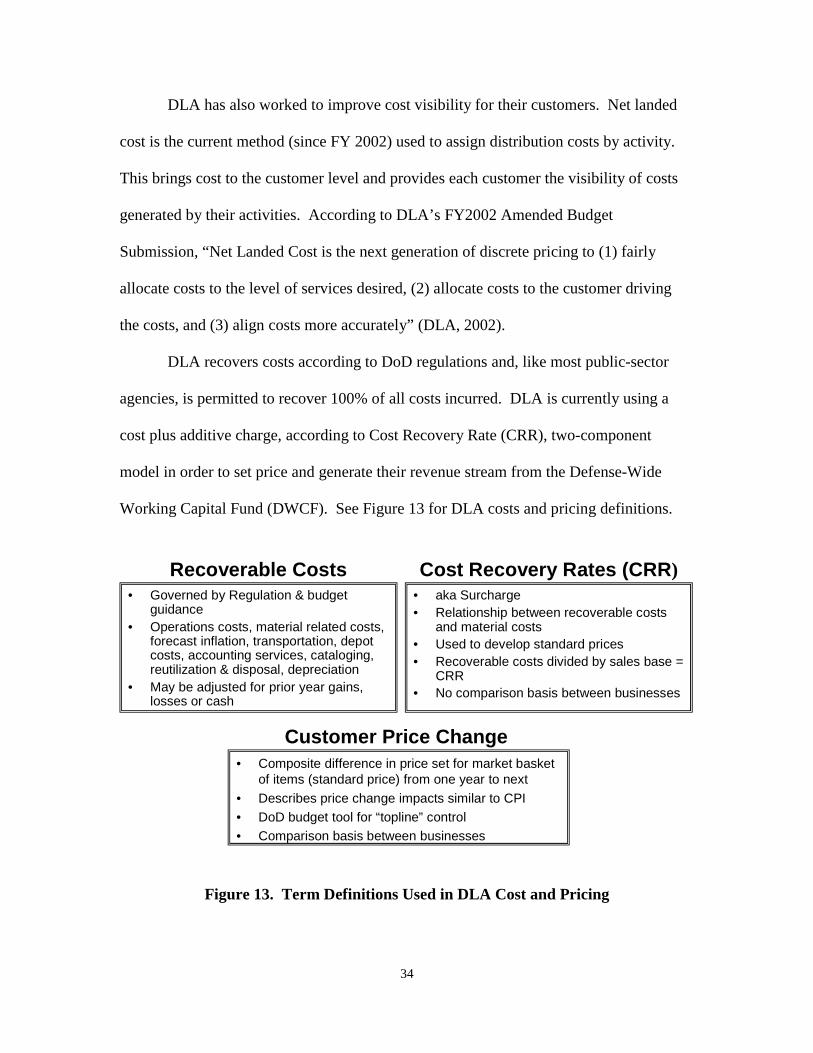
DLA recovers costs according to DoD regulations and, like most public-sector
agencies, is permitted to recover 100% of all costs incurred. DLA is currently using a
cost plus additive charge, according to Cost Recovery Rate (CRR), two-component
model in order to set price and generate their revenue stream from the Defense-Wide
Working Capital Fund (DWCF). See Figure 13 for DLA costs and pricing definitions.
Figure 13. Term Definitions Used in DLA Cost and Pricing
• aka Surcharge• Relationship between recoverable costs
and material costs• Used to develop standard prices• Recoverable costs divided by sales base =
CRR• No comparison basis between businesses
• Governed by Regulation & budget guidance
• Operations costs, material related costs, forecast inflation, transportation, depot costs, accounting services, cataloging, reutilization & disposal, depreciation
• May be adjusted for prior year gains, losses or cash
• Composite difference in price set for market basket of items (standard price) from one year to next
• Describes price change impacts similar to CPI• DoD budget tool for “topline” control• Comparison basis between businesses
Customer Price Change
Cost Recovery Rates (CRR)Recoverable Costs
35
The two pricing components break down as follows: Cost of goods = acquisition cost + inflation + transportation charges from vendor
+ item testing and unitization CRR = Distribution cost + Operating cost + Policy driven cost = 1) Distribution cost = receiving cost + holding cost + shipping cost 2) Operating cost = Mil/Civ compensation + travel + training + supplies + depreciation + utilities + security + facilities maintenance 3) Policy driven cost = accumulated operating results + DLIS + DAASC + other
Under this model, it can be inferred DLA has no incentive to improve operations
or lower costs which are directly passed on to their customers; however, recent other
efficiency improvement efforts elsewhere in the DoD to modernize the acquisition
process have provided the opportunity for DLA’s once mandatory customers to shop
elsewhere. DLA has been placed into unfamiliar territory and just like the private sector,
must compete for customers.
Under the old policy, operating cost and policy driven costs were previously
“peanut butter” spread across all customers. Since DLA’s customers are charged 100%
for all services provided, and they must now compete to retain their customers, DLA is
attempting through their CRM portion of the BSM to charge the customer which is
actually consuming service – i.e. the customer which generates the cost. This assigns
cost, according to the principles of ABC, to the customer level as opposed to the product
level. Ultimately, this cost visibility should provide DLA’s customers the information
needed to determine which of DLA’s “value-added” services to use (consume).
36
Summary and Conclusion
This chapter provided a discussion of the common customer-focused business
practice techniques and philosophies which have evolved over the past three decades to
improve efficiency and profit. The improvement techniques of Quality, ABC, CPA, and
CRM were presented in the order in which they historically occurred. The methods
presented were found to be the most popularly written about topics in business journals,
textbooks, and periodicals covering the past three decades and have been widely adopted
by many public-sector organizations. The chapter closed with a brief example of a large
public-sector organization, the DLA, to set the context for the organizations reviewed in
this research. The next chapter will discuss the research methodology.
37
III. Methodology
Chapter Overview
The previous chapter provided a discussion of the common customer-focused
business practice techniques and philosophies which have evolved over the past three
decades to improve efficiency and profit and an example of a public-sector organization,
the DLA, to set the context for the material reviewed in this research. This chapter will
establish the methodological framework in which this research will be accomplished.
The goal of this research is to develop a set of principles or a theoretical
framework of how public-sector entities implement customer-focused business practice
improvements compared to private-sector organizations and therefore will require a broad
and holistic approach in design. The methodology selected follows tenets of case study
research and an inductive grounded theory approach for analysis. This research will be
an inductive, multiple case study grounded theory design.
In order to support the author’s choice of methodology, the following chapter will
discuss method comparison, strategy of inquiry, case study definition, case study
application, and types of case studies. An explanation of grounded theory will be
followed by the author’s case selection strategy and design for data analysis. The chapter
will close with a discussion of validity and reliability.
Method Comparison
There are three basic approaches to research: quantitative, qualitative, and mixed
(Creswell, 2003). Each approach has specific strategies and methods which vary
according to the type of data used in the study. Selection of a research methodology is
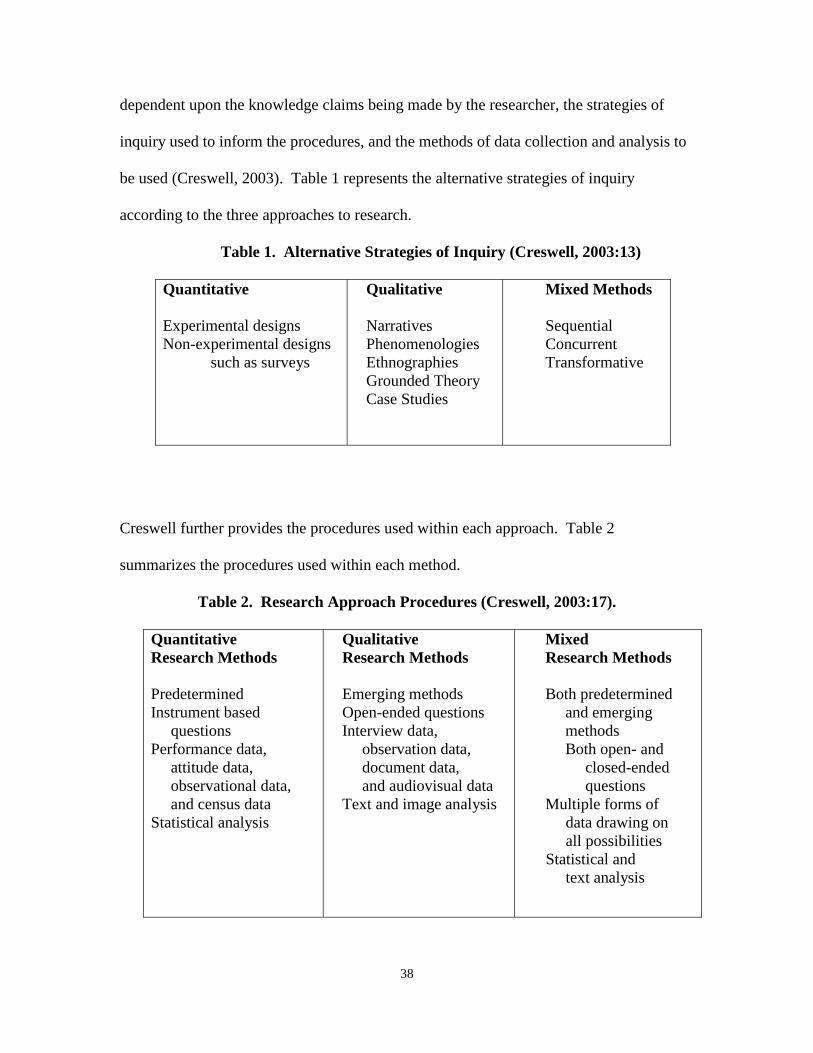
38
dependent upon the knowledge claims being made by the researcher, the strategies of
inquiry used to inform the procedures, and the methods of data collection and analysis to
be used (Creswell, 2003). Table 1 represents the alternative strategies of inquiry
according to the three approaches to research.
Table 1. Alternative Strategies of Inquiry (Creswell, 2003:13)
Quantitative
Experimental designs Non-experimental designs such as surveys
Qualitative
Narratives Phenomenologies Ethnographies Grounded Theory Case Studies
Mixed Methods
Sequential Concurrent Transformative
Creswell further provides the procedures used within each approach. Table 2
summarizes the procedures used within each method.
Table 2. Research Approach Procedures (Creswell, 2003:17).
Quantitative Research Methods
Predetermined Instrument based questions Performance data, attitude data, observational data, and census data Statistical analysis
Qualitative Research Methods
Emerging methods Open-ended questions Interview data,
observation data, document data, and audiovisual data
Text and image analysis
Mixed Research Methods
Both predetermined
and emerging methods Both open- and
closed-ended questions
Multiple forms of data drawing on all possibilities
Statistical and text analysis
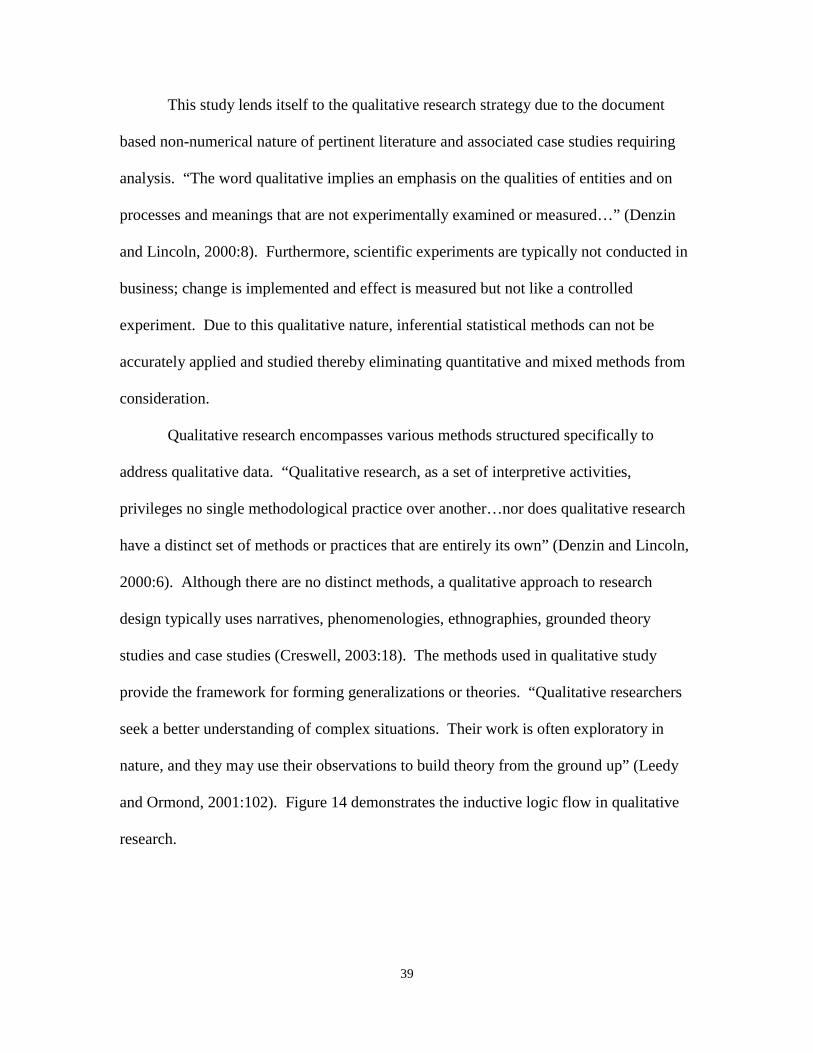
39
This study lends itself to the qualitative research strategy due to the document
based non-numerical nature of pertinent literature and associated case studies requiring
analysis. “The word qualitative implies an emphasis on the qualities of entities and on
processes and meanings that are not experimentally examined or measured…” (Denzin
and Lincoln, 2000:8). Furthermore, scientific experiments are typically not conducted in
business; change is implemented and effect is measured but not like a controlled
experiment. Due to this qualitative nature, inferential statistical methods can not be
accurately applied and studied thereby eliminating quantitative and mixed methods from
consideration.
Qualitative research encompasses various methods structured specifically to
address qualitative data. “Qualitative research, as a set of interpretive activities,
privileges no single methodological practice over another…nor does qualitative research
have a distinct set of methods or practices that are entirely its own” (Denzin and Lincoln,
2000:6). Although there are no distinct methods, a qualitative approach to research
design typically uses narratives, phenomenologies, ethnographies, grounded theory
studies and case studies (Creswell, 2003:18). The methods used in qualitative study
provide the framework for forming generalizations or theories. “Qualitative researchers
seek a better understanding of complex situations. Their work is often exploratory in
nature, and they may use their observations to build theory from the ground up” (Leedy
and Ormond, 2001:102). Figure 14 demonstrates the inductive logic flow in qualitative
research.
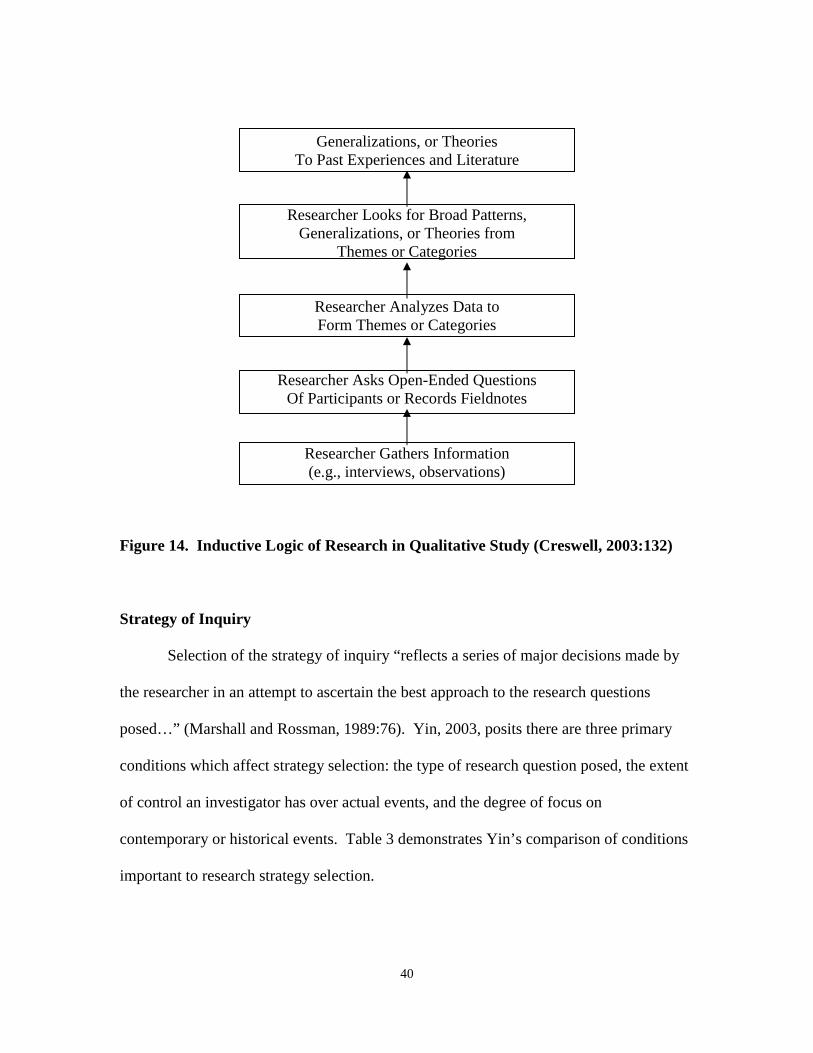
40
Generalizations, or Theories To Past Experiences and Literature
Researcher Looks for Broad Patterns, Generalizations, or Theories from
Themes or Categories
Researcher Analyzes Data to Form Themes or Categories
Researcher Asks Open-Ended Questions Of Participants or Records Fieldnotes
Researcher Gathers Information (e.g., interviews, observations)
Figure 14. Inductive Logic of Research in Qualitative Study (Creswell, 2003:132)
Strategy of Inquiry
Selection of the strategy of inquiry “reflects a series of major decisions made by
the researcher in an attempt to ascertain the best approach to the research questions
posed…” (Marshall and Rossman, 1989:76). Yin, 2003, posits there are three primary
conditions which affect strategy selection: the type of research question posed, the extent
of control an investigator has over actual events, and the degree of focus on
contemporary or historical events. Table 3 demonstrates Yin’s comparison of conditions
important to research strategy selection.
41
Table 3. Conditions Relevant to Strategy Selection (Adopted from Yin, 2003:5).
Form of Requires Control of Focuses on Strategy Research Question Events? Contemporary Events?
Experiment
how, why?
Yes
Yes
Survey
who, what, where, how many, how much?
No
Yes
Archival analysis
who, what, where, how many, how much?
No
Yes/No
History
how, why?
No
No
Case Study how, why? No Yes
Creswell (2003) further clarifies this decision for the researcher through examples
which demonstrate the purposes of each strategy. “For example, researchers might study
individuals (narrative, phenomenology); explore processes, activities, and events (case
study, grounded theory); or learn about broad culture-sharing behavior of individuals or
groups (ethnography)” (Creswell, 2003:183). According to Yin and Creswell, this
research would be best accomplished through a case study strategy.
Case Study Definition
The case study strategy provides a structured method for investigating a situation
or series of events. “The case study is a research strategy which focuses on
understanding the dynamics present within single settings” (Eisenhardt, 1989:534). “The
case method lends itself to early, exploratory investigations where the variables are still
unknown and the phenomenon not at all understood” (Meredith, 1998:444). Yin (2003)
42
further explains that case studies are used to explain “how” and “why” a phenomenon
occurs. For example, “…if you wanted to know how a community successfully
overcame the negative impact of the closing of its largest employer-a military base-you
would be less likely to rely on a survey or an examination of archival records and might
be better off doing a history or a case study” (Yin, 2003:6).
Case Study Application
The case study method has been used in Operations Management and Meredith
(1998) argued more case research should be conducted in the field because new
discovery seems to be limited by the traditional quantitative (rational) methods alone.
“We also find that the objectivity provided by quantification in the rationalist methods
can be a hindrance in the attempt to build theory because a qualitative understanding of
the quantified factors is still required for theories to be accepted by others in, and outside,
the field” (Meredith, 1998:442). Meredith continues the argument for qualitative study
and states combining traditional rational methodologies with qualitative analyses
provides greater potential for strengthening theories than using either method alone. The
purposes of case studies can also vary. “Case studies can be conducted and written with
many different motives, including the simple presentation of individual cases or the
desire to arrive at broad generalizations based on case study evidence” (Yin, 2003:15).
“The case/field focus on understanding is preferable for new theory development
in operations management because eventually, the explanation of quantitative findings
and the construction of theory based on those findings will ultimately have to be based on
qualitative understanding” (Meredith, 1998:453). Case studies are useful for selective
testing of existing theories in particular situations or circumstances, when existing theory
43
must be extended to include new factors, or for situations that require a deeper
understanding of what is happening (Meredith, 1998).
Types of Case Studies
Case studies can consist of either single or multiple cases, and use either an
embedded or holistic approach of analysis (Yin, 2003, Stake, 2000, Eisenhardt 1989). An
important part of the case study as a method is the determination during the research
design of what constitutes a case. A case can be a single individual or “…the case also
can be some event or entity that is less well defined than a single individual. Case studies
have been done about decisions, programs, the implementation process, and
organizational change” (Yin, 2003:23). “But the more the object of study is a specific,
unique, bounded system, the greater the usefulness…” (Stake, 2000:436). Stake explains
three types of case study: intrinsic, instrumental, and collective (2000:437). A case study
is intrinsic if it is the primary concern of the researcher, instrumental if it provides
support for some other phenomena the researcher is concerned with, and collective if
multiple cases are used in an instrumental study. According to Stake, this research is a
collective case study design; however, the author of this research interprets collective
case study and multiple case study to be the same.
Grounded Theory Definition
Grounded theory provides a structured method of analyzing data extracted
through case study research. “Essentially, grounded theory methods consist of systematic
inductive guidelines for collecting and analyzing data to build middle-range theoretical
frameworks that explain the collected data. Throughout the research process, grounded
theorists develop analytic interpretations of their data to focus further data collection,
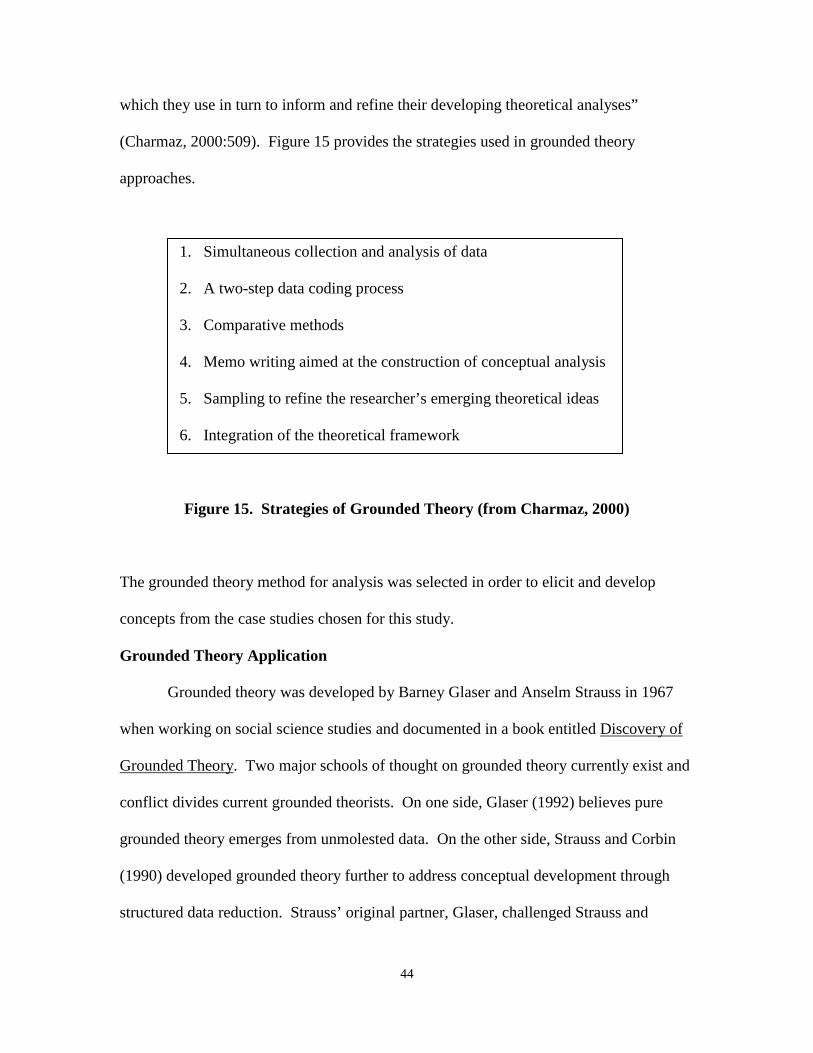
44
which they use in turn to inform and refine their developing theoretical analyses”
(Charmaz, 2000:509). Figure 15 provides the strategies used in grounded theory
approaches.
1. Simultaneous collection and analysis of data
2. A two-step data coding process
3. Comparative methods
4. Memo writing aimed at the construction of conceptual analysis
5. Sampling to refine the researcher’s emerging theoretical ideas
6. Integration of the theoretical framework
Figure 15. Strategies of Grounded Theory (from Charmaz, 2000)
The grounded theory method for analysis was selected in order to elicit and develop
concepts from the case studies chosen for this study.
Grounded Theory Application
Grounded theory was developed by Barney Glaser and Anselm Strauss in 1967
when working on social science studies and documented in a book entitled Discovery of
Grounded Theory. Two major schools of thought on grounded theory currently exist and
conflict divides current grounded theorists. On one side, Glaser (1992) believes pure
grounded theory emerges from unmolested data. On the other side, Strauss and Corbin
(1990) developed grounded theory further to address conceptual development through
structured data reduction. Strauss’ original partner, Glaser, challenged Strauss and
45
Corbin in 1992 as he believed their interpretation was not true grounded theory.
Charmaz (2000) supports both sides of the argument and incorporates a “mix” of the
“rules” established by the developers of the theory.
Grounded theory methods are not specifically required to produce a theory. The
methods can be used “…as flexible, heuristic strategies rather than as formulaic
procedures” and provide a set of clear guidelines from which to build explanatory
frameworks that specify relationships among concepts” (Charmaz, 2000:510). Grounded
theory strategies do not need to be rigid or prescriptive and can be adopted to further
interpretive understanding (Charmaz, 2000).
Cases are initially selected to provide as broad a representation of the phenomena
of interest as possible. Further data collection is then directed throughout the research
according to the concepts which emerge through analysis. As concepts emerge, gaps are
often found in the initially gathered data and require targeted selection of additional
cases. “We use theoretical sampling to develop our emerging categories and to make
them more definitive and useful” (Charmaz, 2000:518). This back-and-forth activity is
what grounds the theory or findings while increasing conceptual depth and density
(Strauss and Corbin, 1990:111).
According to grounded theory procedures, data is coded in order to define and
categorize. “Selective or focused coding uses initial codes that reappear frequently to
sort large amounts of data” (Charmaz, 2000:516). Categories ultimately develop out of
the coding process which aid the researcher in synthesizing and examining the data.
Categories then “…turn description into conceptual analysis by specifying properties
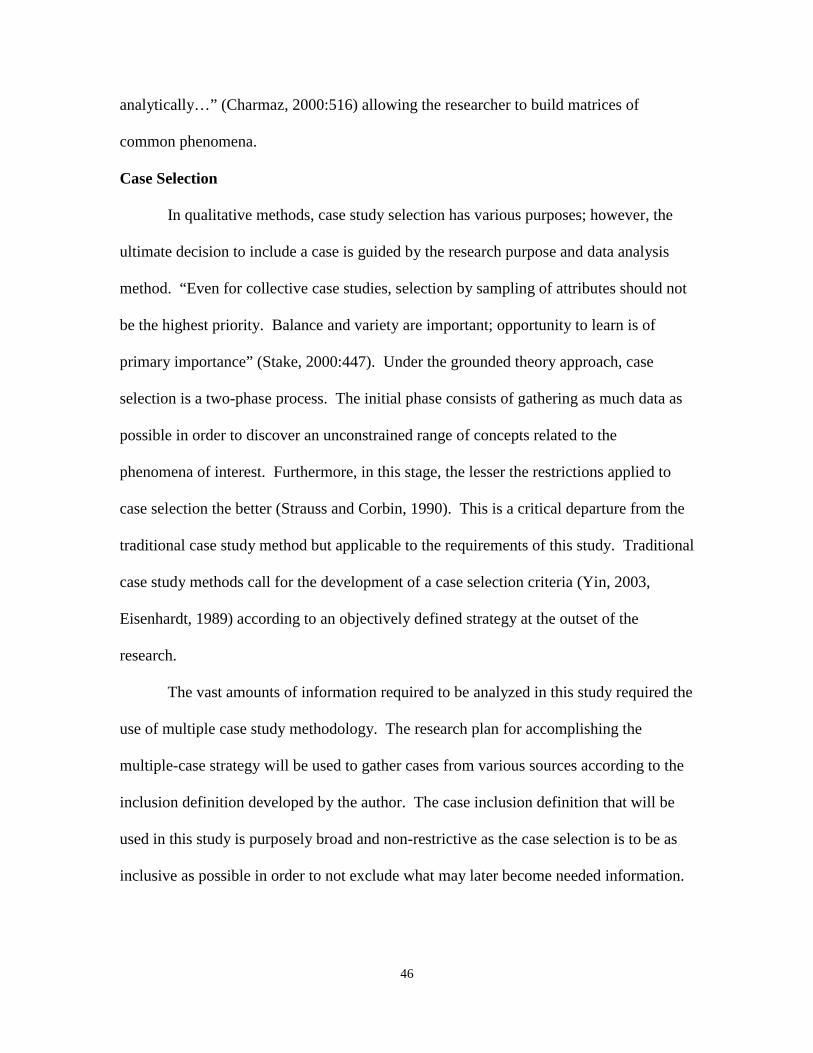
46
analytically…” (Charmaz, 2000:516) allowing the researcher to build matrices of
common phenomena.
Case Selection
In qualitative methods, case study selection has various purposes; however, the
ultimate decision to include a case is guided by the research purpose and data analysis
method. “Even for collective case studies, selection by sampling of attributes should not
be the highest priority. Balance and variety are important; opportunity to learn is of
primary importance” (Stake, 2000:447). Under the grounded theory approach, case
selection is a two-phase process. The initial phase consists of gathering as much data as
possible in order to discover an unconstrained range of concepts related to the
phenomena of interest. Furthermore, in this stage, the lesser the restrictions applied to
case selection the better (Strauss and Corbin, 1990). This is a critical departure from the
traditional case study method but applicable to the requirements of this study. Traditional
case study methods call for the development of a case selection criteria (Yin, 2003,
Eisenhardt, 1989) according to an objectively defined strategy at the outset of the
research.
The vast amounts of information required to be analyzed in this study required the
use of multiple case study methodology. The research plan for accomplishing the
multiple-case strategy will be used to gather cases from various sources according to the
inclusion definition developed by the author. The case inclusion definition that will be
used in this study is purposely broad and non-restrictive as the case selection is to be as
inclusive as possible in order to not exclude what may later become needed information.
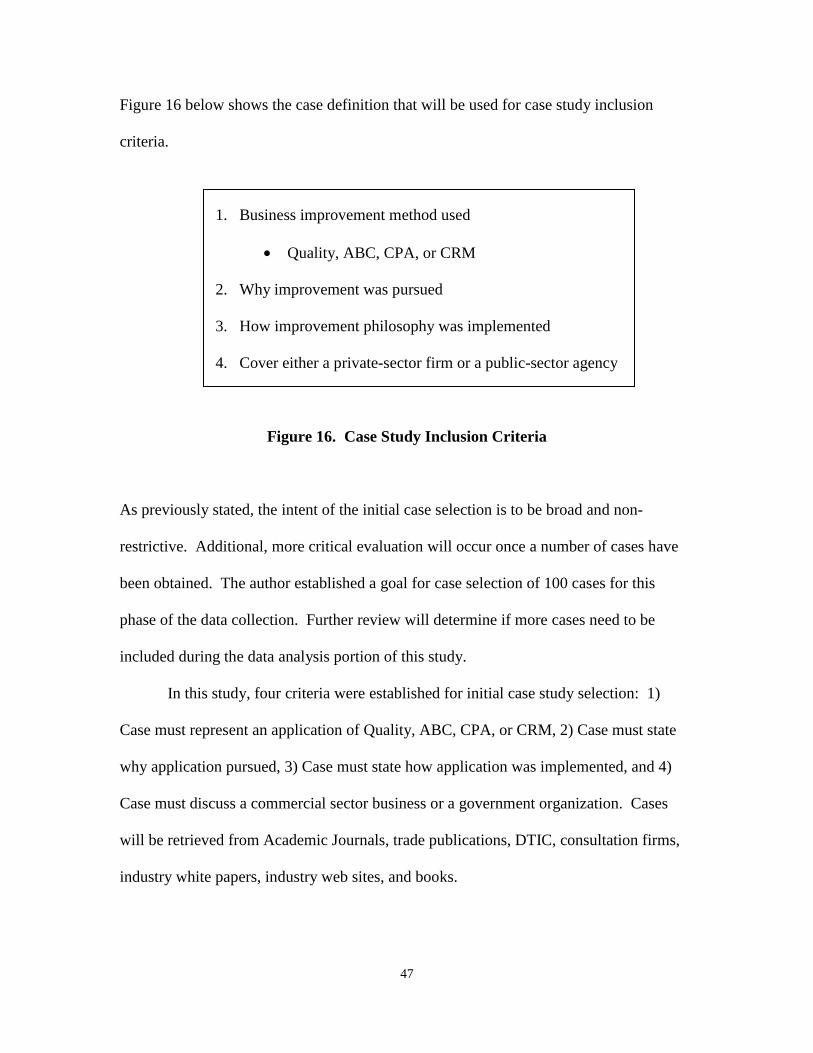
47
Figure 16 below shows the case definition that will be used for case study inclusion
criteria.
1. Business improvement method used
• Quality, ABC, CPA, or CRM
2. Why improvement was pursued
3. How improvement philosophy was implemented
4. Cover either a private-sector firm or a public-sector agency
Figure 16. Case Study Inclusion Criteria
As previously stated, the intent of the initial case selection is to be broad and non-
restrictive. Additional, more critical evaluation will occur once a number of cases have
been obtained. The author established a goal for case selection of 100 cases for this
phase of the data collection. Further review will determine if more cases need to be
included during the data analysis portion of this study.
In this study, four criteria were established for initial case study selection: 1)
Case must represent an application of Quality, ABC, CPA, or CRM, 2) Case must state
why application pursued, 3) Case must state how application was implemented, and 4)
Case must discuss a commercial sector business or a government organization. Cases
will be retrieved from Academic Journals, trade publications, DTIC, consultation firms,
industry white papers, industry web sites, and books.
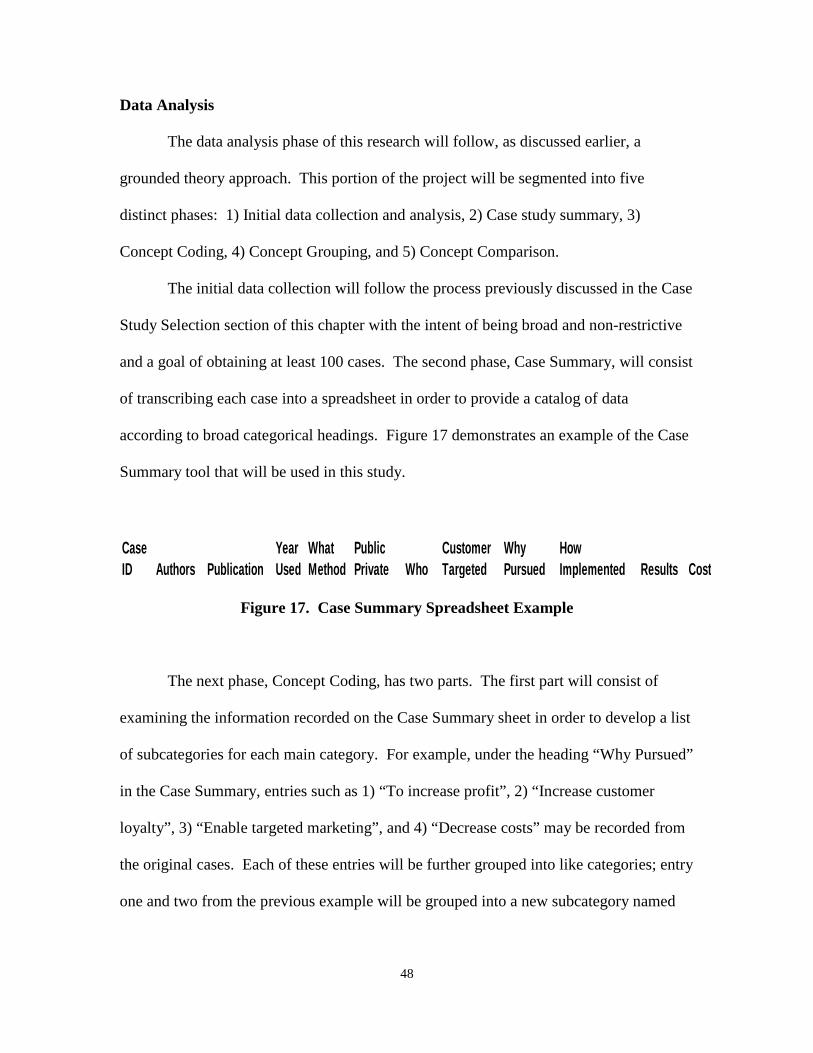
48
Data Analysis
The data analysis phase of this research will follow, as discussed earlier, a
grounded theory approach. This portion of the project will be segmented into five
distinct phases: 1) Initial data collection and analysis, 2) Case study summary, 3)
Concept Coding, 4) Concept Grouping, and 5) Concept Comparison.
The initial data collection will follow the process previously discussed in the Case
Study Selection section of this chapter with the intent of being broad and non-restrictive
and a goal of obtaining at least 100 cases. The second phase, Case Summary, will consist
of transcribing each case into a spreadsheet in order to provide a catalog of data
according to broad categorical headings. Figure 17 demonstrates an example of the Case
Summary tool that will be used in this study.
Case Year What Public Customer Why How ID Authors Publication Used Method Private Who Targeted Pursued Implemented Results Cost
Figure 17. Case Summary Spreadsheet Example
The next phase, Concept Coding, has two parts. The first part will consist of
examining the information recorded on the Case Summary sheet in order to develop a list
of subcategories for each main category. For example, under the heading “Why Pursued”
in the Case Summary, entries such as 1) “To increase profit”, 2) “Increase customer
loyalty”, 3) “Enable targeted marketing”, and 4) “Decrease costs” may be recorded from
the original cases. Each of these entries will be further grouped into like categories; entry
one and two from the previous example will be grouped into a new subcategory named
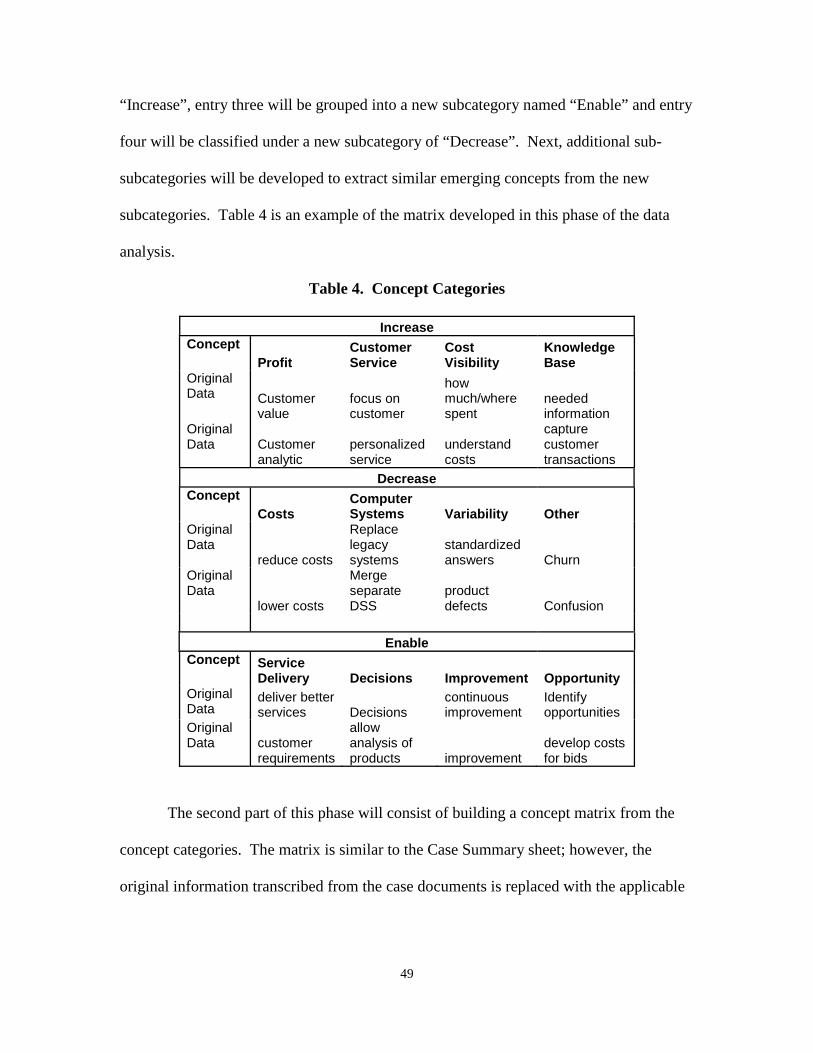
49
“Increase”, entry three will be grouped into a new subcategory named “Enable” and entry
four will be classified under a new subcategory of “Decrease”. Next, additional sub-
subcategories will be developed to extract similar emerging concepts from the new
subcategories. Table 4 is an example of the matrix developed in this phase of the data
analysis.
Table 4. Concept Categories
Increase Concept
Profit Customer Service
Cost Visibility
Knowledge Base
Original Data Customer
value focus on customer
how much/where spent
needed information
Original Data
Customer analytic
personalized service
understand costs
capture customer transactions
Decrease Concept
Costs Computer Systems Variability Other
Original Data
reduce costs
Replace legacy systems
standardized answers Churn
Original Data lower costs
Merge separate DSS
product defects Confusion
Enable Concept Service
Delivery Decisions Improvement Opportunity Original Data
deliver better services Decisions
continuous improvement
Identify opportunities
Original Data
customer requirements
allow analysis of products improvement
develop costs for bids
The second part of this phase will consist of building a concept matrix from the
concept categories. The matrix is similar to the Case Summary sheet; however, the
original information transcribed from the case documents is replaced with the applicable
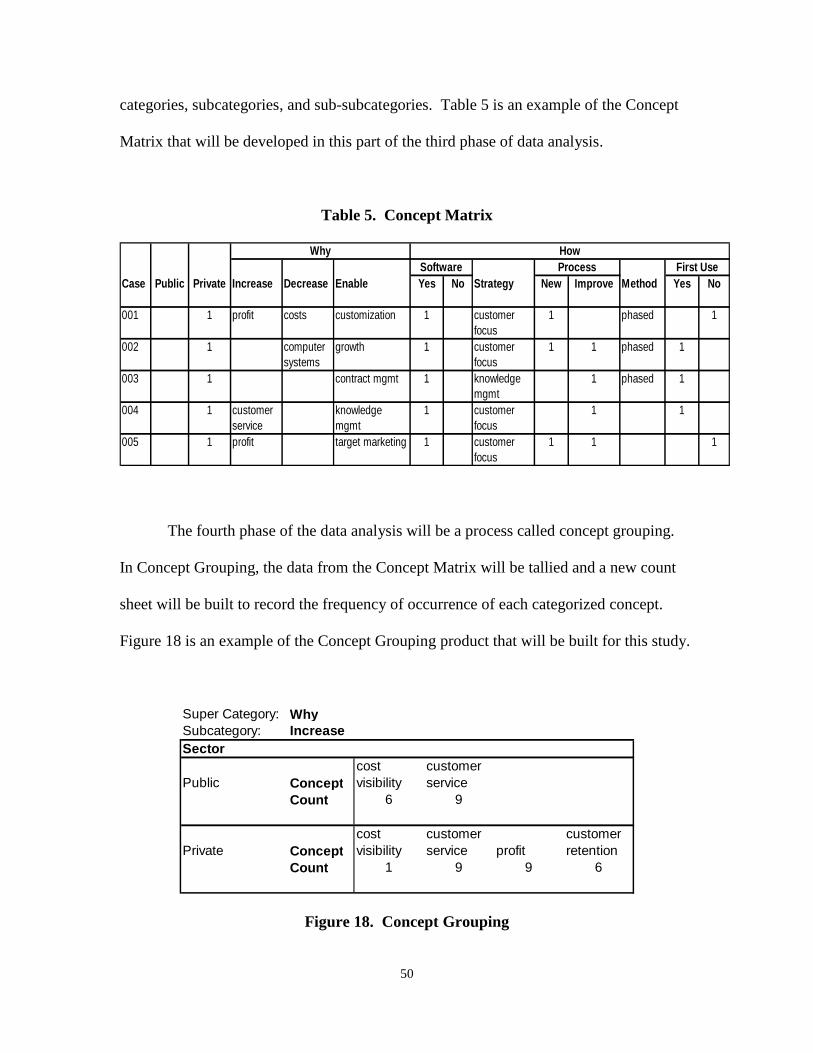
50
categories, subcategories, and sub-subcategories. Table 5 is an example of the Concept
Matrix that will be developed in this part of the third phase of data analysis.
Table 5. Concept Matrix
The fourth phase of the data analysis will be a process called concept grouping.
In Concept Grouping, the data from the Concept Matrix will be tallied and a new count
sheet will be built to record the frequency of occurrence of each categorized concept.
Figure 18 is an example of the Concept Grouping product that will be built for this study.
Super Category: WhySubcategory: IncreaseSector
Public Conceptcost visibility
customer service
Count 6 9
Private Conceptcost visibility
customer service profit
customer retention
Count 1 9 9 6
Figure 18. Concept Grouping
Case Public Private Increase Decrease Enable Yes No Strategy New Improve Method Yes No
001 1 profit costs customization 1 customer focus
1 phased 1
002 1 computer systems
growth 1 customer focus
1 1 phased 1
003 1 contract mgmt 1 knowledge mgmt
1 phased 1
004 1 customer service
knowledge mgmt
1 customer focus
1 1
005 1 profit target marketing 1 customer focus
1 1 1
HowWhySoftware Process First Use
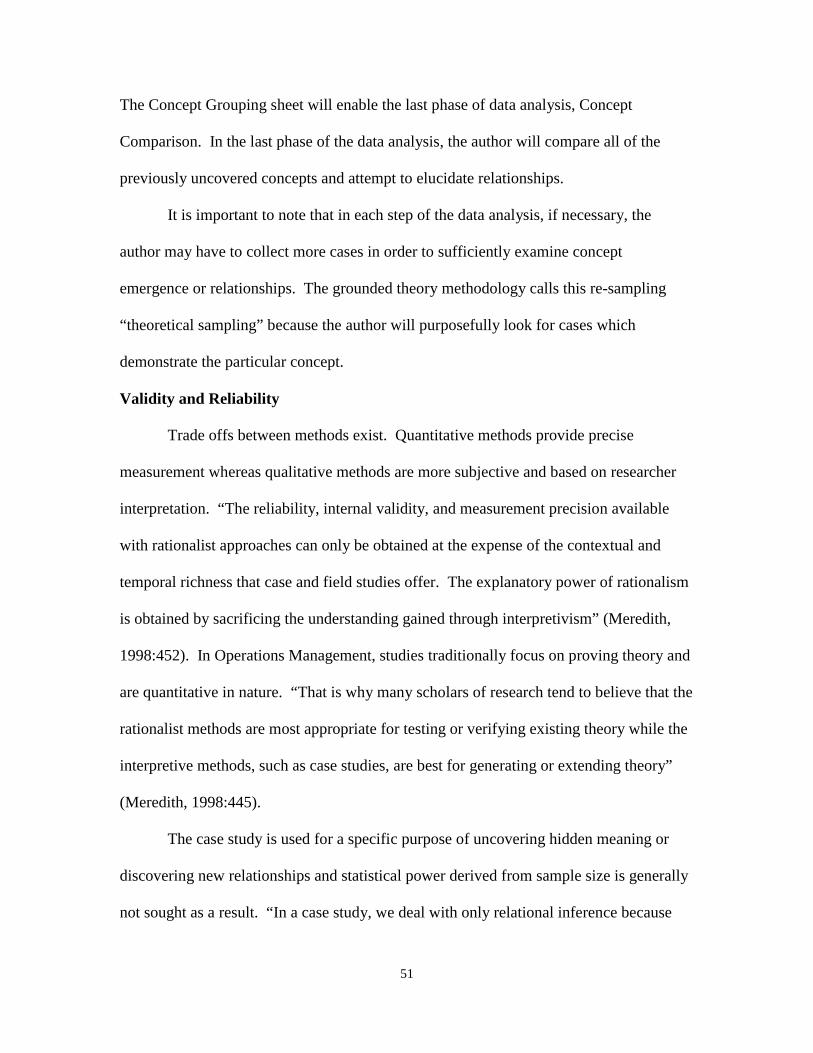
51
The Concept Grouping sheet will enable the last phase of data analysis, Concept
Comparison. In the last phase of the data analysis, the author will compare all of the
previously uncovered concepts and attempt to elucidate relationships.
It is important to note that in each step of the data analysis, if necessary, the
author may have to collect more cases in order to sufficiently examine concept
emergence or relationships. The grounded theory methodology calls this re-sampling
“theoretical sampling” because the author will purposefully look for cases which
demonstrate the particular concept.
Validity and Reliability
Trade offs between methods exist. Quantitative methods provide precise
measurement whereas qualitative methods are more subjective and based on researcher
interpretation. “The reliability, internal validity, and measurement precision available
with rationalist approaches can only be obtained at the expense of the contextual and
temporal richness that case and field studies offer. The explanatory power of rationalism
is obtained by sacrificing the understanding gained through interpretivism” (Meredith,
1998:452). In Operations Management, studies traditionally focus on proving theory and
are quantitative in nature. “That is why many scholars of research tend to believe that the
rationalist methods are most appropriate for testing or verifying existing theory while the
interpretive methods, such as case studies, are best for generating or extending theory”
(Meredith, 1998:445).
The case study is used for a specific purpose of uncovering hidden meaning or
discovering new relationships and statistical power derived from sample size is generally
not sought as a result. “In a case study, we deal with only relational inference because
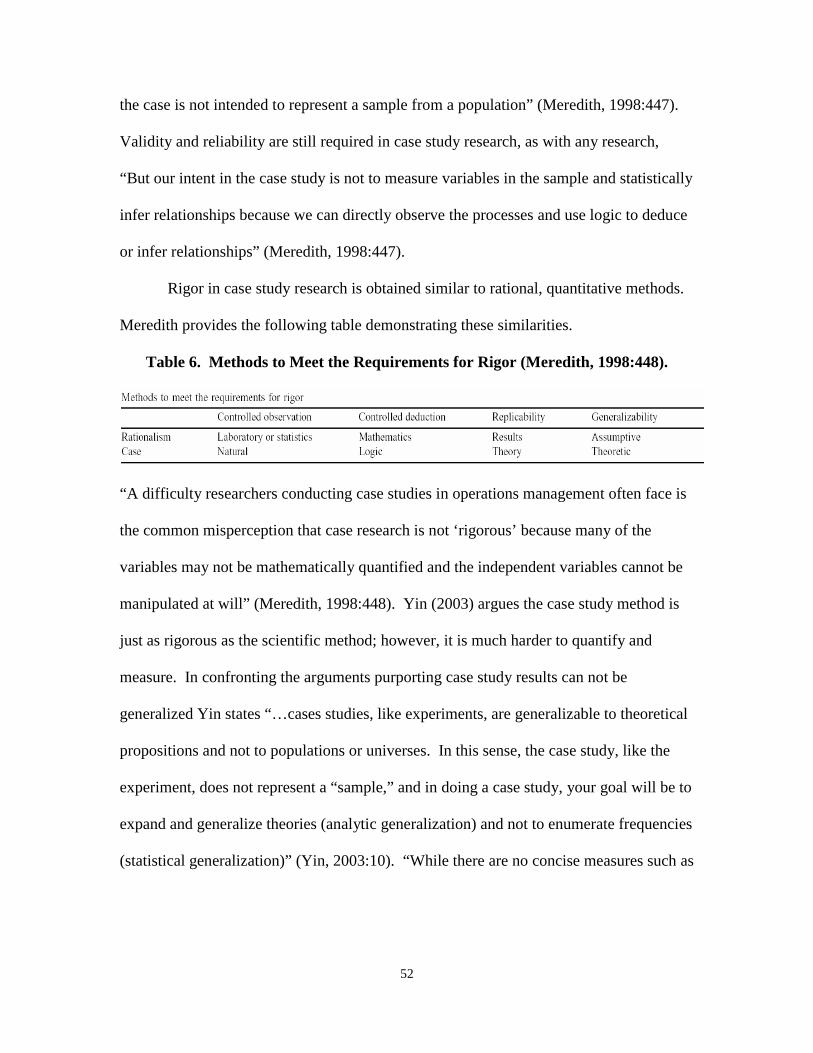
52
the case is not intended to represent a sample from a population” (Meredith, 1998:447).
Validity and reliability are still required in case study research, as with any research,
“But our intent in the case study is not to measure variables in the sample and statistically
infer relationships because we can directly observe the processes and use logic to deduce
or infer relationships” (Meredith, 1998:447).
Rigor in case study research is obtained similar to rational, quantitative methods.
Meredith provides the following table demonstrating these similarities.
Table 6. Methods to Meet the Requirements for Rigor (Meredith, 1998:448).
“A difficulty researchers conducting case studies in operations management often face is
the common misperception that case research is not ‘rigorous’ because many of the
variables may not be mathematically quantified and the independent variables cannot be
manipulated at will” (Meredith, 1998:448). Yin (2003) argues the case study method is
just as rigorous as the scientific method; however, it is much harder to quantify and
measure. In confronting the arguments purporting case study results can not be
generalized Yin states “…cases studies, like experiments, are generalizable to theoretical
propositions and not to populations or universes. In this sense, the case study, like the
experiment, does not represent a “sample,” and in doing a case study, your goal will be to
expand and generalize theories (analytic generalization) and not to enumerate frequencies
(statistical generalization)” (Yin, 2003:10). “While there are no concise measures such as
Methods to meet the requirements for rigor
rmnmlL'd i>h'-i.'r\iHioii roiiih>lli.'J J^'diiclinn Ri.'|'hcahihl\ riL'ni.'rLili/iiliilH>
Rdlioaalism Liiboratory or stiilislics
r;i-.e N:iliiral
Mathematics
LoLiic
Results
Theory
A-.siimpIive
Til Corel ic
53
correlation coefficients or F values, nonetheless thorough reporting of information should
give confidence that the theory is valid” (Eisenhardt, 1989:548).
Other authors find applying the quantitative term of rigor to qualitative studies is
not appropriate. “We challenge this assumption and suggest that these processes have
little to do with the actual attainment of reliability and validity. Contrary to current
practices, rigor does not rely on special procedures external to the research process itself”
(Morse, Barret, Mayan, Olson, & Spiers,2002:6). “Moreover, we suggest that the terms
reliability and validity remain pertinent in qualitative inquiry and should be maintained.
We are concerned that introducing parallel terminology and criteria marginalizes
qualitative inquiry from mainstream science and scientific legitimacy” (Morse et. al,
2002:8).
The argument continues and Morse et al. (2002) posit the analysis is self
correcting if the principles of qualitative inquiry are followed. Due to the nature of
qualitative designs, the research is iterative as opposed to linear, “…so that a good
qualitative researcher moves back and forth between design and implementation to
ensure congruence among question formulation, literature, recruitment, data collection
strategies, and analysis” (Morse et. al, 2002:10). Throughout the research process, work
of analysis and interpretation are constantly monitored and confirmed. Verification
strategies are provided to help the researcher “…identify when to continue, stop or
modify the research process in order to achieve reliability and validity and ensure rigor”
(Morse et. al, 2002:10). Because of the structured method of inquiry itself,
“…verification strategies that ensure both reliability and validity of data are activities
such as ensuring methodological coherence, sampling sufficiency, developing a dynamic
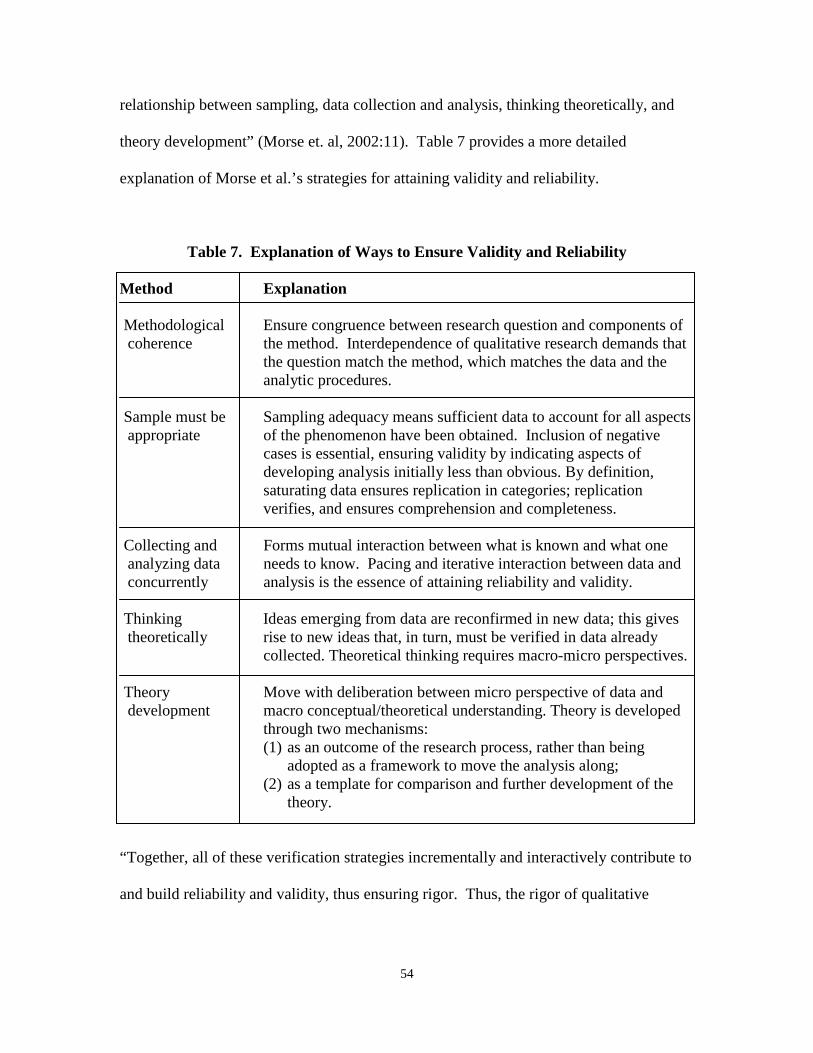
54
relationship between sampling, data collection and analysis, thinking theoretically, and
theory development” (Morse et. al, 2002:11). Table 7 provides a more detailed
explanation of Morse et al.’s strategies for attaining validity and reliability.
Table 7. Explanation of Ways to Ensure Validity and Reliability
Method Explanation
Methodological Ensure congruence between research question and components of coherence the method. Interdependence of qualitative research demands that
the question match the method, which matches the data and the analytic procedures.
Sample must be Sampling adequacy means sufficient data to account for all aspects appropriate of the phenomenon have been obtained. Inclusion of negative
cases is essential, ensuring validity by indicating aspects of developing analysis initially less than obvious. By definition, saturating data ensures replication in categories; replication verifies, and ensures comprehension and completeness.
Collecting and Forms mutual interaction between what is known and what one analyzing data needs to know. Pacing and iterative interaction between data and concurrently analysis is the essence of attaining reliability and validity. Thinking Ideas emerging from data are reconfirmed in new data; this gives theoretically rise to new ideas that, in turn, must be verified in data already
collected. Theoretical thinking requires macro-micro perspectives. Theory Move with deliberation between micro perspective of data and development macro conceptual/theoretical understanding. Theory is developed
through two mechanisms: (1) as an outcome of the research process, rather than being
adopted as a framework to move the analysis along; (2) as a template for comparison and further development of the
theory.
“Together, all of these verification strategies incrementally and interactively contribute to
and build reliability and validity, thus ensuring rigor. Thus, the rigor of qualitative

55
inquiry should thus be beyond question, beyond challenge, and provide pragmatic
scientific evidence that must be integrated into our developing knowledge base” (Morse
et. al, 2002:13).
The most difficult requirement, generalizability, is also known as ‘external
validity’ and is just a difficult in quantitative methods. Yin provides a definition of
generalizability as “…the domain to which a study’s findings or presumed causal
relationships can be generalized” (2003:34). Meredith did not uncover a particular
definition which could be applied to both the rational and case study methods and
therefore termed “…the former ‘assumptive generalizability’ and the latter ‘theoretic
generalizability’. Assumptive generalizability represents those rationalist studies,
especially descriptive and normative models such as econometric analyses, optimization
studies, and simulations, where the assumptions precisely identify the environment
parameters and variables being studied” (1998:449). According to Meredith, theoretic
generalizability represents interpretivist studies like case research and field research,
“…where the theory itself indicates that it would be applicable in a particular situation.
That is, the parameters and variables in the theory give an indication as to its range of
generalizability” (1998:450).
Due to the broad scope of this research project and the inductive case study
grounded theory strategies to be employed, according to the various authors reviewed, if
the methodology is sufficiently adhered to, this research will demonstrate both validity
and reliability.
56
Summary and Conclusion
This chapter established the methodological framework in which this research
will be accomplished. The goal of this research is to uncover principles of how public-
sector entities implement customer-focused business practice improvements compared to
private-sector firms implement customer-focused business practice improvements and
therefore requires a broad and holistic approach in design. Evidence was provided which
supports the selection of the inductive, multiple case study grounded theory design used
to achieve the research goal. The next chapter will provide the analysis and results of this
research.
57
IV. Analysis and Results
Chapter Overview
The previous chapter established the methodological framework in which this
research was accomplished. The goal of this research was to uncover how public-sector
entities compare to private-sector firms when implementing customer-focused business
practice improvements. A broad and holistic approach was required in the research
design for this study. Evidence was provided which supported the selection of the
inductive, multiple case study grounded theory design used to achieve the research goal.
This chapter will provide a narrative description of the data analysis process and the
results of the research.
Each of the five investigative questions were answered during the course of this
research and together provided the answer to the overarching research question.
Investigative question one was answered through the literature review and investigative
question three was answered during the initial data collection phase of the analysis.
Investigative questions two, four, and five were answered through the data analysis. The
results of investigative question one are presented first and a discussion of the data
collection process and analysis follows.
Investigative Question One
The first investigative question, “What are the recent customer-focused business
practices used to improve operations?” was answered through the literature review.
During the review, the author found there have been four major customer-focused
58
business practices for improvement developed and used over the past three decades: 1)
Quality, 2) Activity-Based Costing (ABC), 3) Customer Profitability Analysis (CPA),
and 4) Customer Relationship Management (CRM).
Quality is a philosophy which leads to specific management techniques in order to
achieve improvements throughout an organization. Beginning in the 1950’s, Dr. W.
Edwards Deming and Dr. Joseph Juran taught Japanese corporations how to use
statistical process control and how to be quality oriented. Their teachings spurred an
industrial revolution in Japan, enabled Japan-based businesses to compete head-to-head
with American corporations, and forced American businesses to seek improvement.
According to the literature, the idea of quality came to America in the early 1970s.
Activity-Based Costing (ABC) developed due to increased competition in the
private sector. Private-sector firms began looking to other areas for improvement as
competition was determined less by labor and machine efficiency than in the past.
Managers found ABC to be a way of providing more accurate cost information than
traditional accounting processes provided. Costs, under the ABC methodology, are
assigned to objects based on the amount of resources the objects consume. This new way
of tracking costs provided managers a clearer picture about the costs of processes,
products, and customers. According to Kaplan and Cooper (1998), ABC systems
emerged in the mid-1980s to meet this need for accurate cost information.
Customer Profitability Analysis (CPA) was the next business practice used to
seek out improvement. The paradigm shift from a product-cost focus to a customer-cost
focus was enabled by the use of ABC. The main idea of CPA is to analyze customer
costs and revenues and determine which customers are profitable, which customers are
59
not profitable, and why. Customers are then ranked by profit contribution, customer
profit profiles are established, and analyses to determine why unprofitable relationships
exist are conducted. Unprofitable customers are not necessarily arbitrarily dropped from
the firm’s list of clients. Firms have learned how to transform unprofitable customers
into profitable ones through discriminatory pricing, service level or ordering
arrangements, and payment terms. Firms use CPA to establish the link between
customers and costs.
The last business practice studied in this research was Customer Relationship
Management (CRM). The intense customer level focus used in CPA grew into the
concept of CRM. The analyses of unprofitable customers led to the one-to-one marketing
strategy used in CRM. In one-to-one marketing, firms market their products or services
to their customers one at a time. This process in CRM has four objectives: gain
customer, sell to customer, provide item sold to customer, and provide service to the
customer after the sale. Firms attempt to optimize profit through each of the four CRM
objectives. The advent of information technologies such as data warehousing and data
mining have led to the capabilities firms needed to fully reap the benefits of CRM. The
“personal” relationship in CRM is the unit of analysis and once the customer level
relationship is established, data from transactions is collected and analyzed.
It was discovered through the literature review that these methods incrementally
evolved and each philosophy builds on the previously developed method. It was also
discovered that ABC, CPA, and CRM developed over a rather close interval; CPA and
CRM appear to have evolved especially close because CRM is used to analyze the results
60
of CPA. The current strategies of CRM now include CPA as a step in the process. In
summary, the answer to the first investigative question is Quality, ABC, CPA, and CRM.
Data Analysis
The data analysis phase of this research followed a grounded theory approach.
The analysis was accomplished according to the plan presented in the previous chapter
and was divided into five distinct phases: 1) Initial data collection and analysis, 2) Case
study summary, 3) Concept Coding, 4) Concept Grouping, and 5) Concept Comparison.
The first phase, initial data collection, maintained a broad and non-restrictive
approach and cases were selected according to the previously defined Case Selection
Criteria. Cases were sought which discussed implementations of the business
improvement techniques Quality, ABC, CPA, and CRM. These methods or philosophies
were determined during the literature review to be the major techniques used over the
past three decades. To be included in this first phase of data collection, according to the
case selection criteria established by the author earlier in the study, the cases also had to
explain why the implementation was initiated, how the implementation was
accomplished, and discuss either a private-sector firm or public-sector government
agency. The original goal of obtaining at least 100 cases was exceeded as a total of 138
cases were initially selected as meeting the criteria.
The second phase of analysis, Case Summary, consisted of transcribing the
relevant data from each case into a spreadsheet which provided a catalog of data
according to sixteen broad categorical headings. The headings were subjectively
determined during the transcription of the case study data. Some headings were used to
simply organize the cases for later cross reference if needed while other categories
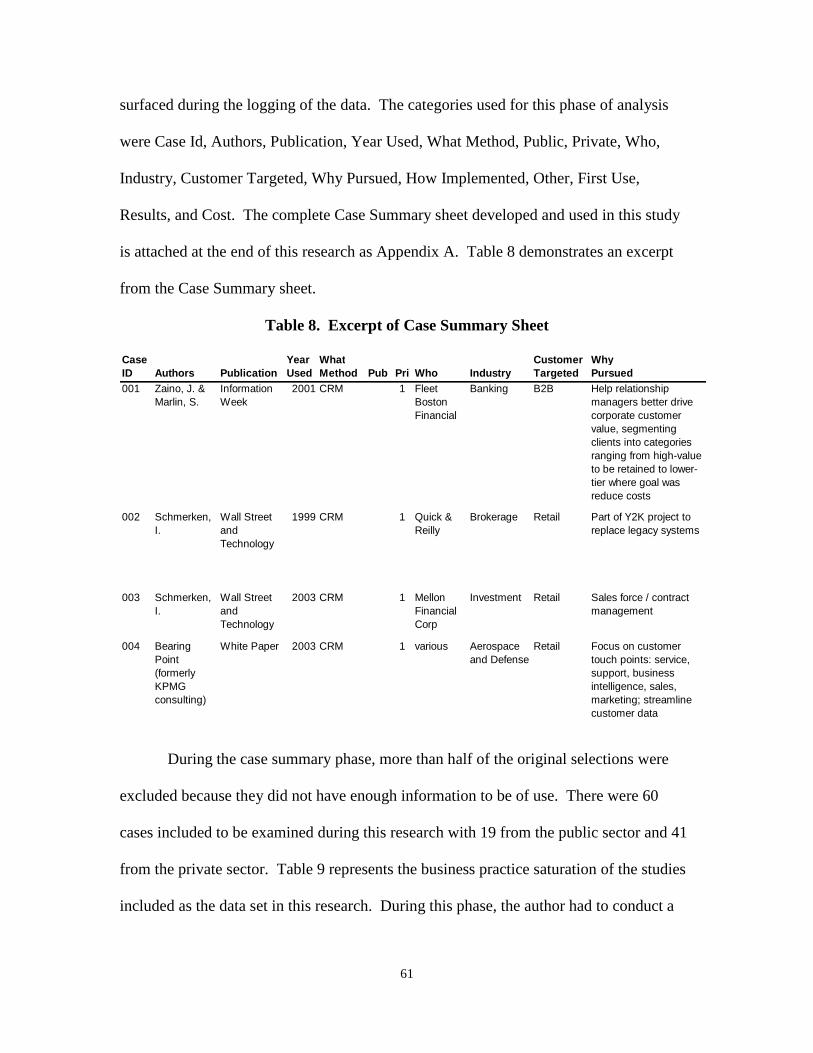
61
surfaced during the logging of the data. The categories used for this phase of analysis
were Case Id, Authors, Publication, Year Used, What Method, Public, Private, Who,
Industry, Customer Targeted, Why Pursued, How Implemented, Other, First Use,
Results, and Cost. The complete Case Summary sheet developed and used in this study
is attached at the end of this research as Appendix A. Table 8 demonstrates an excerpt
from the Case Summary sheet.
Table 8. Excerpt of Case Summary Sheet
Case Year What Customer WhyID Authors Publication Used Method Pub Pri Who Industry Targeted Pursued001 Zaino, J. &
Marlin, S.Information Week
2001 CRM 1 Fleet Boston Financial
Banking B2B Help relationship managers better drive corporate customer value, segmenting clients into categories ranging from high-value to be retained to lower-tier where goal was reduce costs
002 Schmerken, I.
Wall Street and Technology
1999 CRM 1 Quick & Reilly
Brokerage Retail Part of Y2K project to replace legacy systems
003 Schmerken, I.
Wall Street and Technology
2003 CRM 1 Mellon Financial Corp
Investment Retail Sales force / contract management
004 Bearing Point (formerly KPMG consulting)
White Paper 2003 CRM 1 various Aerospace and Defense
Retail Focus on customer touch points: service, support, business intelligence, sales, marketing; streamline customer data
During the case summary phase, more than half of the original selections were
excluded because they did not have enough information to be of use. There were 60
cases included to be examined during this research with 19 from the public sector and 41
from the private sector. Table 9 represents the business practice saturation of the studies
included as the data set in this research. During this phase, the author had to conduct a
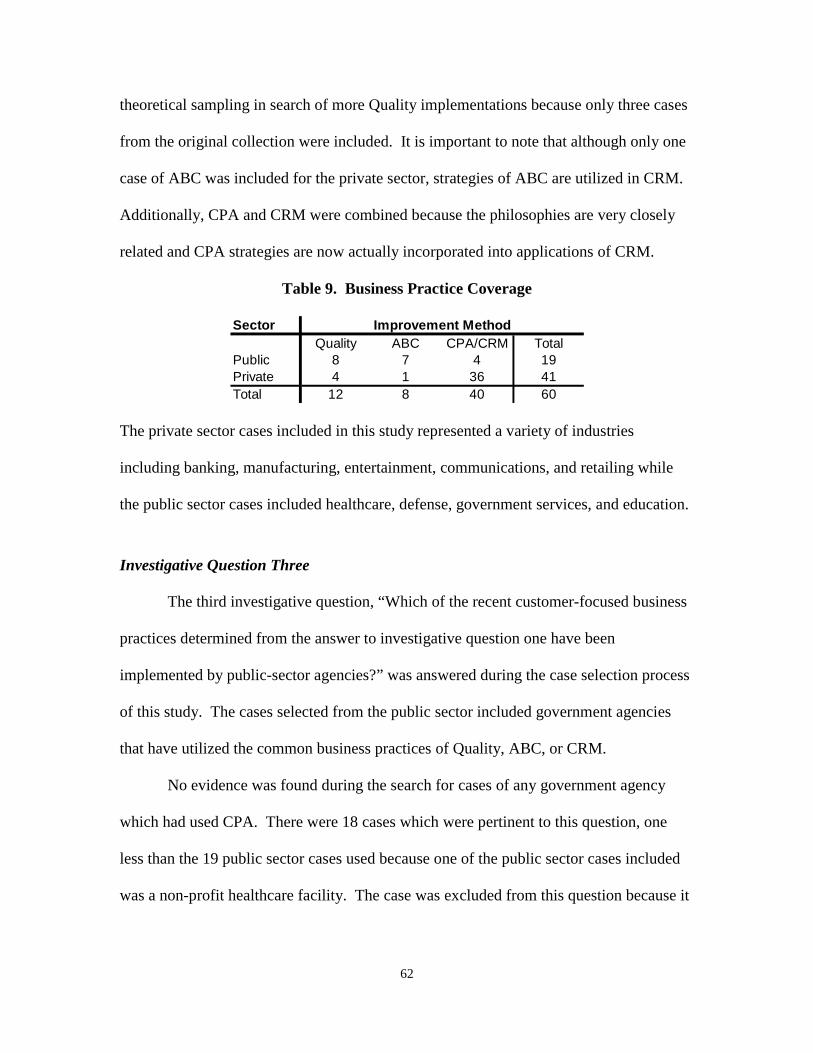
62
theoretical sampling in search of more Quality implementations because only three cases
from the original collection were included. It is important to note that although only one
case of ABC was included for the private sector, strategies of ABC are utilized in CRM.
Additionally, CPA and CRM were combined because the philosophies are very closely
related and CPA strategies are now actually incorporated into applications of CRM.
Table 9. Business Practice Coverage
SectorQuality ABC CPA/CRM Total
Public 8 7 4 19Private 4 1 36 41Total 12 8 40 60
Improvement Method
The private sector cases included in this study represented a variety of industries
including banking, manufacturing, entertainment, communications, and retailing while
the public sector cases included healthcare, defense, government services, and education.
Investigative Question Three
The third investigative question, “Which of the recent customer-focused business
practices determined from the answer to investigative question one have been
implemented by public-sector agencies?” was answered during the case selection process
of this study. The cases selected from the public sector included government agencies
that have utilized the common business practices of Quality, ABC, or CRM.
No evidence was found during the search for cases of any government agency
which had used CPA. There were 18 cases which were pertinent to this question, one
less than the 19 public sector cases used because one of the public sector cases included
was a non-profit healthcare facility. The case was excluded from this question because it
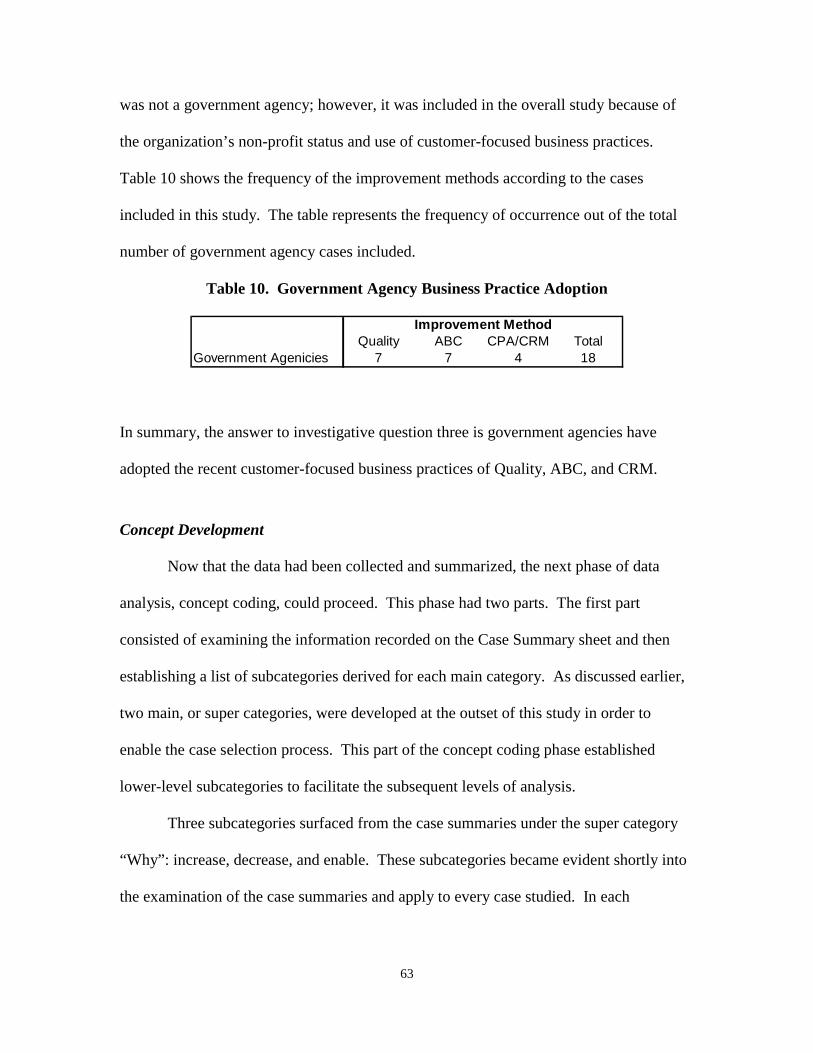
63
was not a government agency; however, it was included in the overall study because of
the organization’s non-profit status and use of customer-focused business practices.
Table 10 shows the frequency of the improvement methods according to the cases
included in this study. The table represents the frequency of occurrence out of the total
number of government agency cases included.
Table 10. Government Agency Business Practice Adoption
Quality ABC CPA/CRM TotalGovernment Agenicies 7 7 4 18
Improvement Method
In summary, the answer to investigative question three is government agencies have
adopted the recent customer-focused business practices of Quality, ABC, and CRM.
Concept Development
Now that the data had been collected and summarized, the next phase of data
analysis, concept coding, could proceed. This phase had two parts. The first part
consisted of examining the information recorded on the Case Summary sheet and then
establishing a list of subcategories derived for each main category. As discussed earlier,
two main, or super categories, were developed at the outset of this study in order to
enable the case selection process. This part of the concept coding phase established
lower-level subcategories to facilitate the subsequent levels of analysis.
Three subcategories surfaced from the case summaries under the super category
“Why”: increase, decrease, and enable. These subcategories became evident shortly into
the examination of the case summaries and apply to every case studied. In each
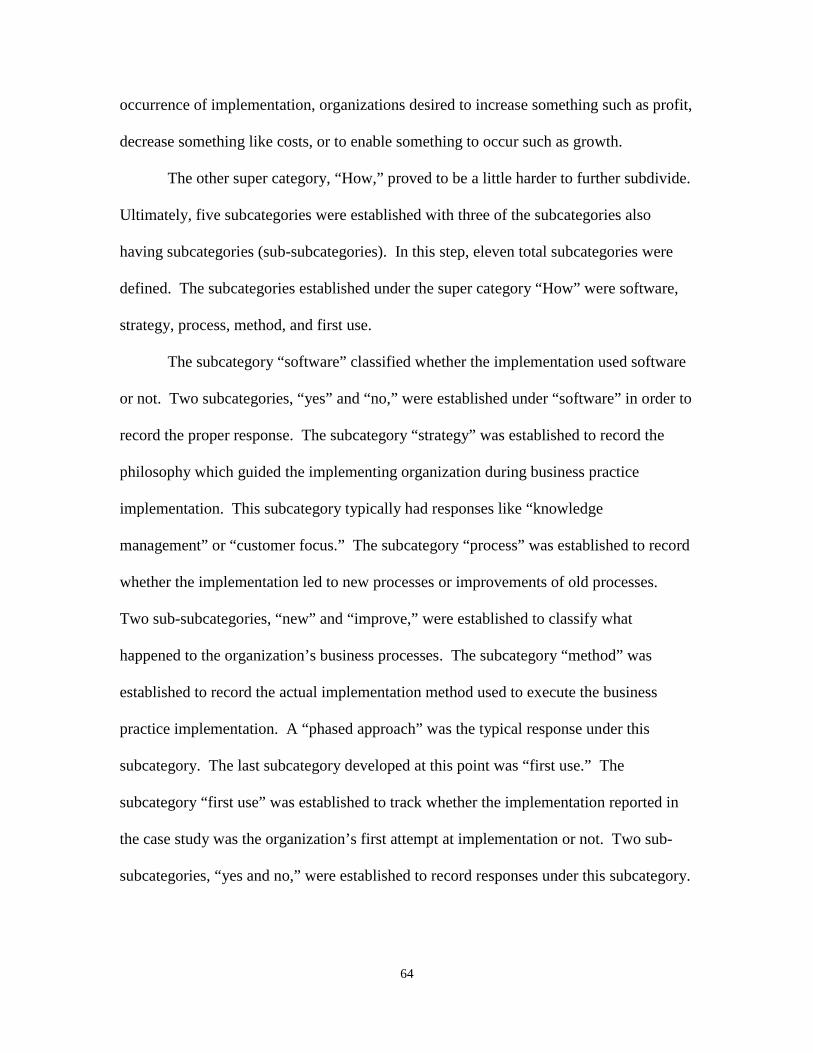
64
occurrence of implementation, organizations desired to increase something such as profit,
decrease something like costs, or to enable something to occur such as growth.
The other super category, “How,” proved to be a little harder to further subdivide.
Ultimately, five subcategories were established with three of the subcategories also
having subcategories (sub-subcategories). In this step, eleven total subcategories were
defined. The subcategories established under the super category “How” were software,
strategy, process, method, and first use.
The subcategory “software” classified whether the implementation used software
or not. Two subcategories, “yes” and “no,” were established under “software” in order to
record the proper response. The subcategory “strategy” was established to record the
philosophy which guided the implementing organization during business practice
implementation. This subcategory typically had responses like “knowledge
management” or “customer focus.” The subcategory “process” was established to record
whether the implementation led to new processes or improvements of old processes.
Two sub-subcategories, “new” and “improve,” were established to classify what
happened to the organization’s business processes. The subcategory “method” was
established to record the actual implementation method used to execute the business
practice implementation. A “phased approach” was the typical response under this
subcategory. The last subcategory developed at this point was “first use.” The
subcategory “first use” was established to track whether the implementation reported in
the case study was the organization’s first attempt at implementation or not. Two sub-
subcategories, “yes and no,” were established to record responses under this subcategory.
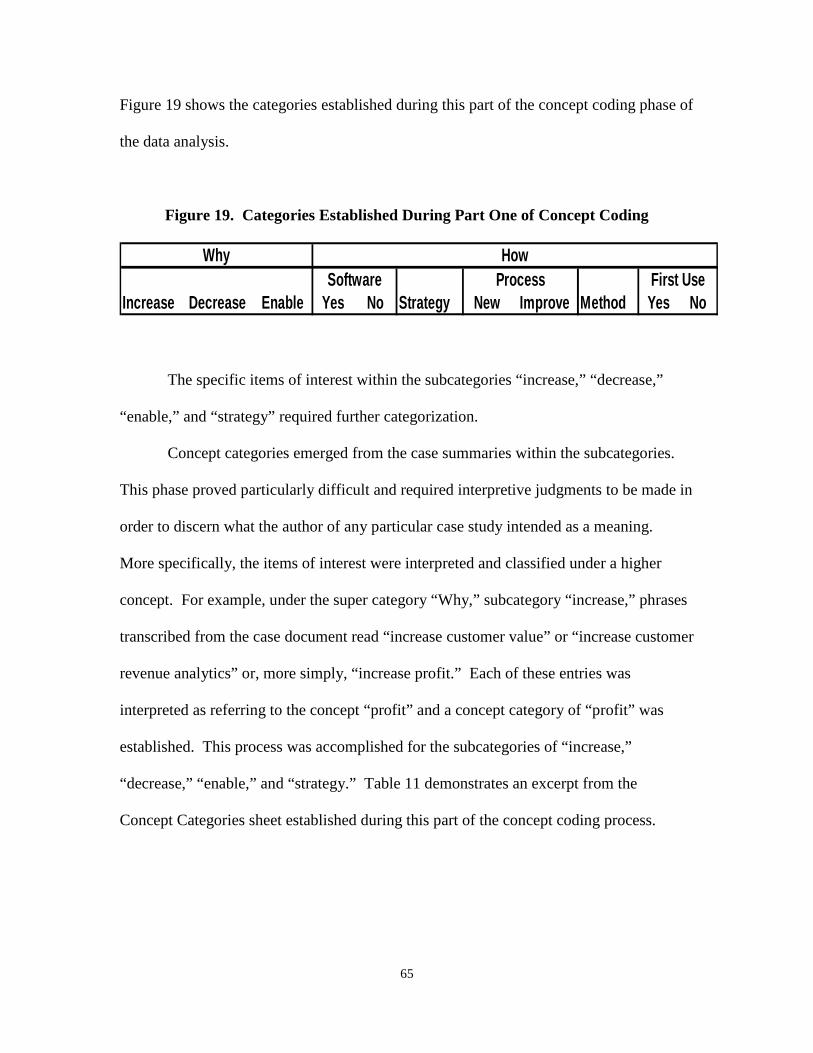
65
Figure 19 shows the categories established during this part of the concept coding phase of
the data analysis.
Figure 19. Categories Established During Part One of Concept Coding
The specific items of interest within the subcategories “increase,” “decrease,”
“enable,” and “strategy” required further categorization.
Concept categories emerged from the case summaries within the subcategories.
This phase proved particularly difficult and required interpretive judgments to be made in
order to discern what the author of any particular case study intended as a meaning.
More specifically, the items of interest were interpreted and classified under a higher
concept. For example, under the super category “Why,” subcategory “increase,” phrases
transcribed from the case document read “increase customer value” or “increase customer
revenue analytics” or, more simply, “increase profit.” Each of these entries was
interpreted as referring to the concept “profit” and a concept category of “profit” was
established. This process was accomplished for the subcategories of “increase,”
“decrease,” “enable,” and “strategy.” Table 11 demonstrates an excerpt from the
Concept Categories sheet established during this part of the concept coding process.
Increase Decrease Enable Yes No Strategy New Improve Method Yes No
HowWhySoftware Process First Use
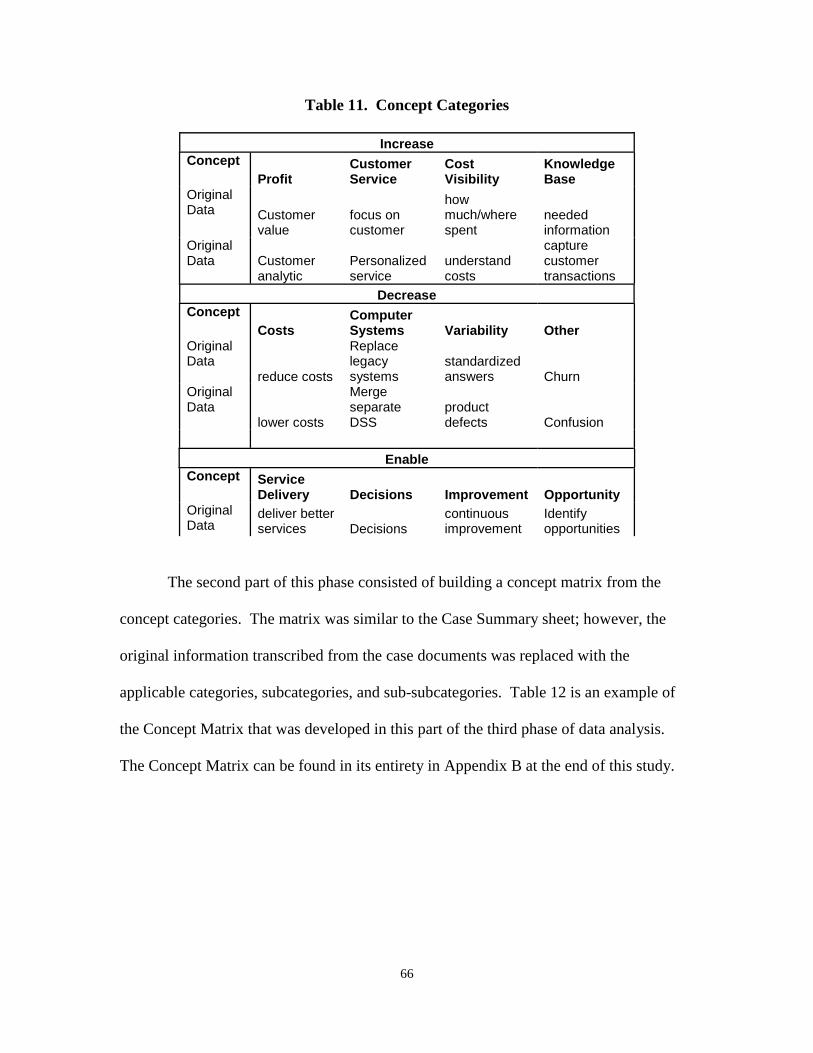
66
Table 11. Concept Categories
Increase Concept
Profit Customer Service
Cost Visibility
Knowledge Base
Original Data Customer
value focus on customer
how much/where spent
needed information
Original Data
Customer analytic
Personalized service
understand costs
capture customer transactions
Decrease Concept
Costs Computer Systems Variability Other
Original Data
reduce costs
Replace legacy systems
standardized answers Churn
Original Data lower costs
Merge separate DSS
product defects Confusion
Enable Concept Service
Delivery Decisions Improvement Opportunity Original Data
deliver better services Decisions
continuous improvement
Identify opportunities
The second part of this phase consisted of building a concept matrix from the
concept categories. The matrix was similar to the Case Summary sheet; however, the
original information transcribed from the case documents was replaced with the
applicable categories, subcategories, and sub-subcategories. Table 12 is an example of
the Concept Matrix that was developed in this part of the third phase of data analysis.
The Concept Matrix can be found in its entirety in Appendix B at the end of this study.
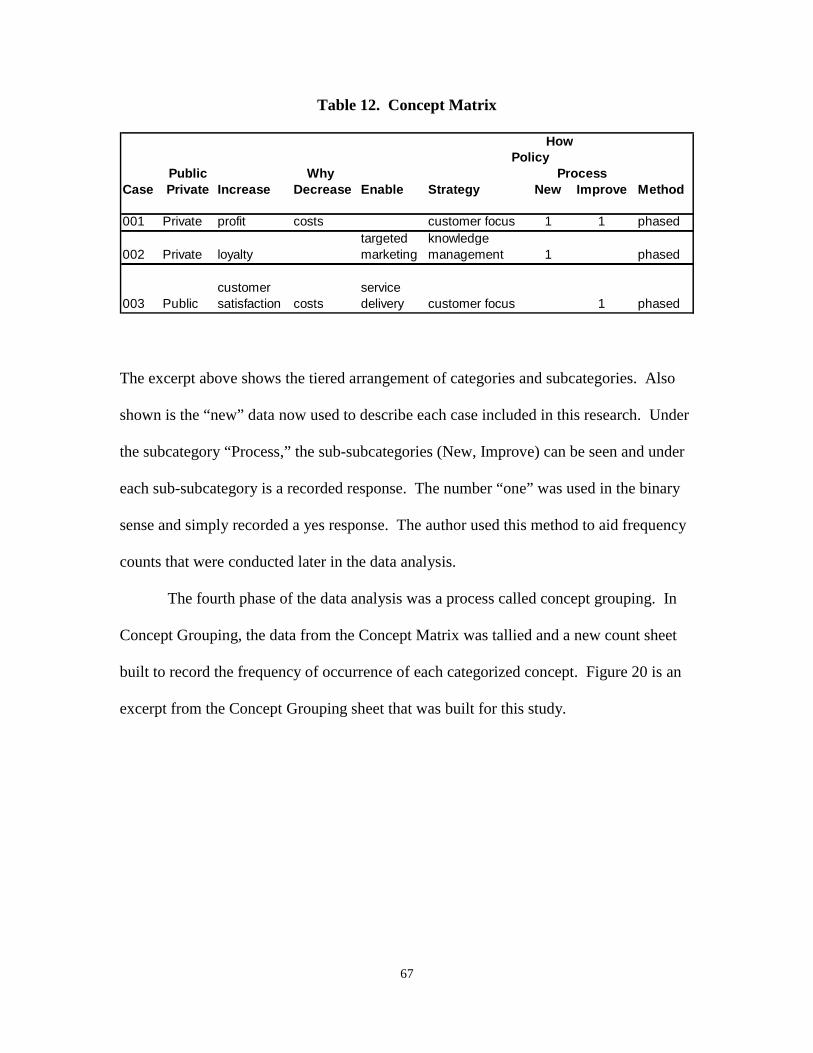
67
Table 12. Concept Matrix
PublicCase Private Increase Decrease Enable Strategy New Improve Method
001 Private profit costs customer focus 1 1 phased
002 Private loyaltytargeted marketing
knowledge management 1 phased
003 Publiccustomer satisfaction costs
service delivery customer focus 1 phased
PolicyWhy Process
How
The excerpt above shows the tiered arrangement of categories and subcategories. Also
shown is the “new” data now used to describe each case included in this research. Under
the subcategory “Process,” the sub-subcategories (New, Improve) can be seen and under
each sub-subcategory is a recorded response. The number “one” was used in the binary
sense and simply recorded a yes response. The author used this method to aid frequency
counts that were conducted later in the data analysis.
The fourth phase of the data analysis was a process called concept grouping. In
Concept Grouping, the data from the Concept Matrix was tallied and a new count sheet
built to record the frequency of occurrence of each categorized concept. Figure 20 is an
excerpt from the Concept Grouping sheet that was built for this study.
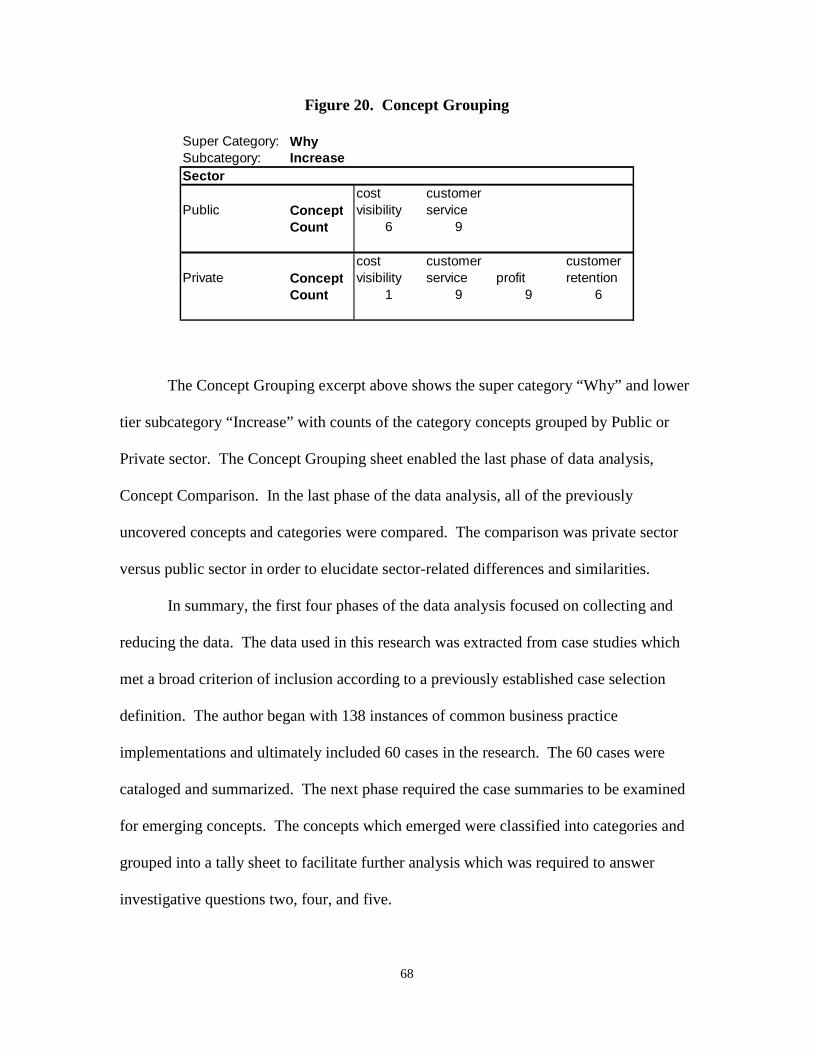
68
Figure 20. Concept Grouping
Super Category: WhySubcategory: IncreaseSector
Public Conceptcost visibility
customer service
Count 6 9
Private Conceptcost visibility
customer service profit
customer retention
Count 1 9 9 6
The Concept Grouping excerpt above shows the super category “Why” and lower
tier subcategory “Increase” with counts of the category concepts grouped by Public or
Private sector. The Concept Grouping sheet enabled the last phase of data analysis,
Concept Comparison. In the last phase of the data analysis, all of the previously
uncovered concepts and categories were compared. The comparison was private sector
versus public sector in order to elucidate sector-related differences and similarities.
In summary, the first four phases of the data analysis focused on collecting and
reducing the data. The data used in this research was extracted from case studies which
met a broad criterion of inclusion according to a previously established case selection
definition. The author began with 138 instances of common business practice
implementations and ultimately included 60 cases in the research. The 60 cases were
cataloged and summarized. The next phase required the case summaries to be examined
for emerging concepts. The concepts which emerged were classified into categories and
grouped into a tally sheet to facilitate further analysis which was required to answer
investigative questions two, four, and five.
69
Investigative Question Two
The second investigative question, “What are the common principles of recent
customer-focused business practice implementations in private-sector entities?” was
answered during the fifth phase of data analysis in this research.
The frequency of occurrence of each concept category was computed within each
subcategory. The private sector cases showed a strong tendency to implement
improvement techniques in order to increase or enable. The subcategory comparison
showed 35 cases exhibited “increase” and 41 cases, every case, specified the
improvement method was to enable something. Only 8 cases reported the reason for
implementation was to decrease something. Closer examination of the concept categories
under each subcategory provided further explanation.
“Profit” and “customer service” were the top two concepts private-sector firms
sought to increase through an implementation of an improvement method. Under the
subcategory “enable,” private-sector firms sought to enable the concepts “customization”
and “targeted marketing” as the top two reasons for implementing a business practice.
The subcategory “decrease” did not seem to be important to private-sector firms as only 8
of 41 cases included the category. Table 13 shows the common principles found through
this study in reference to why implementations were accomplished in the private sector.
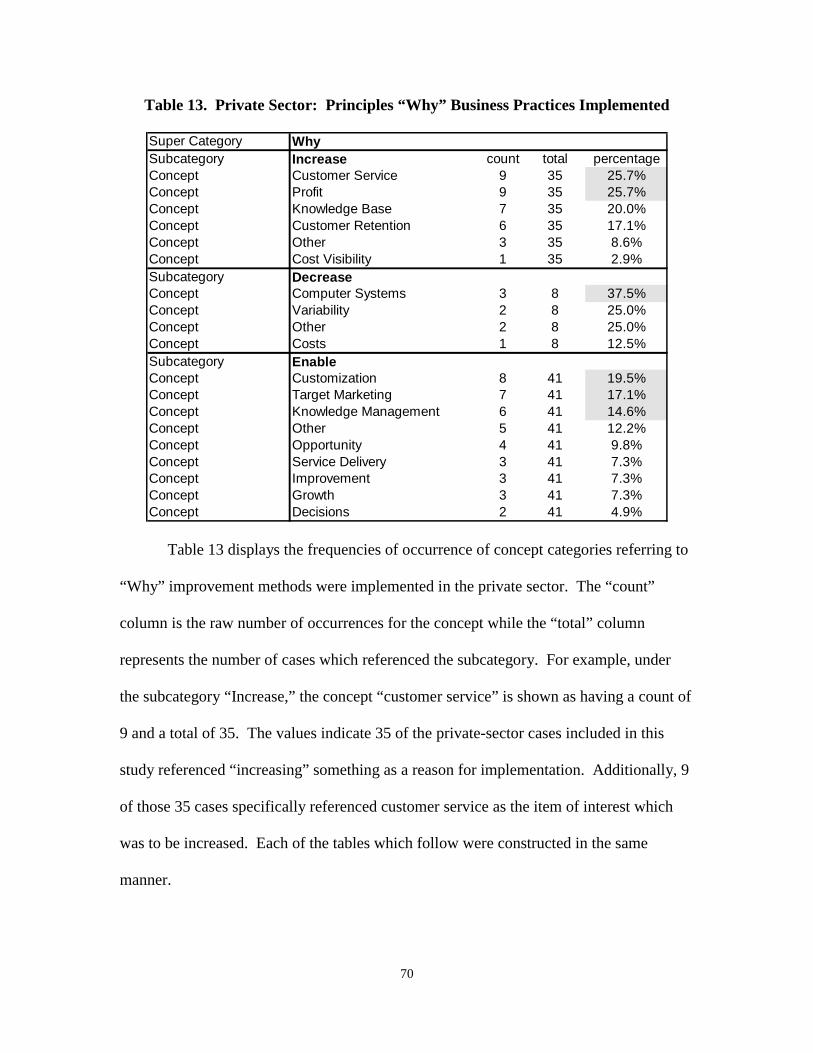
70
Table 13. Private Sector: Principles “Why” Business Practices Implemented
Super Category WhySubcategory Increase count total percentageConcept Customer Service 9 35 25.7%Concept Profit 9 35 25.7%Concept Knowledge Base 7 35 20.0%Concept Customer Retention 6 35 17.1%Concept Other 3 35 8.6%Concept Cost Visibility 1 35 2.9%Subcategory DecreaseConcept Computer Systems 3 8 37.5%Concept Variability 2 8 25.0%Concept Other 2 8 25.0%Concept Costs 1 8 12.5%Subcategory EnableConcept Customization 8 41 19.5%Concept Target Marketing 7 41 17.1%Concept Knowledge Management 6 41 14.6%Concept Other 5 41 12.2%Concept Opportunity 4 41 9.8%Concept Service Delivery 3 41 7.3%Concept Improvement 3 41 7.3%Concept Growth 3 41 7.3%Concept Decisions 2 41 4.9%
Table 13 displays the frequencies of occurrence of concept categories referring to
“Why” improvement methods were implemented in the private sector. The “count”
column is the raw number of occurrences for the concept while the “total” column
represents the number of cases which referenced the subcategory. For example, under
the subcategory “Increase,” the concept “customer service” is shown as having a count of
9 and a total of 35. The values indicate 35 of the private-sector cases included in this
study referenced “increasing” something as a reason for implementation. Additionally, 9
of those 35 cases specifically referenced customer service as the item of interest which
was to be increased. Each of the tables which follow were constructed in the same
manner.
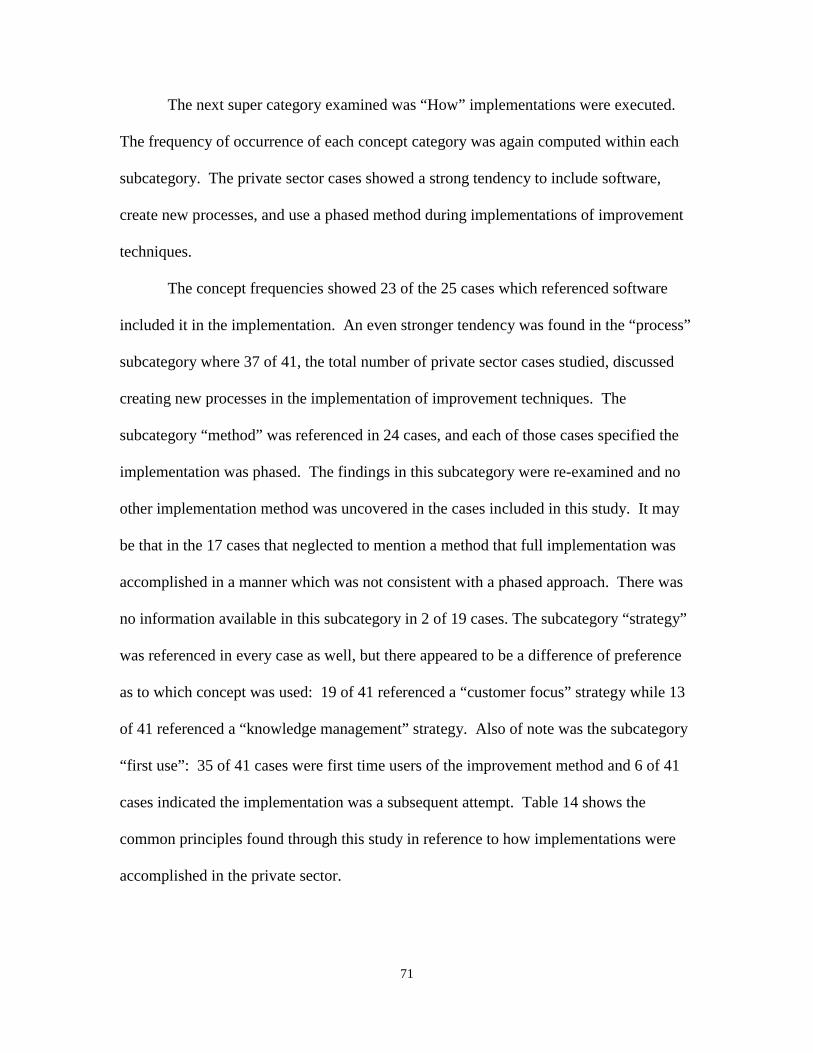
71
The next super category examined was “How” implementations were executed.
The frequency of occurrence of each concept category was again computed within each
subcategory. The private sector cases showed a strong tendency to include software,
create new processes, and use a phased method during implementations of improvement
techniques.
The concept frequencies showed 23 of the 25 cases which referenced software
included it in the implementation. An even stronger tendency was found in the “process”
subcategory where 37 of 41, the total number of private sector cases studied, discussed
creating new processes in the implementation of improvement techniques. The
subcategory “method” was referenced in 24 cases, and each of those cases specified the
implementation was phased. The findings in this subcategory were re-examined and no
other implementation method was uncovered in the cases included in this study. It may
be that in the 17 cases that neglected to mention a method that full implementation was
accomplished in a manner which was not consistent with a phased approach. There was
no information available in this subcategory in 2 of 19 cases. The subcategory “strategy”
was referenced in every case as well, but there appeared to be a difference of preference
as to which concept was used: 19 of 41 referenced a “customer focus” strategy while 13
of 41 referenced a “knowledge management” strategy. Also of note was the subcategory
“first use”: 35 of 41 cases were first time users of the improvement method and 6 of 41
cases indicated the implementation was a subsequent attempt. Table 14 shows the
common principles found through this study in reference to how implementations were
accomplished in the private sector.
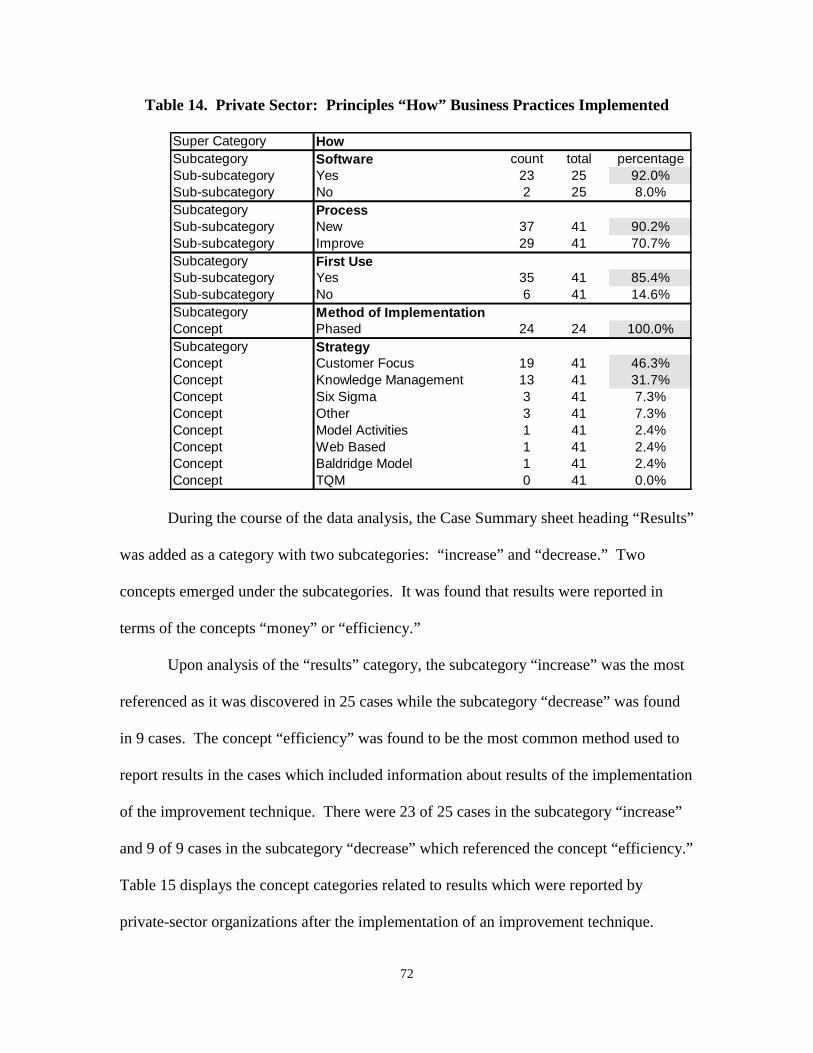
72
Table 14. Private Sector: Principles “How” Business Practices Implemented
Super Category HowSubcategory Software count total percentageSub-subcategory Yes 23 25 92.0%Sub-subcategory No 2 25 8.0%Subcategory ProcessSub-subcategory New 37 41 90.2%Sub-subcategory Improve 29 41 70.7%Subcategory First UseSub-subcategory Yes 35 41 85.4%Sub-subcategory No 6 41 14.6%Subcategory Method of ImplementationConcept Phased 24 24 100.0%Subcategory StrategyConcept Customer Focus 19 41 46.3%Concept Knowledge Management 13 41 31.7%Concept Six Sigma 3 41 7.3%Concept Other 3 41 7.3%Concept Model Activities 1 41 2.4%Concept Web Based 1 41 2.4%Concept Baldridge Model 1 41 2.4%Concept TQM 0 41 0.0%
During the course of the data analysis, the Case Summary sheet heading “Results”
was added as a category with two subcategories: “increase” and “decrease.” Two
concepts emerged under the subcategories. It was found that results were reported in
terms of the concepts “money” or “efficiency.”
Upon analysis of the “results” category, the subcategory “increase” was the most
referenced as it was discovered in 25 cases while the subcategory “decrease” was found
in 9 cases. The concept “efficiency” was found to be the most common method used to
report results in the cases which included information about results of the implementation
of the improvement technique. There were 23 of 25 cases in the subcategory “increase”
and 9 of 9 cases in the subcategory “decrease” which referenced the concept “efficiency.”
Table 15 displays the concept categories related to results which were reported by
private-sector organizations after the implementation of an improvement technique.
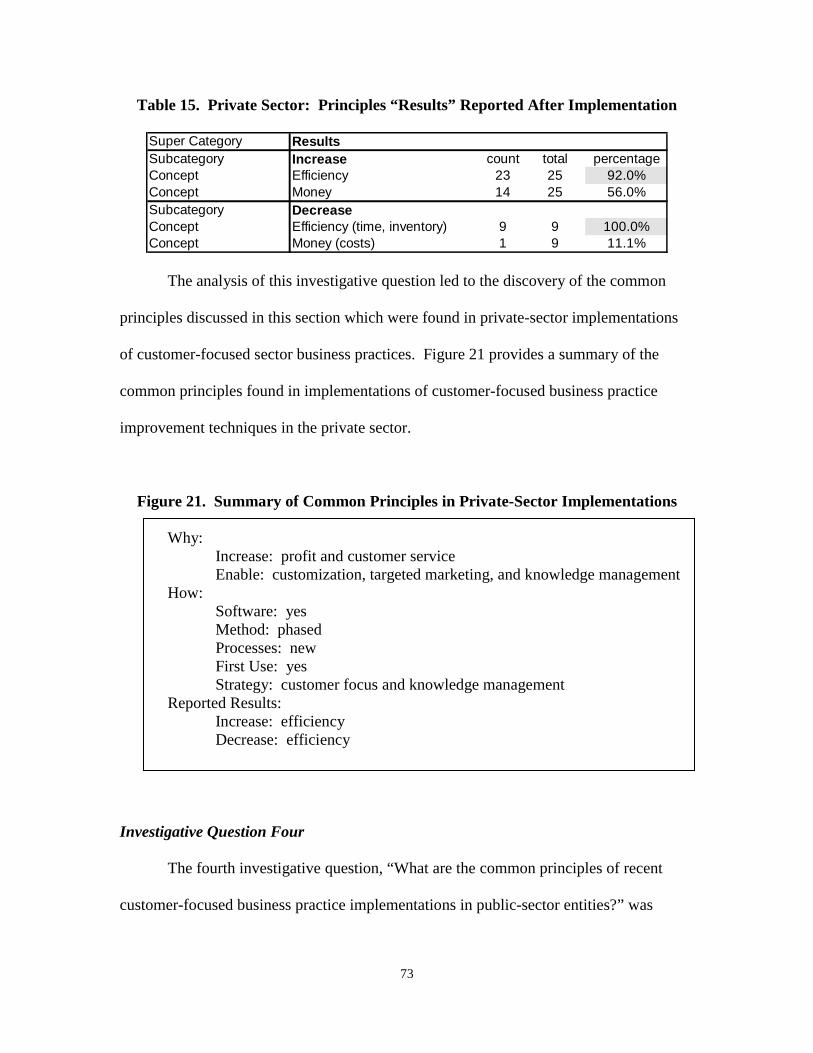
73
Table 15. Private Sector: Principles “Results” Reported After Implementation
Super Category ResultsSubcategory Increase count total percentageConcept Efficiency 23 25 92.0%Concept Money 14 25 56.0%Subcategory DecreaseConcept Efficiency (time, inventory) 9 9 100.0%Concept Money (costs) 1 9 11.1%
The analysis of this investigative question led to the discovery of the common
principles discussed in this section which were found in private-sector implementations
of customer-focused sector business practices. Figure 21 provides a summary of the
common principles found in implementations of customer-focused business practice
improvement techniques in the private sector.
Figure 21. Summary of Common Principles in Private-Sector Implementations
Why: Increase: profit and customer service Enable: customization, targeted marketing, and knowledge management
How: Software: yes Method: phased Processes: new First Use: yes Strategy: customer focus and knowledge management
Reported Results: Increase: efficiency Decrease: efficiency
Investigative Question Four
The fourth investigative question, “What are the common principles of recent
customer-focused business practice implementations in public-sector entities?” was
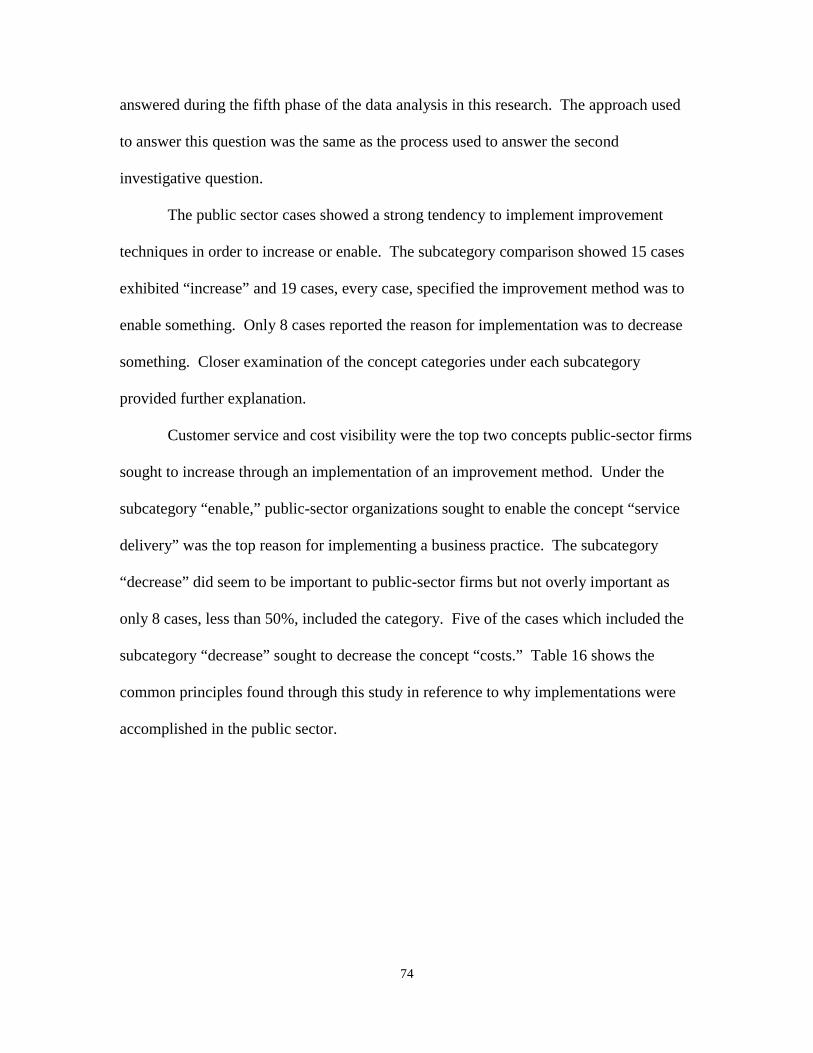
74
answered during the fifth phase of the data analysis in this research. The approach used
to answer this question was the same as the process used to answer the second
investigative question.
The public sector cases showed a strong tendency to implement improvement
techniques in order to increase or enable. The subcategory comparison showed 15 cases
exhibited “increase” and 19 cases, every case, specified the improvement method was to
enable something. Only 8 cases reported the reason for implementation was to decrease
something. Closer examination of the concept categories under each subcategory
provided further explanation.
Customer service and cost visibility were the top two concepts public-sector firms
sought to increase through an implementation of an improvement method. Under the
subcategory “enable,” public-sector organizations sought to enable the concept “service
delivery” was the top reason for implementing a business practice. The subcategory
“decrease” did seem to be important to public-sector firms but not overly important as
only 8 cases, less than 50%, included the category. Five of the cases which included the
subcategory “decrease” sought to decrease the concept “costs.” Table 16 shows the
common principles found through this study in reference to why implementations were
accomplished in the public sector.
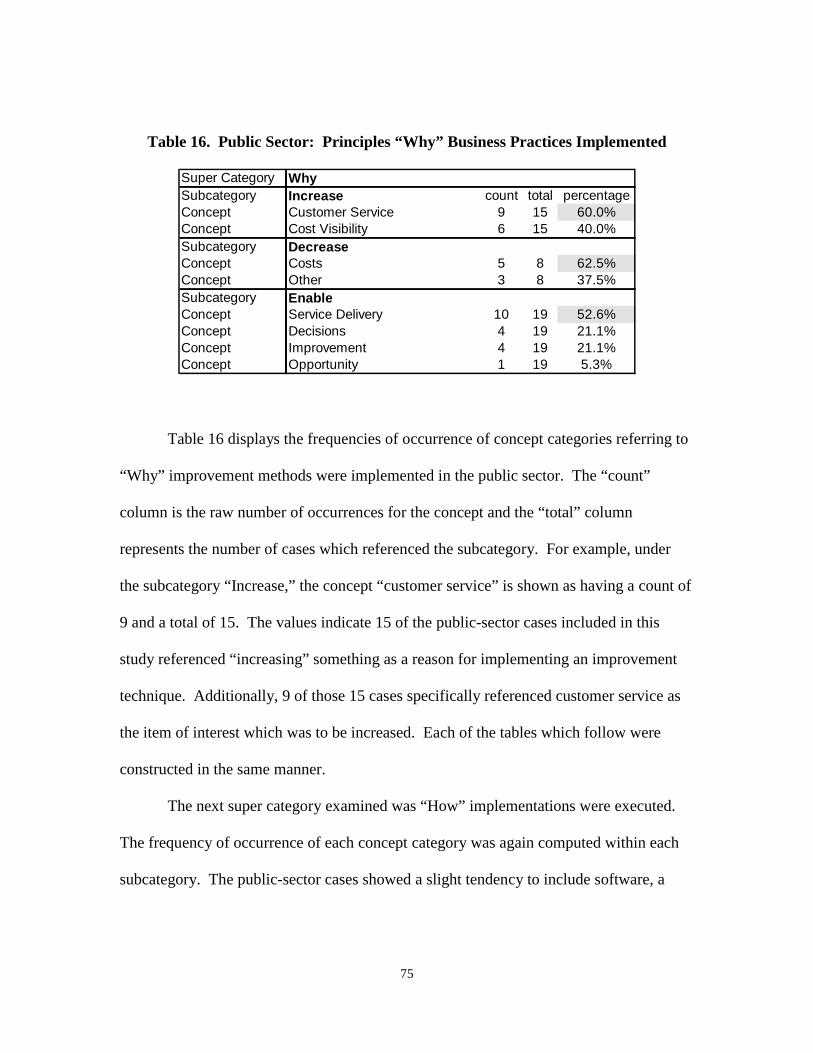
75
Table 16. Public Sector: Principles “Why” Business Practices Implemented
Super Category WhySubcategory Increase count total percentageConcept Customer Service 9 15 60.0%Concept Cost Visibility 6 15 40.0%Subcategory DecreaseConcept Costs 5 8 62.5%Concept Other 3 8 37.5%Subcategory EnableConcept Service Delivery 10 19 52.6%Concept Decisions 4 19 21.1%Concept Improvement 4 19 21.1%Concept Opportunity 1 19 5.3%
Table 16 displays the frequencies of occurrence of concept categories referring to
“Why” improvement methods were implemented in the public sector. The “count”
column is the raw number of occurrences for the concept and the “total” column
represents the number of cases which referenced the subcategory. For example, under
the subcategory “Increase,” the concept “customer service” is shown as having a count of
9 and a total of 15. The values indicate 15 of the public-sector cases included in this
study referenced “increasing” something as a reason for implementing an improvement
technique. Additionally, 9 of those 15 cases specifically referenced customer service as
the item of interest which was to be increased. Each of the tables which follow were
constructed in the same manner.
The next super category examined was “How” implementations were executed.
The frequency of occurrence of each concept category was again computed within each
subcategory. The public-sector cases showed a slight tendency to include software, a
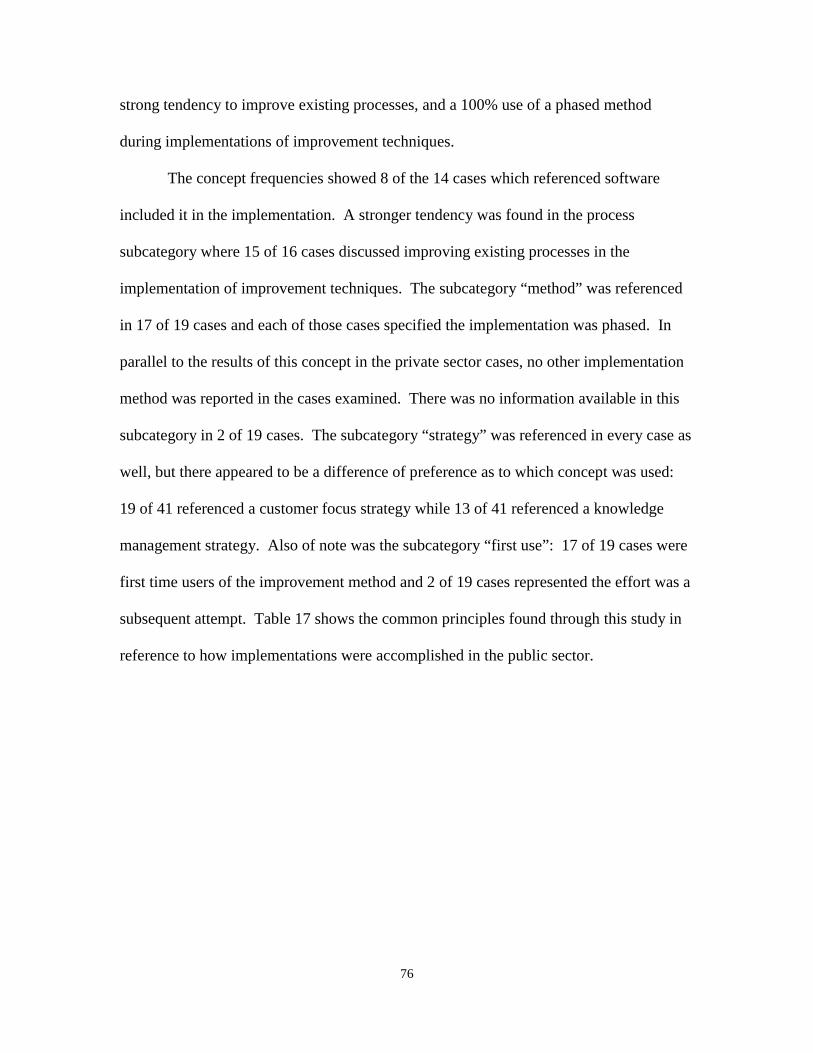
76
strong tendency to improve existing processes, and a 100% use of a phased method
during implementations of improvement techniques.
The concept frequencies showed 8 of the 14 cases which referenced software
included it in the implementation. A stronger tendency was found in the process
subcategory where 15 of 16 cases discussed improving existing processes in the
implementation of improvement techniques. The subcategory “method” was referenced
in 17 of 19 cases and each of those cases specified the implementation was phased. In
parallel to the results of this concept in the private sector cases, no other implementation
method was reported in the cases examined. There was no information available in this
subcategory in 2 of 19 cases. The subcategory “strategy” was referenced in every case as
well, but there appeared to be a difference of preference as to which concept was used:
19 of 41 referenced a customer focus strategy while 13 of 41 referenced a knowledge
management strategy. Also of note was the subcategory “first use”: 17 of 19 cases were
first time users of the improvement method and 2 of 19 cases represented the effort was a
subsequent attempt. Table 17 shows the common principles found through this study in
reference to how implementations were accomplished in the public sector.
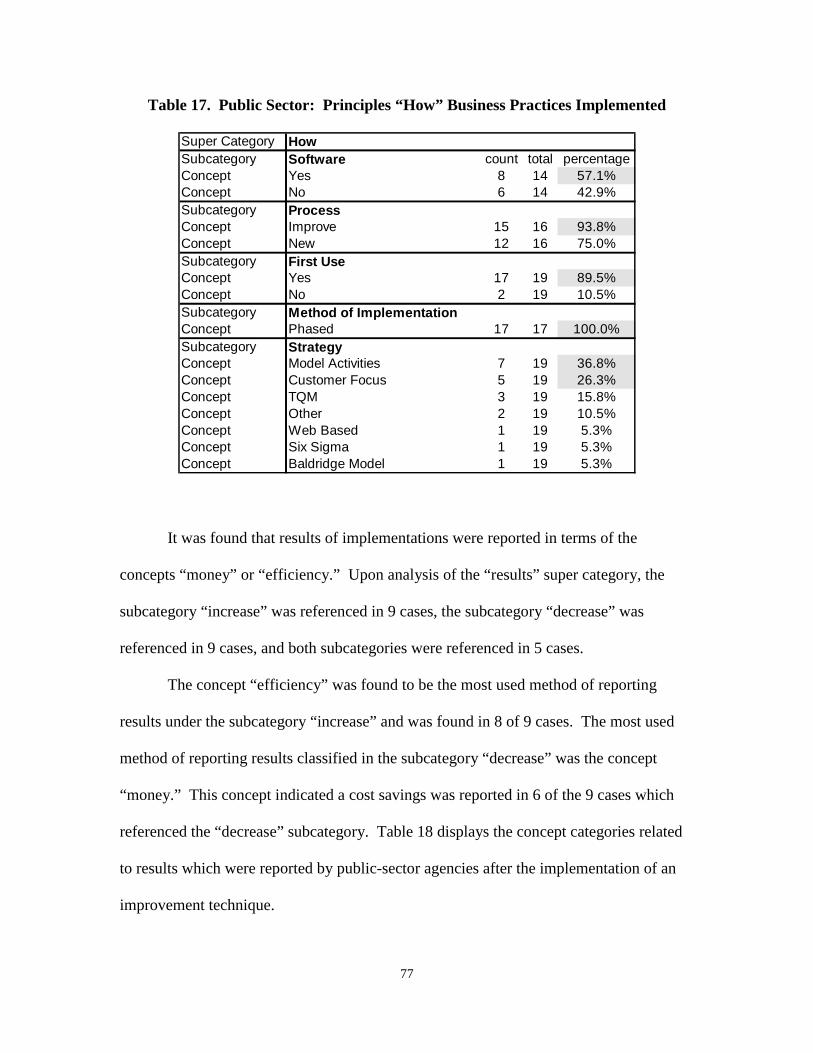
77
Table 17. Public Sector: Principles “How” Business Practices Implemented
Super Category HowSubcategory Software count total percentageConcept Yes 8 14 57.1%Concept No 6 14 42.9%Subcategory ProcessConcept Improve 15 16 93.8%Concept New 12 16 75.0%Subcategory First UseConcept Yes 17 19 89.5%Concept No 2 19 10.5%Subcategory Method of ImplementationConcept Phased 17 17 100.0%Subcategory StrategyConcept Model Activities 7 19 36.8%Concept Customer Focus 5 19 26.3%Concept TQM 3 19 15.8%Concept Other 2 19 10.5%Concept Web Based 1 19 5.3%Concept Six Sigma 1 19 5.3%Concept Baldridge Model 1 19 5.3%
It was found that results of implementations were reported in terms of the
concepts “money” or “efficiency.” Upon analysis of the “results” super category, the
subcategory “increase” was referenced in 9 cases, the subcategory “decrease” was
referenced in 9 cases, and both subcategories were referenced in 5 cases.
The concept “efficiency” was found to be the most used method of reporting
results under the subcategory “increase” and was found in 8 of 9 cases. The most used
method of reporting results classified in the subcategory “decrease” was the concept
“money.” This concept indicated a cost savings was reported in 6 of the 9 cases which
referenced the “decrease” subcategory. Table 18 displays the concept categories related
to results which were reported by public-sector agencies after the implementation of an
improvement technique.
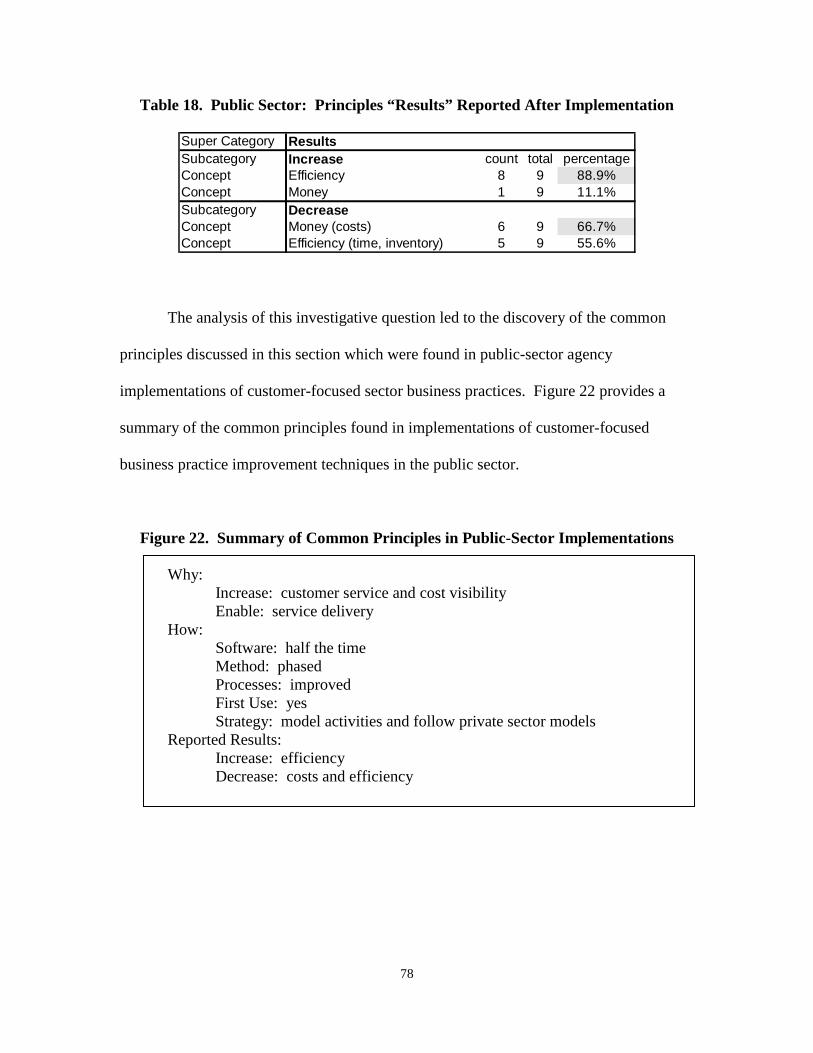
78
Table 18. Public Sector: Principles “Results” Reported After Implementation
Super Category ResultsSubcategory Increase count total percentageConcept Efficiency 8 9 88.9%Concept Money 1 9 11.1%Subcategory DecreaseConcept Money (costs) 6 9 66.7%Concept Efficiency (time, inventory) 5 9 55.6%
The analysis of this investigative question led to the discovery of the common
principles discussed in this section which were found in public-sector agency
implementations of customer-focused sector business practices. Figure 22 provides a
summary of the common principles found in implementations of customer-focused
business practice improvement techniques in the public sector.
Figure 22. Summary of Common Principles in Public-Sector Implementations
Why: Increase: customer service and cost visibility Enable: service delivery
How: Software: half the time Method: phased Processes: improved First Use: yes Strategy: model activities and follow private sector models
Reported Results: Increase: efficiency Decrease: costs and efficiency
79
Investigative Question Five
The last investigative question, “Do the common principles of customer-focused
implementations match principles of implementations in public-sector entities?” was
answered during the fifth phase of the data analysis in this research. This question
required a comparison of the common concepts of implementation which emerged from
the analysis of private-sector implementations in investigative question two and public-
sector implementations in investigative question four. The analysis for this question was
accomplished in three parts: why, how, and results.
The first area compared was the category concepts under the super category
“Why.” It was found during analysis for investigative question two that private-sector
firms implement improvement techniques in order to increase or enable. Common
concepts emerged within these subcategories.
“Profit” and “customer service” were the top two concepts private-sector firms
sought to increase through an implementation of an improvement method. Under the
subcategory “enable,” private-sector firms sought to enable the concepts “customization”
and “targeted marketing” as the top two reasons for implementing a business practice.
The subcategory “decrease” did not seem to be important to private-sector firms as only 8
of 41 cases included the category.
During the analysis for investigative question four, it was found that public-sector
agencies implement customer-focused business practices in order to increase or enable.
Customer service and cost visibility were the top two concepts public-sector firms sought
to increase through an implementation of an improvement method. Under the
subcategory “enable,” public-sector organizations sought to enable the concept “service
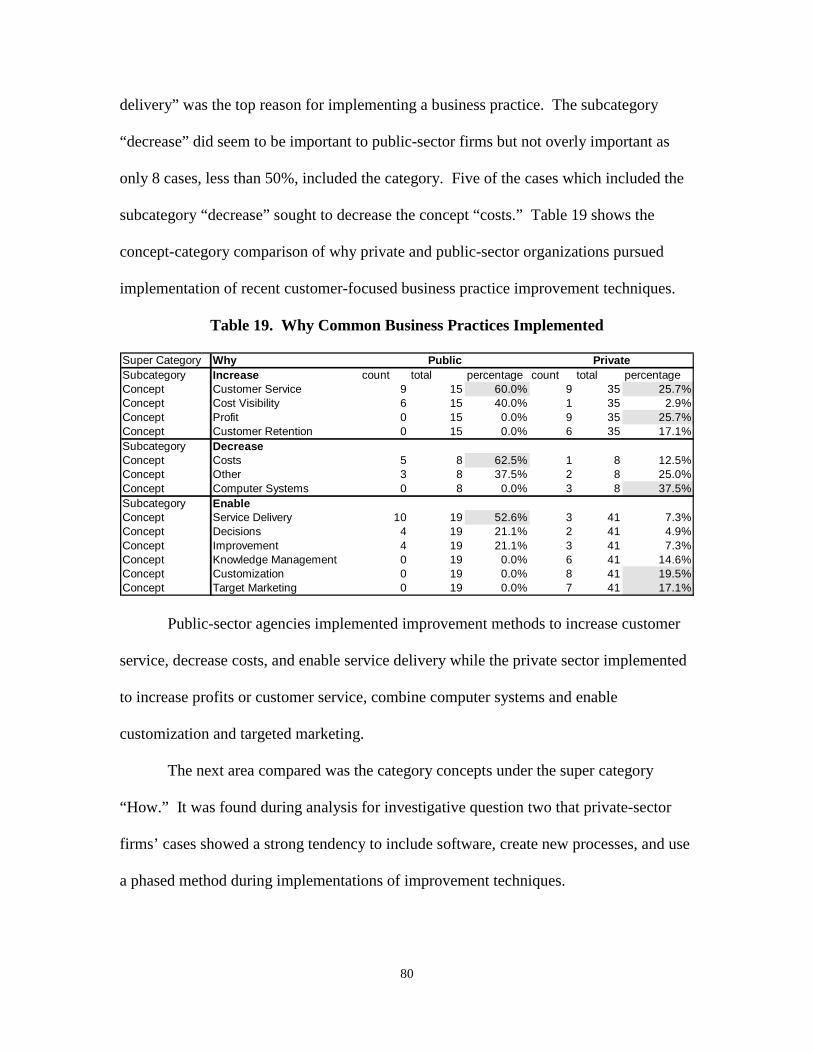
80
delivery” was the top reason for implementing a business practice. The subcategory
“decrease” did seem to be important to public-sector firms but not overly important as
only 8 cases, less than 50%, included the category. Five of the cases which included the
subcategory “decrease” sought to decrease the concept “costs.” Table 19 shows the
concept-category comparison of why private and public-sector organizations pursued
implementation of recent customer-focused business practice improvement techniques.
Table 19. Why Common Business Practices Implemented
Super Category WhySubcategory Increase count total percentage count total percentageConcept Customer Service 9 15 60.0% 9 35 25.7%Concept Cost Visibility 6 15 40.0% 1 35 2.9%Concept Profit 0 15 0.0% 9 35 25.7%Concept Customer Retention 0 15 0.0% 6 35 17.1%Subcategory DecreaseConcept Costs 5 8 62.5% 1 8 12.5%Concept Other 3 8 37.5% 2 8 25.0%Concept Computer Systems 0 8 0.0% 3 8 37.5%Subcategory EnableConcept Service Delivery 10 19 52.6% 3 41 7.3%Concept Decisions 4 19 21.1% 2 41 4.9%Concept Improvement 4 19 21.1% 3 41 7.3%Concept Knowledge Management 0 19 0.0% 6 41 14.6%Concept Customization 0 19 0.0% 8 41 19.5%Concept Target Marketing 0 19 0.0% 7 41 17.1%
Public Private
Public-sector agencies implemented improvement methods to increase customer
service, decrease costs, and enable service delivery while the private sector implemented
to increase profits or customer service, combine computer systems and enable
customization and targeted marketing.
The next area compared was the category concepts under the super category
“How.” It was found during analysis for investigative question two that private-sector
firms’ cases showed a strong tendency to include software, create new processes, and use
a phased method during implementations of improvement techniques.
81
The concept frequencies showed 23 of the 25 cases which referenced software
included it in the implementation. An even stronger tendency was found in the “process”
subcategory where 37 of 41, the total number of private sector cases studied, discussed
creating new processes in the implementation of improvement techniques. The
subcategory “method” was referenced in 24 cases, and each of those cases specified the
implementation was phased. The subcategory “strategy” was referenced in every case as
well, but there appeared to be a difference of preference as to which concept was used:
19 of 41 referenced a “customer focus” strategy while 13 of 41 referenced a “knowledge
management” strategy. Also of note was the subcategory “first use”: 35 of 41 cases
were first time users of the improvement method and 6 of 41 cases indicated the
implementation was a subsequent attempt.
During the analysis for investigative question four, it was found that public-sector
agency implementations of customer-focused business practices showed a slight tendency
to include software, a strong tendency to improve existing processes, and a 100% use of a
phased method during implementation execution.
The concept frequencies showed 8 of the 14 cases which referenced software
included it in the implementation. A stronger tendency was found in the process
subcategory where 15 of 16 cases discussed improving existing processes in the
implementation of improvement techniques. The subcategory “method” was referenced
in 17 of 19 cases and each of those cases specified the implementation was phased. The
subcategory “strategy” was referenced in every case as well, but there appeared to be a
difference of preference as to which concept was used: 19 of 41 referenced a customer
focus strategy while 13 of 41 referenced a knowledge management strategy. Also of note
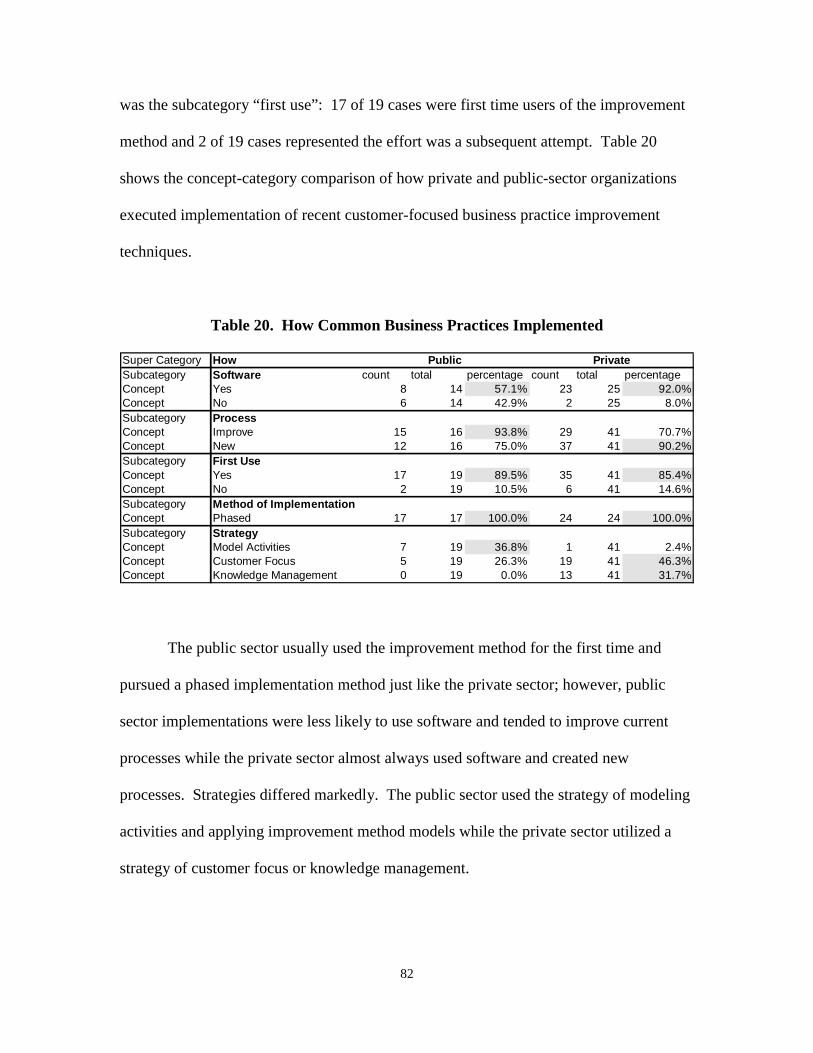
82
was the subcategory “first use”: 17 of 19 cases were first time users of the improvement
method and 2 of 19 cases represented the effort was a subsequent attempt. Table 20
shows the concept-category comparison of how private and public-sector organizations
executed implementation of recent customer-focused business practice improvement
techniques.
Table 20. How Common Business Practices Implemented
Super Category HowSubcategory Software count total percentage count total percentageConcept Yes 8 14 57.1% 23 25 92.0%Concept No 6 14 42.9% 2 25 8.0%Subcategory ProcessConcept Improve 15 16 93.8% 29 41 70.7%Concept New 12 16 75.0% 37 41 90.2%Subcategory First UseConcept Yes 17 19 89.5% 35 41 85.4%Concept No 2 19 10.5% 6 41 14.6%Subcategory Method of ImplementationConcept Phased 17 17 100.0% 24 24 100.0%Subcategory StrategyConcept Model Activities 7 19 36.8% 1 41 2.4%Concept Customer Focus 5 19 26.3% 19 41 46.3%Concept Knowledge Management 0 19 0.0% 13 41 31.7%
Public Private
The public sector usually used the improvement method for the first time and
pursued a phased implementation method just like the private sector; however, public
sector implementations were less likely to use software and tended to improve current
processes while the private sector almost always used software and created new
processes. Strategies differed markedly. The public sector used the strategy of modeling
activities and applying improvement method models while the private sector utilized a
strategy of customer focus or knowledge management.
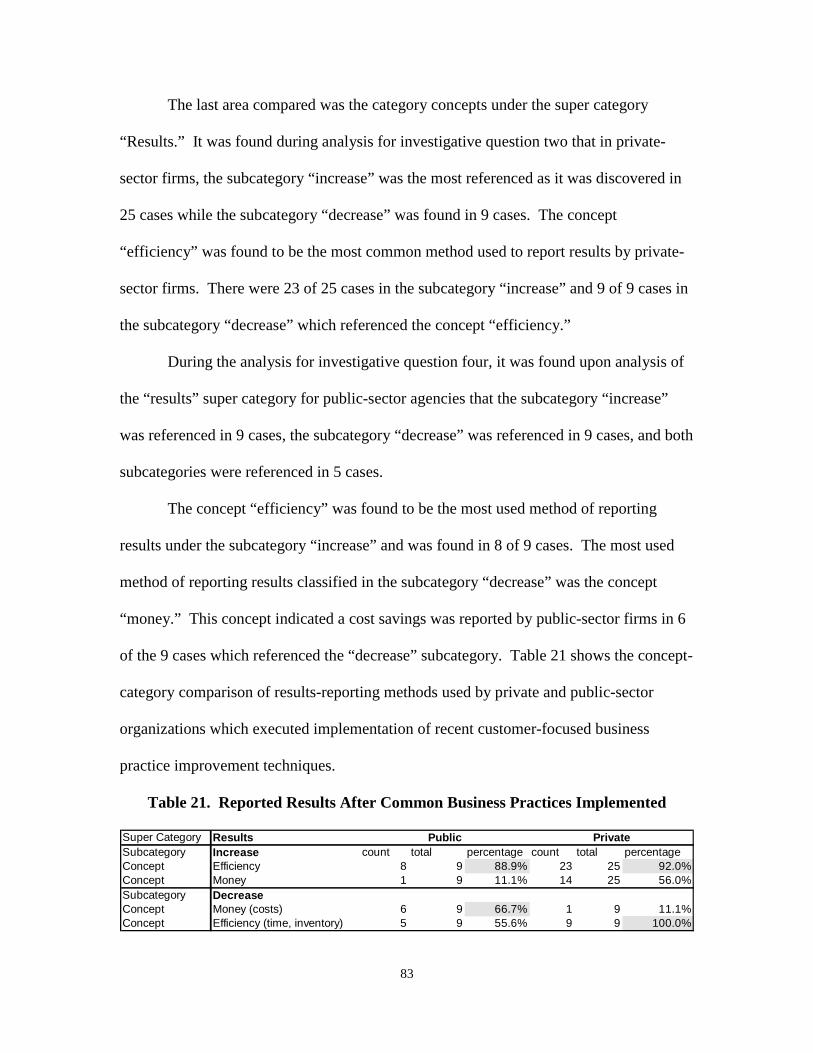
83
The last area compared was the category concepts under the super category
“Results.” It was found during analysis for investigative question two that in private-
sector firms, the subcategory “increase” was the most referenced as it was discovered in
25 cases while the subcategory “decrease” was found in 9 cases. The concept
“efficiency” was found to be the most common method used to report results by private-
sector firms. There were 23 of 25 cases in the subcategory “increase” and 9 of 9 cases in
the subcategory “decrease” which referenced the concept “efficiency.”
During the analysis for investigative question four, it was found upon analysis of
the “results” super category for public-sector agencies that the subcategory “increase”
was referenced in 9 cases, the subcategory “decrease” was referenced in 9 cases, and both
subcategories were referenced in 5 cases.
The concept “efficiency” was found to be the most used method of reporting
results under the subcategory “increase” and was found in 8 of 9 cases. The most used
method of reporting results classified in the subcategory “decrease” was the concept
“money.” This concept indicated a cost savings was reported by public-sector firms in 6
of the 9 cases which referenced the “decrease” subcategory. Table 21 shows the concept-
category comparison of results-reporting methods used by private and public-sector
organizations which executed implementation of recent customer-focused business
practice improvement techniques.
Table 21. Reported Results After Common Business Practices Implemented
Super Category ResultsSubcategory Increase count total percentage count total percentageConcept Efficiency 8 9 88.9% 23 25 92.0%Concept Money 1 9 11.1% 14 25 56.0%Subcategory DecreaseConcept Money (costs) 6 9 66.7% 1 9 11.1%Concept Efficiency (time, inventory) 5 9 55.6% 9 9 100.0%
Public Private
84
Reporting of results slightly differed in that public sector reported cost savings
and efficiency gains while the private sector almost exclusively reported efficiency gains.
Research Findings
This research sought to determine how common generalizable principles of
private-sector customer-focused business practice implementations compared to public-
sector agency implementations. The analysis results show that public sector
implementation is similar to the private sector, but differences do exist.
Analysis of the private-sector cases included in this research showed
improvement methods are implemented with a profit-based motive to increase customer
service, profit or customer retention; combine computer systems; and enable knowledge
management, product or service customization or targeted marketing. It was normally
the first try for use of the program and it was implemented with software in a phased
approach with a customer focus or knowledge management strategy. The
implementation led to creation of new processes and the results of the implementation
were almost exclusively reported as efficiency savings.
Analysis of the public-sector cases included in this research showed improvement
methods were implemented to increase customer service or cost visibility; decrease costs;
and enable service delivery, decision making, or improvement. It was normally the first
time for the program and it was implemented with or without software in a phased
approach with a strategy of modeling activities or a customer focus. The implementation
led to the improvement of processes and the results of the implementation were reported
as efficiency or cost savings.
85
It is intuitive that the private sector would adopt improvement methods to increase
profit-that is their reason for existence-and it should not be a surprise that public-sector
agencies implement to cut costs and increase service. The differences highlighted by the
comparison of reported results also are not much surprise as the private sector translates
efficiency gains as profit gains and public-sector organizations should be expected to
report whether the goals of implementation were achieved. The differences this author
believes are of interest are within the comparison of how the improvement methods were
implemented.
Summary
This chapter provided a narrative description of the analysis and results of the
research. The investigative questions were answered as well as the overall research
question. A summary of the findings was also presented. The next chapter will discuss
the limitations and findings of this research and provide the author’s recommendations
for future research brought to light by this study.
86
V. Discussion Chapter Overview
The previous chapter provided a narrative description of the analysis and results
of the research. The investigative questions were answered as well as the overall
research question. A summary of the findings was also presented. This chapter will
discuss the findings and limitations of this research, provide managerial significance and
the author’s recommendations for future research brought to light by this study.
Findings
This research evaluated a variety of documented cases of customer-focused
business practice initiatives to discern common principles of implementation within the
private and public sectors. The business practices Quality, Activity-Based Costing
(ABC), Customer Profitability Analysis (CPA), and Customer Relationship Management
(CRM) were found to be the major techniques utilized over the past three decades by
improvement-seeking organizations. Cases were collected which documented
implementations of these customer-focused business practices in the private and public
sectors. The cases were collected from various sources according to a broad-based case
selection criterion.
Using grounded theory methodology, the implementations were analyzed for
emerging concepts. The concepts were coded and categorized then grouped and tallied in
order to establish a framework of customer-focused business practice implementation
(See Figure 23).
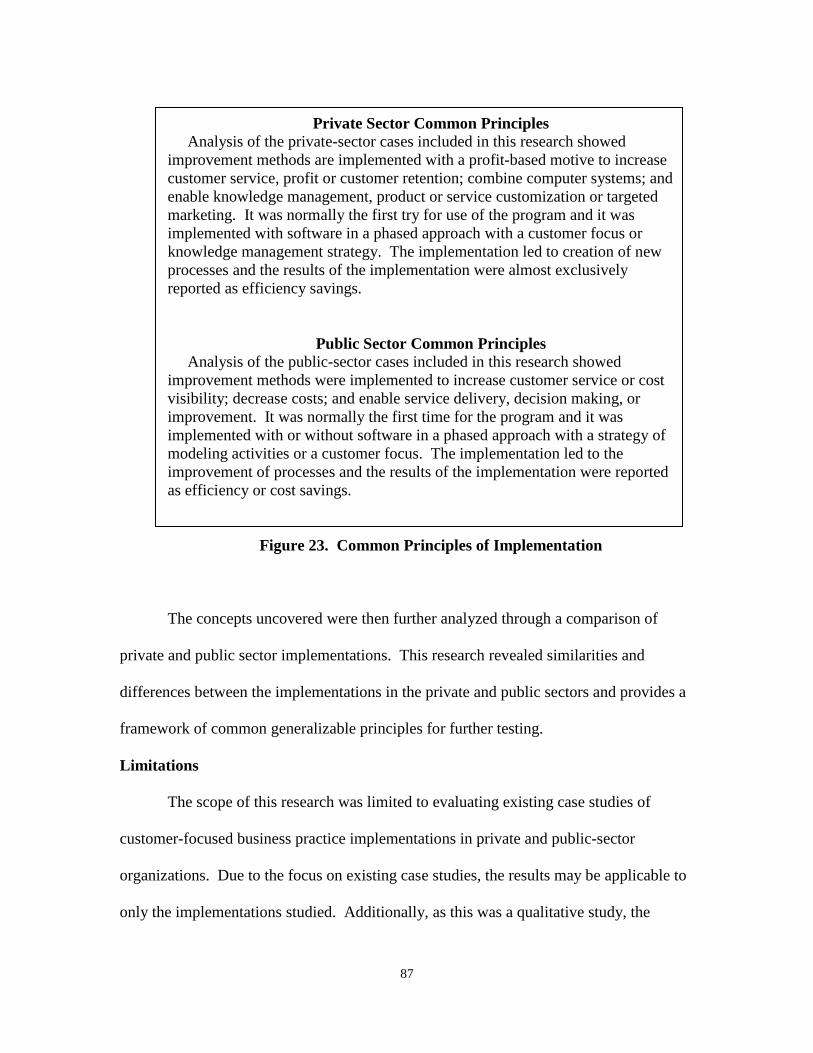
87
Private Sector Common Principles
Analysis of the private-sector cases included in this research showed improvement methods are implemented with a profit-based motive to increase customer service, profit or customer retention; combine computer systems; and enable knowledge management, product or service customization or targeted marketing. It was normally the first try for use of the program and it was implemented with software in a phased approach with a customer focus or knowledge management strategy. The implementation led to creation of new processes and the results of the implementation were almost exclusively reported as efficiency savings.
Public Sector Common Principles Analysis of the public-sector cases included in this research showed improvement methods were implemented to increase customer service or cost visibility; decrease costs; and enable service delivery, decision making, or improvement. It was normally the first time for the program and it was implemented with or without software in a phased approach with a strategy of modeling activities or a customer focus. The implementation led to the improvement of processes and the results of the implementation were reported as efficiency or cost savings.
Figure 23. Common Principles of Implementation
The concepts uncovered were then further analyzed through a comparison of
private and public sector implementations. This research revealed similarities and
differences between the implementations in the private and public sectors and provides a
framework of common generalizable principles for further testing.
Limitations
The scope of this research was limited to evaluating existing case studies of
customer-focused business practice implementations in private and public-sector
organizations. Due to the focus on existing case studies, the results may be applicable to
only the implementations studied. Additionally, as this was a qualitative study, the
88
researcher was the instrument for data collection and analysis. This introduces the aspect
of researcher bias as a limitation. This bias was recognized as a concern during the
research design phase of this study and was attempted to be minimized by the methodical
grounded theory approach used in this study. Another limitation is in the data used for
this study. The data was extracted from case studies documented by other authors and is
therefore secondary data. The cases used were not verified for factual integrity and were
assumed to be factual representations.
Managerial Significance
The concepts which emerged are of particular interest to government managers
seeking improvement in their organization. Managers can use the information discovered
in this research to increase their knowledge of a basic conceptual framework in which
implementations of customer-focused business practices were conducted.
The analysis revealed that private sector cases showed a strong tendency to
include software, create new processes, and use a phased method during implementations
of improvement techniques. The public-sector cases showed a slight tendency to include
software, a strong tendency to improve existing processes, and a phased method during
implementations of improvement techniques. The main difference between the private
and public sectors highlighted by the analysis was how processes were affected by the
implementation.
While the private sector created new processes, the public sector changed or
improved existing processes. The author believed this finding may be of significance in
determining the success or failure of improvement method implementation. At this point,
the author went back to the original cases to investigate the reported success or failure of
89
each implementation. Although this research was not aimed at discovery of factors
leading to successful implementations, it seemed at this point that at least a cursory look
was required.
The author found that some indicator of success or failure could be established 39
of the 41 private-sector cases and 17 of the 19 public-sector cases. (A cautionary note
here is the validity of such a conclusion; however, this investigation was performed to
seek out a possible relationship, not claim it as fact). In most instances, the judgment was
purely subjective; however, there was evidence in each examination to support the
ultimate classification.
In the private-sector cases, no failures could be established; 39 of 39 were
classified as successful. Of the 39 successful implementations, 37 cases showed new
processes were created. In the public-sector cases, 11 were classed as successes and 6
were labeled as failures. Of the 11 successful implementations, 8 showed new processes
were created and 11 showed processes were improved. Of the 6 failures in the public-
sector cases, there were 3 cases which showed new processes were created and 5 where
processes were improved. Is there a relationship here between process strategy and
success of implementation? This research can not claim there is or there is not. This
question will need to be answered through further research.
The next difference uncovered during the analysis was in the strategy used to
approach the implementation. The public sector uses the strategy of modeling activities
and applying improvement method models while the private sector utilizes a strategy of
customer focus or knowledge management. It may be intuitive that since the private
sector creates or first uses the improvement method and the public sector uses what the
90
private sector developed the strategies would differ. This analysis showed the strategies
do differ. The practical value of the results of this study is it provides managers seeking
to implement improvement techniques some common concepts which have emerged from
other implementations.
This author speculates there exists an "ideal" combination of the concepts
uncovered in this research which organizations need to achieve in order to experience a
successful implementation. The private sector's competitive environment fosters an
expectation that leadership will leverage every resource available to achieve the
combination of concepts which lead to success. The public sector, on the other hand,
operates in an environment where regulatory requirements restrict leadership's "field-of-
play" and therefore public-sector organizations can not achieve the same "ideal"
combination of concepts. The private sector’s environment leads to risk taking and
process creation while the public sector’s regulated environment disallows process
creation and limits implementations to “safer” process improvement. Customer-focused
business initiative implementation success is therefore hampered in the public sector due
to prescribed operating requirements which must be adhered to by organization leaders.
Recommendations for Future Research
A few topics for additional research were discovered during the analysis of results
in this study. The author’s recommendations for further research center around the
investigation of the process and strategy differences which surfaced during the course of
this research.
1. Are the common concepts of implementation discovered in this research
factors in determining the success or failure business practice implementations?
91
2. Is there a relationship between process creation or improvement and the
success of a customer-focused business practice implementation?
3. What effect does the restrictive public-sector environment have on
implementation success or failure of overlaying private-sector models?
4. Should the public sector develop unique improvement methods separate from
the private sector which are more conducive to the regulatory nature of public-
sector organizations?
Research Summary
This research evaluated a variety of documented cases of business practice
implementations to discern common principles of implementation within the private and
public sectors. It was shown that the main improvement techniques utilized over the past
three decades were Quality, ABC, CPA, and CRM. The evolution of these techniques
was traced and presented in the literature review. Cases were collected which
documented implementation of the improvement techniques in the private and public
sectors. The implementations were then analyzed for emerging concepts. The concepts
uncovered in the study were further analyzed through a comparison of private and public
sector implementations. Managers can use the information found in this research to
increase their understanding of how the implementations of the improvement methods
were conducted.
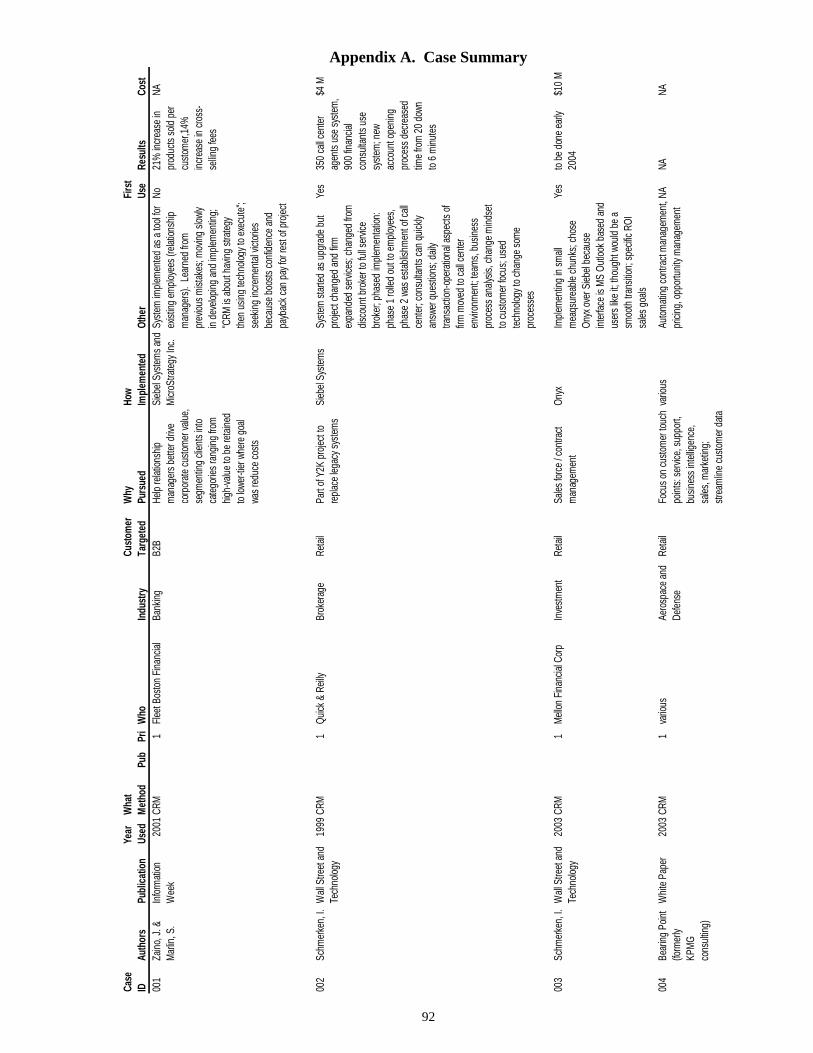
92
Appendix A. Case Summary
Case
Year
Wha
tCu
stom
erW
hyHo
w
Firs
tID
Auth
ors
Publ
icat
ion
Used
Met
hod
Pub
Pri
Who
Indu
stry
Targ
eted
Purs
ued
Impl
emen
ted
Othe
rUs
eRe
sults
Cost
001
Zain
o, J
. &
Mar
lin, S
.In
form
ation
W
eek
2001
CRM
1Fl
eet B
osto
n Fi
nanc
ialBa
nking
B2B
Help
relat
ionsh
ip
man
ager
s bet
ter d
rive
corp
orat
e cu
stom
er va
lue,
segm
entin
g cli
ents
into
ca
tego
ries
rang
ing
from
hig
h-va
lue
to b
e re
tain
ed
to lo
wer-t
ier w
here
goa
l wa
s red
uce
cost
s
Sieb
el Sy
stem
s an
d M
icroS
trate
gy In
c.Sy
stem
impl
emen
ted
as a
tool
for
exist
ing e
mpl
oyee
s (re
lation
ship
m
anag
ers)
. Le
arne
d fro
m
prev
ious m
istak
es; m
oving
slow
ly in
dev
elopi
ng a
nd im
plem
entin
g;
"CRM
is a
bout
hav
ing
strat
egy
then
usin
g te
chno
logy t
o ex
ecut
e";
seek
ing
incre
men
tal v
ictor
ies
beca
use
boos
ts co
nfid
ence
and
pa
ybac
k ca
n pa
y for
rest
of p
rojec
t
No21
% in
crea
se in
pr
oduc
ts so
ld p
er
cust
omer
,14%
in
crea
se in
cros
s-se
lling
fees
NA
002
Schm
erke
n, I.
Wall
Stre
et a
nd
Tech
nolog
y19
99CR
M1
Quick
& R
eilly
Brok
erag
eRe
tail
Part
of Y
2K p
rojec
t to
repl
ace
legac
y sys
tem
sSi
ebel
Syste
ms
Syst
em s
tarte
d as
upg
rade
but
pr
oject
chan
ged
and
firm
ex
pand
ed s
ervic
es; c
hang
ed fr
om
disc
ount
bro
ker t
o fu
ll ser
vice
brok
er; p
hase
d im
plem
enta
tion:
ph
ase
1 ro
lled
out t
o em
ploy
ees,
phas
e 2
was
esta
blish
men
t of c
all
cent
er; c
onsu
ltant
s can
qui
ckly
answ
er q
uest
ions;
dail
y tra
nsac
tion-
oper
ation
al as
pect
s of
fir
m m
oved
to c
all c
ente
r en
viron
men
t; te
ams,
bus
ines
s pr
oces
s ana
lysis,
cha
nge
min
dset
to
cus
tom
er fo
cus;
use
d te
chno
logy t
o ch
ange
som
e pr
oces
ses
Yes
350
call c
ente
r ag
ents
use
sys
tem
, 90
0 fin
ancia
l co
nsult
ants
use
sy
stem
; new
ac
coun
t ope
ning
pr
oces
s de
crea
sed
time
from
20
down
to
6 m
inute
s
$4 M
003
Schm
erke
n, I.
Wall
Stre
et a
nd
Tech
nolog
y20
03CR
M1
Mell
on F
inan
cial C
orp
Inve
stm
ent
Reta
ilSa
les fo
rce
/ con
tract
m
anag
emen
tOn
yxIm
plem
entin
g in
sm
all
mea
qsur
eable
chu
nks;
cho
se
Ony
x ove
r Sieb
el be
caus
e in
terfa
ce is
MS
Out
look
base
d an
d us
ers
like
it; th
ough
t wou
ld b
e a
smoo
th tr
ansit
ion; s
pecif
ic RO
I sa
les g
oals
Yes
to b
e do
ne e
arly
2004
$10
M
004
Bear
ing
Poin
t (fo
rmer
ly KP
MG
cons
ultin
g)
Whi
te P
aper
2003
CRM
1va
rious
Aero
spac
e an
d De
fens
eRe
tail
Focu
s on
cust
omer
touc
h po
ints
: ser
vice,
sup
port,
bu
sines
s in
tellig
ence
, sa
les, m
arke
ting;
str
eam
line
cust
omer
dat
a
vario
usAu
tom
atin
g co
ntra
ct m
anag
emen
t, pr
icing
, opp
ortu
nity m
anag
emen
tNA
NANA
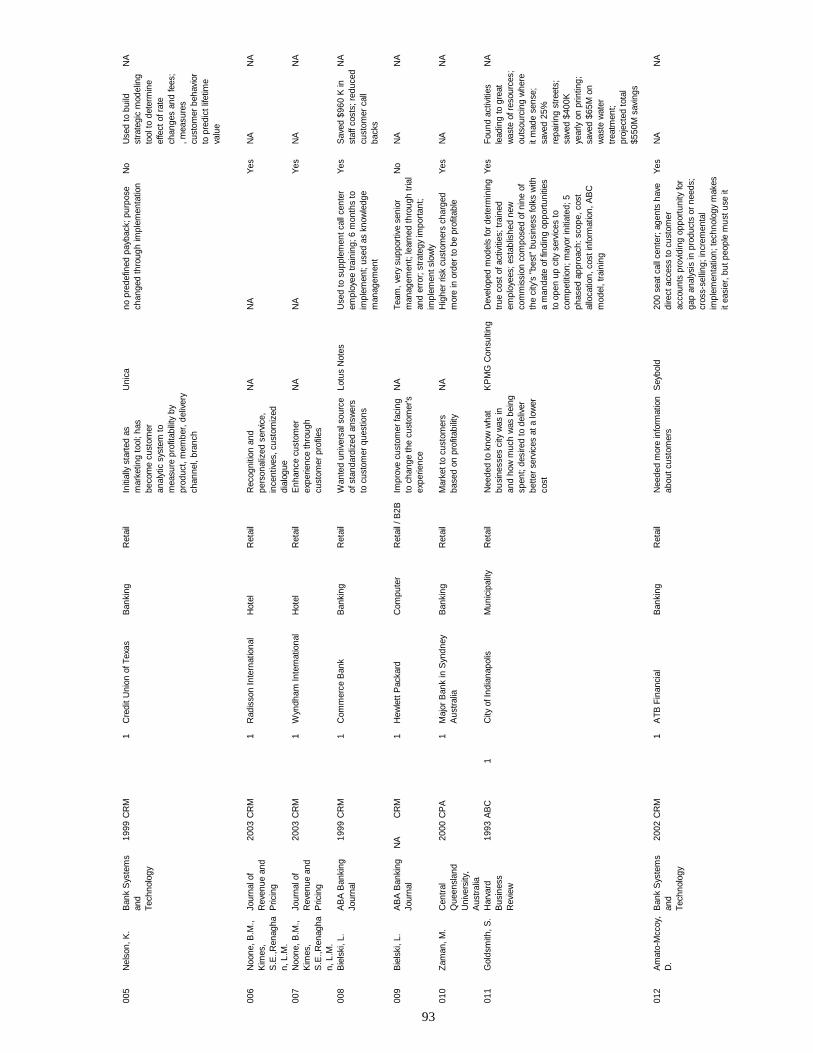
93
00
5N
elso
n, K
.B
ank
Sys
tem
s an
d Te
chno
logy
1999
CR
M1
Cre
dit U
nion
of T
exas
Ban
king
Ret
ail
Initi
ally
sta
rted
as
mar
ketin
g to
ol; h
as
beco
me
cust
omer
an
alyt
ic s
yste
m to
m
easu
re p
rofit
abili
ty b
y pr
oduc
t, m
embe
r, d
eliv
ery
chan
nel,
bran
ch
Uni
cano
pre
defin
ed p
ayba
ck; p
urpo
se
chan
ged
thro
ugh
impl
emen
tatio
nN
oU
sed
to b
uild
st
rate
gic
mod
elin
g to
ol to
det
erm
ine
effe
ct o
f rat
e ch
ange
s an
d fe
es;
, mea
sure
s cu
stom
er b
ehav
ior
to p
redi
ct li
fetim
e va
lue
NA
006
Noo
ne, B
.M.,
Kim
es,
S.E
.,Ren
agha
n, L
.M.
Jour
nal o
f R
even
ue a
nd
Pric
ing
2003
CR
M1
Rad
isso
n In
tern
atio
nal
Hot
elR
etai
lR
ecog
nitio
n an
d pe
rson
aliz
ed s
ervi
ce,
ince
ntiv
es, c
usto
miz
ed
dial
ogue
NA
NA
Yes
NA
NA
007
Noo
ne, B
.M.,
Kim
es,
S.E
.,Ren
agha
n, L
.M.
Jour
nal o
f R
even
ue a
nd
Pric
ing
2003
CR
M1
Wyn
dham
Inte
rnat
iona
lH
otel
Ret
ail
Enh
ance
cus
tom
er
expe
rienc
e th
roug
h cu
stom
er p
rofil
es
NA
NA
Yes
NA
NA
008
Bie
lski
, L.
AB
A B
anki
ng
Jour
nal
1999
CR
M1
Com
mer
ce B
ank
Ban
king
Ret
ail
Wan
ted
univ
ersa
l sou
rce
of s
tand
ardi
zed
answ
ers
to c
usto
mer
que
stio
ns
Lotu
s N
otes
Use
d to
sup
plem
ent c
all c
ente
r em
ploy
ee tr
aini
ng; 6
mon
ths
to
impl
emen
t; us
ed a
s kn
owle
dge
man
agem
ent
Yes
Sav
ed $
960
K in
st
aff c
osts
; red
uced
cu
stom
er c
all
back
s
NA
009
Bie
lski
, L.
AB
A B
anki
ng
Jour
nal
NA
CR
M1
Hew
lett
Pac
kard
Com
pute
rR
etai
l / B
2BIm
prov
e cu
stom
er fa
cing
to
cha
nge
the
cust
omer
's
expe
rienc
e
NA
Team
, ver
y su
ppor
tive
seni
or
man
agem
ent;
lear
ned
thro
ugh
tria
l an
d er
ror;
str
ateg
y im
port
ant;
impl
emen
t slo
wly
No
NA
NA
010
Zam
an, M
.C
entr
al
Que
ensl
and
Uni
vers
ity,
Aus
tral
ia
2000
CP
A1
Maj
or B
ank
in S
yndn
ey
Aus
tral
iaB
anki
ngR
etai
lM
arke
t to
cust
omer
s ba
sed
on p
rofit
abili
tyN
AH
ighe
r ris
k cu
stom
ers
char
ged
mor
e in
ord
er to
be
prof
itabl
eY
esN
AN
A
011
Gol
dsm
ith, S
.H
arva
rd
Bus
ines
s R
evie
w
1993
AB
C1
City
of I
ndia
napo
lisM
unic
ipal
ityR
etai
lN
eede
d to
kno
w w
hat
busi
ness
es c
ity w
as in
an
d ho
w m
uch
was
bei
ng
spen
t; de
sire
d to
del
iver
be
tter
serv
ices
at a
low
er
cost
KP
MG
Con
sulti
ngD
evel
oped
mod
els
for
dete
rmin
ing
true
cos
t of a
ctiv
ities
; tra
ined
em
ploy
ees;
est
ablis
hed
new
co
mm
issi
on c
ompo
sed
of n
ine
of
the
city
's "
best
" bu
sine
ss fo
lks
with
a
man
date
of f
indi
ng o
ppor
tuni
ties
to o
pen
up c
ity s
ervi
ces
to
com
petit
ion;
may
or in
itiat
ed; 5
ph
ased
app
roac
h: s
cope
, cos
t al
loca
tion,
cos
t inf
orm
atio
n, A
BC
m
odel
, tra
inin
g
Yes
Fou
nd a
ctiv
ities
le
adin
g to
gre
at
was
te o
f res
ourc
es;
outs
ourc
ing
whe
re
it m
ade
sens
e;
save
d 25
%
repa
iring
str
eets
; sa
ved
$400
K
year
ly o
n pr
intin
g;
save
d $6
5M o
n w
aste
wat
er
trea
tmen
t; pr
ojec
ted
tota
l $5
50M
sav
ings
NA
012
Am
ato-
Mcc
oy,
D.
Ban
k S
yste
ms
and
Tech
nolo
gy
2002
CR
M1
ATB
Fin
anci
alB
anki
ngR
etai
lN
eede
d m
ore
info
rmat
ion
abou
t cus
tom
ers
Sey
bold
200
seat
cal
l cen
ter;
age
nts
have
di
rect
acc
ess
to c
usto
mer
ac
coun
ts p
rovi
ding
opp
ortu
nity
for
gap
anal
ysis
in p
rodu
cts
or n
eeds
; cr
oss-
selli
ng; i
ncre
men
tal
impl
emen
tatio
n; te
chno
logy
mak
es
it ea
sier
, but
peo
ple
mus
t use
it
Yes
NA
NA
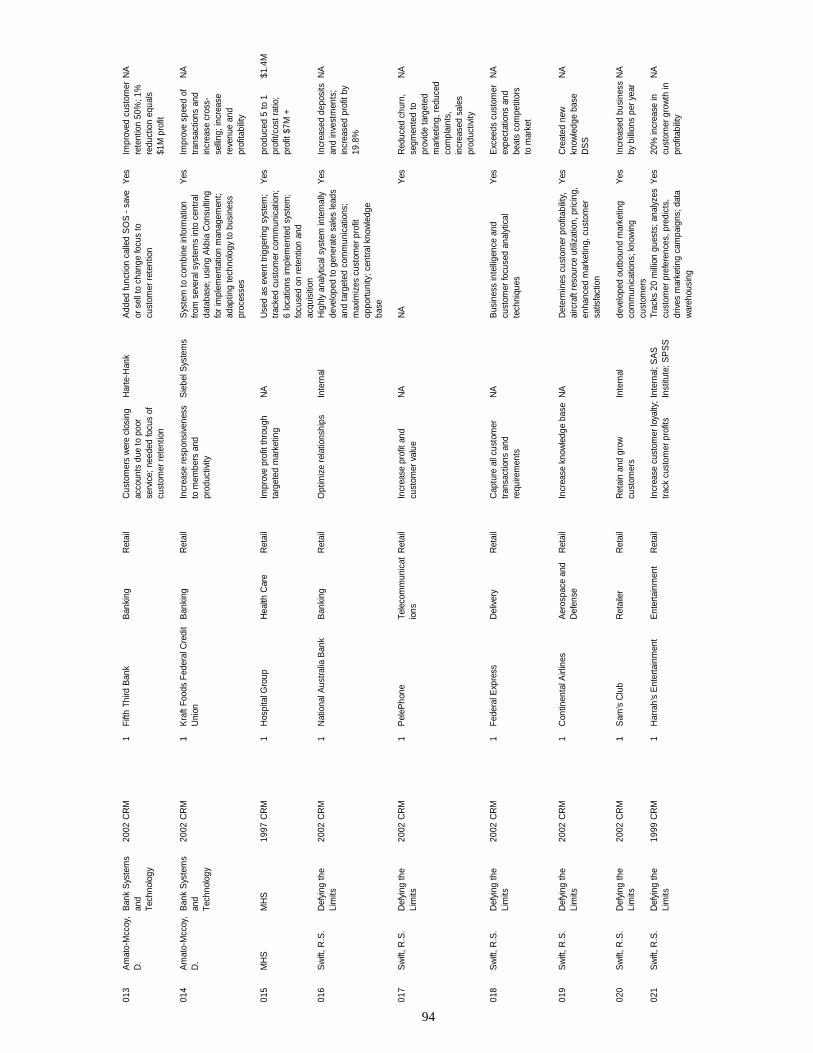
94
01
3A
mat
o-M
ccoy
, D
.B
ank
Sys
tem
s an
d Te
chno
logy
2002
CR
M1
Fifth
Thi
rd B
ank
Ban
king
Ret
ail
Cus
tom
ers
wer
e cl
osin
g ac
coun
ts d
ue to
poo
r se
rvic
e; n
eede
d fo
cus
of
cust
omer
rete
ntio
n
Har
te-H
ank
Add
ed fu
nctio
n ca
lled
SO
S -
save
or
sel
l to
chan
ge fo
cus
to
cust
omer
rete
ntio
n
Yes
Impr
oved
cus
tom
er
rete
ntio
n 50
%; 1
%
redu
ctio
n eq
uals
$1
M p
rofit
NA
014
Am
ato-
Mcc
oy,
D.
Ban
k S
yste
ms
and
Tech
nolo
gy
2002
CR
M1
Kra
ft Fo
ods
Fede
ral C
redi
t U
nion
Ban
king
Ret
ail
Incr
ease
resp
onsi
vene
ss
to m
embe
rs a
nd
prod
uctiv
ity
Sie
bel S
yste
ms
Sys
tem
to c
ombi
ne in
form
atio
n fro
m s
ever
al s
yste
ms
into
cen
tral
data
base
; usi
ng A
kbia
Con
sulti
ng
for i
mpl
emen
tatio
n m
anag
emen
t; ad
aptin
g te
chno
logy
to b
usin
ess
proc
esse
s
Yes
Impr
ove
spee
d of
tra
nsac
tions
and
in
crea
se c
ross
-se
lling
; inc
reas
e re
venu
e an
d pr
ofita
bilit
y
NA
015
MH
SM
HS
1997
CR
M1
Hos
pita
l Gro
upH
ealth
Car
eR
etai
lIm
prov
e pr
ofit
thro
ugh
targ
eted
mar
ketin
gN
AU
sed
as e
vent
trig
gerin
g sy
stem
; tra
cked
cus
tom
er c
omm
unic
atio
n;
6 lo
catio
ns im
plem
ente
d sy
stem
; fo
cuse
d on
rete
ntio
n an
d ac
quis
ition
Yes
prod
uced
5 to
1
prof
it/co
st ra
tio;
prof
it $7
M +
$1.4
M
016
Sw
ift, R
.S.
Def
ying
the
Lim
its20
02C
RM
1N
atio
nal A
ustra
lia B
ank
Ban
king
Ret
ail
Opt
imiz
e re
latio
nshi
psIn
tern
alH
ighl
y an
alyt
ical
sys
tem
inte
rnal
ly
deve
lope
d to
gen
erat
e sa
les
lead
s an
d ta
rget
ed c
omm
unic
atio
ns;
max
imiz
es c
usto
mer
pro
fit
oppo
rtuni
ty; c
entra
l kno
wle
dge
base
Yes
Incr
ease
d de
posi
ts
and
inve
stm
ents
; in
crea
sed
prof
it by
19
.8%
NA
017
Sw
ift, R
.S.
Def
ying
the
Lim
its20
02C
RM
1P
eleP
hone
Tele
com
mun
icat
ions
Ret
ail
Incr
ease
pro
fit a
nd
cust
omer
val
ueN
AN
AY
esR
educ
ed c
hurn
, se
gmen
ted
to
prov
ide
targ
eted
m
arke
ting,
redu
ced
com
plai
nts,
in
crea
sed
sale
s pr
oduc
tivity
NA
018
Sw
ift, R
.S.
Def
ying
the
Lim
its20
02C
RM
1Fe
dera
l Exp
ress
Del
iver
yR
etai
lC
aptu
re a
ll cu
stom
er
trans
actio
ns a
nd
requ
irem
ents
NA
Bus
ines
s in
telli
genc
e an
d cu
stom
er fo
cuse
d an
alyt
ical
te
chni
ques
Yes
Exc
eeds
cus
tom
er
expe
ctat
ions
and
be
ats
com
petit
ors
to m
arke
t
NA
019
Sw
ift, R
.S.
Def
ying
the
Lim
its20
02C
RM
1C
ontin
enta
l Airl
ines
Aer
ospa
ce a
nd
Def
ense
Ret
ail
Incr
ease
kno
wle
dge
base
NA
Det
erm
ines
cus
tom
er p
rofit
abili
ty,
airc
raft
reso
urce
util
izat
ion,
pric
ing,
en
hanc
ed m
arke
ting,
cus
tom
er
satis
fact
ion
Yes
Cre
ated
new
kn
owle
dge
base
D
SS
NA
020
Sw
ift, R
.S.
Def
ying
the
Lim
its20
02C
RM
1S
am's
Clu
bR
etai
ler
Ret
ail
Ret
ain
and
grow
cu
stom
ers
Inte
rnal
deve
lope
d ou
tbou
nd m
arke
ting
com
mun
icat
ions
; kno
win
g cu
stom
ers
Yes
Incr
ease
d bu
sine
ss
by b
illio
ns p
er y
ear
NA
021
Sw
ift, R
.S.
Def
ying
the
Lim
its19
99C
RM
1H
arra
h's
Ent
erta
inm
ent
Ent
erta
inm
ent
Ret
ail
Incr
ease
cus
tom
er lo
yalty
; tra
ck c
usto
mer
pro
fits
Inte
rnal
; SA
S
Inst
itute
; SP
SS
Trac
ks 2
0 m
illio
n gu
ests
; ana
lyze
s cu
stom
er p
refe
renc
es, p
redi
cts,
dr
ives
mar
ketin
g ca
mpa
igns
; dat
a w
areh
ousi
ng
Yes
20%
incr
ease
in
cust
omer
gro
wth
in
prof
itabi
lity
NA
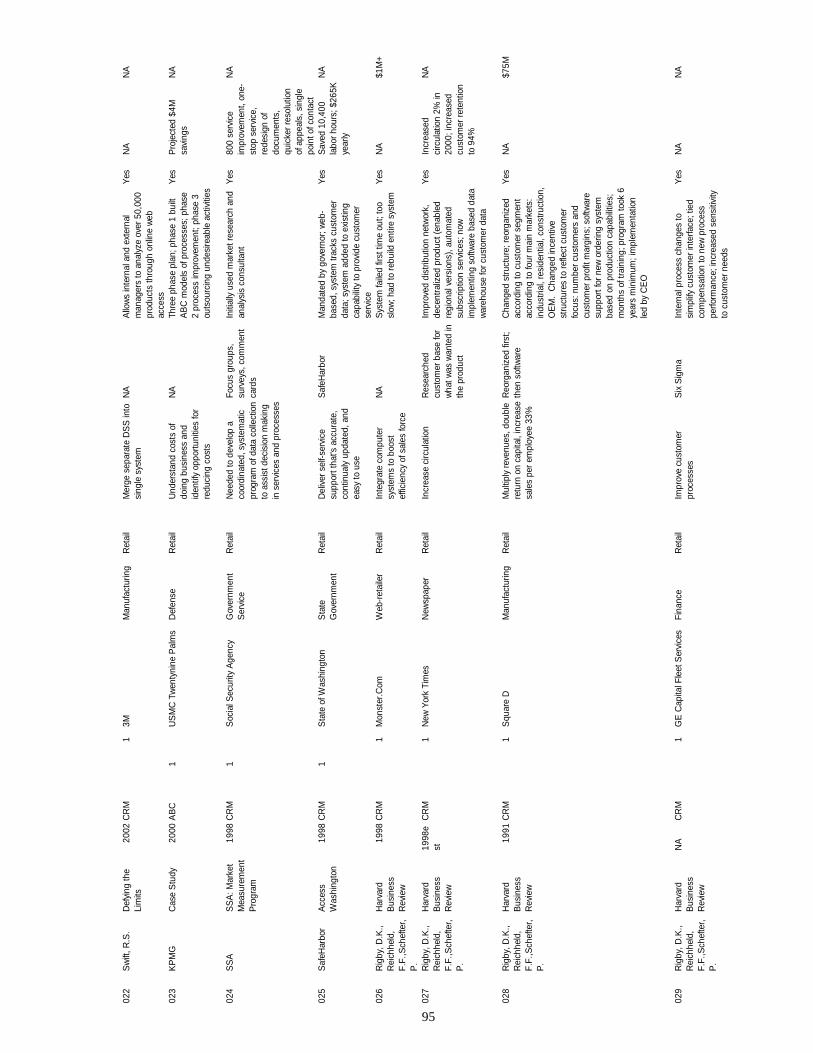
95
02
2S
wift
, R.S
.D
efyi
ng th
e Li
mits
2002
CR
M1
3MM
anuf
actu
ring
Ret
ail
Mer
ge s
epar
ate
DS
S in
to
sing
le s
yste
mN
AA
llow
s in
tern
al a
nd e
xter
nal
man
ager
s to
ana
lyze
ove
r 50,
000
prod
ucts
thro
ugh
onlin
e w
eb
acce
ss
Yes
NA
NA
023
KP
MG
Cas
e S
tudy
2000
AB
C1
US
MC
Tw
enty
nine
Pal
ms
Def
ense
Ret
ail
Und
erst
and
cost
s of
do
ing
busi
ness
and
id
entif
y op
portu
nitie
s fo
r re
duci
ng c
osts
NA
Thre
e ph
ase
plan
; pha
se 1
bui
lt A
BC
mod
els
of p
roce
sses
; pha
se
2 pr
oces
s im
prov
emen
t; ph
ase
3 ou
tsou
rcin
g un
desi
reab
le a
ctiv
ities
Yes
Pro
ject
ed $
4M
savi
ngs
NA
024
SS
AS
SA
: Mar
ket
Mea
sure
men
t P
rogr
am
1998
CR
M1
Soc
ial S
ecur
ity A
genc
yG
over
nmen
t S
ervi
ceR
etai
lN
eede
d to
dev
elop
a
coor
dina
ted,
sys
tem
atic
pr
ogra
m o
f dat
a co
llect
ion
to a
ssis
t dec
isio
n m
akin
g in
ser
vice
s an
d pr
oces
ses
Focu
s gr
oups
, su
rvey
s, c
omm
ent
card
s
Initi
ally
use
d m
arke
t res
earc
h an
d an
alys
is c
onsu
ltant
Yes
800
serv
ice
impr
ovem
ent,
one-
stop
ser
vice
, re
desi
gn o
f do
cum
ents
, qu
icke
r res
olut
ion
of a
ppea
ls, s
ingl
e po
int o
f con
tact
NA
025
Saf
eHar
bor
Acc
ess
Was
hing
ton
1998
CR
M1
Sta
te o
f Was
hing
ton
Sta
te
Gov
ernm
ent
Ret
ail
Del
iver
sel
f-ser
vice
su
ppor
t tha
t's a
ccur
ate,
co
ntin
ualy
upd
ated
, and
ea
sy to
use
Saf
eHar
bor
Man
date
d by
gov
erno
r; w
eb-
base
d, s
yste
m tr
acks
cus
tom
er
data
; sys
tem
add
ed to
exi
stin
g ca
pabi
lity
to p
rovi
de c
usto
mer
se
rvic
e
Yes
Sav
ed 1
0,40
0 la
bor h
ours
; $26
5K
year
ly
NA
026
Rig
by, D
.K.,
Rei
chhe
ld,
F.F.
,Sch
efte
r, P
.
Har
vard
B
usin
ess
Rev
iew
1998
CR
M1
Mon
ster
.Com
Web
-ret
aile
rR
etai
lIn
tegr
ate
com
pute
r sy
stem
s to
boo
st
effic
ienc
y of
sal
es fo
rce
NA
Sys
tem
faile
d fir
st ti
me
out;
too
slow
; had
to re
build
ent
ire s
yste
mY
esN
A$1
M+
027
Rig
by, D
.K.,
Rei
chhe
ld,
F.F.
,Sch
efte
r, P
.
Har
vard
B
usin
ess
Rev
iew
1998
est
CR
M1
New
Yor
k Ti
mes
New
spap
erR
etai
lIn
crea
se c
ircul
atio
nR
esea
rche
d cu
stom
er b
ase
for
wha
t was
wan
ted
in
the
prod
uct
Impr
oved
dis
tribu
tion
netw
ork,
de
cent
raliz
ed p
rodu
ct (e
nabl
ed
regi
onal
ver
sion
s), a
utom
ated
su
bscr
iptio
n se
rvic
es; n
ow
impl
emen
ting
softw
are
base
d da
ta
war
ehou
se fo
r cus
tom
er d
ata
Yes
Incr
ease
d ci
rcul
atio
n 2%
in
2000
; inc
reas
ed
cust
omer
rete
ntio
n to
94%
NA
028
Rig
by, D
.K.,
Rei
chhe
ld,
F.F.
,Sch
efte
r, P
.
Har
vard
B
usin
ess
Rev
iew
1991
CR
M1
Squ
are
DM
anuf
actu
ring
Ret
ail
Mul
tiply
reve
nues
, dou
ble
retu
rn o
n ca
pita
l, in
crea
se
sale
s pe
r em
ploy
ee 3
3%
Reo
rgan
ized
firs
t; th
en s
oftw
are
Cha
nged
stru
ctur
e; re
orga
nize
d ac
cord
ing
to c
usto
mer
seg
men
t ac
cord
ing
to fo
ur m
ain
mar
kets
: in
dust
rial,
resi
dent
ial,
cons
truct
ion,
O
EM
. C
hang
ed in
cent
ive
stru
ctur
es to
refle
ct c
usto
mer
fo
cus:
num
ber c
usto
mer
s an
d cu
stom
er p
rofit
mar
gins
; sof
twar
e su
ppor
t for
new
ord
erin
g sy
stem
ba
sed
on p
rodu
ctio
n ca
pabi
litie
s;
mon
ths
of tr
aini
ng; p
rogr
am to
ok 6
ye
ars
min
imum
; im
plem
enta
tion
led
by C
EO
Yes
NA
$75M
029
Rig
by, D
.K.,
Rei
chhe
ld,
F.F.
,Sch
efte
r, P
.
Har
vard
B
usin
ess
Rev
iew
NA
CR
M1
GE
Cap
ital F
leet
Ser
vice
sFi
nanc
eR
etai
lIm
prov
e cu
stom
er
proc
esse
sS
ix S
igm
aIn
tern
al p
roce
ss c
hang
es to
si
mpl
ify c
usto
mer
inte
rface
; tie
d co
mpe
nsat
ion
to n
ew p
roce
ss
perfo
rman
ce; i
ncre
ased
sen
sitiv
ity
to c
usto
mer
nee
ds
Yes
NA
NA
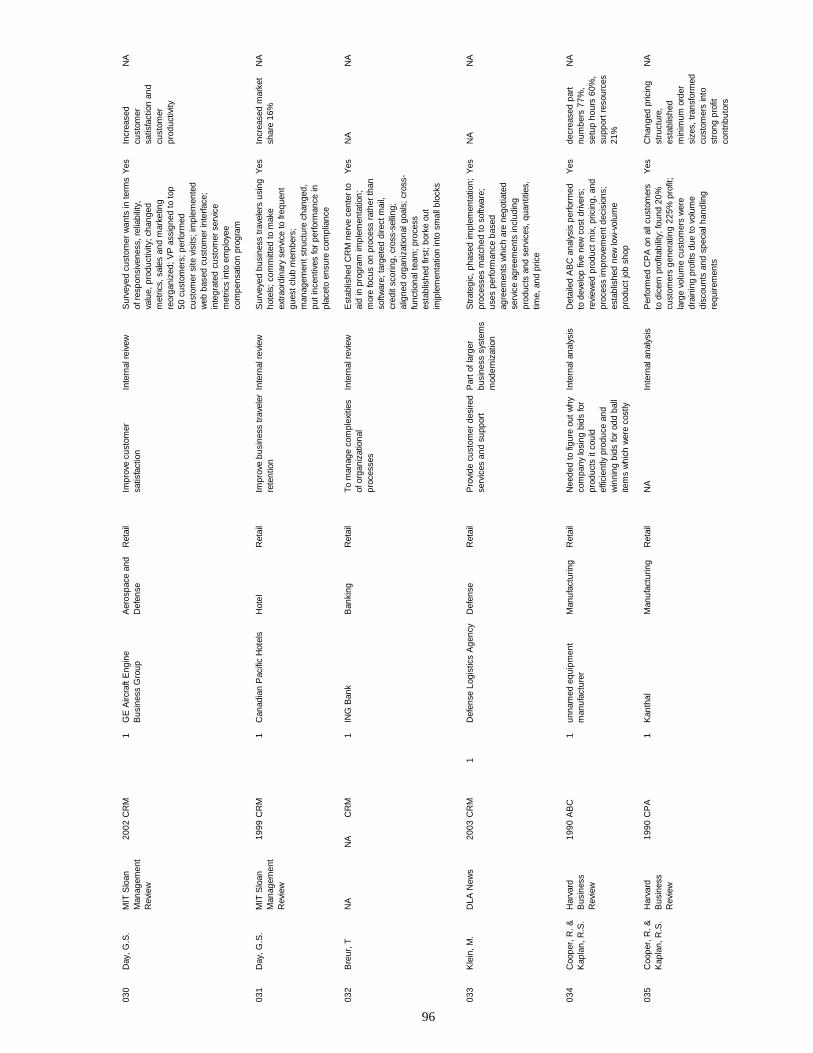
96
03
0D
ay, G
.S.
MIT
Slo
an
Man
agem
ent
Rev
iew
2002
CR
M1
GE
Airc
raft
Eng
ine
Bus
ines
s G
roup
Aer
ospa
ce a
nd
Def
ense
Ret
ail
Impr
ove
cust
omer
sa
tisfa
ctio
nIn
tern
al re
ivew
Sur
veye
d cu
stom
er w
ants
in te
rms
of r
espo
nsiv
enes
s, re
liabi
lity,
va
lue,
pro
duct
ivity
; cha
nged
m
etric
s, s
ales
and
mar
ketin
g re
orga
nize
d; V
P a
ssig
ned
to to
p 50
cus
tom
ers;
per
form
ed
cust
omer
site
vis
its; i
mpl
emen
ted
web
bas
ed c
usto
mer
inte
rface
; in
tegr
ated
cus
tom
er s
ervi
ce
met
rics
into
em
ploy
ee
com
pens
atio
n pr
ogra
m
Yes
Incr
ease
d cu
stom
er
satis
fact
ion
and
cust
omer
pr
oduc
tivity
NA
031
Day
, G.S
.M
IT S
loan
M
anag
emen
t R
evie
w
1999
CR
M1
Can
adia
n P
acifi
c H
otel
sH
otel
Ret
ail
Impr
ove
busi
ness
trav
eler
re
tent
ion
Inte
rnal
revi
ewS
urve
yed
busi
ness
trav
eler
s us
ing
hote
ls; c
omm
itted
to m
ake
extr
aord
inar
y se
rvic
e to
freq
uent
gu
est c
lub
mem
bers
; m
anag
emen
t str
uctu
re c
hang
ed,
put i
ncen
tives
for
perfo
rman
ce in
pl
acet
o en
sure
com
plia
nce
Yes
Incr
ease
d m
arke
t sh
are
16%
NA
032
Bre
ur, T
NA
NA
CR
M1
ING
Ban
kB
anki
ngR
etai
lTo
man
age
com
plex
ities
of
org
aniz
atio
nal
proc
esse
s
Inte
rnal
revi
ewE
stab
lishe
d C
RM
ner
ve c
ente
r to
ai
d in
pro
gram
impl
emen
tatio
n;
mor
e fo
cus
on p
roce
ss r
athe
r th
an
softw
are;
targ
eted
dire
ct m
ail,
cred
it sc
orin
g, c
ross
-sel
ling;
al
igne
d or
gani
zatio
nal g
oals
; cro
ss-
func
tiona
l tea
m; p
roce
ss
esta
blis
hed
first
; bor
ke o
ut
imjp
lem
enta
tion
into
sm
all b
lock
s
Yes
NA
NA
033
Kle
in, M
.D
LA N
ews
2003
CR
M1
Def
ense
Log
istic
s A
genc
yD
efen
seR
etai
lP
rovi
de c
usto
mer
des
ired
serv
ices
and
sup
port
Par
t of l
arge
r bu
sine
ss s
yste
ms
mod
erni
zatio
n
Str
ateg
ic, p
hase
d im
plem
enta
tion;
pr
oces
ses
mat
ched
to s
oftw
are;
us
es p
erfo
rman
ce b
ased
ag
reem
ents
whi
ch a
re n
egot
iate
d se
rvic
e ag
reem
ents
incl
udin
g pr
oduc
ts a
nd s
ervi
ces,
qua
ntiti
es,
time,
and
pric
e
Yes
NA
NA
034
Coo
per,
R. &
K
apla
n, R
.S.
Har
vard
B
usin
ess
Rev
iew
1990
AB
C1
unna
med
equ
ipm
ent
man
ufac
ture
rM
anuf
actu
ring
Ret
ail
Nee
ded
to fi
gure
out
why
co
mpa
ny lo
sing
bid
s fo
r pr
oduc
ts it
cou
ld
effic
ient
ly p
rodu
ce a
nd
win
ning
bid
s fo
r od
d ba
ll ite
ms
whi
ch w
ere
cost
ly
Inte
rnal
ana
lysi
sD
etai
led
AB
C a
naly
sis
perfo
rmed
to
dev
elop
five
new
cos
t driv
ers;
re
view
ed p
rodu
ct m
ix, p
ricin
g, a
nd
proc
ess
impr
ovem
ent d
ecis
ions
; es
tabl
ishe
d ne
w lo
w-v
olum
e pr
oduc
t job
sho
p
Yes
decr
ease
d pa
rt
num
bers
77%
, se
tup
hour
s 60
%,
supp
ort r
esou
rces
21
%
NA
035
Coo
per,
R. &
K
apla
n, R
.S.
Har
vard
B
usin
ess
Rev
iew
1990
CP
A1
Kan
thal
Man
ufac
turin
gR
etai
lN
AIn
tern
al a
naly
sis
Per
form
ed C
PA
on
all c
usto
mer
s to
dic
ern
prof
itabi
lity;
foun
d 20
%
cust
omer
s ge
nera
ting
225%
pro
fit;
larg
e vo
lum
e cu
stom
ers
wer
e dr
aini
ng p
rofit
s du
e to
vol
ume
disc
ount
s an
d sp
ecia
l han
dlin
g re
quire
men
ts
Yes
Cha
nged
pric
ing
stru
ctur
e,
esta
blis
hed
min
imum
ord
er
size
s, tr
ansf
orm
ed
cust
omer
s in
to
stro
ng p
rofit
co
ntrib
utor
s
NA
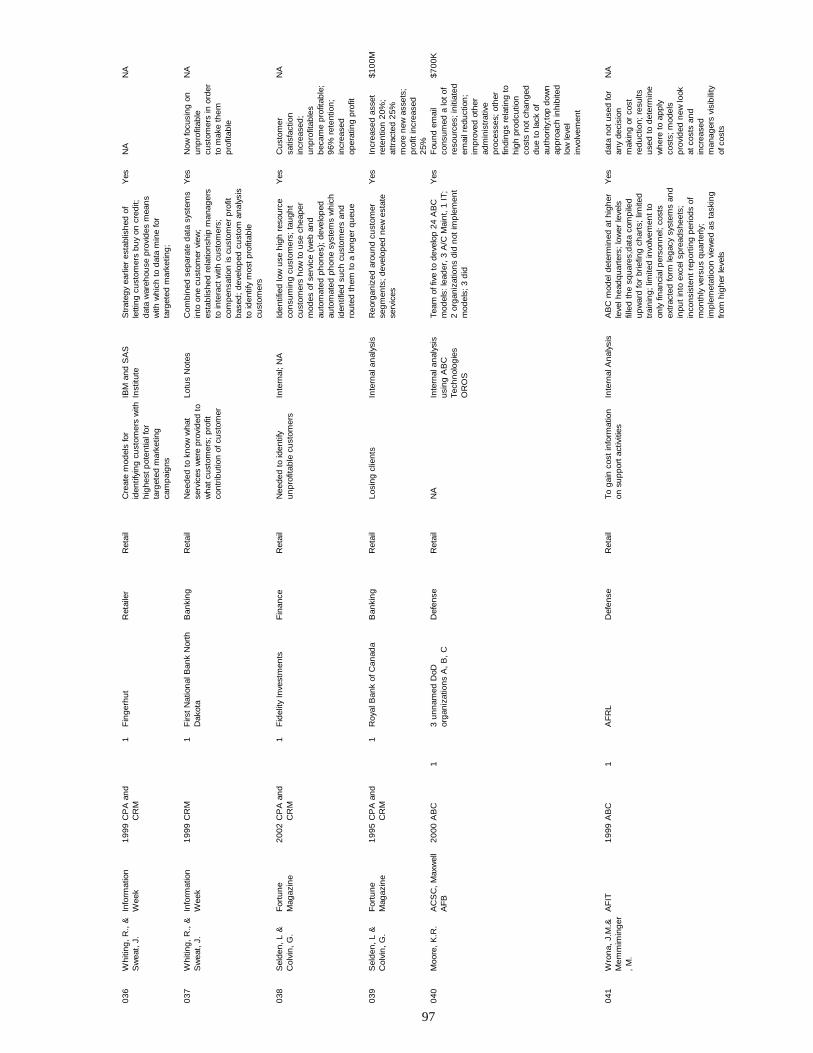
97
03
6W
hiti
ng
, R
., &
S
wea
t, J
.In
form
atio
n
Wee
k1
99
9C
PA
an
d
CR
M1
Fin
ger
hu
tR
etai
ler
Ret
ail
Cre
ate
mod
els
for
iden
tifyi
ng
cu
stom
ers
with
h
igh
est
pot
entia
l for
ta
rget
ed m
arke
ting
ca
mp
aig
ns
IBM
an
d S
AS
In
stitu
teS
trat
egy
earli
er e
stab
lish
ed o
f le
ttin
g c
ust
omer
s b
uy
on c
red
it;
dat
a w
areh
ouse
pro
vid
es m
ean
s w
ith w
hic
h t
o d
ata
min
e fo
r ta
rget
ed m
arke
ting
;
Yes
NA
NA
03
7W
hiti
ng
, R
., &
S
wea
t, J
.In
form
atio
n
Wee
k1
99
9C
RM
1F
irst
Nat
ion
al B
ank
Nor
th
Dak
ota
Ban
kin
gR
etai
lN
eed
ed t
o kn
ow w
hat
se
rvic
es w
ere
pro
vid
ed t
o w
hat
cu
stom
ers;
pro
fit
con
trib
utio
n o
f cu
stom
er
Lot
us
Not
esC
omb
ined
sep
arat
e d
ata
syst
ems
into
on
e cu
stom
er v
iew
; es
tab
lish
ed r
elat
ion
ship
man
ager
s to
inte
ract
with
cu
stom
ers;
co
mp
ensa
tion
is c
ust
omer
pro
fit
bas
ed;
dev
elop
ed c
ust
om a
nal
ysis
to
iden
tify
mos
t p
rofit
able
cu
stom
ers
Yes
Now
focu
sin
g o
n
un
pro
fitab
le
cust
omer
s in
ord
er
to m
ake
them
p
rofit
able
NA
03
8S
eld
en,
L &
C
olvi
n,
G.
For
tun
e M
agaz
ine
20
02
CP
A a
nd
C
RM
1F
idel
ity I
nve
stm
ents
Fin
ance
Ret
ail
Nee
ded
to
iden
tify
un
pro
fitab
le c
ust
omer
sIn
tern
al;
NA
Iden
tifie
d lo
w u
se h
igh
res
ourc
e co
nsu
min
g c
ust
omer
s; t
aug
ht
cust
omer
s h
ow t
o u
se c
hea
per
m
odes
of s
ervi
ce (
web
an
d
auto
mat
ed p
hon
es);
dev
elop
ed
auto
mat
ed p
hon
e sy
stem
s w
hic
h
iden
tifie
d s
uch
cu
stom
ers
and
ro
ute
d t
hem
to
a lo
ng
er q
ueu
e
Yes
Cu
stom
er
satis
fact
ion
in
crea
sed
; u
np
rofit
able
s b
ecam
e p
rofit
able
; 9
6%
ret
entio
n;
incr
ease
d
oper
atin
g p
rofit
NA
03
9S
eld
en,
L &
C
olvi
n,
G.
For
tun
e M
agaz
ine
19
95
CP
A a
nd
C
RM
1R
oyal
Ban
k of
Can
ada
Ban
kin
gR
etai
lL
osin
g c
lien
tsIn
tern
al a
nal
ysis
Reo
rgan
ized
aro
un
d c
ust
omer
se
gm
ents
; d
evel
oped
new
est
ate
serv
ices
Yes
Incr
ease
d a
sset
re
ten
tion
20
%;
attr
acte
d 2
5%
m
ore
new
ass
ets;
p
rofit
incr
ease
d
25
%
$1
00
M
04
0M
oore
, K
.R.
AC
SC
, M
axw
ell
AF
B2
00
0A
BC
13
un
nam
ed D
oD
org
aniz
atio
ns
A,
B,
CD
efen
seR
etai
lN
AIn
tern
al a
nal
ysis
u
sin
g A
BC
T
ech
nol
ogie
s O
RO
S
Tea
m o
f fiv
e to
dev
elop
24
AB
C
mod
els:
lead
er,
3 A
/C M
ain
t, 1
IT
; 2
org
aniz
atio
ns
did
not
imp
lem
ent
mod
els;
3 d
id
Yes
Fou
nd
em
ail
con
sum
ed a
lot
of
reso
urc
es;
initi
ated
em
ail r
edu
ctio
n;
imp
rove
d o
ther
ad
min
istr
ativ
e p
roce
sses
; ot
her
fin
din
gs
rela
ting
to
hig
h p
rod
cutio
n
cost
s n
ot c
han
ged
d
ue
to la
ck o
f au
thor
ity;t
op d
own
ap
pro
ach
inh
ibite
d
low
leve
l in
volv
emen
t
$7
00
K
04
1W
ron
a, J
.M.&
M
emm
imin
ger
, M
.
AF
IT1
99
9A
BC
1A
FR
LD
efen
seR
etai
lT
o g
ain
cos
t in
form
atio
n
on s
up
por
t ac
tiviti
esIn
tern
al A
nal
ysis
AB
C m
odel
det
erm
ined
at
hig
her
le
vel h
ead
qu
arte
rs;
low
er le
vels
fil
led
th
e sq
uar
es;d
ata
com
pile
d
up
war
d fo
r b
riefin
g c
har
ts;
limite
d
trai
nin
g;
limite
d in
volv
emen
t to
on
ly fi
nan
cial
per
son
nel
; co
sts
extr
acte
d fo
rm le
gac
y sy
stem
s an
d
inp
ut
into
exc
el s
pre
adsh
eets
; in
con
sist
ent
rep
ortin
g p
erio
ds
of
mon
thly
ver
sus
qu
arte
rly;
imp
lem
etat
ioon
vie
wed
as
task
ing
fr
om h
igh
er le
vels
Yes
dat
a n
ot u
sed
for
any
dec
isio
n
mak
ing
or
cost
re
du
ctio
n;
resu
lts
use
d t
o d
eter
min
e w
her
e to
ap
ply
co
sts;
mod
els
pro
vid
ed n
ew lo
ok
at c
osts
an
d
incr
ease
d
man
ager
s vi
sib
ility
of
cos
ts
NA
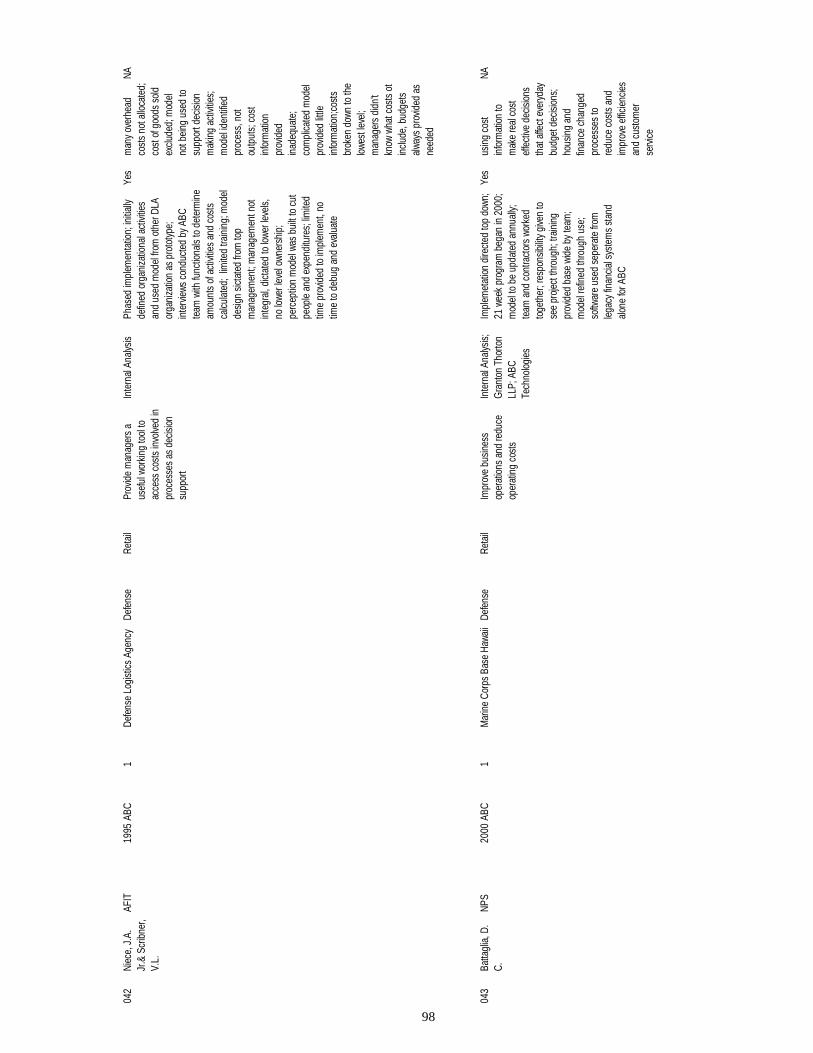
98
04
2Ni
ece,
J.A
. Jr
.& S
crib
ner,
V.L.
AFIT
1995
ABC
1De
fens
e Lo
gist
ics A
genc
yDe
fens
eRe
tail
Prov
ide
man
ager
s a
usef
ul w
orkin
g to
ol to
ac
cess
cos
ts in
volve
d in
pr
oces
ses
as d
ecisi
on
supp
ort
Inte
rnal
Ana
lysis
Phas
ed im
plem
enta
tion;
initia
lly
defin
ed o
rgan
izatio
nal a
ctivi
ties
and
used
mod
el fr
om o
ther
DLA
or
gani
zatio
n as
pro
toty
pe;
inte
rvie
ws c
ondu
cted
by
ABC
team
with
func
tiona
ls to
det
erm
ine
amou
nts
of a
ctivi
ties
and
cost
s ca
lcula
ted;
lim
ited
train
ing;
mod
el
desig
n sic
tate
d fro
m to
p m
anag
emen
t; m
anag
emen
t not
in
tegr
al, d
ictat
ed to
lowe
r lev
els,
no
lowe
r lev
el o
wner
ship
; pe
rcep
tion
mod
el w
as b
uilt
to c
ut
peop
le a
nd e
xpen
ditu
res;
limite
d tim
e pr
ovid
ed to
impl
emen
t, no
tim
e to
deb
ug a
nd e
valu
ate
Yes
man
y ov
erhe
ad
cost
s no
t allo
cate
d;
cost
of g
oods
sol
d ex
clude
d; m
odel
no
t bei
ng u
sed
to
supp
ort d
ecisi
on
mak
ing
activ
ities;
m
odel
iden
tifie
d pr
oces
s, n
ot
outp
uts;
cos
t in
form
atio
n pr
ovid
ed
inad
equa
te;
com
plica
ted
mod
el
prov
ided
little
in
form
atio
n;co
sts
brok
en d
own
to th
e lo
west
leve
l; m
anag
ers
didn
't kn
ow w
hat c
osts
ot
inclu
de, b
udge
ts
alwa
ys p
rovid
ed a
s ne
eded
NA
043
Batta
glia
, D.
C.NP
S20
00AB
C1
Mar
ine
Corp
s Ba
se H
awai
iDe
fens
eRe
tail
Impr
ove
busin
ess
oper
atio
ns a
nd re
duce
op
erat
ing
cost
s
Inte
rnal
Ana
lysis;
G
rant
on T
horto
n LL
P; A
BC
Tech
nolo
gies
Impl
emet
atio
n di
rect
ed to
p do
wn;
21 w
eek
prog
ram
beg
an in
200
0;
mod
el to
be
upda
ted
annu
ally;
te
am a
nd c
ontra
ctor
s wo
rked
to
geth
er; r
espo
nsib
ility
give
n to
se
e pr
ojec
t thr
ough
; tra
inin
g pr
ovid
ed b
ase
wide
by
team
; m
odel
refin
ed th
roug
h us
e;
softw
are
used
sep
erat
e fro
m
lega
cy fi
nanc
ial s
yste
ms
stan
d al
one
for A
BC
Yes
usin
g co
st
info
rmat
ion
to
mak
e re
al c
ost
effe
ctive
dec
ision
s th
at a
ffect
eve
ryda
y bu
dget
dec
ision
s;
hous
ing
and
finan
ce c
hang
ed
proc
esse
s to
re
duce
cos
ts a
nd
impr
ove
effic
ienc
ies
and
cust
omer
se
rvice
NA
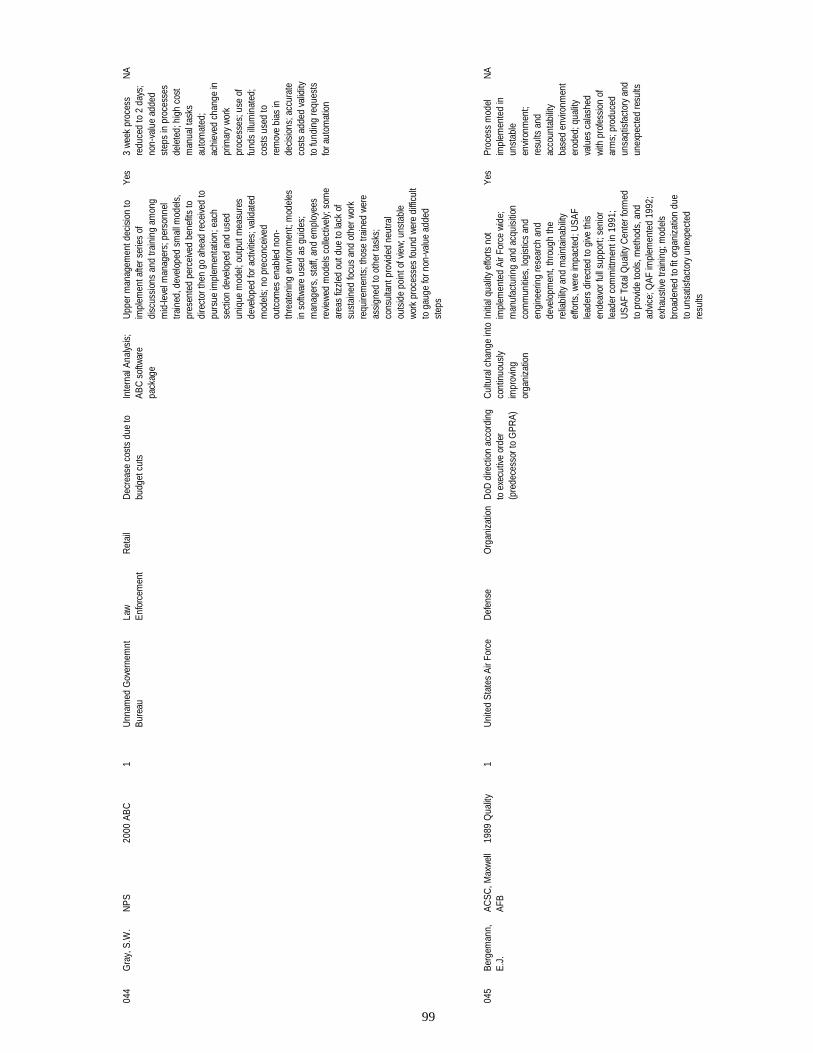
99
04
4G
ray,
S.W
.N
PS
2000
ABC
1U
nnam
ed G
over
nem
nt
Bur
eau
Law
En
forc
emen
tR
etai
lD
ecre
ase
cost
s du
e to
bu
dget
cut
sIn
tern
al A
nalys
is;
ABC
sof
twar
e pa
ckag
e
Upp
er m
anag
emen
t dec
isio
n to
im
plem
ent a
fter s
erie
s of
di
scus
sion
s an
d tra
inin
g am
ong
mid
-leve
l man
ager
s; p
erso
nnel
tra
ined
, dev
elop
ed s
mal
l mod
els,
pr
esen
ted
perc
eive
d be
nefit
s to
di
rect
or th
en g
o ah
ead
rece
ived
to
purs
ue im
plem
enta
tion;
eac
h se
ctio
n de
velo
ped
and
used
un
ique
mod
el; o
utpu
t mea
sure
s de
velo
ped
for a
ctivi
ties;
val
idat
ed
mod
els;
no
prec
once
ived
ou
tcom
es e
nabl
ed n
on-
thre
aten
ing
envir
onm
ent;
mod
eles
in
sof
twar
e us
ed a
s gu
ides
; m
anag
ers,
sta
ff, a
nd e
mpl
oyee
s re
view
ed m
odel
s co
llect
ively;
som
e ar
eas
fizzl
ed o
ut d
ue to
lack
of
sust
aine
d fo
cus
and
othe
r wor
k re
quire
men
ts; t
hose
trai
ned
were
as
sign
ed to
oth
er ta
sks;
co
nsul
tant
pro
vided
neu
tral
outs
ide
poin
t of v
iew;
uns
tabl
e w
ork
proc
esse
s fo
und
were
diff
icul
t to
gau
ge fo
r non
-val
ue a
dded
st
eps
Yes
3 we
ek p
roce
ss
redu
ced
to 2
day
s;
non-
valu
e ad
ded
step
s in
pro
cess
es
dele
ted;
hig
h co
st
man
ual t
asks
au
tom
ated
; ac
hiev
ed c
hang
e in
pr
imar
y wo
rk
proc
esse
s; u
se o
f fu
nds
illum
inat
ed;
cost
s us
ed to
re
mov
e bi
as in
de
cisi
ons;
acc
urat
e co
sts
adde
d va
lidity
to
fund
ing
requ
ests
fo
r aut
omat
ion
NA
045
Berg
eman
n,
E.J.
ACSC
, Max
wel
l AF
B19
89Q
ualit
y1
Uni
ted
Stat
es A
ir Fo
rce
Def
ense
Org
aniz
atio
nD
oD d
irect
ion
acco
rdin
g to
exe
cutiv
e or
der
(pre
dece
ssor
to G
PR
A)
Cul
tura
l cha
nge
into
co
ntin
uous
ly im
prov
ing
orga
niza
tion
Initi
al q
ualit
y ef
forts
not
im
plem
ente
d Ai
r For
ce w
ide;
m
anuf
actu
ring
and
acqu
isiti
on
com
mun
ities
, log
istic
s an
d en
gine
erin
g re
sear
ch a
nd
deve
lopm
ent,
thro
ugh
the
relia
bilit
y an
d m
aint
aina
bilit
y ef
forts
, wer
e im
pact
ed; U
SAF
lead
ers
dire
cted
to g
ive
this
en
deav
or fu
ll su
ppor
t; se
nior
le
ader
com
mitt
men
t in
1991
; U
SAF
Tot
al Q
ualit
y C
ente
r for
med
to
pro
vide
tool
s, m
etho
ds, a
nd
advic
e; Q
AF im
plem
ente
d 19
92;
exha
ustiv
e tra
inin
g; m
odel
s br
oade
ned
to fi
t org
aniz
atio
n du
e to
uns
atis
fact
ory
unex
pect
ed
resu
lts
Yes
Proc
ess
mod
el
impl
emen
ted
in
unst
able
en
viron
men
t; re
sults
and
ac
coun
tabi
lity
base
d en
viron
men
t er
oded
; qua
lity
valu
es c
alas
hed
with
pro
fess
ion
of
arm
s; p
rodu
ced
unsa
qtis
fact
ory
and
unex
pect
ed re
sults
NA
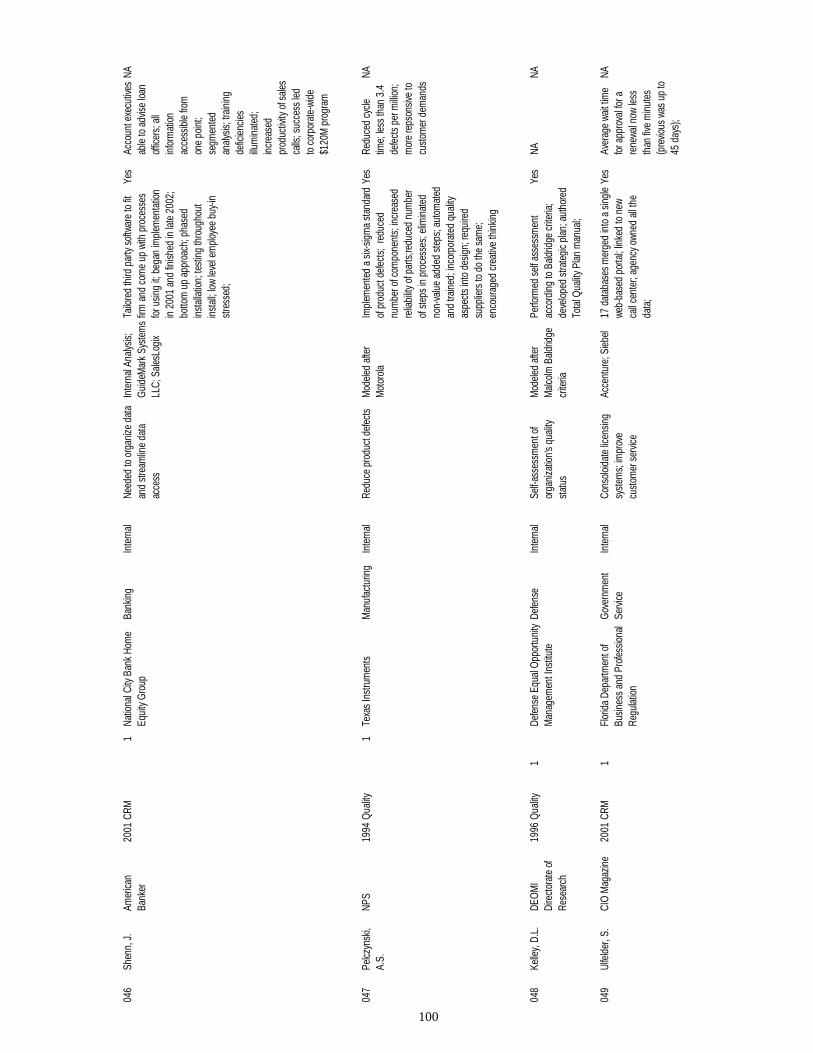
100
04
6Sh
enn,
J.
Amer
ican
Bank
er20
01CR
M1
Natio
nal C
ity B
ank
Hom
e Eq
uity
Gro
upBa
nkin
gIn
tern
alNe
eded
to o
rgan
ize d
ata
and
stre
amlin
e da
ta
acce
ss
Inte
rnal
Analy
sis;
Gui
deM
ark
Syst
ems
LLC;
Sal
esLo
gix
Tailo
red
third
par
ty so
ftwar
e to
fit
firm
and
com
e up
with
pro
cess
es
for u
sing
it; b
egan
impl
emen
tatio
n in
200
1 an
d fin
ished
in la
te 2
002;
bo
ttom
up
appr
oach
; pha
sed
inst
allat
ion; t
estin
g th
roug
hout
in
stal
l; low
leve
l em
ploy
ee b
uy-in
st
ress
ed;
Yes
Acco
unt e
xecu
tives
ab
le to
adv
ise lo
an
offic
ers;
all
info
rmat
ion
acce
ssib
le fr
om
one
poin
t; se
gmen
ted
analy
sis; t
rain
ing
defic
iencie
s illu
min
ated
; in
crea
sed
prod
uctiv
ity o
f sale
s ca
lls; s
ucce
ss le
d to
cor
pora
te-w
ide
$120
M p
rogr
am
NA
047
Pelcz
ynsk
i, A.
S.NP
S19
94Q
uality
1Te
xas
Inst
rum
ents
Man
ufac
turin
gIn
tern
alRe
duce
pro
duct
def
ects
Mod
eled
afte
r M
otor
ola
Impl
emen
ted
a six
-sig
ma
stan
dard
of
pro
duct
def
ects
; re
duce
d nu
mbe
r of c
ompo
nent
s; in
crea
sed
relia
bility
of p
arts
;redu
ced
num
ber
of s
teps
in p
roce
sses
; elim
inat
ed
non-
valu
e ad
ded
step
s; a
utom
ated
an
d tra
ined
; inc
orpo
rate
d qu
ality
as
pect
s in
to d
esig
n; re
quire
d su
pplie
rs to
do
the
sam
e;
enco
urag
ed c
reat
ive th
inkin
g
Yes
Redu
ced
cycle
tim
e; le
ss th
an 3
.4
defe
cts
per m
illion
; m
ore
reps
onsiv
e to
cu
stom
er d
eman
ds
NA
048
Kelle
y, D.
L.DE
OM
I Di
rect
orat
e of
Re
sear
ch
1996
Qua
lity1
Defe
nse
Equa
l Opp
ortu
nity
Man
agem
ent I
nstit
ute
Defe
nse
Inte
rnal
Self-
asse
ssm
ent o
f or
gani
zatio
n's q
uality
st
atus
Mod
eled
afte
r M
alcolm
Bald
ridge
cr
iteria
Perfo
rmed
self
ass
essm
ent
acco
rdin
g to
Bald
ridge
crit
eria;
de
velop
ed s
trate
gic
plan
; aut
hore
d To
tal Q
uality
Pla
n m
anua
l;
Yes
NANA
049
Ulfe
lder
, S.
CIO
Mag
azin
e20
01CR
M1
Flor
ida
Depa
rtmen
t of
Busin
ess
and
Prof
essio
nal
Regu
lation
Gov
ernm
ent
Serv
iceIn
tern
alCo
nsolo
idat
e lic
ensin
g sy
stem
s; im
prov
e cu
stom
er s
ervic
e
Acce
ntur
e; S
iebel
17 d
atab
ases
mer
ged
into
a s
ingl
e we
b-ba
sed
porta
l; lin
ked
to n
ew
call c
ente
r; ag
ency
own
ed a
ll the
da
ta;
Yes
Aver
age
wait
time
for a
ppro
val fo
r a
rene
wal n
ow le
ss
than
five
min
utes
(p
revio
us w
as u
p to
45
day
s);
NA
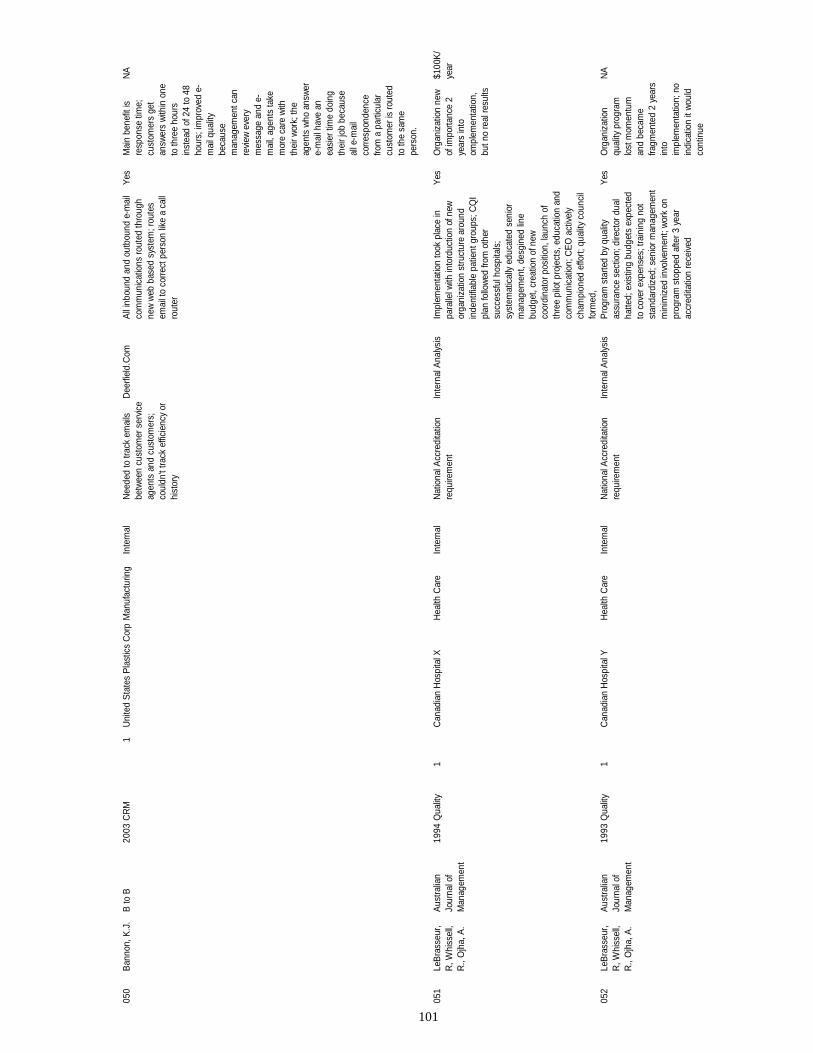
101
05
0B
anno
n, K
.J.
B to
B20
03C
RM
1U
nite
d S
tate
s P
last
ics
Cor
pM
anuf
actu
ring
Inte
rnal
Nee
ded
to tr
ack
emai
ls
betw
een
cust
omer
ser
vice
ag
ents
and
cus
tom
ers;
co
uldn
't tra
ck e
ffici
ency
or
hist
ory
Dee
rfiel
d.C
omA
ll in
boun
d an
d ou
tbou
nd e
-mai
l co
mm
unic
atio
ns ro
uted
thro
ugh
new
web
bas
ed s
yste
m; r
oute
s em
ail t
o co
rrect
per
son
like
a ca
ll ro
uter
Yes
Mai
n be
nefit
is
resp
onse
tim
e;
cust
omer
s ge
t an
swer
s w
ithin
one
to
thre
e ho
urs
inst
ead
of 2
4 to
48
hour
s; im
prov
ed e
-m
ail q
ualit
y be
caus
e m
anag
emen
t can
re
view
eve
ry
mes
sage
and
e-
mai
l, ag
ents
take
m
ore
care
with
th
eir w
ork;
the
agen
ts w
ho a
nsw
er
e-m
ail h
ave
an
easi
er ti
me
doin
g th
eir j
ob b
ecau
se
all e
-mai
l co
rres
pond
ence
fro
m a
par
ticul
ar
cust
omer
is ro
uted
to
the
sam
e pe
rson
.
NA
051
LeB
rass
eur,
R, W
hiss
ell,
R.,
Ojh
a, A
.
Aus
tralia
n Jo
urna
l of
Man
agem
ent
1994
Qua
lity
1C
anad
ian
Hos
pita
l XH
ealth
Car
eIn
tern
alN
atio
nal A
ccre
dita
tion
requ
irem
ent
Inte
rnal
Ana
lysi
sIm
plem
enta
tion
took
pla
ce in
pa
ralle
l with
into
rduc
tion
of n
ew
orga
niza
tion
stru
ctur
e ar
ound
in
dent
ifiab
le p
atie
nt g
roup
s; C
QI
plan
follo
wed
from
oth
er
succ
essf
ul h
ospi
tals
; sy
stem
atic
ally
edu
cate
d se
nior
m
anag
emen
t, de
sgin
ed li
ne
budg
et, c
reat
ion
of n
ew
coor
dina
tor p
ositi
on, l
aunc
h of
th
ree
pilo
t pro
ject
s, e
duca
tion
and
com
mun
icat
ion;
CE
O a
ctiv
ely
cham
pion
ed e
ffort;
qua
lity
coun
cil
form
ed,
Yes
Org
aniz
atio
n ne
w
of im
porta
nce
2 ye
ars
into
om
plem
enta
tion,
bu
t no
real
resu
lts
$100
K/
year
052
LeB
rass
eur,
R, W
hiss
ell,
R.,
Ojh
a, A
.
Aus
tralia
n Jo
urna
l of
Man
agem
ent
1993
Qua
lity
1C
anad
ian
Hos
pita
l YH
ealth
Car
eIn
tern
alN
atio
nal A
ccre
dita
tion
requ
irem
ent
Inte
rnal
Ana
lysi
sP
rogr
am s
tarte
d by
qua
lity
assu
ranc
e se
ctio
n; d
irect
or d
ual
hatte
d; e
xist
ing
budg
ets
expe
cted
to
cov
er e
xpen
ses;
trai
ning
not
st
anda
rdiz
ed; s
enio
r man
agem
ent
min
imiz
ed in
volv
emen
t; w
ork
on
prog
ram
sto
pped
afte
r 3 y
ear
accr
edita
tion
rece
ived
Yes
Org
aniz
atio
n qu
ality
pro
gram
lo
st m
omen
tum
an
d be
cam
e fra
gmen
ted
2 ye
ars
into
im
plem
enta
tion;
no
indi
catio
n it
wou
ld
cont
inue
NA
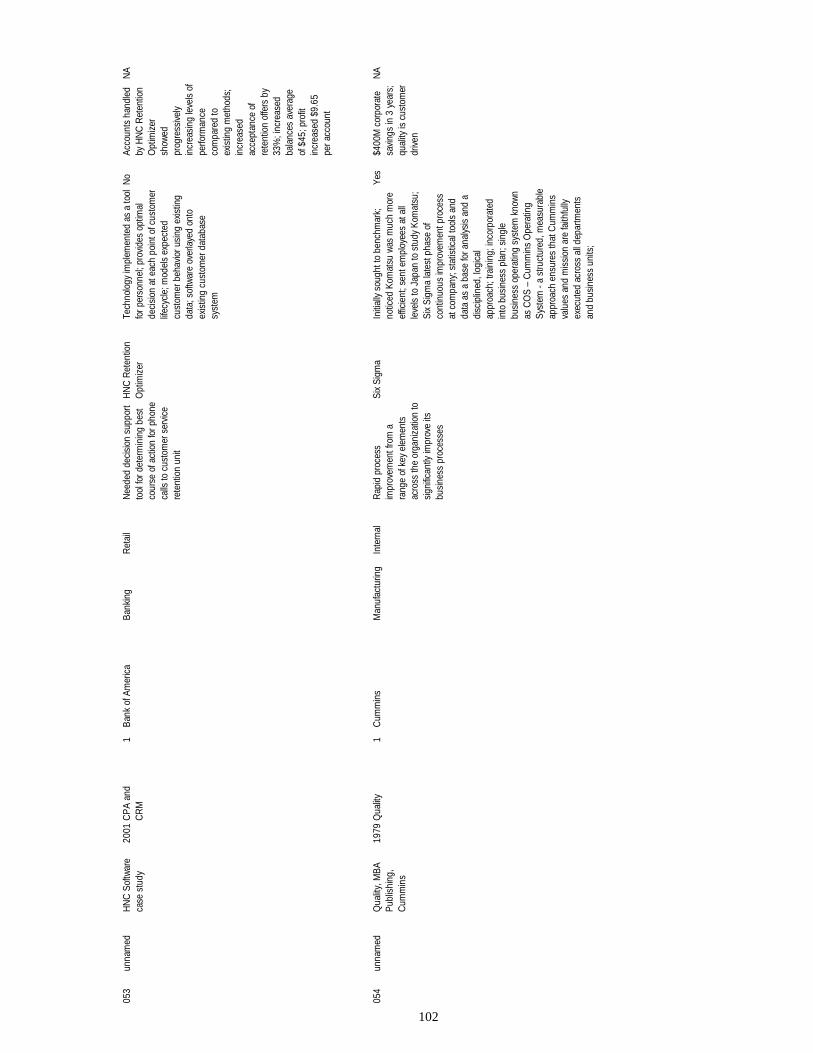
102
05
3un
nam
edH
NC
Sof
twar
e ca
se s
tudy
2001
CP
A an
d C
RM
1B
ank
of A
mer
ica
Bank
ing
Ret
ail
Nee
ded
deci
sion
sup
port
tool
for d
eter
min
ing
best
co
urse
of a
ctio
n fo
r pho
ne
calls
to c
usto
mer
ser
vice
re
tent
ion
unit
HN
C R
eten
tion
Opt
imiz
erTe
chno
logy
impl
emen
ted
as a
tool
fo
r per
sonn
el; p
rovi
des
optim
al
deci
sion
at e
ach
poin
t of c
usto
mer
lif
ecyc
le; m
odel
s ex
pect
ed
cust
omer
beh
avio
r usi
ng e
xistin
g da
ta; s
oftw
are
over
laye
d on
to
exis
ting
cust
omer
dat
abas
e sy
stem
No
Acco
unts
han
dled
by
HN
C R
eten
tion
Opt
imiz
ersh
owed
pr
ogre
ssiv
ely
incr
easi
ng le
vels
of
perfo
rman
ceco
mpa
red
to
exis
ting
met
hods
; in
crea
sed
acce
ptan
ce o
f re
tent
ion
offe
rs b
y 33
%; i
ncre
ased
ba
lanc
es a
vera
ge
of $
45; p
rofit
in
crea
sed
$9.6
5 pe
r acc
ount
NA
054
unna
med
Qua
lity,
MBA
Pu
blis
hing
, C
umm
ins
1979
Qua
lity
1C
umm
ins
Man
ufac
turin
gIn
tern
alR
apid
pro
cess
im
prov
emen
t fro
m a
ra
nge
of k
ey e
lem
ents
ac
ross
the
orga
niza
tion
to
sign
ifican
tly im
prov
e its
bu
sine
ss p
roce
sses
Six
Sigm
aIn
itial
ly so
ught
to b
ench
mar
k;
notic
ed K
omat
su w
as m
uch
mor
e ef
ficie
nt; s
ent e
mpl
oyee
s at
all
leve
ls to
Jap
an to
stu
dy K
omat
su;
Six
Sig
ma
late
st p
hase
of
cont
inuo
us im
prov
emen
t pro
cess
at
com
pany
; sta
tistic
al to
ols
and
data
as
a ba
se fo
r ana
lysi
s an
d a
disc
iplin
ed, l
ogic
alap
proa
ch; t
rain
ing;
inco
rpor
ated
in
to b
usin
ess
plan
; sin
gle
busi
ness
ope
ratin
g sy
stem
kno
wnas
CO
S –
Cum
min
s O
pera
ting
Sys
tem
- a
stru
ctur
ed, m
easu
rabl
eap
proa
ch e
nsur
es th
at C
umm
ins
valu
es a
nd m
issi
on a
re fa
ithfu
lly
exec
uted
acr
oss
all d
epar
tmen
ts
and
busi
ness
uni
ts;
Yes
$400
M c
orpo
rate
sa
ving
s in
3 y
ears
; qu
ality
is c
usto
mer
dr
iven
NA

103
05
5C
lark
, T.,
Wal
z, L
., Tu
rner
, G.,
Mis
zuk,
B.
Qua
lity
1988
Qua
lity
1In
tel
Man
ufac
turin
gIn
tern
alR
edef
ine
proc
esse
s in
or
gani
zatio
n an
d sh
ift
focu
s to
cus
tom
er
Inte
rnal
Ana
lysi
sM
ultip
le a
ttem
pts;
firs
t was
198
8;
18 m
onth
pro
gram
cal
led
man
agin
g fo
r val
ue; 1
990
esta
blis
hed
qual
ity te
ch g
roup
with
go
al o
f app
lyin
g fo
r Mal
colm
B
aldr
idge
aw
ard;
gro
up h
ad
spec
ific
goal
s to
tran
sfor
m
com
pany
; dev
elop
ed tr
aini
ng fo
r en
tire
com
pany
; man
agem
ent b
y pl
anni
ng p
rogr
am e
stab
lishe
d;
1991
refo
cuse
d w
ith li
mite
d se
nio
man
agem
ent;
redu
ced
mea
sure
s fro
m 2
00 to
2 to
gai
n fo
cus;
3
proc
ess
impr
ovem
ent l
eade
rs
resp
onsi
ble
to k
eep
com
pany
on
trac
k; to
p do
wn
appr
oach
ab
ando
ned
and
botto
m u
p in
stitu
ted;
func
itona
l tea
ms
met
w
eekl
y to
sol
ve p
robl
ems;
pr
ogre
ss re
view
s m
anda
tory
; re
war
d sy
stem
est
ablis
hed
Yes
M4V
faile
d to
pr
oduc
e la
stin
g ch
ange
; cris
es
redi
rect
ed
man
agem
ent a
nd
all d
iver
ted
back
to
the
old
way
; tac
tics
agai
n fa
iled
due
to
effo
rts to
do
too
muc
h at
onc
e; 3
rd
prog
ram
wor
ked;
cu
stom
er
satis
fact
ion
rais
ed
from
70/
80 to
95%
; cu
stom
er d
ownt
ime
decr
ease
d fro
m 2
5 ho
urs
to 1
1 ho
urs;
NA
056
Man
i, B
.G.
Rev
iew
of
Pub
lic
Per
sonn
el
Adm
inis
trat
ion
1985
Qua
lity
1IR
SG
over
nmen
t S
ervi
ceIn
tern
alB
ette
r se
rve
the
need
s of
cu
stom
ers
Inte
rnal
Ana
lysi
s;
Mye
rs-B
riggs
Typ
e In
dica
tor
Em
ploy
ee e
duca
tion
and
invo
lvem
ent a
t all
leve
ls; t
op
lead
ersh
ip s
uppo
rt; p
rogr
am fo
r lo
wer
leve
l em
ploy
ees
to a
dvan
ce
to m
anag
emen
t pos
ition
s; r
ules
to
sens
ibly
app
ly r
egul
atio
ns;
empl
oyee
s ex
pect
ed to
thin
k cr
eativ
ely
to id
entif
y pr
oble
ms
and
seek
cha
nge;
MB
TI u
sed
as to
ol
for
man
ager
can
dida
tes
to id
entif
y th
eir
styl
e
Yes
Rec
eive
d P
resi
dent
ial A
war
d fo
r Qua
lity
in 1
991;
w
ent f
rom
cha
os to
TQ
M o
rgan
izat
ion;
NA
057
Dou
glas
-Th
omer
son,
L.
Qua
lity
Con
gres
s19
98Q
ualit
y1
Com
mon
wea
lth H
ealth
C
orpo
ratio
nH
ealth
Car
eIn
tern
alB
ecom
e re
cogn
ized
by
empl
oyee
s, c
usto
mer
s,
and
com
petit
ors
as th
e un
ques
tione
d le
ader
in
care
and
ser
vice
s
Inte
rnal
Ana
lysi
s;
Six
Sig
ma
thro
ugh
GE
Med
ical
S
yste
ms
Hea
lthca
re
Sol
utio
ns
1997
sen
ior
lead
ers
met
with
GE
le
ader
s an
d le
arne
d of
pro
gram
; 19
98 p
rogr
am im
plem
enta
tion
bega
n; tr
aini
ng; s
tep-
by-s
tep
proc
ess;
com
pany
wid
e fo
cus
on
four
prin
cipl
es: c
usto
mer
sa
tisfa
ctio
n, q
ualit
y of
ca
re/s
ervi
ces,
tim
elin
ess/
spee
d/co
nven
ienc
e,
cost
; CE
O m
et w
ith s
enio
r lea
ders
, w
ord
and
supp
ort p
rovi
ded
for a
ll em
ploy
ees;
four
pha
ses
No
$1.2
M in
sav
ings
; in
crea
sed
thro
ughp
ut 3
3%;
decr
ease
d co
st
21.5
%
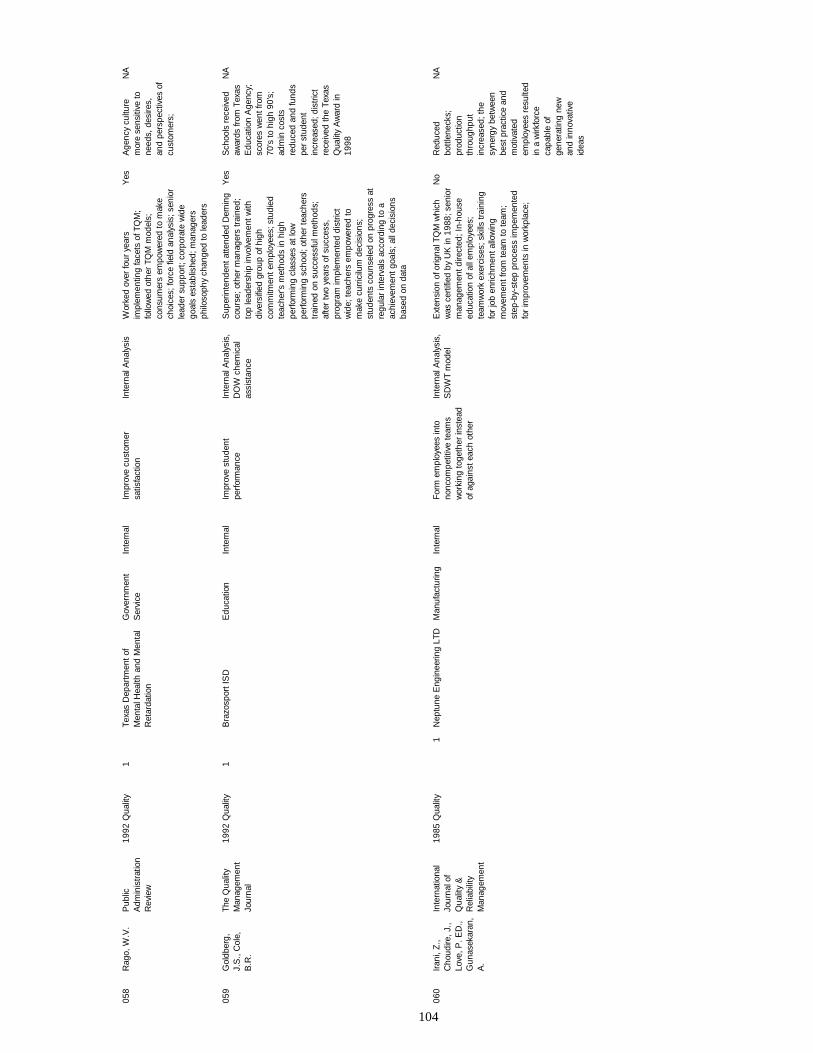
104
05
8R
ago,
W.V
.P
ublic
A
dmin
istr
atio
n R
evie
w
1992
Qua
lity
1Te
xas
Dep
artm
ent o
f M
enta
l Hea
lth a
nd M
enta
l R
etar
datio
n
Gov
ernm
ent
Ser
vice
Inte
rnal
Impr
ove
cust
omer
sa
tisfa
ctio
nIn
tern
al A
naly
sis
Wor
ked
over
four
yea
rs
impl
emen
ting
face
ts o
f TQ
M;
follo
wed
oth
er T
QM
mod
els;
co
nsum
ers
empo
wer
ed to
mak
e ch
oice
s; fo
rce
field
ana
lysi
s; s
enio
r le
ader
sup
port
; cor
pora
te w
ide
goal
s es
tabl
ishe
d; m
anag
ers
philo
soph
y ch
ange
d to
lead
ers
Yes
Age
ncy
cultu
re
mor
e se
nsiti
ve to
ne
eds,
des
ires,
an
d pe
rspe
ctiv
es o
f cu
stom
ers;
NA
059
Gol
dber
g,
J.S
., C
ole,
B
.R.
The
Qua
lity
Man
agem
ent
Jour
nal
1992
Qua
lity
1B
razo
spor
t IS
DE
duca
tion
Inte
rnal
Impr
ove
stud
ent
perfo
rman
ceIn
tern
al A
naly
sis,
D
OW
che
mic
al
assi
stan
ce
Sup
erin
tend
ent a
ttend
ed D
emin
g co
urse
; oth
er m
anag
ers
train
ed;
top
lead
ersh
ip in
volv
emen
t with
di
vers
ified
gro
up o
f hig
h co
mm
itmen
t em
ploy
ees;
stu
died
te
ache
r's m
etho
ds in
hig
h pe
rform
ing
clas
ses
at lo
w
perfo
rmin
g sc
hool
; oth
er te
ache
rs
trai
ned
on s
ucce
ssfu
l met
hods
; af
ter
two
year
s of
suc
cess
, pr
ogra
m im
plem
ente
d di
stric
t w
ide;
teac
hers
em
pow
ered
to
mak
e cu
rric
ilum
dec
isio
ns;
stud
ents
cou
nsel
ed o
n pr
ogre
ss a
t re
gula
r int
erva
ls a
ccor
ding
to a
ac
hiev
emen
t goa
ls; a
ll de
cisi
ons
base
d on
dat
a
Yes
Sch
ools
rec
eive
d aw
ards
from
Tex
as
Edu
catio
n A
genc
y;
scor
es w
ent f
rom
70
's to
hig
h 90
's;
adm
in c
osts
re
duce
d an
d fu
nds
per
stud
ent
incr
ease
d; d
istri
ct
rece
ived
the
Texa
s Q
ualit
y A
war
d in
19
98
NA
060
Irani
, Z.,
Cho
udire
, J.,
Love
, P. E
D.,
Gun
asek
aran
, A
.
Inte
rnat
iona
l Jo
urna
l of
Qua
lity
&
Rel
iabi
lity
Man
agem
ent
1985
Qua
lity
1N
eptu
ne E
ngin
eerin
g LT
DM
anuf
actu
ring
Inte
rnal
Form
em
ploy
ees
into
no
ncom
petit
ive
team
s w
orki
ng to
geth
er in
stea
d of
aga
inst
eac
h ot
her
Inte
rnal
Ana
lysi
s,
SD
WT
mod
elE
xten
sion
of o
rigna
l TQ
M w
hich
w
as c
ertif
ied
by U
K in
198
8; s
enio
r m
anag
emen
t dire
cted
; In-
hous
e ed
ucat
ion
of a
ll em
ploy
ees;
te
amw
ork
exer
cise
s; s
kills
trai
ning
fo
r jo
b en
richm
ent a
llow
ing
mov
emen
t fro
m te
am to
team
; st
ep-b
y-st
ep p
roce
ss im
pem
ente
d fo
r im
prov
emen
ts in
wor
kpla
ce;
No
Red
uced
bo
ttlen
ecks
; pr
oduc
tion
thro
ughp
ut
incr
ease
d; th
e sy
nerg
y be
twee
n be
st p
ract
ice
and
mot
ivat
ed
empl
oyee
s re
sulte
d in
a w
irkfo
rce
capa
ble
of
gene
ratin
g ne
w
and
inno
vativ
e id
eas
NA
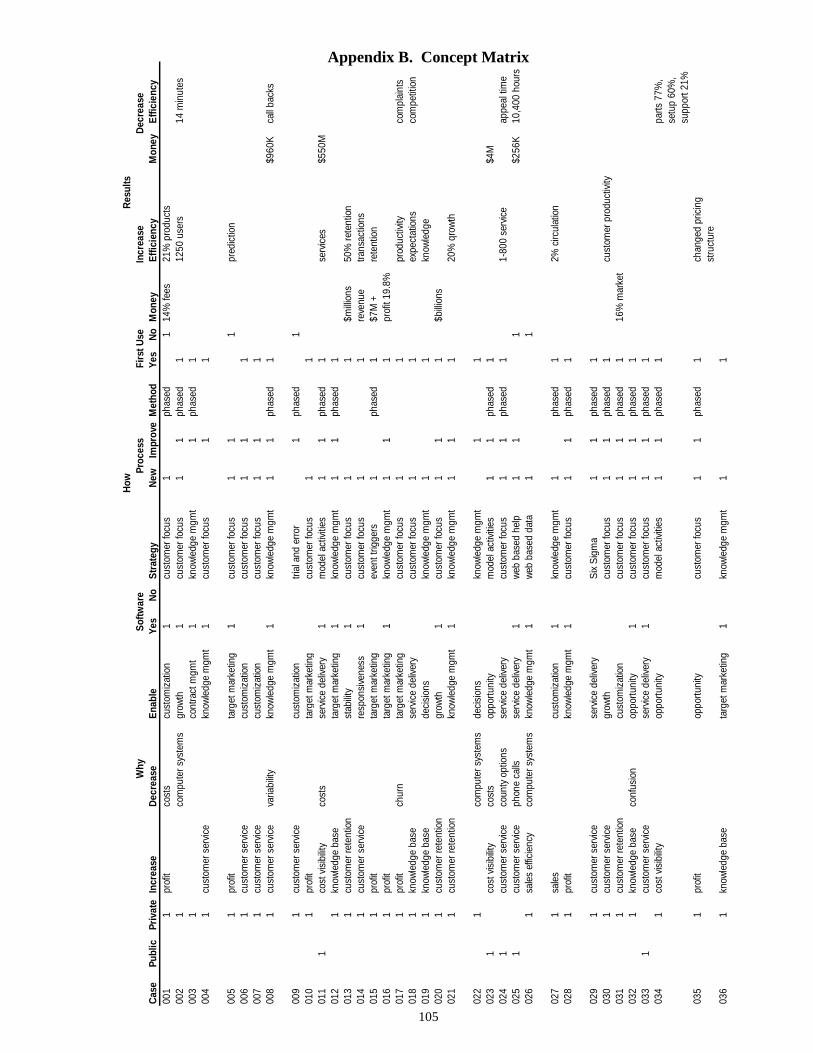
105
Appendix B. Concept Matrix
Cas
ePu
blic
Priv
ate
Incr
ease
Dec
reas
eE
nabl
eYe
sN
oS
trat
egy
New
Impr
ove
Met
hod
Yes
No
Mon
eyEf
ficie
ncy
Mon
eyE
ffici
ency
001
1pr
ofit
cost
scu
stom
izat
ion
1cu
stom
er fo
cus
1ph
ased
114
% fe
es21
% p
rodu
cts
002
1co
mpu
ter s
yste
ms
grow
th1
cust
omer
focu
s1
1ph
ased
112
50 u
sers
14 m
inut
es00
31
cont
ract
mgm
t1
know
ledg
e m
gmt
1ph
ased
100
41
cust
omer
ser
vice
know
ledg
e m
gmt
1cu
stom
er fo
cus
11
005
1pr
ofit
targ
et m
arke
ting
1cu
stom
er fo
cus
11
1pr
edic
tion
006
1cu
stom
er s
ervi
cecu
stom
izat
ion
cust
omer
focu
s1
11
007
1cu
stom
er s
ervi
cecu
stom
izat
ion
cust
omer
focu
s1
11
008
1cu
stom
er s
ervi
ceva
riabi
lity
know
ledg
e m
gmt
1kn
owle
dge
mgm
t1
1ph
ased
1$9
60K
call
back
s
009
1cu
stom
er s
ervi
cecu
stom
izat
ion
trial
and
erro
r1
phas
ed1
010
1pr
ofit
targ
et m
arke
ting
cust
omer
focu
s1
101
11
cost
vis
ibilit
yco
sts
serv
ice
deliv
ery
1m
odel
act
iviti
es1
1ph
ased
1se
rvic
es$5
50M
012
1kn
owle
dge
base
targ
et m
arke
ting
1kn
owle
dge
mgm
t1
1ph
ased
101
31
cust
omer
rete
ntio
nst
abilit
y1
cust
omer
focu
s1
1$m
illion
s50
% re
tent
ion
014
1cu
stom
er s
ervi
cere
spon
sive
ness
1cu
stom
er fo
cus
11
reve
nue
trans
actio
ns01
51
prof
itta
rget
mar
ketin
gev
ent t
rigge
rs1
phas
ed1
$7M
+re
tent
ion
016
1pr
ofit
targ
et m
arke
ting
1kn
owle
dge
mgm
t1
11
prof
it 19
.8%
017
1pr
ofit
chur
nta
rget
mar
ketin
gcu
stom
er fo
cus
11
prod
uctiv
ityco
mpl
aint
s01
81
know
ledg
e ba
sese
rvic
e de
liver
ycu
stom
er fo
cus
11
expe
ctat
ions
com
petit
ion
019
1kn
owle
dge
base
deci
sion
skn
owle
dge
mgm
t1
1kn
owle
dge
020
1cu
stom
er re
tent
ion
grow
th1
cust
omer
focu
s1
11
$billi
ons
021
1cu
stom
er re
tent
ion
know
ledg
e m
gmt
1kn
owle
dge
mgm
t1
11
20%
qro
wth
022
1co
mpu
ter s
yste
ms
deci
sion
skn
owle
dge
mgm
t1
102
31
cost
vis
ibilit
yco
sts
oppo
rtuni
tym
odel
act
iviti
es1
1ph
ased
1$4
M02
41
cust
omer
ser
vice
coun
ty o
ptio
nsse
rvic
e de
liver
ycu
stom
er fo
cus
11
phas
ed1
1-80
0 se
rvic
eap
peal
tim
e02
51
cust
omer
ser
vice
phon
e ca
llsse
rvic
e de
liver
y1
web
bas
ed h
elp
11
1$2
56K
10,4
00 h
ours
026
1sa
les
effic
ienc
yco
mpu
ter s
yste
ms
know
ledg
e m
gmt
1w
eb b
ased
dat
a1
1
027
1sa
les
cust
omiz
atio
n1
know
ledg
e m
gmt
1ph
ased
12%
circ
ulat
ion
028
1pr
ofit
know
ledg
e m
gmt
1cu
stom
er fo
cus
11
phas
ed1
029
1cu
stom
er s
ervi
cese
rvic
e de
liver
yS
ix S
igm
a1
1ph
ased
103
01
cust
omer
ser
vice
grow
thcu
stom
er fo
cus
11
phas
ed1
cust
omer
pro
duct
ivity
031
1cu
stom
er re
tent
ion
cust
omiz
atio
ncu
stom
er fo
cus
11
phas
ed1
16%
mar
ket
032
1kn
owle
dge
base
conf
usio
nop
portu
nity
1cu
stom
er fo
cus
11
phas
ed1
033
1cu
stom
er s
ervi
cese
rvic
e de
liver
y1
cust
omer
focu
s1
1ph
ased
103
41
cost
vis
ibilit
yop
portu
nity
mod
el a
ctiv
ities
11
phas
ed1
parts
77%
, se
tup
60%
, su
ppor
t 21%
035
1pr
ofit
oppo
rtuni
tycu
stom
er fo
cus
11
phas
ed1
chan
ged
pric
ing
stru
ctur
e03
61
know
ledg
e ba
seta
rget
mar
ketin
g1
know
ledg
e m
gmt
11
Why
Proc
ess
How
Incr
ease
Dec
reas
eR
esul
tsS
oftw
are
Firs
t Use

106
03
71
prof
itcu
stom
izat
ion
1kn
owle
dge
mgm
t1
1ph
ased
103
81
know
ledg
e ba
sese
rvic
e de
liver
ycu
stom
er fo
cus
11
phas
ed1
96%
rete
ntio
n,
satis
fact
ion
039
1cu
stom
er re
tent
ion
oppo
rtuni
tycu
stom
er fo
cus
11
1pr
ofit
25%
rete
ntio
n 20
%04
01
cost
vis
ibilit
yse
rvic
e de
liver
y1
mod
el a
ctivi
ties
1ph
ased
1em
ail
041
1co
st v
isib
ility
deci
sion
sm
odel
act
ivitie
sph
ased
104
21
cost
vis
ibilit
yde
cisi
ons
mod
el a
ctivi
ties
phas
ed1
043
1co
st v
isib
ility
cost
sde
cisi
ons
1m
odel
act
ivitie
s1
phas
ed1
cust
omer
ser
vice
044
1co
sts
deci
sion
s1
mod
el a
ctivi
ties
1ph
ased
1pr
oduc
tivity
cost
s19
day
s04
51
cust
omer
ser
vice
cost
sim
prov
emen
t1
TQM
11
phas
ed1
046
1kn
owle
dge
mgm
t1
know
ledg
e m
gmt
11
phas
ed1
prod
uctiv
ity
047
1va
riabi
lity
crea
tive
thin
king
1Si
x Si
gma
11
phas
ed1
resp
onsi
vene
ss<
3.4
DPM
048
1im
prov
emen
t1
Bald
ridge
Mod
el1
phas
ed1
049
1cu
stom
er s
ervic
ebu
reau
crac
yse
rvic
e de
liver
y1
cust
omer
focu
s1
phas
ed1
wait
time
45
days
to 5
m
inut
es05
01
know
ledg
e ba
sere
spon
sive
ness
1kn
owle
dge
mgm
t1
phas
ed1
resp
onsi
vene
ss24
- 48
hrs
to
1 - 3
hrs
051
1se
rvic
e de
liver
y1
cust
omer
focu
s1
1ph
ased
105
21
serv
ice
deliv
ery
1cu
stom
er fo
cus
phas
ed1
053
1cu
stom
er re
tent
ion
cust
omiz
atio
n1
know
ledg
e m
gmt
11
19.
65 p
er
acco
unt
33%
rete
ntio
n
054
1im
prov
emen
t1
Six
Sigm
a1
1ph
ased
1$4
00M
resp
onsi
vene
ss05
51
cust
omer
ser
vice
impr
ovem
ent
Bald
ridge
Mod
el1
1ph
ased
195
% s
atis
fact
ion
25 h
rs to
11
hrs
056
1cu
stom
er s
ervic
ese
rvic
e de
liver
y1
MBT
I, TQ
M1
1ph
ased
1Aw
ard
1991
057
1cu
stom
er s
ervic
ese
rvic
e de
liver
y1
Six
Sigm
a1
1ph
ased
1$1
.2M
thro
ughp
ut 3
3%co
sts
21.5
%05
81
cust
omer
ser
vice
impr
ovem
ent
1TQ
M1
1ph
ased
1se
nsiti
vity
059
1cu
stom
er s
ervic
eim
prov
emen
t1
DO
W M
odel
11
phas
ed1
stud
ent f
unds
scor
es 7
0s to
90s
supp
ort
cost
s06
01
orga
niza
tion
impr
ovem
ent
1SD
WT
Mod
el1
1ph
ased
1th
roug
hput
bottl
enec
ks19
41
107
Bibliography “A SafeHarbor Case Study: Access Washington.” Excerpt from an unpublished article.
n. pag. http://www.safeharbor.com. 15 January 2004. “Aerospace and Defense Industry Turns to Customer Relationship Management to
Transform Business Process and Asset Utilization.” Excerpt from an unpublished article. n. pag. http://www.bearingpoint.com. 15 January 2004.
Aguayo, R. (1990). Dr. Deming: The Man Who Taught the Japanese About Quality. New York, NY: Carol Publishing Group
Amato-McCoy, D. (2002). “There’s No ‘O’ in CRM: Successful Projects Emphasize
Customers, Not Operations.” Bank Systems & Technology, August 2002, pp. 30 – 33.
Anonymous. (2003). “Cummins Witnesses Savings.” Quality, February, pp. 49 - 51 Anonymous. (2002). “Bank of America Case Study.” Excerpt from unpublished article.
http://www.technologyforfinance.com/PDF/HNCBankofAmericaCaseStudy.pdf. n. pag. 17 December 2003.
Baillie, F. (2002). “Achieving Excellence in Global Value Chain Integration.” Excerpt
from unpublished briefing. n. pag. http://www.dtic.mil/ndia/2002logistics/bailie.pdf. 14 January 2004.
Bannan, K.J., (2003). “Plastics firm learns CRM makes it more flexible.” B to B;
September, Vol. 88 Issue 10, p13. Battaglia, D.C., (2003). An Activity-Based Costing Analysis of the Substance Abuse
Counseling Center, Marine Corps Base Hawaii. MS thesis. Naval Post Graduate School, Monterey, CA.
Beth, S., Burt, D., Copacino, W., Gopal, C. and Lynch, R. (2003). “Supply Chain
Challenges: Building Relationships”. Harvard Business Review; Jul2003, Vol. 81 Issue 7, p64, 10p, 10bw.
Benchley, R., (2003). “CEO INSIGHTS” A Supplement to Chief Executive Magazine,
April 2003 Bielski, L. (2003). “Taking CRM Step-By-Step.” ABA Banking Journal, April 2003, pp.
57-59.
108
Breur, T. (2003). “Integration of Analytical CRM in Business Processes: An Application.” Unpublished article. n. pag. http://www.INGbank.com, 15 January 2004.
Caudle, S.L., (1995). “Reengineering for Results: Keys to Success from Government
Experience.” n. pag. National Academy of Public Administration, Washington http://www.defenselink.mil/nii/bpr/bprcd/3002.htm. 17 November 2003.
Charmaz, K. (2000). Grounded Theory: Objectivist and Constructivist Methods. In N.K.
Denzin and Y.S. Lincoln (Eds.), Handbook of Qualitative Research (2nd Edition) (pp. 509-535). Thousand Oaks, CA: Sage Publications
Chatham, B. (2000). “Managing Customer Profitability” Forrester Research, Inc.:
Cambridge, Massachusetts Clark, T., Walz, L., Turner, G., Miszuk, B. (1993). “Intel's Circuitous Route to
Implementing Total Quality.” Quality, February 1993; pp. 25 – 31. Cooper, R. and Kaplan, R.S. (1991). “Profit Priorities from Activity-Based Costing”
Harvard Business Review, May – June, pp. 130 – 135. Cooper, R. and Kaplan, R.S. (1998). Cost and Effect. Harvard Business School Press:
Boston MA Creswell, J.W., (2003). Research Design: Qualitative, quantitative, and mixed method
approaches. 2ed. Thousand Oaks, CA: Sage Publications Cummins Inc., (2003). Sustainability Report.
http://www.cummins.com/na/pages/en/index.cfm. 12 February 2004. Day, G.S. (2003). “Creating a Superior Customer-Relating Capability.” MIT Sloan
Management Review, Spring 2003, pp. 77 – 82. Defense Logistics Agency (DLA), (2002). Strategic Plan 2002 – 2007
Corporate Planning, DSS-P: Fort Belvoir, Virginia. http://www.dla.mil/dss/dss-p. 18 November 2003.
-----. (1999). Activity Based Costing and Management Implementation Plan.
http://www.ceac.army.mil/web/Downloads/GanslerMemo/DLA_ABM_Implementation_Plan.doc. 18 November 2003.
-----. (2003). Defense-Wide Working Capital Fund: Fiscal Year 2004 Budget Estimates (Distribution Depots). http://www.dod.mil/.../budget_justification/pdfs/dwcf/DWCF_Justification_Book/ 04_DLA%20Distribution_Operating.pdf. 17 November 2003.
109
-----. (2003). “Performance-based Agreements Support Customers at DLA.” Excerpt from unpublished article. n. pag. http://www.dla.mil/public_info/read_news.asp?track=182. 5 December 2003.
Denzin, N.K. and Lincoln, Y.S. (2000). Handbook of Qualitative Research (2nd Edition).
Thousand Oaks, CA: Sage Publications Department of Defense, (1997). Defense Reform Initiative: The Business Strategy for
Defense in the 21st Century. http://www.defenselink.mil. 15 January 2004. ----, (1988). Total Quality Master Plan. Washington. ----, (1995). ABC Guidebook: Guidebook for Using and Understanding Activity-Based
Costing. n. pag. http://www.defenselink.mil/nii/bpr/bprcd/0201.htm. 17 November 2003.
Dulworth, M. & Usilaner, B.L. (1986). “Productivity Improvement in the Federal
Government: An Emerging Reality?” The GAO Review, Fall 1986. pp. 26 – 29. Eisenhardt, K.M. “Building Theories from Case Study Research,” Academy of
Management Review, 14: 532-550 (1989).
Fairley, J. (2000). “What to do with the “losers”: Better read this before you cut off any unprofitable customers, or you could end up as the loser” ABA Banking Journal, October, pp. 29 – 36
Gabor, A. (1990). The Man Who Discovered Quality. New York, NY: Times Books Gansler, J.S., Under Secretary of Defense. Memorandum of Defense-Wide
Implementation of Activity Based Management. 9 July 1999. Glaser, B. G. (1992). Basics of Grounded Theory Analysis: Emergence vs. Forcing. Mill
Valley, CA: Sociology Press Glaser, B. G., & Strauss, A. L. (1967). The Discovery of Grounded Theory: Strategies
for Qualitative Research. Chicago, IL: Aldine Goldberg, J. S. & Cole, B.R., (2002). “Quality Management in Education: Building
Excellence and Equity in Student Performance.” The Quality Management Journal, Vol 9, No. 4, pp. 8 – 22.
Goldsberry, C., (2003). “Strategic Moves for Troubled Times: Firing Unprofitable
Customers.” Injection Molding Magazine, n. pag., http://www.immnet.com/articles?article=2124. 22 October 2003.
110
Goldsmith, S. (1997). “Can Business Really Do Business With Government?” Harvard Business Review, May-June 1997, pp. 110 - 121
Gray, S.W. (2000). Factors That Affect Success in Implementing Activity-Based Cost
Management in a Government Organization: A Comparative Case Study Analysis. MS thesis. Naval Post Graduate School. Monterey, CA.
Hartfeil, G. (1996) “Bank One Measures Profitability of Customers, not Just Products”
Journal of Retail Banking Services, summer XVIII (2), pp. 23 – 29. Heskett JL, Sasser WE & Schlesinger LA, (1997). The Service Profit Chain
The Free Press: New York Howell, R.A. and Soucy, S.R. (1990). “Customer Profitability: As Critical As Product
Profitability” Management Accounting, October, pp. 43 – 47. Irani, Z., Choudrie, J., Love, P.E.D., Gunasekaran, A. (2002). “Sustaining TQM Through
Self-Directed Work Teams.” The International Journal of Quality & Reliability Management, Vol. 19, No. 5, pp. 596 – 609.
Jones TO & Sasser WE, (1995). “Why Satisfied Customers Defect” Harvard Business
Review, November-December, 88-99 Juran, J. M. (1995). Managerial Breakthrough (2nd Edition). New York, NY: McGraw
Hill Inc. Kamakura, W.A., (2003). “Acquiring, Developing and Retaining Profitable Customers
with Analytical CRM.” Unpublished briefing. Delivered at Expo Management Conference, Mexico, June 2003. http://www.teradataduke.org/ApplicationFiles/web/WebWYSIWYGPage.cfm?web_page._id=82. 18 December 2003.
Kellen, V. (2002). “CRM Measurement Frameworks.” Unpublished article. n. pag.
http://www.kellen.net/crmmeas.htm. 22 October 2003. Kelly, D.L., (1997). Quality Improvement at the Defense Equal Opportunity
Management Institute. DEOMI Research Series Publication 97-10, Patrick AFB, FL.
La Londe, B. and Ginter, J. (1999). “A Summary of Activity-Based Costing Best
Practices” The Supply Chain Management Research Group; Marketing Department, Max M. Fisher College of Business, Ohio State University
Labovitz, G., Chang, Y.S., Rosansky, V. (1993). Managing Quality Work: A Leadership
Guide for the Results-Driven Manager. New York, NY: Harper Collins
111
LeBrasseur, R., Whissell, R., Ojha, A. (2002). “Organisational Learning, Transformational Leadership and Implementation of Continuous Quality Improvement in Canadian Hospitals.” Australian Journal of Management, Vol. 27, No. 2, December, pp. 141 – 163.
Leedy, P.D. and Ormand, J.E. (2001). Practical Research: planning and design (7th
Edition). Upper Saddle River, NJ: Prentice-Hall Inc. Mani, B. G., (1996). “TQM Management Development in Public Agencies Using the
Myers-Briggs Type Indicator and the Adjective Checklist.” Review of Public Personnel Administration, Fall 1996, pp. 79 – 96.
Marshall, C. and Rossman, G.B. (1989). Designing qualitative research. Newbury Park,
CA: Sage Publications McConnell, C.R. & Brue, S.L. (1996). Economics – Principles, Problems, and Policies.
13th Ed. New York, NY: McGraw-Hill Inc. Meredith, J., (1998). Building operations management theory through case and field
research. Journal of Operations Management, Vol. 16, 441–454 Moore, K.R., (2000). Using Activity-Based Costing to Improve Performance: A Case
Study Report. Research report. Air Command and Staff College. Maxwell AFB, AL.
Morse, J. M., Barrett, M., Mayan, M., Olson, K., & Spiers, J. (2002). Verification
strategies for establishing reliability and validity in qualitative research. International Journal of Qualitative Methods 1 (2), Article 2. http://www.ualberta.ca/~ijqm/. 15 Feb 2004.
Nelson, K. (2001). “Analytical Approach Pays Off For Credit Union.” Bank Systems &
Technology, July, 42 Niece, J.A. & Scribner, V.L. (1996). The Implementation of an Enhanced Activity-Based
Costing Model at the Defense Supply Center Columbus. MS thesis. Air Force Institute of Technology, Wright-Patterson AFB, OH.
Niraj, R, Gupta, M., Chakravarthi, N. (2001). “Customer Profitability in a Supply Chain”
Journal of Marketing, July, pp. 1 – 16. Noone, B. M., Kimes, S. E., Renaghan, L. M. (2003). “Integrating Customer Relationship
Management and Revenue Management: A Hotel Perspective.” Journal of Revenue and Pricing Management, Vol. 2, No. 1, pp. 7 - 21
112
Oi, T. & Singh, S., (2003). “Customer Relationship Management: Improving Organizational Unity with a Single View of the Customer.” Unpublished article. http://www.bearingpoint.com/library/pdfs/Single_View_of_the_Customer_Whitepaper.pdf. 18 December 2003.
Pelczynski, A.S. (1995). An Analysis of the Total Quality Management Practices of the
Contractors Supporting the Apache Helicopter Program. MS thesis. Naval Post Graduate School, Monterey, CA.
Peppers D. & Rogers M., (1997). Enterprise One to One. New York, NY: Doubleday Petrison LA, Blattberg RC & Wang P, (1993). “Database Marketing: Past, Present, and
Future” Journal of Direct Marketing, Vol. 7, No. 3, Summer, 27-43 Petro, T.M. (1990), “Profitability the 5th ‘p’ of Marketing”, Bank Marketing, September,
pp. 48– 52. Pohlen, T. L. & La Londe, B. J., (1994). “Implementing activity-based costing (ABC) in
logistics” Journal of Business Logistics, Vol 15, No. 2, 1-23. Rago, W. V., (1996). “Struggles in Transformation: A Study in TQM, Leadership, and
Organizational Culture in a Government Agency.” Public Administration Review, May/Jun, pp. 227 – 234.
Reichebacher, T. (2003). “The Art of Customer Profitability Analysis.” Destination
CRM, http://www.destinationcrm.com/articles/default.asp?articleid=3038. 22 October 2003.
Reichheld F.F. & Sasser W.E., (1990). “Zero Defections: Quality Comes to Services”
Harvard Business Review, September-October, 105-111 Reichhield, F.F. (1993) “Loyalty-Based Management” Harvard Business Review,
March – April, pp. 64 – 73. Reichheld F.F., (1996). The Loyalty Effect, Harvard Business School Press, Boston,
Massachusetts Rigby, D.K., Reichheld, F.F., Schefter, P. (2002). “Avoid the Four Perils of CRM.”
Harvard Business Review, February 2002, pp. 101 – 109. Rumsfeld, D.H. (2001). DOD Acquisition and Logistics Excellence Week Kickoff—
Bureaucracy to Battlefield Remarks as Delivered by Secretary of Defense. http://www.defenselink.mil/speeches/2001/s20010910-secdef.html. 14 January 2004.
113
Rust RT, Zahorik A.J. & Keiningham T.L., (1996). Service Marketing. HarperCollins: New York
Schmerken, I. (2003). “Earning a Payback on CRM: Smaller Projects, More Homework,”
Wall Street & Technology, September, 12 - 16 Shapiro, B.P., Rangan, V.K., Moriarty, R.T. and Ross, E.B. (1987) “Manage Customers
for Profits (Not Just Sales)” Harvard Business Review, September – October, pp. 101 – 108.
Shenn, J. (2003). “How Nat City Improved Data Management.” American Banker;
October, Vol. 168, Issue 200, p 4 Slywotsky AJ & Shapiro BP, (1993). “Leveraging to Beat the Odds: The New Marketing
Mind-Set” Harvard Business Review, September-October, 97-107 Springs, B.E. (1998). Contemporary Quality Leadership Principles: Do They Fit the Air
Force Model? Research report. Air Command and Staff College. Maxwell AFB, AL.
Stake, R.E. (2000). Case Studies. In N.K. Denzin and Y.S. Lincoln (Eds.), Handbook of
Qualitative Research (2nd Edition) (pp. 435-454). Thousand Oaks, CA: Sage Publications
Social Security Administration. (2000). “Gathering and Using Customer Information to
Improve Service to the Public.” Unpublished report. http://www.ssa.gov/reports/customer/. 15 January 2004.
Söderlund, M. & Vilgon, M. (1999). “Customer Satisfaction and Links to Customer
Profitability: An Empirical Examination of the Association Between Attitudes and Behavior” SSE/EFI Working Paper Series in Business Administration No. 1999:1 January 1999
Strauss, A.L., and Corbin, J.M. (1990). Basics of qualitative research: grounded theory
procedures and techniques. Newbury Park, CA: Sage Publications Swift, R.S. (2002). “The New Economic Opportunity for Business – Creating Increased
Profitability through CRM.” Defying the Limits, July 2002, pp. 38 - 42 Thomerson, L. D., (2001). “Journey for Excellence: Kentucky's Commonwealth Health
Corporation Adopts Six Sigma Approach.” Quality Congress. ASQ's ... Annual Quality Congress Proceedings, pp. 152 – 158.
114
Ulfelder, S. (2001). “How to Keep the Citizens Satisfied.” CIO Magazine. 15 November. “United States Marine Corps Base at Twentynine Palms.” Excerpt from an unpublished
article. n. pag. http://www.kpmgconsulting.com. 15 January 2004. unknown (2002). “Boosting the Bottom Line With CRM.” MHS, Fall 2002, pp. 39 - 40 Wang P & Splegel T, (1994). “Database Marketing and Its Measurements of Success”
Journal of Direct Marketing, Vol. 8, No. 2, Spring, 73-84 Wayland R.E. & Cole P.M., (1997). Customer Connections: New Strategies for Growth,
Harvard Business School Press: Boston, Massachusetts Whiting, R. & Sweat, J. (1999). “Profitable Customers.” InformationWeek, March 1999,
pp. 44 – 56. Wrona, J.M. & Memminger, M., (1999). Implementation of an Activity-Based Costing
System in an Air Force Laboratory Envirnoment. MS thesis. Air Force Institue of Technology, Wright-Patterson AFB, OH.
Yin, R.K. (2003). Case Study Research: Design and Methods (3rd Edition). Thousand
Oaks, CA: Sage Publications. Zaino, J. & Marlin, S. (2003). “Fleet Sees Payoff in CRM,” InformationWeek, August, 47 Zaman, M. (2002). “Lifetime Customer Profitability Analysis Model (LCPAM): A Case
Study of Retail Bank in Australia and a comparative study with US Retail Banks. Central Queensland University: Australia
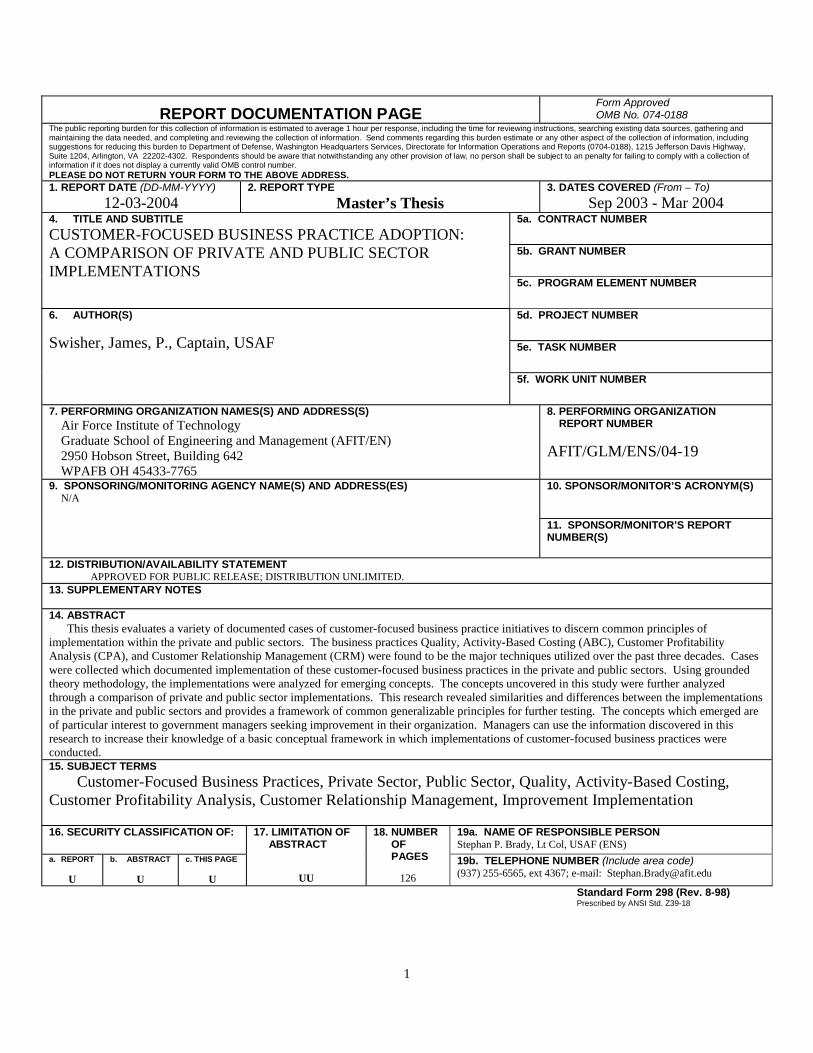
1
REPORT DOCUMENTATION PAGE Form Approved OMB No. 074-0188
The public reporting burden for this collection of information is estimated to average 1 hour per response, including the time for reviewing instructions, searching existing data sources, gathering and maintaining the data needed, and completing and reviewing the collection of information. Send comments regarding this burden estimate or any other aspect of the collection of information, including suggestions for reducing this burden to Department of Defense, Washington Headquarters Services, Directorate for Information Operations and Reports (0704-0188), 1215 Jefferson Davis Highway, Suite 1204, Arlington, VA 22202-4302. Respondents should be aware that notwithstanding any other provision of law, no person shall be subject to an penalty for failing to comply with a collection of information if it does not display a currently valid OMB control number. PLEASE DO NOT RETURN YOUR FORM TO THE ABOVE ADDRESS. 1. REPORT DATE (DD-MM-YYYY)
12-03-2004 2. REPORT TYPE
Master’s Thesis 3. DATES COVERED (From – To)
Sep 2003 - Mar 2004 5a. CONTRACT NUMBER
5b. GRANT NUMBER
4. TITLE AND SUBTITLE
CUSTOMER-FOCUSED BUSINESS PRACTICE ADOPTION: A COMPARISON OF PRIVATE AND PUBLIC SECTOR IMPLEMENTATIONS 5c. PROGRAM ELEMENT NUMBER
5d. PROJECT NUMBER
5e. TASK NUMBER
6. AUTHOR(S)
Swisher, James, P., Captain, USAF
5f. WORK UNIT NUMBER
7. PERFORMING ORGANIZATION NAMES(S) AND ADDRESS(S) Air Force Institute of Technology Graduate School of Engineering and Management (AFIT/EN) 2950 Hobson Street, Building 642 WPAFB OH 45433-7765
8. PERFORMING ORGANIZATION REPORT NUMBER
AFIT/GLM/ENS/04-19
10. SPONSOR/MONITOR’S ACRONYM(S)
9. SPONSORING/MONITORING AGENCY NAME(S) AND ADDRESS(ES) N/A
11. SPONSOR/MONITOR’S REPORT NUMBER(S)
12. DISTRIBUTION/AVAILABILITY STATEMENT APPROVED FOR PUBLIC RELEASE; DISTRIBUTION UNLIMITED. 13. SUPPLEMENTARY NOTES 14. ABSTRACT This thesis evaluates a variety of documented cases of customer-focused business practice initiatives to discern common principles of implementation within the private and public sectors. The business practices Quality, Activity-Based Costing (ABC), Customer Profitability Analysis (CPA), and Customer Relationship Management (CRM) were found to be the major techniques utilized over the past three decades. Cases were collected which documented implementation of these customer-focused business practices in the private and public sectors. Using grounded theory methodology, the implementations were analyzed for emerging concepts. The concepts uncovered in this study were further analyzed through a comparison of private and public sector implementations. This research revealed similarities and differences between the implementations in the private and public sectors and provides a framework of common generalizable principles for further testing. The concepts which emerged are of particular interest to government managers seeking improvement in their organization. Managers can use the information discovered in this research to increase their knowledge of a basic conceptual framework in which implementations of customer-focused business practices were conducted. 15. SUBJECT TERMS
Customer-Focused Business Practices, Private Sector, Public Sector, Quality, Activity-Based Costing, Customer Profitability Analysis, Customer Relationship Management, Improvement Implementation
16. SECURITY CLASSIFICATION OF: 19a. NAME OF RESPONSIBLE PERSON Stephan P. Brady, Lt Col, USAF (ENS)
a. REPORT
U
b. ABSTRACT
U
c. THIS PAGE
U
17. LIMITATION OF ABSTRACT
UU
18. NUMBER OF PAGES
126
19b. TELEPHONE NUMBER (Include area code) (937) 255-6565, ext 4367; e-mail: [email protected]
Standard Form 298 (Rev. 8-98) Prescribed by ANSI Std. Z39-18