AIR FORCE INSTITUTE OF TECHNOLOGY - dtic.mil · Degree of Master of Science (Computer ......
80
Network Visualization Design using Prefuse Visualization Toolkit THESIS J. Mark Belue, Captain, USAF AFIT/GCS/ENG/08-03 DEPARTMENT OF THE AIR FORCE AIR UNIVERSITY AIR FORCE INSTITUTE OF TECHNOLOGY Wright-Patterson Air Force Base, Ohio APPROVED FOR PUBLIC RELEASE; DISTRIBUTION UNLIMITED.
Transcript of AIR FORCE INSTITUTE OF TECHNOLOGY - dtic.mil · Degree of Master of Science (Computer ......

Network Visualization Design
using
Prefuse Visualization Toolkit
THESIS
J. Mark Belue, Captain, USAF
AFIT/GCS/ENG/08-03
DEPARTMENT OF THE AIR FORCEAIR UNIVERSITY
AIR FORCE INSTITUTE OF TECHNOLOGY
Wright-Patterson Air Force Base, Ohio
APPROVED FOR PUBLIC RELEASE; DISTRIBUTION UNLIMITED.

The views expressed in this thesis are those of the author and do not reflect the officialpolicy of the United States Air Force, Department of Defense, or the United StatesGovernment.
AFIT/GCS/ENG/08-03
Network Visualization Design
using
Prefuse Visualization Toolkit
THESIS
Presented to the Faculty
Department of Electrical and Computer Engineering
Graduate School of Engineering and Management
Air Force Institute of Technology
Air University
Air Education and Training Command
In Partial Fulfillment of the Requirements for the
Degree of Master of Science (Computer Science)
J. Mark Belue, BS
Captain, USAF
March 2008
APPROVED FOR PUBLIC RELEASE; DISTRIBUTION UNLIMITED.

AFIT/GCS/ENG/08-03
Network Visualization Design
using
Prefuse Visualization Toolkit
J. Mark Belue, BS
Captain, USAF
Approved:
/signed/ 22 Feb 2008
Lt Col Stuart Kurkowski, PhD(Chairman)
Date
/signed/ 22 Feb 2008
Dr. Kenneth M. Hopkinson (Member) Date
/signed/ 22 Feb 2008
Capt Ryan W. Thomas, PhD (Member) Date

AFIT/GCS/ENG/08-03
Abstract
Visualization of network simulation events or network visualization is an ef-
fective and low cost method to evaluate the health and status of a network and
analyze network designs, protocols, and network algorithms. This research designed
and developed a network event visualization framework using an open source general
visualization toolkit. This research achieved three major milestones during the de-
velopment of this framework: A robust network simulator trace file parser, multiple
network visualization layouts–including user-defined layouts, and precise visualization
timing controls and integrated display of network statistics. The parser architecture is
extensible to allow customization of simulator trace formats that are accepted by the
visualization framework. This design makes the framework capable of accepting trace
files from different network simulators and provides one common visualization testbed
to study network scenarios run on different simulators. Multiple network visualization
layouts are made possible using the prefuse visualization toolkit Layout class which
provides many different visualization layouts and is easily extensible to create new
Layout subclasses. Finally, precise timing controls give users better control for quicker
navigation to specific network events at any time. The toolkit design is readily ex-
tensible allowing developers to easily expand the framework to meet research-specific
visualization goals.
iv

Acknowledgements
I would first like to thank Josh Abernathy from Cedarville college for his contributions
towards building the network visualization framework and his extensive knowledge of
prefuse. Also my wife for her help and support and my lab mates who kept me sane
during the long hours of writing and coding. Finally, I would like to acknowledge
the great effort of my thesis advisor Lt Col Kurkowski who helped me organize my
writing and kept me believing all things were possible.
J. Mark Belue
v

Table of ContentsPage
Abstract . . . . . . . . . . . . . . . . . . . . . . . . . . . . . . . . . . . . . iv
Acknowledgements . . . . . . . . . . . . . . . . . . . . . . . . . . . . . . . v
List of Figures . . . . . . . . . . . . . . . . . . . . . . . . . . . . . . . . . viii
I. Introduction . . . . . . . . . . . . . . . . . . . . . . . . . . . . . 1
II. Network Simulation and Visualization . . . . . . . . . . . . . . . 42.1 Network Simulator Visualizations . . . . . . . . . . . . . 5
2.1.1 Nam . . . . . . . . . . . . . . . . . . . . . . . . 52.1.2 iNSpect . . . . . . . . . . . . . . . . . . . . . . 6
2.1.3 GTNets . . . . . . . . . . . . . . . . . . . . . . 82.1.4 OPNET . . . . . . . . . . . . . . . . . . . . . . 92.1.5 Discussion . . . . . . . . . . . . . . . . . . . . . 10
2.2 Visualization Toolkits . . . . . . . . . . . . . . . . . . . 102.2.1 GUESS . . . . . . . . . . . . . . . . . . . . . . 112.2.2 Osprey . . . . . . . . . . . . . . . . . . . . . . . 11
2.2.3 Qt . . . . . . . . . . . . . . . . . . . . . . . . . 12
2.2.4 Piccolo . . . . . . . . . . . . . . . . . . . . . . . 132.2.5 Prefuse . . . . . . . . . . . . . . . . . . . . . . 152.2.6 Discussion . . . . . . . . . . . . . . . . . . . . . 16
III. Visualization Framework Design and Implementation . . . . . . . 19
3.1 Network Trace File . . . . . . . . . . . . . . . . . . . . . 203.2 Trace File Parser . . . . . . . . . . . . . . . . . . . . . . 20
3.2.1 Initial Design . . . . . . . . . . . . . . . . . . . 21
3.2.2 Initial Design Problems . . . . . . . . . . . . . . 23
3.2.3 Final Design and Implementation . . . . . . . . 25
3.3 Network Event Animation . . . . . . . . . . . . . . . . . 263.3.1 Wired Networks . . . . . . . . . . . . . . . . . . 263.3.2 Wireless Networks . . . . . . . . . . . . . . . . 28
3.4 Visualization / Simulator Interaction . . . . . . . . . . . 33
3.5 Code Refactoring . . . . . . . . . . . . . . . . . . . . . . 34
3.5.1 Extract Class [9] . . . . . . . . . . . . . . . . . 34
3.5.2 Replace Conditional with Polymorphism [9] . . 35
3.5.3 Extract Hierarchy [9] . . . . . . . . . . . . . . . 35
3.6 Discussion . . . . . . . . . . . . . . . . . . . . . . . . . . 36
vi

Page
IV. A Network Visualization Framework for Network Event Observa-tion and Analysis . . . . . . . . . . . . . . . . . . . . . . . . . . . 37
4.1 Robust Parser Architecture . . . . . . . . . . . . . . . . 374.2 Multi-objective Dynamic Network Topology Layout . . . 40
4.2.1 Physical and Virtual Network Layout Design . . 42
4.2.2 Virtual Network Layout Example I: Wireless Net-work Broadcast . . . . . . . . . . . . . . . . . . 43
4.2.3 Virtual Network Layout Example II: Wired Net-work Link Break . . . . . . . . . . . . . . . . . 45
4.2.4 Discussion . . . . . . . . . . . . . . . . . . . . . 454.3 Analysis-based User Interface . . . . . . . . . . . . . . . 47
4.4 Testing and Validating the Visualization Framework . . 48
4.4.1 Wired packet queueing . . . . . . . . . . . . . . 49
4.4.2 Wireless node movement . . . . . . . . . . . . . 494.4.3 Wireless and wired network topology packet trace 53
4.5 Discussion . . . . . . . . . . . . . . . . . . . . . . . . . . 53
V. Contributions and Future Work . . . . . . . . . . . . . . . . . . 565.1 Contributions . . . . . . . . . . . . . . . . . . . . . . . . 56
5.1.1 Robust Framework Trace Parser . . . . . . . . . 565.1.2 Extensible Visualization Layout . . . . . . . . . 56
5.1.3 User Interface . . . . . . . . . . . . . . . . . . . 575.2 Future Work . . . . . . . . . . . . . . . . . . . . . . . . 58
5.2.1 Parser Enhancements . . . . . . . . . . . . . . . 585.2.2 Layout Enhancements . . . . . . . . . . . . . . 58
5.2.3 Network Simulator Interaction . . . . . . . . . . 615.2.4 Discussion . . . . . . . . . . . . . . . . . . . . . 62
5.3 Conclusion . . . . . . . . . . . . . . . . . . . . . . . . . 63
Bibliography . . . . . . . . . . . . . . . . . . . . . . . . . . . . . . . . . . 64
vii
List of FiguresFigure Page
2.1 Nam Visualization . . . . . . . . . . . . . . . . . . . . . . . . . 6
2.2 iNSpect visualization highlighting packet routing nodes: source
(blue), intermediate (yellow), destination (red or green) . . . . 7
2.3 GTNets visualizer showing wireless broadcast rings [39] . . . . 8
2.4 Modest GTNetS execution time increases as network scenarios
increase in size [33] . . . . . . . . . . . . . . . . . . . . . . . . . 9
2.5 Multiple wireless nodes and wireless packets in OPNET network
(broadcast range shown with large outer circles) . . . . . . . . 9
2.6 GUESS visualization illustrating command window, grouping,
and graph layout [1] . . . . . . . . . . . . . . . . . . . . . . . . 11
2.7 (a) Original graph visualization (b) resultant visualization after
text query [4] . . . . . . . . . . . . . . . . . . . . . . . . . . . . 12
2.8 Examples of Qt in Julius framework and Ball modelar . . . . . 13
2.9 PNode class hierarchy showing monolithic Piccolo toolkit design
[3] . . . . . . . . . . . . . . . . . . . . . . . . . . . . . . . . . . 14
2.10 Interactive graph expanded when users click on an entry [28] . 15
2.11 Interactive grid layout (called fisheye) where users click on a cell
to reveal more detailed information [3] . . . . . . . . . . . . . . 15
2.12 Prefuse toolkit with Model, View, and Controller highlighted 16
2.13 Prefuse TupleSet Hierarchy: Shows how prefuse organizes
collections of visual and data objects used to create a visualization 17
2.14 Prefuse Tuple Hierarchy: Shows how prefuse organizes indi-
vidual pieces of visualization data . . . . . . . . . . . . . . . . 17
3.1 The prefuse visualization toolkit. Lists of composable actions
filter abstract data into visualizable content and assign visual
properties (position, color, size, font, etc). Renderer modules,
provided on a per-item basis by a RendererFactory, draw the
VisualItem to construct interactive Displays. User interaction
can then trigger changes at any point in the toolkit [18]. . . . . 19
viii

Figure Page
3.2 NS-2 trace samples, showing two formats highlighting the differ-
ing locations of time and other tags . . . . . . . . . . . . . . . 20
3.3 Data Column Pattern . . . . . . . . . . . . . . . . . . . . . . . 22
3.4 Extension of prefuse DataParser and ParserFactory into net-
work visualization specific parsers and parser factories . . . . . 23
3.5 Creation of network visualization specific parsers ImageParser,
BandwidthParser, and IDParser . . . . . . . . . . . . . . . . . 24
3.6 Initial Parser Design . . . . . . . . . . . . . . . . . . . . . . . . 25
3.7 Final Parser Design . . . . . . . . . . . . . . . . . . . . . . . . 26
3.8 Network Event Animation Design . . . . . . . . . . . . . . . . 27
3.9 Network Event Animation Screen shot . . . . . . . . . . . . . . 28
3.10 Node events inside a NS-2 trace for three different nodes initially
no node movement defined, but later node movement is specifi-
cally defined by the -u (x-coordinate velocity), -v (y-coordinate
velocity), -T (duration of movement) tags. layer . . . . . . . . 30
3.11 NodeParser parses node event trace lines and updates data fields
inside NodeMobilityManager. NodeLayout then accesses a set of
MobilityEntry objects inside NodeMobilityManagerto correctly
animate node movement. . . . . . . . . . . . . . . . . . . . . . 31
3.12 Wireless traces of four unique packetIDs . . . . . . . . . . . . . 32
3.13 Data Structure design for wireless traffic Map. The map stores
routes for wireless packets from source to destination for later
visualization . . . . . . . . . . . . . . . . . . . . . . . . . . . . 33
3.14 Conditional Chain Example . . . . . . . . . . . . . . . . . . . . 35
4.1 Trace created by OPNET toolkit. Highlighted are the packet
event lines beginning with ’p’ and using the ’-e’ tag to denote a
send, receive, queue or drop packet event. Also, this trace uses
the ’-z’ tag to denote packet size. . . . . . . . . . . . . . . . . . 38
4.2 Framework visualization of OPNET simulation . . . . . . . . . 39
4.3 NamLine and OpNetLine subclass TraceLine. OpNetLine adds
functionality to TraceLine with new methods and method overrides–
allows TraceLine to handle network events in OPNET trace file. 40
ix
Figure Page
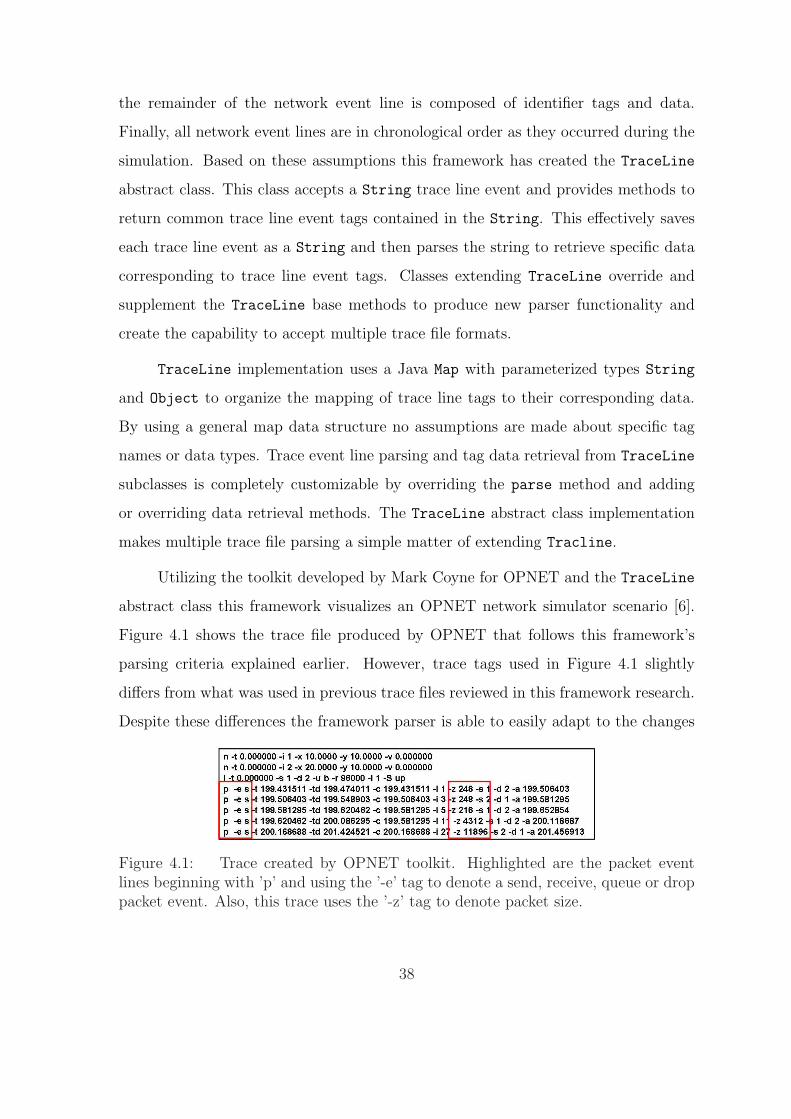
4.4 Layers of cyberspace situational awareness: This framework pro-
vides network architecture (physical and virtual) layers . . . . . 41
4.5 GeographicLayout and GroupedLayout class hierarchy. The
GeographicLayout and GroupedLayout classes extend Layout
and Activity to create customized visualization animation . . 42
4.6 NS-2 trace directing wireless broadcast from node 1 to nodes: 14,
6, 47, 40, 36, 12. As shown in Figure 4.7 . . . . . . . . . . . . . 43
4.7 Wireless packet broadcast using combination of force-directed
and grouped layout . . . . . . . . . . . . . . . . . . . . . . . . 44
4.8 Wired Network showing network topology animation in response
link status changes from up to down . . . . . . . . . . . . . . . 46
4.9 Prefuse visualization architecture for handling various visual-
ization control capabilities. SuperFocusControl is a new visual-
ization control added by this framework to custimize how focus
changes when users click on the visualization background. . . . 48
4.10 Network Visualization framework user-interface with visualiza-
tion controls highlighted . . . . . . . . . . . . . . . . . . . . . . 49
4.11 NS-2 trace file lines accounting for Figure 4.12 . . . . . . . . . 50
4.12 Nam and this framework’s visualization of wired packet traffic
with both visualizations paused at the same time . . . . . . . . 50
4.13 This visualization framework node movement animation com-
pared to Nam . . . . . . . . . . . . . . . . . . . . . . . . . . . 51
4.14 This visualization framework node movement animation com-
pared to Nam (cont) . . . . . . . . . . . . . . . . . . . . . . . . 52
4.15 Wireless packet trace for wireless packet travelling from node 3
to 4 and finally node 2 . . . . . . . . . . . . . . . . . . . . . . . 53
4.16 This network visualization framework’s animation of wireless packet
moving from wireless node to wired network topology . . . . . 54
4.17 Nam’s network animation of wireless packet moving from wireless
node to wired network topology . . . . . . . . . . . . . . . . . 54
5.1 Potential real-world network scenario . . . . . . . . . . . . . . 59
x

Figure Page
5.2 Illustration of node statistics kept and displayed by this visual-
ization framework. . . . . . . . . . . . . . . . . . . . . . . . . . 60
5.3 Example of prefuse Action objects used to enlarge scrolled over
nodes and hight nodes sharing a link . . . . . . . . . . . . . . . 61
5.4 Diagram illustrating network simulator interaction goals. Di-
agram highlights feedback loop between Network Visualization
(this framework) and Network simulators via their respective
toolkits . . . . . . . . . . . . . . . . . . . . . . . . . . . . . . . 62
xi

Network Visualization Design
using
Prefuse Visualization Toolkit
I. Introduction
Throughout history, military operations have relied heavily on an accurate picture
of the battlespace. On land or at sea, early military operations used maps to
visualize ship locations, troop positions, and even different characteristics of the land.
Commanders used the maps to plan and carry out strategic strikes against enemy
positions. However, as time passed and technology improved so did the tools used to
create a picture of the battlespace. Sonar significantly improved the naval battlespace
picture by using sound waves to locate submarines buried deep in the sea, invisible to
the human eye. As military operations took to the skies, it was necessary to provide
an aerial battlespace picture. Technology aided this endeavor by combining radar
technology with a cathode-ray tube display to produce the first real-time picture of
airspace–the Plan Position Indicator [22]. This device oriented the radar signal source
at the center of the display with an extended line rotating around the signal source in
a sweeping motion. The radar display sweep was synchronized with the turning of the
physical radar scan. Aircraft detected by the physical radar scan appeared as lighted
dots on the display and their positions updated during each sweep. These early tools
filled the inherent need to see the battlespace picture visually and motivated future
battlespace visualization enhancements.
Military technology today has advanced beyond the early capabilities of maps,
sonar and radar. Today, commanders have battlespace pictures captured and trans-
ferred from around the world using different combinations of radar, sonar, GPS,
and satellite image systems. These tracking technologies are combined to produce
a battlespace visualization for land, sea, and air. However, bringing together a com-
1

prehensive visualization requires large and complex computer communication net-
works. Further increasing the demand for large communication networks, newly de-
veloped Unmanned Aerial Vehicles (UAVs) and Unmanned Combat Aerial Vehicles
(UCAVs) require networks with high capacity communication uplinks to fulfill their
missions [38]. Because UAVs/UCAVs rely heavily on computer communication net-
works to be successful, there is a greater requirement to monitor, design, and plan
these networks. Additionally, reliance on communication networks will only increase
as UAV/UCAV technology continues to expand and advance as the US and allies
develop new technologies like the Pegasus, X-45, Neuron and Phoenix [11].
Military networks continue to grow into a bigger part of the way we conduct war.
Future military in-theater communication will rely on mobile routers imbedded in a
variety of different places from devices carried by soldiers, to manned and unmanned
land, sea, and air based vehicles. Due to the mobile nature of these future networks,
connections between different nodes will sporadically be up and down. How networks
adapt to these changes is critical to overall network efficiency. Vital to guaranteeing
efficient network usage and effective command and control of military assets is a
central view of network events and activities.
Network visualization is crucial to understanding and effectively managing net-
work resources required during military land, sea, and air operations. Building a net-
work visualization framework capable of handling the large and complex computer,
and communication networks found today starts with a framework that can handle
simple network events. The easiest way to generate these simple network events is to
use the visualization framework to visualize network events from a network simulator.
However, many commonly used network simulators today already have accompanying
network visualization frameworks. Some of these visualization frameworks include:
Network Animator (Nam), interactive Network Simulator 2 protocol and environment
confirmation tool (iNSpect), Georgia Tech Network Simulator (GTNets) and the Op-
timized Network Evaluation Tools (OPNET). Although these visualizations illustrate
network events for their accompanying network simulator they motivate the develop-
2

ment of a new more universal visualization framework that provide better network
analysis tools. This research presents the design, implementation, and testing of a
new visualization framework to improve network visualization of wired, wireless, and
multi-hop wireless network scenarios and provide network analysis tools.
The new network visualization framework presented in this research extends the
widely used prefuse visualization toolkit [16]. A brief overview of different toolkits:
Guess, Osprey, Piccolo, Qt, and prefuse motivated the selection of prefuse as the
best suited for this framework. The new framework design provides trace file parsing
for trace files from Network Simulator-2 (NS-2). However, the framework includes a
file parser base class which users can easily extend or modify to create a trace file
parser for other network traces.
This research provides three major contributions with the new framework. First,
a trace file parser for NS-2 traces that is easily extensible to include traces in other
formats. Second, a multi-objective network topology visualization layout that can
also be easily extended to highlight specific user network behavior interests. Finally,
an analysis-based user interface to control the visualization. This research also tested
the network visualization framework functionality by comparing visualization output
to Nam.
The visualization framework provides: an easily extensible network trace parser
for accepting multiple trace file formats, multiple extensible network topology layouts,
and an analysis-based user interface. Future work will build upon the parser architec-
ture to handle different network trace formats from real-world networks. Additionally,
the flexible layout architecture will allow developers to customize the visualization to
commander preferences. The framework provides network event visualization with
the flexibility needed to visualize today’s large and complex networks.
3

II. Network Simulation and Visualization
Researchers use network simulator software suites to simulate network events.
To perform these simulations, users first choose a network simulator such as
Network Simulator-2 (NS-2), Optimized Network Evaluation Tools (OPNET), Geor-
gia Tech Network Simulator (GTNetS) Omnet++, or GloMoSim [5]. Second, they
create a network topology inside the simulator using the provided simulator interface.
Finally, they create a scenario for the simulator to run on the network topology. After
execution, the simulator provides a statistical report detailing how the network per-
formed during scenario execution. The simulator report is often lengthy, and locating
the pertinent information in the report can be difficult. Additionally, reports only
contain network performance statistics. It is very difficult to understand how the
network is working and evaluate network protocols without actually watching packet
routing. To eliminate the effort of finding information in reports and to facilitate
better network packet routing observation, researchers have developed software suites
to visualize network events run on a network simulator.
Visualization of network events is a crucial part of testing new network designs
and analyzing network efficiency. Network architects can design a network inside a
network simulator and then visualize how the network will perform under specific sce-
narios. A network visualization quickly reveals sources of network inefficiencies such
as: queuing delays, dropped packets, network congestion, and insufficient bandwidth.
Additionally, network visualizations provide protocol developers a powerful method
to quickly evaluate their protocols by visually analyzing network packet traffic. The
important role of network visualizations in designing networks and analyzing network
traffic warrants an evaluation of current network visualization suites
Network visualization suites include both separate programs designed to work
with a simulator and programs integrated into the network simulators. Four of these
visualization suites are: Nam, iNSpect, GTNetS, and OPNET. Nam visualizes net-
work events (packet flow, links, and queuing) on wired network topologies. The iN-
Spect program visualizes wireless-specific network events (packet hops, wireless node
4

links, and packet delivery success) [26]. Both Nam and iNSpect are network visual-
ization frameworks for NS-2. GTNets is a network simulator integrated with packet
level visualization and limited wireless support. OPNET shows network events for
both wired and wireless networks, but is a proprietary software platform for the OP-
NET simulator. Section 2.1 explores Nam, iNSpect, GTNetS, and OPNET in greater
detail.
The existence of several different visualizations and network simulators built
from the ground up for each simulator raises the questions: Can a single network
visualization framework be created to effectively visualize both wired and wireless
network simulator scenarios? What about network scenarios created in different
simulators (NS-2, OPNET, etc.)? This framework combines network simulator trace
data with a well-established visualization toolkit to create an efficient and robust
framework. This new visualization framework accurately animates network events
contained in a simulation trace file. A major decision during the design of the vi-
sualization frameowkr was selecting an existing visualization toolkit that encouraged
code reuse with loose coupling between the toolkit and the framework using it [13].
The analysis found in section 2.2 further discusses visualization toolkit selection.
2.1 Network Simulator Visualizations
2.1.1 Nam. When NS-2 executes a network scenario it produces a trace
file, containing network events that occurred during the scenario. Nam, a separate
program from NS-2, uses the NS-2 trace file to animate a visual representation of
the network events that occurred during the scenario. Combining NS-2 with Nam
users can define specific network scenarios and network events, run the scenarios in
NS-2, and then see the network events visualized as they are re-created in the Nam
window (see Figure 2.1(a)). Nam provides packet-level animation, protocol graphs,
traditional time-event plots of protocol actions and scenario editing capabilities to
NS-2 [7].
5
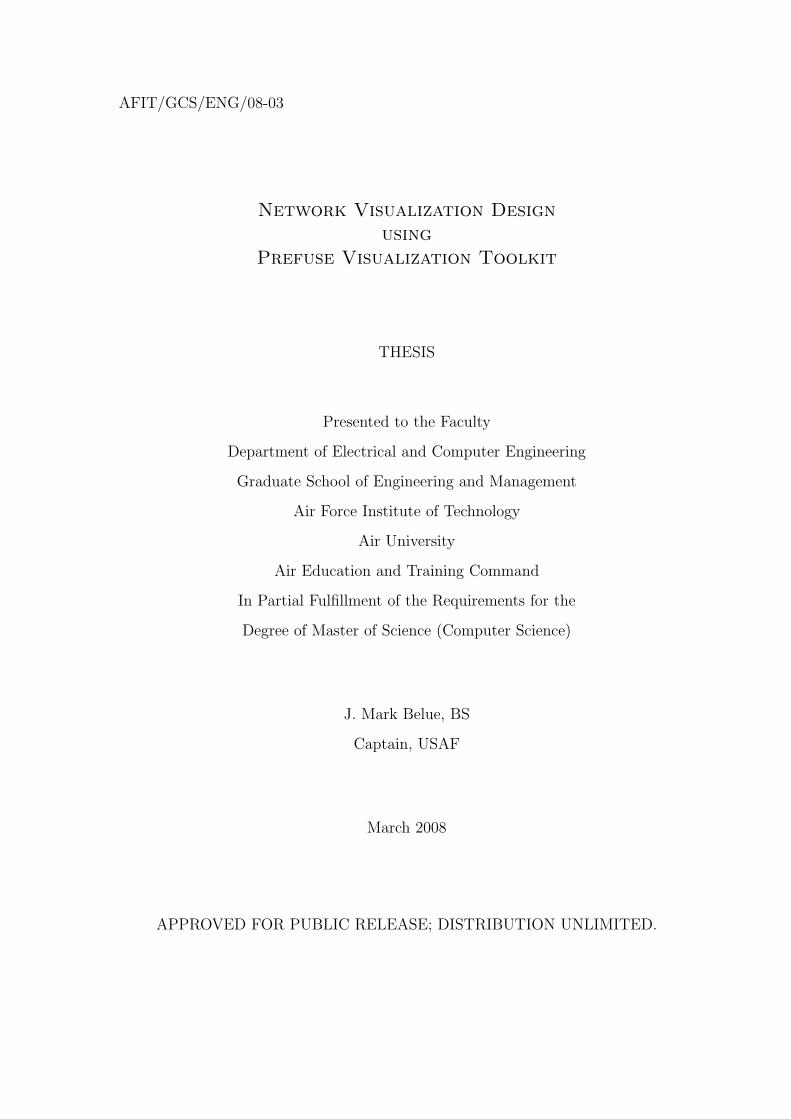
(a) Wired Network Nam Visualizationshowing packet traffic, queued packets,and dropped packets
(b) Wireless NetworkNam Visualization show-ing broadcast rings
Figure 2.1: Nam Visualization
Originally built to support wired network visualization Nam has limited wireless
network animation capabilities. Nam visualizes wireless traffic as broadcast rings
moving outward originating from the center of wireless nodes (see Figure 2.1(b)).
Nam allows user interaction with the simulator through the scenario input facility, but
is limited to setting up network scenarios. The scenario input facility uses traditional
drawing approaches to add nodes, links, and protocol agents [7]. This user interaction
is limited to activities prior to scenario execution; Nam does not allow user interaction
while a scenario is running and does not facilitate two-way communication between
the visualization and the simulator.
Nam provides a good baseline for wired network event animation. Packet rout-
ing, queueing, and dropping are all visible and easily recognized. Nam visualization
of these network events makes network and protocol evaluation possible. However
wireless network event visualization shortfalls in Nam have opened the door for new
visualization frameworks that provided better wireless network event visualization.
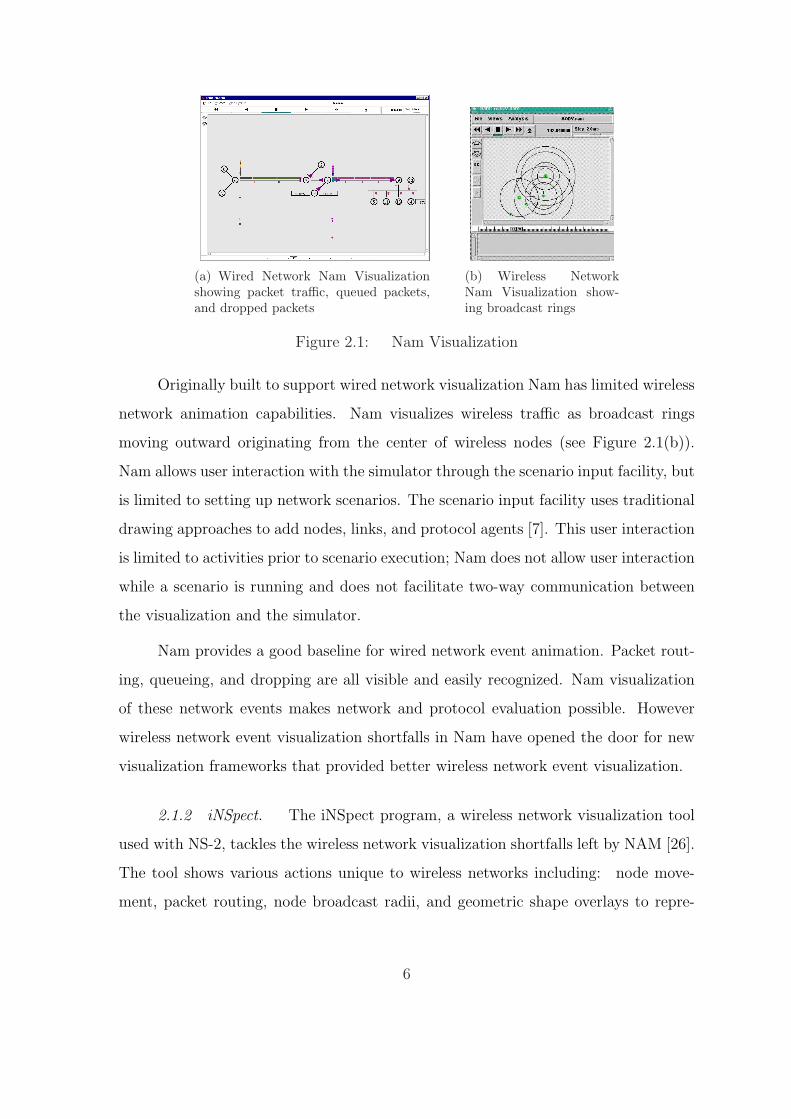
2.1.2 iNSpect. The iNSpect program, a wireless network visualization tool
used with NS-2, tackles the wireless network visualization shortfalls left by NAM [26].
The tool shows various actions unique to wireless networks including: node move-
ment, packet routing, node broadcast radii, and geometric shape overlays to repre-
6

sent physical boundaries. The iNSpect program accurately visualizes how packets are
routed through a wireless network by generating arrows to indicate packets moving
from one node to another and color coding nodes to indicate source (blue), destination
(red or green), and path nodes (yellow) (see Figure 2.2).
Figure 2.2: iNSpect visualization highlighting packet routing nodes: source (blue),intermediate (yellow), destination (red or green)
The iNSpect program is a definite improvement in wireless network event vi-
sualization over Nam. The program uses arrows and color coded nodes to highlight
packet routes which allows users to evaluate wireless network events and protocols.
However, illustrating packet transmission from one node to another with arrows is
less intuitive then simply animating packet movement between nodes. The iNSpect
program’s packet animation could be improved by showing packet traffic as it is shown
in wired network event animation, with small rectangles moving from node to node.
The program also requires NS-2 to produce larger trace files (almost a factor of 2)
than are required for Nam. A final drawback to the iNSpect program is that only
wireless network traffic is visualized. The iNSpect program’s visualization of wire-
less packet routing is a powerful tool, however, a framework that combines wireless
network traffic with intuitive network packet animation would be better.
7
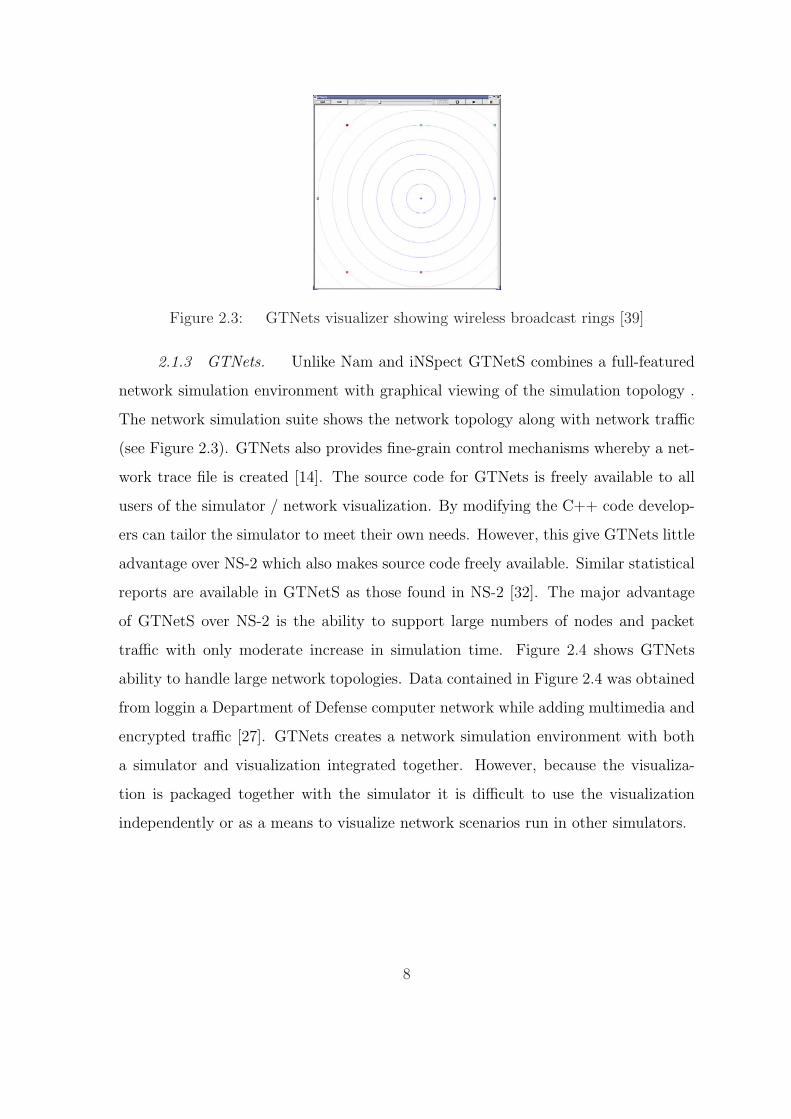
Figure 2.3: GTNets visualizer showing wireless broadcast rings [39]
2.1.3 GTNets. Unlike Nam and iNSpect GTNetS combines a full-featured
network simulation environment with graphical viewing of the simulation topology .
The network simulation suite shows the network topology along with network traffic
(see Figure 2.3). GTNets also provides fine-grain control mechanisms whereby a net-
work trace file is created [14]. The source code for GTNets is freely available to all
users of the simulator / network visualization. By modifying the C++ code develop-
ers can tailor the simulator to meet their own needs. However, this give GTNets little
advantage over NS-2 which also makes source code freely available. Similar statistical
reports are available in GTNetS as those found in NS-2 [32]. The major advantage
of GTNetS over NS-2 is the ability to support large numbers of nodes and packet
traffic with only moderate increase in simulation time. Figure 2.4 shows GTNets
ability to handle large network topologies. Data contained in Figure 2.4 was obtained
from loggin a Department of Defense computer network while adding multimedia and
encrypted traffic [27]. GTNets creates a network simulation environment with both
a simulator and visualization integrated together. However, because the visualiza-
tion is packaged together with the simulator it is difficult to use the visualization
independently or as a means to visualize network scenarios run in other simulators.
8
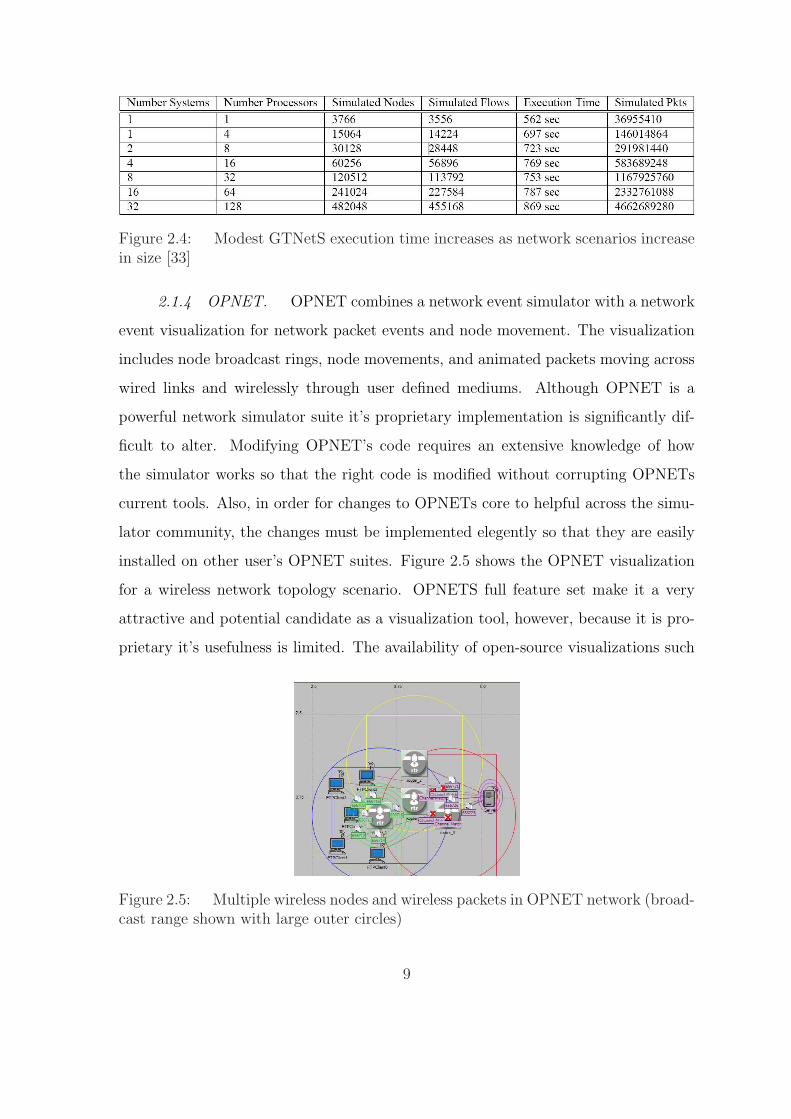
Figure 2.4: Modest GTNetS execution time increases as network scenarios increasein size [33]
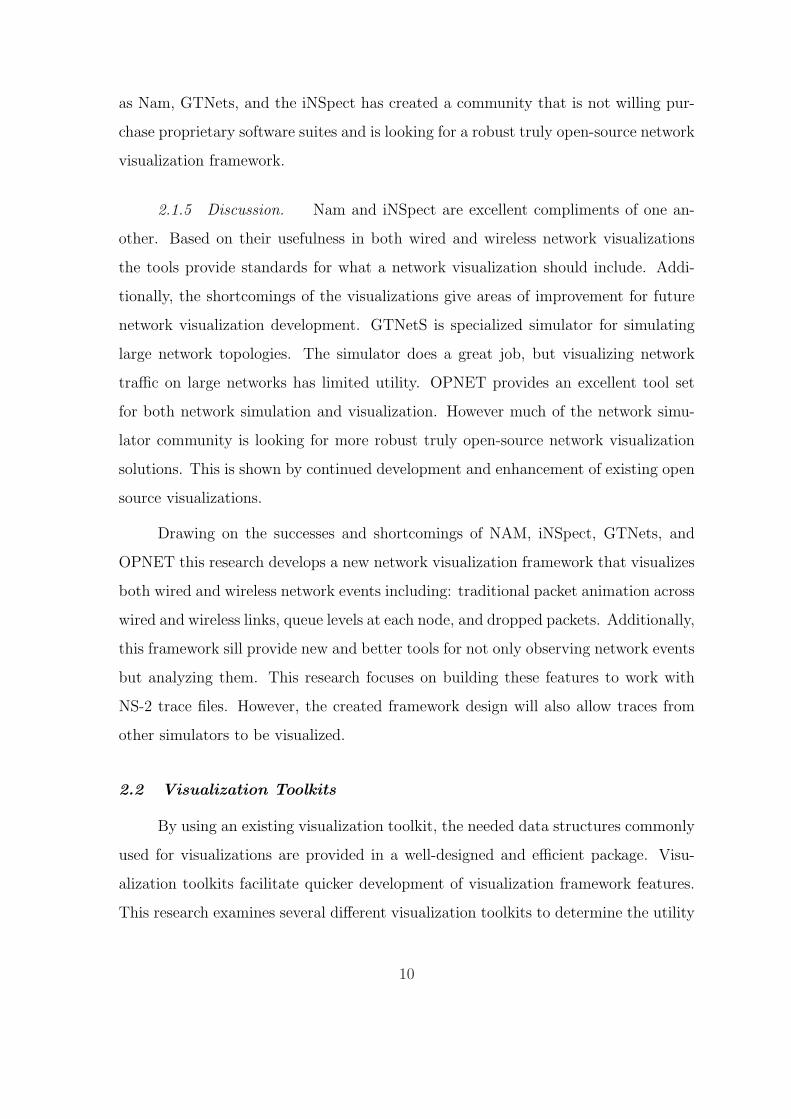
2.1.4 OPNET. OPNET combines a network event simulator with a network
event visualization for network packet events and node movement. The visualization
includes node broadcast rings, node movements, and animated packets moving across
wired links and wirelessly through user defined mediums. Although OPNET is a
powerful network simulator suite it’s proprietary implementation is significantly dif-
ficult to alter. Modifying OPNET’s code requires an extensive knowledge of how
the simulator works so that the right code is modified without corrupting OPNETs
current tools. Also, in order for changes to OPNETs core to helpful across the simu-
lator community, the changes must be implemented elegently so that they are easily
installed on other user’s OPNET suites. Figure 2.5 shows the OPNET visualization
for a wireless network topology scenario. OPNETS full feature set make it a very
attractive and potential candidate as a visualization tool, however, because it is pro-
prietary it’s usefulness is limited. The availability of open-source visualizations such
Figure 2.5: Multiple wireless nodes and wireless packets in OPNET network (broad-cast range shown with large outer circles)
9
as Nam, GTNets, and the iNSpect has created a community that is not willing pur-
chase proprietary software suites and is looking for a robust truly open-source network
visualization framework.
2.1.5 Discussion. Nam and iNSpect are excellent compliments of one an-
other. Based on their usefulness in both wired and wireless network visualizations
the tools provide standards for what a network visualization should include. Addi-
tionally, the shortcomings of the visualizations give areas of improvement for future
network visualization development. GTNetS is specialized simulator for simulating
large network topologies. The simulator does a great job, but visualizing network
traffic on large networks has limited utility. OPNET provides an excellent tool set
for both network simulation and visualization. However much of the network simu-
lator community is looking for more robust truly open-source network visualization
solutions. This is shown by continued development and enhancement of existing open
source visualizations.
Drawing on the successes and shortcomings of NAM, iNSpect, GTNets, and
OPNET this research develops a new network visualization framework that visualizes
both wired and wireless network events including: traditional packet animation across
wired and wireless links, queue levels at each node, and dropped packets. Additionally,
this framework sill provide new and better tools for not only observing network events
but analyzing them. This research focuses on building these features to work with
NS-2 trace files. However, the created framework design will also allow traces from
other simulators to be visualized.
2.2 Visualization Toolkits
By using an existing visualization toolkit, the needed data structures commonly
used for visualizations are provided in a well-designed and efficient package. Visu-
alization toolkits facilitate quicker development of visualization framework features.
This research examines several different visualization toolkits to determine the utility
10

for using them in the creation of a network visualization framework. The basis for
toolkit utility is a collection of visualization functions, data structures, and organized
animation logic that can be used and re-used by the visualization framework [13].
2.2.1 GUESS. The GUESS visualization toolkit highlights some specific
aspects of graph visualization. Using the toolkit in a visualization gives users different
ways to interact with a graph. In addition to the toolkit’s graph visualization window
GUESS provides a command window where text commands are entered using tailor-
made command language (see Figure 2.6). These commands form the GUESS toolkit’s
visualization functions. Some of these functions include: altering layouts, graph-
based clustering, and node coloring [1]. GUESS also uses underlying data structures
and graph clustering functions from the JUNG [23] library. This library provides
intuitive classes for both drawing and organizing graph nodes and links. GUESS
animation logic is limited to features like force-directed layouts, panning, zooming,
and modifying highlights/grouping. No underlying animation logic is available where
actions can be defined by users to produce custom animations.
Figure 2.6: GUESS visualization illustrating command window, grouping, andgraph layout [1]
2.2.2 Osprey. The Osprey visualization toolkit is used to build graphical
representations of gene relationships [4]. The toolkit uses Java Standard Develop-
ment Kit, but does not build on any known helper libraries. Because gene data sets
11

can be quite large Osprey implements a text query feature which alters visualiza-
tions based on query results (see Figure 2.7). In addition to queries Osprey defines
numerous specific layout types to better organize data [30]. Research revealed little
about how Osprey organizes data structures internally; however, this could be in part
because the toolkit kit is proprietary and intimately connected with the BIOGrid [36]
database. Osprey references the database for gene interaction data to render visual-
izations. Animations in Osprey are limited to mouse-over pop-up windows and layout
modifications.
Figure 2.7: (a) Original graph visualization (b) resultant visualization after textquery [4]
2.2.3 Qt. This comprehensive development framework includes an extensive
array of features, capabilities and tools that enable development of high-performance,
cross-platform rich-client and server-side applications [37]. The framework also in-
cludes a rich set of visualization development tools for user interfaces, layout man-
agement, 3D graphics, and scalable vector graphics [37]. The framework is available
in both C++ and Java programming languages.
Research showed that most visualization frameworks using Qt employed the
toolkit for user interfaces [15] [21] [29]. In addition to providing good user interface
tools the toolkit allows users to use their own choice of graphical visualization toolkits
as illustrated by BALL [25] (used for molecular modeling) and JULIUS [24] (used for
medical imaging). However, all frameworks studied, except one, selected OpenGL as
12

their graphical visualization toolkit. This open-ended approach allows any visualiza-
tion toolkit to be used which translates to great flexibility for an interface specific
toolkit. Figure 2.8(a) shows the design of JULIUS and Qt widgets used to create the
user interface for Ball (see Figure 2.8(b)). These examples reinforce the main use of
Qt. Because of the emphasis on providing user interface tools Qt lacks the built in
logic for network event animations.
(a) Julius framework conceptual overview illus-trating use of Qt for user interface [24]
(b) Screenshot from Ball molecular modelarshowing windows and widgets implemented withQt [25]
Figure 2.8: Examples of Qt in Julius framework and Ball modelar
2.2.4 Piccolo. Piccolo is a toolkit that supports the development of 2D
structured graphics programs, in general, and zoomable user interfaces, in particular.
The toolkit maintains a hierarchal structure of objects and cameras, which allows the
application developer to orient, group and manipulate objects in meaningful ways [20].
Piccolo uses a monolithic class hierarchy for organization of visualization information.
This design results in smaller number of classes, however, top-level classes become
13

large and more difficult for developers to understand [3]. This design is illustrated in
Figure 2.9 which show the base class PNode with no additional classes defining it’s
characteristics or behavior.
Figure 2.9: PNode class hierarchy showing monolithic Piccolo toolkit design [3]
The Piccolo visualization toolkit produces effective visualizations of data using
tree and fisheye layouts which are easily adapted to user data. The tree layout gives
users access to large amounts of hierarchal data, but presents it in a format which
allows them to focus on particular areas of interest (see Figure 2.10). Fisheye layout
gives user visibility to a large amount of data at a high level using a grid pattern.
When users select an area of interest the layout reveals more detail (see Figure 2.11).
The Piccolo toolkit includes numerous beneficial functions that are helpful for
visualizations. Piccolo also provides the necessary design and structure to support a
network visualization framework. These features, along with a structured approach to
adding custom animations, make Piccolo a good toolkit to use with the network visu-
alization framework. The only drawback of Piccolo is the monolithic design approach.
This approach creates large top-level classes. Expanding the framework then requires
sifting through lines and lines of code to add functionality to the major top-level
classes of the toolkit. Because it is anticipated that this framework will be expanded
through future research the monolithic Piccolo toolkit is less desirable.
14
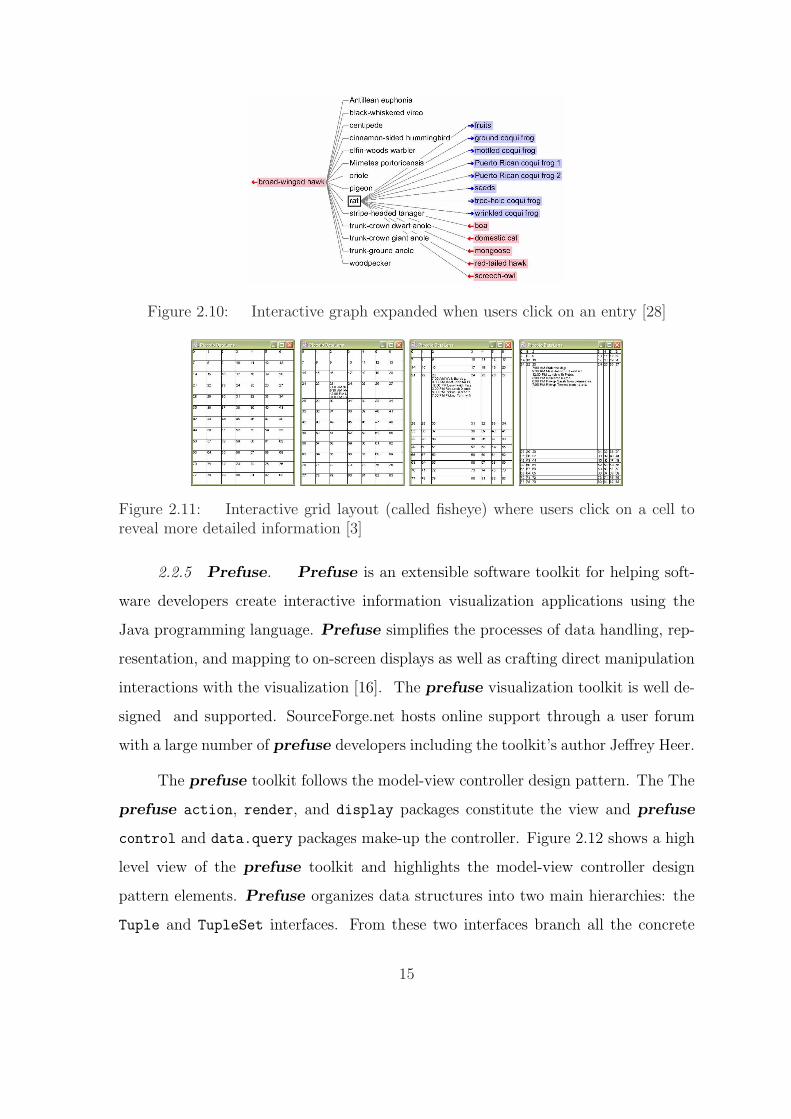
Figure 2.10: Interactive graph expanded when users click on an entry [28]
Figure 2.11: Interactive grid layout (called fisheye) where users click on a cell toreveal more detailed information [3]
2.2.5 Prefuse. Prefuse is an extensible software toolkit for helping soft-
ware developers create interactive information visualization applications using the
Java programming language. Prefuse simplifies the processes of data handling, rep-
resentation, and mapping to on-screen displays as well as crafting direct manipulation
interactions with the visualization [16]. The prefuse visualization toolkit is well de-
signed and supported. SourceForge.net hosts online support through a user forum
with a large number of prefuse developers including the toolkit’s author Jeffrey Heer.
The prefuse toolkit follows the model-view controller design pattern. The The
prefuse action, render, and display packages constitute the view and prefuse
control and data.query packages make-up the controller. Figure 2.12 shows a high
level view of the prefuse toolkit and highlights the model-view controller design
pattern elements. Prefuse organizes data structures into two main hierarchies: the
Tuple and TupleSet interfaces. From these two interfaces branch all the concrete
15
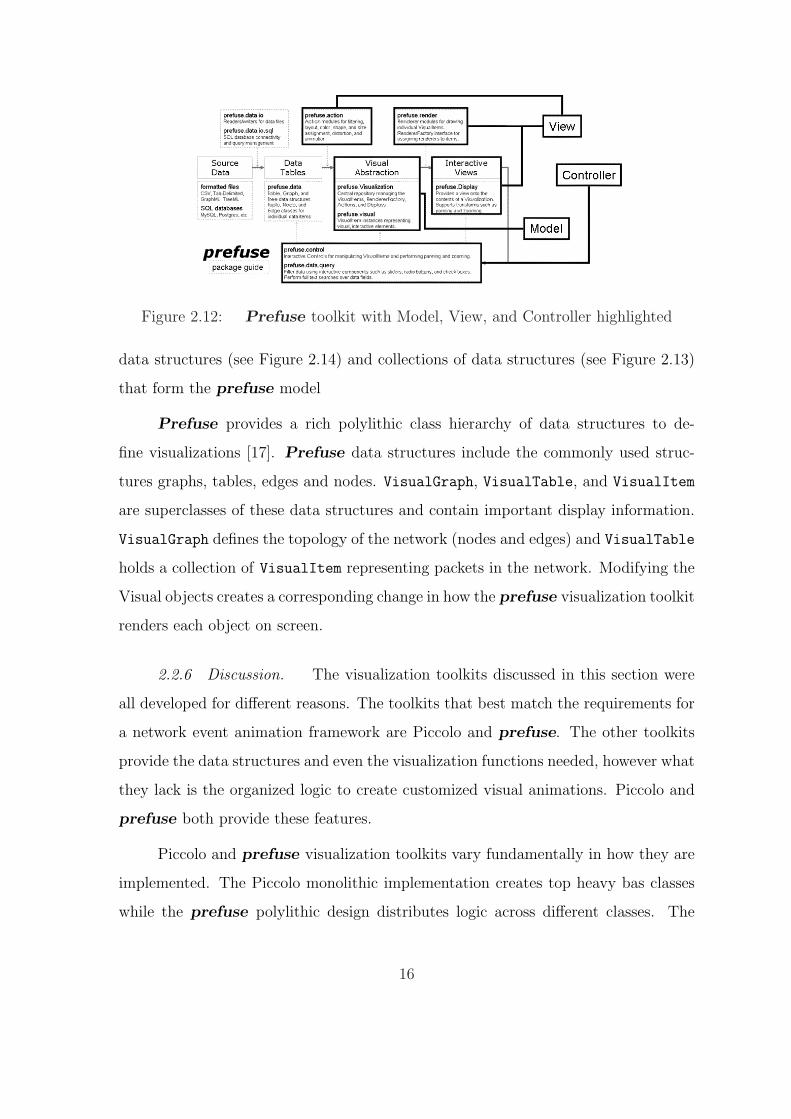
Figure 2.12: Prefuse toolkit with Model, View, and Controller highlighted
data structures (see Figure 2.14) and collections of data structures (see Figure 2.13)
that form the prefuse model
Prefuse provides a rich polylithic class hierarchy of data structures to de-
fine visualizations [17]. Prefuse data structures include the commonly used struc-
tures graphs, tables, edges and nodes. VisualGraph, VisualTable, and VisualItem
are superclasses of these data structures and contain important display information.
VisualGraph defines the topology of the network (nodes and edges) and VisualTable
holds a collection of VisualItem representing packets in the network. Modifying the
Visual objects creates a corresponding change in how the prefuse visualization toolkit
renders each object on screen.
2.2.6 Discussion. The visualization toolkits discussed in this section were
all developed for different reasons. The toolkits that best match the requirements for
a network event animation framework are Piccolo and prefuse. The other toolkits
provide the data structures and even the visualization functions needed, however what
they lack is the organized logic to create customized visual animations. Piccolo and
prefuse both provide these features.
Piccolo and prefuse visualization toolkits vary fundamentally in how they are
implemented. The Piccolo monolithic implementation creates top heavy bas classes
while the prefuse polylithic design distributes logic across different classes. The
16

Figure 2.13: Prefuse TupleSet Hierarchy: Shows how prefuse organizes collec-tions of visual and data objects used to create a visualization
Figure 2.14: Prefuse Tuple Hierarchy: Shows how prefuse organizes individualpieces of visualization data
17
multiple class approach of prefuse was a better fit for this development because the
polylithic class hierarchy allows for implementing different behaviors for the main
visual objects on screen: nodes, links, and packets. Specifically, nodes and links can
use the prefuse node and edge java interfaces and packets can use the generic prefuse
VisualItem interface. The node, link, and packet functionality could have simply
been added to the existing Piccolo classes, but this would have required additional
implementation not needed with the prefuse toolkit. Also, it is anticipated that
in the future additional visualization features will be added to this implementation.
Therefore, this research uses the prefuse visualization toolkit to create a new network
visualization framework.
18

III. Visualization Framework Design and Implementation
The design and implementation of this network visualization framework utilizes
the iterative process for software development applying design patterns where
applicable. This process also implements refactoring techniques to keep code imple-
mentation clean. The four major design challenges for this framework are: trace file
format, network simulator trace file parsing, wired/wireless network event animation,
and creating a visualization interface to alter network simulator parameters during
runtime.
Understanding the prefuse visualization toolkit design is crucial to addressing
the four major design challenges for the network visualization framework. Figure 3.1
illustrates how the prefuse toolkit performs data visualization. The toolkit design
is perfect for addressing the previously mentioned design challenges. Prefuse data
corresponds to a trace file. Prefuse filtering is accomplished through a file parser,
which parses data into the prefuse visual forms. The prefuse rendering and view
handles the challenge of animating network events. Finally, the user interacts with
the prefuse user interface controls to provide user interaction with the visualization.
Because prefuse addresses these challenges it is an excellent toolkit to extend into
this network visualization framework.
Figure 3.1: The prefuse visualization toolkit. Lists of composable actions filter ab-stract data into visualizable content and assign visual properties (position, color, size,font, etc). Renderer modules, provided on a per-item basis by a RendererFactory,draw the VisualItem to construct interactive Displays. User interaction can thentrigger changes at any point in the toolkit [18].
19
3.1 Network Trace File
The network visualization framework requires a trace file produced by the net-
work or network simulator to visualize network events. The initial, and majority, of
simulator traces used for this research came from NS-2. GTNetS produces a trace
file, however, this file is primarily used to record network statistics, not unique net-
work events [33]. OPNET uses it’s own network visualizer and therefore does not,
by default, produce a trace file. However, OPNET can be configured to produce a
trace file of network events according to a specified format. Because NS-2 produces
trace files with the needed network event information this research focuses initially
on parsing trace files from NS-2 and later extend to other formats.
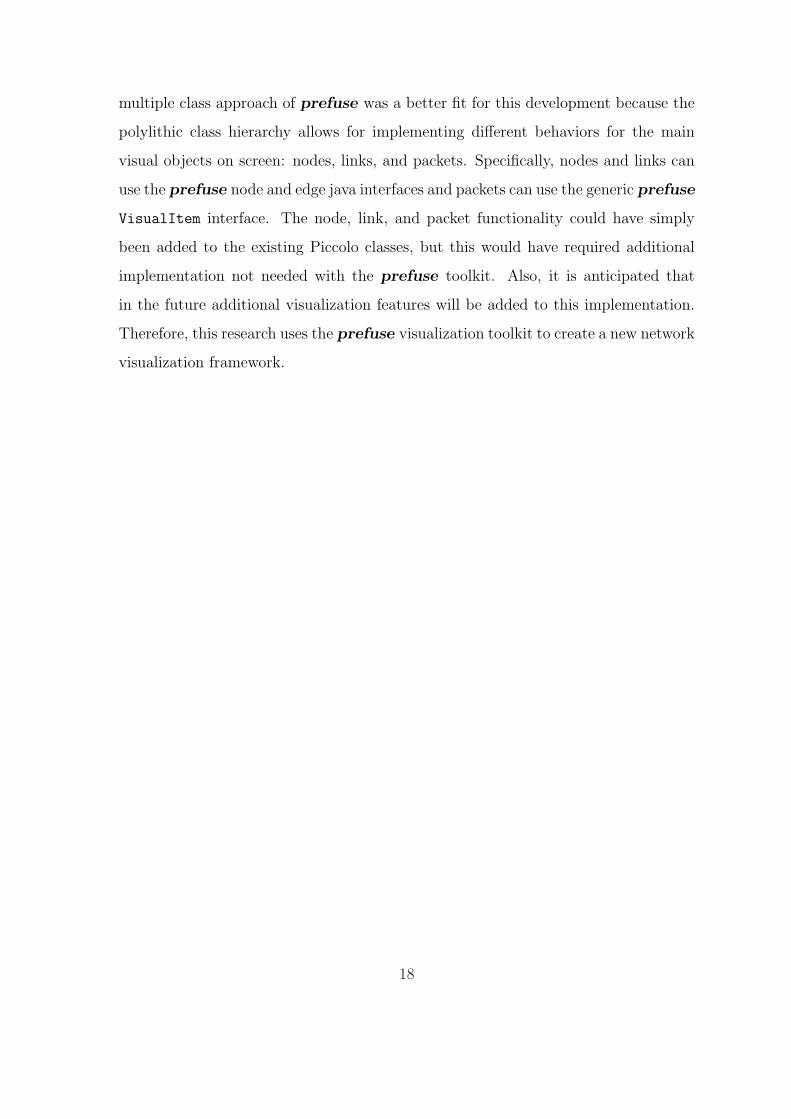
3.2 Trace File Parser
NS-2 can produce produce a trace file during a network simulation in several
different formats. This research initially focuses on NS-2 traces use by Nam. These
traces follow certain format conventions, but can still have subtle variations based on
user configuration of NS-2 [8]. Figure 3.2 shows an example of and NS-2 trace that
could be visualized by Nam.
Figure 3.2: NS-2 trace samples, showing two formats highlighting the differinglocations of time and other tags
Each line in the Figure 3.2 is a network event. The first character in each line
classifies it as a node, link, or packet network event (column 1). Within each network
event line are tags denoted by the ‘-’ character followed by a letter; these tags specify
information about a network event. Common to all network events is the time event
20

tag, denoted as ‘-t’ (see Figure 3.2), indicating when an event occurred. The time
event tag illustrates one of the differences in the two trace files. In Trace 1 the tag is
consistently in column 2, but in Trace 2 the location of the tag varies between three
different columns (see Figure 3.2).
The major difference between the two trace files is the packet network event
lines. The events differ greatly because Trace 1 tells us more about packet events
than Trace 2. The table below lists tags corresponding to packet event NS-2 trace
lines.
Nam Visualization Packet Events
+ Packet is queued in a node
– Packet is dequeued from a node
h Packet begins transmission across a link
r Packet is received by another node
d Packet is dropped from node queue (queue overflow)
[8]
Trace 2 does not describe packet queuing or dequeueing, but only describes
packets being sent and received. Additionally, Trace 2 defines another network event
tag ‘-e’ (Trace 2: column two). Following the tag are the character ‘s’ or ‘r’ indicating
a packet was sent or received. The two different trace files illustrate the challenge of
creating a trace file parser capable of parsing NS-2 trace files with subtle differences
in tag placement and meaning.
3.2.1 Initial Design. The network visualization trace file parser communi-
cates directly with the prefuse visualization toolkit. This communication uses the
Data column pattern implemented in the prefuse toolkit [2]. Figure 3.3 illustrates
the data column pattern. Collections of columns compose a table. and when a column
is added to a table the ColumnFactory creates the column in the table and returns
a reference to that column. A Table is used to obtain a reference to a given column.
When a value in a column is altered the columnChanged method is invoked and tables
that share that column are notified of column changes.
21

Figure 3.3: Data Column Pattern
The network visualization trace file parser uses references to three prefuse ta-
bles each holding network node, link, and packet information respectively. Each row in
a prefuse Table object corresponds to a single item to be visualized, a VisualItem
object. A column, however, corresponds to a specific data attribute for a collec-
tion of similar VisualItem objects displayed by the visualization. Column objects in
prefuse Table objects must be assigned, at creation, a specific type and value. To
assist with Column type and value assignment prefuse uses a ParserFactory object
to sort incoming visualization data into specific types (Integer, Double, Float, String,
etc.). ParserFactory sorting is a two-step process. First, the ParserFactory sam-
ple method is called to decide the correct type of the string input and second, the
getParser method is called which returns a specific parser for the input type. The re-
turned parser provides the necessary information to store value and type information
into a prefuse Column object; and even create a Column object when necessary.
The data parsing process described above utilizes the factory method pat-
tern and the observer pattern. The factory method pattern is used in both the
ColumnFactory and ParserFactory. ColumnFactory uses the create method to in-
stantiate a concrete product which is a subclass of Column. ParserFactory does the
same with the getParser method which returns a DataParser subclass [13]. Finally,
the observer pattern is used by Table implementing the ColumnListener interface.
This interface defines the columnChanged method allowing a Table to notify other
Table objects that share this column [2].
22

Figure 3.4: Extension of prefuse DataParser and ParserFactory into networkvisualization specific parsers and parser factories
The trace file parser design extends the relationship between the prefuse Parser
Factory and ColumnFactory to handle the specific needs of parsing network events.
Figure 3.4 shows the extension of the prefuse ParserFactory into specific Parser
Factory subclasses for different possible network events. This design separates code
between the different network events allowing each implementation to tailor the way
it parses information. Each network event specific ParserFactory uses an array of
node, edge, or packet parsers, extending the DataParser interface, to parse their re-
spective relevant data from the trace file. Additionally, the node, edge, and parser
factories retain the elements of the prefuse ParserFactory making them capable of
parsing types (Integer, Double, String, etc..). This design follows the factory pattern
design pattern where DataParser serves as the interface but instantiation is left to
the subclasses (line, node, edge, packet ParserFactory) subclasses [12]. This design
is show in Figure 3.5.
3.2.2 Initial Design Problems. The initial file parser design built an archi-
tecture that extended the prefuse ParserFactory to create specific parser factories
23
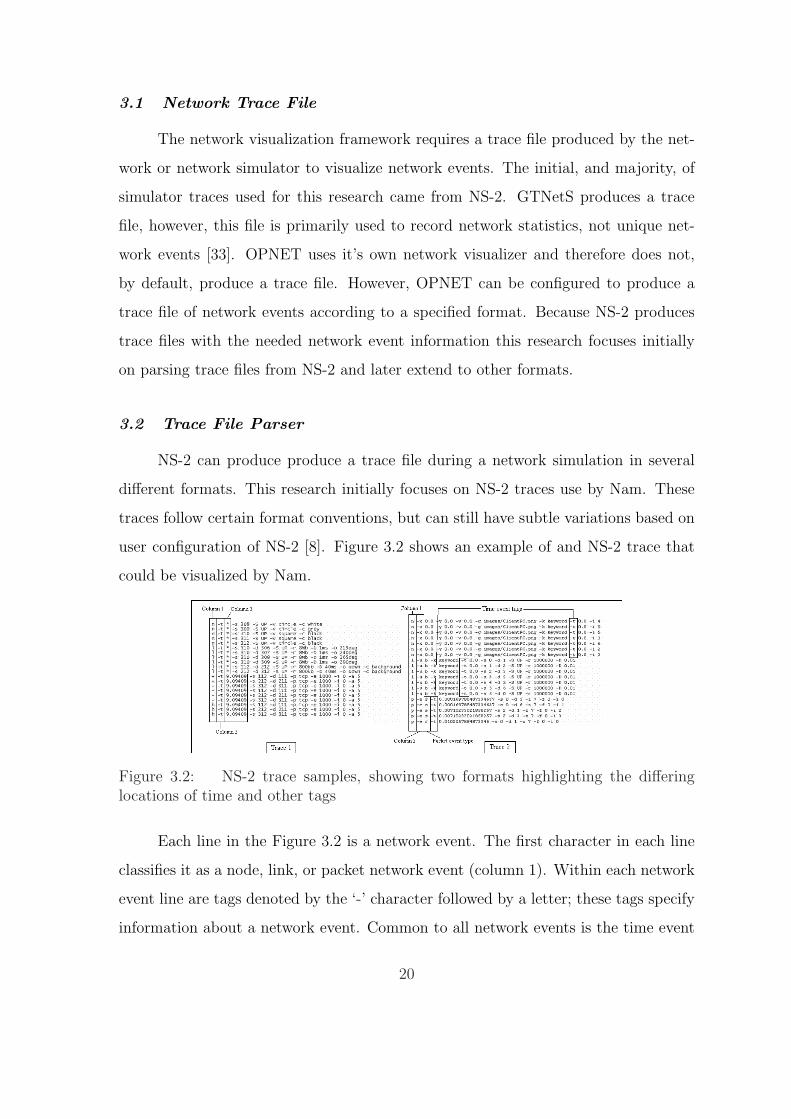
Figure 3.5: Creation of network visualization specific parsers ImageParser,BandwidthParser, and IDParser
and separate parser objects extending the prefuse DataParser interface (Figure 3.4).
This design gave users the ability to create, modify, and extend parser classes and
created parser factories based on information found in a specific trace file (see Fig-
ure 3.5). The initial parser design also created a class hierarchy that utilized polymor-
phic method invocation to parse each trace file line. Polymorphic methods allowed
line parsing to proceed under different criteria as specified by different user-defined
parser objects. This robust parser architecture provided the ability to add new pars-
ing criteria by simply inserting new parser classes into the class hierarchy as shown in
Figure 3.5. Extending the DataParser interface allowed the framework to function
the same way no matter how the parser objects actually parsed the lines. These de-
sign decisions were a good mix of using existing code from the prefuse toolkit and
giving flexibility to the user to extend prefuse’s parsing capabilities according to the
trace file.
The design, however, created undesired side effects. The parser hierarchy and
associated helper classes produced extra coupling to prefuse data structures storing
visualization information. Figure 3.6 illustrates the high coupling centered around
the EdgeTableManager class (similar results were found in NodeTableManager). In
addition to the increased coupling further exploration into the trace files used revealed
24

Figure 3.6: Initial Parser Design
relatively few subtle changes between traces. This discovery along with the high
coupling of the initial design motivates a more simple parser design.
3.2.3 Final Design and Implementation. The final parser design builds
on the initial design, but effectively reduces the coupling in a simple elegant design
(see Figure 3.7). The design replaces the old NetVizParserFactory hierarchy (see
Figure 3.4) with one ParserFactory. This change creates one consolidated location
for specifying parser criteria, making parsing changes simple and straightforward.
In addition to the ParserFactory the concrete products are limited to only node,
edge, and packet parser objects. Finally, the Parser abstract class handles updates
to the visualization through the node, edge, and packet parser objects. This design
establishes parser as the central manager for updates to different objects held in the
prefuse visualization framework.
25
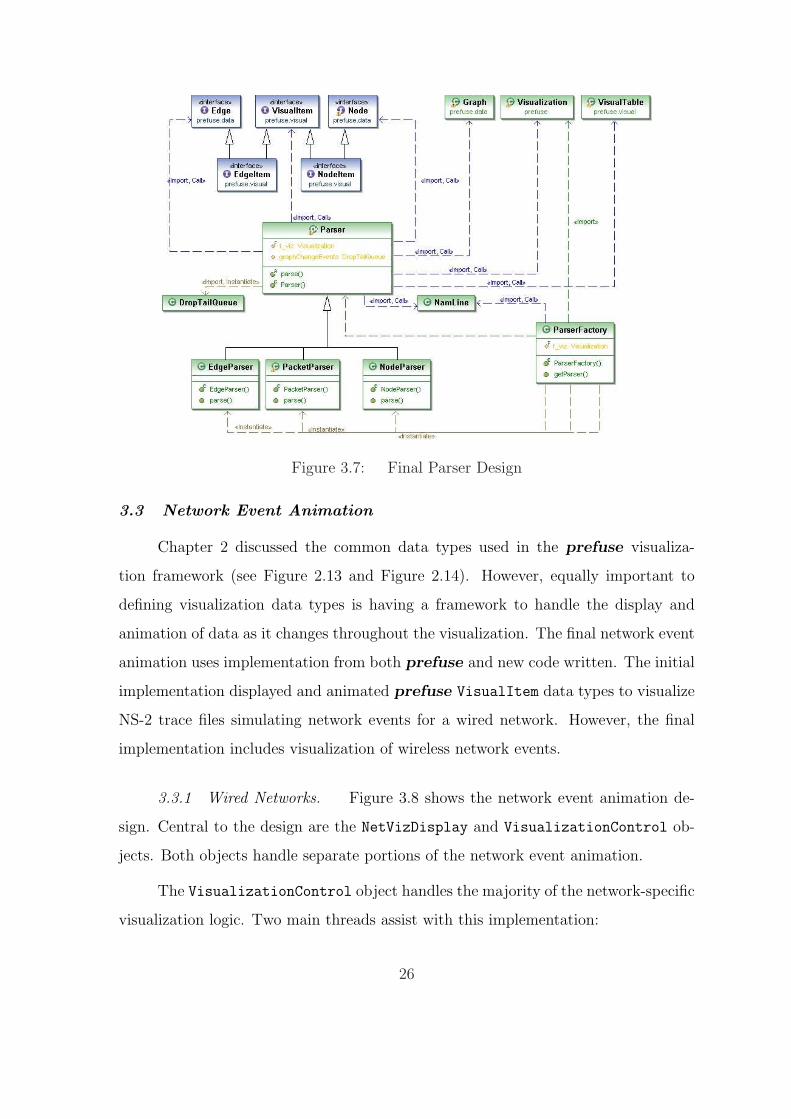
Figure 3.7: Final Parser Design
3.3 Network Event Animation
Chapter 2 discussed the common data types used in the prefuse visualiza-
tion framework (see Figure 2.13 and Figure 2.14). However, equally important to
defining visualization data types is having a framework to handle the display and
animation of data as it changes throughout the visualization. The final network event
animation uses implementation from both prefuse and new code written. The initial
implementation displayed and animated prefuse VisualItem data types to visualize
NS-2 trace files simulating network events for a wired network. However, the final
implementation includes visualization of wireless network events.
3.3.1 Wired Networks. Figure 3.8 shows the network event animation de-
sign. Central to the design are the NetVizDisplay and VisualizationControl ob-
jects. Both objects handle separate portions of the network event animation.
The VisualizationControl object handles the majority of the network-specific
visualization logic. Two main threads assist with this implementation:
26
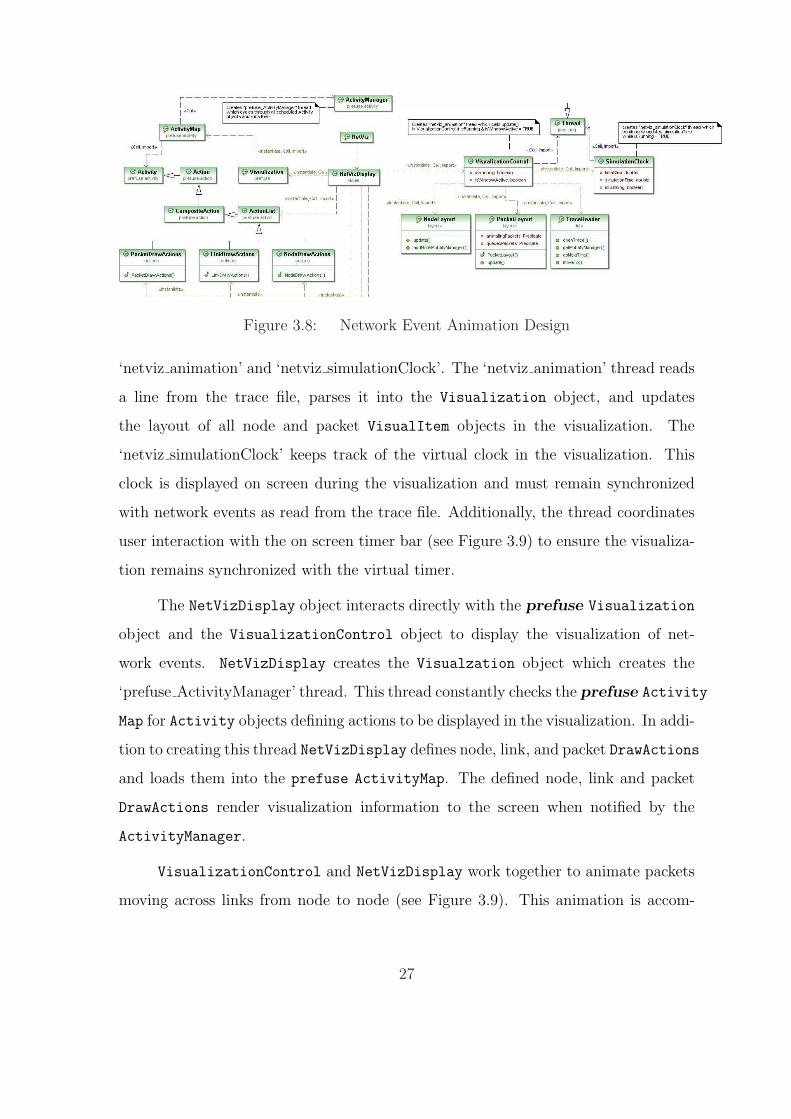
Figure 3.8: Network Event Animation Design
‘netviz animation’ and ‘netviz simulationClock’. The ‘netviz animation’ thread reads
a line from the trace file, parses it into the Visualization object, and updates
the layout of all node and packet VisualItem objects in the visualization. The
‘netviz simulationClock’ keeps track of the virtual clock in the visualization. This
clock is displayed on screen during the visualization and must remain synchronized
with network events as read from the trace file. Additionally, the thread coordinates
user interaction with the on screen timer bar (see Figure 3.9) to ensure the visualiza-
tion remains synchronized with the virtual timer.
The NetVizDisplay object interacts directly with the prefuse Visualization
object and the VisualizationControl object to display the visualization of net-
work events. NetVizDisplay creates the Visualzation object which creates the
‘prefuse ActivityManager’ thread. This thread constantly checks the prefuse Activity
Map for Activity objects defining actions to be displayed in the visualization. In addi-
tion to creating this thread NetVizDisplay defines node, link, and packet DrawActions
and loads them into the prefuse ActivityMap. The defined node, link and packet
DrawActions render visualization information to the screen when notified by the
ActivityManager.
VisualizationControl and NetVizDisplay work together to animate packets
moving across links from node to node (see Figure 3.9). This animation is accom-
27

Figure 3.9: Network Event Animation Screen shot
plished with both the update method in PacketLayout and the PacketDrawAction
method in PacketDrawAction (see Figure 3.8). PacketLayout defines which Visual
Item packets need new x,y coordinates and assigns new coordinates, which the Packet
DrawAction renders to the screen. The result is a design that effectively leverages the
VisualItem and ActivityManager objects inside prefuse to create a network event
animation.
3.3.2 Wireless Networks. Visualizing wireless network packet transmission
is different from wired network packet transmission in two ways. First, wireless nodes
often move while transmitting and receiving data. Second, the very nature of wire-
less packet transmission is fundamentally different than wired transmission. A wired
packet is directed to the next node hop on the link. However, wireless packet trans-
missions (from nodes with omnidirectional antennas) are not constrained to one next
hop on their path. Wireless packets are broadcast and can be received by many differ-
ent nodes. Nodes that receive the broadcast can ignore it, process the packet, or relay
the packet to surrounding nodes. This understanding of wireless packet traffic raises
the question: How do we visualize wireless traffic? An important consideration when
28
answering this question is how much detail to show [19]. Accurate visualizations of
transmission energy rings disseminating from a node quickly becomes confusing and
does not highlight a packet’s route movement from source to destination. However,
the nature of wireless broadcasts does not allow a packet’s final destination to be
known at the time of initial packet broadcast. Despite these challenges this research
creates an accurate wireless network visualization which addresses node movement
and packet transmission, using the following techniques.
3.3.2.1 Node movement. Node movement is critical for effective net-
work visualization observation and analysis. Increased use of mobile nodes in networks
warrant the need to accurately show mobile node movement. Visualizing node move-
ment is an important part of understanding why a network is performing the way it is.
Mobile nodes present network performance challenges not encountered in traditional
wired networks. First, node movement can cause network reliability to degrade. As
nodes move farther away signals can degrade or be obstructed which, depending on
the node, can have effects that ripple through the entire network. Second, node move-
ment can result in complete loss of the node due to compromise, destruction, or node
defect. Without node position the correct recourse cannot be taken. Finally, there is
little point in a network visualization if the picture is inaccurate–physically moving
nodes simply must move within the visualization. These factors establish accurate
node movement as an essential part of a network visualization framework.
The network visualization requires that node movement information be given
in the trace file using the defined tags -u (x-coordinate velocity), -v (y-coordinate
velocity), -T (duration of movement) [8]. The tags must be placed inside node event
lines in the file, therefore every node movement must correspond to a specific node
event. Figure 3.10 shows a trace file segment highlighting three nodes. Initially the
nodes are given no movement by setting velocity and duration of movement tags to
zero. Later in the trace, however, these nodes are assigned node movement with
specific node speed, direction, and duration of movement (see Figure 3.10.
29

Figure 3.10: Node events inside a NS-2 trace for three different nodes initially nonode movement defined, but later node movement is specifically defined by the -u(x-coordinate velocity), -v (y-coordinate velocity), -T (duration of movement) tags.layer
Node movement information is parsed out of the NS-2 trace file into a new
objects called MobilityEntry. Each of these objects correspond to specific node
movement, because many specific node movements may occur within a trace file
all MobilityEntry objects are managed by by the NodeMobilityManager. The
NodeMobilityManager object is added to NodeLayout to update node position each
time the NodeLayout update method is called by the ‘netviz animation’ thread (see
Figure 3.8). Inside the NodeLayout object the current simulation time is used with
the specific node movement information inside MobilityEntry objects to calculate
the correct position of the node at the current time. This implementation follows
closely the implementation used to produce packet animation with PacketLayout
discussed previously. Based on node movement information held in MobilityEntry
objects the ‘netviz animation’ thread updates node position to create node movement.
Figure 3.11 shows the network visualization framework design for implementing node
movement.
3.3.2.2 Wireless packet transmission. In order to understand the dif-
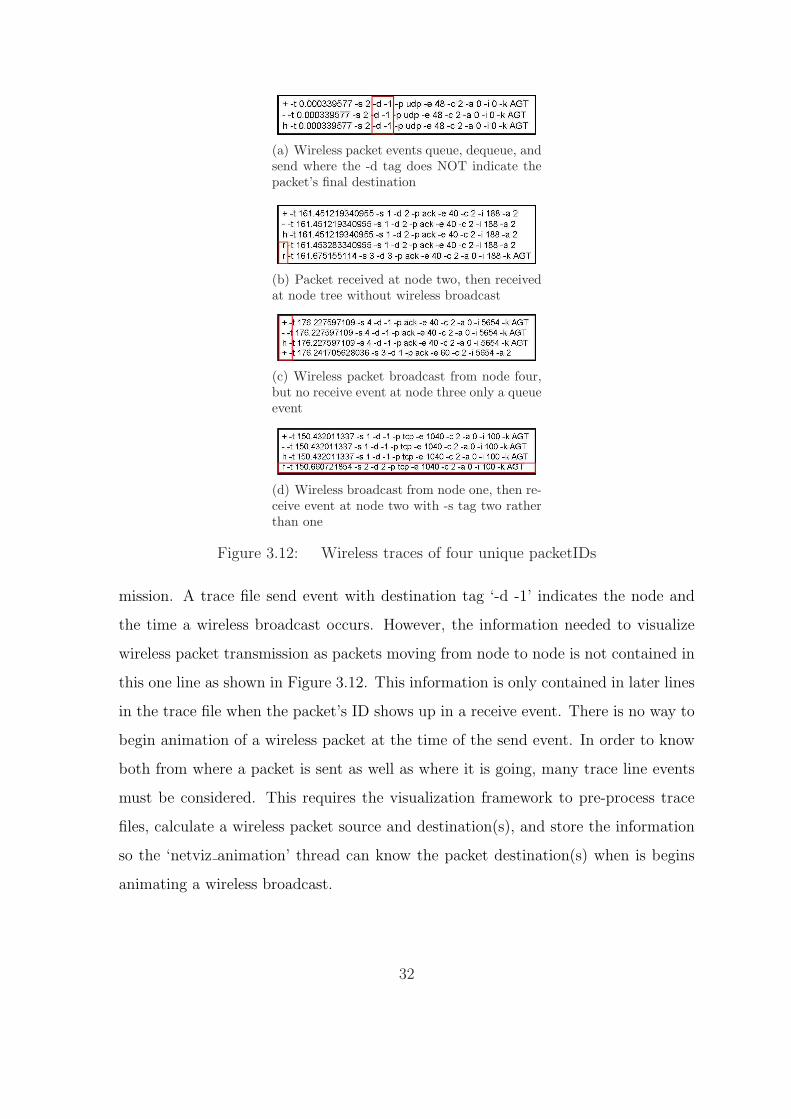
ficulties of visualizing wireless network events Figure 3.12 shows four specific wireless
traces illustrating the problem of wireless traffic visualization. Each sample trace con-
tains network events for a unique packet shown by the id number following the ’-i’ tag
in each sample. 3.12(d) shows a major deviation from wired packet traffic. Instead
of specifying the destination after the ’-d’ tag a ’-1’ indicates the packet is broadcast
from node two. 3.12(b) illustrates packet traffic moving from wired links to a wireless
link. The first receive clearly shows the source as one and the destination as two.
30

Figure 3.11: NodeParser parses node event trace lines and updates data fields insideNodeMobilityManager. NodeLayout then accesses a set of MobilityEntry objectsinside NodeMobilityManagerto correctly animate node movement.
However, the second receive is at node three without a previous send event. 3.12(c)
shows wireless- node-to-wireless-node packet transmission. Here a queue, dequeue,
and send event from node four are followed immediately by a queue event at node
three, indicating a receive event at node three without a receive event entry in the
trace file. Finally, 3.12(d) shows a queue, dequeue, and send event from node one
followed by a receive event at node two. This trace sample contrasts 3.12(c) which
does not include a receive event. Because of the ambiguous nature of NS-2 trace files
for wireless packet events this network visualization framework pre-processes trace
file data. By pre-processing trace data users can visualize wired and wireless network
traffic accurately and without confusing wireless broadcast rings. It also gives users
the ability to visually track packets from source to destination.
3.3.2.3 Trace file pre-process methodology. Nam network visualiza-
tions show animated wireless transmission energy rings to denote a wireless trans-
31
(a) Wireless packet events queue, dequeue, andsend where the -d tag does NOT indicate thepacket’s final destination
(b) Packet received at node two, then receivedat node tree without wireless broadcast
(c) Wireless packet broadcast from node four,but no receive event at node three only a queueevent
(d) Wireless broadcast from node one, then re-ceive event at node two with -s tag two ratherthan one
Figure 3.12: Wireless traces of four unique packetIDs
mission. A trace file send event with destination tag ‘-d -1’ indicates the node and
the time a wireless broadcast occurs. However, the information needed to visualize
wireless packet transmission as packets moving from node to node is not contained in
this one line as shown in Figure 3.12. This information is only contained in later lines
in the trace file when the packet’s ID shows up in a receive event. There is no way to
begin animation of a wireless packet at the time of the send event. In order to know
both from where a packet is sent as well as where it is going, many trace line events
must be considered. This requires the visualization framework to pre-process trace
files, calculate a wireless packet source and destination(s), and store the information
so the ‘netviz animation’ thread can know the packet destination(s) when is begins
animating a wireless broadcast.
32

The visualization framework uses a map-like data structure to store needed trace
data during the read-ahead. Figure 3.13 shows the basic design of the data structure.
The outer map uses each broadcasting node throughout the trace as keys. These keys
map to an inner map where each packetID is used as a key for a set of destination
node IDs. This structure is necessary to allow nodes to broadcast multiple times to
multiple destinations—all wireless network traffic possibilities.
Figure 3.13: Data Structure design for wireless traffic Map. The map stores routesfor wireless packets from source to destination for later visualization
3.4 Visualization / Simulator Interaction
Design concepts discussed to this point, do not address interaction with the
simulator. Establishing a communication link with an external simulator and pass-
ing new trace information to the visualization parser through the link is a major
implementation challenge. The following outlines a design for this implementation.
33
The Gateway pattern provides a simple and effective template to access external
resources and is a good fit to access an external network simulator [10]. The initial
design creates the VisualizationGateway and SimulatorGateway classes to han-
dle communication with the simulator. The VisualizationGateway encapsulates all
functions the network simulator will call to effect the Visualization. These methods
primarily involve transmitting new trace data. The SimulatorGateway encapsulates
all methods the visualization will call to effect the simulator. The methods notify
the simulator of user interaction with the visualization (taking down links, moving
nodes, etc.) that will effect the results of the simulation. Critical to the success
of the Gateway pattern implementation are simulator utilities currently being de-
veloped by members of the AFIT hybrid communication team. These utilities will
accept visualization input, alter the simulation and return the new trace through the
SimulatorGateway.
3.5 Code Refactoring
Refactoring is the process of changing a software system in such a way that it
does not alter the external behavior of the code yet improves its internal structure [9].
This research included three major refactorings: First, the extract class refactoring
removed many similar methods from the large TraceReader class into a new NamLine
class. Second, a conditional chain used for parsing was replaced by parser subclasses
using polymorphic calls to parse strings differently. Finally, extract hierarchy refac-
toring was implemented as a side-effect of applying the two previously mentioned
refactorings.
3.5.1 Extract Class [9]. The initial network visualization implementation
used the class TraceReader to handle connecting, parsing, sorting, and loading infor-
mation into the vizualization tables. This implementation created what the authors
of [9] call ‘bad smells in code’. One such smell was a large TraceReader class. The
NamLine class removed ‘helper’ methods methods for extracting information from a
34

new trace string created in TraceReader. Additionally, it created a more object-
oriented design placing all methods relating to extracting trace information in one
place.
3.5.2 Replace Conditional with Polymorphism [9]. Another ‘code smell’ in
the code was conditional chains. One such chain is shown in Figure 3.14. The Parser
implementation shown in Figure 3.7 replaces the conditional chain with polymorphic
calls to the Parser subclasses NodeParser, EdgeParser, and PacketParser. Again,
this design reduced the size of TraceReader, but it also made the code easier to
extend as new parsers need only extend Parser. Figure 3.14 shows the polymorphic
parse call.
Figure 3.14: Conditional Chain Example
3.5.3 Extract Hierarchy [9]. The hierachy that facilitates the polymorphic
method parse also creates the extract hierarchy refactoring. As with Design Patterns
certain refactorings seam to occur automatically as a result of implmenting others.
Software development is naturally prone to errors. Refactoring can significantly reduce
errors during software development and produce more maintainable code. [31].
35

3.6 Discussion
The network visualization framework discussed above creates an intriguing new
way to study wired and wireless networks. Research on network protocols and network
design will be aided by the ability to see wireless network traffic and communicate
with network simulators. Additionally, because this framework is built on the prefuse
visualization toolkit new animations can be added through new prefuse Action ob-
jects. The network visualization framework provides new visualization capabilities
and a good design for future development.
36

IV. A Network Visualization Framework for Network Event
Observation and Analysis
This research produced a network visualization framework that advances network
event analysis capabilities. The new framework includes the architecture nec-
essary to parse NS-2 trace files, but can be expanded to parse trace files from other
simulators. This capability allows the framework to visualize network scenarios run
on different simulators and compare the results. Another framework capability is the
robust and easily extensible design used to layout the network topology and animate
network events within the visualization. This design gives developers the ability to
define custom network topology layouts and network event animations to highlight
specific analysis objectives. The framework empowers the visualization with precise
user interface controls including: zooming, panning, node highlighting, and visualiza-
tion timing controls. Finally, the visualization shows promise towards allowing users
to alter a network simulator scenario (e.g., toggle node or link status between up and
down) by interacting with the visualization.
Visualizations, by their very nature, are difficult to test. This research tested
numerous visualization scenarios by visual inspection. The testing was done by visu-
alizing a network scenario, or trace file, in Nam and comparing the resultant visual-
ization with the same trace file visualized by this framework. The network scenario
trace files used during framework testing demonstrate important network event visu-
alization capabilities.
4.1 Robust Parser Architecture
Creating a robust parser architecture for parsing network simulator trace files
requires some knowledge of how trace the file data is organized. Therefore, this
framework starts with four basic trace file parsing assumptions. First, trace file data
is organized by individual network events and each network event corresponds to a line
in the network simulator trace file. Second, each network event line in the trace file
is marked as a node, link, or packet event. Third, after the network event identifier
37
the remainder of the network event line is composed of identifier tags and data.
Finally, all network event lines are in chronological order as they occurred during the
simulation. Based on these assumptions this framework has created the TraceLine
abstract class. This class accepts a String trace line event and provides methods to
return common trace line event tags contained in the String. This effectively saves
each trace line event as a String and then parses the string to retrieve specific data
corresponding to trace line event tags. Classes extending TraceLine override and
supplement the TraceLine base methods to produce new parser functionality and
create the capability to accept multiple trace file formats.
TraceLine implementation uses a Java Map with parameterized types String
and Object to organize the mapping of trace line tags to their corresponding data.
By using a general map data structure no assumptions are made about specific tag
names or data types. Trace event line parsing and tag data retrieval from TraceLine
subclasses is completely customizable by overriding the parse method and adding
or overriding data retrieval methods. The TraceLine abstract class implementation
makes multiple trace file parsing a simple matter of extending Tracline.
Utilizing the toolkit developed by Mark Coyne for OPNET and the TraceLine
abstract class this framework visualizes an OPNET network simulator scenario [6].
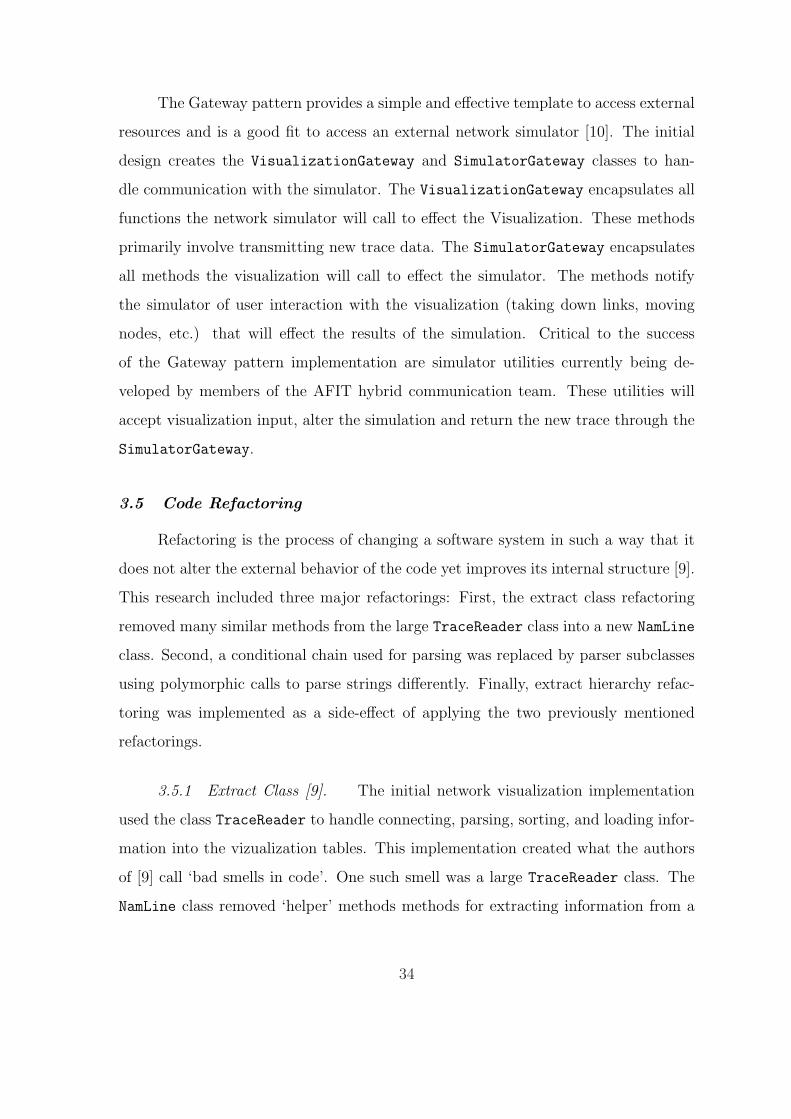
Figure 4.1 shows the trace file produced by OPNET that follows this framework’s
parsing criteria explained earlier. However, trace tags used in Figure 4.1 slightly
differs from what was used in previous trace files reviewed in this framework research.
Despite these differences the framework parser is able to easily adapt to the changes
Figure 4.1: Trace created by OPNET toolkit. Highlighted are the packet eventlines beginning with ’p’ and using the ’-e’ tag to denote a send, receive, queue or droppacket event. Also, this trace uses the ’-z’ tag to denote packet size.
38

Figure 4.2: Framework visualization of OPNET simulation
needed to parse the OPNET trace file. Figure 4.2 shows the simple OPNET trace
using this network visualization framework.
This framework extended TraceLine for two different network event line traces.
NamLine extends TraceLine to parse network event lines from NS-2 trace files. OpNetLine
extends TraceLine to parse network events recorded from a scenario run in OPNET.
Listing IV.1 below shows the conditional logic used to determine which subclass of
TraceLine will be used based the trace file extension.
Listing 4.0:
if ( fileExtension . equals ("nam" ) )
nextLine = new NamLine ( fileIn . readLine ( ) ) ;
else
nextLine = new OpNetLine ( fileIn . readLine ( ) ) ;
The NextLine object is of type TraceLine and according to the conditional logic is
instantiated as either a NamLine or a OpNetLine based on whether the trace file is
Nam or OPNET. The conditional logic in Listing IV.1 can be extending as needed to
accommodate additional trace file formats. Once the correct TraceLine subclass is
instantiated the developer can add specific parsing logic as needed by the new subclass
in order to parse the simulator trace line.
39

This design uses TraceLine to define core methods used to obtain information
from the network event trace lines, but allows NamLine and OpNetLine subclasses
to supplement and override methods as necessary . Figure 4.3 illustrates methods
overriden by OpNetLine to retrieve specific information the logged OPNET network
events.
Figure 4.3: NamLine and OpNetLine subclass TraceLine. OpNetLine adds func-tionality to TraceLine with new methods and method overrides–allows TraceLine
to handle network events in OPNET trace file.
The file parser built for this network visualization framework creates an excel-
lent foundation for future research and collaboration. The capability brings network
simulator research one step closer to comparing executed network simulator scenarios
in a common visualization environment. A comparison that would provide better
understanding on how simulators differ and how those differences can effect network
event simulation. Additionally, network simulator performance could be seamlessly
analyzed and compared from one simulator to another.
4.2 Multi-objective Dynamic Network Topology Layout
This research designed and implemented a network visualization framework to
assist network observation and analysis. When implementing a network visualization
framework a major concern is how to visualize the network topology. An obvious an-
swer to this question is to arrange network nodes and links as close to their physical
arrangement as possible. However, sometimes a physical layout does not provide suffi-
40
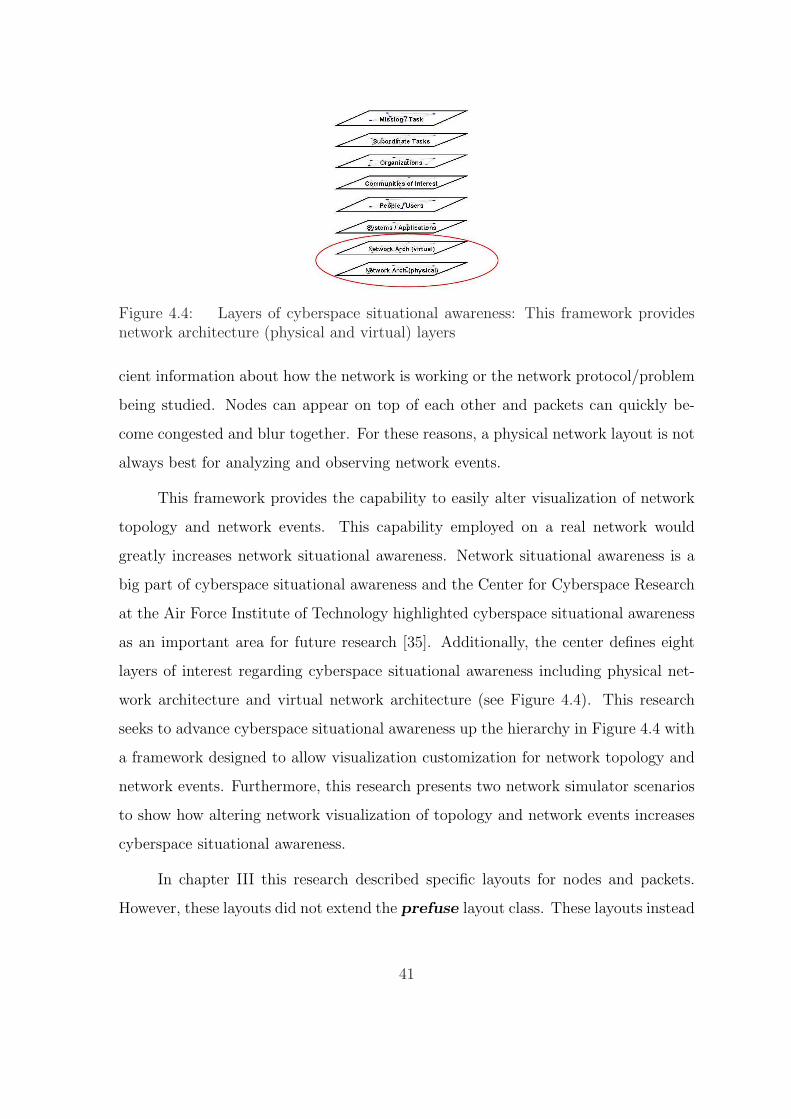
Figure 4.4: Layers of cyberspace situational awareness: This framework providesnetwork architecture (physical and virtual) layers
cient information about how the network is working or the network protocol/problem
being studied. Nodes can appear on top of each other and packets can quickly be-
come congested and blur together. For these reasons, a physical network layout is not
always best for analyzing and observing network events.
This framework provides the capability to easily alter visualization of network
topology and network events. This capability employed on a real network would
greatly increases network situational awareness. Network situational awareness is a
big part of cyberspace situational awareness and the Center for Cyberspace Research
at the Air Force Institute of Technology highlighted cyberspace situational awareness
as an important area for future research [35]. Additionally, the center defines eight
layers of interest regarding cyberspace situational awareness including physical net-
work architecture and virtual network architecture (see Figure 4.4). This research
seeks to advance cyberspace situational awareness up the hierarchy in Figure 4.4 with
a framework designed to allow visualization customization for network topology and
network events. Furthermore, this research presents two network simulator scenarios
to show how altering network visualization of topology and network events increases
cyberspace situational awareness.
In chapter III this research described specific layouts for nodes and packets.
However, these layouts did not extend the prefuse layout class. These layouts instead
41
Figure 4.5: GeographicLayout and GroupedLayout class hierarchy. TheGeographicLayout and GroupedLayout classes extend Layout and Activity to cre-ate customized visualization animation
provided update methods called during the ‘netviz anmiation’ thread. This research
also defines two different layouts which extend the prefuse Layout class. These two
layouts create a physical and virtual view of the network visualization and contribute
to two layers of cyberspace situational awareness in Figure 4.4.
4.2.1 Physical and Virtual Network Layout Design. Prefuse provides an
excellent toolkit architecture for supporting different user-defined visualization lay-
outs. This framework leverages the prefuse toolkit architecture to define two differ-
ent network topology layouts. First, a physical layout which draws networks of nodes
on a grid using the x,y coordinates found in trace file node event lines. Second, a vir-
tual grouped layout which organizes nodes together based on links that exists between
the nodes. Nodes that share higher bandwidth links are pulled closer together and
nodes that share lower bandwidth links appear farther apart. These two layouts ap-
pear in the framework implementation as GeographicLayout and GroupedLayout
respectively. Figure 4.5 shows the class hierarchy of these two classes. Because
GroupedLayout inherits from prefuse ForceDirectedLayout, nodes without links
continue to move farther and farther apart. The class hierarchy in Figure 4.5 also
illustrates how any subclass of Layout is also a subclass of Activity. This is im-
portant because as an Activity object Layout objects are added to the prefuse
ActivityManager and used to to create visualization animation. Therefore, by us-
ing the prefuse class hierarchy design, new Layout subclasses automatically effect
42

visualization animation. This design gives developers a simple way to change how net-
work events are animated. The next two sections highlight specific network simulator
scenarios that utilize GroupedLayout to visually highlight specific network events.
4.2.2 Virtual Network Layout Example I: Wireless Network Broadcast. Ef-
fectively visualizing network events requires the visualization logic to create a picture
where users can quickly and accurately understand what is happening in the network.
Wireless networks is a difficult venue fill this requirement. This is because wireless
packets are often broadcast to multiple nodes and without link lines highlighting a
packets path it is difficult to know a packets final destination. Tracing wireless packet
routes becomes even more difficult as more and more wireless nodes broadcast and
the areas around nodes becomes more and more congested with packet traffic.
This framework overcomes these challenges by using GroupedLayout. Using
GroupedLayout a network of many nodes groups together based on node communica-
tion. Nodes that broadcast to one another group together to make packet destinations
obvious. Figure 4.6 shows a wireless trace file excerpt with one hop event followed
by six receive events, each at different nodes. Tracking these packets could be dif-
Figure 4.6: NS-2 trace directing wireless broadcast from node 1 to nodes: 14, 6,47, 40, 36, 12. As shown in Figure 4.7
ficult in a physical network layout, especially if the nodes were far apart or packet
traffic was high. However, Figure 4.7 illustrates how this visualization framework’s
GroupedLayout emphasizes wireless packet destinations making them easier to track.
Also, by quickly highlighting packet destinations additional network conditions may
become apparent such as: defective nodes, compromised nodes, and nodes that are
obstructed from sent packet transmissions.
43

(a) Collection of 50 wireless nodes visualizedusing force-directed layout prior to any packetbroadcasts at time zero
(b) Identical network at the same time zoomedin using prefuse toolkit zoom feature
(c) Packet broadcast from node 1: grouped layout causes nodes receiving packets to move closer tonode 1
Figure 4.7: Wireless packet broadcast using combination of force-directed andgrouped layout
44
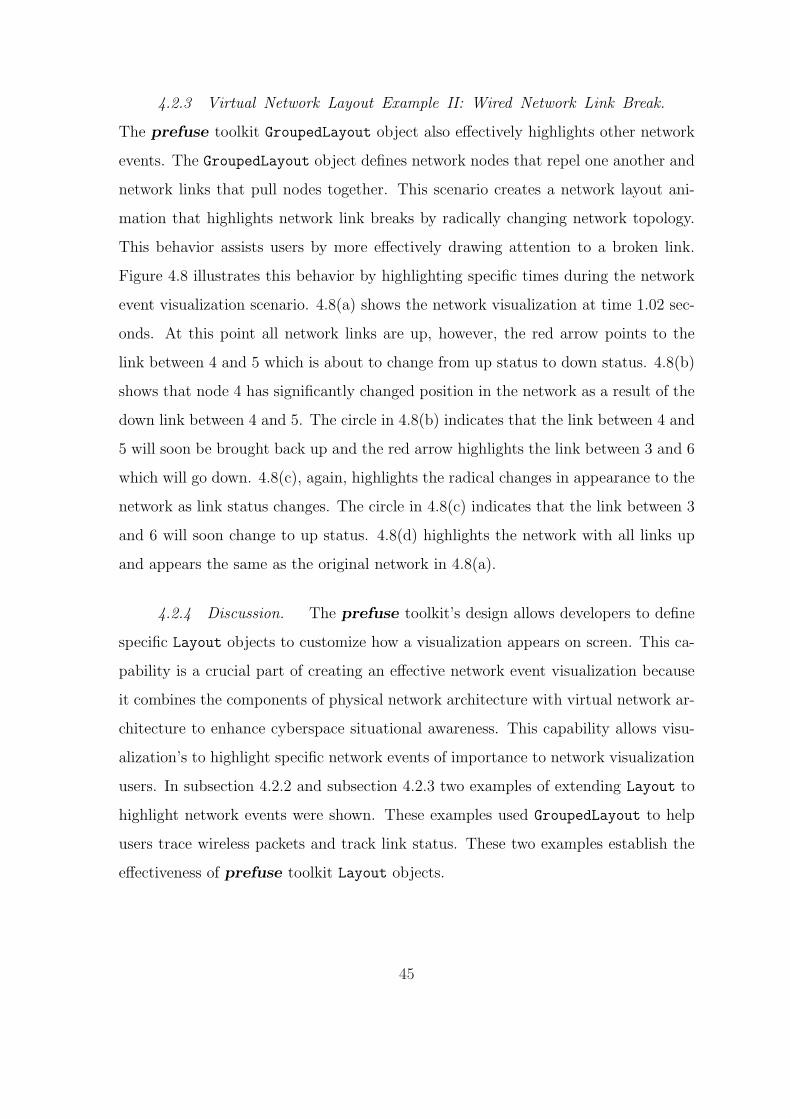
4.2.3 Virtual Network Layout Example II: Wired Network Link Break.
The prefuse toolkit GroupedLayout object also effectively highlights other network
events. The GroupedLayout object defines network nodes that repel one another and
network links that pull nodes together. This scenario creates a network layout ani-
mation that highlights network link breaks by radically changing network topology.
This behavior assists users by more effectively drawing attention to a broken link.
Figure 4.8 illustrates this behavior by highlighting specific times during the network
event visualization scenario. 4.8(a) shows the network visualization at time 1.02 sec-
onds. At this point all network links are up, however, the red arrow points to the
link between 4 and 5 which is about to change from up status to down status. 4.8(b)
shows that node 4 has significantly changed position in the network as a result of the
down link between 4 and 5. The circle in 4.8(b) indicates that the link between 4 and
5 will soon be brought back up and the red arrow highlights the link between 3 and 6
which will go down. 4.8(c), again, highlights the radical changes in appearance to the
network as link status changes. The circle in 4.8(c) indicates that the link between 3
and 6 will soon change to up status. 4.8(d) highlights the network with all links up
and appears the same as the original network in 4.8(a).
4.2.4 Discussion. The prefuse toolkit’s design allows developers to define
specific Layout objects to customize how a visualization appears on screen. This ca-
pability is a crucial part of creating an effective network event visualization because
it combines the components of physical network architecture with virtual network ar-
chitecture to enhance cyberspace situational awareness. This capability allows visu-
alization’s to highlight specific network events of importance to network visualization
users. In subsection 4.2.2 and subsection 4.2.3 two examples of extending Layout to
highlight network events were shown. These examples used GroupedLayout to help
users trace wireless packets and track link status. These two examples establish the
effectiveness of prefuse toolkit Layout objects.
45

(a) Wired network topology–arrows point outnetwork links that will go down
(b) Altered network topology–arrow points tolink that will go down and oval shows links thatwill go up
(c) New network topology–arrow points to linkcurrently carrying packets which will go down,oval show link currently not visible that will goup
(d) Original network topology restored
Figure 4.8: Wired Network showing network topology animation in response linkstatus changes from up to down
46

4.3 Analysis-based User Interface
Building an effective network visualization framework requires a user interface
that gives users the ability to alter specific visualization characteristics. The frame-
work created through this research uses the prefuse visualization toolkit to provide
many commonly used visualization capabilities. The prefuse design not only contains
many commonly used visualization capabilities, but also allows for easy extension of
existing prefuse classes into user defined classes. Some of the prefuse visualiza-
tion toolkit capabilities include: panning, zooming, drag control, and focus control.
By capturing these prefuse capabilities in a network event visualization framework
this research contributes a new approach for developing network event visualization
software.
Figure 4.9 shows the prefuse visualization toolkit design for handling various
visualization controls as described previously (see PanControl, AbstractZoomControl,
DragControl, and FocusControl). One of the major benefits of the prefuse visual-
ization toolkit is that when the toolkit design is understood it is easy to add additional
functionality. An example of this is shown in Figure 4.9 by extending FocusControl
with SuperFocusControl. This action overrides itemKeyPressed, itemClicked, and
mouseClicked methods to redefine how the visualization assigns focus when the user
clicks on the visualization background. SuperFocusControl changes visualization fo-
cus to nothing when the user clicks on the background; a more intuitive result then
keeping the focus the same. Extending prefuse base classes, like FocusControl, and
overriding certain methods demonstrates an elegent way to enhance and customize
visualization behavior.
Other helpful user interface capabilities included in this visualization framework
are: fast-forward/rewind, pause, jump slider, and user-input jump. Again, these
controls assist the user during analysis of network events during the visualization.
Many of these features are included with Nam, however, the user-input jump is a new
feature not included in Nam. Figure 4.10 illustrates these different user interfaces.
47

Figure 4.9: Prefuse visualization architecture for handling various visualizationcontrol capabilities. SuperFocusControl is a new visualization control added bythis framework to custimize how focus changes when users click on the visualizationbackground.
4.4 Testing and Validating the Visualization Framework
The previous examples of wireless node broadcasts and a disabled network links
demonstrate some of this frameworks features. The two network visualization ex-
amples illustrate the visualizations capability to show wireless and wired topologies,
wired packet traffic, wireless broadcasts, disabled links, and dropped packets. This
section further verifies this framework’s capability to visualize network events from
a trace file by showing: packet movement (including queueing) in different network
topologies and wireless node movement.
48

Figure 4.10: Network Visualization framework user-interface with visualization con-trols highlighted
4.4.1 Wired packet queueing. Figure 4.11 and Figure 4.12 illustrate distinct
capabilities of this visualization framework. 4.11(a) shows extracted lines from a
Nam trace accounting for packet sends and packet queues. 4.11(b) shows extracted
lines from the same Nam trace accounting for packet dequeues. The dequeues in
4.11(b) are significant because in the Figure 4.12 screenshots these dequeues have
not yet occurred. Figure 4.12 shows Nam and this visualization framework paused at
the same time during their visualizations. At this point in time all queued packets in
4.11(b) are visible in the two screenshots and appear as they should in the node queues.
Therefore, Figure 4.12 verifies wired packet queueing for this framework because it
matches the Nam visualization. Additionally, the packet traffic in Figure 4.12 is
identical between Nam and this framework which verifies wired packet transmissions.
4.4.2 Wireless node movement. Figure 4.7 showed a wireless network topol-
ogy using the force-directed layout. However, this visualization framework can also
show the same network topology using node x,y coordinates specified in the trace
file. The frameowork layout that provides this capability is GeographicLayout (see
Figure 4.5. Combining the GeographicLayout with the node mobility data struc-
49
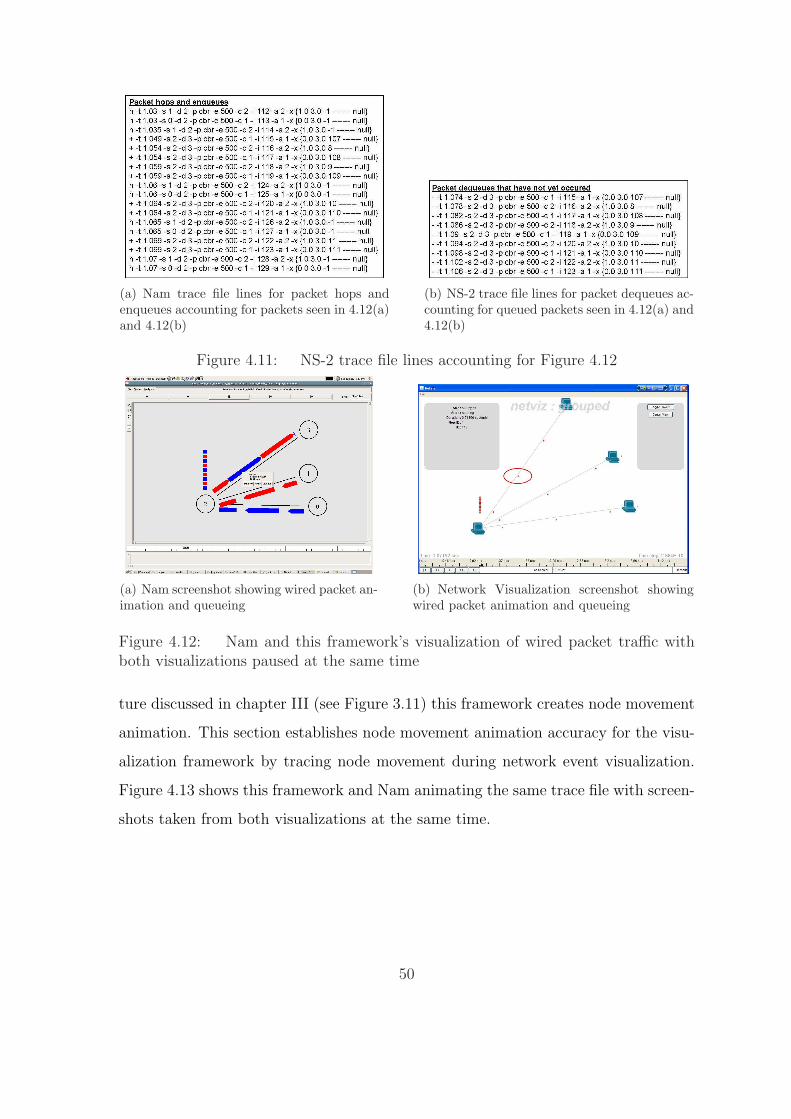
(a) Nam trace file lines for packet hops andenqueues accounting for packets seen in 4.12(a)and 4.12(b)
(b) NS-2 trace file lines for packet dequeues ac-counting for queued packets seen in 4.12(a) and4.12(b)
Figure 4.11: NS-2 trace file lines accounting for Figure 4.12
(a) Nam screenshot showing wired packet an-imation and queueing
(b) Network Visualization screenshot showingwired packet animation and queueing
Figure 4.12: Nam and this framework’s visualization of wired packet traffic withboth visualizations paused at the same time
ture discussed in chapter III (see Figure 3.11) this framework creates node movement
animation. This section establishes node movement animation accuracy for the visu-
alization framework by tracing node movement during network event visualization.
Figure 4.13 shows this framework and Nam animating the same trace file with screen-
shots taken from both visualizations at the same time.
50
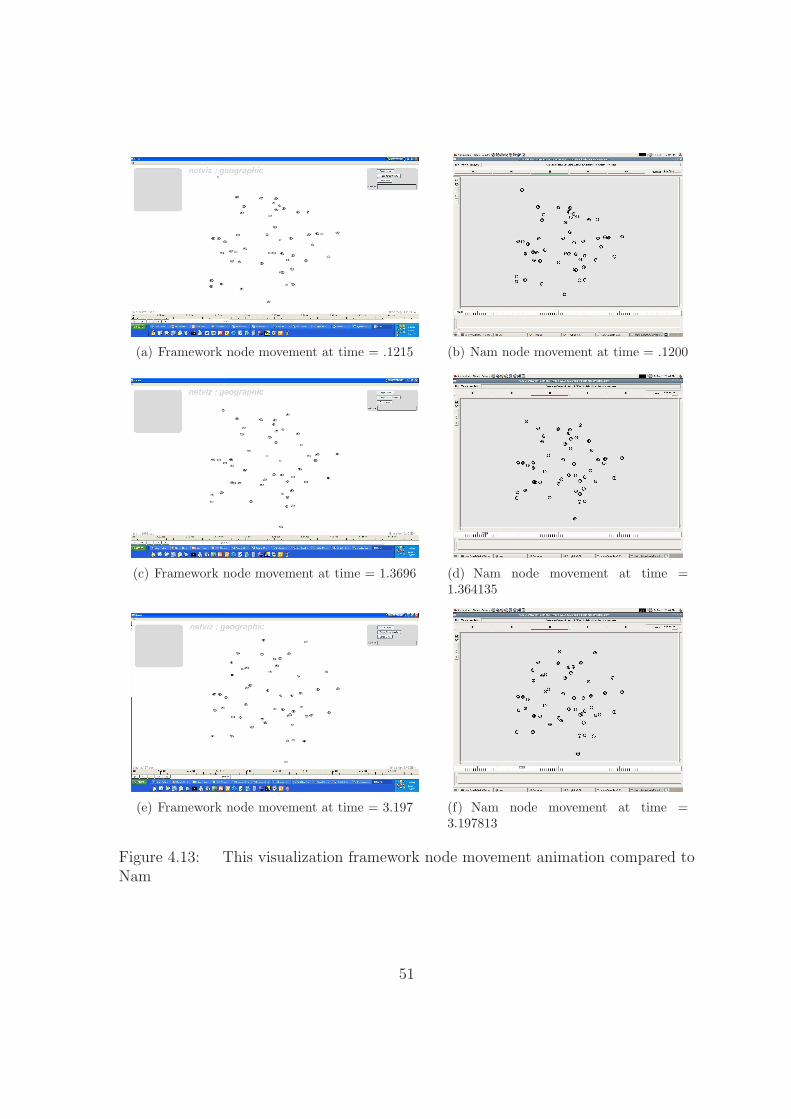
(a) Framework node movement at time = .1215 (b) Nam node movement at time = .1200
(c) Framework node movement at time = 1.3696 (d) Nam node movement at time =1.364135
(e) Framework node movement at time = 3.197 (f) Nam node movement at time =3.197813
Figure 4.13: This visualization framework node movement animation compared toNam
51
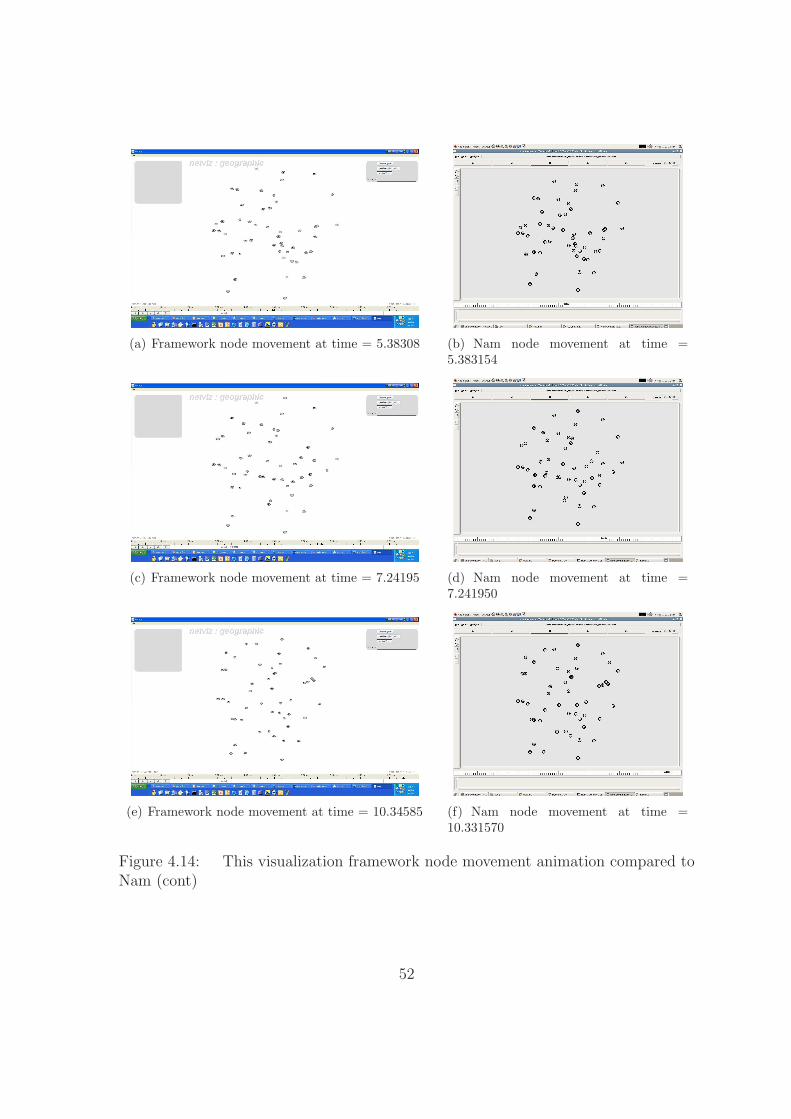
(a) Framework node movement at time = 5.38308 (b) Nam node movement at time =5.383154
(c) Framework node movement at time = 7.24195 (d) Nam node movement at time =7.241950
(e) Framework node movement at time = 10.34585 (f) Nam node movement at time =10.331570
Figure 4.14: This visualization framework node movement animation compared toNam (cont)
52

Figure 4.15: Wireless packet trace for wireless packet travelling from node 3 to 4and finally node 2
4.4.3 Wireless and wired network topology packet trace. Visual inspection of
wireless traffic reveals an interesting differences between this visualization framework
and Nam. Figure 4.15 defines network packet traffic for packet ID 64 originating at
node 3. Packet 64 is first sent to node 4 and then from node 4 it is sent to node
2. Figure 4.16 shows these two packet transmissions visualized by this framework.
Figure 4.16(a) shows the first wireless transmission for packet 64 from node 3 to node
4. Figure 4.16(b) shows the second wireless transmission from node 4 to node 2. The
visualization screenshots in Figure 4.16 verify that this framework accurately shows
wireless packet broadcasts for packet 64. However, running the same trace file in
Nam highlights inaccuracies in the visualization. Figure 4.17(a) shows the wireless
packet moving between nodes 3 and 4 and Figure 4.17(b) shows the packet moving
between nodes 4 and 2. Figure 4.17(b) clearly shows a packet in route to node 4,
however, Figure 4.17(b) also shows that the same packet is actually broadcast from
node 4 before the enroute packet from node 3 actually arrives. Figure 4.17 points out
a wireless packet visualization error with Nam wireless packet animation. Packet 64
is not correctly visualized and does not accurately reflect the behavior defined by the
the trace shown in Figure 4.15.
4.5 Discussion
The examples in this section illustrate the capabilities of this visualization frame-
work. The framework is extensible and allows multiple trace file formats to be parsed
and visualized. This capability will invite new levels of analysis across different net-
work simulators–providing a common visualization framework to analyze differences
53
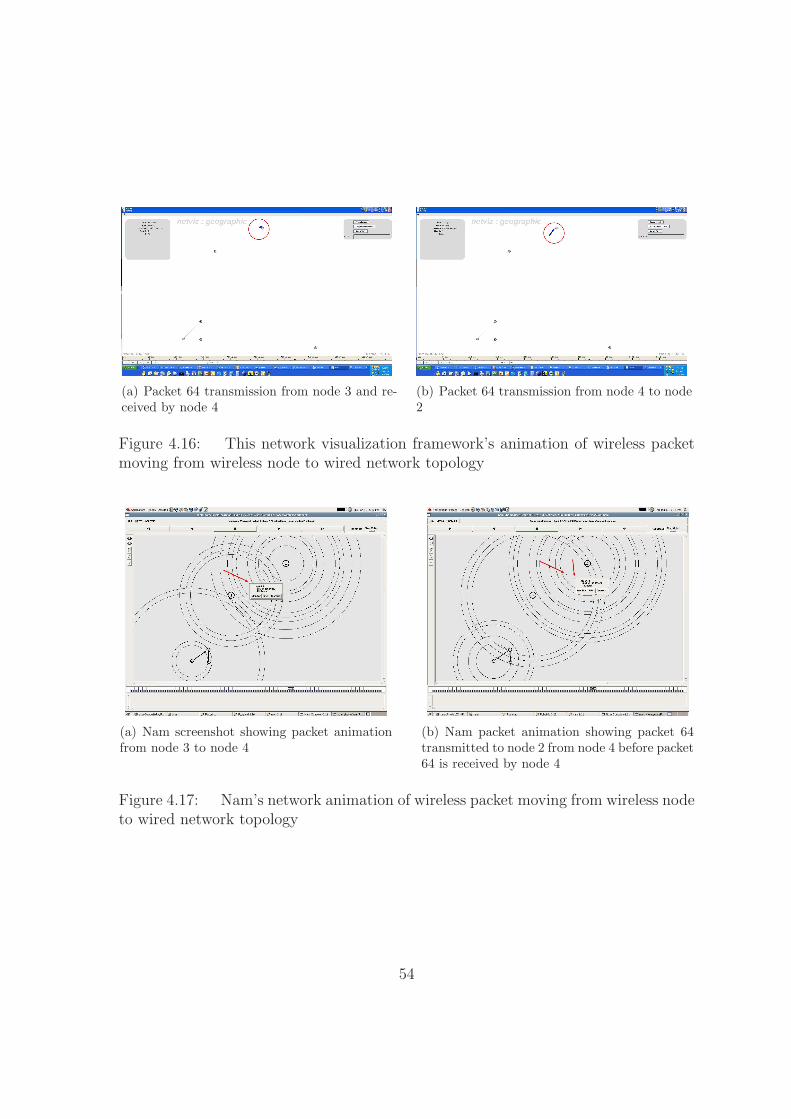
(a) Packet 64 transmission from node 3 and re-ceived by node 4
(b) Packet 64 transmission from node 4 to node2
Figure 4.16: This network visualization framework’s animation of wireless packetmoving from wireless node to wired network topology
(a) Nam screenshot showing packet animationfrom node 3 to node 4
(b) Nam packet animation showing packet 64transmitted to node 2 from node 4 before packet64 is received by node 4
Figure 4.17: Nam’s network animation of wireless packet moving from wireless nodeto wired network topology
54

in simulators. Also the new framework gives users enhanced user-interface controls
which give user precise visualization control. The extensible network topology layouts
give users the ability to define how network events are visualized. This ability puts
users in command of what network event information is relevant and allows them to
remove irrelevant information from the visualization through new prefuse Layout
development. The visualization framework steps forward with these new capabilities
and contributes to future network research and analysis.
55
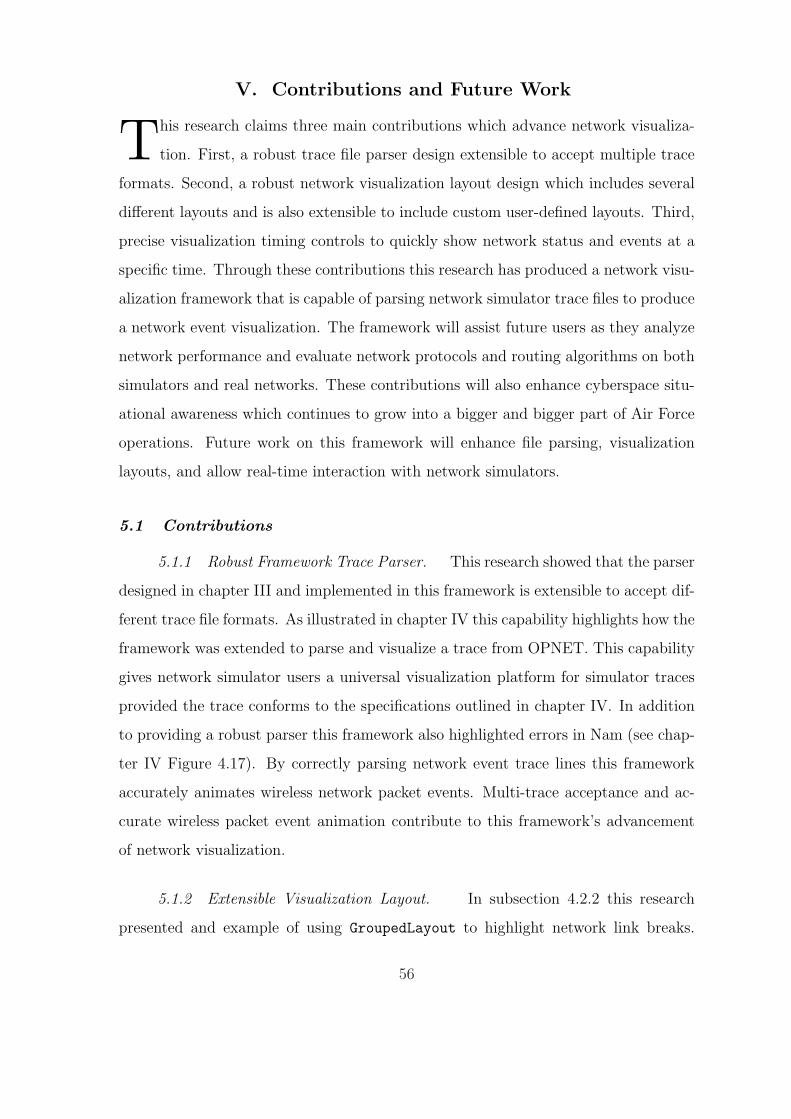
V. Contributions and Future Work
This research claims three main contributions which advance network visualiza-
tion. First, a robust trace file parser design extensible to accept multiple trace
formats. Second, a robust network visualization layout design which includes several
different layouts and is also extensible to include custom user-defined layouts. Third,
precise visualization timing controls to quickly show network status and events at a
specific time. Through these contributions this research has produced a network visu-
alization framework that is capable of parsing network simulator trace files to produce
a network event visualization. The framework will assist future users as they analyze
network performance and evaluate network protocols and routing algorithms on both
simulators and real networks. These contributions will also enhance cyberspace situ-
ational awareness which continues to grow into a bigger and bigger part of Air Force
operations. Future work on this framework will enhance file parsing, visualization
layouts, and allow real-time interaction with network simulators.
5.1 Contributions
5.1.1 Robust Framework Trace Parser. This research showed that the parser
designed in chapter III and implemented in this framework is extensible to accept dif-
ferent trace file formats. As illustrated in chapter IV this capability highlights how the
framework was extended to parse and visualize a trace from OPNET. This capability
gives network simulator users a universal visualization platform for simulator traces
provided the trace conforms to the specifications outlined in chapter IV. In addition
to providing a robust parser this framework also highlighted errors in Nam (see chap-
ter IV Figure 4.17). By correctly parsing network event trace lines this framework
accurately animates wireless network packet events. Multi-trace acceptance and ac-
curate wireless packet event animation contribute to this framework’s advancement
of network visualization.
5.1.2 Extensible Visualization Layout. In subsection 4.2.2 this research
presented and example of using GroupedLayout to highlight network link breaks.
56

This section presents a possible real-world scenario to emphasize the possible impact
a network link going down. Additionally, this section highlights how by using this
framework with the GroupLayout commanders can receive early warning of upcoming
information loss.
Figure 5.1 illustrates a possible real-world scenario for monitoring a military
network. Figure 5.1 shows visualization screenshots that illustrate what is happening
in the network. This network scenario focuses on the UAV node to highlight frame-
work capabilities. Figure 5.1(a) shows the initial network with all links up and the
UAV communication with the satellite. In Figure 5.1(b) the link between the satellite
and the UAV goes down and the UAV has to re-route traffic through the aircraft
carrier. Figure 5.1(c) shows the result of this UAV traffic re-routing as the queue on
the aircraft carrier begins to spike from the increased network traffic.
This scenario illustrates the power of this visualization framework. First, the
link break dramatically altered the network topology and aligned the UAV more with
the carrier than with the satellite. Second, the visualization shows the aircraft carriers
queue spike indicating that the traffic load is too great and eventually information
will be lost. In a real-world scenario these two factors would alert network analysts
to inform commanders of the potential information loss and evasive action could
be taken. This possible scenario shows how this network visualization framework
provides vital network situational awareness.
5.1.3 User Interface. This framework employs a precise user-interface to
assist users while navigating through a network visualization. Key to efficient analysis
are precise timing controls. These controls allow the user to quickly jump to a specific
time without having to use fast forward or rewind features which commonly result
and overshooting the desired time period. Additionally node statistics are given
when a user clicks on a desired node. Figure 5.2 illustrates this feature by showing
packet receives, drops, and receive/drop percentages. These features give the user the
57
control and information needed to perform network performance analysis at a higher
level than other network visualizations.
5.2 Future Work
The three major contributions of this research already show promise for im-
provement which is exciting because it validates the importance of the robust design
used to create the contributions. Future framework iterations will build on this ro-
bust design. Parser enhancement will better organize code to facilitate robust creation
of trace file parsers. Layout enhancements will better visualize large wired network
topologies. Finally, using the methodology discussed in chapter III and the OPNET
toolkit developed by Mark Coyne [6] this visualization will interact real-time with the
OPNET simulator.
5.2.1 Parser Enhancements. Additional research is needed for using net-
work simulator trace files in a network visualization. This research used 16 different
traces to examine network visualization performance. One of these traces was from
OPNET, but the rest were from NS-2. The visualization could be greatly benefited
by examining more traces from different simulators to establish the framework as a
robust network visualization framework.
Currently framework implementation creates TraceLine subclasses using a chain
of conditional logic which tests which subclass is needed. A better design would re-
place this logic with a TraceLine factory. The factory would hold all the logic to
determine the TraceLine subclass needed to parse network events into the prefuse
visualization data structures. Also, by centralizing TraceLine subclass creation into
a factory developer parser modifications would be more intuitive.
5.2.2 Layout Enhancements. Currently this visualization framework has
two separate layouts: GeographicLayout and GroupedLayout. However, large net-
work topology trace files that do not specify node location and have nodes that are
58

(a) Real-world network scenario. Here the UAV is communicat-ing via satellite
(b) UAV to satellite link goes down and UAV begins to commu-nicate with the aircraft carrier
(c) As a direct result of increased traffic from the UAV the aircraftcarrier’s packet queue begins to fill up
Figure 5.1: Potential real-world network scenario
59
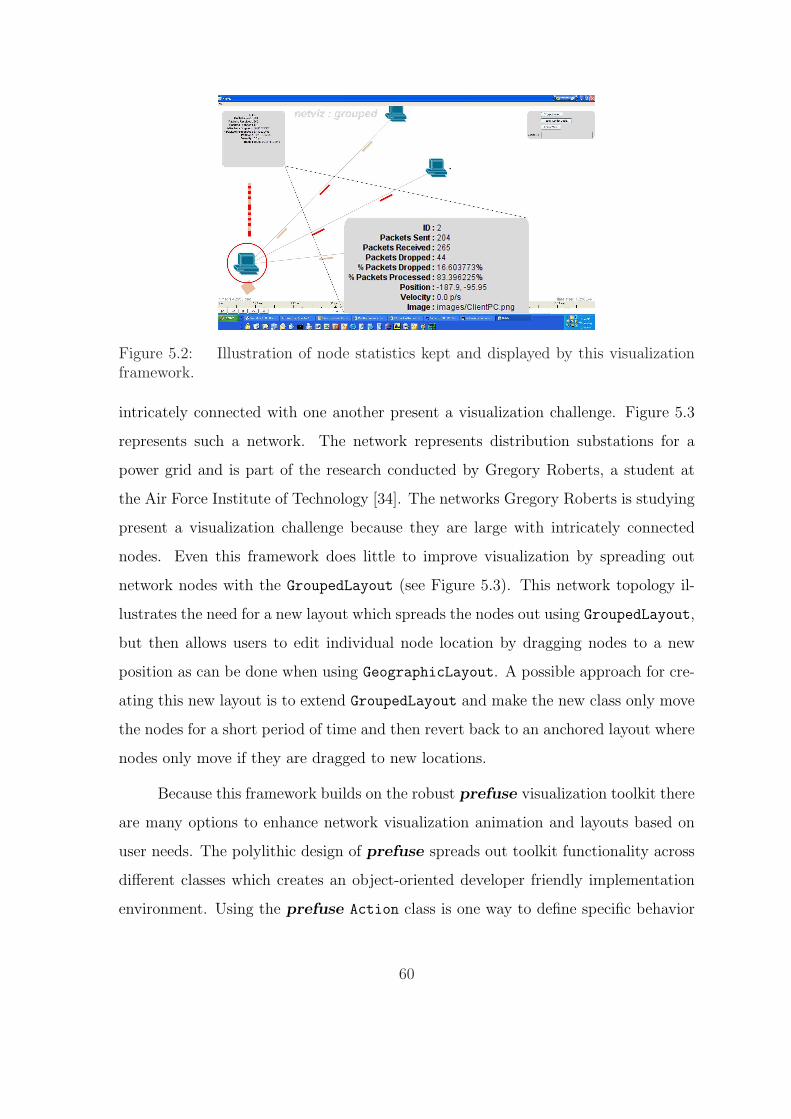
Figure 5.2: Illustration of node statistics kept and displayed by this visualizationframework.
intricately connected with one another present a visualization challenge. Figure 5.3
represents such a network. The network represents distribution substations for a
power grid and is part of the research conducted by Gregory Roberts, a student at
the Air Force Institute of Technology [34]. The networks Gregory Roberts is studying
present a visualization challenge because they are large with intricately connected
nodes. Even this framework does little to improve visualization by spreading out
network nodes with the GroupedLayout (see Figure 5.3). This network topology il-
lustrates the need for a new layout which spreads the nodes out using GroupedLayout,
but then allows users to edit individual node location by dragging nodes to a new
position as can be done when using GeographicLayout. A possible approach for cre-
ating this new layout is to extend GroupedLayout and make the new class only move
the nodes for a short period of time and then revert back to an anchored layout where
nodes only move if they are dragged to new locations.
Because this framework builds on the robust prefuse visualization toolkit there
are many options to enhance network visualization animation and layouts based on
user needs. The polylithic design of prefuse spreads out toolkit functionality across
different classes which creates an object-oriented developer friendly implementation
environment. Using the prefuse Action class is one way to define specific behavior
60

Figure 5.3: Example of prefuse Action objects used to enlarge scrolled over nodesand hight nodes sharing a link
for specific VisualItem objects. Figure 5.3 shows two examples of custom Action
objects defined to alter the appearance of network nodes. One Action increases node
size when a user scrolls over a node and the other colors neighbor nodes sharing a link
with the node. These are only two examples of using the prefuse Action objects
to enhance the network visualization. Future development will continue to customize
network visualizations using not only the Action object but Layout, Control, and
others.
Extending Layout, Action, and Control to enhance visualizations will continue
to be a part of any framework that utilizes the prefuse toolkit. The classes in this
toolkit are designed with that very purpose in mind. The examples listed in this
section are only some of the changes that will be made to this framework in the
future as it continues to grow into a more effective network visualization framework.
5.2.3 Network Simulator Interaction. A major emphasis of network visual-
ization research is to provide a network visualization that can interact with a network
simulator to alter network events at runtime. Figure 5.4 shows a design for this
interaction. Creating this kind of visualization requires, at least at some level, an
understanding of how network simulators work internally. Additionally, the visual-
61

ization must be equipped to communicate with the network simulator. This research
provided a design for this communication, however, the actual implementation re-
mains incomplete. Implementing and testing simulation to visualization interaction
remains as an area of future work for this network visualization framework.
[6]
Figure 5.4: Diagram illustrating network simulator interaction goals. Diagramhighlights feedback loop between Network Visualization (this framework) and Net-work simulators via their respective toolkits
5.2.4 Discussion. Because the framework is still in developmental stages,
some errors exist in the implementation. One of these problems is out of sync node
movement from the trace being visualized. This anomaly is avoidable by not using the
jump or slider functionality of the user-interface, however this limits the usefulness of
the visualization for analysis of network events.
62

Despite these anomalies this research provides an effective framework capable of
accurately visualizing network events from a network simulator trace file. The parser
framework design facilitates parsing trace files with different formats. Additional
features of the framework include two different network layouts that can highlight
network event trace data in dramatically different ways. The layout design is in-
cluded in this research to illustrate how future work can create new layout designs to
highlight user-specific network trace events. This network visualization contributes
these features towards advancing network visualization and network event analysis
and provides a solid framework base for future development.
5.3 Conclusion
This research has studied several different existing network visualization soft-
ware and data visualization toolkits. This study resulted in questions about current
network visualization software, data visualization toolkits, and how they could be
combined to created a more robust and effective network visualization. As a direct
result of these questions this research has created a network visualization framework
using the prefuse toolkit. This framework meets the standards of existing network
visualization frameworks in some cases and in others exceeds them. This framework
excels with robust network simulator trace filing parsing, extensible network visual-
ization layouts, and precise visualization timing controls. This network visualization
framework advances network visualization standards and provides capabilities for fu-
ture advancement.
63
Bibliography
1. Adar, Eytan. “GUESS: a language and interface for graph exploration”. CHI ’06:Proceedings of the SIGCHI conference on Human Factors in computing systems,791–800. ACM Press, New York, NY, USA, 2006. ISBN 1-59593-372-7.
2. Agrawala, Maneesh. “Software Design Patterns for Information Visualization”.IEEE Transactions on Visualization and Computer Graphics, 12(5):853–860,2006. ISSN 1077-2626. Student Member-Jeffrey Heer.
3. Bederson, Benjamin B., Jesse Grosjean, and Jon Meyer. “Toolkit Design forInteractive Structured Graphics”. IEEE Trans. Softw. Eng., 30(8):535–546, 2004.ISSN 0098-5589.
4. Breitkreutz, B. J., C. Stark, and M. Tyers. “Osprey: a network visu-alization system.” Genome Biol, 4(3), 2003. ISSN 1465-6914. URLhttp://www.ncbi.nlm.nih.gov/entrez/query.fcgi?cmd=Retrieve\&db=pubmed\&dopt=Abstract\&list uids=12620107.
5. Cabrera, A. Trivino and E. Casilari. “Network Simulator: A Learning Tool forWireless Technologies”. Current Developments in Technology-Assisted Education,3:1979–1983, 2006.
6. Coyne, Mark E., 2nd Lieutenant USAF. Hot Swapping Protocol Implementationsin the OPNET Modeler Development Environment. Master’s thesis, Air ForceInstitute of Technology, March 2008.
7. Estrin, Deborah, Mark Handley, John Heidemann, Steven McCanne, Ya Xu, andHaobo Yu. “Network Visualization with Nam, the VINT Network Animator”.Computer, 33(11):63–68, 2000. ISSN 0018-9162.
8. Fall, K. and K. Varadhan. “The NS Manual (Formerly NS Notes and Documen-tation”, 2002. URL citeseer.ist.psu.edu/article/fall03ns.html.
9. Fowler, Martin. Refactoring: Improving the Design of Existing Code. Addison-Wesley, Boston, MA, USA, 1999. ISBN 0-201-48567-2.
10. Fowler, Martin. Patterns of Enterprise Application Architecture. Addison-WesleyLongman Publishing Co., Inc., Boston, MA, USA, 2002. ISBN 0321127420.
11. Fredrick, Missy. “Growing Use of UAVs Strains Bandwidth”, July 2006. URLhttp://www.space.com/spacenews/archive06/Uav 071706.html. February 5,2008.
12. Freeman, Eric, Elisabeth Freeman, Kathy Sierra, and Bert Bates. Head FirstDesign Patterns. O’Reilly, 2004.
64

13. Gamma, Erich, Richard Helm, Ralph Johnson, and John Vlisside. Design Pat-terns: Elements of Reusable Object-Oriented Software. Addison-Wesley, Reading,Massachusetts, 1995.
14. ‘Georgia Institute of Technology’. “GTNets”. URL http://www.ece.gatech.
edu/research/labs/MANIACS/GTNetS/. February 5, 2008.
15. Griebsch, Jan, Oliver Arafat, and Wolfram Koska. “xAnVi - An Extensible Visu-alization and Analysis Framework”. IV ’06: Proceedings of the conference on In-formation Visualization, 45–52. IEEE Computer Society, Washington, DC, USA,2006. ISBN 0-7695-2602-0.
16. Heer, Jeffrey, October 2007. URL http://www.prefuse.org/. February 5, 2008.
17. Heer, Jeffrey. “Prefuse”, September 2007. URL http://www.infovis-wiki.
net/index.php?title=Prefuse. February 5, 2008.
18. Heer, Jeffrey, Stuart K. Card, and James A. Landay. “prefuse: a toolkit for inter-active information visualization”. CHI ’05: Proceeding of the SIGCHI conferenceon Human factors in computing systems, 421–430. ACM Press, New York, NY,USA, 2005. ISBN 1581139985. URL http://portal.acm.org/citation.cfm?
id=1055031.
19. Heidemann, J., N. Bulusu, J. Elson, C. Intanagonwiwat, K. Lan, Y. Xu, W. Ye,D. Estrin, and R. Govindan. “Effects of detail in wireless network simulation”,2001. URL citeseer.ist.psu.edu/heidemann00effects.html.
20. ‘Human-Computer Interaction Lab’. “Piccolo Toolkit”. URL http://www.cs.
umd.edu/hcil/jazz/. February 5, 2008.
21. Iragne, Florian, Macha Nikolski, Bertrand Mathieu, David Auber, and DavidSherman. “ProViz: protein interaction visualization and exploration”. Bioinfor-matics, 21(2):272–274, 2005. ISSN 1367-4803.
22. James, R.J. “A history of radar”. IEE Review, 35(9):343–349, 5 Oct 1989. ISSN0953-5683.
23. ‘JUNG: Java Universal Network/Graph Framework’. URL http://jung.
sourceforge.net/. February 5, 2008.
24. Keeve, Erwin, Thomas Jansen, Zdzislaw Krol, Lutz Ritter, and Bartosz vonRymon-Lipinski. “JULIUS - An Extendable Software Framework for Surgi-cal Planning”. Caesar, Berlin, Germany, 2001. URL http://www.caesar.de/
fileadmin/user upload/ssl/Publications/C01-6.pdf.
25. Kohlbacher O, Lenhof HP. “BALL–rapid software prototyping in computa-tional molecular biology”. URL http://www.billingpreis.mpg.de/hbp00/
kohlbacher.pdf.
26. Kurkowski, Stuart, Tracy Camp, and Michael Colagrosso. “A Visualization andAnimation Tool for NS-2 Wireless Simulations: iNSpect”. URL citeseer.ist.
psu.edu/kurkowski04visualization.html.
65

27. Larish, G.; Nguyen P.; Legaspi A., B.; Riley. “Quality of service analysis using theGeorgia Tech network simulator”. Military Communications Conference, 2005.MILCOM 2005. IEEE, 2649–2654 Vol. 4, 17-20 Oct. 2005.
28. Lee, Bongshin, Cynthia S. Parr, Catherine Plaisant, Benjamin B. Bederson,Vladislav D. Veksler, Wayne D. Gray, and Christopher Kotfila. “TreePlus: In-teractive Exploration of Networks with Enhanced Tree Layouts”. IEEE Trans-actions on Visualization and Computer Graphics, 12(6):1414–1426, 2006. ISSN1077-2626.
29. Onut, Iosif-Viorel, Bin Zhu, and Ali A. Ghorbani. “A novel visualization techniquefor network anomaly detection”. PST, 167–174. 2004.
30. ‘Osprey Network Visualization System Reference Manual Version 1.2.0’. URLhttp://biodata.mshri.on.ca/osprey/OspreyHelp/index.html. February 5,2008.
31. Poole, Charles J. and Allen Higgins. “Extreme Maintenance”. ICSM ’01: Proceed-ings of the IEEE International Conference on Software Maintenance (ICSM’01),301. IEEE Computer Society, Washington, DC, USA, 2001. ISBN 0-7695-1189-9.
32. Riley, George F. “Using the Georgia Tech Network Simulator”. URL http:
//www.ece.gatech.edu/research/labs/MANIACS/GTNetS/docs/gtnets.pdf.
33. Riley, George F. “The Georgia Tech Network Simulator”. MoMeTools ’03: Pro-ceedings of the ACM SIGCOMM workshop on Models, methods and tools forreproducible network research, 5–12. ACM, New York, NY, USA, 2003. ISBN1-58113-748-8.
34. Roberts, Gregory R., Captain USAF. Evaluating Security and Quality of ServiceConsiderations in Critical Infrastructure Communication Networks. Master’s the-sis, Air Force Institute of Technology, March 2008.
35. Shaw, Al, Robert Mills, Barry Mullins, and Kenneth Hopkinson. “A MultilayerGraph Approach to Correlating Network Events with Operational Mission Im-pact”, June 2007.
36. Stark, Chris, Bobby-Joe Breitkreutz, Teresa Reguly, Lorrie Boucher, AshtonBreitkreutz, and Mike Tyers. “BioGRID: a general repository for interactiondatasets”. Nucleic Acids Research, 34(Database-Issue):535–539, 2006.
37. Trolltech. “Qt: Cross-Platform Rich Client Development Framework”, 2008. URLhttp://trolltech.com/products/qt. Online. Internet. Site accessed February5, 2008.
38. Wilson, Clay. “Network Centric Warefare: Background and Oversight Issues forCongress”. Congressional Research Service, June 2004.
39. Zhang, Xin and George F. Riley. “Bluetooth Simulations for Wireless Sensor Net-works Using GTNetS”. MASCOTS ’04: Proceedings of the The IEEE Computer
66

Society’s 12th Annual International Symposium on Modeling, Analysis, and Sim-ulation of Computer and Telecommunications Systems (MASCOTS’04), 375–382.IEEE Computer Society, Washington, DC, USA, 2004. ISBN 0-7695-2251-3.
67

REPORT DOCUMENTATION PAGE Form ApprovedOMB No. 0704–0188
The public reporting burden for this collection of information is estimated to average 1 hour per response, including the time for reviewing instructions, searching existing data sources, gathering andmaintaining the data needed, and completing and reviewing the collection of information. Send comments regarding this burden estimate or any other aspect of this collection of information, includingsuggestions for reducing this burden to Department of Defense, Washington Headquarters Services, Directorate for Information Operations and Reports (0704–0188), 1215 Jefferson Davis Highway,Suite 1204, Arlington, VA 22202–4302. Respondents should be aware that notwithstanding any other provision of law, no person shall be subject to any penalty for failing to comply with a collectionof information if it does not display a currently valid OMB control number. PLEASE DO NOT RETURN YOUR FORM TO THE ABOVE ADDRESS.
1. REPORT DATE (DD–MM–YYYY) 2. REPORT TYPE 3. DATES COVERED (From — To)
4. TITLE AND SUBTITLE 5a. CONTRACT NUMBER
5b. GRANT NUMBER
5c. PROGRAM ELEMENT NUMBER
5d. PROJECT NUMBER
5e. TASK NUMBER
5f. WORK UNIT NUMBER
6. AUTHOR(S)
7. PERFORMING ORGANIZATION NAME(S) AND ADDRESS(ES) 8. PERFORMING ORGANIZATION REPORTNUMBER
9. SPONSORING / MONITORING AGENCY NAME(S) AND ADDRESS(ES) 10. SPONSOR/MONITOR’S ACRONYM(S)
11. SPONSOR/MONITOR’S REPORTNUMBER(S)
12. DISTRIBUTION / AVAILABILITY STATEMENT
13. SUPPLEMENTARY NOTES
14. ABSTRACT
15. SUBJECT TERMS
16. SECURITY CLASSIFICATION OF:
a. REPORT b. ABSTRACT c. THIS PAGE
17. LIMITATION OFABSTRACT
18. NUMBEROFPAGES
19a. NAME OF RESPONSIBLE PERSON
19b. TELEPHONE NUMBER (include area code)
Standard Form 298 (Rev. 8–98)Prescribed by ANSI Std. Z39.18
27–03–2008 Master’s Thesis May 2006 — Mar 2008
Network Visualization Designusing
Prefuse Visualization Framework
JON # 08-175
J. Mark Belue, Capt, USAF
Air Force Institute of TechnologyGraduate School of Engineering and Management AFIT/EN2950 Hobson WayWPAFB OH 45433-7765
AFIT/GCS/ENG/08-03
AFOSR/NMATTN: David Luginbuhl875 N. Randolph, Ste.325, Rm. 3112Arlington Virginia, 22203DSN: 426-6207email: [email protected]
Approval for public release; distribution is unlimited.
Visualization of network simulation events or network visualization is an effective and low cost method to evaluate thehealth and status of a network and analyze network designs, protocols, and network algorithms. This research designedand developed a network event visualization framework using an open source general visualization toolkit. This researchachieved three major milestones during the development of this framework: A robust network simulator trace file parser,multiple network visualization layouts–including user-defined layouts, and precise visualization timing controls andintegrated display of network statistics.The toolkit design is readily extensible allowing developers to easily expand theframework to meet research-specific visualization goals.
Network, Visualization, Network Simulator, Network Visualization
U U U UU 80
Lt Col Stuart Kurkowski, PhD
(937) 785–3636, ext 7228; e-mail: [email protected]