AIR DEPOSITION OF MERCURY AND OTHER AIRBORNE POLLUTANTS … · as hazardous air pollutants in the...
34
AIR DEPOSITION OF MERCURY AND OTHER AIRBORNE POLLUTANTS IN THE ARID SOUTHWEST PROJECT NUMBER: A-00-1 COLLEEN A. CALDWELL, NEW MEXICO STATE UNIVERSITY AND THE U.S. GEOLOGICAL SURVEY NEW MEXICO COOPERATIVE FISH AND WILDLIFE RESEARCH UNIT RICH ARIMOTO, NEW MEXICO STATE UNIVERSITY AT CARLSBAD PHILIP SWARTZENDRUBER AND ERIC M. PRESTBO, FRONTIER GEOSCIENCES, INC. NARRATIVE SUMMARY Mercury is a toxic metal with no known essential function in living organisms, and it has been declared a primary pollutant of global concern. Of the 189 compounds identified as hazardous air pollutants in the 1990 Clean Air Act Amendment, only mercury was singled out for separate study to examine anthropogenic emissions and to define thresholds at which it affects human health and wildlife. Annual anthropogenic emissions of mercury in the United States were estimated at 159 metric tons in 1994- 1995, with one-third of the mercury deposited through wet and dry deposition within the lower 48 states and the remainder transported out of the United States. Although government legislation reduced the acute toxicological effects of mercury contamination from point sources, regulatory control of emissions is lacking. Roughly 87% of the emissions are from combustion sources such as fossil fuel and waste incineration, which contributes significantly to local and regional concentrations of mercury-adsorbed particulates in air and has been observed in association with other effects of rapid urbanization such as wild fires, brick manufacturing, and refuse burning. Thus, point sources for mercury emissions in the U.S.-Mexican border region, particularly in light of the increase in industrial operations of the maquiladora and increased urbanization surrounding the industry sectors, are particularly important when considering the influx of mercury and its potential effects in the border region. Long-range transport through the atmosphere and wet and dry deposition play especially important roles in biogeochemical cycling of mercury in freshwater systems. Mercury deposition in rainfall is a reflection of the mercury concentration in the atmosphere and the dynamic influence of spatial and temporal changes due to emissions, meteorology, and climatology. An important issue when studying the geochemical cycle of atmospheric mercury is the distribution between gaseous elemental mercury (Hg o ), particulate-bound mercury (HgP) and reactive gaseous mercury (RGM). Mercury concentrations in wet and dry deposition will be strongly influenced by the concentration of RGM because this species can be readily scavenged through wet precipitation and dry deposited. In addition to its high reactivity, RGM concentrations are very low in the atmosphere. Thus, reliable measurements in ambient
Transcript of AIR DEPOSITION OF MERCURY AND OTHER AIRBORNE POLLUTANTS … · as hazardous air pollutants in the...

AIR DEPOSITION OF MERCURY AND OTHER AIRBORNE
POLLUTANTS IN THE ARID SOUTHWEST
PROJECT NUMBER: A-00-1
COLLEEN A. CALDWELL, NEW MEXICO STATE UNIVERSITY AND THE U.S.GEOLOGICAL SURVEY NEW MEXICO COOPERATIVE FISH AND WILDLIFE
RESEARCH UNIT
RICH ARIMOTO, NEW MEXICO STATE UNIVERSITY AT CARLSBAD
PHILIP SWARTZENDRUBER AND ERIC M. PRESTBO, FRONTIER GEOSCIENCES,INC.
NARRATIVE SUMMARY
Mercury is a toxic metal with no known essential function in living organisms, and it hasbeen declared a primary pollutant of global concern. Of the 189 compounds identifiedas hazardous air pollutants in the 1990 Clean Air Act Amendment, only mercury wassingled out for separate study to examine anthropogenic emissions and to definethresholds at which it affects human health and wildlife. Annual anthropogenicemissions of mercury in the United States were estimated at 159 metric tons in 1994-1995, with one-third of the mercury deposited through wet and dry deposition within thelower 48 states and the remainder transported out of the United States. Althoughgovernment legislation reduced the acute toxicological effects of mercury contaminationfrom point sources, regulatory control of emissions is lacking. Roughly 87% of theemissions are from combustion sources such as fossil fuel and waste incineration,which contributes significantly to local and regional concentrations of mercury-adsorbedparticulates in air and has been observed in association with other effects of rapidurbanization such as wild fires, brick manufacturing, and refuse burning. Thus, pointsources for mercury emissions in the U.S.-Mexican border region, particularly in light ofthe increase in industrial operations of the maquiladora and increased urbanizationsurrounding the industry sectors, are particularly important when considering the influxof mercury and its potential effects in the border region.
Long-range transport through the atmosphere and wet and dry deposition playespecially important roles in biogeochemical cycling of mercury in freshwater systems.Mercury deposition in rainfall is a reflection of the mercury concentration in theatmosphere and the dynamic influence of spatial and temporal changes due toemissions, meteorology, and climatology. An important issue when studying thegeochemical cycle of atmospheric mercury is the distribution between gaseouselemental mercury (Hgo), particulate-bound mercury (HgP) and reactive gaseousmercury (RGM). Mercury concentrations in wet and dry deposition will be stronglyinfluenced by the concentration of RGM because this species can be readily scavengedthrough wet precipitation and dry deposited. In addition to its high reactivity, RGMconcentrations are very low in the atmosphere. Thus, reliable measurements in ambient

air are difficult. Methodologies have only recently been developed with regard tomeasuring atmospheric RGM, and as a result, very little actual data exists regarding itsconcentrations and behavior in air.
Thus, the research described in this report was conducted to compare two methods forthe measurement of dry deposition of RGM, characterize dry deposition of mercury inan arid landscape throughout one seasonal cycle, and characterize mercury inprecipitation and associated trace elements in episodic rain events. The interpretation ofregional sources of mercury was greatly enhanced by trace metal data representingpriority pollutants (such as cadmium, copper, lead) and provided information not only onthe potential sources of pollutants in the atmosphere but also how the strengths of thesesources varied over time.
Reactive gaseous mercury at Caballo Reservoir in south central New Mexico exhibitedseasonal variability. During the winter months (December 2001 and January 2002),RGM was lower (2.16 picograms per cubic meter [pg/m3]) compared to values averagedfor summer months (July 2001 and June 2002; 6.22pg/m3). The seasonality of lowerRGM during the cooler months compared to the warmer months is likely due to acombination of advection, and/or air stagnation, and temperature and photochemical-dependent reaction rates. In addition to seasonal changes, we observed consistent dieland diurnal patterns for RGM. Atmospheric concentrations were consistently lowestduring the night and peaked at mid-day for each sample date. When values wereaveraged throughout the entire study for each collection interval, average RGM waslowest between 2200 and 0600 hours with 3.3pg/m3, compared to 7.4pg/m3 between0600 and 1400 hours, and 8.9pg/m3 between 1400 and 2200 hours. The averageconcentration for samples taken during this study for RGM in south central New Mexicowas 6.5pg/m3 and is comparable to a variety of locations throughout the United States,representing a range of environmental conditions.
Atmospheric concentrations of HgP in south central New Mexico averaged 3.0pg/m3
and ranged from below the detection limit (0.57pg/m3) to 12pg/m3 throughout the entirecollection period. This range is comparable to regional background levels of 10pg/m3 to20pg/m3 that have been reported in rural areas of the Great Lakes region. Of greatinterest was one sample collection in June 2002 exhibiting the highest HgPconcentrations (12pg/m3) when prevailing winds transported smoke 250 kilometers (km)to our collection site from a series of large-scale forest fires in east-central Arizona. TheRodeo/Chediski fires began June 18, 2002 and burned 189,802 hectares (468,648acres) until contained July 7, 2002. A series of back trajectories showed the air parcelscontaining the elevated HgP came from directly over the burn sites.
Although Hgo did not exhibit diel or diurnal patterns, seasonal changes were observedwith higher concentrations in summer months (June and July) (average 1.75 nanogramsper meter cubed [ng/m3]) compared to winter months (average 1.32ng/m3). Atmosphericconcentrations of Hgo exhibited good average daily precision (1.59ng/m3 ± 0.37) andwere comparable to natural background concentrations reported in the literature(1.3ng/m3 to 3.0ng/m3).

Of great interest is the total annual depositional flux of mercury representing both wetand dry contributions. The annual atmospheric flux of RGM from an indirect inferentialmethod and the annual deposition of Hg from a surrogate surface were 0.82 microgramper meter squared (µg/m2) and 32µg/m2, respectively. Total mercury in wet and drydepositional processes can be calculated from the annual mercury deposition in rainfall(5.44µg/m2; normalized for 52 weeks) and dry depositional methods resulting in a totaldepositional flux of mercury ranging from 6.26µg/m2 to 37.44µg/m2. Thus, this study’smeasurements indicate from 13% to 85% of the annual depositional flux for totalmercury in south central New Mexico would be due to dry depositional processesalone.
Wet deposition, total mercury concentration, and trace metal concentrations werecharacterized each week (from Tuesday to Tuesday). The highest mercury deposition(1,049.6ng/m2) occurred May 21,2002 and was associated with prevailing winds southby south-west across Mexico. Of the seven trace metals analyzed in 0.84 centimeters(cm) of precipitation on that date, five trace metals (Cadmium, Cobalt, Copper,Manganese, and Lead) had the highest concentrations for the entire collection year.
Although it is not possible to determine what emission point sources lie along thetrajectory pathway, the results of this research indicate that a monitoring programshould be considered for border regions that includes mercury and trace metals in bothdry and wet depositional processes. With multiple years of information, a clearer patternof the source and fate of mercury can be identified.
This research will result in a series of peer-refereed publications in the Journal ofEnvironmental Science and Technology in 2004.
AIR DEPOSITION OF MERCURY AND OTHER AIRBORNE
POLLUTANTS IN THE ARID SOUTHWEST
PROJECT NUMBER: A-00-1
COLLEEN A. CALDWELL, NEW MEXICO STATE UNIVERSITY AND THE U.S.GEOLOGICAL SURVEY NEW MEXICO COOPERATIVE FISH AND WILDLIFE
RESEARCH UNIT
RICH ARIMOTO, NEW MEXICO STATE UNIVERSITY AT CARLSBAD
PHILIP SWARTZENDRUBER AND ERIC M. PRESTBO, FRONTIER GEOSCIENCES,INC.
INTRODUCTION
During the last decade, new patterns have emerged with regard to trends in mercurypollution. Global concerns were highlighted at the International Conference on Mercuryas a Global Pollutant in 1992 when mercury was recognized as a problem on a world-wide scale. Mercury has been declared a primary pollutant by the U.S. EnvironmentalProtection Agency (EPA), the United Nations Environmental Science Committee, theUnited Nations Environmental Council of Europe, and a trilateral Council of NorthAmerican Environment Ministers. Of the 189 compounds identified as hazardous airpollutants in the 1990 Clean Air Act Amendment, only mercury was singled out forseparate study to examine anthropogenic emissions and to define thresholds at whichmercury affects human health and wildlife. Although environmental legislation hasmitigated the acute toxicological effects of aquatic mercury contamination to a degree,reports of mercury-contaminated fish stocks in areas remote from human activities haveheightened an awareness and expanded research concerning its source, fate, andeffects worldwide (Watras and Huckabee 1994).
Mercury is a toxic metal with no known essential function in living organisms.Methylmercury (MMHg) is the most environmentally pervasive toxicant of all themercurial compounds, and it is the compound found to bioaccumulate up the food chaindue to the difficulty organisms have in excreting it (Clarkson 1994). In fish-eating fish,from 95% to 99% of the total mercury body burden is sequestered in muscle as MMHg(Bloom 1992). Thus, mercury accumulates most efficiently in the aquatic food web withorganisms at the top of the food web having greater concentrations. As a consequence,the consumption of mercury-contaminated fish represents the primary route of exposurein humans (Porcella 1994). In response to public health concerns, the number of statesissuing health advisories for fish consumers increased from 27 in 1993 to 40 in 1997(Krabbenhoft and Wiener 1999). In New Mexico, fish monitoring programs showedmercury concentrations in edible tissues sufficient to cause the issuance of advisoriesthroughout the state as early as 1971 (NMDH 1993). Currently, 26 bodies of water inNew Mexico have advisories against the consumption of mercury-contaminatedsportfish (EPA 2002). Fish consumption advisories remain in effect at Caballo

2
Reservoir in southern New Mexico with surface water concentrations of total mercury(THg) and MMHg in the parts per billion range (1.08 nanograms per liter [ng/L] and0.096ng/L, respectively) (Caldwell and Canavan 1998). Despite these relatively lowlevels, bioaccumulation and biomagnification of mercury have been observed in CaballoReservoir’s aquatic food web (Borunda 1997) and in local populations of fish-eatingdouble-crested cormorants (Phalacrocorax auritus) (Caldwell, Arnold, and Gould 1999).There are no known cinnabar deposits in New Mexico that would be the source formercury contamination. Although the impact of historic gold and silver mining isunknown, most such mines are small and long abandoned.
In the absence of strong point source emissions, long-range transport through theatmosphere and wet and dry deposition play especially important roles inbiogeochemical cycling of mercury in freshwater systems (Rada, et al. 1989; Fitzgerald,et al. 1994). The majority of mercury deposited via atmospheric deposition would beexpected to remain within the watersheds until it is mobilized and released in run-off asa result of physical disturbances such as intense storm events, urban and agriculturalpractices (Lee, et al. 1995; Balough, et al. 1997; Mason and Sullivan 1998), and forestfires (Vega, et al. 1994). Three major creeks (Percha, Animas, and Palomas) empty intoCaballo Reservoir during intense rain events. These creeks comprise the only drainageroutes for a highly erosive watershed that is 19 kilometers (km) wide and 64km long andextends from the western shore of the reservoir to the Black Range. Small amounts ofmercury deposition in this large drainage area could presumably result in a rapid andhigh concentration input of mercury into the reservoir.
Natural sources of mercury include volcanoes, forest fires, geothermal hot springs,naturally enriched mercury soils, and large bodies of water such as oceans and theGreat Lakes. In total, the global anthropogenic sources of mercury contaminationaccount for approximately 3,350 metric tons per year, or roughly 60% of the total influxof mercury to the atmosphere (Porcella 1994). Annual anthropogenic emissions ofmercury in the United States was estimated at 159 metric tons in 1994-1995 with one-third of the mercury deposited through wet and dry deposition within the lower 48 statesand the remainder transported outside the United States (EPA 1995). Althoughgovernment legislation such as the Clean Water Act has reduced the acute toxicologicaleffects of aquatic mercury contamination, regulatory control of emissions is lacking.Roughly 87% of the emissions are from combustion sources such as fossil fuel andincineration of wastes. Thus, point sources for mercury emission in the U.S.-Mexicanborder region, particularly in light of the increase in industrial operations of themaquiladora and increased urbanization surrounding the industry sectors, are importantwhen considering the influx of mercury and its potential effects in the border region.
Since 1995, the Mercury Deposition Network (MDN) has been monitoring regional wetdeposition patterns of total mercury in rain and snow as part of the NationalAtmospheric Deposition Program. The MDN program was designed to study andquantify the spatial and temporal trends of the fate of mercury in the atmosphere withthe ultimate goal of evaluating the effectiveness of state and federal mandated controlson mercury emissions to the atmosphere. Weekly precipitation samples are collected for

3
the MDN at more than 80 sites in the United States and eastern Canada using a pre-cleaned glassware and special handling procedures. The samples are then shipped to acentral laboratory (Frontier Geosciences, Seattle) for analysis of total mercury using anEPA Method 1631 equivalent (EPA 1997). Since 1997, mercury has been characterizedin precipitation at an MDN site near Caballo Reservoir in southern New Mexico. TheMDN site in southern New Mexico exhibited relatively high (23.0ng/L) mercuryconcentrations in precipitation in 1998 compared to an average concentration of 9.5ng/Lacross the entire MDN program. Although the New Mexico site had the highest averageconcentration of total mercury, the site received only 17.64 centimeters (cm) of rainfallresulting in the lowest wet deposition of mercury in the network for 1998 (4.0µg/m2).
Mercury deposition in rainfall is a direct measure of mercury concentration in theatmosphere and reflects the dynamic influence of spatial and temporal patterns inemissions and changes due to meteorology and climatology. As long as periodic(weekly) rain events occur and are captured, then a realistic characterization of mercuryin precipitation can be obtained. However, rainfall in the arid southwest is seasonal andsporadic. To fully characterize the spatial and temporal influences of mercury inputs in aclimate that receives less than 20cm of rainfall, it is essential to characterize mercury inboth wet and dry depositional phases. Very little information, however, exists on thedeposition of mercury and its impact in freshwater ecosystems, especially in aridclimates.
An important issue when studying the geochemical cycle of atmospheric mercury is thedistribution between gaseous elemental mercury (Hgo), particulate-bound mercury(HgP), and reactive gaseous mercury (RGM). Mercury concentrations in wet and drydeposition will be strongly influenced by the behavior of RGM (Lindberg and Stratton1998). This species is highly reactive and can be readily scavenged from theatmosphere by precipitation and can then be dry deposited. In addition to its highreactivity, RGM concentrations are very low in the atmosphere; thus, reliablemeasurements in ambient air are difficult. Several methodologies have only recentlybeen developed with regard to measuring atmospheric RGM (Lindberg and Stratton1998; Landis, et al. 2002), and as a result, very little actual data exists regarding itsconcentrations and behavior in air.
Thus, the research described in this report was conducted to compare two methods forthe measurement of dry deposition of RGM, characterize dry deposition of mercury inan arid landscape throughout one seasonal cycle, and characterize mercury inprecipitation and associated trace elements in episodic rain events. The interpretation ofregional sources of mercury was greatly enhanced by trace metal data representingpriority pollutants (cadmium, copper, lead) and provided information not only on thepotential sources of pollutants in the atmosphere but also how the strengths of thesesources varied over time.
RESEARCH OBJECTIVES
The overall goal of this study was to characterize the transport and deposition ofatmospheric mercury and associated trace elements to south central New Mexico. To
4
achieve this goal, the objectives were to:• Characterize elemental mercury (Hgo), particulate-bound mercury (HgP), andreactive gaseous mercury (RGM) concentrations in dry deposition using a manualinferential method and deposition by direct method using a surrogate surface
• Compare the results of the manual inferential method with those of the directmethod using the surrogate surface throughout an annual seasonal cycle
• Evaluate potential local and regional sources through observed depositional valuesof mercury and associated anthropogenic trace elements (i.e., cadmium, cobalt,chromium, copper, molybdenum, nickel, lead, vanadium, zinc)
RESEARCH METHODOLOGY/APPROACHES
Study AreaThe deposition collectors were located on private property on the western side ofCaballo Reservoir (Sierra County) in south central New Mexico approximately 96kmfrom the border of El Paso, Texas-Ciudad Juárez, Mexico. Collectors were placed inareas remote from rural and urban point sources of pollution to prevent or at leastminimize confounding localized effects. The landscape at Caballo Reservoir, typical ofthe Chihuahuan desert, receives an annual rainfall ranging from 20cm to 25cm per year.Vegetation surrounding the sites is characterized by desertic species such as mesquite,creosote, small grasses, and forbs.
Wet Deposition Collection of Mercury and Trace MetalsTotal mercury and trace metals in wet deposition were collected for 64 weeks (April2001 through August 2002) using a dual-orifice Aerochem Metric Sampler (AerochemMetrics, Inc., Bushnell, Fla.). A rain sensor triggered the motor on the inside of thesampler causing a Teflon-coated pad to lift off the dual orifice leading to the borosilicateglass sample train for total mercury determination and to the polyethylene funnel andbottle for trace metal determination. For total mercury determination, precipitation wascaught in the funnel where it is delivered via a thin (3 millimeter [mm] inner diameter)capillary tube to a one-liter bottle. For trace metal determination, the precipitation wascaught in the polyethylene funnel and delivered directly to the 0.5L polyethylene catchbottle. The sampling train for mercury consists of trace mercury-cleaned glass surfacesto minimize contamination. For trace metal analysis, the sampling train consisted of onlypolyethylene surfaces. A Belfort weighing-bucket rain gauge was located 10 meters (m)from the dual-orifice MDN collector to chart weekly rainfall events and was used tocalculate rainfall amount.
Pre-cleaned sampling trains were shipped from the analytical laboratories (totalmercury: Frontier Geosciences, Inc., Seattle; trace metals: New Mexico State University[NMSU] Carlsbad Environmental Monitoring and Research Center, Carlsbad, N.M.) anddeployed at the MDN site each Tuesday. The exposed sampling trains were removedand returned to the analytical laboratories with the sample bottles containing anyprecipitation collected since the previous Tuesday. The sample bottle for total mercurydetermination arrived from the analytical laboratory pre-charged with 20 milliliters (mL)of dilute hydrochloric acid (0.12 moles) to reduce the loss of mercury by diffusion to thegas phase. Once the data for total mercury was analyzed, it was reviewed for

5
completeness and accuracy by the MDN Program Coordinator prior to being released tothe public on the Internet (http://nadp.sws.uiuc.edu/mdn/). Data for trace metals werescreened for accuracy prior to release.
Dry Deposition of MercuryAmbient concentrations of RGM, HgP, and gaseous Hgo were determined using aseries of modified traps. Potassium chloride (KCl)-coated annular denuders, quartz fiberfilters (QFF), and gold-coated quartz chips were chosen for collection and comparisonof atmospheric RGM, HgP, and Hgo, respectively. Of the few and relatively newmethodologies available for capturing mercury species in ambient air (see Lindberg andStratton 1998; Landis, et al. 2002), the annular denuder was chosen because it is easilydeployed, operates throughout a wide temperature range, results in little interferencefrom other mercury species, and provides low method detection limits (MDL) (6.2pg/m3
to 0.5pg/m3) to allow differentiation of background noise in short sampling intervals (1hour to 12 hours) (Landis, et al. 2002).
Separation and collection of mercury species was accomplished in the KCl denudersampling train (Figure 1, Appendix A). Briefly stated, as the air stream entered the train,a 10 liters per minute (L/min) PM2.5 elutriator removed particulates with aerodynamicdiameters larger than 2.5µm. The air then passed through the etched annular surfacecoated with KCl to selectively capture the RGM by exploiting the lower diffusionconstant of particulate-bound mercury and the lack of affinity of gaseous Hgo for KCl.The RGM denuded air stream was subsequently split into a high and low flow-ratestream. The high flow-rate stream passed through a quartz fiber filter (47mm diameter)to collect HgP. In the low flow stream, gaseous Hgo was collected by adsorption onto agold surface (EPA Compendium Method I0-5). A pump with a mass flow controller set at9.5L/min drew air through the high flow-rate train, while the remaining 0.5L/min waspulled through the low flow-rate train by a pump, needle valve, and mass flow meter.Each annular denuder train was deployed every 8 hours for a 24-hour period (1400 to2200; 2200 to 0600; 0600 to 1400), while a fourth was used as the field blank. Timing ofdeployment deviated slightly to coincide with sunrise. Prior to deployment, eachsampling train was checked for leaks. After recovery from the field, the annulardenuders and ion exchange (IX) membranes were shipped to the mercury analyticallaboratory for analysis (see below for analytical procedures).
An IX membrane (30cm x 20cm; Gelman, Inc.), made of polyethylsulfone and sulfonicacid groups, was selected as the direct surrogate surface to compare with the inferentialKCl annular denuder measurements. The membranes were hydrophilic and presumably100% efficient at adsorbing RGM. An earlier study demonstrated moderate successusing IX membranes with low MDL (0.95ng/m2) and moderate variability (2.94ng/m2 to11.04ng/m2) (Caldwell 2000). At the mercury analytical laboratory, the IX membraneswere loaded onto 35.6cm x 25.4cm plexiglass plates and placed into plastic bags forshipment to NMSU. At the study site, the plates were removed from plastic bags usingclean latex gloves and placed on top of a 10cm x 10cm untreated wood post 2.5m fromthe ground surface. At each sampling date, an IX membrane and KCl annular denuderwith sampling train were deployed and recovered every 8 hours throughout a 24-hour

6
period (1400 to 2200; 2200 to 0600; 0600 to 1400) and returned to the mercuryanalytical laboratory.
Meteorological AnalysisMeteorological influences on atmospheric mercury and trace metals were characterizedusing the Hybrid Single-Particle Lagrangian Integrated Trajectory Model (HySPLIT41997). The model was used with 2001 and 2002 Eta Data Assimilation Systemmeteorological data from the National Oceanic and Atmospheric Association’s AirResources Laboratory, in which 48-hour isentropic back trajectories were plotted foreach rain event 1,500m and 3,000m above ground level to display the most probablepath of an air parcel arriving at the site on a specified day and hour. Similarly, 36-hourisentropic back trajectories were plotted for each 24 hour sample collection of mercuryin ambient air 50m, 500m, and 2,000m above ground level. Supplementalmeteorological variables (rain deposition) were also provided by the HySPLIT model inan ASCII trajectory endpoint output file and used to determine if the trajectory path wassubject to precipitation.
Mercury and Trace Metal Analyses and Quality Control/Quality AssuranceThe KCl annular denuders and IX membranes were prepared at the mercury analyticallaboratory under clean laboratory conditions and shipped to NMSU prior to each sampledate. Temperature data loggers were twice placed inside the annular denuder shippingcase to monitor and record temperature fluctuations to and from the site until finalreceipt at the analytical laboratory. All mercury species were quantified using cold vaporatomic fluorescence spectrometry (CVAFS) which is the basis for EPA Method 1631 forthe determination of ultra-trace concentrations of mercury in waters. Briefly stated, theKCl denuders and gold traps were analyzed by thermal desorption and automatedpreconcentration and detection by CVAFS with a Tekran 2537a. Initially, the particulatefilters (QFF) and the IX membranes were analyzed by aqueous digestion and oxidationof Hg followed by stannous chloride (SnCl2) reduction and quantification using dualamalgamation CVAFS (method 1631 equivalent). The analytical procedure for HgP wasaltered part way through the study due to low ambient concentrations of HgP and arelatively high method detection limit (MDL) (10pg/m3) of the aqueous method. As aresult, the aqueous digestion and reduction procedure described above was eliminated.Particulate-bound mercury was thermally desorbed from quartz fiber filters at 550oC andquantified by CVAFS using a Tekran 2537a (Tekran, Inc., Toronto, Canada). The MDLfor HgP using the new method was 0.57pg/m3. As a result of the improved MDL, theinitial four of the earliest sampling events with concentrations near the detection limitwere eliminated (March 8, 2001 through July 30, 2001).
Trace metals were analyzed using an Elan 6000 low-resolution inductively-coupledmass spectrophotometer (ICPMS). Initial calibration and verification for qualitycontrol/quality assurance purposes were conducted using a blank and at least twocalibration standards traceable to the National Institute of Standards and Technology(NIST) with + 10% recovery. Following initial calibration, a standard for a differentsource traceable to NIST was used to calibrate the ICPMS. Samples were analyzed induplicate when sufficient volume was present. All values above the reporting limit had a

7
relative standard deviation of less than 20% and those exceeding 20% were eliminatedor evaluated to identify the problem.
Quality assurance samples for wet deposition of mercury and trace metals includedtravel blanks, field blanks, and system blanks. Travel blanks were bottles shipped withthe regular sampling train and stored unopened in the enclosure during the sampleperiod. The field blanks were samples from weeks having no wet deposition where allequipment operated correctly. A single trace event, however, disqualified a sample frombeing a field blank and was insufficient for trace metal determination.
The MDL for total mercury in wet deposition and ambient mercury speciation wascalculated as three times the standard deviation of the method blank. Thus, theestimated MDL was 1.6pg/m3 (n=6) for RGM, 0.57pg/m3 (n=12) for HgP, 0.13ng/m3
(n=35) for Hgo, and 1.5 nanograms per meter squared per hour (ng/m2/h) (n=3) formercury collected on the IX membrane. The MDL for metals in wet deposition werecalculated as outlined in 40 CFR (standard deviation of seven lowest standards times3.14). The estimated MDLs for metals of interest were: 0.051µg/L for cadmium; 0.073microgram per liter (µg/L) for cobalt; 0.11µg/L for chromium; 0.05µg/L for copper;0.009µg/L for manganese; 0.20µg/L for molybdenum; 0.12µg/L for nickel; 0.004µg/L forlead; 0.066µg/L for vanadium; and 0.26µg/L for zinc.
ISSUES ENCOUNTERED
Procedures for determining dry deposition and speciation of atmospheric mercury werein the experimental phase in this study. As a result, several issues were encountered.
The analytical procedure for HgP was altered part way through the study due to lowambient concentrations of HgP and a relatively high MDL (10pg/m3). The resulting MDLfor HgP was 0.57pg/m3. As a result of the improved MDL, four sampling events wereeliminated (March 8, 2001 through July 30, 2001).
In addition, it appeared the blank level of the Gelman IX membranes varied substantiallywithin a single lot. This became evident when the field blanks drifted between samplingevents. The resulting MDL for the first lot of IX membranes was greater in all of theearlier sample collections (MDL 15.0pg/m3). A new lot of Gelman IX membranesresulted in a 10-fold reduction of the MDL (MDL 1.5pg/m3). Thus, the IX samplescollected using the old lot of IX membranes were eliminated from the results, whichresulted in the loss of six sampling events (March 8, 2001 through December 14, 2001).
Windy conditions resulted in less-than-optimal handling procedures in the field andpotentially an overestimation of mercury concentrations due to contamination of thetrain. Thus, optimal weather conditions were necessary for the deployment of thecollectors (i.e., no rain or wind). In one sample event (June 4, 2001) windy conditionsprevailed resulting in the elimination of the data for that sample date, due to apparentcontamination of the collectors.
The dry deposition values obtained from direct surrogate surface measurements (IX

8
membranes) also included a contribution from particulate deposition. However, theparticulate collection efficiency of the IX membrane is not well understood nor can asimple prediction be made. It is not clear, a priori, if the IX membranes will capture HgPin a manner that quantitatively relates to the PM2.5 particulates collected in the denudertrain.
Values for deposition velocity of RGM do not exist for arid climates. Thus, a depositionvelocity for RGM over grasslands (Lindberg and Stratton 1998) was used to calculateatmospheric deposition using the inferential KCl denuder method. As a general rule, thegreater the surface area with regard to vegetation, the greater the deposition velocityand dry deposition rate. Thus, it follows that grasslands and forests with higher surfacearea will most likely result in a greater deposition rate of mercury when compared todesert scrub such as the arid study site in south central New Mexico. The result ispresumably an overestimation of total mercury deposition on an arid landscape. Despitethe potential for overestimation of RGM deposition, the use of a value for depositionvelocity was necessary to allow comparison of the manual inferential method using theKCl denuder with the direct method by surrogate surface.
RESEARCH FINDINGS
Atmospheric Mercury SpeciationReactive gaseous mercury in south central New Mexico exhibited seasonal variability.During the winter months (December 2001 and January 2002), RGM was lower(2.16pg/m3; standard error, SE=1.00, n=6) compared to values averaged for summermonths (July 2001 and June 2002; 6.22pg/m3, SE=1.75, n=13) (Figure 2a). Lindbergand Stratton (1998) reported strong correlations of RGM with meteorological variables(air temperature and solar radiation) reflecting seasonality with lower RGM during thecooler months, compared to the warmer months due to advection and/or air stagnationand temperature-dependent reaction rates. In a recent study, Lindberg, et al. (2002)showed a strong linkage of sunlight, photochemical reactions, and meteorologicalvariables (wind speed and air temperature) on the formation of reactive gaseousmercury and depletion of gaseous elemental mercury in the artic boundary layer atsunrise.
In addition to seasonal changes, the authors observed consistent diel and diurnalpatterns for RGM (Figure 2b). Atmospheric concentrations were consistently lowestduring the night and peaked at mid-day for each sample date. When values wereaveraged for each collection time throughout the entire study, RGM was lowest between2200 hours and 0600 hours (local time) with a mean value of 3.3pg/m3 (SE=2.26, n=7,range <MDL - 16.0pg/m3), compared to 7.4pg/m3 between 0600 hours and 1400 hours(SE=2.07, n=6, range 1.5pg/m3 to 15.0pg/m3) and 8.9pg/m3 between 1400 hours and2200 hours (SE=2.78, n=8, range 1.5pg/m3 to 24.5pg/m3) (Table 1). Lindberg andStratton (1998) reported comparable values using a refluxing mist chamber in whichRGM ranged from 5pg/m3 at night to 120pg/m3 during the day in a rural area ofTennessee.
The average concentration for RGM measurements in this study was 6.5pg/m3

9
(SE=1.46, n=21). This value was comparable to results obtained by Landis, et al. (2002)using a manual KCl annular denuder in a variety of locations throughout the UnitedStates representing a range of environmental conditions. The MDL of 1.6pg/m3 reportedhere was slightly higher than that reported by Landis, et al. (2002) for a samplingduration 6 hours to 12 hours (1.0pg/m3 to 0.5pg/m3, respectively), but was deemedacceptable. An intercomparison study of the annular denuder and mist chamberdescribed the mist chamber collecting RGM concentrations 6.5 times higher than theannular denuder (Landis, et al. 2002). Thus, it is important to recognize the limitationswhen comparing the results of this study’s RGM levels with those reported for the mistchamber (Lindberg and Stratton 1998; Stratton, Lindberg, and Perry 2001).
The effects of meteorological conditions associated with season, particle-sizedistribution, as well as the source of the contaminant with respect to sampling site allplay an important role in the deposition of HgP (Pirrone, Glinsorn, and Keeler 1995).Seasonal effects of HgP in south central New Mexico were not evident due to the smallnumber of samples. Atmospheric concentrations of HgP (less than 2.5µm) ranged frombelow detection limit (0.57pg/m3) to 12pg/m3 throughout the entire collection period(Figure 3). This range is comparable to regional background levels of 10pg/m3 to20pg/m3 reported in the Great Lakes region by Pirrone, Glinsorn, and Keeler (1995).The authors also observed similar concentrations of HgP from 10.5pg/m3 to 22.4pg/m3
in rural areas throughout the Great Lakes region with seasonal effects of HgP greatestin winter. Seasonal trends were also observed in rural Vermont with greaterconcentrations in winter than in summer and average annual concentrations of 11pg/m3
(Burke, et al.1995).
One sample collection in this study (June 27-28, 2002) was elevated nearly 12-foldwhen prevailing winds transported smoke 250km to the collection site from a series oflarge-scale forest fires in east-central Arizona. The Rodeo/Chediski fires (Latitude34.0986 Longitude -10.433) began June 18, 2002 and burned 189,802 hectares(468,648 acres) until contained July 7, 2002. A series of 36-hour HySPLIT backtrajectories were calculated for three collection intervals beginning June 27 at 1700hours (UTC), June 28 at 0100 hours, and ending June 28 at 1700 hours. For each backtrajectory, ending particle heights or elevations of 50m, 500m, and 2,000m aboveground level were chosen to characterize particle movements. The trajectory for June27 at 1700 hours (Figure 4a) indicated particle movement from directly over the burnarea that continued through June 28 at 0100 hours (Figure 4b). This suggests thatelevated HgP levels were related to the fires. Interestingly, HgP levels decreased by thethird sample collection (8 hours later, 0600 hours to 1400 hours) and was reflected bythe change in wind direction from the west for the altitude trajectories (Figure 4c). Areduction in haze was noted by the third sample collection.
Although Hgo did not exhibit diel or diurnal patterns (Figure 5a), seasonal changes wereobserved with higher concentrations in summer months (June and July) (average1.75ng/m3, SE=0.109,n=12) compared to winter months (average 1.32ng/m3,SE=0.068, n=6) (Figure 5b). The difference is much smaller, however, if values from thewildfire are discarded (average 1.52ng/m3 SE=0.12, n=9). Atmospheric concentrations
10
of Hgo throughout all samples exhibited good precision (1.59ng/m3, SD=0.37, n=19), nosignificant diel variation (1400 hours to 2200 hours: 1.56ng/m3; 2200 hours to 0600hours: 1.60ng/m3; 0600 hours to 1400 hours: 1.59ng/m3), and were comparable tobackground concentrations reported in the literature (1.3 ng/m3 to 3.0ng/m3; Lindqvist,et al. 1991).
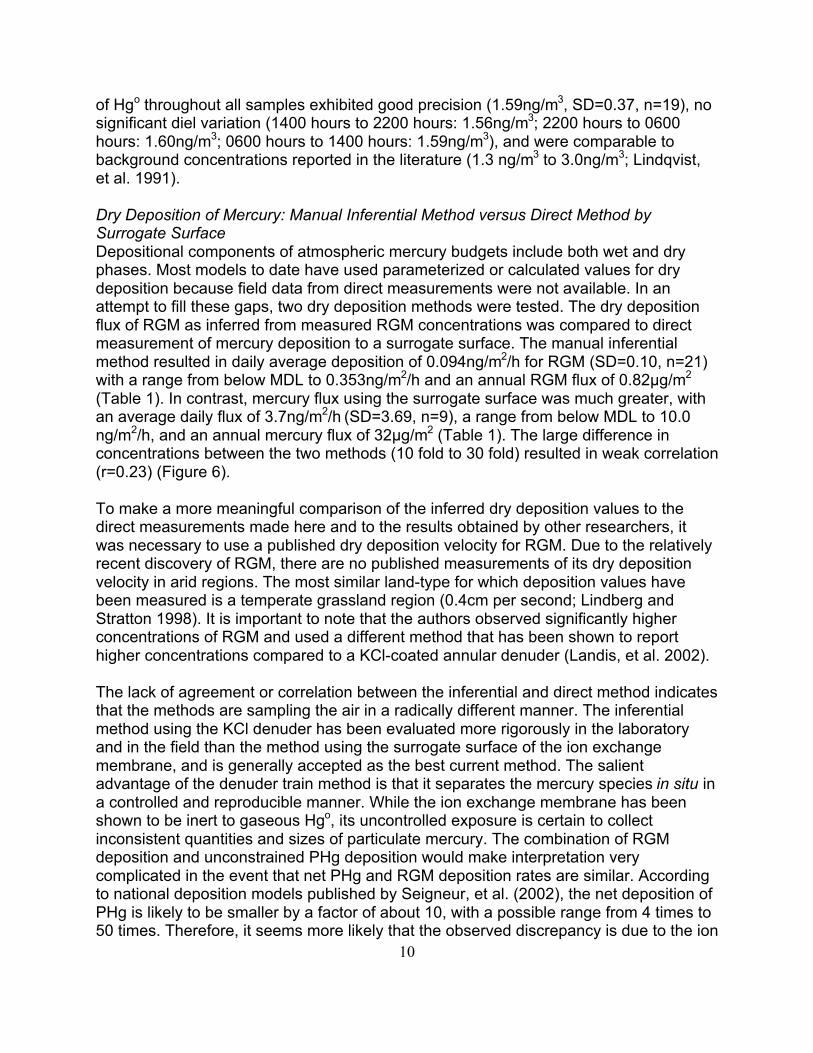
Dry Deposition of Mercury: Manual Inferential Method versus Direct Method bySurrogate SurfaceDepositional components of atmospheric mercury budgets include both wet and dryphases. Most models to date have used parameterized or calculated values for drydeposition because field data from direct measurements were not available. In anattempt to fill these gaps, two dry deposition methods were tested. The dry depositionflux of RGM as inferred from measured RGM concentrations was compared to directmeasurement of mercury deposition to a surrogate surface. The manual inferentialmethod resulted in daily average deposition of 0.094ng/m2/h for RGM (SD=0.10, n=21)with a range from below MDL to 0.353ng/m2/h and an annual RGM flux of 0.82µg/m2
(Table 1). In contrast, mercury flux using the surrogate surface was much greater, withan average daily flux of 3.7ng/m2/h (SD=3.69, n=9), a range from below MDL to 10.0ng/m2/h, and an annual mercury flux of 32µg/m2 (Table 1). The large difference inconcentrations between the two methods (10 fold to 30 fold) resulted in weak correlation(r=0.23) (Figure 6).
To make a more meaningful comparison of the inferred dry deposition values to thedirect measurements made here and to the results obtained by other researchers, itwas necessary to use a published dry deposition velocity for RGM. Due to the relativelyrecent discovery of RGM, there are no published measurements of its dry depositionvelocity in arid regions. The most similar land-type for which deposition values havebeen measured is a temperate grassland region (0.4cm per second; Lindberg andStratton 1998). It is important to note that the authors observed significantly higherconcentrations of RGM and used a different method that has been shown to reporthigher concentrations compared to a KCl-coated annular denuder (Landis, et al. 2002).
The lack of agreement or correlation between the inferential and direct method indicatesthat the methods are sampling the air in a radically different manner. The inferentialmethod using the KCl denuder has been evaluated more rigorously in the laboratoryand in the field than the method using the surrogate surface of the ion exchangemembrane, and is generally accepted as the best current method. The salientadvantage of the denuder train method is that it separates the mercury species in situ ina controlled and reproducible manner. While the ion exchange membrane has beenshown to be inert to gaseous Hgo, its uncontrolled exposure is certain to collectinconsistent quantities and sizes of particulate mercury. The combination of RGMdeposition and unconstrained PHg deposition would make interpretation verycomplicated in the event that net PHg and RGM deposition rates are similar. Accordingto national deposition models published by Seigneur, et al. (2002), the net deposition ofPHg is likely to be smaller by a factor of about 10, with a possible range from 4 times to50 times. Therefore, it seems more likely that the observed discrepancy is due to the ion

11
exchange membrane collecting mercury in a manner unrelated to RGM deposition ornet particle deposition. Two potential explanations include (1) local generation andredeposition of larger diameter particulate matter containing trace levels of mercury, or(2) another artifact particular to the BIX sampling scheme and environmental conditions(e.g., sunlight, moisture, windspeed, turbulence). The clear conclusion is that passiveion exchange membranes used in the manner described herein do not provide resultsthat can be directly comparable to the dry deposition values for RGM obtained from theinferential KCl denuder method.
Despite the lack of good agreement observed in this study, the potential for IXmembranes to offer a simple alternative to more expensive and complicated methods isstill feasible. Actively collected IX membranes behind particulate filters have been foundto be comparable to annular denuders by Sheu and Mason (Sheu 2001; Sheu andMason 2001). A new deployment design that protects the IX membrane surface fromlocal environmental factors, including ground level particulate, may eliminate artifactsand would be easy and inexpensive to test.
How Do Regional Models Compare with the Measured Depositional Fluxes?In a recently modified regional transport model, Seignuer, et al. (2002) obtained goodagreement between simulated values and measured values for annual wet depositionfluxes of total mercury in New Mexico (within a factor of 1.5). Using a depositionvelocity for calculating RGM flux similar to that used here, the authors obtained anannual deposition flux from 5µg/m2 to 10µg/m2 for total mercury (included both wet anddry depositional processes). Of interest was their reported annual dry deposition flux of2µg/m2 to 5µg/m2 for Hg(II) (which includes RGM) in south central New Mexico,indicating that roughly 20 to 100% of mercury flux in New Mexico would occur via drydepositional processes. Our results for the direct surrogate surface (32µg/m2) andindirect inferential measurements (0.82µg/m2) resulted in total dry deposition ofmercury that was comparable in magnitude to predictions of Seigneur, et al. (2002).However, due to the uncertainty in the direct surrogate surface method, it is suggestedthat these values be regarded as experimental until their meaning is more fullyunderstood.
Given the annual atmospheric flux of RGM from the inferential measurement(0.82µg/m2) and the annual deposition of mercury from the surrogate surface(32µg/m2), the total mercury in wet and dry depositional processes can be calculated.The annual mercury deposition in rainfall (5.44µg/m2; normalized for 52 weeks) and drydepositional methods resulted in a total depositional flux of mercury ranging from6.26µg/m2 to 37.44µg/m2. Thus, our measurements indicate from 13% to 85% of theannual depositional flux for total mercury in south central New Mexico would be due todry depositional processes alone, which is comparable in magnitude to Seignuer, et al.(2002).
Wet Deposition of Mercury and Trace MetalsWet deposition is highly seasonal in the southwest. In this study, the majority of theprecipitation events occurred in the summer (29, June through August), followed by

12
seven events in the fall (September through November), four in the winter (Decemberthrough February), and five in the spring (March through May) (Figure 7a). Thus, wetdeposition of mercury depends strongly on both mercury concentration in precipitationand precipitation amount. The seasonal pattern in New Mexico for mercury in wetdeposition has been characterized since 1997 with higher mercury concentrations andgreater precipitation events combined to produce summer wet deposition peaks(Caldwell 2000).
Seasonal variation may be influenced by several factors, including meteorology such aslarge frontal events (Lamborg, et al. 1995), in-cloud processes (Pleijel and Munthe1995), regional transport patterns (Hoyer, et al. 1995), and anthropogenic sources formercury emissions (Ebinghaus, et al. 1995; Gustin, Taylor and Leonard 1995; Carpi1997). Burke, et al. (1995) observed higher seasonal concentrations of mercury in theatmosphere with concentrations and precipitation events greater in summer monthscompared to winter months.
The concentrations and deposition of total mercury and trace metals were characterizedin rainfall events each week (from Tuesday to Tuesday). Although precipitation eventswere recorded on the Belfort chart recorder, individual events were combined for eachweek, reflecting mercury concentrations and deposition values on a weekly basis andnot for each event. Thus, a total of 45 rain events were recorded in 26 weeksthroughout the 64-week study totaling 20.16cm in precipitation (Figure 7a). Totalmercury deposition (product of concentration and rainfall amount) was 6,700ng/m2 withan average mercury deposition of 257ng/m2 (SE=56.11, n=26, range 8.3ng/m2 to1,049.6ng/m2) throughout the 64-week study (Figure 7b). Average total mercuryconcentration was 36.8ng/L (SE=5.26, n=26, range 4.9ng/L to 125.2ng/L).
As a result of wet depositional processes being characterized from Tuesday toTuesday, only sample weeks with a single precipitation event were chosen forcomparison of total mercury deposition, with the single event containing deposition oftrace metals. Fourteen such single precipitation events were recorded; however, twoevents were eliminated due to deposition values less than 0.05cm (trace amount).Subsequently, 12 single precipitation events were identified and characterized for totalmercury and trace metal deposition (Table 2). In addition, 48-hour back trajectorieswere calculated for the 12 precipitation events to determine the source of the air parcelsas well as precipitation events within the path of the air parcels.
The highest mercury deposition (1,049.6ng/m-2) occurred May 19, 2001 and wasassociated with prevailing winds south by south-west across Mexico (Figure 8). Of theseven trace metals analyzed in 0.84cm of wet deposition on that date, five trace metals(Cadmium, Cobalt, Copper, Manganese, and Lead) had the highest deposition for the12 single precipitation events (Table 2). Molybdenum was recorded as having thesecond highest deposition for that date.
The second highest mercury deposition (695.5ng/m2) occurred June 29, 2001 and wasassociated with prevailing winds north by north-east across the Four Corners region of
13
the four states (New Mexico, Arizona, Utah, and Colorado) (Figure 9). Of the eight tracemetals analyzed in 2.3cm of wet deposition on that date, Vanadium was recorded ashaving the highest deposition for the 12 precipitation events (Table 2). Cobalt,Manganese, and Lead were recorded as having the second highest deposition valuesfor the year while Copper, Nickel, and Zinc were mid-range in depositional values.
The third highest mercury deposition (396.1ng/m2) occurred June 8, 2001 and wasassociated with winds at varying heights coming from a mixture of directions (north bynorth-west and north by north-east) (Figure 10). Of the 11 trace metals analyzed in0.61cm precipitation, Vanadium and Chromium had the second highest depositionvalues for the 12 precipitation events (Table 2). Cadmium and Molybdenum resulted inthe third highest deposition values while Copper, Manganese, Nickel, Lead and Zincwere moderate in their deposition values.
Prior storm activity within the pathway of the air parcel is important when consideringmercury and other trace metal loadings in deposition (Glass, et al. 1991). Precipitationdata associated with the trajectory endpoints for the three highest mercury precipitationsamples indicated no precipitation along the path of the air parcels that would havereduced the trace metals at the sample site. In contrast, reduced mercury and metalloadings were observed in the second highest wet deposition event (April 6, 2001;1.3cm) as a result of rainfall throughout the entire pathway of the back trajectory (seeTable 2 for volume-weighted average mercury concentration and deposition). Regionalloadings of mercury and trace metals were anticipated throughout pathways ofprevailing winds south and south-west from Mexico (see Table 2: April 6, 2001; July 16,2001; October 7, 2001), however, rainfall was observed within the path of the air parcelback trajectories, which likely reduced trace metal concentrations. Additionalmeteorological variables not considered here are rapid advection processes, in whichtransport due to strong winds reduce the residence time of mercury and associatedtrace metals at the collection site and thus reduce precipitation loadings.
Of particular interest was the degree of association reflected by elevated correlationcoefficients (r) for mercury and associated trace metals in single precipitation events(Table 3). When the correlation coefficients were averaged for each metal, the followinghierarchy or relative order was observed:
Molybdenum > Lead > Manganese > Mercury > Chromium > Cobalt > Cadmium >Vanadium > Nickel > Zinc
The majority of the above trace metals are associated with mercury in emissions ofcoal-fired power plants and incinerators.
Although it is clear that the higher deposition of mercury and associated trace metalswas associated with storm transport, the source of the metals is not conclusive. Theelevated mercury and associated metals were not typically associated with air masstransport from any one direction reflecting local or regional anthropogenic sources.However, substantial variation was observed with regard to total mercury concentrationand precipitation amount for the 12 precipitation events (Figure 11). Total mercury

14
concentrations were not correlated with precipitation volume (r = 0.1) as indicated by awide range in concentration with precipitation volumes similar in magnitude. Forexample, total mercury concentration for precipitation events from 0.64cm (August 19,2002) and 0.61cm (June 8, 2001) were 32.3ng/L and 65.0ng/L, respectively. Associateddeposition values were 112.4ng/m2 (August 19, 2002) and 396.1ng/m2 (June 8, 2001).The range in concentrations can be explained, in part, by rainfall along the path of theair parcel prior to arrival at the collection site for the August 19, 2002 sample collection.The precipitation amount observed by Landis, et al. (2002) explained less than 20% ofthe variability in mercury concentrations and deposition values when comparing rainfallevents similar in magnitude. That group attributed the variation to differences intransport emissions from local and regional anthropogenic sources. When combinedwith rainfall occurrences upwind from the collection site, the additional confoundinginfluences of meteorological conditions in addition to regional sources make it difficult tocharacterize the source and fate of atmospheric mercury. The authors recognize thelimitations and uncertainties associated with using trajectory models to obtainmeteorological links between a regional source and its transport to the receptor site.Despite these limitations, there appears to be a clear association of elevated mercuryand anthropogenic sources of trace metals.
CONCLUSIONS
Historically, wet deposition was considered the principal contributor of atmosphericmercury flux to terrestrial watersheds. And until recently, the role dry deposition playedin atmospheric processes was minimized or considered inconsequential. The standardfor characterizing mercury in deposition has been the weekly capture and analysis ofmercury in rain events; however, rainfall in the arid southwest is seasonal and sporadic.This research compared two methodologies characterizing mercury flux in drydepositional processes. The dry deposition flux of RGM as inferred from measuredRGM concentrations was compared to direct measurement of mercury deposition to asurrogate surface. The manual inferential method resulted in daily average deposition of0.094ng/m2/h for RGM and an annual RGM flux of 0.82µg/m2. In contrast, mercury fluxusing the surrogate surface was much greater with an average daily flux of 3.7ng/m2/hand an annual mercury flux of 32µg/m2. Despite the lack of good agreement betweenthese two methods, the potential for IX membranes as a surrogate surface fordetermining mercury in deposition is feasible and should be considered as a simplerand less expensive alternative.
Given the annual atmospheric flux of RGM from the inferential measurement(0.82µg/m2) and the annual deposition of mercury from the surrogate surface(32µg/m2), then total mercury in wet and dry depositional processes can be calculated.The annual mercury deposition in rainfall (5.44µg/m2) and dry depositional methodsresulted in a total depositional flux of mercury ranging from 6.26µg/m2 to 37.44µg/m2.Thus, the measurements in this study indicate 13% to 85% of the annual depositionalflux for total mercury in south central New Mexico would be due to dry depositionalprocesses alone, which is comparable in magnitude to a mercury deposition model forNew Mexico (Seignuer, et al. 2002).

15
Wet deposition is highly seasonal in the southwest, with the majority of the precipitationevents occurring in summer months. Total mercury deposition (product of concentrationand rainfall amount) was 6,700ng/m2 with an average mercury deposition of 257ng/m2
(range 8.3ng/m2 to 1,049.6ng/m2) throughout the 64-week study. The seasonal patternin New Mexico for mercury in wet deposition, when combined with elevated mercuryconcentrations, produced total summer wet depositions of 2,760ng/m2 in 2001 and2,236ng/m2 in 2002. Mercury deposition for the two summers alone represented 75% ofthe total mercury in precipitation in the study.
Single precipitation events were identified and characterized for total mercury and tracemetal deposition using back trajectories to determine the source of the air parcels. Aseries of single precipitation events revealed elevated levels of mercury associated withelevated trace metal concentrations. The highest mercury deposition (1,049.6ng/m2)was associated with prevailing winds south by south-west across Mexico. Otherprecipitation events containing elevated concentrations of mercury and trace metalswere associated with air mass transport from other directions (across west Texas andeastern Arizona). Determining the sources were beyond the scope of this work, butwould represent an important next step in identifying mercury and associated heavymetals in depositional processes.
The levels of mercury observed throughout our sample collections (as a single speciesor in total) do not represent levels of concern for either human or wildlife health. Thepurpose of this work was simply to characterize mercury in dry deposition form. Inaddition, this work fills important information gaps of the sum total of mercury depositionto an arid landscape. As a result of mercury’s propensity to bioaccumulate andbioconcentrate, increased trace amounts of mercury in deposition will likely biomagnifythrough the aquatic food web, resulting in increasing restrictions pertaining to sportfishconsumption advisories.
RECOMMENDATIONS FOR FURTHER RESEARCH
Mercury assessment and strategic monitoring should continue in the southwest, andespecially the border region, to include atmospheric monitoring of mercury andassociated trace metals. These should be conducted in conjunction with sportfishmonitoring programs in which mercury concentrations are identified in fish tissues andother fish-eating wildlife. It is essential that partnerships be developed among state,federal, and international agencies to develop an integrated model for use in monitoringand predicting the effects of mercury at a large-scale level.
RESEARCH BENEFITS
This research was conducted in response to explicit problems outlined in the 2003Border 2012 Framework Document describing air quality effects due to rapidurbanization and emissions along the border (EPA 2003). The document described theneed to determine sources of pollutants through the development of inventories ofpollutant emissions and modeling. Mercury emitted through the combustion of fossilfuels and waste incineration contributes significantly to local and regional concentrationsof mercury-adsorbed particulates in air and has been observed in association with other

16
effects of rapid urbanization, such as wildfires, brick manufacturing, and refuse burning.It is our intention that this research assist the Border XXI Air Workgroup in promotingthe addition of regionally based air quality monitoring networks, such as MDN sites foratmospheric monitoring of mercury throughout the border region.
In their final Report to Congress on mercury, the EPA identified many areas ofuncertainty (EPA 1997). Those that specifically pertain to this research includedsignificant data gaps in quantifying actual air concentrations and atmospheric depositionrates, the need for a better understanding of mercury transport from watershed to waterbodies, and an improved understanding of mercury fluxes within water bodies (e.g.,bioaccumulation through the food chain) (17, Vol. I, Executive Summary, p. 5-2).
This research will result in a series of peer-refereed publications in the Journal ofEnvironmental Science and Technology in 2004.
REFERENCES
Balough S. J., M. L. Meyer, and D. K. Johnson. 1997. “Mercury and SuspendedSediment Loadings in Lower Minnesota River.” Environmental Science and Technology31:198-202.
Bloom, Nicolas S. 1992. “On the Chemical Form of Mercury in Edible Fish and MarineInvertebrate Tissue.” Canadian Journal of Fisheries and Aquatic Sciences 49:1010-1017.
Bloom, Nicolas S. 1995. “Ultra-clean Sample Handling.” Environmental LaboratoryMarch/April:120-126.
Borunda, Daniel. 1997. “Total Mercury Concentrations in Aquatic Food WebComponents of Caballo and Elephant Butte Reservoirs (Sierra County, NM).” MastersThesis, Department of Fishery and Wildlife Sciences, New Mexico State University,New Mexico, U.S.A.
Burke, J., M. Hoyer, G. Keller, and T. Scherbatskoy. 1995. “Wet Deposition ofMercury and Ambient Mercury Concentrations at a Site in Lake Champlain Basin.”Water, Air, and Soil Pollution 80:353-362.
Caldwell, Colleen A., and Christopher M. Canavan. 1998. “Spatial and TemporalDistribution of Mercury in Caballo and Elephant Butte Reservoirs, Sierra County, NewMexico.” Water Resources Research Institute Technical Completion Report No. 306,Las Cruces, N.M.
Caldwell, Colleen A., Mary A. Arnold, and William R. Gould. 1999. “MercuryDistribution in Blood, Tissues, and Feathers of Double-crested Cormorant Nestlingsfrom Arid-lands Reservoirs in South Central New Mexico.” Archives of EnvironmentalContamination and Toxicology 36:456-461.
17
Caldwell, Colleen A. 2000. “Atmospheric Deposition of Mercury in South Central NewMexico, USA.” Report to the U.S. Bureau of Reclamation. Cooperative Agreement No.1425-98-FC-21830, New Mexico Cooperative Fish and Wildlife Research Unit, LasCruces, N.M.
Carpi, Anthony. 1997. “Mercury From Combustion Sources: A Review Of The ChemicalSpecies Emitted And Their Transport In The Atmosphere.” Water, Air, and SoilPollution 98:241-254.
Clarkson, T. W. 1994. “The Toxicology of Mercury and its Compounds.” Pp. 631-641in Mercury Pollution Integration and Synthesis. Boca Raton, Fla.: CRC Press, Inc.
Ebinghaus, R., H. H. Kock, S. G. Jennings, P. McCartin, and M. J. Orren. 1995.“Measurements Of Atmospheric Mercury Concentrations In Northwestern And CentralEurope- Comparison Of Experimental Data And Model Results.” AtmosphericEnvironment 29:3333-3344.
Fitzgerald, William F., R. P. Mason, G. M. Vandal, and F. Dulac. 1994. “Air-waterCycling of Mercury in Lakes.” Pp. 203-220 in Mercury Pollution Integration andSynthesis. Boca Raton, Fla.: CRC Press, Inc.
Glass, Gary. E., John A. Sorensen, Kent W. Schmidt, George R. Rapp, David Yap, andDuncan Fraser. 1991. “Mercury Deposition and Sources for the Upper Great LakesRegion.” Water, Air, and Soil Pollution 56:235-249.
Gustin, M. S., G. E. Taylor, Jr., and T. L. Leonard. 1995. “Atmospheric MercuryConcentrations Above Mercury Contaminated Mill Tailings In The Carson RiverDrainage Basin, NV.” Water, Air, and Soil Pollution 80:217-220.
Kahl, Jonathan D. 1991. “A Cautionary Note on the Use of Air Trajectories inInterpreting Atmospheric Chemistry Measurements.” Atmospheric Environment27A:3037-3038.
Keeler, G., G. Glinsorn, and N. Pirrone. 1995. “Particulate Mercury In The Atmosphere:Its Significance, Transport, Transformation And Sources.” Water, Air, and Soil Pollution80:159-168.
Krabbenhoft, David P., and James G. Wiener. 1999. “Mercury contamination: anationwide threat to our aquatic resources and proposed research agenda for the U.S.Geological Survey. “ Pp. 171-178 in U.S. Geological Survey Toxic SubstancesHydrology Program—Proceedings of the Technical Meeting, Volume 2. Contaminationof Hydrologic Systems and Related Ecosystems: U.S. Geological Survey Water-Resources Investigations Report 99-4018B, D.W. Morganwalp and H.T. Buxton, eds.
Lamborg, Carl H., William F. Fitzgerald, Grace M. Vandal, and Kristofer R. Rolfhus.1995. “Atmospheric Mercury In Northern Wisconsin: Sources And Species.” Water, Air,
18
and Soil Pollution 80:189-198.
Landis, Mathew S., Robert K. Stevens, Frank Schaedlich, and Eric M. Prestbo. 2002.“Development And Characterization Of An Annular Denuder Methodology For TheMeasurement Of Divalent Inorganic Reactive Gaseous Mercury In Ambient Air.”Environmental Science and Technology 36:3000-3009.
Lee Y. H., K. Bishop, C. Pettersoon, and A. Iverfeldt. 1995. “Subcatchment output ofmercury and methylmecury at Svartberget in northern Sweden.” Water Air and SoilPollution 80:455-465.
Lindberg, S. E., and W. J. Stratton. 1998. “Atmospheric Mercury Speciation:Concentrations and Behavior of Reactive Gaseous Mercury in Ambient Air.”Environmental Science and Technology 32:49-57.
Lindberg, Steve E., Steve Brooks, C. J. Lin, Karen J. Scott, Matthew S. Landis, RobertK. Stevens, Mike Goodsite, and Andreas Richter. 2002. “Dynamic Oxidation ofGaseous Mercury in the Artic Troposphere at Polar Sunrise.” Environmental Scienceand Technology 36:1245-1256.
Lindqvist, O., K. Johansson, M. Aastrup, A. Andersson, L. Bringmark, G. Hovsenius, A.Iverfeld, M. Meili, and B. Timm. 1991. “Mercury in the Swedish Environment.” Water,Air, and Soil Pollution 55:193-216.
Mason, R. P., and K. A. Sullivan. 1998. “Mercury And Methylmercury TransportThrough An Urban Watershed.” Water Research 32:321-330.
National Oceanic and Atmospheric Association Air Resources Laboratory. 1997.“HySPLIT4 (HYbrid Single-particle Lagrangian Integrated Trajectory) Model 1997.”http//www.arl.noaa.gov/ready/hysplit4.html.
New Mexico Department of Health, New Mexico Environment Department, and NewMexico Game and Fish. 1993. “Fish Consumption Guidelines Due to MercuryContamination.” http://www.nmenv.state.nm.us/swqb/Mercury.html.
Pirrone, N., G. Glinsorn, and G. J. Keeler. 1995. “Ambient Levels of Dry DepositionFluxes of Mercury to Lakes Huron, Eric, and St. Clair.” Water, Air, and Soil Pollution80:317-324.
Pleijel, Karin, and John Munthe. 1995. “Modeling The Atmospheric Chemistry OfMercury: The Importance Of A Detailed Description Of The Chemistry Of Cloud Water.”Water, Air, and Soil Pollution 80:317-324.
Porcella, Donald B. 1994. “Mercury in the Environment: Biogeochemistry.” Pp. 3-20 inMercury Pollution: Integration and Synthesis, Carl J. Watras and John W. Huckabee,eds. Boca Raton, Florida: CRC Press, Inc.
19
Rada, Ronald G., Jim G. Wiener, Michael R. Winfrey, and Dan E. Powell. 1989.“Recent Increases in Atmospheric Deposition of Mercury to North-central WisconsinLakes Inferred from Sediment Analysis.” Archives of Environmental Contamination andToxicology 18:175-181.
Seigneur, Christian, Prakash Karamchandani, Kristen Lohman, and KrishVijayaraghavan. 2002. “Multiscale Modeling of the Atmospheric Fate and Transport ofMercury.” Journal of Geophysical Research 106:27,795-27,809.
Sheu, G-R. 2001. “Speciation and Distribution of Atmospheric Mercury: Significance ofReactive Gaseous Mercury in the Global Mercury Cycle.” Ph.D. Dissertation, Universityof Maryland, College Park, Maryland.
Sheu, G-R., and R. P. Mason. 2001. “An Examination of the Methods for theMeasurement of Reactive Gaseous Mercury in the Atmosphere.” Environmental.Science and Technology 35:1209-1216.
Stratton, Wilmer J., S. E. Lindberg, and Christopher J. Perry. 2001. “AtmosphericMercury Speciation: Laboratory and Field Evaluation of a Mist Chamber Method forMeasuring Reactive Gaseous Mercury.” Environmental Science and Technology35:170-177.
U.S. Environmental Protection Agency. 1995. “Method 1631: Mercury in water byoxidation, purge and trap, and cold vapor atomic fluorescence spectrometry.” U.S. EPAOffice of Water Engineering and Analysis Division EPA-821-R-95-027 April.
U.S. Environmental Protection Agency. 2003. “U.S.–Mexico Border 2012 ProgramFramework Document.” EPA 160-R-03-003.
U.S. Environmental Protection Agency. 1997. “Mercury Study Report to Congress.”Office of Air Quality Planning and Standards and Office of Research and Development.EPA-452/R-97-003.
U.S. Environmental Protection Agency Office of Water. 2002. “2001 National Listing ofFish and Wildlife Advisories.” EPA-823-F-02010.
Veiga, M. M., J. A. Meech, and N. Onate. 1994. “Mercury Pollution fromDeforestation.” Nature 368:816-818.
Watras, C. J., and J. W. Huckabee. 1994. Mercury Pollution: Integration and Synthesis.Boca Raton, Fla.: CRC Press, Inc.
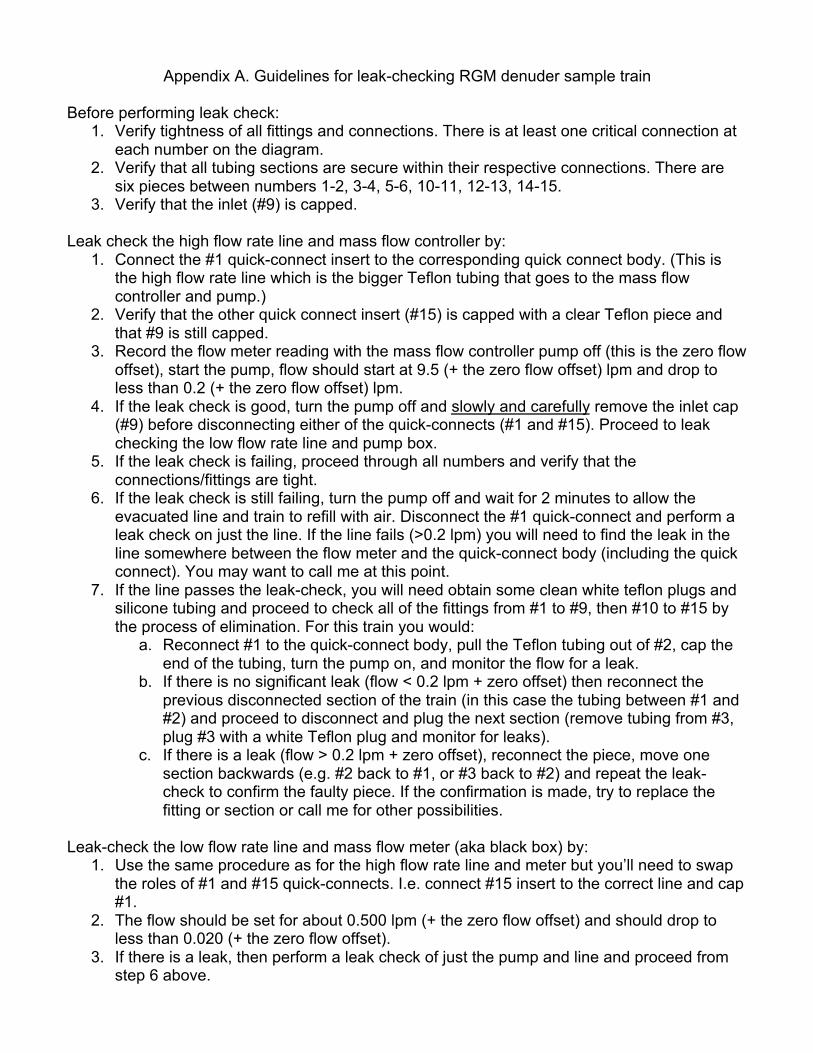
Appendix A. Guidelines for leak-checking RGM denuder sample train
Before performing leak check:1. Verify tightness of all fittings and connections. There is at least one critical connection at
each number on the diagram.2. Verify that all tubing sections are secure within their respective connections. There are
six pieces between numbers 1-2, 3-4, 5-6, 10-11, 12-13, 14-15.3. Verify that the inlet (#9) is capped.
Leak check the high flow rate line and mass flow controller by:1. Connect the #1 quick-connect insert to the corresponding quick connect body. (This is
the high flow rate line which is the bigger Teflon tubing that goes to the mass flowcontroller and pump.)
2. Verify that the other quick connect insert (#15) is capped with a clear Teflon piece andthat #9 is still capped.
3. Record the flow meter reading with the mass flow controller pump off (this is the zero flowoffset), start the pump, flow should start at 9.5 (+ the zero flow offset) lpm and drop toless than 0.2 (+ the zero flow offset) lpm.
4. If the leak check is good, turn the pump off and slowly and carefully remove the inlet cap(#9) before disconnecting either of the quick-connects (#1 and #15). Proceed to leakchecking the low flow rate line and pump box.
5. If the leak check is failing, proceed through all numbers and verify that theconnections/fittings are tight.
6. If the leak check is still failing, turn the pump off and wait for 2 minutes to allow theevacuated line and train to refill with air. Disconnect the #1 quick-connect and perform aleak check on just the line. If the line fails (>0.2 lpm) you will need to find the leak in theline somewhere between the flow meter and the quick-connect body (including the quickconnect). You may want to call me at this point.
7. If the line passes the leak-check, you will need obtain some clean white teflon plugs andsilicone tubing and proceed to check all of the fittings from #1 to #9, then #10 to #15 bythe process of elimination. For this train you would:
a. Reconnect #1 to the quick-connect body, pull the Teflon tubing out of #2, cap theend of the tubing, turn the pump on, and monitor the flow for a leak.
b. If there is no significant leak (flow < 0.2 lpm + zero offset) then reconnect theprevious disconnected section of the train (in this case the tubing between #1 and#2) and proceed to disconnect and plug the next section (remove tubing from #3,plug #3 with a white Teflon plug and monitor for leaks).
c. If there is a leak (flow > 0.2 lpm + zero offset), reconnect the piece, move onesection backwards (e.g. #2 back to #1, or #3 back to #2) and repeat the leak-check to confirm the faulty piece. If the confirmation is made, try to replace thefitting or section or call me for other possibilities.
Leak-check the low flow rate line and mass flow meter (aka black box) by:1. Use the same procedure as for the high flow rate line and meter but you’ll need to swap
the roles of #1 and #15 quick-connects. I.e. connect #15 insert to the correct line and cap#1.
2. The flow should be set for about 0.500 lpm (+ the zero flow offset) and should drop toless than 0.020 (+ the zero flow offset).
3. If there is a leak, then perform a leak check of just the pump and line and proceed fromstep 6 above.

Figure 1. Field Guide to RGM Denuder Sample Train
Legend
Denuder end cap Coupler between the elutriator and denuder
Teflon nut
Quick-connect insert – inserts into quick-connect body on the sample line, hand-tighten metal nut and cap withclear Teflon piece for leak checking
Friction fit Teflon sleeve
_ inch Teflon tubing(diagram not to scale) Phil Swartzendruber, Frontier Geosciences, Seattle, WA, voice [email protected]
KCL denuder
PHg filter
Au traps
PM 2.5 elutriator
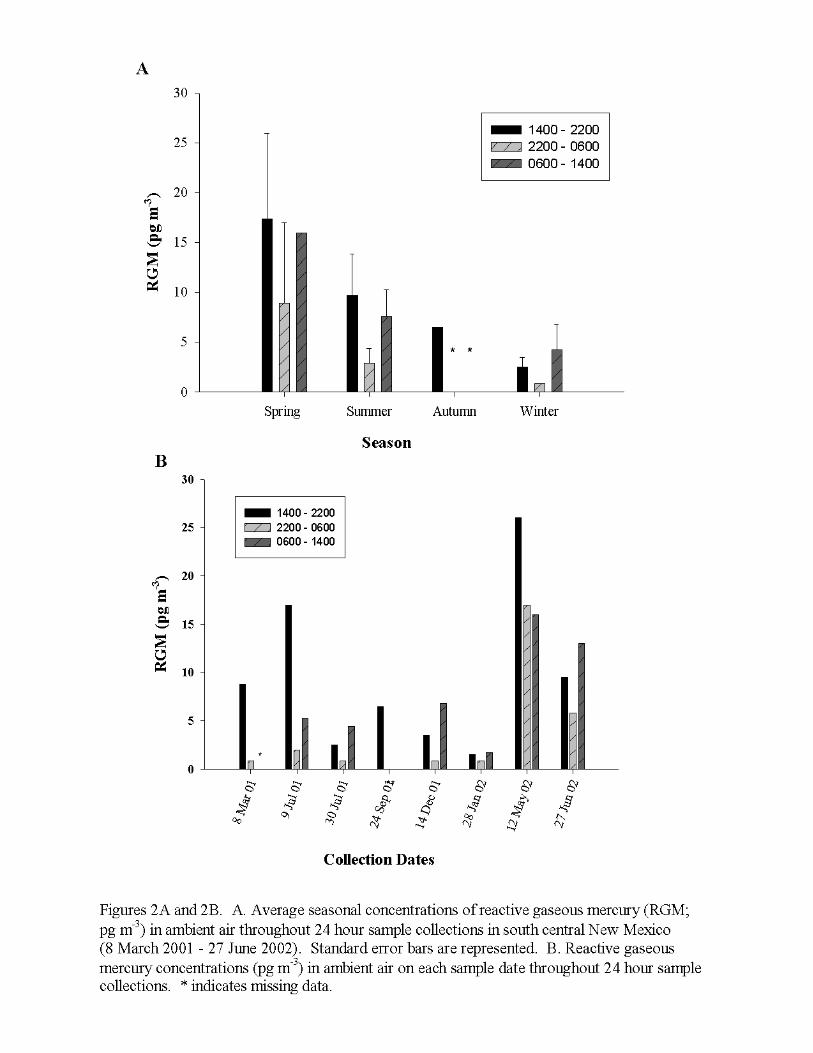


Table 1. Summary of Concentrations and Dry Deposition of Reactive Gaseous Mercury (RGM) and Concentrations ofParticulate-bound Mercury (HgP) and Elemental Mercury (Hgo) in South Central New Mexico (sample collections were
averaged within each collection time throughout the 64-week collection period (April 2001 through August 2002)
Calculated AtmosphericConcentration and RGM Flux
via KCl Denuder
Measured MercuryFlux to
IX Membrane*
AtmosphericConcentration of
HgP (<2.5 micron)
AtmosphericConcentration of
Hgo
Collection Time(hours)
pg m-3 n ng m-2 hr -1
**ng m-2 hr -1 N pg m-3 n ng m-3 n
1400-2200 8.9 8 0.13 7.9 3 4.3 5 1.56 5
2200-0600 3.3 7 0.047 1.4 3 3.6 5 1.60 8
0600-1400 7.4 6 0.11 1.8 3 1.2 5 1.59 6
MDL 1.6 6 0.024 1.5 3 0.57 12 0.13 35
Mean (24 hour) 6.5 - 0.094 3.7 - 3.0 - 1.59 -
StandardDeviation
6.7 21 0.10 3.7 9 4.1 15 0.37 19
Annual Mean(ug m–2 year–1)
- - 0.82 32 - - - - -
* Direct deposition of presumably RGM and HgP (< and > 2.5 micron) onto IX membrane** Calculated using deposition velocity 0.4 cm sec-1 (Lindberg and Stratton1998)MDL= method detection limit calculated as 3 times the standard deviation of the method blank

Table 2. Wet Deposition (n m-2) for Metals Analyzed in 12 Single Precipitation Events from 6 April 2001 through 19 August 2002 inSouth Central New Mexico (dash [-] indicates deposition value below method of detection limits)
Deposition (ng m-2)Date Hg Cd Co Cr Cu Mn Mo Ni Pb V Zn
6 Apr 01 42.1 67.1 119.7 285.5 1167.3 10339 - 518.6 911.6 2501.3 4270
8 Jun 01 396.1 597.8 23.5 2742.8 3564.5 29145 214.3 1444.4 420.9 2851.9 20908
29 Jun 01 695.5 - 1694.6 26918 890.6 174685 - 1725.3 1594.9 14105 5064
9 Jul 01 14.0 - 6.3 289.4 - 7253 - 794.5 - - -
16 Jul 01 31.2 35.4 1143.6 156.8 7094.9 36681 - 2230.9 707.1 919.6 2200
14 Aug 01 122.6 757.2 473.5 - 8799.5 17572 666.6 14492 1166.6 601.6 507822
7 Oct 01 70.3 196.9 80.9 - 2841.7 6017 104.6 107.8 480.9 945.1 51198
16 Nov 01 26.5 - 30.2 - 1248.2 5156 40.1 - 181.4 - 45725
19 May 02 1049.6 879.8 4308.9 - 10352 421712 3392.3 7018.8 4381.6 - -
28 Jul 02 8.3 - 80.7 - 43.8 7148 2.7 835.9 50.8 125.9 161436
7 Aug 02 50.0 18.1 58.8 - - 7363 40.2 163.5 15.2 538.0 13932
19 Aug 02 112.4 147.0 223.9 - 50.2 28097 53.3 364.6 63.3 501.2 -

Table 3. Correlation Coefficients (r) for Metals Analyzed in 12 Single Precipitation Events from 6 April 2001 through 19August 2002 in South Central New Mexico (dash [–]“indicates coefficient of determination (r2) below 0.001)
Hg Cd Co Cr Cu Mn Mo Ni Pb V ZnHg 1.0 0.77 0.87 0.89 0.49 0.94 0.94 0.26 0.88 0.91 0.09Cd 1.0 0.60 0.83 0.73 0.65 0.73 0.76 0.72 0.17 0.76Co 1.0 0.77 0.66 0.98 0.91 0.36 0.96 0.75 -Cr 1.0 0.42 0.97 1.0 0.51 0.80 0.99 -Cu 1.0 0.57 0.82 0.71 0.71 0.24 0.61Mn 1.0 0.98 0.30 0.95 0.96 0.14Mo 1.0 0.47 0.99 - 0.88Ni 1.0 0.46 - 0.89Pb 1.0 0.71 0.30V 1.0 0.26Zn 1.0